Highlights
What are the main findings?
- SRDA-Net adopts an end-to-end deep learning architecture, overcoming the reliance of traditional methods on linear assumptions and multi-source high-temporal LST data, and achieving end-to-end nonlinear high-precision downscaling.
- Integrating the attention mechanism and multi-source feature fusion significantly enhances the ability to capture details of heterogeneous agricultural surfaces.
What is the implication of the main finding?
- With thermodynamic and spatial structure constraint loss function, it takes into account both reconstruction accuracy and physical interpret-ability.
- Producing LST data with a resolution of 500 and 250 m, serving agricultural, ecological and climate change research.
Abstract
Land surface temperature (LST) is a critical parameter in agricultural drought monitoring, crop growth analysis, and climate change research. However, the challenge of acquiring high-resolution LST data with both fine spatial and temporal scales remains a significant obstacle in remote sensing applications. Despite the high temporal resolution afforded by daily MODIS LST observations, the coarse (1 km) spatial scale of these data restricts their applicability for studies demanding finer spatial resolution. To address this challenge, a novel deep learning-based approach is proposed for LST downscaling: the spatial resolution downscaling attention network (SRDA-Net). The model is designed to upscale the resolution of MODIS LST from 1000 m to 250 m, overcoming the shortcomings of traditional interpolation techniques in reconstructing spatial details, as well as reducing the reliance on linear models and multi-source high-temporal LST data typical of conventional fusion approaches. SRDA-Net captures the feature interaction between MODIS LST and auxiliary data through global resolution attention to address spatial heterogeneity. It further enhances the feature representation ability under heterogeneous surface conditions by optimizing multi-source features to handle heterogeneous data. Additionally, it strengthens the model of spatial dependency relationships through a multi-level feature refinement module. Moreover, this study constructs a composite loss function system that integrates physical mechanisms and data characteristics, ensuring the improvement of reconstruction details while maintaining numerical accuracy and model interpret-ability through a triple collaborative constraint mechanism. Experimental results show that the proposed model performs excellently in the simulation experiment (from 2000 m to 1000 m), with an MAE of 0.928 K and an R2 of 0.95. In farmland areas, the model performs particularly well (MAE = 0.615 K, R2 = 0.96, RMSE = 0.823 K), effectively supporting irrigation scheduling and crop health monitoring. It also maintains good vegetation heterogeneity expression ability in grassland areas, making it suitable for drought monitoring tasks. In the target downscaling experiment (from 1000 m to 500 m and 250 m), the model achieved an RMSE of 1.804 K, an MAE of 1.587 K, and an R2 of 0.915, confirming its stable generalization ability across multiple scales. This study supports agricultural drought warning and precise irrigation and provides data support for interdisciplinary applications such as climate change research and ecological monitoring, while offering a new approach to generating high spatio-temporal resolution LST.
1. Introduction
Land surface temperature (LST) is critical for agricultural drought monitoring and climate research. As a key variable in the energy and water exchange processes between the land surface and atmosphere, LST plays a substantial role in regional climate assessment, ecological monitoring, and drought early warning systems [1]. However, the spatial resolution of remote sensing imagery remains a major challenge in acquiring high-resolution LST data with both spatial and temporal precision [2]. For instance, although MODIS LST data boast high temporal resolution (with daily overpasses), their spatial resolution of 1000 m is inadequate for fine-scale regional research [3]. To address this gap, LST downscaling techniques have emerged, utilizing auxiliary data sources such as the Normalized Difference Vegetation Index (NDVI), topography, and surface albedo. These methods improve spatial resolution, enhance spatial heterogeneity representation, and support various applications, including agricultural drought monitoring and urban heat island management.
In recent years, two main approaches have been proposed for LST downscaling: statistical relationship-based methods and image spatio-temporal fusion techniques. The former methods, including classic algorithms like DisTrad [4], TsHARP [5], and machine learning-based random forests [6], improve resolution by establishing statistical relationships between LST and high-resolution driving factors. These methods are computationally efficient and conceptually intuitive. However, they oversimplify physical mechanisms and rely heavily on empirical statistical models. In heterogeneous regions, these relationships can be unstable, leading to limited adaptability and poor capacity to capture fine-scale features, such as small structures or complex urban heat islands [6]. On the other hand, spatio-temporal fusion methods, like STARFM [7] and its derivatives ESTARFM [8], focus on combining high spatial-resolution data (e.g., Landsat) with high temporal-resolution data (e.g., MODIS) to generate high spatio-temporal resolution LST products. These methods provide a good spatio-temporal balance in relatively stable regions but are sensitive to the quality and consistency of input data. Challenges arise in areas with rapid surface changes, strong heterogeneity, or nonlinearity (such as urban margins, mountainous regions, and post-disaster areas), where these methods struggle to capture the complex LST dynamics. Additionally, these approaches often lack robustness in terms of model complexity and cross-regional or seasonal generalization [9].
Given these limitations, deep learning technologies [10] have emerged as a promising solution for LST downscaling, leveraging capabilities in nonlinear feature extraction, end-to-end mapping, and multi-source data integration. Specifically, residual learning enhances deep neural network feature extraction through skip connections, addressing the degradation problem in deep networks. This allows for the capture of intricate spatial patterns in complex heterogeneous landscapes, such as urban areas and terrains with complex topographies [11]. The attention mechanism further refines feature representation by focusing on key spectral bands and spatial domains, thus improving the model’s ability to capture fine-grained spatial details [12]. For example, the convolutional block attention module (CBAM) optimizes feature representation through both channel and spatial attention, significantly improving the model’s performance [12]. The integration of residual learning and attention mechanisms has shown remarkable success in various tasks, including hyperspectral image reconstruction [13], super-resolution [14], and data fusion [15], demonstrating its potential for addressing the spatial heterogeneity and complexity in LST downscaling. Additionally, techniques like the residual channel attention network (RCAN) have proven effective in enhancing spatial detail reconstruction [16], and the attention mechanism improves feature selection during multi-source data fusion [7]. Furthermore, the combination of multi-scale feature fusion and attention mechanisms has been shown to capture high-frequency textures and global semantic information, which is crucial for accurately processing remote sensing data.
These advancements have facilitated the integration of remote sensing with fields such as computer science, geographic information science, and environmental science, fostering interdisciplinary applications. For instance, the combination of deep learning and high-resolution LST data has the potential to enhance the analysis of urban heat island effects [16], precision agricultural management [17], and ecosystem carbon cycle modeling [18], thereby improving cross-disciplinary research and decision-making support. Despite these advances, the application of deep learning in LST downscaling is still under-explored, particularly in heterogeneous and dynamically changing regions like urban heat islands and post-disaster zones.
To address these challenges, this study introduces a novel LST downscaling framework that integrates convolutional neural networks and attention mechanisms. By leveraging residual learning, attention mechanisms, and multi-level feature optimization strategies, the framework aims to enhance the accuracy and robustness of high-resolution LST reconstruction, ultimately providing valuable support for cross-disciplinary applications.
2. Materials and Methods
2.1. Study Area
This study utilized MODIS data blocks H26V05 and H27V05 to extract surface temperature data for the region spanning from 102°E to 114°E and 34°N to 40°N. This area encompasses a diverse range of ecological gradient zones that are crucial for agricultural applications. It stretches from the intensively cultivated North China Plain in the east, through the dryland agricultural landscape of the Loess Plateau in the middle, to the semi-arid grassland regions of China in the northwest. This area encompasses farmland, forestland, grassland and urban areas, providing a natural experimental environment for validating the downscaling model of land surface temperature used to support agricultural drought monitoring and crop management. The area features spatial heterogeneity, as reflected in the differences in thermal inertia of farmland, urban heat island effect and ecological transition, which enables the SRDA-Net deep learning model to capture the complex relationships among different land surfaces. To ensure the standardization of geographical representation while maintaining the spatial characteristics of the original data, the tile data were spatially clipped using provincial administrative boundaries. This approach preserved the entire regions of Shanxi, Henan and so on, as well as the main parts of Ningxia, with boundary provinces presented as complete municipal units. All analyses were conducted based on natural geographical units. The distribution of land cover following the clipping process is illustrated in Figure 1.
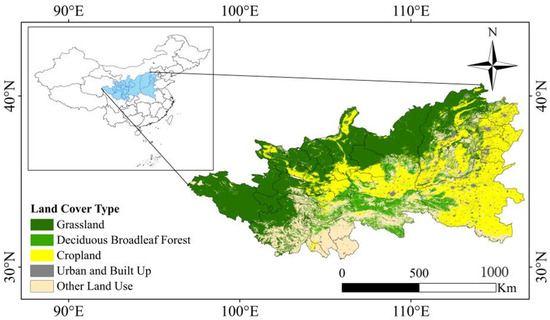
Figure 1.
Map of land cover types for LST downscaling in the study area.
2.2. Data Sources
In this study, MODIS LST data served as the primary data source for model development. To enhance the LST dataset, auxiliary variables such as the Normalized Difference Vegetation Index (NDVI), the digital elevation model (DEM), and other relevant parameters were integrated, facilitating the construction of a deep learning-based downscaling model. These data encompass key information on surface temperature and its driving factors, providing essential support for the downscaling process. The fundamental details and applications of these datasets are summarized in Table 1.

Table 1.
Remote sensing datasets for land surface temperature downscaling.
For data acquisition, all MODIS LST images covering the study area were downloaded. Images with minimal cloud coverage, or those completely free of clouds, were selected to ensure high data quality. Preprocessing of the MODIS LST and auxiliary datasets involved several steps, including data download, band extraction, coordinate re-projection, resolution resampling, and data quality control. These procedures were implemented to guarantee the consistency of the datasets across both temporal and spatial dimensions, ensuring reliable data support for the development of the land surface temperature downscaling model.
2.3. Stepwise Downscaling Framework of LST
In this study, geographical and environmental factors, including longitude, latitude, Digital Elevation Model (DEM), Normalized Difference Vegetation Index (NDVI), and Normalized Difference Water Index (NDWI), were employed to implement a stepwise downscaling of LST. This approach incrementally enhances the spatial resolution, thereby providing more detailed and accurate LST information. The stepwise downscaling process, through multi-stage feature extraction and fusion, progressively improves the representation of spatial heterogeneity in LST. This methodology is particularly well-suited for interdisciplinary applications, such as agricultural drought monitoring and urban thermal environment analysis. The relationship between LST and auxiliary factors can be mathematically expressed as follows:
, respectively, represent high- and low-resolution LST data. The digital elevation model (DEM) reflects the terrain’s undulation and significantly influences LST by affecting solar radiation reception, atmospheric circulation, and local climate conditions. The Normalized Difference Vegetation Index (NDVI), an important index for characterizing vegetation coverage, is widely utilized to estimate surface emissivity, thereby impacting the thermal radiation characteristics of LST [19]. The calculation formula for NDVI is as follows:
Here, NIR and RED represent the surface reflectance of the near-infrared and red light bands, respectively, and ε is a small constant (such as 1 × 10⁻⁸), which is a numerical stability treatment to avoid a denominator of zero in engineering practice. Similarly, the NDWI is used to characterize surface moisture conditions and is closely linked to moisture evaporation and heat distribution in LST [20].
Here, Green represents the reflectance in the green light band. By analyzing and selecting the auxiliary factors that influence temperature variations, this study designed a stepwise downscaling framework for surface temperature, as illustrated in Figure 2. First, the multi-source auxiliary data (longitude, latitude, DEM, NDVI, and NDWI) were preprocessed to ensure spatio-temporal consistency. Next, the SRDA-Net network was trained and tested on the multi-scale dataset to generate the downscaled satellite surface temperature data. Finally, the accuracy of the downscaling results was validated using the original satellite images, evaluation metrics (such as RMSE and MAE), and data from meteorological stations. The specific architecture of SRDA-Net will be discussed in detail in the following section.
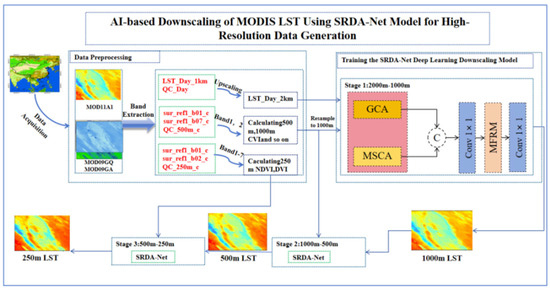
Figure 2.
Schematic diagram of the progressive downscaling workflow for land surface temperature (LST) based on the SRDA–Net.
The hardware platform used in this study is configured with an NVIDIA GeForce RTX 5090 graphics card (32 GB VRAM), dual AMD EPYC 7K62 processors, and 512 GB of RAM. The software environment is based on the Windows operating system, utilizing Python 3.9 and the TensorFlow 2.13 deep learning framework. In this optimized environment, the SRDA-Net model achieved robust convergence after 200 training epochs. For a single 1200 × 2400 pixel input, the model efficiently generates a downscaled output with a spatial resolution of 250 m, resulting in an image size of 4800 × 9600 pixels. Even with this large-scale spatial transformation, the entire single processing operation requires 3 to 4 min.
2.4. SRDA-Net Deep Learning Downscaling Model
To achieve the downscaling of land surface temperature (LST), this study proposes the spatial resolution downscaling attention network (SRDA-Net), hereafter referred to as “SRDA-Net.” As illustrated in Figure 3, the network utilizes low-resolution () data alongside a range of high-resolution auxiliary data () as inputs.
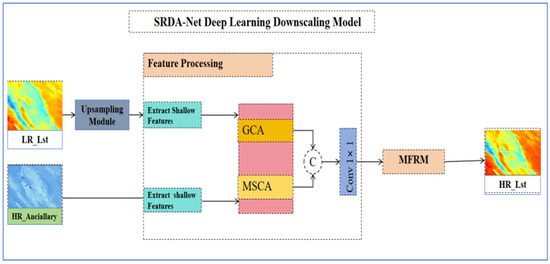
Figure 3.
The proposed SRDA-Net architecture for LST downscaling.
To fully leverage the more precise thermal radiation information from the low-resolution downscaled data, alongside the richer spatial details and surface structure (texture) features in the high-resolution auxiliary data, two cross-attention modules are proposed for feature map extraction and recalibration. These modules are the global resolution cross-attention (GCA) module and the multi-source resolution attention (MSCA) module. The GCA module is primarily designed to guide information flow and enable adaptive reallocation of channel weights across different resolutions. In contrast, the MSCA module further integrates spatial information from multiple sources, enhancing the response of key regions through the application of the attention mechanism.
Upon completing the cross-scale fusion, the network passes the fused features into a deep structure built with residual dense connections. An attention mechanism is integrated within this structure to enhance the model’s ability to capture complex patterns and nonlinear features. Finally, the network predicts and projects the high-resolution land surface temperature image data through global residual learning. This process can be formally expressed as follows:
Here, denotes the upsampling function. In this research, it is bilinear interpolation. represents the output of the residual network.
To ensure that SRDA-Net maintains a balance between physical plausibility and spatial structure consistency in the LST downscaling task, this study introduces a composite loss function. This function combines degradation loss, Charbonnier loss, multi-scale structural similarity (SSIM) loss, and an adaptive fusion mechanism, optimizing physical constraints, numerical accuracy, and spatial details through dynamic weighting (see Section 2.4.3). The details of the network modules are provided below.
2.4.1. GCA and MSCA Modules
The attention mechanism enhances the critical information while suppressing less important data by dynamically assigning weights. Leveraging this mechanism, deep learning networks can efficiently focus on significant features, thereby improving the efficiency and accuracy of feature extraction. In this study, as shown in Figure 4c, a cross-attention mechanism was employed to capitalize on the complementary strengths of low-resolution (LR) LST data and high-resolution (HR) auxiliary data. This was achieved through two distinct data combination patterns corresponding to the global resolution cross-attention (GCA) module and the multi-source resolution attention (MSCA) module, facilitating the mutual calibration of multi-source and multi-scale features.
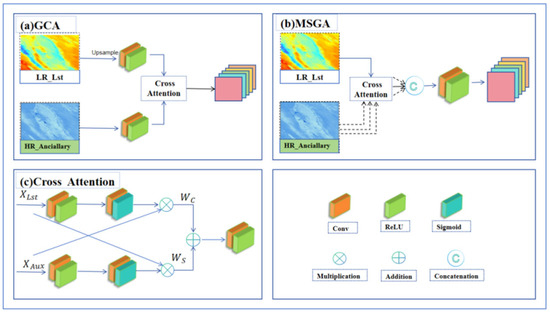
Figure 4.
Structure diagram of (a) the global resolution cross-attention (GCA) module, (b) the multi-source resolution attention (MSCA) module, (c) Cross-attention block modules.
In the GCA module, as shown in Figure 4a, the feature maps derived from the LR LST data and the integrated HR auxiliary data underwent recalibration within a cross-attention block. The GCA module utilizes a dual-branch cross-attention mechanism to perform bidirectional optimization between the temperature data and auxiliary data. This mechanism comprises two primary components: the channel attention block for LR data (LRCA) and the spatial attention block for HR auxiliary data (HRSA).
In the LRCA module, the amplitude information of the LR LST data is leveraged to refine the feature map of the HR auxiliary data. Specifically, the upsampled LR temperature data is passed through a convolutional layer to extract amplitude features. Pooling operations are avoided to preserve outlier information. A sigmoid function is then applied to generate channel weights, which are used to recalibrate the feature map of the HR auxiliary data. Conversely, the HRSA module extracts spatial features from the HR auxiliary data and generates a spatial weight map that enhances the fine-grained representation of the LR LST data.
Finally, the channel-weighted and spatial-weighted feature maps produced by the LRCA and HRSA blocks are integrated, resulting in mutually recalibrated feature maps that capture both amplitude and variation information. The cross-attention mechanism can be formalized as follows:
Here, represents the integrated auxiliary data, denotes the upsampled temperature data, refers to a convolution operation, and indicates element-wise multiplication, while the Sigmoid function is applied. This design effectively addresses the skewed distribution of temperature data and enhances the modeling of spatial heterogeneity by combining temperature physical attribute calibration with spatial detail enhancement. When handling multi-source heterogeneous auxiliary data, the GCA module’s single interaction path encounters the issue of insufficient feature extraction. To address this, the MSCA module is introduced to further enrich the feature map. As shown in Figure 4b, the core of the MSCA module consists of i parallel single-factor cross-attention blocks (SFCAs), where each block independently processes the interaction between a specific auxiliary source and the temperature data. These blocks emphasize the spatial heterogeneity of key regions by driving feature reconstruction through attention mechanisms.
Ultimately, these feature maps are combined through a cascading operation to serve as the input for the subsequent multi-level feature refinement module (MFRM) module. This structure incorporates an isolated feature calibration mechanism, which effectively preserves the distinct characteristics of heterogeneous auxiliary sources, such as vegetation indices, while avoiding feature interference. Section 2.4.3 further discusses the network enhancements facilitated by these two cross-attention modules.
2.4.2. MFRM Module
Leveraging the nonlinear feature extraction and end-to-end mapping capabilities of deep learning, the multi-level feature refinement module (MFRM) refines features based on the multi-source calibrated data generated by the GCA and MSCA modules. This is achieved through a hierarchical residual attention mechanism, ultimately reconstructing high-resolution LST data. As illustrated in Figure 5, the MFRM adopts a three-level architecture, with each level consisting of a cascaded combination of a residual block (RB) [11] and a convolutional block attention module (CBAM) [12]. This structure collaboratively optimizes multi-scale feature representations by facilitating cross-level information flow. At each level, the RB initially performs local feature extraction. Its dual-convolution structure enhances the model’s ability to capture intricate details, such as surface cover mutation zones while maintaining the physical constraints of the input features through skip connections. Following this, the CBAM applies dual-path calibration to the output of the RB. The channel attention path emphasizes key feature responses, whereas the spatial attention path preserves the spatial continuity of the temperature field through large receptive field convolutions. These two paths work in tandem to enhance the discriminative power of the features.
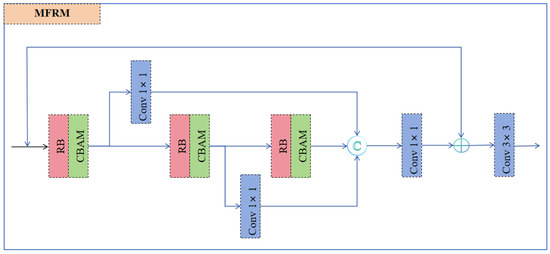
Figure 5.
Structure diagram of the multi-level feature refinement module (MFRM) modules.
The RB-CBAM cascade within this three-level architecture creates an evolving hierarchy of feature abstraction. The output from the first level retains high-frequency spatial textures at the original resolution. The second level constructs intermediate semantic features, while the third level encodes abstract temperature distribution patterns. The outputs from each level are compressed in channels via 1 × 1 convolutions and subsequently concatenated for fusion across the levels. Finally, through a global residual connection, the inherent physical laws of the original input features are seamlessly transferred to the reconstruction layer. The high-resolution LST is then generated through a 3 × 3 convolution. This process ensures a complete optimization loop, from local feature extraction and adaptive calibration to multi-scale feature fusion, maintaining the lossless transmission of physical laws while balancing detail preservation and semantic abstraction requirements.
2.4.3. Design of the Physical Constraint Loss Function
The primary challenge in the downscaling of surface temperature lies in achieving a balance between numerical accuracy and physical plausibility. Traditional loss functions, which are typically based on pixel-level errors, often fail to capture the intricate characteristics of the surface temperature field. This issue becomes particularly pronounced when dealing with surface types that exhibit highly skewed distributions and significant spatial heterogeneity.
To address this challenge, this study introduces an innovative composite loss function system that integrates both physical mechanisms and data characteristics. By employing a triple collaborative constraint mechanism, the downscaling process ensures that the results not only adhere to the fundamental principles of thermodynamics but also maintain the authentic spatial structural characteristics of the surface temperature field.
- (1)
- Degradation loss
The degradation loss serves as the physical foundation for this study, derived from the principle of surface energy balance. In thermal infrared remote sensing, the surface temperature field must comply with the conservation of energy, meaning that the total local thermal radiation remains constant during the scale transformation. This principle is enforced through mathematical constraints, ensuring that the downscaling process adheres to the inherent physical laws of thermal radiation.
In this formulation, represents the temperature value of the i-th pixel in the low-resolution temperature field (unit: K), corresponding to the low-resolution land surface temperature observed by the satellite (e.g., 1000 m). denotes the temperature value of the j-th pixel in the high-resolution temperature field (unit: K), which is the high-resolution land surface temperature reconstructed by the model (e.g., 250 m). refers to the group of high-resolution pixels corresponding to the low-resolution pixel i. represents the bilinear interpolation of on , which smooths the temperature field. The term is the temperature value obtained by weighted averaging of within according to the weight, simulating the sensor radiation integration. Here, represents the sum of weights, used for normalization. α(0 ≤ α ≤ 1) is the weighting factor, balancing the bilinear interpolation (1 − α) and the area-weighted average ). The weight parameter α was determined through grid search optimization, aiming to minimize the validation set RMSE. The optimal value was identified within a pre-set physically reasonable range (α: 0.1~0.9). The degradation process combines bilinear interpolation and area-weighted averaging to ensure that the total thermal radiation of the high-resolution temperature after degradation matches that of the low-resolution observation. This constraint is especially important in urban heat island regions, where it helps prevent abnormal temperature distributions, such as excessively high temperatures over water bodies or unnaturally low temperatures in building areas.
- (2)
- Charbonnier Loss
Surface temperature data often exhibit a highly skewed distribution, particularly with extreme high temperatures in urbanized areas. In such scenarios, the traditional mean squared error (MSE) loss function presents two significant issues: first, it is overly sensitive to high-temperature outliers, leading to unstable model training; second, it under-penalizes normal temperature regions, which causes the loss of fine texture features. To overcome these challenges, we propose an enhanced Charbonnier loss function:
Here, is the Charbonnier loss value, which measures the robust difference between the predicted and actual temperatures. is the predicted temperature of the i-th pixel (K). is the actual temperature of the i-th pixel (K). is the parameter that adopts a dynamic adjustment mechanism directly related to the statistical characteristics of the temperature: is the standard deviation of the temperature data T, reflecting the temperature variability. 0.1 is an empirical scale factor. The high-temperature area relaxes the constraint to avoid over-fitting, while the flat area maintains strict constraints to accurately reconstruct the fine gradients such as the edge of vegetation.
This design allows the loss function to adapt to the temperature variation across different regions. It automatically relaxes the constraints in high-temperature aggregation areas to prevent the model from over fitting extreme values while maintaining stricter constraints in areas with gradual temperature changes on natural surfaces. This ensures that subtle gradient variations in key areas, such as vegetation zones and water body edges, are accurately reconstructed.
- (3)
- Multi-scale SSIM Loss
The spatial structural characteristics of LST contain valuable environmental information, such as the heat conduction effect of urban road networks, the cooling gradient along water body boundaries, and evapotranspiration induced cooling in vegetated areas. To accurately preserve these spatial patterns, we develop a multi-scale SSIM loss:
Here, represents the multi-scale SSIM loss, which is used to evaluate the structural similarity. s serves as the scale index (e.g., 1000 m, 500 m). is the weight corresponding to scales. Specifically, the 1000 m scale ensures the total amount of thermal radiation, while the 500 m scale is dedicated to optimizing spatial details. is the SSIM value at scales, which is employed to compare the predicted temperature field with the actual one.
- (4)
- Adaptive Fusion Mechanism
The three loss functions discussed above target different physical objectives, but they may conflict with each other during the optimization process. For example, overemphasizing physical consistency could weaken the representation of spatial details, while focusing on structural similarity might compromise numerical accuracy. To tackle this multi-objective optimization challenge, we propose an adaptive weight fusion mechanism:
Here, is the total loss. is the degradation loss. is the Charbonnier loss. is the SSIM loss. are the weights of the three, respectively, and they are dynamically adjusted. The weight coefficients evolve dynamically during training: the weight coefficients are not fixed values but evolve dynamically during the training process. Specifically, the weight coefficients are not static values. Rather, they evolve dynamically throughout the training process:
The weights for the degradation, Charbonnier, and SSIM losses are dynamically scheduled across three consecutive phases. Initially, the degradation loss is prioritized to establish a physically plausible solution. Then, the focus smoothly transitions to the Charbonnier loss to enhance numerical accuracy. Finally, the SSIM loss is emphasized to refine structural and perceptual details. This phased strategy orchestrates a stable transition from physical fundamentals to pixel-level precision and ultimately to perceptual quality, effectively managing conflicts between the optimization objectives.
3. Results
To evaluate the effectiveness of the proposed SRDA-Net model in downscaling LST, a series of simulation and target experiments were designed. The model’s performance was assessed based on spatial distribution and numerical accuracy, using metrics such as mean absolute error (MAE), normalized root mean square error (RMSE), and the coefficient of determination (R2).
3.1. Experimental Design
Training Data: The experimental data primarily consist of MODIS data from 2018 and 2019, encompassing both LST and auxiliary datasets. The auxiliary data include the NDVI and the NDWI at a 500 m resolution. These datasets, derived from MODIS products, were preprocessed through normalization before being integrated into the modeling process. The data were partitioned into a training set and a validation set at a 4:1 ratio, with the partitioning based on the original 1000 m LST. The input data consisted of LST and auxiliary factors at various scales, while the output was the LST at the target high resolution. This configuration ensures that the training process simulates the downscaling from low to high resolutions effectively.
To enhance the model’s adaptability and accuracy, invalid pixels outside the study area and cloud-covered regions, as identified by MODIS, were excluded from the dataset. All input data were resampled using bilinear interpolation consistently across both the input and output stages to ensure spatial consistency. Furthermore, the data were partitioned using a sliding-window approach to improve computational efficiency. The detailed experimental setup is summarized in Table 2 below.
Table 2.
Experimental Setup for SRDA-Net LST downscaling.
Test data: The images of 2019 were used as an independent subset for network testing in both simulation and target data experiments, covering various surface types such as urban and forest areas. The image resolution in the target experiment was twice that of the training process and the simulation experiment.
3.2. Simulation Experiment: Upscaling–Downscaling Closed-Loop Verification
In this experiment, the geographically weighted average (GWA) method was first used to upscale the original MODIS LST data from a resolution of 1000 m to 2000 m, thereby creating a low-resolution input field. Subsequently, the resampled auxiliary factor dataset, with a resolution of 1000 m, was incorporated into the process. The SRDA-Net model was then trained to reconstruct the original 1000 m LST data, aiming to systematically evaluate its ability to recover spatial information.
To ensure a comprehensive evaluation, a dual-track assessment strategy was employed. First, the upscaling–downscaling closed-loop validation was performed. This involved analyzing and comparing image sequences to evaluate the consistency of the reconstruction. Second, multi-dimensional metric validation was conducted, which combined statistical metrics with pixel-level error diagnosis. This approach was executed on multi-temporal datasets from typical seasons, particularly focusing on the high-temperature period in summer. It quantitatively analyzed the stability and error-transmission characteristics of the model across different land surface types, including urban areas, forests, and grasslands.
The model’s ability to restore spatial details was evaluated by comparing the reconstructed 1000 m LST data with the original 1000 m LST data. As shown in Figure 6, Figure 6a,b presents the original 1000 m LST data, which highlights the spatial characteristics of the urban heat island effect and the temperature gradient in farmland regions. Figure 6c,d illustrate the upscaled 2000 m LST data, which exhibits a noticeable smoothing effect and a loss of fine details. Figure 6e,f show the 1000 m LST data predicted and reconstructed by SRDA-Net, which successfully restores most of the spatial details. For example, the edge features of urban high-temperature zones and the temperature gradient in farmland areas are clearly regained.
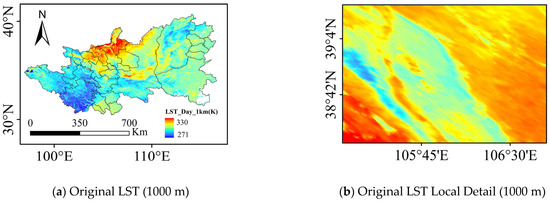
Figure 6.
LST upscaling–downscaling validation diagrams (1000 m → 2000 m → 1000 m).
The comprehensive evaluation presented in Figure 7 shows that the SSIM is 0.948, the MAE is 0.928 K, the R2 is 0.951, and the RMSE is 1.664 K. These indicators underscore the SRDA-Net model’s exceptional performance in spatial feature restoration and numerical accuracy, effectively reconstructing spatial details while preserving high numerical precision. To further assess the model’s adaptability to various land surface types, pure pixel samples were extracted from land cover partitions on representative days in the typical mixed sample area. Scatter plots of predicted vs. observed values were then generated (Figure 8).
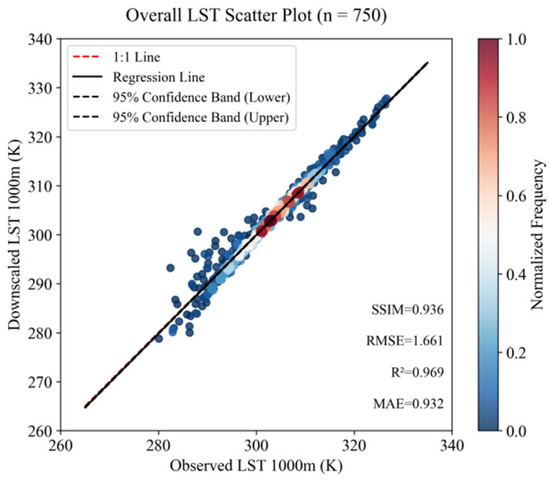
Figure 7.
Validation scatter plot (original vs. reconstructed LST, 1000 m).
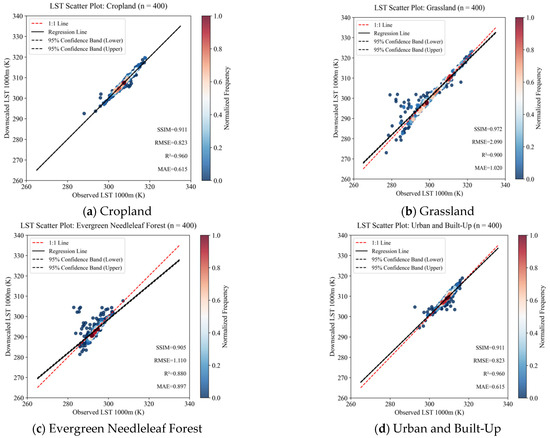
Figure 8.
Simulated experiment: LST upscaling downscaling land cover validation scatter plots.
Figure 8 presents the validation results across the four primary surface types: croplands, grasslands, evergreen needle-leaf forests and urban and built-up areas. The model demonstrates robust performance across these diverse landscapes, with particularly strong results in agricultural regions. In croplands (Figure 8a), the high spatial detail retrieval capability (the MAE is 0.615K, the R2 is 0.96, and the RMSE is 0.823 K) ensures reliable data for precision farming applications, including irrigation scheduling and crop health monitoring. Grasslands (Figure 8b) maintain satisfactory vegetation heterogeneity preservation, supporting pasture management and drought assessment. While evergreen needle-leaf forests (Figure 8c) show somewhat limited texture recovery due to complex terrain and canopy shading effects, the results provide valuable benchmarks for forestry applications. Urban and built-up areas (Figure 8d) exhibit excellent performance (MAE is 0.71K, the R2 is 0.9, and the RMSE is 0.977 K), demonstrating the model’s utility for urban heat island studies relevant to urban agriculture planning.
3.3. Target Experiment: Staged Multi-Scale Downscaling
The target experiment was designed to evaluate the performance of SRDA-Net in the practical task of downscaling LST. It involved two stages of spatial resolution enhancement: from 1000 m to 500 m and from 500 m to 250 m.
In the first stage, 1000 m resolution MODIS LST data and 500 m resolution auxiliary factors were used as inputs, with the objective of predicting 500 m resolution LST data. The 500 m labeled data were generated through bilinear interpolation of the 1000 m LST data, serving as the supervisory signal for model training. In the second stage, the 500 m LST data generated in the first stage, along with 250 m resolution auxiliary factors, were used as inputs to predict 250 m resolution LST data. The labeled data for this stage were similarly obtained by interpolating the 500 m LST data.
As shown in Figure 9 and Figure 10, this study utilized a dual-scale validation strategy to systematically assess the downscaling performance and practical significance of the SRDA-Net model. The image-based comparative assessment demonstrates that the downscaled LST data at 250 m and 500 m resolutions significantly outperform the original 1000 m data in terms of spatial details, allowing for a more precise representation of the spatial heterogeneity of LST (Figure 9).
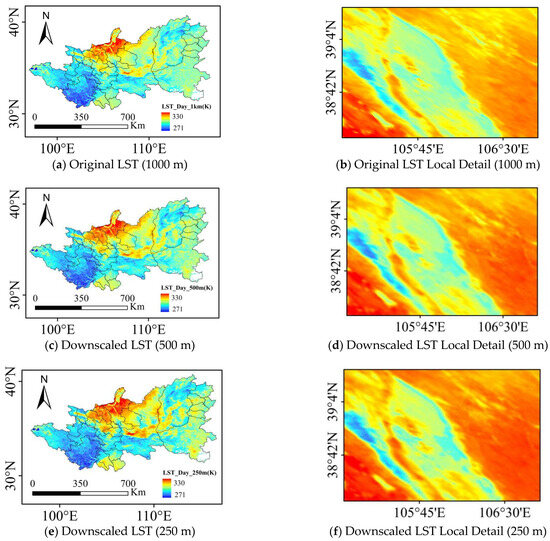
Figure 9.
Target experiment: LST downscaling validation diagrams (1000 → 500 m → 250 m).
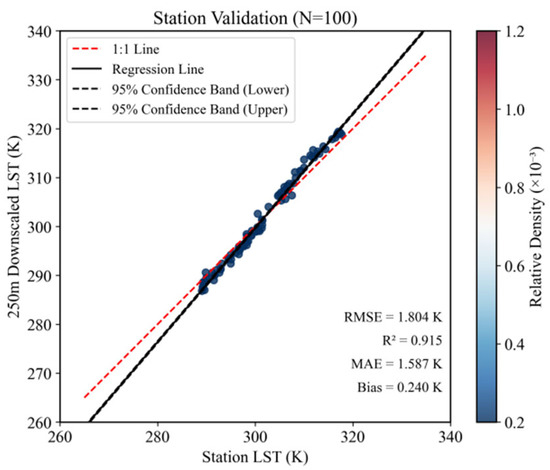
Figure 10.
Scatter plot of downscaling station verification.
The station-based validation, the model-generated 250 resolution LST product was compared with available in situ measurements from meteorological stations within the study area. The validation method involved directly matching and comparing the predicted LST value of a single 250 pixel containing a specific meteorological station with the in situ measurement from that station. The validation results demonstrate that the RMSE was 1.804 K, MAE was 1.587 K, R2 reached 0.915, and the bias was 0.24 K (Figure 10). These results validate the effectiveness of the downscaling model in enhancing spatial resolution while preserving numerical accuracy.
4. Discussion
The proposed SRDA-Net model demonstrates excellent downscaling performance across various land cover types, which can be attributed to its core architectural designs. Firstly, the global resolution attention module, through its dual-branch cross-attention mechanism, achieves deep feature calibration between low-resolution LST and high-resolution auxiliary data. This effectively explains the model’s capability to recover high-precision spatial details in areas with distinct structural characteristics (Figure 6 and Figure 9) and its superior performance metrics in cropland and urban areas (Figure 8a,d), providing reliable data support for precision agriculture and urban heat island studies. Secondly, the multi-source feature optimization module processes heterogeneous auxiliary data through parallel single-factor cross-attention blocks, enabling it to capture and accentuate spatial heterogeneity across different regions. This capability is evident not only in the resolution enhancement within farmland areas but also in the effective preservation of spatial variability in grassland (Figure 8b), thereby supporting pasture management and drought assessment. However, the model exhibits relatively limited texture restoration capability in evergreen needle-leaf forest areas (Figure 8c). We hypothesize that this limitation may stem from shadow effects caused by complex terrain, the mixing of thermal signals from canopy layers in satellite observations, and insufficient representation of sub-canopy thermal environments by auxiliary data (such as DEM). Nevertheless, the results still provide valuable baseline data for large-scale thermal environment monitoring in forest ecosystems. Compared to traditional bilinear/bicubic convolution interpolation methods, SRDA-Net fundamentally overcomes the inherent limitations of conventional approaches in restoring spatial details through its deep nonlinear modeling capability. Furthermore, the composite loss function system developed in this study, incorporating physical constraints and data feature priors combined with a triple coordination constraint mechanism, is considered crucial for maintaining high consistency with station-based validation (R2 = 0.915, Figure 10) while enhancing spatial resolution, effectively balancing numerical accuracy with spatial detail preservation.
5. Conclusions
This study proposes an end-to-end nonlinear SRDA-Net model for downscaling land surface temperature (LST). Leveraging deep learning’s nonlinear modeling capabilities and attention mechanisms, the model effectively downscales MODIS LST data from 1000 m to 250 m, significantly enhancing spatial resolution. It overcomes the limitations of traditional interpolation methods in restoring spatial details and reduces reliance on linear assumptions or extensive multi-temporal data required by conventional fusion approaches.
Experimental results demonstrate the model’s high-precision performance across multiple scales, with particular effectiveness in farmland areas supporting precision irrigation and crop health monitoring. The model also shows robust performance in grassland vegetation monitoring for drought assessment and maintains strong generalization capability. The derived 250 LST data provide valuable support for agricultural drought early warning, irrigation decision-making, and interdisciplinary research in climate change and ecological monitoring. Future work will focus on optimizing computational efficiency and integrating multi-source data assimilation frameworks to advance smart agriculture applications. Further development should address (1) comprehensive validation across diverse agricultural ecosystems and climate zones; (2) enhanced robustness to data uncertainty through advanced fusion techniques; and (3) improved model interpretability using explainable AI methods to bridge data-driven approaches with physical process understanding.
Author Contributions
H.M.: writing—review and editing, writing—original draft, visualization, validation, supervision, software, resources, project administration, methodology, investigation, form analysis, data curation, conceptualization. K.M.: Writing—review and editing, writing—original draft, supervision, resources, project administration, methodology, funding acquisition, formal analysis, conceptualization. Z.Y. and L.X.: writing—review and editing, validation, formal analysis. J.S., Z.G. and Z.Q.: writing—review and editing. All authors have read and agreed to the published version of the manuscript.
Funding
This research was funded by the Central Public-interest Scientific Institution Basal Research Fund (No. Y2025YC86) and the Key Project of Natural Science Foundation of Ningxia Department of Science and Technology (No. 2024AC02032). The APC was funded by the Central Public-interest Scientific Institution Basal Research Fund (No. Y2025YC86).
Data Availability Statement
The data supporting this study are available from the following public sources: NASA Land Processes Distributed Active Archive Center (LP DAAC): Land Surface Temperature (MOD11A1, v6.1): https://doi.org/10.5067/MODIS/MOD11A1.061 (accessed on 20 August 2024); Surface Reflectance (MOD09GA, v6.1 and MOD09GQ, v6.1): https://doi.org/10.5067/MODIS/MOD09GA.061 and https://doi.org/10.5067/MODIS/MOD09GQ.061 (accessed on 10 September 2024); Surface Albedo (MCD43A3, v6.1): https://doi.org/10.5067/MODIS/MCD43A3.061 (accessed on 10 September 2024); Land Cover Classification (MCD12Q1, v6.1): https://doi.org/10.5067/MODIS/MCD12Q1.061 (accessed on 10 September 2024). U.S. Geological Survey (USGS) Earth Explorer: Digital Elevation Model (SRTM, v3): https://earthexplorer.usgs.gov (accessed on 20 August 2024). ECMWF Climate Data Store: Meteorological Reanalysis Data (ERA5, v5): https://doi.org/10.24381/cds.adbb2d47 (accessed on 25 September 2024). The datasets generated and analysed during the current study are available from the corresponding author upon reasonable request.
Conflicts of Interest
The authors declare no conflicts of interest.
References
- Li, Z.L.; Tang, B.H.; Wu, H.; Ren, H.; Yan, G.; Wan, Z.; Trigo, I.F.; Sobrino, J.A. Satellite-derived land surface temperature: Current status and perspectives. Remote Sens. Environ. 2013, 131, 14–37. [Google Scholar] [CrossRef]
- Bouaziz, S.; Hafiane, A.; Canals, R.; Nedjai, R. Deep learning for spatio-temporal fusion in land surface temperature estimation: A comprehensive survey, experimental analysis, and future trends. arXiv 2024, arXiv:2412.16631. [Google Scholar] [CrossRef]
- Wan, Z. New refinements and validation of the collection-6 MODIS land surface temperature/emissivity product. Remote Sens. Environ. 2014, 140, 36–45. [Google Scholar] [CrossRef]
- Kustas, W.P.; Norman, J.M.; Anderson, M.C.; French, A.N. Estimating subpixel surface temperatures and energy fluxes from the vegetation index–radiometric temperature relationship. Remote Sens. Environ. 2003, 85, 429–440. [Google Scholar] [CrossRef]
- Agam, N.; Kustas, W.P.; Anderson, M.C.; Li, F.; Norman, J.M. A vegetation index based technique for spatial sharpening of thermal imagery. Remote Sens. Environ. 2007, 107, 545–558. [Google Scholar] [CrossRef]
- Hutengs, O.; Vohland, M. Downscaling land surface temperatures at regional scales with random forest regression. Remote Sens. Environ. 2016, 178, 127–141. [Google Scholar] [CrossRef]
- Zhu, X.; Chen, J.; Gao, F.; Chen, X.; Masek, J.G. An enhanced spatial and temporal adaptive reflectance fusion model for complex heterogeneous regions. Remote Sens. Environ. 2010, 114, 2610–2623. [Google Scholar] [CrossRef]
- Zhu, X.; Helmer, E.H.; Gao, F.; Liu, D.; Chen, J.; Lefsky, M.A. A flexible spatiotemporal method for fusing satellite images with different resolutions. Remote Sens. Environ. 2016, 172, 165–177. [Google Scholar] [CrossRef]
- Zhu, X.; Cai, F.; Tian, J.; Williams, T.K.A. Spatiotemporal Fusion of Multisource Remote Sensing Data: A Survey and Trends. Remote Sensing 2018, 10, 527. [Google Scholar] [CrossRef]
- LeCun, Y.; Bengio, Y.; Hinton, G. Deep learning. Nature 2015, 521, 436–444. [Google Scholar] [CrossRef] [PubMed]
- He, K.; Zhang, X.; Ren, S.; Sun, J. Deep residual learning for image recognition. In Proceedings of the 2016 IEEE Conference on Computer Vision and Pattern Recognition (CVPR), Las Vegas, NV, USA, 27–30 June 2016; pp. 770–778. [Google Scholar] [CrossRef]
- Woo, S.; Park, J.; Lee, J.Y.; Kweon, I.S. CBAM: Convolutional block attention module. In Proceedings of the European Conference on Computer Vision (ECCV), Munich, Germany, 8–14 September 2018; pp. 3–19. [Google Scholar] [CrossRef]
- Wang, W.; Wang, J. Double ghost convolution attention mechanism network: A framework for hyperspectral reconstruction of a single RGB image. Sensors 2021, 21, 666. [Google Scholar] [CrossRef] [PubMed]
- Zhang, Y.; Li, K.; Li, K.; Wang, L.; Zhong, B.; Fu, Y. Image super-resolution using very deep residual channel attention networks. In Computer Vision—ECCV 2018; Springer: Cham, Switzerland, 2018; pp. 286–301. [Google Scholar] [CrossRef]
- Gao, F.; Masek, J.; Schwaller, M.; Hall, F. On the blending of the Landsat and MODIS surface reflectance: Predicting daily Landsat surface reflectance. IEEE Trans. Geosci. Remote Sens. 2006, 44, 2207–2218. [Google Scholar] [CrossRef]
- Zhou, D.; Xiao, J.; Bonafoni, S.; Berger, C.; Deilami, K.; Zhou, Y.; Frolking, S.; Yao, R.; Qiao, Z.; Sobrino, J.A. Satellite remote sensing of surface urban heat islands: Progress, challenges, and perspectives. Remote Sens. 2019, 11, 48. [Google Scholar] [CrossRef]
- Maimaitijiang, M.; Sagan, V.; Sidike, P.; Daloye, A.M.; Erkbol, H.; Fritschi, F.B. Crop monitoring using satellite/UAV data fusion and machine learning. Remote Sens. 2020, 12, 1357. [Google Scholar] [CrossRef]
- Reichstein, M.; Camps-Valls, G.; Stevens, B.; Jung, M.; Denzler, J.; Carvalhais, N.; Prabhat, F. Deep learning and process understanding for data-driven Earth system science. Nature 2019, 566, 195–204. [Google Scholar] [CrossRef] [PubMed]
- Sandholt, I.; Rasmussen, K.; Andersen, J. A simple interpretation of the surface temperature/vegetation index space for assessment of surface moisture status. Remote Sens. Environ. 2002, 79, 213–224. [Google Scholar] [CrossRef]
- Gao, B.C. NDWI—A normalized difference water index for remote sensing of vegetation liquid water from space. Remote Sens. Environ. 1996, 58, 257–266. [Google Scholar] [CrossRef]


Disclaimer/Publisher’s Note: The statements, opinions and data contained in all publications are solely those of the individual author(s) and contributor(s) and not of MDPI and/or the editor(s). MDPI and/or the editor(s) disclaim responsibility for any injury to people or property resulting from any ideas, methods, instructions or products referred to in the content. |
© 2025 by the authors. Licensee MDPI, Basel, Switzerland. This article is an open access article distributed under the terms and conditions of the Creative Commons Attribution (CC BY) license (https://creativecommons.org/licenses/by/4.0/).