Highlights
What are the main findings?
- The proposed model effectively integrates progressive multi-scale feature extraction with deformable attention mechanisms, achieving comprehensive representation of cloud systems, spanning from macroscopic cloud organizations down to local textures and irregular morphological patterns.
- A composite loss function is introduced, which significantly enhances the reconstruction of high-frequency details while preserving meteorological physical consistency in the super-resolved cloud image.
What is the implication of the main finding?
- The framework offers a viable approach for high-resolution cloud analysis, showing potential value in nowcasting and climatological applications.
- The methodology demonstrates how meteorological physical constraints can be incorporated into deep-learning-based image reconstruction, providing a reference for domain-aware super-resolution tasks in remote sensing and atmospheric sciences.
Abstract
High-resolution meteorological satellite cloud imagery plays a crucial role in diagnosing and forecasting severe convective weather phenomena characterized by suddenness and locality, such as tropical cyclones. However, constrained by imaging principles and various internal/external interferences during satellite data acquisition, current satellite imagery often fails to meet the spatiotemporal resolution requirements for fine-scale monitoring of these weather systems. Particularly for real-time tracking of tropical cyclone genesis-evolution dynamics and capturing detailed cloud structure variations within cyclone cores, existing spatial resolutions remain insufficient. Therefore, developing super-resolution techniques for meteorological satellite cloud imagery through software-based approaches holds significant application potential. This paper proposes a Multi-scale Residual Deformable Attention Model (MRDAM) based on Generative Adversarial Networks (GANs), specifically designed for satellite cloud image super-resolution tasks considering their morphological diversity and non-rigid deformation characteristics. The generator architecture incorporates two key components: a Multi-scale Feature Progressive Fusion Module (MFPFM), which enhances texture detail preservation and spectral consistency in reconstructed images, and a Deformable Attention Additive Fusion Module (DAAFM), which captures irregular cloud pattern features through adaptive spatial-attention mechanisms. Comparative experiments against multiple GAN-based super-resolution baselines demonstrate that MRDAM achieves superior performance in both objective evaluation metrics (PSNR/SSIM) and subjective visual quality, proving its superior performance for satellite cloud image super-resolution tasks.
1. Introduction
Clouds are visible aggregates suspended in the atmosphere, composed of microscopic water droplets formed by condensation of atmospheric water vapor and ice crystals formed through sublimation. The geostationary meteorological satellite (hereafter referred to as “satellite”) captures cloud layer structures from high altitudes, serving as a critical information source for studying atmospheric morphology and evolutionary mechanisms over Earth’s surface [1]. Particularly in monitoring and forecasting operations for severe convective weather events like tropical cyclones, satellite cloud imagery demonstrates irreplaceable value [2,3]. To accommodate the accelerating modernization process, weather forecasting, climate prediction, and meteorological disaster early-warning systems face increasingly stringent requirements for precision, necessitating more detailed and accurate analysis of satellite cloud imagery. Consequently, high-resolution meteorological satellite cloud data has become an essential foundational resource for atmospheric science research and operational meteorology.
While physical upgrades to satellite imaging systems can improve image resolution, this approach typically faces two major limitations: (1) lack of flexibility and high costs due to dynamically changing image acquisition requirements in practical applications; (2) capability only for capturing new high-resolution (HR) images rather than enhancing existing low-resolution (LR) images. Compared to hardware-based “hard” solutions, signal-processing-oriented “soft” super-resolution techniques offer greater flexibility and cost-effectiveness. As a software-driven methodology, image super-resolution (SR) technology enables resolution enhancement without equipment updates, providing cost-effective clarity improvements. This technique has been widely adopted in remote sensing, medical imaging, entertainment, and video surveillance applications, attracting sustained academic attention globally. Therefore, when meteorological satellites cannot yet provide satellite imagery with sufficient spatiotemporal resolution, developing refined cloud image interpretation techniques through software approaches using existing satellite systems and acquired observational data holds significant practical value for improved monitoring and forecasting of tropical cyclones and other severe convective weather phenomena.
Traditional satellite cloud image super-resolution methods primarily focus on enhancing image details through general digital image processing techniques. For instance, Wu et al. [4] proposed a cartoon-texture decomposition approach based on tensor diffusion for satellite image preprocessing, effectively reducing noise while sharpening cloud edge transitions. Yin et al. [5] introduced an adaptive nonlinear image enhancement fusion method based on grayscale mean values, leveraging domain knowledge that visible-light cloud imagery exhibits monotonically increasing grayscale over time, while infrared imagery shows monotonic decreases, thereby fusing visible and infrared images to reveal additional cloud details. Cai et al. [6] developed an image inpainting method combining Hough transform with line-loss distribution characteristics in satellite imagery. Kim et al. [7] improved high-resolution cloud image restoration quality by incorporating estimated interpolation error into interpolated images. Demirel et al. [8] and Ahire et al. [9] achieved significant improvements in reconstructed satellite image quality through discrete wavelet transform-based super-resolution approaches.
Compared to traditional satellite cloud image super-resolution algorithms, deep-learning-based super-resolution (SR) techniques offer a novel research paradigm for enhancing cloud image quality. Convolutional neural networks (CNNs) such as SRCNN [10] and EDSR [11], which learn end-to-end mappings from low-resolution (LR) to high-resolution (HR) images, have achieved remarkable progress in natural image domains. In specialized satellite cloud image SR tasks, Jin et al. [12] constructed an anti-aliasing directional multi-scale transform integrated with stochastic projection techniques to introduce smoothed projection algorithms into block-based compressed sensing reconstruction. He et al. [13] incorporated Tetrolet transform—a representation capable of capturing directional texture and edge information—into compressed sensing’s sparse representation stage, computing differences between reference cloud images and adjacent temporal images to reconstruct high-quality outputs within the compressed sensing framework. Shi et al. [14] proposed a coupled dictionary learning algorithm that modifies dictionary pair update strategies and employs optimal orthogonal matching pursuit to generate HR cloud images meeting reconstruction constraints. Zhou et al. [15] introduced a sparse representation-based infrared cloud image super-resolution method that structures image patches into groups as sparsity units, exploiting structural similarity information in infrared cloud data to enhance resolution. Zhang et al. [16] presented deep-learning-based SR restoration approaches, with Su et al. [17] demonstrating superior performance over interpolation and sparse methods through CNN-based satellite cloud image SR research. Jing et al. [18] successfully applied adversarial-learning-based super-resolution algorithms to satellite cloud image SR tasks. Cornebise et al. [19] proposed a multi-path network model called SRCloudNet, which involves a joint feature extraction method of backprojection network and local residual network to achieve more accurate image super-resolution reconstruction. To promote the widespread application of machine learning in satellite image super-resolution research, Zhang et al. [20] have created a professional dataset.
We fundamentally recognize that satellite cloud imagery represents quantitative maps of physical variables like brightness temperature, making its super-resolution an inverse physical problem rather than a conventional visual enhancement task. However, existing deep-learning-based super-resolution methods face particular challenges when applied to this domain. First, cloud systems exhibit complex multi-scale textures where different cloud types show substantial variations in both morphological characteristics and frequency-domain distributions. Second, the non-rigid deformations and fractal features along cloud edges render traditional spatial convolution operations inadequate for capturing crucial high-frequency details. Most critically, meteorological applications demand strict physical consistency, requiring preserved geometric integrity and radiometric interpretability—constraints that current methods fail to sufficiently address.
Given the rich details and complex textures in satellite cloud images, combined with the dynamic evolution and deformable nature of cloud systems across spatiotemporal dimensions, this study proposes a Multi-scale Residual Deformable Attention Model (MRDAM) based on deep learning for satellite cloud image super-resolution. The model integrates visual attention mechanisms to address the unique characteristics of satellite cloud data within a Generative Adversarial Network (GAN) framework. The generator architecture comprises two key components: the Multi-scale Feature Progressive Fusion Module (MFPFM), which enhances texture detail preservation and spectral consistency in reconstructed images, and the Deformable Attention Additive Fusion Module (DAAFM), which captures irregularly shaped cloud features through adaptive attention mechanisms. Our main contributions are as follows:
(1) Multi-scale Feature Progressive Fusion Module (MFPFM): This module enables multi-scale feature perception, allowing simultaneous focus on low-frequency structural information and high-frequency detail restoration. By implementing progressive feature fusion across network depths, it achieves superior global–local feature extraction capabilities to capture both large-scale cloud systems and small-scale convective cells in satellite cloud imagery.
(2) Deformable Attention Additive Fusion Module (DAAFM): The deformable attention mechanism improves sensitivity to meteorologically critical details (e.g., cloud boundaries and textures) and irregular cloud pattern features. Through cross-layer additive attention strategies, the attention matrices from smaller-scale layers are incorporated as prior knowledge into current-scale computations. Additionally, deformable convolution operations are employed to better characterize cloud system deformations in satellite cloud images.
(3) Texture-Aware Loss Function: A texture-preserving loss component is integrated into the overall network loss formulation to compensate for insufficient high-frequency detail supervision in conventional loss functions. This enhancement improves the reconstruction of fine-scale structural details in super-resolved satellite cloud images while maintaining meteorological interpretability.
2. Method
Optical images represent visual appearances, while cloud images are quantitative maps of physical variables like temperature. Therefore, super-resolution for a cloud image is an inverse physical problem, aiming to recover high-resolution distributions of these variables. Accordingly, our model employs a multi-scale architecture with deformable attention to capture atmospheric dynamical states and incorporates a composite loss function that ensures that the super-resolution results maintain high visual quality while preserving physically plausible.
Inspired by the human visual selective attention mechanism, the computer vision field has modeled attention as a prior cognitive tool. Among these, spatial-attention mechanisms, which are sensitive to spatial structures and capable of effectively localizing key regions, have demonstrated significant advantages in complex texture reconstruction tasks. However, traditional spatial-attention mechanisms (e.g., fixed-window or global attention) suffer from rigid sampling patterns that struggle to adapt to non-regular cloud structures such as cloud deformation and vortex motion. Additionally, their ability to jointly model multi-scale meteorological features in cloud imagery—such as localized convective cells and global spiral rainbands—is limited. To address these challenges, this study proposes a cross-layer additive deformable spatial-attention mechanism and constructs a multi-scale feature fusion network module to achieve super-resolution restoration of satellite cloud images.
2.1. Network Structure
To address the aforementioned challenges, this paper proposes a Multi-scale Residual Deformable Attention Model (MRDAM) for satellite cloud image super-resolution, as illustrated in Figure 1. Designed to meet the dual requirements of multi-scale cloud system meteorological features and super-resolution tasks in satellite cloud imagery, MRDAM achieves high-frequency detail restoration and low-frequency structural fidelity while realizing progressive hierarchical feature extraction through cross-scale attention mechanisms. By leveraging the synergistic effects of its modular components, MRDAM effectively enhances the quality of satellite cloud image super-resolution.
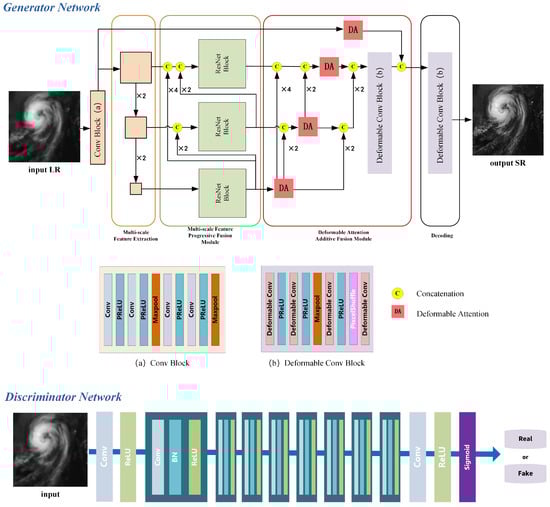
Figure 1.
Multi-scale Residual Deformable Attention-based Network for super-resolution reconstruction of satellite cloud imagery.
Firstly, MRDAM adopts the Super-Resolution Generative Adversarial Network (SRGAN) [21] as its backbone framework. Through dynamic adversarial interactions between two neural networks—Generator (G) and Discriminator (D)—both networks iteratively improve their capabilities. The generator progressively enhances its ability to generate realistic samples, while the discriminator strengthens its capacity to distinguish real from synthetic data. Specifically, to enhance contextual information modeling, the generator incorporates a Multi-scale Feature Progressive Fusion Module (MFPFM). By perceiving multi-scale features, this module enables superior global–local feature extraction, allowing the model to better capture both large-scale cloud systems and small-scale convective cell characteristics in satellite cloud imagery. Additionally, based on visual attention principles, a Deformable Attention Additive Fusion Module (DAAFM) is constructed to better detect meteorologically critical high-frequency details (e.g., cloud boundaries and textures). The cross-layer additive strategy integrates attention matrices from smaller-scale layers as prior knowledge, adding them to attention matrices computed at the current scale layer to generate scale-specific attention matrices—thereby realizing a priori knowledge-driven attention mechanism.
Meanwhile, the discriminator enforces adversarial feedback to compel the generator to learn real-image distributions. To differentiate between generated super-resolved (SR) images and authentic high-resolution (HR) images, the discriminator guides the generator toward producing more realistic details through adversarial training. The discriminator comprises eight convolutional blocks, each consisting of a “convolution layer + activation layer + batch normalization layer” sequence. Finally, a Sigmoid activation outputs a scalar value between 0 and 1, representing the probability that the input image is a real high-resolution image.
2.2. Loss Function
To find a better loss function of the proposed method for satellite cloud image super-resolution, this study introduces a texture-aware loss and integrates it into the SRGAN loss. This composite loss function jointly constrains the super-resolution output to maintain both high-frequency texture details and atmospheric physical consistency in the reconstructed cloud image.
The Mean Squared Error (MSE) is the most fundamental and widely used loss function in image restoration tasks. It evaluates model performance by computing the average of squared differences between predicted values and ground-truth values. The mathematical formulation is as follows:
where N denotes the number of samples, represents the actual value of the i-th sample, and is the model’s predicted value for that sample. When used as an optimization objective function, MSE minimizes the sum of squared prediction errors by averaging them, which assigns higher weights to samples with larger errors during training. This prioritizes the reduction of errors in such samples, driving overall loss reduction. While this penalty mechanism enhances sensitivity to outliers and guides data fitting, it also introduces practical challenges—such as vulnerability to outliers and potential vanishing gradients—due to its overemphasis on large errors.
In the SRGAN framework, the generator G does not adopt traditional MSE as its loss function. The authors argue that while MSE constraints yield strong peak signal-to-noise ratio (PSNR) metrics, the resulting super-resolved images often lack rich high-frequency details, appearing overly smoothed. This limitation arises because MSE only quantifies pixel-wise differences between the generated high-resolution (HR) image and the ground truth, failing to account for structural or textural variations. Relying solely on low-level pixel discrepancies is insufficient for capturing perceptual realism. To address this, higher-level image features must be incorporated into the loss function to enhance sensitivity to detail variations and improve the super-resolution performance of deep learning models.
This SRGAN framework innovatively introduces a composite loss function, expressed as Equation (2):
where denotes the content loss, which employs the VGG network to extract features and computes the Euclidean distance between high-level semantic features of the super-resolved image and the ground-truth high-resolution image. represents the adversarial loss for discriminating generated samples. is a regularization term based on total variational loss, which can constrain the consistency and stability of the physical meaning represented by the grayscale values of satellite cloud images before and after super-resolution.
Comparing to traditional MSE loss, the VGG feature loss reduces image blurring by matching deep feature distributions, preserving high-frequency details while achieving semantic feature retention. It captures semantic information (e.g., edges, textures, and structures) and aligns generated images with human perceptual preferences rather than pixel-level similarity, avoiding excessive smoothing. However, the VGG feature loss is sensitive to feature layer selection—the impact of different layers (e.g., shallow conv1_2 and deep conv5_4 in VGG) varies significantly. Additionally, VGG is pre-trained on natural images (e.g., ImageNet), limiting its ability to capture domain-specific features in satellite cloud imagery with stringent structural requirements. This results in suboptimal fine-structure reconstruction in super-resolved images.
To address this problem, this study proposes a texture-aware loss function that supervises texture preservation by computing the absolute difference of variances between image patches in the generated super-resolved image and the original high-resolution image. This loss function operates between the low-level MSE feature loss and high-level feature loss , serving as an intermediate strategy for texture-aware supervision. The mathematical formulation is defined in Equation (3):
in which denotes a high-resolution image patch, represents a low-resolution image patch, and indicates the super-resolved image patch. Var(*) calculates the variance of image patches, while and denote the corresponding mean values of image patches. W and H represent the width and height of image patches in pixels, respectively, and x and y are the pixel indices of the image.
In the generator network G of this work, the following loss function architecture is employed to further overcome existing algorithmic bottlenecks and enhance the performance of the super-resolution model.
in which , , and are mentioned in detail in reference [21].
In the discriminator, we use the Binary Cross Entropy Loss as the loss function, as in Equation (5) as follows:
where is the ground truth of the i-th sample, while is the predicted value.
3. Multi-Scale Feature Progressive Fusion Module
Multi-scale feature processing has proven highly effective in digital image processing tasks. Particularly for satellite cloud imagery, where cloud systems exhibit strong scale variations, relying solely on single-scale features fails to capture complete contextual information. Parallel feature extraction across multiple scales enables models to simultaneously focus on both local details and global structural information. To address this, we propose extracting features from satellite cloud imagery at different resolution scales and sharing a deformable attention mechanism across these features to facilitate context-aware fusion over extended spatial ranges.
The Multi-scale Feature Progressive Fusion Module (MFPFM) employs a parallel multi-branch network architecture. First, multi-scale features (denoted as F in Figure 2) extracted by the Multi-scale Feature Extraction module are fed into residual blocks at different scales for further representation learning, yielding enhanced output features (denoted as F’ in Figure 2). Subsequently, features from smaller scales are progressively upsampled and merged with those from larger scales.
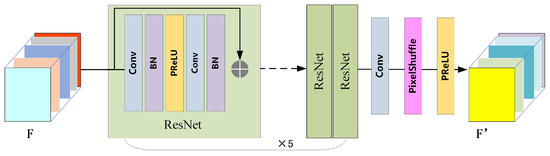
Figure 2.
Block architecture of the Multi-scale Feature Progressive Fusion Module.
The extracted features are progressively upsampled and fused with larger-scale features. This process is repeated for subsequent scales until feature extraction completes at the maximum resolution. Consequently, both scale-specific features and fused features integrating multi-scale contextual information are obtained. Finally, feature maps from each scale are independently transmitted to subsequent network modules. This hierarchical fusion strategy strengthens the contextual relevance of features across spatial resolutions, thereby improving the model’s capacity to represent cloud structures at varying scales.
4. Deformable Attention Stacked Fusion Module
Atmospheric motion is ubiquitous, and large-scale satellite cloud targets on Earth’s surface do not conform to regular 2D planar structures. Image processing for such targets necessitates deformable operators. This section first reviews deformable convolution and deformable attention mechanisms, followed by a detailed description of the proposed Deformable Attention Stacked Fusion Module (DAAFM).
4.1. Deformable Convolution
Figure 3 illustrates the schematic of standard convolution versus deformable convolution (DC) [22]. Specifically, left one shows a traditional 3 × 3 convolution kernel (green points), while right one introduces offset vectors (light blue arrows) to each kernel position, enabling adaptive geometric transformations.
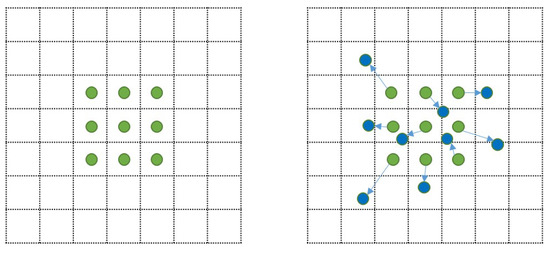
Figure 3.
Schematic illustration of standard and deformable convolution kernels.
Deformable convolution introduces learnable offsets during convolution operations, which are predicted through two convolutional layers consisting of learnable parameters generating x and y directional offset. The feature matrix produced by standard convolution is generally defined as Equation (6), where w denotes the convolution kernel, x represents the input image, y indicates the output feature, and corresponds to the output feature at position associated with the kernel center. represents the points in the image, which is a one-to-one correspondence to that in the convolution kernel. In contrast, the feature matrix from deformable convolution follows Equation (7), which incorporates an offset into the standard convolution operation.
The offsets are obtained through parameter-learnable convolutional layers. The convolutional kernel shares the same structure as a standard kernel but with a two-dimensional channel output corresponding to the x and y directional offsets. These additional offsets in deformable convolution layers are integrated into the main network architecture, fundamentally involving passing through a standard convolutional unit, enabling end-to-end learning via gradient backpropagation.
As illustrated in Figure 4, after training, the deformable convolution kernel dynamically adjusts its size and position according to the actual shape of the target in the image, regardless of the object’s original shape. This adaptive sampling mechanism allows the kernel positions to automatically vary with image content, accommodating geometric deformations such as object shape, scale, and orientation. While standard convolution employs regular rectangular templates for feature extraction in satellite cloud imagery, deformable convolution templates adaptively reshape according to target geometry. Consequently, deformable convolution effectively handles complex cloud patterns caused by movements, rotations, deformations, and scale variations in satellite cloud imagery.
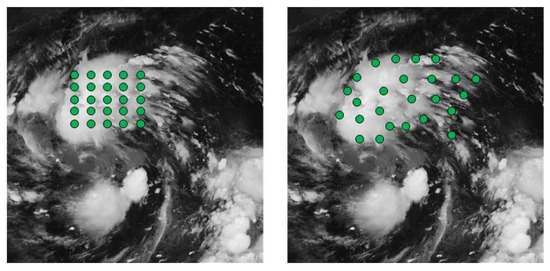
Figure 4.
Schematic illustration of shape adaptability in standard and deformable convolution kernels for satellite cloud imagery (green dot represents the shape of the convolution kernel).
However, how to appropriately integrate deformable convolution into the main architecture of deep neural networks remains an open question. It is known that feature maps in deeper network layers possess richer semantic information and larger receptive fields, enabling them to model more complex geometric transformations. Therefore, placing deformable convolutions at these deeper layers allows them to most effectively capture deformations and offsets present in cloud imagery. In contrast, feature maps from shallow layers primarily contain low-level information such as edges and colors, where the benefits of deformable convolutions are limited and may instead introduce unnecessary computational overhead. This paper investigates the embedding strategies of deformable convolution in the generator of SRGAN. We evaluated the performance of deformable convolution at different positions in the network structure in three scenarios: front, middle, and back, which are the positions of the input layer (before the first residual block), middle layer (after the seventh residual block), and output layer (after the last residual block), where Scheme 1 introduces multiple deformable convolution blocks, while Scheme 2 employs a single block. The experimental results, as shown in Table 1, demonstrate that optimal performance is achieved when the deformable convolution (with a single block) is placed near the network backend. This improvement stems from the availability of high-level semantic features in later stages, making adaptive feature focusing more efficient [23]. Consequently, with all the consideration above, we adopt the strategy of embedding deformable convolution in the latter part of the network.

Table 1.
Experiment on embedding position of deformable convolution in backbone network (evaluation metric: PSNR, bold indicates optimal results).
4.2. Deformable Attention
Attention mechanisms have rapidly advanced in computer vision, fundamentally serving as a biomimetic reconstruction of human visual selective attention mechanisms at the algorithmic level. These mechanisms are typically formalized as spatial, channel, and temporal attention computational paradigms.
Conventional attention mechanisms often rely on fixed windows or global computations, struggling to adapt to complex features with irregular vortex structures in satellite cloud imagery. Deformable attention (DA) [24] addresses the limitations of standard self-attention mechanisms, which suffer from prohibitively high computational complexity when processing high-resolution images or long sequential data. By dynamically adjusting spatial deformations in feature sampling regions, DA significantly enhances the model’s capability to capture intricate textures and non-rigid cloud system structures in satellite cloud imagery within super-resolution tasks.
The deformable attention mechanism generates a uniform grid of reference points based on the input feature map . First, the grid size is determined by the input feature dimensions H and W and a downsampling factor r: , . The reference coordinates are linearly spaced 2D positions . Subsequently, these coordinates are normalized to the range [−1, +1] according to the feature map shape , where (−1, −1) denotes the top-left corner, and (+1, +1) represents the bottom-right corner.
To obtain offsets for each reference point, query tokens q are generated via linear projection . These tokens are fed into a lightweight subnetwork to predict offsets. To stabilize training, offsets are typically scaled and clamped within predefined bounds using a normalization factor s, yielding . Finally, features at the deformed positions are sampled as key–value pairs and projected through learnable matrices to produce the output variables defined in Equations (8) and (9).
The key and value in the deformable attention mechanism are denoted as and , respectively. Specifically, we define the sampling function as a bilinear interpolation operation to ensure its differentiability:
Here, and denote all spatial positions on the feature map . Since it is non-zero only at the four nearest integer coordinates around the offset position , Equation (9) simplifies to a weighted average over these four discrete grid points. Following the existing approaches, we apply multi-head attention to q, k and v, incorporating relative position bias R. The output of each attention head is formulated as Equation (11):
Here, denotes the position encoding derived from ref. [24] with several modifications.
Deformable attention improves computational efficiency and flexibility by introducing offset vectors to adapt to geometric variations of targets in input feature maps. Unlike conventional attention mechanisms where weights are computed from fixed attention models at predefined positions, deformable attention dynamically adjusts the shape and scale of attention models to better accommodate varying task requirements and input characteristics. This adaptive mechanism is illustrated in Figure 5.
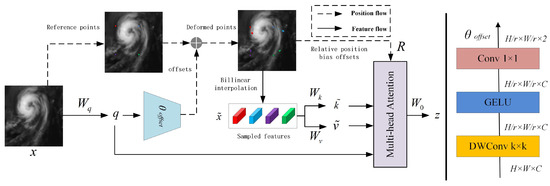
Figure 5.
Deformable attention model architecture.
4.3. Attention Stacked Fusion
We propose a low-level attention stacked fusion strategy that enables subsequent network layers to directly access low-level attention matrices from preceding layers. This strategy computes the current layer’s attention matrix by integrating knowledge from the previous layer’s attention matrix through cross-layer connections, thereby establishing structural dependencies across attention matrices.
The network architecture implementing this strategy is named the Deformable Attention Additive Fusion Module (DAAFM), which consists of three interconnected components: attention matrix generation, cross-layer connection, and feed-forward stacking. Specifically, the attention matrix generation module produces the current layer’s attention matrix. Subsequently, cross-layer connections introduce the preceding layer’s attention matrix into the current layer. Finally, feed-forward stacking computes the refined attention matrix for the current layer. The architectural design is illustrated in Figure 6.
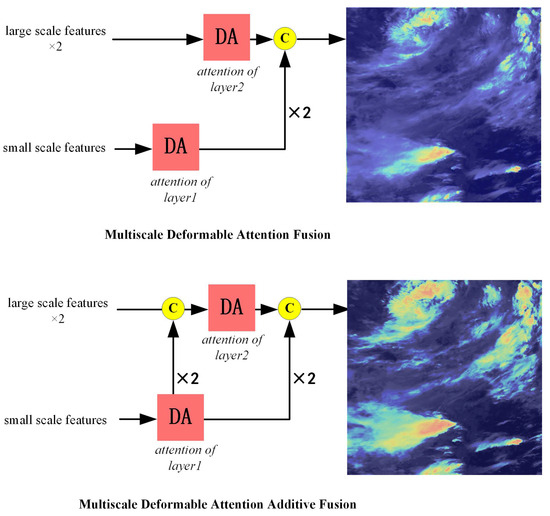
Figure 6.
Comparison of the two deformable attention fusion strategy.
Specifically, we design a cross-layer architecture termed prior-attention-constrained attention mechanism. The core module comprises an attention generation layer and cross-layer pathways, enabling attention matrices to propagate through two distinct pathways: one processed by the deformable attention module and another preserving the previous attention matrix or applying linear projections. By reformulating the conventional attention stacking architecture into a cross-layer configuration, this design integrates multi-scale attention matrices, enhancing the model’s capability to focus on and extract complex satellite cloud features (e.g., edges and textures). The arithmetic operations in the cross-layer deformable attention module are formulated as Equation (12):
Here, and are scalar weights, and we determine its optimal value through experimentation. We have set three scenarios, specifically , , and . In Figure 7, it can be seen that when , the attention heatmap can more comprehensively focus on the structure of complex cloud systems in the cloud image. Therefore, in this work, we set it to and . denotes an attention transformation function that takes an n×n matrix as input and outputs an n×n matrix. This function serves to transform the attention matrix from the previous layer into an attention prior usable in the current layer through learnable parameters.
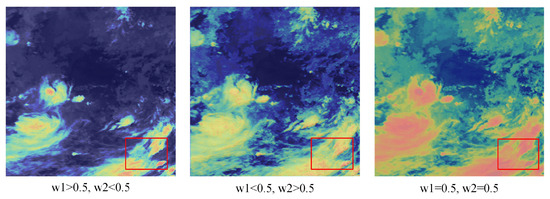
Figure 7.
Multi-scale deformable attention additive fusion strategy.
5. Experimental Results and Analysis
5.1. Algorithm Implementation Details
Table 2 outlines the steps of the proposed Multi-scale Residual Deformable Attention Network (MRDAM) for satellite cloud image super-resolution. The input is a low-resolution image (LR), and the output is the super-resolution image (SR), with the high-resolution target image (HR) serving as reference. The computational procedures mainly include constructing generator network G containing MFPFM and DAAFM modules; constructing discriminator network D using convolutional layers for progressive downsampling to distinguish real/fake images; defining loss functions and integrating them into the overall loss function; alternately training generator and discriminator networks of MRDAM; generating super-resolution images using the trained generator network of MRDAM. The complete implementation comprises six sequential steps.
Table 2.
Steps of satellite cloud image super-resolution method based on Multi-Scale Residual Deformable Attention.
5.2. Experimental Setup
The dataset used in this study consists of geostationary meteorological satellite Himawari-8 imagery provided by the Japan Meteorological Agency, covering latitudes from 60°S to 60°N and longitudes from 80°E to 200°E. It was collated and released during the 2018 Workshop on Pattern Recognition and Computer Vision in China. The original high-resolution (HR) images consist of infrared band grayscale images at a nominal physical resolution of 2 km, with an image size of 800 × 800 pixels. The corresponding low-resolution (LR) images were generated by downsampling the HR images using bilinear interpolation. A total of 2500 paired HR–LR images were selected, randomly divided into 2000 for training, 300 for validation, and 200 for testing. Figure 8 shows sample image pairs from the dataset, illustrating representative HR and LR satellite cloud images. The dataset includes convective regions and typhoon-centered cloud patterns, covering a variety of cloud morphologies such as spiral, banded, comma-shaped, and wavy cloud structures.
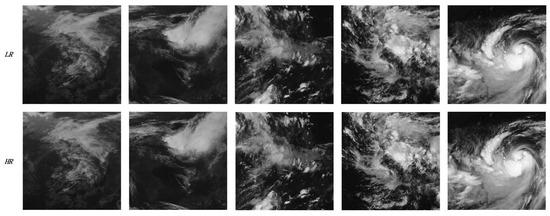
Figure 8.
The experimental dataset in this study comprises low-resolution (LR) images and their corresponding high-resolution (HR) counterparts with a 4× upscaling factor.
The optimizer adopts Adaptive Moment Estimation (Adam), and the learning rate strategy employs the “ploy” policy, which can be mathematically formulated as follows:
where is the updated learning rate, is the baseline learning rate, epoch is the current training iteration, num_epoch represents the maximum iteration count, and power controls the curve shape (typically > 1). In the experiments, was set to 0.001, power to 0.9, and num_epoch to 150. Pretrained parameters were not utilized during training. Due to computational and memory constraints, the batch size was configured as 64. To mitigate overfitting, data augmentation, dropout, and normalization techniques were integrated into the design. Additionally, a 10-fold cross-validation experiment was implemented: one data group was iteratively selected as the test set, while the remaining nine groups formed the training set, ensuring experimental reliability. The software environment included Python 3.10.16 and PyTorch 2.0.1. The hardware setup comprised an AMD EPYC-Rome Processor (16 cores) (Taiwan Semiconductor Manufacturing Company Limited, Hsinchu, Taiwan, China), NVIDIA GeForce RTX 4090 (Taiwan Semiconductor Manufacturing Company Limited, Hsinchu, Taiwan, China), and Ubuntu 22.04.5 LTS (Canonical Group Limited, London, UK).
5.3. Objective Evaluation Metrics
To evaluate the performance of the proposed algorithm on the Himawari-8 dataset, three primary metrics were selected: Peak Signal-to-Noise Ratio (PSNR), Structural Similarity (SSIM), and Relative Average Spectral Error (RASE). Their mathematical definitions are as follows:
5.3.1. Peak Signal-to-Noise Ratio
The Peak Signal-to-Noise Ratio (PSNR) is the most widely adopted full-reference objective quality assessment metric for image restoration tasks (e.g., super-resolution, denoising, demosaicking, and deblurring). Given and , the PSNR is defined as follows:
In which, denotes the Mean Squared Error between the super-resolved reconstructed image and the high-resolution reference image , where L represents the maximum pixel value (255 for 8-bit images). PSNR emphasizes the proximity of corresponding pixel values between and . When the structural information of the super-resolution reconstructed image approaches that of the original high-resolution image, higher PSNR values indicate better reconstruction quality; conversely, lower values suggest inferior performance.
5.3.2. Structural Similarity Index
The Structural Similarity Index (SSIM) serves as a comprehensive objective quality assessment metric for structural similarity evaluation. Specifically, it compares images through three dimensions—luminance, contrast, and structure—while quantifying image quality degradation from structural distortion perspectives. Its mathematical formulation is expressed as follows:
where and represent the mean intensities of the super-resolved image and reference high-resolution image , and denote their standard deviations, and is the covariance between and , while and are small constants to avoid denominator instability. When the structural information of super-resolution reconstructed images closely matches the original high-resolution images, the SSIM value approaches 1; conversely, it decreases.
5.3.3. Relative Average Spectral Error (RASE)
The Relative Average Spectral Error (RASE) serves as a critical metric for evaluating spectral reconstruction quality in multi/hyperspectral image super-resolution tasks, particularly in remote sensing applications involving image fusion and spatial enhancement. It quantifies spectral preservation capability through spectral error analysis between reconstructed and reference images. This metric demonstrates cross-sensor comparability and enables comprehensive multi-band assessment, often combined with spatial quality indicators (PSNR and SSIM) for joint analysis. In remote sensing and biomedical imaging domains, RASE provides essential spectral fidelity evaluation through its mathematical formulation:
where M denotes the average radiance across all spectral bands in the reference image for normalization purposes, N represents the number of spectral bands, and RMSE indicates the Root Mean Squared Error for the i-th spectral band, which is mathematically defined as follows:
where and denote the high-resolution reference image and super-resolved reconstructed image, respectively, while W and H represent the image width and height. When the structural information of the super-resolution image closely matches the original high-resolution image, RASE produces smaller values. Conversely, larger values indicate poorer spectral reconstruction.
5.3.4. Natural Image Quality Evaluator (NIQE)
The Natural Image Quality Evaluator (NIQE) is a no-reference image quality assessment metric based on quality-aware features derived from natural scene statistics (NSS). The method constructs a multivariate Gaussian model (MVG) by learning texture characteristics from a large dataset of natural images. For a super-resolution reconstructed image , NIQE evaluates quality by measuring the discrepancy between its feature distribution and the pre-fitted MVG model. The calculation is defined as follows:
where and represent the mean vector and covariance matrix of the natural MVG model, and and denote the corresponding parameters for the reconstructed image. The calculation details refer to reference [25]. When the structural features of the super-resolution reconstruction image align closer with the predefined feature model, the image quality is higher and the NIQE value decreases; conversely, greater discrepancies result in lower quality and higher NIQE values.
5.4. Ablation Experiment and Analysis
As described in Section 3 and Section 4 of this paper, the proposed method incorporates three key components: deformable convolution operation (DC), deformable attention (DA), and multi-scale structure (MS). To systematically investigate the individual contributions of these modules to the overall performance and elucidate their synergistic mechanisms in satellite cloud image super-resolution reconstruction, ablation experiments are conducted on the dataset.
As presented in Table 3, PSNR, SSIM, and RASE metrics are employed to evaluate the effectiveness of each module. The experimental results demonstrate that employing only the deformable convolution in the generator enhances the capability to capture morphological variation features of satellite cloud images, improving PSNR by approximately 0.9 compared to the original SRGAN method. Subsequently integrating the deformable attention mechanism into the generator further strengthens the network’s ability to reconstruct detailed morphological features, resulting in an additional PSNR improvement of about 0.5. When the multi-scale structure is introduced into the generator, the PSNR metric increases further to 34.4591, achieving a cumulative improvement of about 2.4 over the baseline SRGAN algorithm. Moreover, when all modules are integrated into the network backbone, the proposed method attains the optimal performance in both SSIM and RASE metrics, indicating superior structural preservation capability and minimal loss of meteorological cloud features. The ablation study confirms that the complete combination of these modules yields the best objective evaluation indices. The integration of deformable convolution, deformable attention, and multi-scale structure enables the proposed network to outperform the baseline SRGAN model, thereby more effectively addressing the satellite cloud image super-resolution task. These findings align consistently with the theoretical analysis presented in this work.
Table 3.
Ablation study of each module in the proposed algorithm model (bold indicates optimal results).
Figure 9 reveals that integrating the deformable convolution module enhances the super-resolution reconstruction of cloud texture details compared to the SRGAN baseline model. When both deformable convolution and deformable attention modules are incorporated, the super-resolved images exhibit significantly superior restoration of localized cloud features. These include convective cells at cloud tops (as detailed in the fourth row) and the structural intricacies of cyclonic spirals (highlighted in the first row detail of Figure 9). Further inclusion of the multi-scale structure module yields results demonstrating improved fidelity in both local details and global cloud morphology. These ablation studies quantitatively delineate the individual contributions of each module while concurrently validating the efficacy of their synergistic interactions.
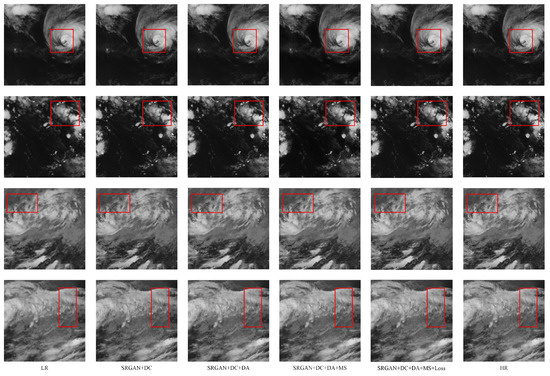
Figure 9.
The visualization results of the ablation experiments for each module.
To complement the ablation analysis, we employed heatmap visualizations to illustrate the impact of each module. We selected two low-resolution (LR) satellite cloud images from the dataset for 4× super-resolution reconstruction. Heatmaps generated using optimal parameters learned during training, corresponding to different module combinations, are presented in Figure 10. These visualizations demonstrate that the model integrating deformable convolution and deformable attention modules effectively spatially attends to the diverse edges within cloud imagery, particularly focusing on the complex textural structures surrounding the vortex structure of typhoon cloud systems. The subsequent addition of the multi-scale structure module further augments the model’s capacity to capture both local textural details and the global morphology of cloud systems. This enhancement stems from the utilization of cross-layer prior knowledge; by fusing multi-scale features across layers, the model achieves a superior spatial–structural reconstruction of satellite cloud imagery during super-resolution.
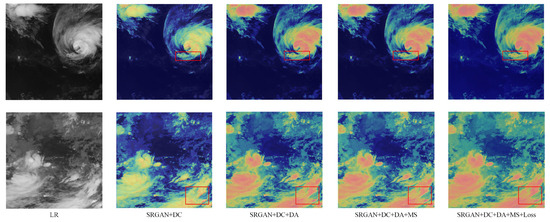
Figure 10.
The results of the heat maps from the ablation experiments of each module.
5.5. Comparative Experiment and Analysis
Through ablation experiments, we have validated the effectiveness of individual modules in the proposed model. To further evaluate its performance, we conduct comparative experiments against several publicly available deep-learning-based image super-resolution models. Following the principle of controlling variables, all experiments are implemented under consistent experimental settings and environments on the Himawari-8 dataset. The performance of different models is comprehensively assessed using three objective metrics: PSNR, SSIM, and RASE. The selected baseline models include VDSR [26], SRGAN [21], ESRGAN [27], SRRseCGAN [28], BSRGAN [29], and RealESRGAN [30]. The superiority of our proposed network in satellite cloud image super-resolution is demonstrated through both qualitative visual comparisons and quantitative objective evaluations.
Table 4 presents the objective evaluation metrics of different models for satellite cloud image super-resolution tasks (4×). According to the experimental results, our proposed model achieves the best performance in both PSNR and SSIM metrics while attaining the second-best performance in RASE metric among all compared models. The experimental results also indicate that our model indeed requires more parameters and computational cost than the baseline models. However, the increase in complexity remains within a reasonable range. This overhead primarily stems from the multi-scale feature extraction and deformable attention mechanisms introduced in our framework, which are designed to more effectively represent cloud features in satellite imagery with diverse detail variations and large-scale differences. These components contribute significantly to the improved super-resolution image quality, as evidenced by the PSNR gains of approximately 0.64 dB over ESRGAN and 2.70 dB over SRGAN.
Table 4.
Comparison results between the proposed method and other methods (4× magnification, bold indicates optimal results).
To demonstrate the visual super-resolution performance of different models in comparative experiments, five representative test samples were selected from the test set. These samples exhibit diverse cloud system morphologies and serve as typical cases for evaluation. Figure 11 shows the super-resolution results of all compared models on these five test images.
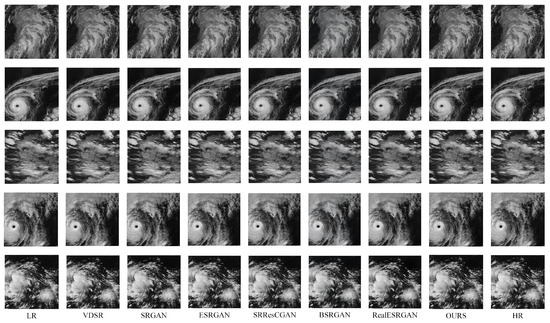
Figure 11.
Comparative experimental results of the proposed method with other approaches on the satellite cloud image super-resolution task (4× upscaling).
According to high-resolution satellite cloud image analysis, the proposed network model demonstrates superior capability in reconstructing detailed information with complex cloud texture patterns. Compared to corresponding low-resolution (LR) and high-resolution (HR) images, our model achieves excellent super-resolution performance for satellite cloud images, particularly exhibiting strong perceptual abilities for multi-shaped cloud structures and edge details. The method effectively restores super-resolution details in various complex-shaped cloud edges and feathery cloud systems while showing minimal artifacts such as detail blurring or overemphasized edges. It maintains an optimal balance between image clarity enhancement and cloud structure texture restoration.
In comparative analysis, SRGAN, ESRGAN, and SRRseCGAN demonstrated insufficient fine-detail restoration, whereas BSRGAN and RealESRGAN exhibited over-sharpening artifacts. The comprehensive experimental results highlight the effectiveness of the proposed MRDAM generative adversarial network for satellite cloud image super-resolution tasks. Our model demonstrates excellent restoration performance for both thick and thin cloud structures, particularly achieving superior super-resolution effects for complex typhoon cloud systems. The internal structures and edge details of typhoon clouds, including feathery, filamentous, and wispy cloud patterns, are reconstructed with high fidelity.
Table 5 presents the objective evaluation metrics of different models for satellite cloud image super-resolution tasks (2×). Figure 12 presents comparative results between the proposed method and benchmark approaches under 2× magnification experiments. The results indicate that our method maintains robust performance even at this magnification level. Notably, the proposed approach demonstrates superior detail restoration capability at cloud image boundaries, with clearer edge definition and texture preservation compared to alternative methods.
Table 5.
Comparison results between the proposed method and other methods (2× magnification, bold indicates optimal results).
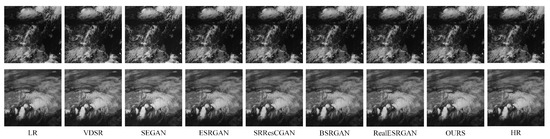
Figure 12.
Comparative experimental results of the proposed method with other approaches on the satellite cloud image super-resolution task (2× upscaling).
5.6. Generalization Experiment and Analysis
To further validate the generalization capability of the proposed algorithm on unseen datasets and evaluate its robustness and transferability, this section conducts generalization experiments using the Digital Typhoon Dataset. This dataset contains 1099 typhoons and 189,364 images spanning typhoon events in the Northwest Pacific region (100°E to 180°E) from 1978 to 2022. Four groups of typhoon time-series grayscale images were selected for analysis: PABUK (2018), VONGFONG (2020), DUJUAN (2021), and MALAKAS (2022). The superiority of the proposed network for satellite cloud image super-resolution was verified through both visual comparison of super-resolution effects and objective evaluation metrics.
Adhering to the principle of controlled variables in experimental design, the testing environment and parameter settings remained consistent across all comparisons. As shown in Table 6, the generalization experiment lacked paired high-resolution (HR) reference images. Therefore, the no-reference image restoration quality assessment metric Natural Image Quality Evaluator (NIQE) was employed to evaluate model performance. The results demonstrate that our model achieves consistently favorable and stable outcomes under the NIQE objective evaluation framework.
Table 6.
Generalization experiment results of the proposed method on four typhoon medium points in digital typhoon dataset.
Due to the presence of approximately 200 satellite cloud images in each typhoon sequence, it is impractical to visualize all images individually. Therefore, based on meteorological criteria, the typhoon sequence images are categorized into four developmental phases: formation, development, intensification, and dissipation. Six sequential images with 3-h intervals are selected from each phase. We note that super-resolution reconstruction of typhoon sequence images requires not only consideration of complex cloud pattern structures but also the continuity of structural changes over time. Figure 13 shows the selected sequential images corresponding to the four developmental phases of Typhoon DUJUAN (2021). The proposed algorithm achieves superior restoration of marginal structural details in cloud morphology across different typhoon stages. It effectively reconstructs filamentous peripheral clouds, feather-like cloud structures, spiral rainbands surrounding the typhoon eye, and banded cloud patterns during dissipation phase while maintaining the temporal coherence of typhoon cloud evolution. Consequently, the proposed MRDAM method demonstrates robust performance and transfer capability in satellite cloud image super-resolution tasks, laying a foundation for future applications of satellite cloud imagery in meteorological analysis and forecasting.
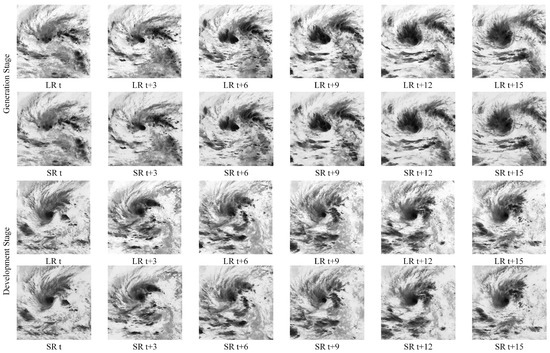
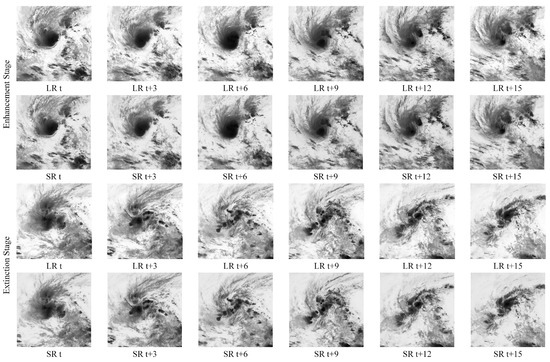
Figure 13.
The super-resolution visualization results of satellite cloud images at various stages of Typhoon DUJUAN (2021) by the proposed method.
6. Discussion
This study proposed a novel super-resolution framework for satellite cloud imagery, integrating multi-scale progressive fusion, deformable attention mechanisms, and a physical loss optimization. The experimental results demonstrate that our method achieves superior performance in reconstructing high-resolution cloud systems and fine-scale convective structures while maintaining physical consistency. Compared to existing approaches based on GAN, our model shows significant improvements in perceptual quality and meteorological relevance, particularly in capturing irregular cloud morphologies and boundary details. Our method reduces spatial distortion in cloud boundaries and enhances texture fidelity under multiple scaling factors. These advantages are attributed to the deformable attention module’s ability to adaptively focus on meteorologically critical regions, as well as the multi-scale architecture’s capacity to hierarchically integrate structural and textural information. Nevertheless, certain limitations remain. While the model performs well under most cloud types, its reconstruction accuracy decreases in regions with rapidly evolving convective systems, possibly due to insufficient temporal modeling. Future work may explore dynamic or sequence-based modeling to address this issue.
7. Conclusions
In this paper, we presented a dedicated super-resolution method for satellite cloud imagery that effectively balances perceptual quality and physical interpretability. Through systematic experimentation, we found that the proposed model achieves optimal performance at a 4× super-resolution scale, offering an ideal trade-off between computational cost and reconstruction accuracy. To facilitate broader adoption, we recommend the following: The method can be integrated into nowcasting systems or climate data processing pipelines to enhance the spatial resolution of historical or real-time cloud products. With appropriate retraining, the framework may be extended to other types of meteorological data, such as radar reflectivity or atmospheric reanalysis fields. This work underscores the value of domain-aware design in super-resolution tasks and provides a feasible path toward high-resolution, physically consistent satellite cloud imagery.
Author Contributions
Conceptualization, L.Z. and Z.L.; methodology, L.Z. and Z.L.; software, Z.L.; validation, Z.L.; formal analysis, L.Z. and Q.S.; investigation, L.Z. and Z.L.; resources, Z.L.; data curation, Z.L.; writing—original draft preparation, Z.L.; writing—review and editing, L.Z.; visualization, Z.L.; supervision, L.Z. and Q.S.; project administration, L.Z. and Q.S.; funding acquisition, L.Z. All authors have read and agreed to the published version of the manuscript.
Funding
This work is funded by the Shanghai Typhoon Research Foundation from Shanghai Typhoon Institute of China Meteorological Administration, grant number TFJJ202208.
Data Availability Statement
The original contributions presented in the study are included in the article, further inquiries can be directed to the corresponding author.
Conflicts of Interest
The authors declare no conflicts of interest.
References
- Fan, T.; Xu, Q. Meteorological Satellite and Satellite Meteorology; Meteorological Press: Beijing, China, 2014; pp. 101–105. (In Chinese)
- Lin, P.; Wang, N. A data-driven approach for regional-scale fine-resolution disaster impact prediction under tropical cyclones. Nat. Hazards 2024, 120, 7461–7479. [Google Scholar] [CrossRef]
- Toğaçar, M.; Ergen, B. Classification of cloud images by using super resolution, semantic segmentation approaches and binary sailfish optimization method with deep learning model. Comput. Electron. Agric. 2022, 193, 106724. [Google Scholar] [CrossRef]
- Wu, Y.; Li, H.; Song, X. Satellite cloud image edge extraction based on cartoon texture decomposition and NSCT. J. Pla Univ. Sci. Technol. (Nat. Sci. Ed.) 2015, 16, 245–253. (In Chinese) [Google Scholar]
- Yin, X.; Zhao, H.; Sun, W.; Guo, X.; Jiang, S.; Liu, Y. Research on enhanced fusion method of FY-4A satellite ocean cloud image. Mar. Surv. Mapp. 2020, 40, 30–34. (In Chinese) [Google Scholar]
- Cai, F.; Yan, Z.; Lang, H. Research and implementation of satellite cloud image repair method. Electron. Meas. Technol. 2017, 40, 109–112. (In Chinese) [Google Scholar]
- Kim, W.H.; Kim, J.N. Cloud Image Resolution Enhancement Method Using Loss Information Estimation; Signal Processing and Multimedia; Springer: Berlin/Heidelberg, Germany, 2010; pp. 115–120. [Google Scholar]
- Demirel, H.; Anbarjafari, G. Discrete wavelet transform-based satellite image resolution enhancement. IEEE Trans. Geosci. Remote Sens. 2011, 49, 1997–2004. [Google Scholar] [CrossRef]
- Ahire, R.B.; Patil, V.S. Overview of satellite image resolution enhancement techniques. In Proceedings of the 2013 Tenth International Conference on Wireless and Optical Communications Networks (WOCN), Bhopal, India, 26–28 July 2013; IEEE: Piscataway, NJ, USA, 2013; pp. 1–4. [Google Scholar]
- Dong, C.; Loy, C.C.; Tang, X. Accelerating the super-resolution convolutional neural network. In Proceedings of the Computer Vision—ECCV 2016: 14th European Conference, Amsterdam, The Netherlands, 11–14 October 2016; Proceedings, Part II 14. Springer International Publishing: Berlin/Heidelberg, Germany, 2016; pp. 391–407. [Google Scholar]
- Lim, B.; Son, S.; Kim, H.; Nah, S.; Lee, K.M. Enhanced deep residual networks for single image super-resolution. In Proceedings of the IEEE Conference on Computer Vision and Pattern Recognition Workshops, Honolulu, HI, USA, 21–26 July 2017; pp. 136–144. [Google Scholar]
- Jin, W.; Fu, R.; Ye, M.; Cen, X.; Yin, C. Satellite cloud image compression sensing reconstruction using residual estimation. Appl. Sci. J. 2011, 5, 495–499. (In Chinese) [Google Scholar]
- He, Y.; Jin, W.; Liu, L.; Fu, R.; Tian, W. Cloud image compression sensing reconstruction using spatiotemporal correlation in Tetrolet domain. Remote Sens. J. 2014, 5, 1034–1047. (In Chinese) [Google Scholar]
- Shi, D.; Fu, R.; Jin, W. Infrared cloud image super-resolution method based on coupled complete dictionary. Opto-Electron. Eng. 2014, 4, 69–74. (In Chinese) [Google Scholar]
- Zhou, Y. Research on Some Key Technologies of Satellite Cloud Image Super-Resolution. Master’s Thesis, Ningbo University, Ningbo, China, 2017. (In Chinese). [Google Scholar]
- Zhang, J.; Yang, Z.; Liu, Y.; Xue, K. A Deep Learning-Based Satellite Cloud Image Super-Resolution Reconstruction Method. CN111861884A[P], 16 May 2023. (In Chinese). [Google Scholar]
- Su, J. Research on Infrared Cloud Image Super-Resolution Reconstruction Algorithm Based on Learning. Master’s Thesis, University of Chinese Academy of Sciences (Shanghai Institute of Technical Physics, Chinese Academy of Sciences), Shanghai, China, 2018. (In Chinese). [Google Scholar]
- Jing, Y. Research on Satellite Cloud Image Prediction Algorithm Based on Generative Adversarial Network. Master’s Thesis, Shandong University of Science and Technology, Qingdao, China, 2020. (In Chinese). [Google Scholar]
- Cornebise, J.; Oršolić, I.; Kalaitzis, F. Open high-resolution satellite imagery: The worldstrat dataset–with application to super-resolution. Adv. Neural Inf. Process. Syst. 2022, 35, 25979–25991. [Google Scholar]
- Zhang, J.; Yang, Z.; Jia, Z.; Bai, C. Superresolution imaging with a deep multipath network for the reconstruction of satellite cloud images. Earth Space Sci. 2021, 8, e2020EA001559. [Google Scholar] [CrossRef]
- Ledig, C.; Theis, L.; Huszár, F.; Caballero, J.; Cunningham, A.; Acosta, A.; Aitken, A.; Tejani, A.; Totz, J.; Wang, Z.; et al. Photo-realistic single image super-resolution using a generative adversarial network. In Proceedings of the IEEE/CVF Conference on Computer Vision and Pattern Recognition (CVPR), Honolulu, HI, USA, 21–26 July 2017; pp. 4681–4690. [Google Scholar]
- Dai, J.; Qi, H.; Xiong, Y.; Li, Y.; Zhang, G.; Hu, H.; Wei, Y. Deformable Convolutional Networks. In Proceedings of the 2017 International Conference on Computer Vision (ICCV), Venice, Italy, 22–29 October 2017; IEEE: Piscataway, NJ, USA, 2017; Volume 89. [Google Scholar]
- Liao, Z.; Hu, K.; Meng, Y.; Shen, S. An advanced three stage lightweight model for underwater human detection. Sci. Rep. 2025, 15, 18137. [Google Scholar] [CrossRef] [PubMed]
- Xia, Z.; Pan, X.; Song, S.; Li, L.E.; Huang, G. Vision transformer with deformable attention. In Proceedings of the IEEE/CVF Conference on Computer Vision and Pattern Recognition, New Orleans, LA, USA, 18–24 June 2022; pp. 4794–4803. [Google Scholar]
- Mittal, A.; Soundararajan, R.; Bovik, A.C. Making a “completely blind” image quality analyzer. IEEE Signal Process. Lett. 2012, 20, 209–212. [Google Scholar] [CrossRef]
- Kim, J.; Lee, J.K.; Lee, K.M. Accurate image super-resolution using very deep convolutional networks. In Proceedings of the IEEE/CVF Conference on Computer Vision and Pattern Recognition (CVPR), Las Vegas, NV, USA, 27–30 June 2016; pp. 1646–1654. [Google Scholar]
- Wang, X.; Yu, K.; Wu, S.; Gu, J.; Liu, Y.; Dong, C.; Qiao, Y.; Loy, C.C. Esgan: Enhanced super-resolution generative adversarial networks. In Proceedings of the European Conference on Computer Vision Workshops (ECCVW), Munich, Germany, 8–14 September 2018. [Google Scholar]
- Umer, R.M.; Foresti, G.L.; Micheloni, C. Deep generative adversarial residual convolutional networks for real-world super-resolution. In Proceedings of the IEEE/CVF Conference on Computer Vision and Pattern Recognition Workshops (CVPRW), Seattle, WA, USA, 14–19 June 2020; pp. 438–439. [Google Scholar]
- Zhang, K.; Liang, J.; Van Gool, L.; Timofte, R. Designing a practical degradation model for deep blind image super-resolution. In Proceedings of the IEEE/CVF International Conference on Computer Vision (ICCV), Montreal, QC, Canada, 11–17 October 2021; pp. 4791–4800. [Google Scholar]
- Wang, X.; Xie, L.; Dong, C.; Shan, Y. Real-esrgan: Training real-world blind super-resolution with pure synthetic data. In Proceedings of the IEEE/CVF International Conference on Computer Vision (ICCV), Montreal, QC, Canada, 11–17 October 2021; pp. 1905–1914. [Google Scholar]


Disclaimer/Publisher’s Note: The statements, opinions and data contained in all publications are solely those of the individual author(s) and contributor(s) and not of MDPI and/or the editor(s). MDPI and/or the editor(s) disclaim responsibility for any injury to people or property resulting from any ideas, methods, instructions or products referred to in the content. |
© 2025 by the authors. Licensee MDPI, Basel, Switzerland. This article is an open access article distributed under the terms and conditions of the Creative Commons Attribution (CC BY) license (https://creativecommons.org/licenses/by/4.0/).