Article

InSAR Coherence Linked to Soil Moisture, Water Level and Precipitation on a Blanket Peatland in Scotland

1
Nottingham Geospatial Institute, University of Nottingham, 30 Triumph Road, Nottingham NG7 2TU, UK
2
School of Geography, University of Nottingham, Nottingham NG7 2RD, UK
3
Environmental Research Institute, University of the Highlands and Islands, Castle Street, Thurso KW14 7JD, UK
4
Department of Chemical and Environmental Engineering, Faculty of Engineering, University of Nottingham, Nottingham NG7 2RD, UK
*
Author to whom correspondence should be addressed.
Remote Sens. 2025, 17(21), 3507; https://doi.org/10.3390/rs17213507
Submission received: 22 July 2025 / Revised: 10 October 2025 / Accepted: 15 October 2025 / Published: 22 October 2025
(This article belongs to the Special Issue Remote Sensing for the Study of the Changes in Wetlands)

Highlights

What are the main findings?
  • Sentinel-1 InSAR coherence is strongly and seasonally related to peatland soil moisture, with the highest linear relationships in spring and summer, and strongest at intact bogs.
  • Water level–InSAR coherence relationships are weaker and often out-of-phase, while precipitation timing is strongly cross-correlated with InSAR coherence but not linearly related.
What are the implications of the main findings?
  • InSAR coherence provides a useful remotely sensed indicator of peatland soil moisture and hydrological seasonality, especially when between peatlands of different condition.
  • Combining InSAR coherence with ground data can enhance peatland monitoring and support restoration assessment in blanket bog ecosystems.

Abstract

Hydrological changes in peatland are directly related to peat condition. Restoration projects typically aim to raise the water table to enhance peat development, support ecology and increase carbon storage. Remote monitoring of peatland hydrology is challenging but advantageous for assessing condition and restoration effectiveness. This study explores how temporal Sentinel-1-derived InSAR coherence relates to ground-based measurements of soil moisture, water level and local precipitation at two sites, near-natural (Munsary) and degraded (Knockfin Heights), in the Flow Country, Scotland, alongside regional Wick weather station precipitation data (2015–2024). Stronger seasonal linear relationships were observed between soil moisture and InSAR coherence in spring/summer (R2 reaching 0.83 at Munsary subsite C, p < 0.001), with in-phase cross correlation throughout the year. In contrast, the relationship between water level and InSAR coherence was more complex with an out-of-phase relationship for much of the year and a weaker linear correlation. These relationships varied with peatland condition, strongest at the more intact bog (Munsary). InSAR coherence and precipitation were in-phase, but not linearly correlated, and land use/cover had no significant effect. Outcomes suggest that InSAR coherence could, when combined with other data, assist in mapping soil moisture/water level dynamics in blanket peatlands, and identify the timing of precipitation events in areas with non-frontal rainfall.

1. Introduction

Raising the water table is a key part of peatland restoration, reducing the risk of peat releasing carbon due to degradation and climate change [1]. A higher water table reduces the rate of decay in the presence of oxygen and aids the development of conditions for peat-forming species to thrive, enabling peat accumulation [2,3]. As a result, traditional peatland monitoring includes in-situ measurements of groundwater levels and soil moisture to attain temporal hydrological changes, especially post-restoration, but these measurements are spatially limited. Changes in soil moisture and groundwater impact ecology [4,5], as such it is important to measure changes in hydrology so that responses to degradation can occur more quickly. Remote sensing, particularly Synthetic Aperture Radar (SAR), offers wider coverage and can operate at night and through cloud [6,7,8], with some canopy penetration [8,9]. SAR backscatter has been used as a proxy for soil moisture, but results are inconsistent due to vegetation, land use and water table depth [10,11]. Misclassification of water and vegetation also limits its usability [9,12,13], indicating that backscatter alone is not sufficient to determine the soil moisture levels in peatlands. Interferometric SAR (InSAR)—a measure of phase similarity between repeated SAR acquisitions—have the potential to detect changes in soil moisture when wide-swath, high-resolution data are used, owing to sufficient coherence and strong backscatter intensity [14,15]. Surface water has a high dielectric constant and is a specular reflector [16], enabling its use to assess soil moisture change. Volume scattering enables the potential monitoring of Land Use Land Cover (LULC) changes [14], which could therefore affect the relationships shown between other variables, such as precipitation and InSAR coherence across a landscape.
This study assesses the relationship between InSAR coherence and soil moisture/groundwater in the Flow Country, a blanket peatland in Scotland. As LULC has potential to affect the InSAR signal, which could skew its relationship with precipitation, and therefore other attributes, across peatland environments, the relationship between InSAR coherence and precipitation is also explored.

1.1. InSAR Coherence

Sentinel-1 transmits a C-band radar signal (5.405 GHz) to the Earth’s surface, with the returned energy recorded as SAR backscatter. From this, a Single Look Complex (SLC) image is created, containing information on the propagation time of the radar waves, geometry of the acquisition and dielectric properties of the ground surface [17]. InSAR derives surface change from the phase difference between at least two co-registered SAR images [18]. Valid interferometric pairs require identical mode, polarisation and incidence angle [19]. Applied to peatlands, InSAR has revealed “bog breathing” by detecting height changes between acquisitions [20,21,22,23].
InSAR coherence measures phase correlation (decorrelation) between SAR images, expressed as complex numbers with in-phase and quadrature components. Values near one indicate strong correlation, while decorrelation (approaching zero) is typically caused by landscape changes, especially changes in hydrology (soil moisture and possibly water level) and ecology (vegetation growth and decline) [13,24,25,26,27]. Additional decorrelation arises from changes in peatland geometry (due to erosion and Peat Surface Motion (PSM)) and residue thermal noise post-correction [28].
Sentinel-1 data are processed with the Sentinel-1 Toolbox (noise removal, calibration, terrain correction) to generate products suitable for coherence analysis. C-band radar has been shown to correlate well with soil moisture in lab conditions [29], but the penetration of the radar through vegetation canopies and soils is limited to the top layers [30].
Coherence analysis has been applied across diverse contexts, including peatland soil moisture monitoring [17,31,32], wetland monitoring and flood mapping [13,15,24,33,34,35,36], forest studies [26], agricultural soil moisture [18,37] and peatland land use classification [19]. It has also been combined with SAR backscatter data to improve wetland classification [38,39]. Ramsey et al. [40] found that coherence discriminated land cover types more effectively than SAR intensity, particularly during leaf-off seasons. The rate of coherence change depends on the extent to which soil moisture levels change, with larger relative changes resulting in a decorrelation effect [41,42,43,44]. These changes are relative to the location and the effect of other decorrelation events, such as rapid vegetation growth.

1.2. InSAR and Hydrology

Limited studies have been undertaken linking interferometric coherence with soil moisture in peatland environments, with Tampuu et al. [32] and Hrysiewica et al. [17] analysing this relationship in temperate raised bogs in Estonia and Ireland respectively. As the acrotelm of raised and blanket bogs is typically between 5 and 50 cm and, if healthy, the vegetation cause more stable backscattering than other vegetation types, including grasslands [17,19]. However, coherence declines as the water table falls during seasonal dry periods [32]. Tampuu et al. [32] found that in July, the mean coherence of the open bog was at its lowest (relative to May 2018) and water table depth was lowest then as well. However, a linear regression model could be meaningful, with an R2 value of only 0.333 (p = 0.081), if direction of the water table is deemed unimportant. They demonstrated that long-term coherence trends follow water table dynamics. Hrysiewica et al. [17] found that during periods of drought, coherence loss was particularly pronounced. It can be expected that vegetated pool areas respond more quickly to drought than bare areas, with drought conditions also causing rapid peat motion [23]. The maximum value of the coherence range was negatively correlated with soil moisture change and the coherence was related to the temporal baseline of the SAR image pairs [17]. Additionally, coherence is highest for a short temporal baseline and decreases with increased temporal baseline for a given soil moisture change [17].
InSAR coherence analysis could be applied to a blanket bog, although there are challenges to consider. These include the different sizes, vegetation and hydrological dynamics of blanket bogs compared to raised bogs, the condition of the bog and whether it is undergoing restoration [17]. Although the link between interferometric coherence and soil moisture should be transferable to other bogs, dielectric constants may differ slightly affecting the outcome, requiring them to be considered [17].
The aims of this study are, first, to determine whether there is a relationship between InSAR coherence and aspects of peatland hydrology that can be managed (soil moisture and groundwater level) in the Flow Country. Comparisons will be made between an area classed as near-natural (Munsary) and eroded (Knockfin-Heights). Second, to assess the more contextual relationship between InSAR coherence and precipitation, and whether LULC in a peatland with a frontal weather system (the Flow Country) affects the relationship between InSAR coherence and precipitation. Precipitation is a key cause of soil moisture change and as precipitation is reasonably similar across the Flow Country (frontal system), this allows comparisons to be made between outcomes to see the impact of LULC on scattering.

2. Materialsand Methods

2.1. Data Acquisition

2.1.1. InSAR Coherence Data

The Python (version 3.12) plugin HyP3 (7.7.1) was used to process and access Sentinel-1 InSAR coherence data using the Alaskan Satellite Facility (ASF) with a reference image date of 2 April 2018. The temporal resolution was 6/12 days depending on whether Sentinel-1B was active. Spring was chosen as the reference date because this is when changes in hydrology occur, with spring and summer typically drier than autumn and winter. The year 2018 was chosen as the reference year as the initial ground data accessed for analysis covered the period September 2017–November 2018; longer-term water level data for Munsary also included spring 2018. The parameters used to access and preprocess the data at the ASF are summarised in Table 1. The ASF was chosen over other platforms because the Python library was easy to install and use, in addition to being open access with no associated costs. Furthermore, the ASF conducted all essential preprocessing, meaning once the parameters had been determined and data downloaded from the ASF, only study-specific preprocessing was required, reducing the local impact on processing and storage requirements.
The coherence data are outputted by the ASF as a GeoTIFF with values between 0 and 1, where higher values demonstrate higher coherence (the magnitude of the correlation between two SAR images). A high correlation results from high accuracy of the phase information/visibility of interferometric fringes [45]. Any pixels without common overlap between images to generate interferometric fringes are filtered out prior to InSAR generation.
Temporal decorrelation is typically caused by landscape changes, especially changes in hydrology (soil moisture and possibly water level) and ecology (vegetation growth and decline). InSAR coherence is thus defined [24,25,26]:
γ = S 1 S 2 * | S 1 | 2 | S 2 | 2
where the straight brackets indicate the modulus of the complex backscatter coefficients and the angle brackets indicate an ensemble-average (the average over a window with a sizeable number of pixels). The * denotes the complex conjugate. The phase of γ is the measure of the difference in distance to the target between the two acquisitions, while the modulus, |γ|, indicates the stability of the phase, ranging from 0.0 (completely random/no coherence) to 1.0 (the phase is identical over the entire ensemble/perfect coherence) [13,24].

2.1.2. Shorter-Term Munsary and Knockfin Heights Ground Data

Ground data from the Flow Country was used in this study. This is a blanket bog covering over 4000 km2 [46], which is a key carbon store, but due to draining and forestry has been subject to degradation, and more recently restoration. These data were collected between September 2017 and November 2018 [23]. Munsary is classed as a near-natural lowland bog with a high water table, whereas Knockfin Heights contains a range of eroded features and is an upland blanket bog (Figure 1) [23]. Details of the site ecohydrology are given in Marshall et al. [23]. The data collected includes soil moisture (mg/g water), water level (m below the peat surface), precipitation (mm) and temperature (°C). These were analysed in Python in relation with the InSAR coherence.
Measurements were collected every 30 min, with water level calculated relative to the peat surface and calibrated every three months to allow for changes in peat growth [47]. Precipitation data were collected at one subsite per site (Munsary subsite E/F and Knockfin Heights subsite C). Measurements were collected using the HOBO U20L-04 Water Level Data logger (0–4 m), HOBO EC-5 Soil Moisture Smart Sensor, HOBO H21 USB Micro Station Weather/Energy Data Logger (soil temperature) and HOBOnet Rainfall (metric) Sensor. The soil moisture and temperature loggers were inserted 5 cm below the surface of the peat and connected to a data logger from which the data were downloaded. Set up and calibration followed the manufacturer’s instructions [48]. Manual values were collected at every download (monthly) for the water level transducers. Processing was undertaken using HOBOWARE Software (version 3.7.0 and above).

2.1.3. Longer-Term Munsary Ground Data

These data included water level (converted to mm to use the same units as the shorter-term data) and soil temperature (°C). Timings varied between the sites, ranging from 11 April 2013 to 14 April 2022 (subsites 1 and 2), 11 April 2013 to 11 January 2020 (subsite 3) and 11 April 2013 to 31 December 2018 (subsite 4) depending on the lifespan of the equipment. Site one is a hollow (dominated by Sphagnum cuspidatum and Eriophorum angustifolium), whereas the other sites are all low ridges (with other Sphagnum species, sedges and Calluna vulgaris) (Figure 2).
The water level data were collected using OTT Orpheus Mini Water Level Loggers with calibration occurring alongside data collection. Set up and calibration followed the manufacturer’s instructions [49] with manual values collected at every download, every  3–6 month. Soil moisture was not measured at these subsites and longer-term data were only collected at Munsary and can be requested at roxane.andersen@uhi.ac.uk.

2.1.4. Wick Weather Data

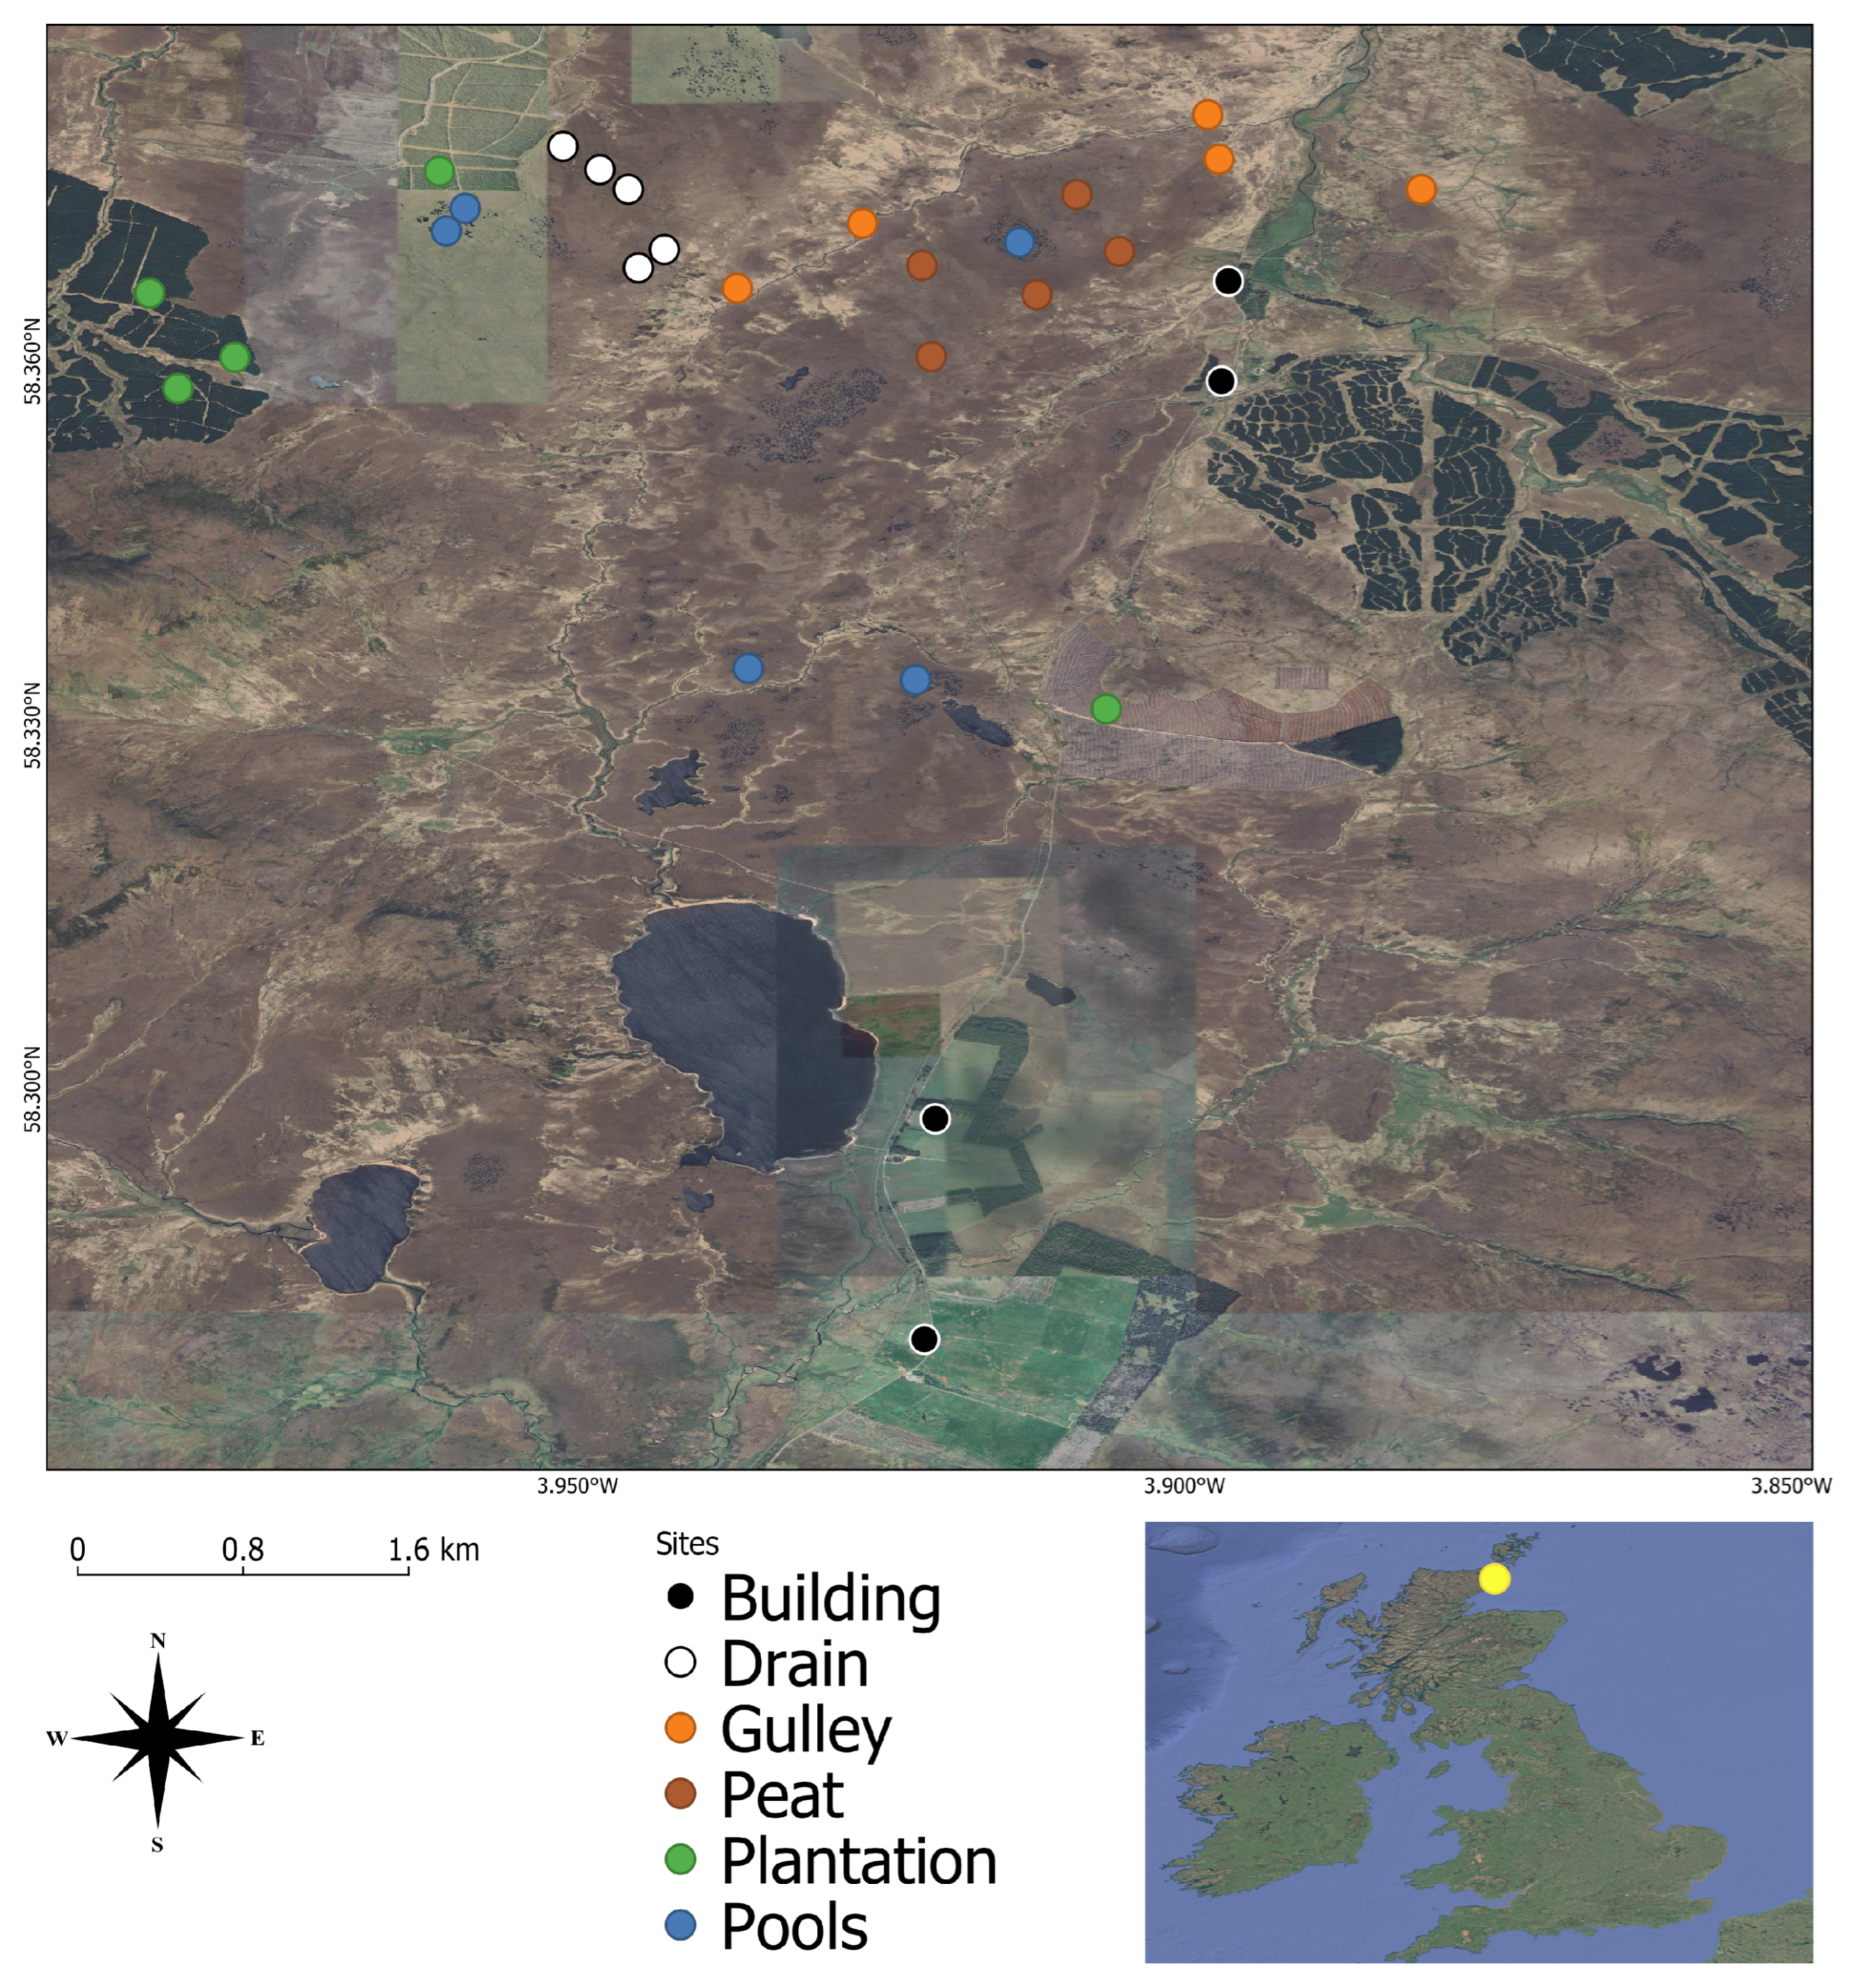
As local data precipitation and temperature data were collected at the shorter-term ground data sites, Wick weather station data were downloaded from 2015 to 2024 [50] to assess whether a relationship existed between general precipitation and InSAR coherence data at the ground data sites and across a variety of LULCs. Then, if there was a relationship, whether the strength varied depending on the LULC overlying the peat. This analysis was undertaken in the Flow Country for a range of land covers (Figure 3) as the weather system is frontal, meaning precipitation is reasonably similar across the Flow Country. Wick weather data have been used as a proxy for precipitation when local data have been unavailable in previous studies (e.g., [22]). However, precipitation does vary regionally (Figure 4), meaning where possible, local data should be utilised and where data are removed based on the presence of frozen ground, temperate change with altitude should be considered.

2.2. Data Processing

Rolling windows were applied over one-month, six-week and two-month time frames to the satellite data (coherence), and ground data (soil moisture, water level and precipitation), reducing the impact of noise and demonstrating overarching trends across the data. The original data demonstrated the rapid changes in water table in response to precipitation events, with one-month rolling window data reflecting short-term responses to changes. One-month was used to balance fluctuation smoothing with event sensitivity. A two-month rolling window was used to reflect seasonal relationships between variables and six-weeks acted as an intermediary between the one- and two-month. These were analysed in relation to each other by assessing the linear relationship and correlation (R2 and Pearson) and the temporal in-phase relationship (cross correlation).
Bechtold et al. [51], Asmuss et al. [52] and Toca et al. [53] determined that radar analysis improved when removing data based on weather factors during the acquisition of Sentinel-1 data. These are when the day’s rain exceeded 20 mm [51] as rainfall events can disturb microwave observations [54], when temperatures were below 2 °C resulting in frozen soil [51,52,53], when it had rained within the six-hour period prior to acquisition [52,53] and when there was snow cover [53]. Asmuss et al. tested soil temperature and time since last precipitation thresholds to determine the impact on the production of outliers [52]. Precipitation just before the overpass of Sentinel-1 causes higher backscatter values as the surface of the peat is temporarily wetter, which is unrelated to the current position of the water table, with their analysis determining that a six-hour period without precipitation was optimal to filter outliers that affected the correlation coefficients [52]. Therefore, data were filtered using the above methods separately and in combination, in addition to analysing the complete dataset. The significant difference between the Pearson outcomes for the sites, data-removal techniques and soil moisture/water level was assessed to determine the usefulness of the InSAR coherence in monitoring peatland hydrology.
As initial outcomes (over the period of one year) suggested strong relationships between hydrology and InSAR coherence, especially soil moisture in the warmer months, ground data covering longer time frames were sought to determine whether this relationship was influenced by other factors. As a result, longer-term Munsary data were analysed, focusing on InSAR Coherence and water level (no soil moisture data available), and assessing overall, seasonal and monthly relationships.
Due to the non-linear relationship of much of these data, cross-correlations were applied to determine whether the timings of peaks and troughs were related even if the magnitude was not. A value of +1 describes perfect in-phase and −1 anti-phase correlation between two datasets [55].

3. Results

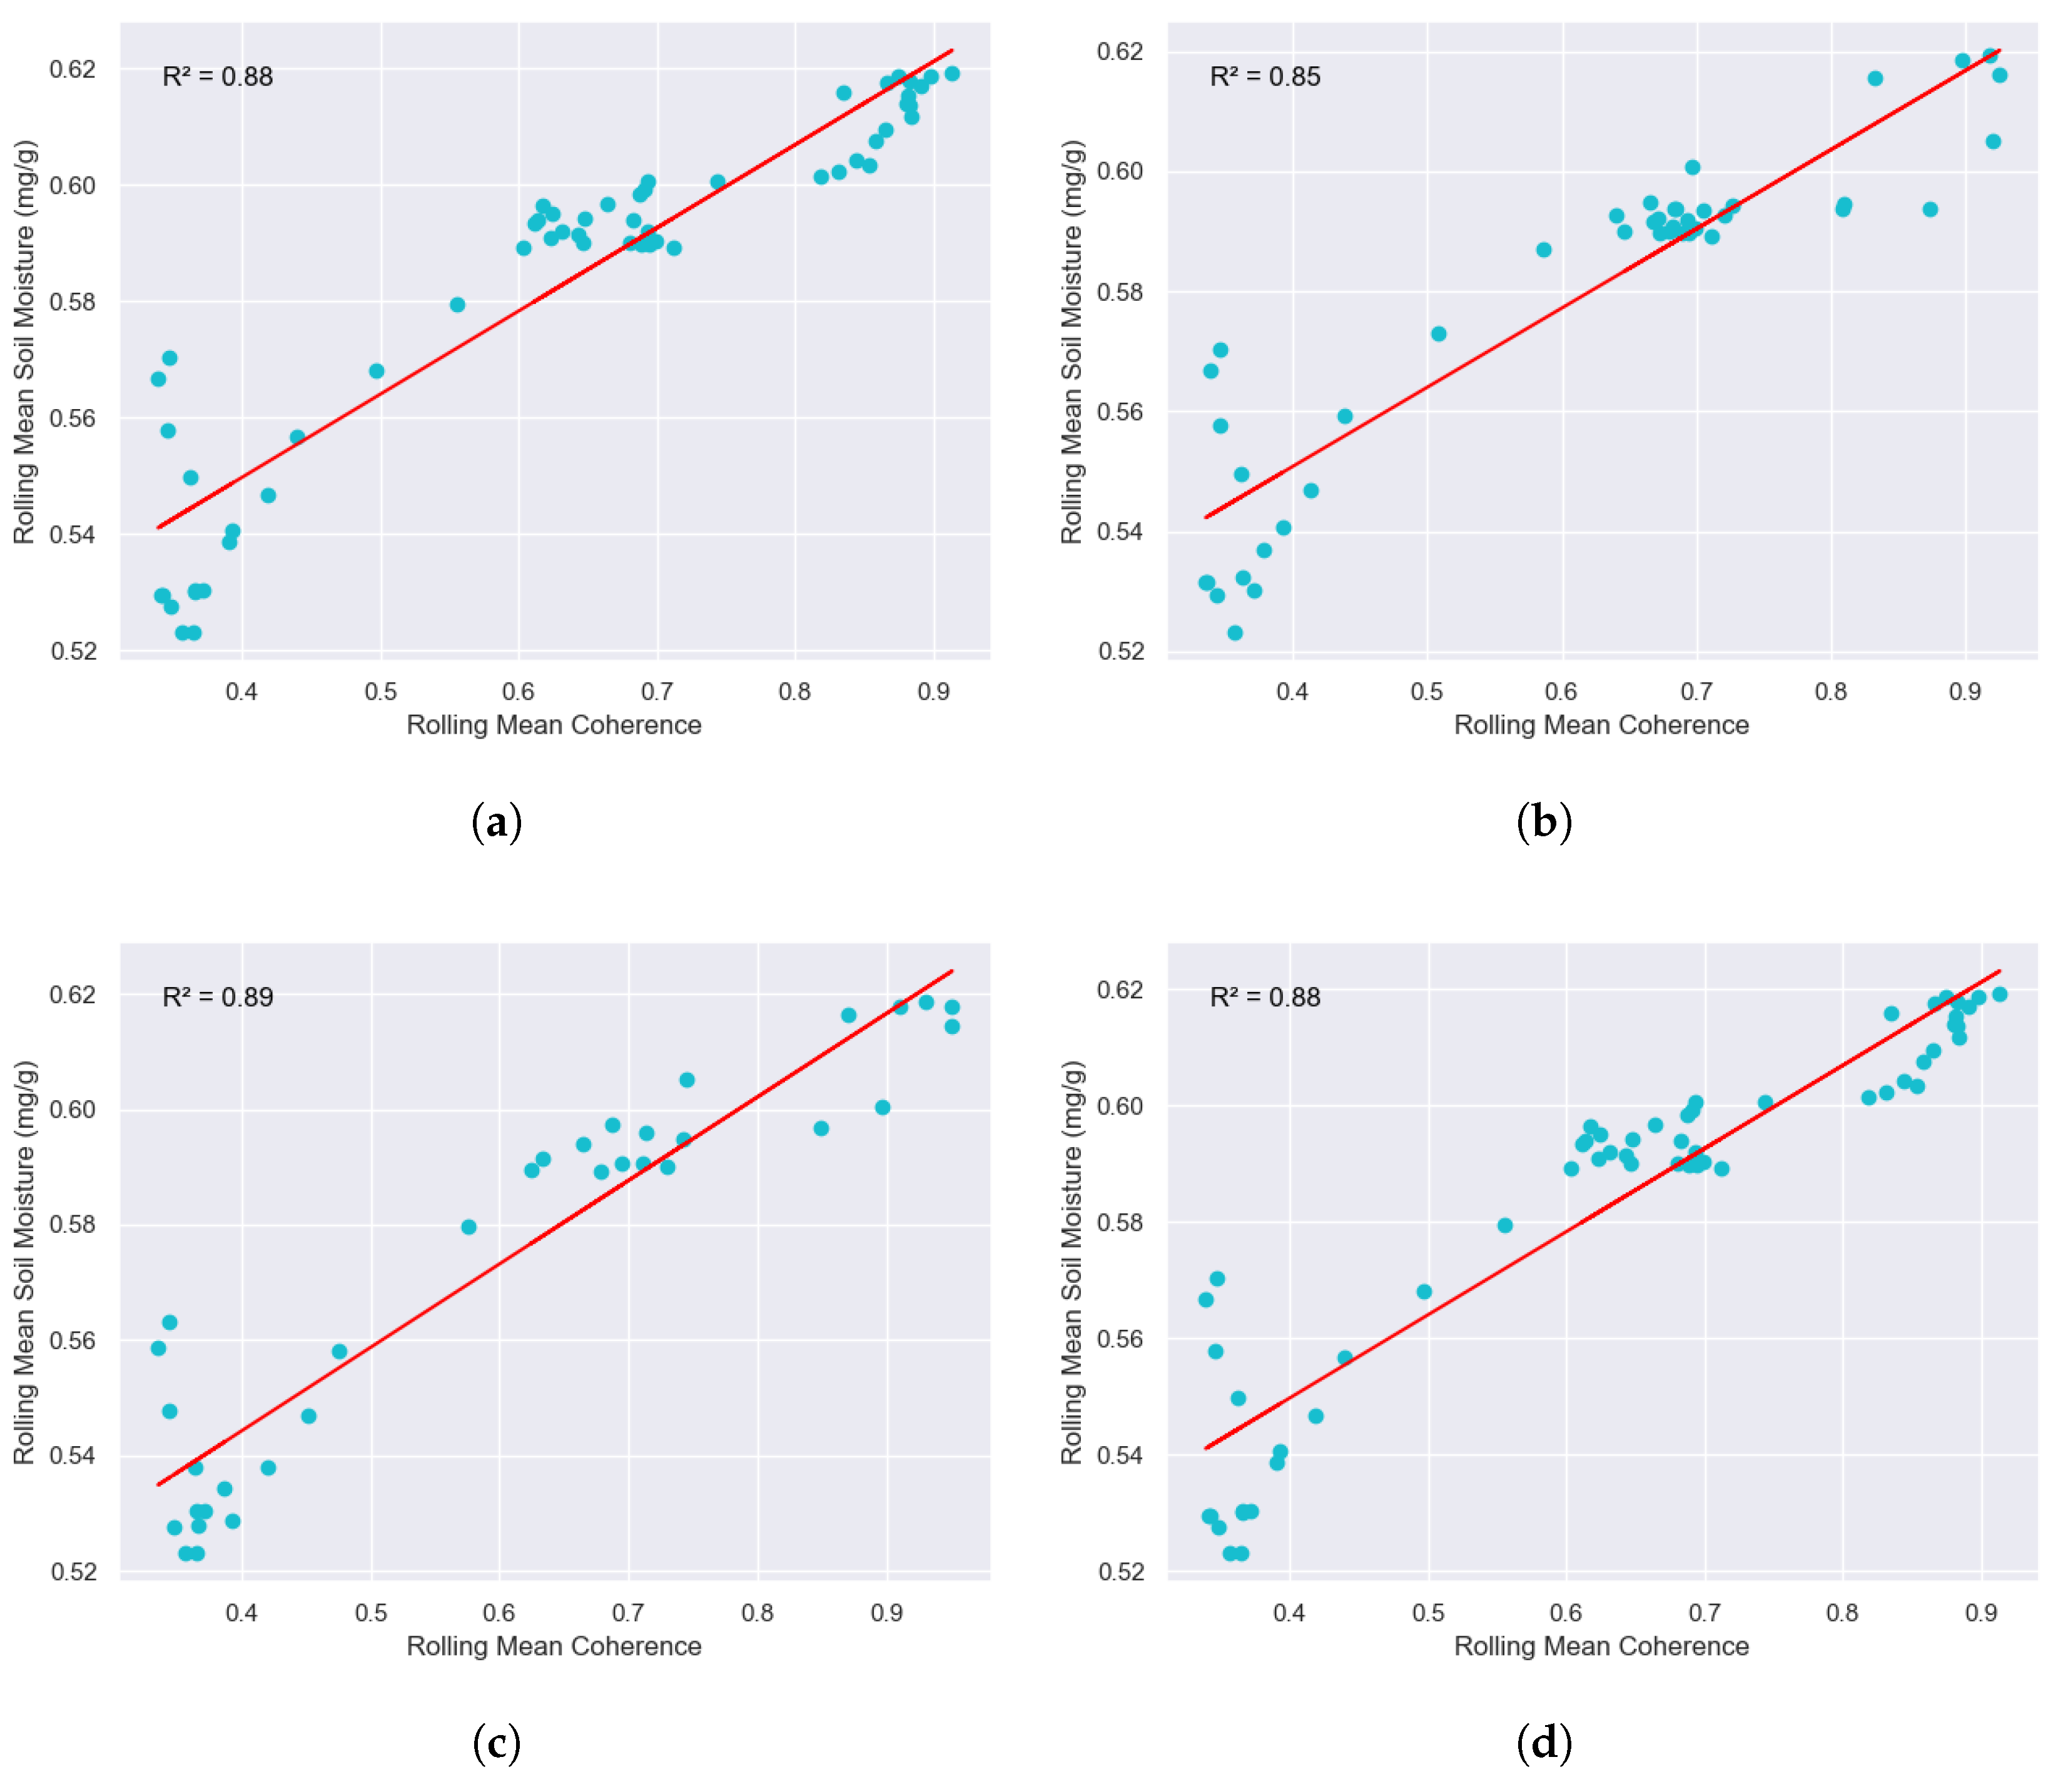
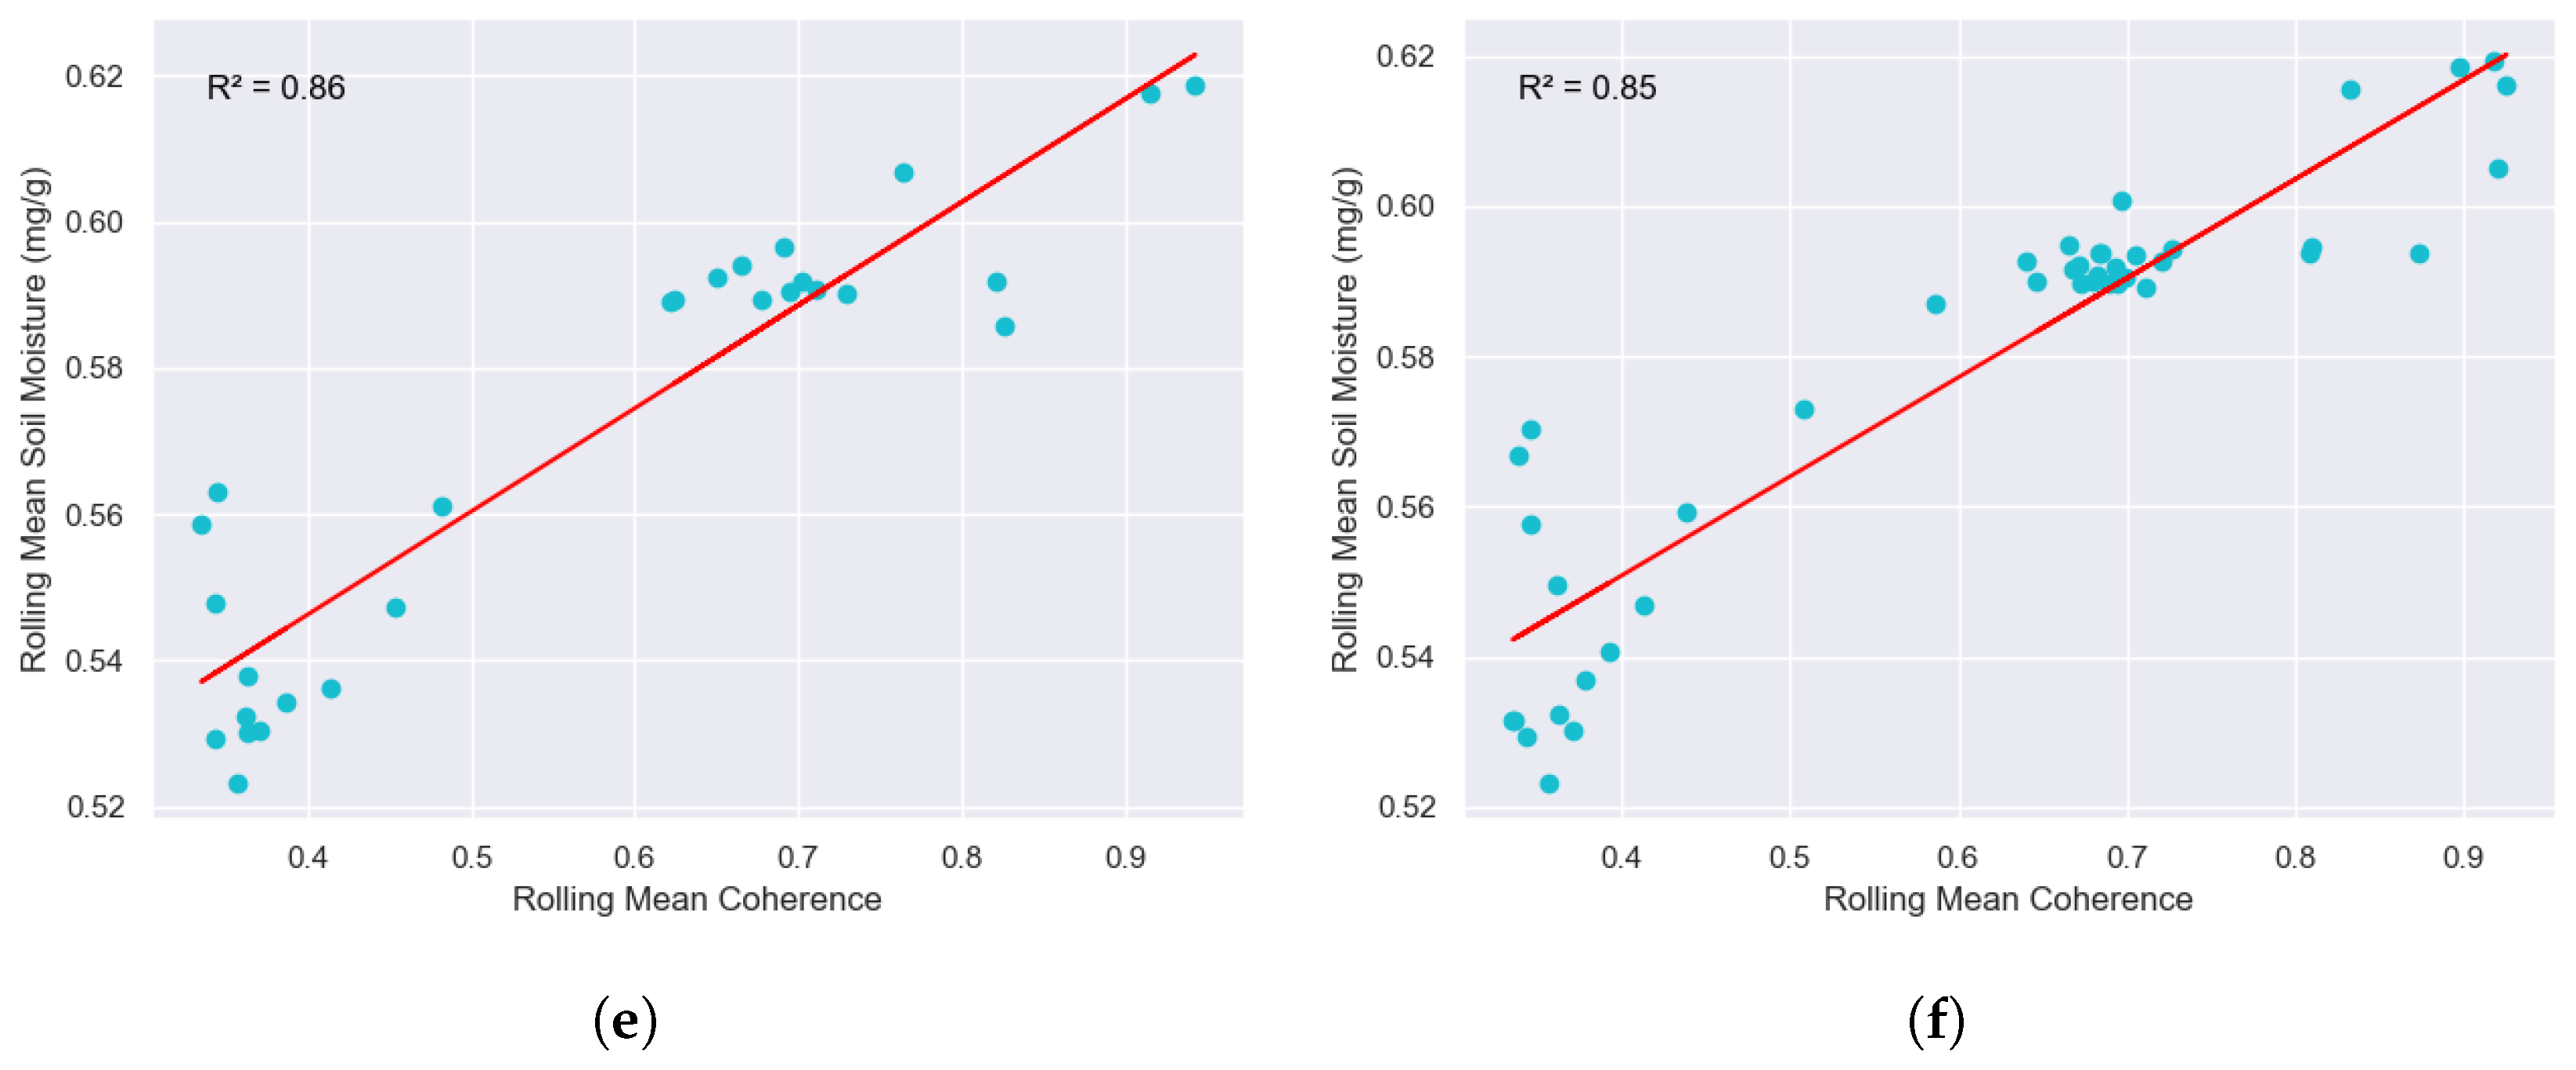
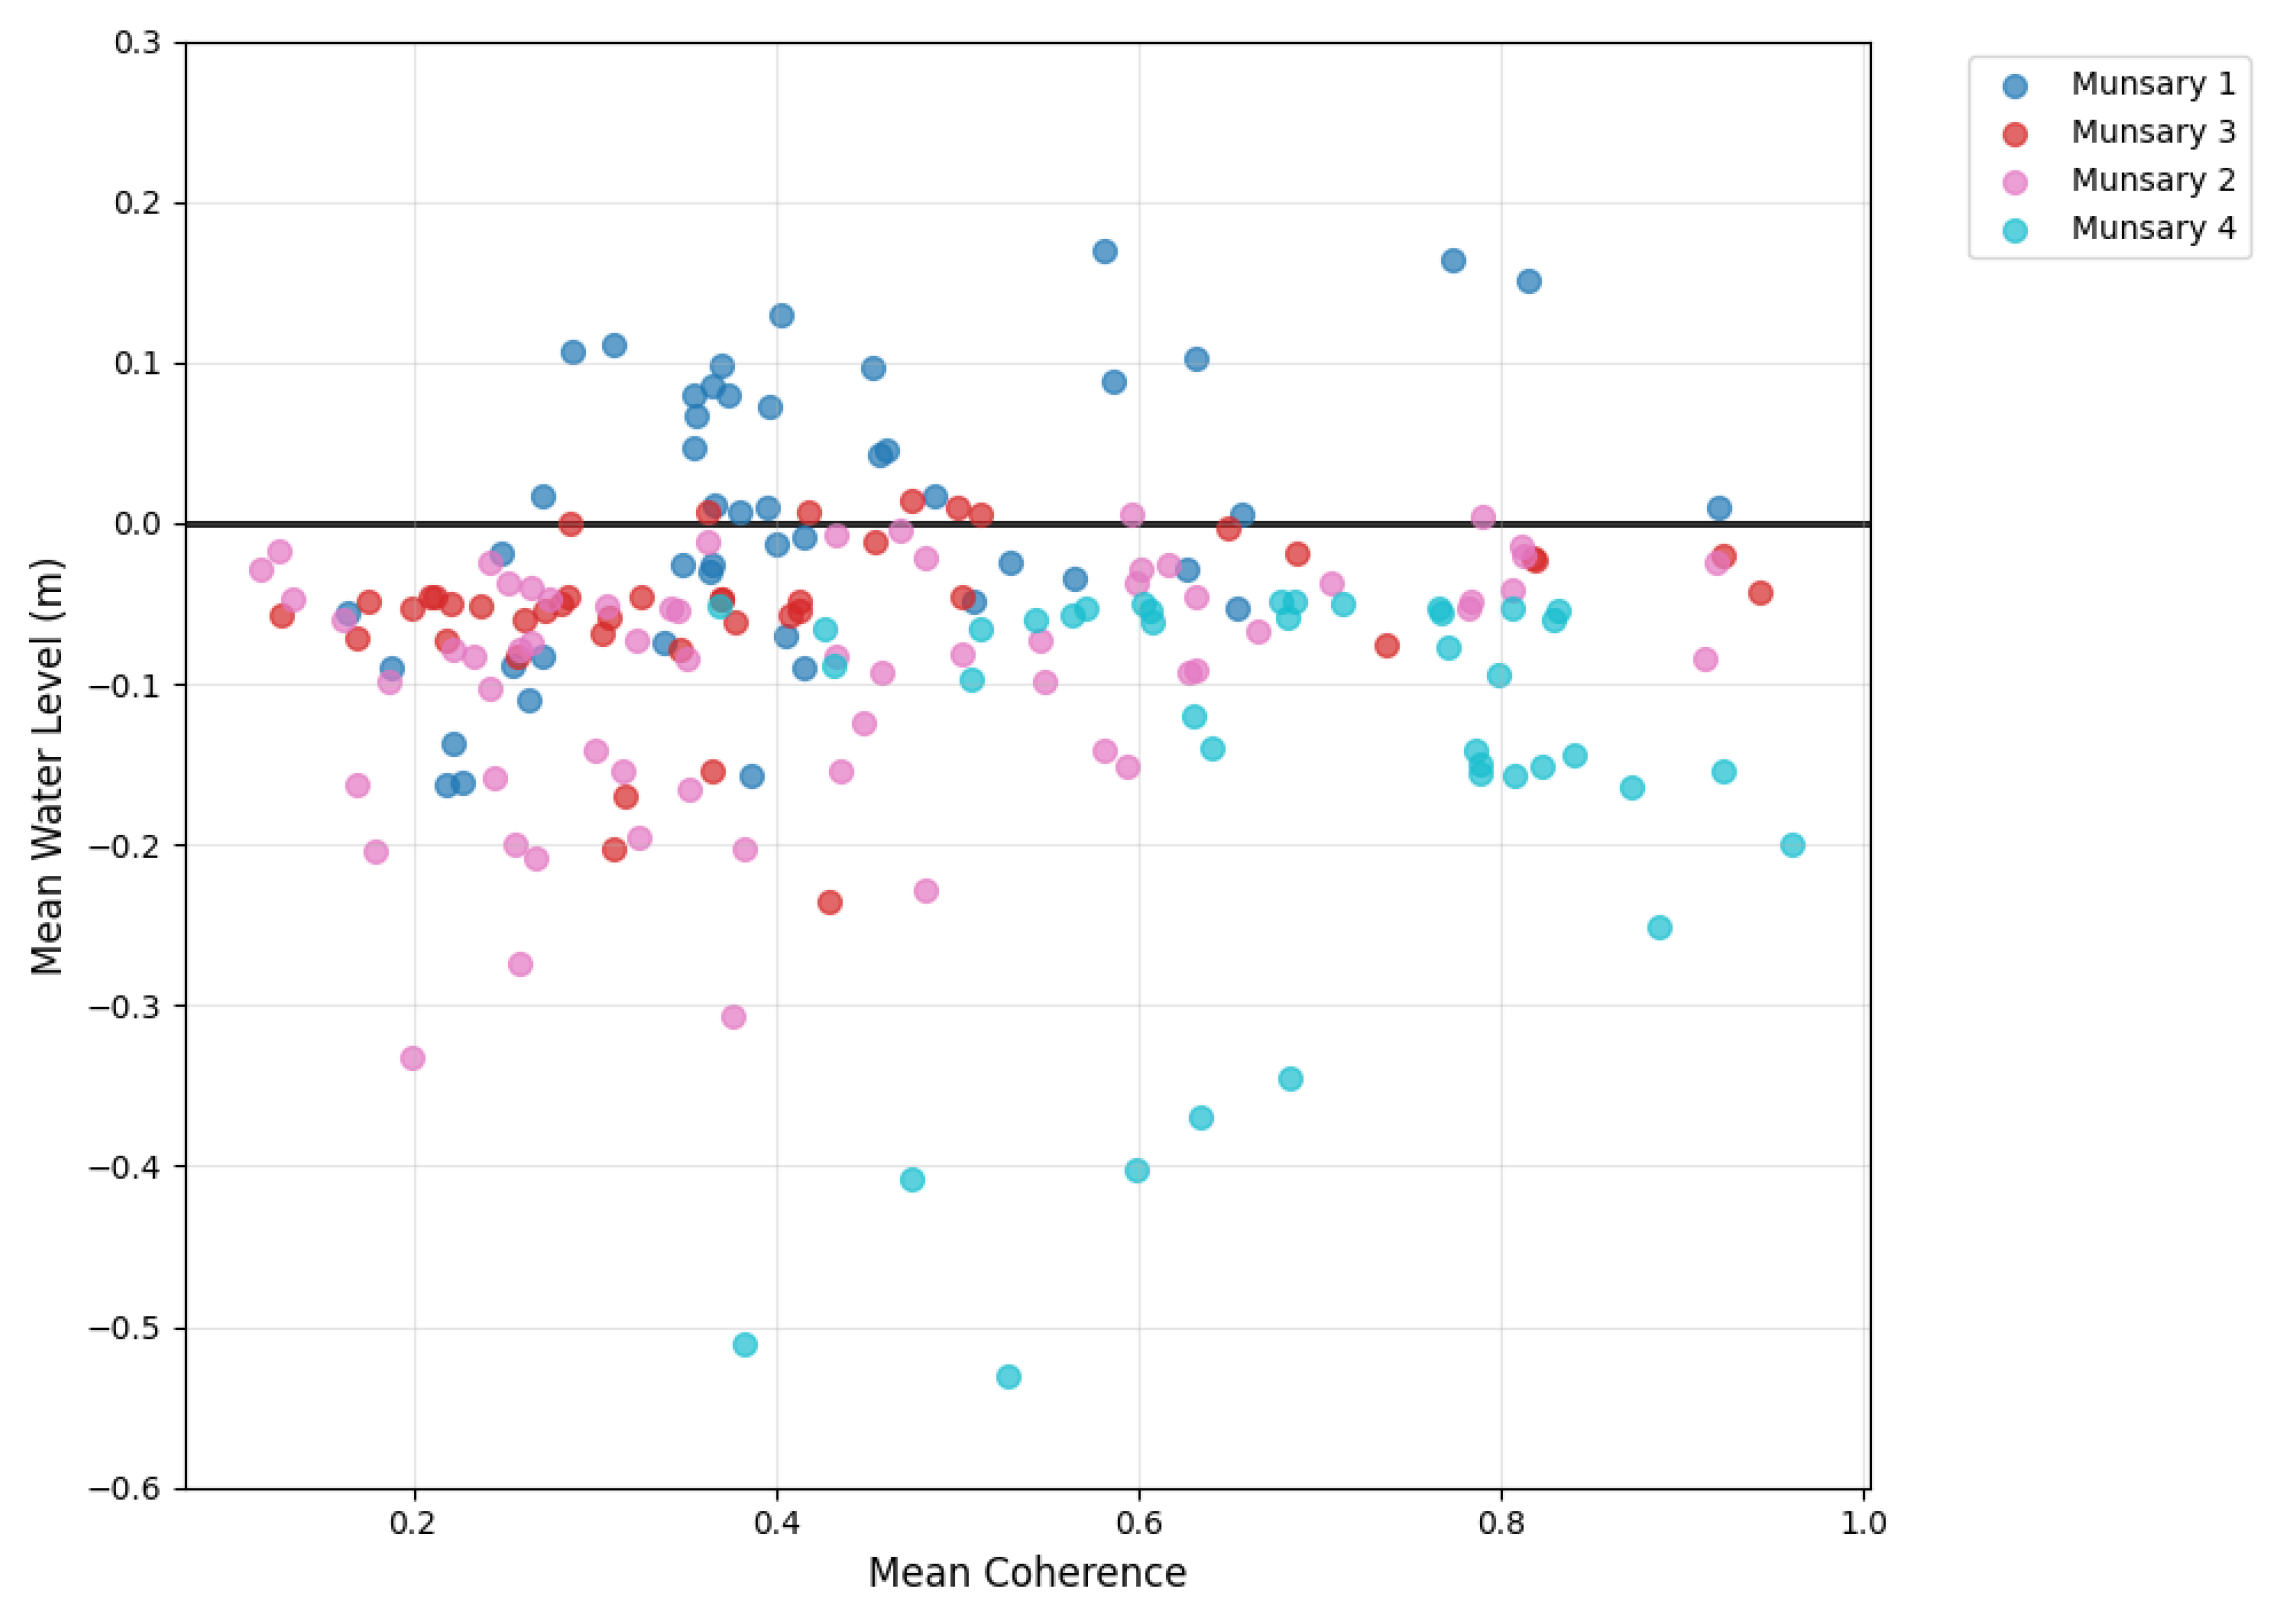
Locally, the relationship between InSAR coherence and soil moisture/water level was improved by removing data, especially when data had been collected within six hours of rainfall (precipitation time), with the two-month rolling mean yielding the best outputs (Table 2). These relationships were stronger at the near-natural site (Munsary) than the degraded site (Knockfin Heights). At Munsary, a consistent relationship was observed between coherence and water level, though correlations were only moderate when precipitation timing was included—and otherwise low. These patterns are supported by R2 values and scatter plots (Figure 5).
There are significant differences in the correlations between the data preprocessed based on the timing of precipitation and no data removal during preprocessing, demonstrating that this affects the quality of the InSAR coherence data and how it can relate to soil moisture in particular (Table 3). Similarly, there is a significant difference between Munsary and Knockfin Heights regarding soil moisture and within sites for both soil moisture and water level.

3.1. Soil Moisture and InSAR Coherence

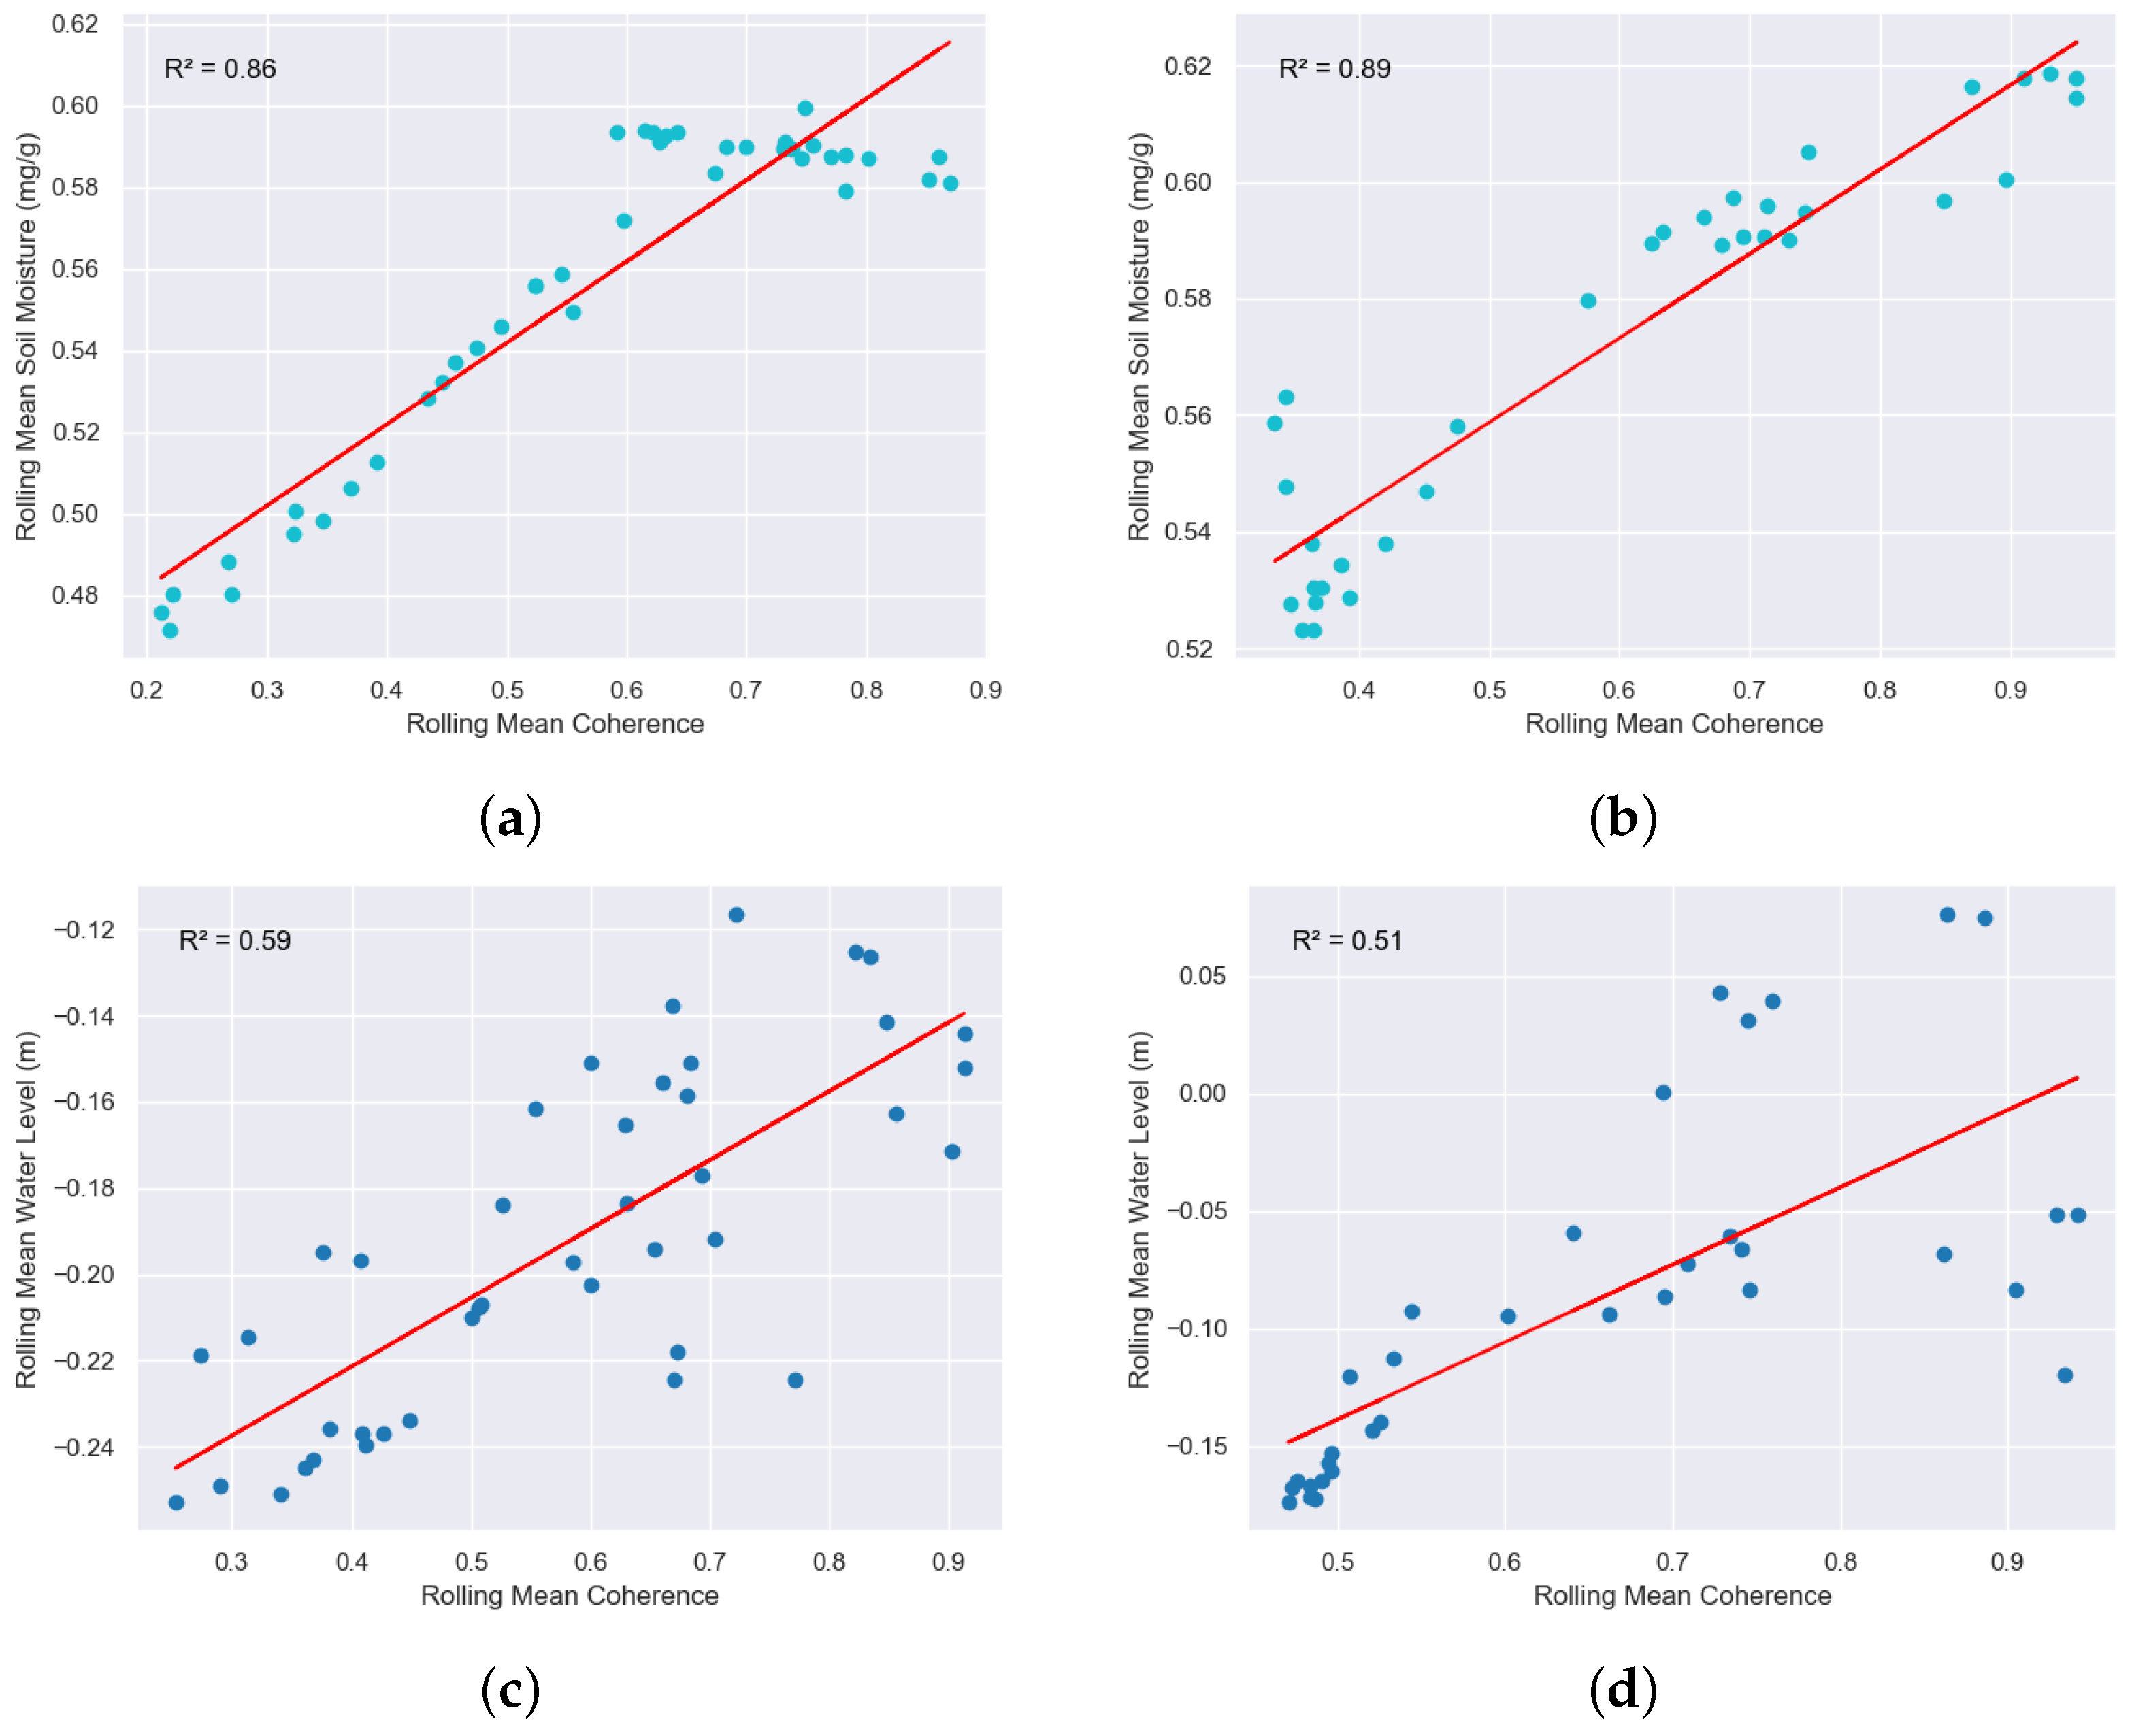
Soil moisture and InSAR coherence show a seasonal relationship in spring and summer, with a stronger linear relationship in the more intact blanket bog (Figure 6 and Figure 7). Pearson correlation always performs better at Munsary than Knockfin Heights with typically smaller standard deviations, with the strongest correlations where data were reduced based on the timing of precipitation (Table 2). The cross correlation is highest for soil moisture and InSAR coherence (Table 4, Figure 8c), with the mean cross correlation higher at Munsary than Knockfin Heights, but typically with greater standard deviations. The cross correlations reflect that as soil moisture and precipitation increase, so does InSAR coherence with timings of peaks and troughs matching (Figure 8a,c).
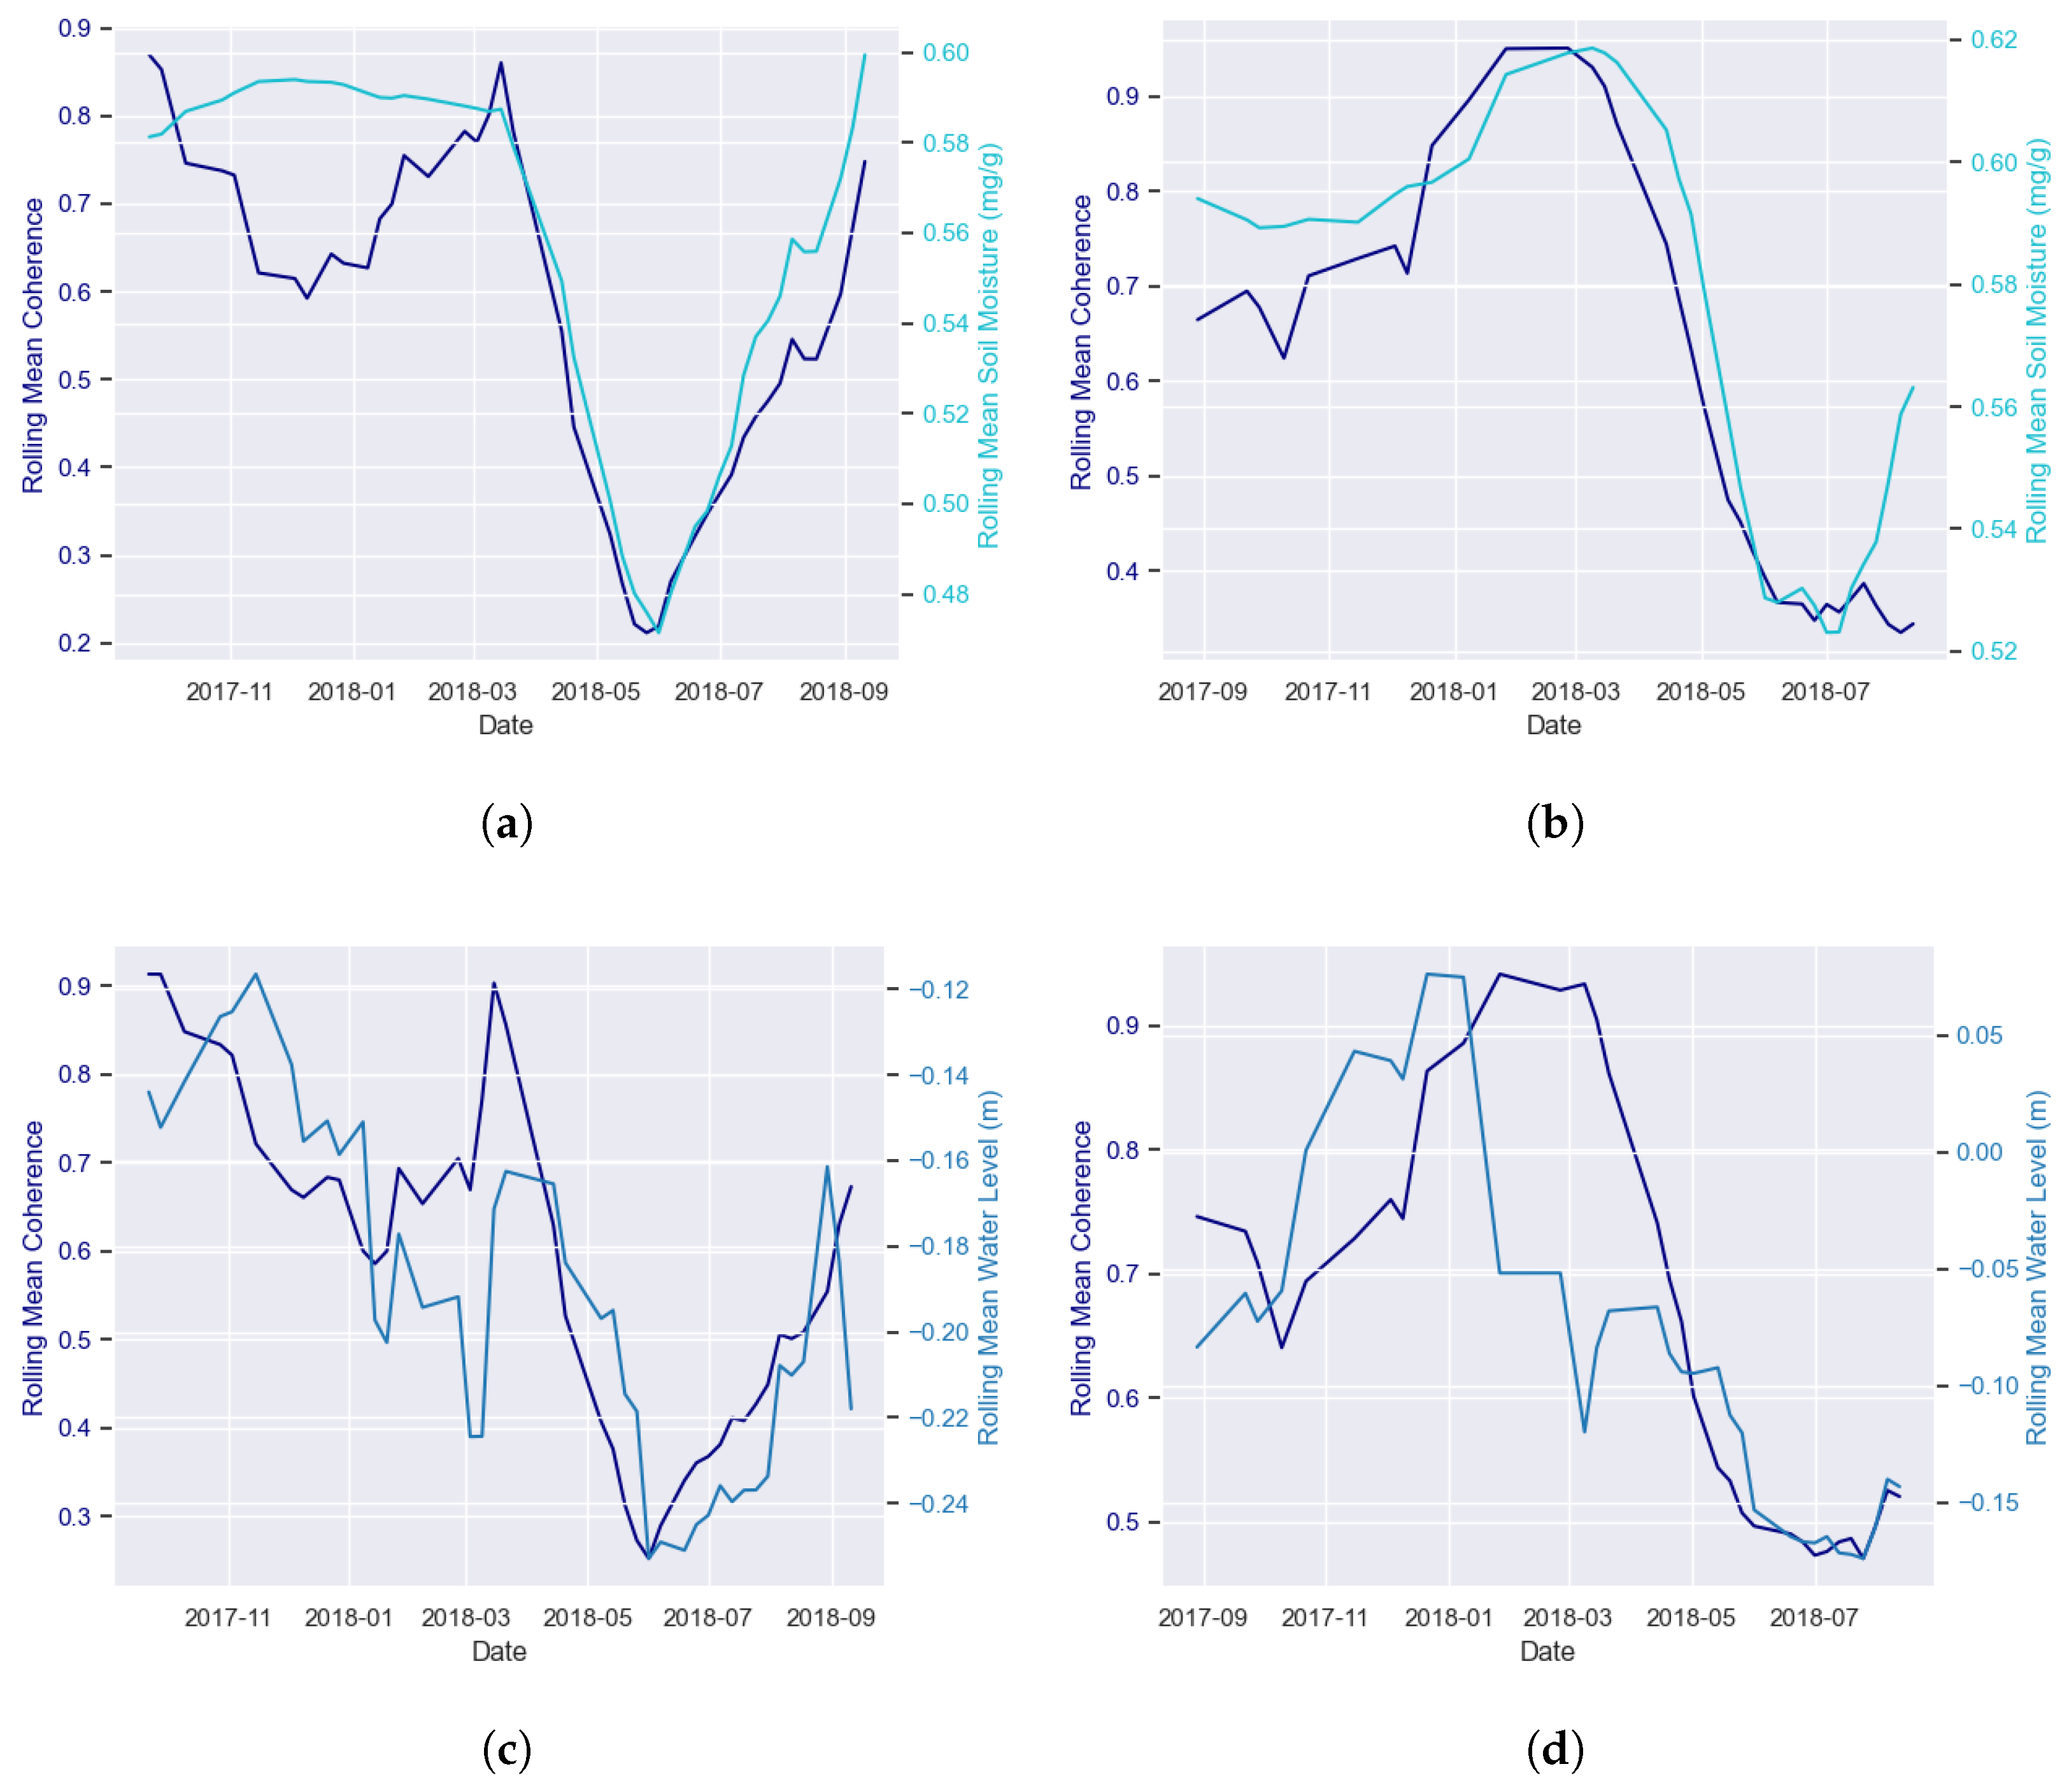
Changes in the ground data are more pronounced in late spring/early summer in 2018 due to the drought, causing larger changes in soil moisture, impacting coherence (Figure 7). At other times of year coherence may be affected more by other factors such as changes in surface roughness.
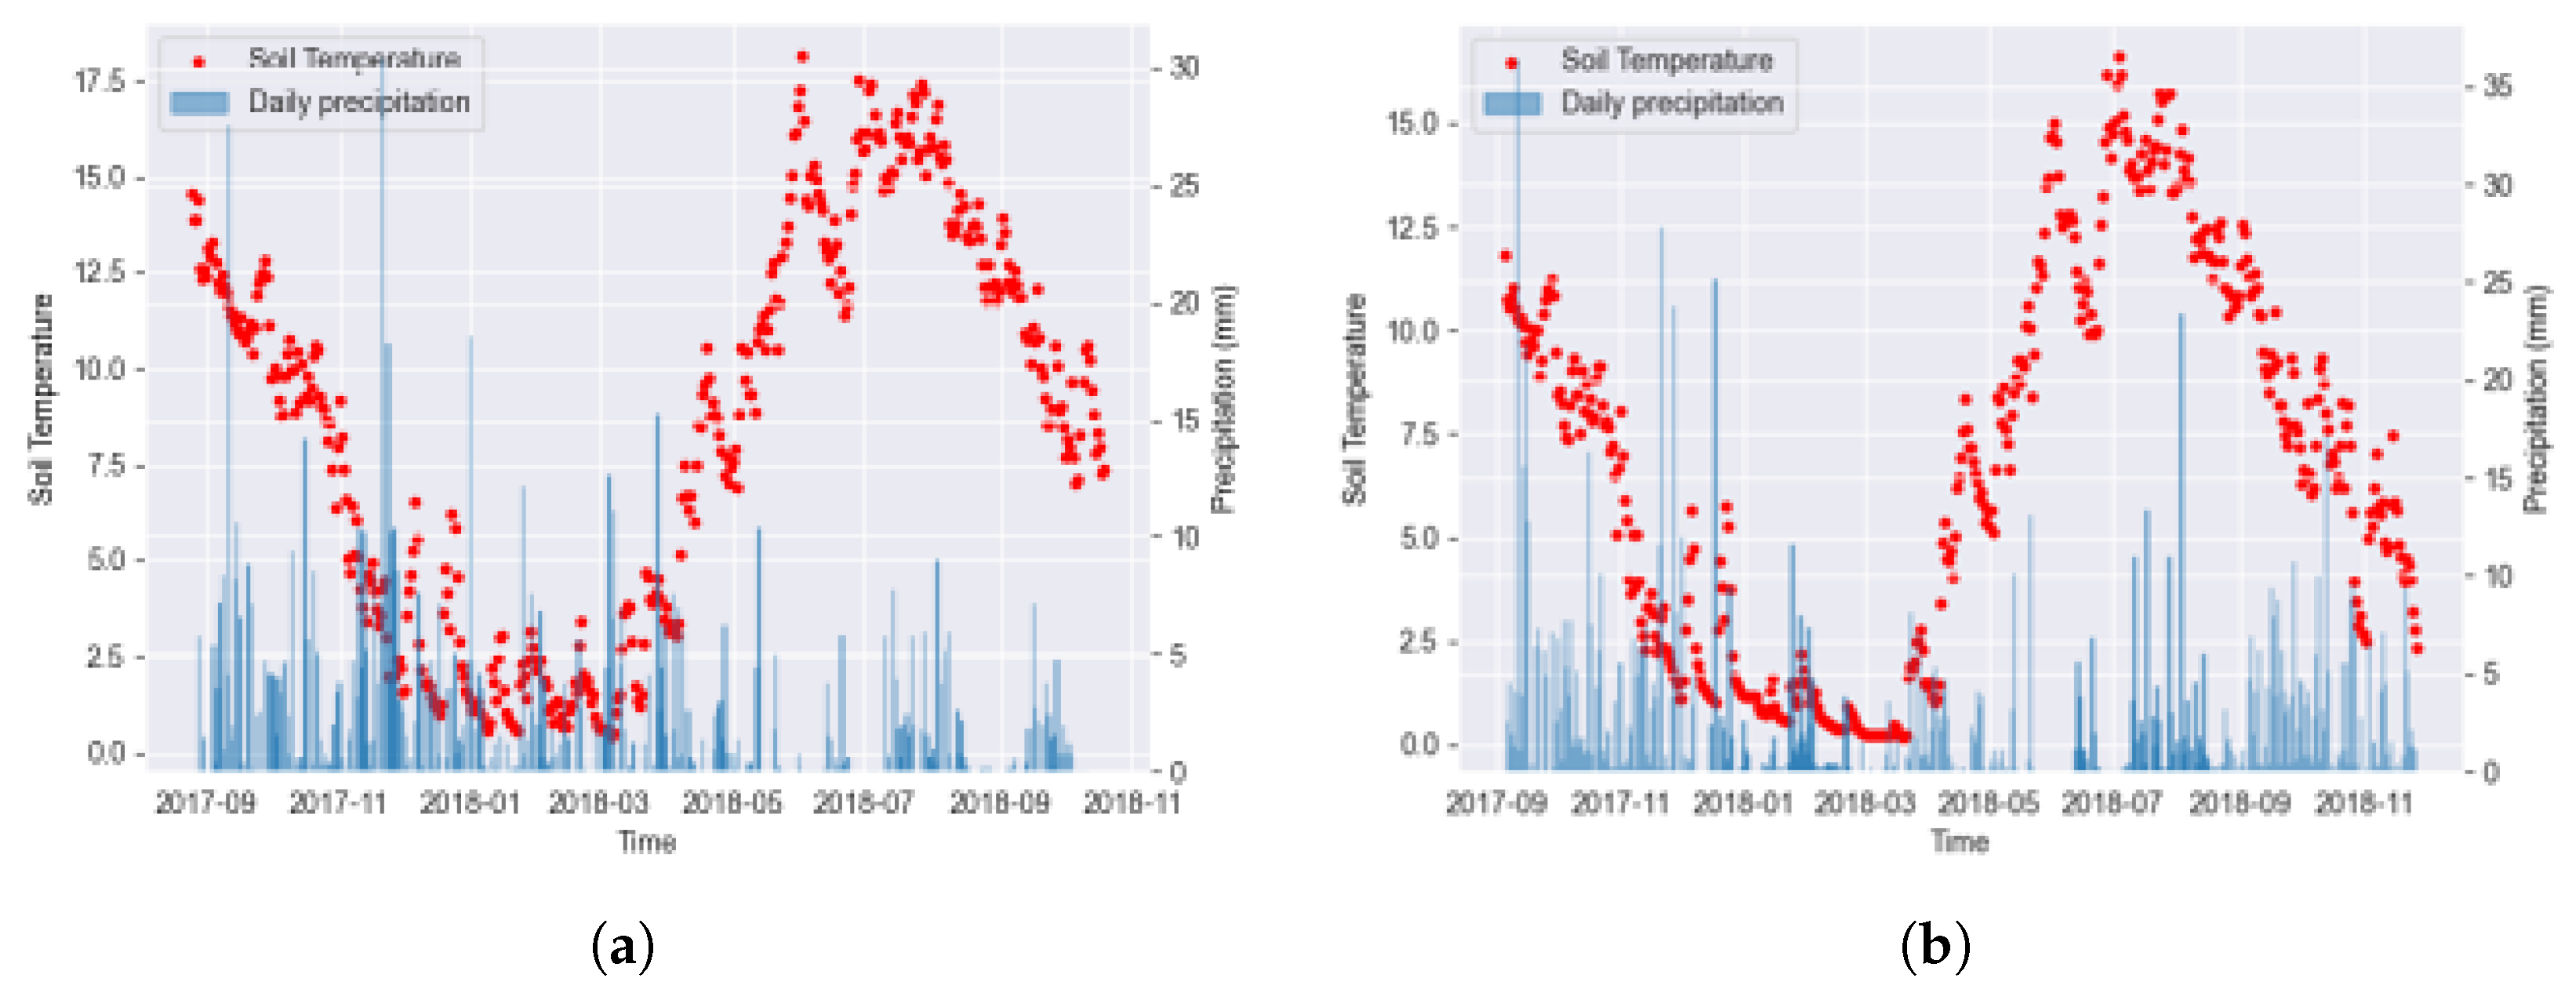
The soil moisture in autumn and winter are more likely to be stable due to higher levels of rainfall and therefore greater soil saturation at these times of year (Figure 4 and Figure 7). This is also reflected in a stronger linear relationship between InSAR coherence and soil moisture rolling means at Munsary subsite C for spring/summer (R2: 0.83, p < 0.001), compared to autumn/winter (R2: 0.77, p < 0.001), although neither are as strong as the overall relationship for this site (R2: 0.89, p < 0.001; Figure 6). The stronger relationship in the warmer months is seen at 11/12 subsites (anomaly is Munsary subsite A). The near-natural subsites (Munsary subsites B-G) have stronger linear relationships (R2: 0.89 ± 0.04 ) than the degraded site (R2: 0.71 ± 0.15 ).
In the winter, frozen soil may lead to reduced sensitivity of radar signals to soil moisture variations, which could be why InSAR coherence variations in autumn and winter tend to be less related to soil moisture for much of these seasons. However, this does not explain the relationship throughout the whole period, especially post-data reduction, meaning there are other reasons for the poorer relationship between InSAR coherence and soil moisture between September and March. In the summer, when soil is thawed, radar signals may exhibit greater sensitivity to changes in soil moisture.

3.2. Water Level and InSAR Coherence

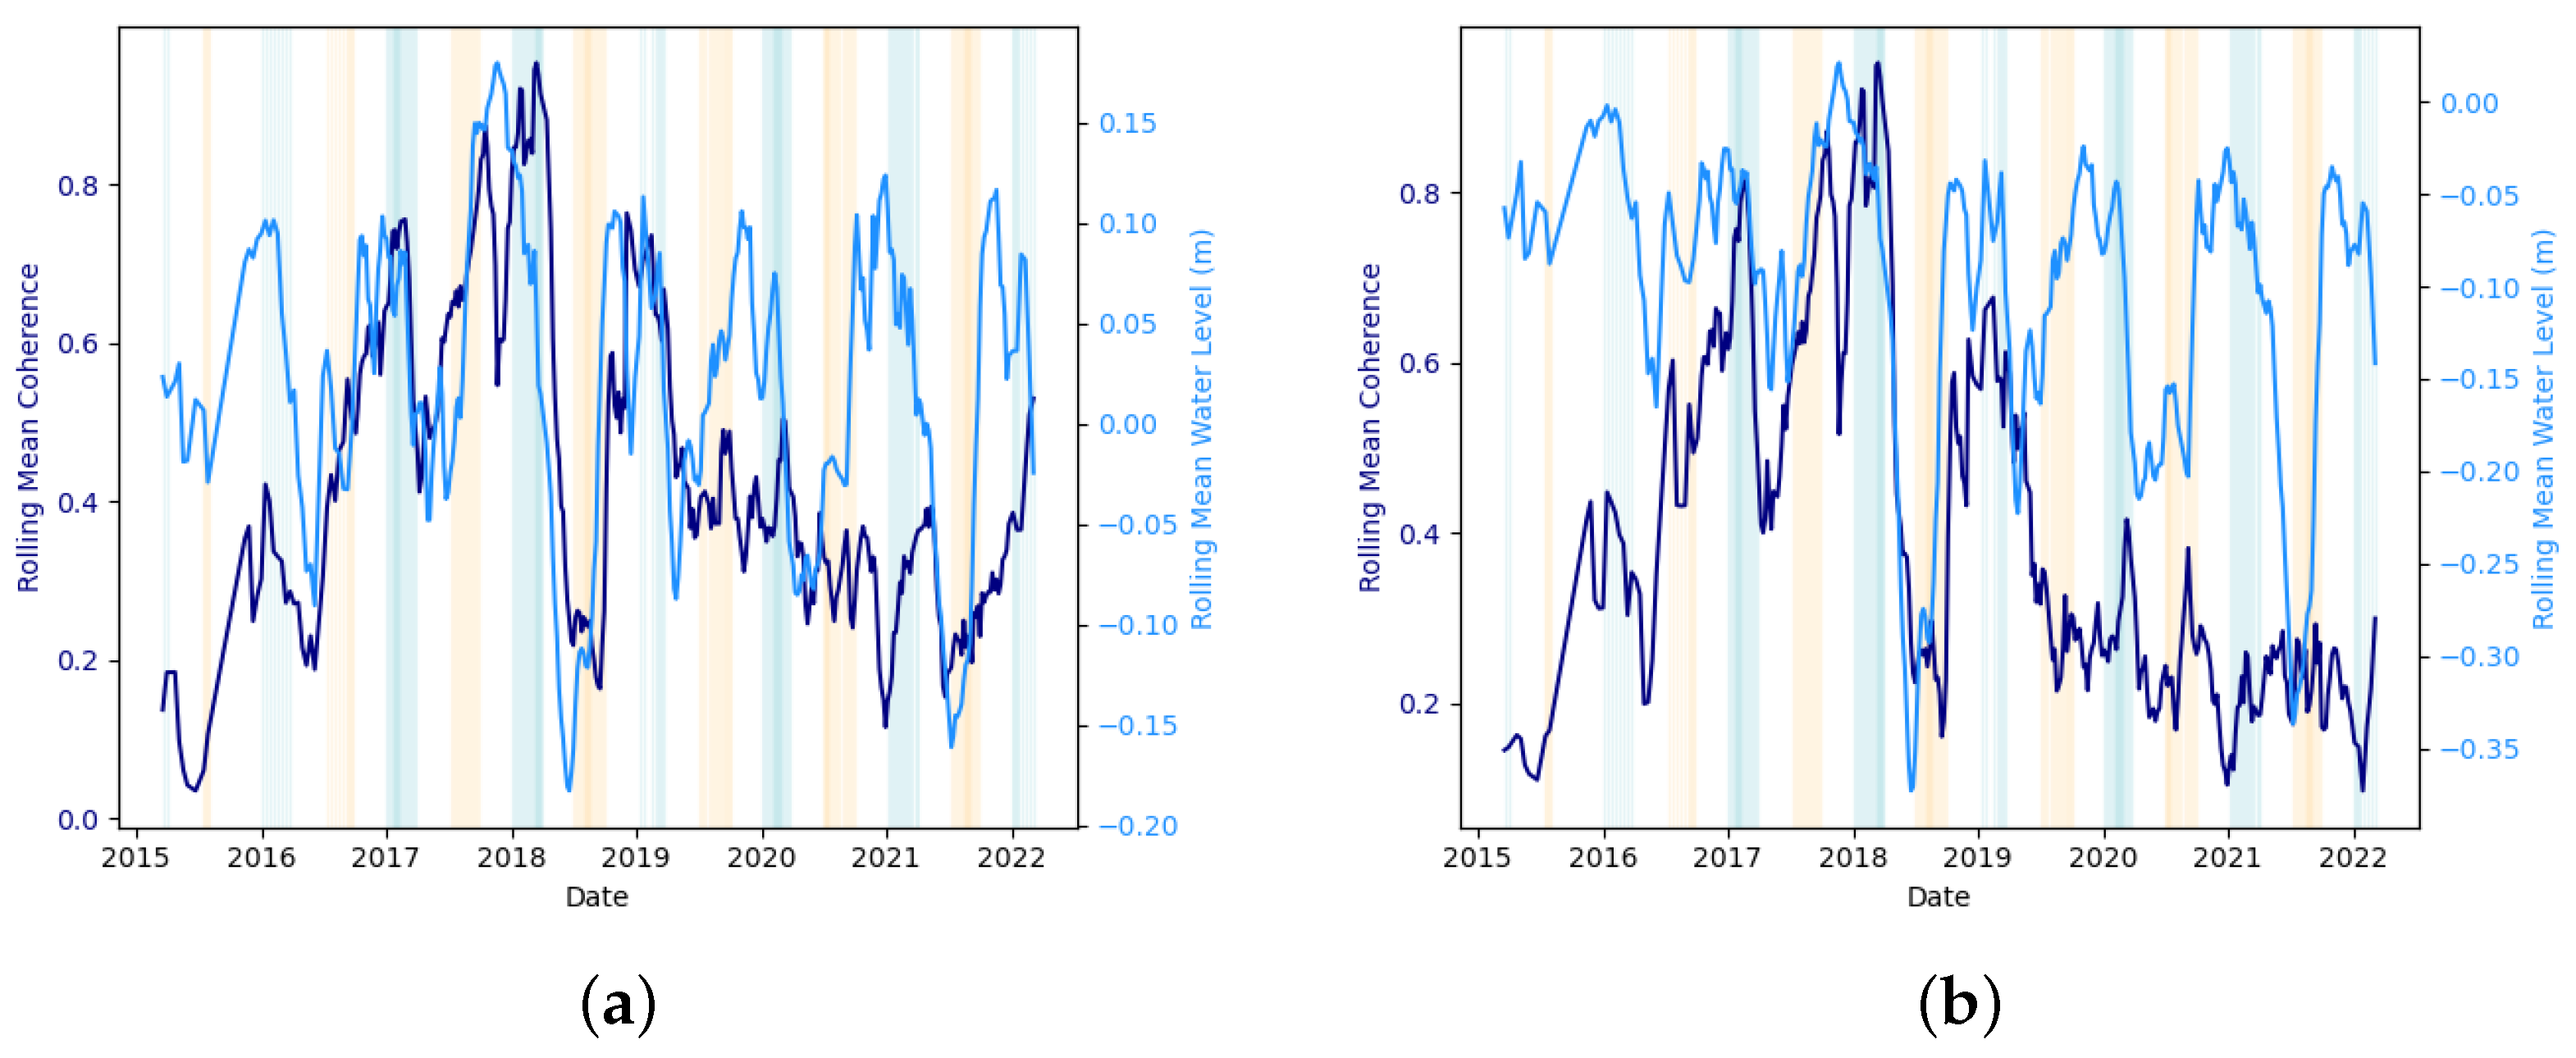
InSAR coherence and water level are generally out-of-phase, with water level increasing as InSAR coherence reduces (Figure 8d and Figure 9), especially in autumn and winter, while spring and summer show more in-phase behaviour (Figure 7). At the degraded site, this inverse pattern persists most of the year, except for an in-phase, non-linear relationship in late summer. At the more intact site, however, there is an in-phase linear relationship in late spring/early summer and an in-phase non-linear relationship (there is a strong cross correlation) for much of the rest of the spring and summer months in the shorter-term data. The relationship between InSAR coherence and water level is poorer than with soil moisture and precipitation with no lag and always in-phase at Munsary subsite B compared to lags some of the time between InSAR coherence and water level (Figure 8c,d). The more intact peat at Munsary typically has a stronger linear relationship between InSAR coherence than Knockfin Heights with less variation (Table 2). The high level of variation at Knockfin Heights results in the strongest relationship across the ten sites at which water level was measured.
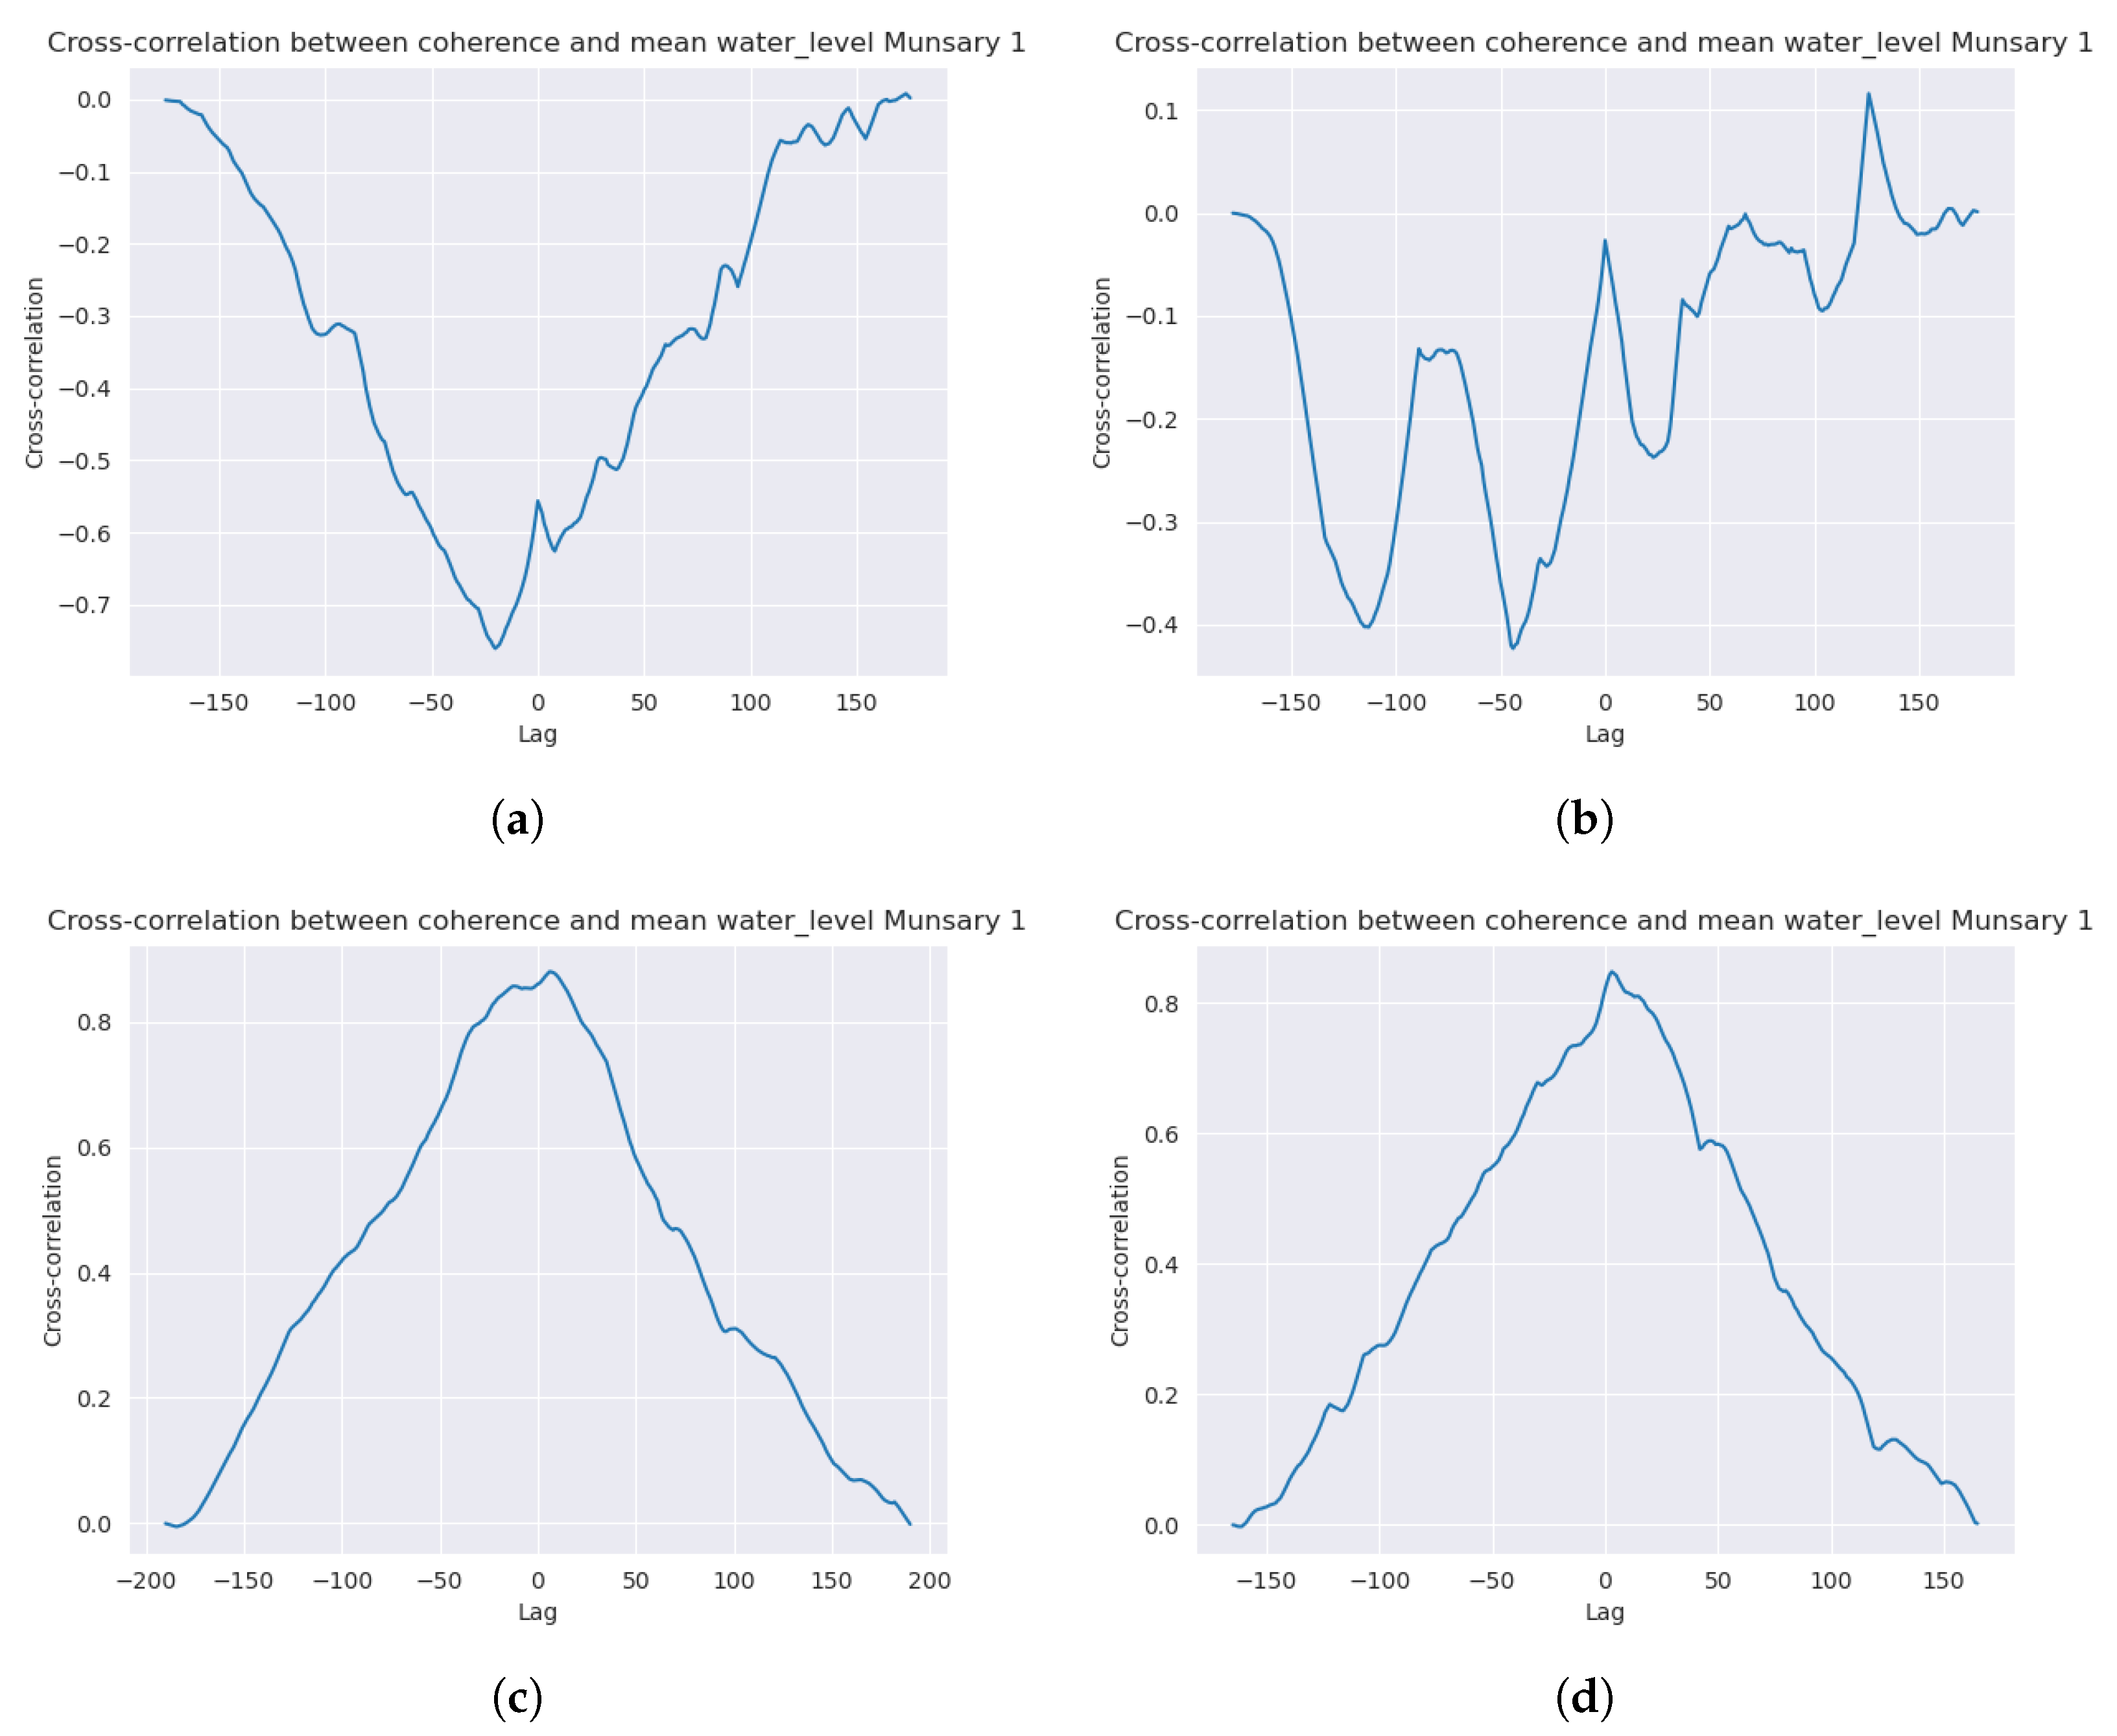
The longer-term data at the more intact site followed the expected trend, with InSAR coherence being out-of-phase with water level and precipitation in-phase at subsites 2–4 (Figure 10). The anomalous site was subsite 1 (Figure 10), where water level data were collected in a hollow, rather than a low ridge. Due to the very high water table, throughout autumn and winter, the relationship is more typical of soil moisture rather than water level. During drier periods this subsite demonstrates either a weaker relationship or one more reflective of water level. The mean winter coherence values tend to correspond to whether areas are wetter or drier. When broken down by season, subsite 1 behaves more like soil moisture in autumn and winter, water level in spring and a variable relationship in summer (Figure 11). All long-term sites show a positive correlation between InSAR coherence and water level when focusing on the summary data (means for each month and season throughout the time the data were collected) and when focusing on each year individually (R2 reaching 0.84 in 2018 for subsite 4); however, when this is split into finer temporal resolution of months rather than seasons or years, this relationship becomes more complex. The correlation becomes negative after the drought (post-2018), especially at subsite 2. Other factors, particularly around the ground surface, also influence this relationship as correlation is very poor across all sites when the water level is less than 0.1 m below the surface (Figure 12).

3.3. Precipitation and InSAR Coherence

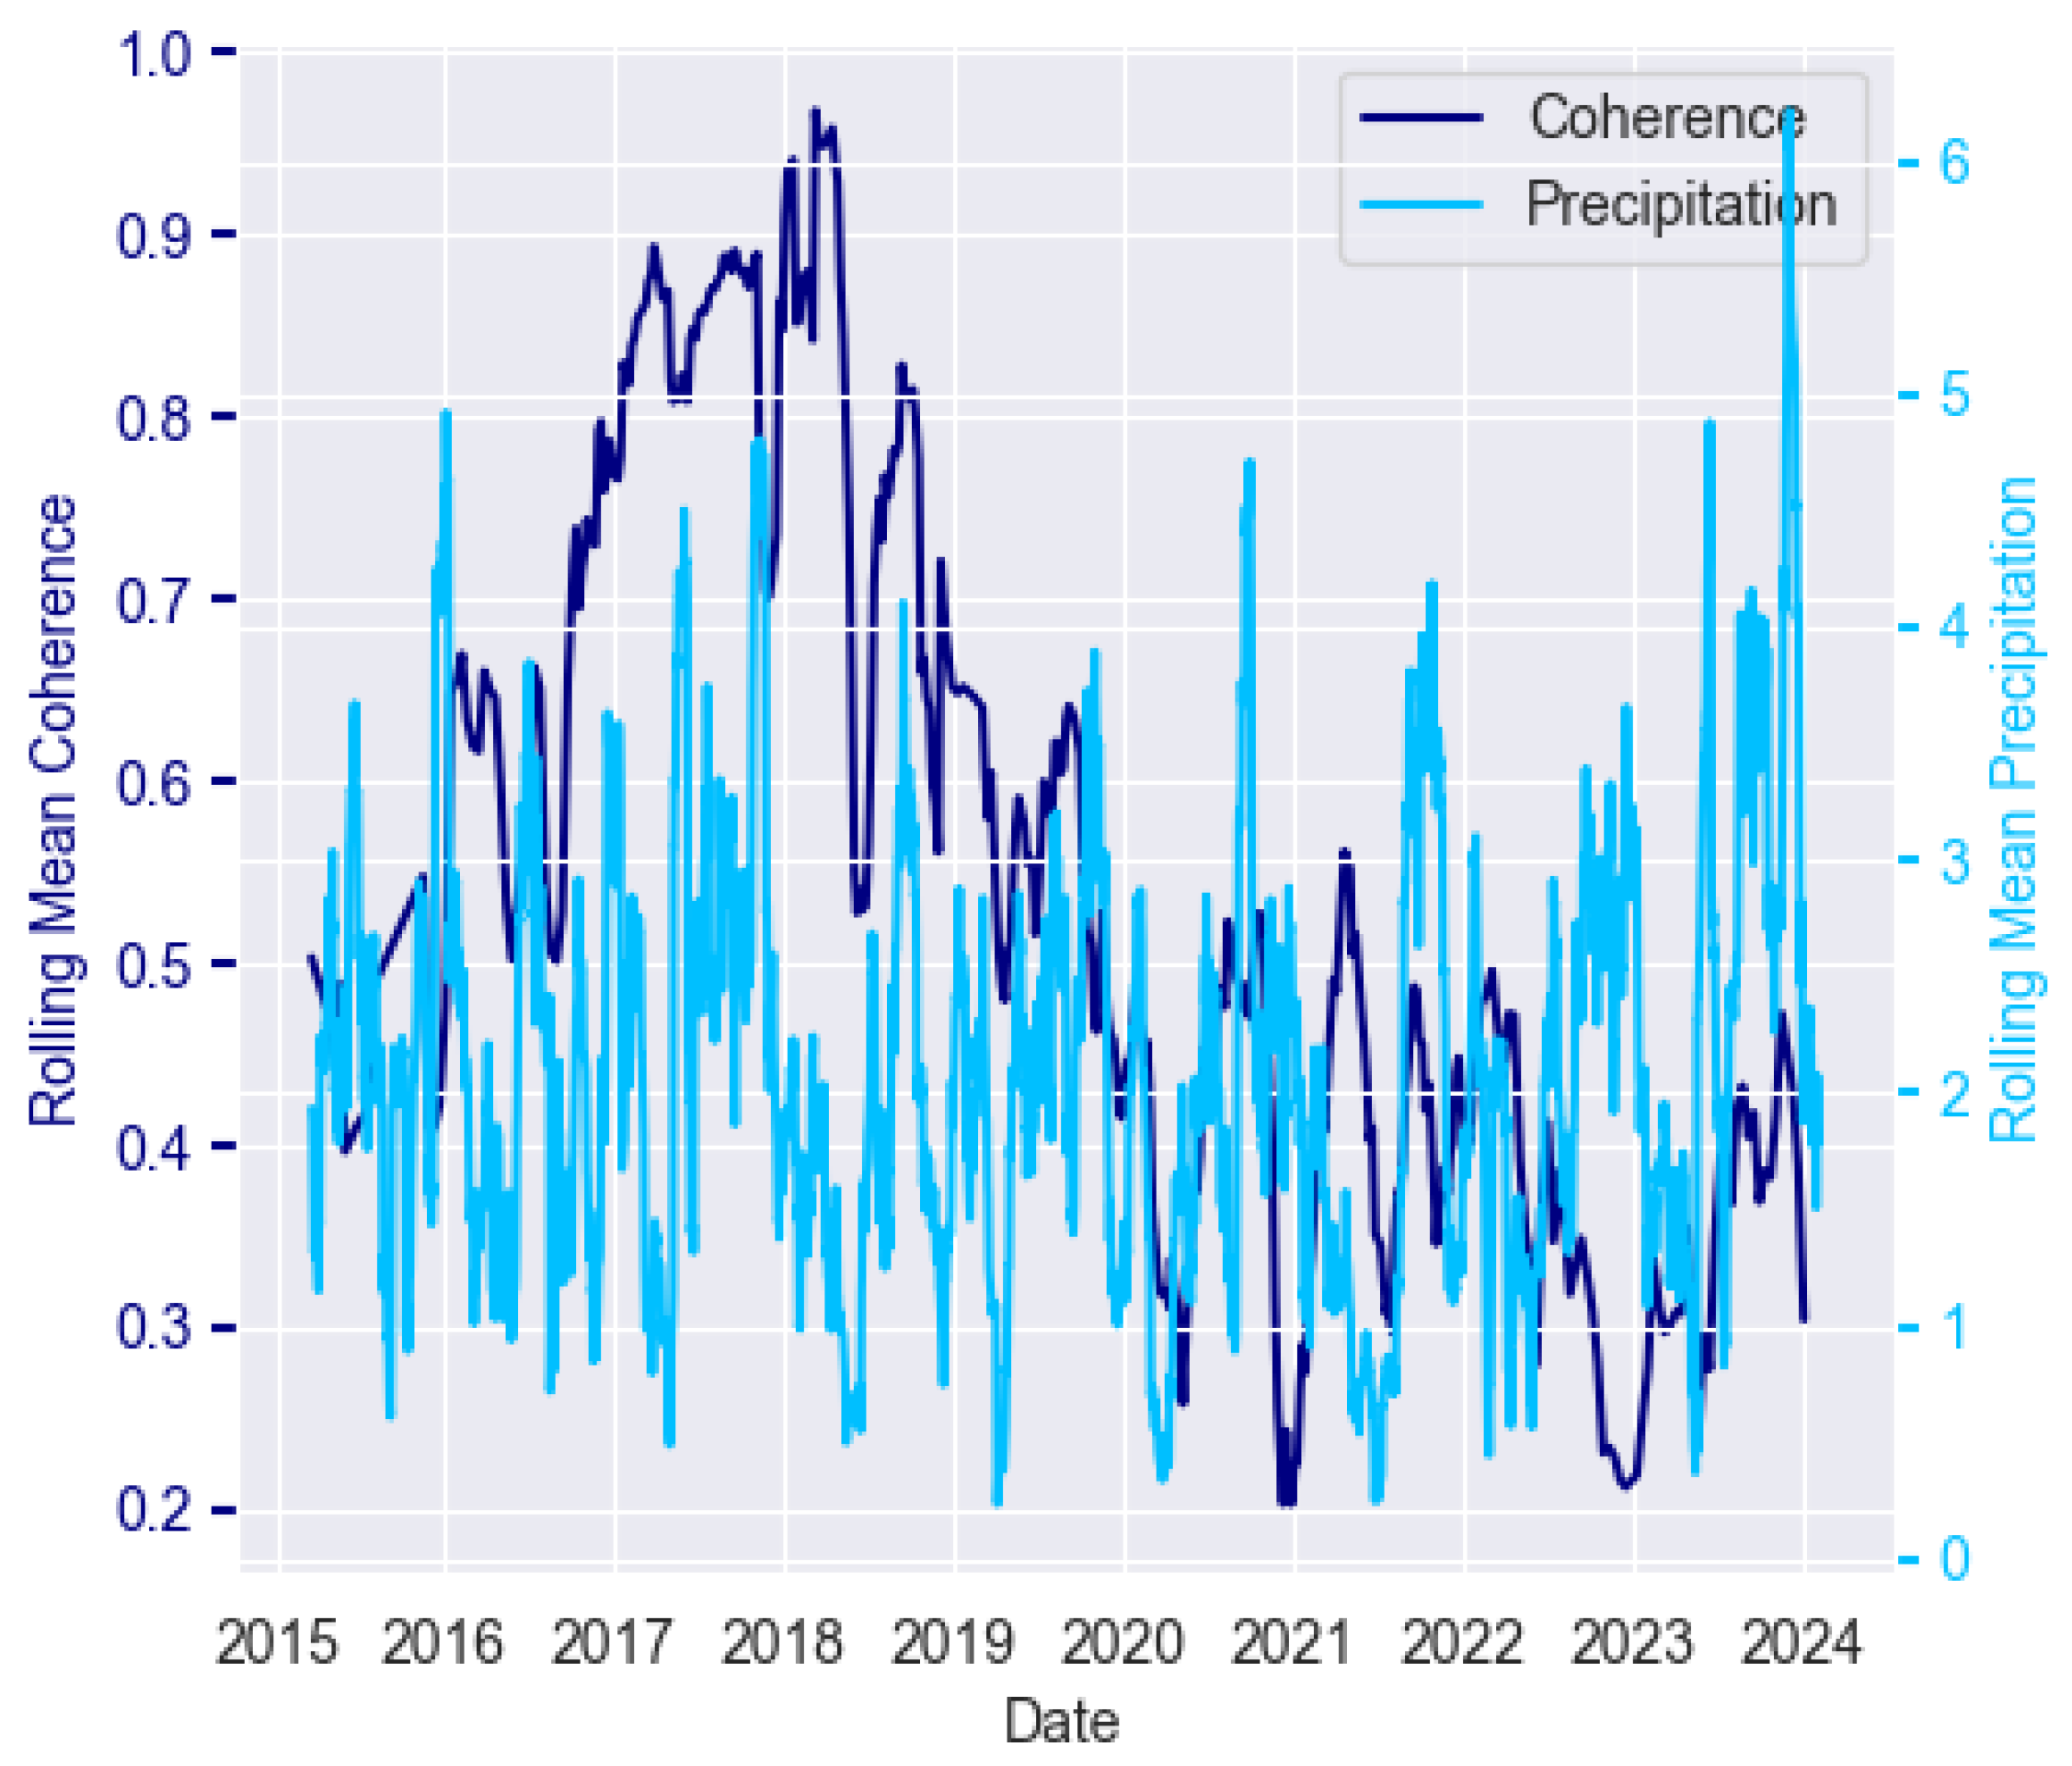
Precipitation and InSAR coherence are cross correlated with timings of peaks and troughs in-phase, but not linearly correlated meaning that precipitation causes an increase in InSAR coherence but does not affect the magnitude of the change (Table 4, Figure 13).
This relationship is stronger when using regional Wick data, with strong in-phase relationships, with no lags (triangular shape) compared to local data (e.g., Figure 8). LULC had no apparent impact on the relationship between precipitation and InSAR coherence with no particular group LULC having a stronger cross correlation outcome than another (Table 5).

4. Discussion

4.1. Variations in Soil Moisture and InSAR Coherence

There is potential to use InSAR coherence to monitor soil moisture in blanket peatland, probably because wetter soils are more stable than drier soils, causing fewer sudden changes in scattering properties. This helps maintain higher coherence, with drought conditions causing a reduction in coherence, possibly due to surface cracking, vegetation stress and microtopographic changes [32,57], resulting in a positive correlation. The weaker linear relationship in colder months (R2: 0.77, p < 0.001) compared to spring/summer (R2: 0.83, p < 0.001) could be due to lower temperatures resulting in a change in the dielectric constant, shifting the radar response [58]. Winter conditions, especially freezing ground and snow cause decorrelation [24,59,60]. The extent of change will be affected by the frequency of the Sentinel-1 data (5.405 GHz) and the proportion of the water that is bound [58]. However, more analysis needs to be undertaken outside of drought periods as this could have strengthened the results for summer 2018 compared to other years.
The significantly different stronger relationship found between soil moisture and InSAR coherence in a more intact peatland (p = 0.0087) reflects the findings of Hrysiewicz et al. [17], this is despite higher levels of precipitation at the degraded site, especially in August and autumn 2018, possibly because the more intact site has poorer natural drainage overall (reflected by numerous pool systems, high water table and the blocking of artificial drains to the south) and more hydrophilic species [47]. Additionally, evapotranspiration rates will be higher at the more intact site (approximately 2.5 °C warmer), increasing the decorrelation between the reference image and that taken during the summer. However, rolling mean coherence and soil moisture reach lower levels at the degraded site suggesting that poorer natural drainage at the more intact site has a greater impact on InSAR coherence and soil moisture than evapotranspiration. Hrysiewicz et al. [17] found that InSAR coherence negatively correlates with changes in soil moisture, which is not the case here. This may be due to the extreme nature of the 2018 drought in the Flow Country or caused by differences in the conditions when the baseline image was collected as high coherence is associated with similar precipitation and soil moisture between the SAR image pairs and the opposite for low coherence [17]. Therefore, the data collected in early April 2018 is very different to the conditions later in spring and summer. Longer-term soil moisture data are required, although the water level data collected at the more intact site at Munsary subsite 1 (a hollow which displays similar patters to soil moisture in autumn and winter) suggest this trend is not limited to drought years, with patterns extending across the whole period.
The ecology could also have an impact as there is more vegetation in the summer and its state changes which can significantly affect radar signals by scattering and diminishing them. However, the strength of the relationship between soil moisture and InSAR coherence at this time of year suggests that hydrology is the main factor. This is further supported by the conclusions of Hrysiewicz et al’s [17] Ireland study where they determined that vegetation did not affect InSAR coherence in the raised bog. Therefore, changes in surface roughness are also unlikely to be a factor that affects the relationship between InSAR coherence and soil moisture as vegetation is a major influence on the roughness in peatland environments [61,62]. However, it could be that this is exacerbated in summer 2018 due to the drought which would limit the growth of vegetation, meaning other years must be assessed to form a conclusion regarding the impact of vegetation on InSAR coherence in the context of soil moisture in a blanket peatland.
Roughness is also affected by water flow, with the vegetation reducing the water movement, especially where Sphagnum dominates [62]. Additionally, surface roughness is affected by LULC and management; however, at both sites, the changes in LULC are not occurring over the course of the ground data-collection period. Furthermore, peat characteristics including peat depth, substrate geology and drainage, also affect the roughness; however, this is more likely to occur spatially or over time periods longer than a few months unless an extreme event occurs.

4.2. Variations in Water Level and InSAR Coherence

The relationship between water level and InSAR coherence is more complex than with soil moisture, but it is typically out-of-phase, possibly because groundwater levels can cause ground deformation, which disrupt the radar signal [63], resulting in a change in InSAR coherence. For instance, as groundwater level increases, swelling can occur, reducing the distance between the ground and Sentinel-1 slightly, resulting in a reduction in coherence. Stronger relationships were found at the more intact site, which could be due to the near-natural nature of the bog with peatlands in a healthier condition demonstrating a stronger relationship between InSAR coherence and water level. Therefore, InSAR coherence could potentially be utilised to assess peat condition between sites.
The longer-term relationships suggest that temporal relationships are affected by other factors, which could be assessed in conjunction with the InSAR coherence data to determine water level. One factor could be PSM, particularly in autumn and winter. In autumn and winter at the more intact site, water levels are higher and this causes the ground to swell, which has the potential to cause the InSAR coherence measurement to be less than would be the case had the ground not moved. The relationship between groundwater and surface motion is likely to change throughout the year depending on what causes the most surface motion. Other factors such as precipitation, evapotranspiration, land management and groundwater recharge can also affect ground movement [63], meaning that further analysis into this relationship is necessary.
Additionally, the drought caused the stronger relationship seen at the more intact site with the shorter-term data in summer. This is supported by Tampuu et al. [32] who found that the dry summer of 2018 resulted in better characterisation of water table fluctuations when using InSAR coherence data as this had the largest water table change. The reduction in groundwater could be further exacerbated as dry peat mosses and soil become hydrophobic, increasing drainage. When peat and mosses are already wet, they are hydrophilic, resulting in more water absorption and water build up in the uppermost layer of peat, with water content reaching about 90% [32]. This causes the water table to rise more quickly in wetter areas, especially in hollows, meaning that the conditions of the hollows in particular, whether they are dry, wet or inundated, affect the coherence of pixels [32], with drier hollows in particular reducing coherence. This is reflected by larger fluctuations in spring 2018 in both InSAR coherence and water level compared to the rest of the time period for the longer-term data at subsites 1 and 2. Additionally, drought periods have been shown to have more rapid changes in PSM [23], which could be caused by increased suction of water from the peat by vegetation.

4.3. Variations in Precipitation and InSAR Coherence

Precipitation causes an increase in InSAR coherence, but does not affect the magnitude of the change, probably because a range of factors, not just precipitation, affect InSAR coherence.
LULC does not appear to impact the relationship between precipitation and InSAR coherence, which is surprising as precipitation is related to soil moisture and as such it is expected that the relationship will be stronger where the peat is more intact. This could be due to both sites, particularly the degraded site due to its higher altitude, receiving large, but unquantified amounts of water in the form of occult precipitation (fog and dew) [64]. This outcome also suggests that LULC has a limited impact on volume scattering in the Flow Country. The use of regional Wick precipitation data may be a reason for this; however, localised data had a limited impact on outcomes at both sites. The local precipitation data may have demonstrated a poorer relationship as the data are collected much more regularly (twice hourly compared to once per day) and the time period that the data were collected was more extreme than usual as there was a drought in the summer, which could affect the lag between a precipitation event and the change in InSAR coherence.
InSAR coherence data could potentially be used to demonstrate when changes in precipitation occur, especially in regions where precipitation is not frontal (such as the North Pennines, England). However, the usefulness of this is limited as it does not reflect the magnitude or intensity of the precipitation.

4.4. Future Work

The data were limited to two locations in a large blanket bog, with longer-term data limited to one area. This is a key limitation of the study, especially as the shorter-term data were collected in a particularly dry year. This could mean that the data do not represent wider peatland environments, particularly when assessing the relationship between soil moisture and InSAR coherence. The impact of colder temperatures in winter on dielectric behaviour should be further investigated. Longer-term data are required to determine whether this weaker relationship was caused by frozen soil specifically or impacted by other environmental responses, such as the response to a drier than ‘normal’ year. Furthermore, the longer-term data were limited to four subsites, with measurements undertaken in varying conditions (hollow compared to ridge). Therefore, future studies should be conducted over longer timescales and across multiple sites to assess whether these relationships are demonstrated in a range of blanket bogs under different conditions.
Additionally, studies should look to determine to a greater degree of certainty why the relationship between the groundwater level and InSAR coherence is out-of-phase and what limits the relationship between soil moisture and InSAR coherence in autumn and winter. Further assessment into the impact of high saturation levels in more depth (currently just the one site with ground measurements taken in a hollow) is also required.
Other data, such as, PSM, the size of pools and peat hags, and vegetation type could be considered in association with each factor (soil moisture, water level and precipitation) and InSAR coherence, when analysing the correlation (cross and linear). This could include a correlation matrix between InSAR coherence and all predictors to determine collinearity and multiple linear regression models. If there are enough spatial data, machine learning approaches, such as random forests, could be used to analyse the permutation importance by assessing the extent to which each variable contributes to predicting changes in InSAR coherence.
There is potential to apply deep learning models to investigate the relationships between remotely sensed InSAR Coherence and the in-situ measurements (soil moisture, water level and precipitation) where ground data are more detailed and cover a greater area. Temporal Sequence Models could be used to model dependencies across the time period or ConvLSTM (Convolutional Long Short-Term Memory) to learn how patterns evolve temporally and spatially.

5. Conclusions

Relationships between soil moisture of peatland and Sentinel-1 InSAR coherence are seasonal in the Flow Country, Scotland with stronger linear relationships in spring and summer, suggesting potential for using InSAR coherence to predict soil moisture. Soil moisture and InSAR coherence are also strongly cross correlated and relationships are typically stronger at more intact peatland sites. Water level is also related to InSAR coherence; however, this relationship is more complex, with an inverse relationship for much of the year, although there is still a moderate correlation between these variables and typically stronger at the near-natural peatland (Munsary).
As there are significant differences between the correlations at different sites, there is potential to use InSAR coherence as a proxy for soil moisture when comparing areas with different peat condition and could be used as an indicator for how intact the peatland is in relation to its hydrology, but needs to be used in conjunction with other data, such as the presence of key peatland species, peat surface motion and SAR backscatter data, especially where the water table is high.
Although the timing of precipitation is strongly cross-correlated with InSAR coherence, the magnitude variation prevents a linear relationship. Additionally, land cover has no impact on the strength of cross correlation in the Flow Country. The cross correlation outcomes suggest that InSAR coherence could be used as a proxy for the timing of precipitation events, especially in peatlands with non-frontal weather systems.

Author Contributions

Conceptualisation, R.Z.W. and D.J.L.; methodology, R.Z.W. and D.J.L.; software, R.Z.W.; formal analysis, R.Z.W.; data curation, R.A., R.Z.W., writing—original draft preparation, R.Z.W.; writing—review and editing, R.Z.W., D.J.L., D.S.B. and R.A.; visualisation, R.Z.W.; supervision, D.J.L. and D.S.B. All authors have read and agreed to the published version of the manuscript.

Funding

This research was funded by the Engineering and Physical Sciences Research Council (EPSRC) Centre for Doctoral Training (CDT) in Geospatial Systems under grant number EP/S023577/1. R.A. acknowledges funding from Plantlife Scotland and the Leverhulme Trust (RL-2019-002) who have supported the acquisition and curation of the long-term Munsary dataset.

Institutional Review Board Statement

Not applicable.

Informed Consent Statement

Not applicable.

Data Availability Statement

Short-term ground data: https://catalogue.ceh.ac.uk/documents/3458e0b9-5002-4ddb-bcb3-1c7fb08fb70b (accessed on 24 October 2023). Longer-term data: Andersen, personal communication; the data are not currently publicly available but can be requested at roxane.andersen@uhi.ac.uk. Wick weather data are accessible from https://meteostat.net/en/station/03075?t=2015-01-01/2024-12-31 (accessed on 26 January 2024). Sentinel-1 InSAR coherence data were accessed from https://search.asf.alaska.edu/#/ (accessed on 23 February 2024) using Python (version 3.12): https://github.com/rachelzwalker/insar_coherence_water_content_level_precipitation (accessed on 3 June 2025).

Acknowledgments

With thanks to Andy Sowter for suggesting the research topic and the Geospatial Systems CDT for their support. We thank all the research assistants and researchers who have contributed to the field data collection at the two sites (Paul Gaffney, Henk Pieter Sterk, Chris Marshall, Peter Gilbert, Paula Fernandez Farcia and Heather Johnstone).

Conflicts of Interest

The authors declare no conflicts of interest.

Abbreviations

The following abbreviations are used in this manuscript:
SARSynthetic Aperture Radar
InSARInterferometric Synthetic Aperture Radar
SLCSingle Look Complex
PSMPeat Surface Motion
ASFAlaskan Satellite Facility
LULCLand Use Land Cover

References

  1. Wilkinson, S.L.; Andersen, R.; Moore, P.A.; Davidson, S.J.; Granath, G.; Waddington, J.M. Wildfire and degradation accelerate northern peatland carbon release. Nat. Clim. Change 2023, 13, 456–461. [Google Scholar] [CrossRef]
  2. Joosten, H.; Clarke, D. Wise Use of Mires and Peatlands-Background and Principles Including a Framework for Decision-Making; International Mire Conservation Group and International Peat Society, Saarijärven Offset Oy: Saarijärvi, Finland, 2002; pp. 1–304. [Google Scholar]
  3. Page, S.E.; Baird, A.J. Peatlands and Global Change: Response and Resilience. Annu. Rev. Environ. Resour. 2016, 41, 35–57. [Google Scholar] [CrossRef]
  4. Flynn, R.; Mackin, F.; Renou-Wilson, F. Towards the Quantification of Blanket Bog Ecosystem Services to Water; Technical Report; Environmental Protection Agency: Washington, DC, USA, 2021. [Google Scholar]
  5. Hughes, R.; Anderson, R.; Cowie, N.R.; Gullett, P.R.; Hancock, M.H.; Klein, D.; Littlewood, N.; Martin-Walker, A.; Pravia, A.; Stagg, P.; et al. Hydrological and vegetation change during peatland restoration at ex-forested sites in a blanket bog ecosystem. J. Appl. Ecol. 2025, 62, 2357–2372. [Google Scholar] [CrossRef]
  6. Smith, L. Satellite remote sensing of river inundation area, stage, and discharge: A review. Hydrol. Process. 1997, 11, 1427–1439. [Google Scholar] [CrossRef]
  7. Campbell, J.; Wynne, R.; Thomas, V. Introduction to Remote Sensing, 6th ed.; The Guilford Press: New York, NY, USA, 2022. [Google Scholar]
  8. White, L.; Brisco, B.; Dabboor, M.; Schmitt, A.; Pratt, A. A collection of SAR methodologies for monitoring wetlands. Remote Sens. 2015, 7, 7615–7645. [Google Scholar] [CrossRef]
  9. Töyrä, J.; Pietroniro, A. Towards operational monitoring of a northern wetland using geomatics-based techniques. Remote Sens. Environ. 2005, 97, 174–191. [Google Scholar] [CrossRef]
  10. Bechtold, M.; Tiemeyer, B.; Laggner, A.; Leppelt, T.; Frahm, E.; Belting, S. Large-scale regionalization of water table depth in peatlands optimized for greenhouse gas emission upscaling. Hydrol. Earth Syst. Sci. 2014, 18, 3319–3339. [Google Scholar] [CrossRef]
  11. Bechtold, M.; Schlaffer, S.; Tiemeyer, B.; De Lannoy, G. Inferring water table depth dynamics from ENVISAT-ASAR C-band backscatter over a range of peatlands from deeply-drained to natural conditions. Remote Sens. 2018, 10, 536. [Google Scholar] [CrossRef]
  12. Millard, K.; Richardson, M. Quantifying the relative contributions of vegetation and soil moisture conditions to polarimetric C-Band SAR response in a temperate peatland. Remote Sens. Environ. 2018, 206, 123–138. [Google Scholar] [CrossRef]
  13. Canisius, F.; Brisco, B.; Murnaghan, K.; Van Der Kooij, M.; Keizer, E. SAR backscatter and InSAR coherence for monitoring wetland extent, flood pulse and vegetation: A study of the Amazon lowland. Remote Sens. 2019, 11, 720. [Google Scholar] [CrossRef]
  14. Srivastava, S.K.; Jayaraman, V. Relating Interferometric Signature of Repeat Pass ERS-1 SAR Signals to Dynamic Land Cover Changes. Acta Astronaut. 2001, 48, 37–44. [Google Scholar] [CrossRef]
  15. Brisco, B.; Murnaghan, K.; Wdowinski, S.; Hong, S.H. Evaluation of RADARSAT-2 Acquisition Modes for Wetland Monitoring Applications. Can. J. Remote Sens. 2015, 41, 431–439. [Google Scholar] [CrossRef]
  16. Di Baldassarre, G.; Schumann, G.; Brandimarte, L.; Bates, P. Timely Low Resolution SAR Imagery To Support Floodplain Modelling: A Case Study Review. Surv. Geophys. 2011, 32, 255–269. [Google Scholar] [CrossRef]
  17. Hrysiewicz, A.; Holohan, E.P.; Donohue, S.; Cushnan, H. SAR and InSAR data linked to soil moisture changes on a temperate raised peatland subjected to a wildfire. Remote Sens. Environ. 2023, 291, 113516. [Google Scholar] [CrossRef]
  18. Barrett, B.; Whelan, P.; Dwyer, N. The Use of C-and L-Band Repeat-Pass Interferometric SAR Coherence for Soil Moisture Change Detection in Vegetated Areas. Open Remote Sens. J. 2012, 5. [Google Scholar] [CrossRef]
  19. Millard, K.; Kirby, P.; Nandlall, S.; Behnamian, A.; Banks, S.; Pacini, F. Using growing-season time series coherence for improved peatland mapping: Comparing the contributions of Sentinel-1 and RADARSAT-2 coherence in full and partial time series. Remote Sens. 2020, 12, 2465. [Google Scholar] [CrossRef]
  20. Alshammari, L.; Large, D.; Boyd, D.; Sowter, A.; Anderson, R.; Andersen, R.; Marsh, S. Long-term peatland condition assessment via surface motion monitoring using the ISBAS DInSAR technique over the Flow Country, Scotland. Remote Sens. 2018, 10, 1103. [Google Scholar] [CrossRef]
  21. Alshammari, L.; Boyd, D.; Sowter, A.; Marshall, C.; Andersen, R.; Gilbert, P.; Marsh, S.; Large, D. Use of Surface Motion Characteristics Determined by InSAR to Assess Peatland Condition. J. Geophys. Res. Biogeosciences 2020, 125, e2018JG004953. [Google Scholar] [CrossRef]
  22. Bradley, A.; Andersen, R.; Marshall, C.; Sowter, A.; Large, D. Identification of typical ecohydrological behaviours using InSAR allows landscape-scale mapping of peatland condition. Earth Surf. Dyn. 2022, 10, 261–277. [Google Scholar] [CrossRef]
  23. Marshall, C.; Sterk, H.; Gilbert, P.; Andersen, R.; Bradley, A.; Sowter, A.; Marsh, S.; Large, D. Multiscale Variability and the Comparison of Ground and Satellite Radar Based Measures of Peatland Surface Motion for Peatland Monitoring. Remote Sens. 2022, 14, 336. [Google Scholar] [CrossRef]
  24. Brisco, B.; Ahern, F.; Murnaghan, K.; White, L.; Canisus, F.; Lancaster, P. Seasonal change in wetland coherence as an aid to wetland monitoring. Remote Sens. 2017, 9, 158. [Google Scholar] [CrossRef]
  25. Prati, C.; Rocca, F. Improving slant-range resolution with multiple SAR surveys. IEEE Trans. Aerosp. Electron. Syst. 1993, 29, 135–143. [Google Scholar] [CrossRef]
  26. Olesk, A.; Praks, J.; Antropov, O.; Zalite, K.; Arumäe, T.; Voormansik, K. Interferometric SAR coherence models for Characterization of hemiboreal forests using TanDEM-X dssata. Remote Sens. 2016, 8, 700. [Google Scholar] [CrossRef]
  27. Hagberg, J.O.; Ulander, L.M.; Askne, J. Repeat-pass SAR interferometry over forested terrain. IEEE Trans. Geosci. Remote Sens. 1995, 33, 331–340. [Google Scholar] [CrossRef]
  28. Hanssen, R. Radar Interferometry: Data Interpretation and Error Analysis; Kluwer Academic Publishers: Dordrecht, The Netherlands, 2001. [Google Scholar]
  29. Yin, Q.; Hong, W.; Lin, Y.; Li, Y. Soil moisture change estimation using InSAR coherence variations with preliminary laboratory measurements. Sci. China Inf. Sci. 2017, 60, 29301. [Google Scholar] [CrossRef]
  30. Holmes, M.G. Monitoring vegetation in the future: Radar. Bot. J. Linn. Soc. 1992, 108, 93–109. [Google Scholar] [CrossRef]
  31. Kim, J.W.; Lu, Z.; Gutenberg, L.; Zhu, Z. Characterizing hydrologic changes of the Great Dismal Swamp using SAR/InSAR. Remote Sens. Environ. 2017, 198, 187–202. [Google Scholar] [CrossRef]
  32. Tampuu, T.; Praks, J.; Kull, A. Insar Coherence for Monitoring Water Table Fluctuations in Northern Peatlands. In Proceedings of the International Geoscience and Remote Sensing Symposium (IGARSS), Waikoloa, HI, USA, 26 September–2 October 2020; Institute of Electrical and Electronics Engineers Inc.: Piscataway, NJ, USA, 2020; Volume 9, pp. 4738–4741. [Google Scholar] [CrossRef]
  33. Cao, N.; Lee, H.; Jung, H.; Yu, H. Estimation of Water Level Changes of Large-Scale Amazon Wetlands Using ALOS2 ScanSAR Differential Interferometry. Remote Sens. 2018, 10, 966. [Google Scholar] [CrossRef]
  34. Kasischke, E.S.; Smith, K.B.; Bourgeau-Chavez, L.L.; Romanowicz, E.A.; Brunzell, S.; Richardson, C.J. Effects of seasonal hydrologic patterns in south Florida wetlands on radar backscatter measured from ERS-2 SAR imagery. Remote Sens. Environ. 2003, 88, 423–441. [Google Scholar] [CrossRef]
  35. Lee, H.; Yuan, T.; Jung, H.C.; Beighley, E. Mapping wetland water depths over the central Congo Basin using PALSAR ScanSAR, Envisat altimetry, and MODIS VCF data. Remote Sens. Environ. 2015, 159, 70–79. [Google Scholar] [CrossRef]
  36. Yuan, T.; Lee, H.; Jung, H.C.; Aierken, A.; Beighley, E.; Alsdorf, D.E.; Tshimanga, R.M.; Kim, D. Absolute water storages in the Congo River floodplains from integration of InSAR and satellite radar altimetry. Remote Sens. Environ. 2017, 201, 57–72. [Google Scholar] [CrossRef]
  37. De Zan, F.; Parizzi, A.; Prats-Iraola, P.; López-Dekker, P. A SAR interferometric model for soil moisture. IEEE Trans. Geosci. Remote Sens. 2014, 52, 418–425. [Google Scholar] [CrossRef]
  38. Mohammadimanesh, F.; Salehi, B.; Mahdianpari, M.; Brisco, B.; Motagh, M. Wetland Water Level Monitoring Using Interferometric Synthetic Aperture Radar (InSAR): A Review. Can. J. Remote Sens. 2018, 44, 247–262. [Google Scholar] [CrossRef]
  39. Ferretti, A.; Monti-Guarnieri, A.; Prati, C.; Rocca, F.; Massonet, D. InSAR Principles—Guidelines for SAR Interferometry Processing and Interpretation. 2007. Available online: https://www.esa.int/esapub/tm/tm19/TM-19_ptA.pdf (accessed on 3 March 2025).
  40. Ramsey, E.; Lu, Z.; Rangoonwala, A.; Rykhus, R. Multiple baseline radar interferometry applied to coastal land cover classification and change analyses. GIScience Remote Sens. 2006, 43, 283–309. [Google Scholar] [CrossRef]
  41. Luo, X.; Askne, J.; Smith, G.; Dammert, P. Coherence characteristics of radar signals from rough soil. J. Electromagn. Waves Appl. 2001, 14, 1555–1557. [Google Scholar] [CrossRef]
  42. Nesti, G.; Tarchi, D.; Rudant, J.P. Decorrelation of backscattered signal due to soil moisture changes. In Proceedings of the 1995 International Geoscience and Remote Sensing Symposium, IGARSS ’95, Quantitative Remote Sensing for Science and Applications, Firenze, Italy, 10–14 July 1995; IEEE: New York, NY, USA, 1995; pp. 2026–2028. [Google Scholar] [CrossRef]
  43. Nesti, G.; Tarchi, D.; Despan, D.; Rudant, J.; Bedidi, A.; Borderies, P.; Bachelier, E. Phase Shift and Decorrelation of Radar Signal Related to Soil Moisture Changes. In Proceedings of the Retrieval of Bio- and Geo-Physical Parameters from SAR Data for Land Applications Workshop, Noordwijk, The Netherlands, 21–23 October 1998; ESTEC: Noordwijk, The Netherlands, 1998; pp. 21–23. [Google Scholar]
  44. Weydahl, D.J. Analysis of ERS SAR coherence images acquired over vegetated areas and urban features. Int. J. Remote Sens. 2001, 22, 2811–2830. [Google Scholar] [CrossRef]
  45. ASF. Product Guide—HyP3. 2025. Available online: https://hyp3-docs.asf.alaska.edu/guides/rtc_product_guide/ (accessed on 3 March 2025).
  46. Lindsay, R.; Charman, D.; Everingham, F.; O’reilly, R.; Palmer, M.; Rowell, T.; Stroud, D.; Ratcliffe, D.; Oswald, P. The Flow Country—The Peatlands of Caithness and Sutherland; Technical Report; Joint Nature Conservation Committee: Peterborough, UK, 1988. [Google Scholar]
  47. Marshall, C.; Large, D.; Andersen, R.; Gilbert, P.; Sterk, H. Environmental Monitoring Data from Upland and Lowland Blanket Peatland in the Flow Country, Scotland, 2017–2019; EIDC: Lancaster, UK, 2021. [Google Scholar] [CrossRef]
  48. HOBO Data Loggers. HOBO® U20L Water Level Logger (U20L-0x) Manual; HOBO Data Loggers: Cape Cod, MA, USA, 2018. [Google Scholar]
  49. OTT. Operating Instructions Groundwater Datalogger OTT Orpheus Mini. 2022. Available online: https://stevenswater.com/resources/documentation/Orpheus%20Mini_E_usermanual.pdf (accessed on 20 August 2025).
  50. Meteostat. Wick Airport Weather. 2024. Available online: https://meteostat.net/en/station/03075?t=2015-03-19/2024-03-08 (accessed on 4 April 2024).
  51. Bechtold, M.; De Cannière, S.; Reichle, R.; De Lannoy, G. Accounting for static and dynamic open water in the modeling of Smap brightness temperatures over peatlands. In Proceedings of the International Geoscience and Remote Sensing Symposium (IGARSS), Valencia, Spain, 22–27 July 2018; Volume 2018. [Google Scholar] [CrossRef]
  52. Asmuß, T.; Bechtold, M.; Tiemeyer, B. On the potential of Sentinel-1 for high resolution monitoring of water table dynamics in grasslands on organic soils. Remote Sens. 2019, 11, 1659. [Google Scholar] [CrossRef]
  53. Toca, L.; Artz, R.R.; Smart, C.; Quaife, T.; Morrison, K.; Gimona, A.; Hughes, R.; Hancock, M.H.; Klein, D. Potential for Peatland Water Table Depth Monitoring Using Sentinel-1 SAR Backscatter: Case Study of Forsinard Flows, Scotland, UK. Remote Sens. 2023, 15, 1900. [Google Scholar] [CrossRef]
  54. Gevaert, A.; Parinussa, R.; Renzullo, L.; van Dijk, A.; de Jeu, R. Spatio-temporal evaluation of resolution enhancement for passive microwave soil moisture and vegetation optical depth. Int. J. Appl. Earth Obs. Geoinf. 2016, 45, 235–244. [Google Scholar] [CrossRef]
  55. Newland, D. An Introduction to Random Vibrations, Spectral and Wavelet Analysis, 3rd ed.; Longman Scientific and Technical and John Wiley and Sons: New York, NY, USA, 1993. [Google Scholar]
  56. Diedenhofen, B.; Musch, J. Correction: cocor: A Comprehensive Solution for the Statistical Comparison of Correlations. PLoS ONE 2015, 10, e0131499. [Google Scholar] [CrossRef]
  57. Hrysiewicz, A.; Williamson, J.; Evans, C.D.; Jovani-Sancho, A.J.; Callaghan, N.; Lyons, J.; White, J.; Kowalska, J.; Menichino, N.; Holohan, E.P. Estimation and validation of InSAR-derived surface displacements at temperate raised peatlands. Remote Sens. Environ. 2024, 311, 114232. [Google Scholar] [CrossRef]
  58. Jin, X.; Yang, W.; Gao, X.; Li, Z. Analysis and modeling of the complex dielectric constant of bound water with application in soil microwave remote sensing. Remote Sens. 2020, 12, 3544. [Google Scholar] [CrossRef]
  59. Tampuu, T.; Praks, J.; Uiboupin, R.; Kull, A. Long term interferometric temporal coherence and DInSAR phase in Northern Peatlands. Remote Sens. 2020, 12, 1566. [Google Scholar] [CrossRef]
  60. Wang, L.; Marzahn, P.; Bernier, M.; Ludwig, R. Sentinel-1 InSAR measurements of deformation over discontinuous permafrost terrain, Northern Quebec, Canada. Remote Sens. Environ. 2020, 248, 111965. [Google Scholar] [CrossRef]
  61. Bond, S.; Kirkby, M.J.; Johnston, J.; Crowle, A.; Holden, J. Seasonal vegetation and management influence overland flow velocity and roughness in upland grasslands. Hydrological Processes 2020, 34, 3777–3791. [Google Scholar] [CrossRef]
  62. Holden, J.; Kirkby, M.J.; Lane, S.N.; Milledge, D.G.; Brookes, C.J.; Holden, V.; McDonald, A.T. Overland flow velocity and roughness properties in peatlands. Water Res. Res. 2008, 44. [Google Scholar] [CrossRef]
  63. Fu, G.; Schmid, W.; Castellazzi, P. Understanding the Spatial Variability of the Relationship between InSAR-Derived Deformation and Groundwater Level Using Machine Learning. Geosciences 2023, 13, 133. [Google Scholar] [CrossRef]
  64. Price, J.S. Blanket bog in Newfoundland. Part 1. The occurrence and accumulation of fog-water deposits. J. Hydrol. 1992, 135, 87–101. [Google Scholar] [CrossRef]
Figure 1. Location of Knockfin Heights (left) and Munsary (right) subsites. Data were collected over between September 2017 and November 2018 by Marshall et al. [23]. Munsary is west of Knockfin Heights.
Remotesensing 17 03507 g001
Figure 2. Location of Munsary subsites (dots are shorter-term and triangles longer-term locations). Subsites 1 and 2 are close to each other with measurements for subsite 1 taken in a hollow and subsite 2 on a low ridge (as are subsites 3 and 4).
Remotesensing 17 03507 g002
Figure 3. Sites of a range of LULC in the Flow Country, Scotland.
Remotesensing 17 03507 g003
Figure 4. (a) Soil temperature and daily precipitation data for Munsary. (b) Soil temperature and daily precipitation data for Knockfin Heights. Data from Marshall [23].
Remotesensing 17 03507 g004
Figure 5. The strongest linear relationships occurred at Munsary subsite C, with these graphed for each of the water reductions with R-squared values. All use the 2-month rolling mean InSAR coherence and soil moisture data. (a) Original data. (b) Removed frozen soil. (c) Removed rain within 6 h (precipitation time). (d) Removed days with over 20 mm precipitation (precipitation amount). (e) Removed frozen soil and rain within 6 h. (f) Removed frozen soil and days with over 20 mm precipitation.
Remotesensing 17 03507 g005aRemotesensing 17 03507 g005b
Figure 6. The strongest linear relationship for soil moisture and water level at Knockfin Heights and Munsary with a rolling mean of 2 months when reducing the data by precipitation time. (a) Knockfin Heights subsite F soil moisture. (b) Munsary subsite C soil moisture. (c) Knockfin Heights subsite A water level. (d) Munsary subsite G water level.
Remotesensing 17 03507 g006
Figure 7. Temporal relationship between soil moisture and water level at Knockfin Heights and Munsary with a rolling mean of 2 months (reduced by precipitation time). (a) Knockfin Heights subsite F soil moisture. (b) Munsary subsite C soil moisture. (c) Knockfin Heights subsite A water level. (d) Munsary subsite G water level.
Remotesensing 17 03507 g007
Figure 8. Cross correlation between InSAR coherence data and precipitation, soil moisture and water level for Munsary subsite B with a rolling mean over 6 weeks where data were reduced by frozen soil and precipitation time. (a) InSAR coherence and Wick precipitation data. (b) InSAR coherence and local precipitation data. (c) InSAR coherence and soil moisture. (d) InSAR coherence and water level.
Remotesensing 17 03507 g008aRemotesensing 17 03507 g008b
Figure 9. InSAR coherence and water level over time with a rolling mean of one month. Blue stripes January–March, orange stripes July–September. (a) Munsary subsite 1. (b) Munsary subsite 2.
Remotesensing 17 03507 g009
Figure 10. (a) InSAR coherence and water level at Munsary subsite 1. (b) InSAR coherence and water level at Munsary subsite 2. (c) InSAR coherence and precipitation at Munsary subsite 1. (d) InSAR coherence and precipitation at Munsary subsite 2. Cross correlation between InSAR coherence data and water level/precipitation for Munsary subsite 1 (water level measurements were taken in a hollow) and Munsary subsite 2 (water level measurements were taken on a ridge).
Remotesensing 17 03507 g010
Figure 11. Cross correlation between InSAR coherence data and water level for Munsary subsite 1 (water level measurements were taken in a hollow rather than on a ridge). (a) Spring. (b) Summer. (c) Autumn. (d) Winter.
Remotesensing 17 03507 g011
Figure 12. The relationship between InSAR coherence and water level for each long-term site at Munsary for points months with a standard deviation of less than 0.5.
Remotesensing 17 03507 g012
Figure 13. The temporal relationship between 6-week rolling mean precipitation and InSAR coherence at Munsary subsite B.
Remotesensing 17 03507 g013
Table 1. Parameters for InSAR coherence data access and preprocessing.
Aspect of FocusParameter
PlatformSentinel 1
Beam ModeIW
Flight DirectionAscending
Relative Orbit132
GranuleSLC
Looks10 × 2
Apply water maskTrue
Table 2. Munsary (subsites A-G) and Knockfin Heights (subsites A-F) mean Pearson values for the relationships between InSAR coherence and soil moisture (SM) and water level (WL) using the overall data and rolling means over 1 month, 6 weeks and 2 months.
Rolling Mean Time ScaleNo Data RemovedPrecipitation TimePrecipitation AmountFrozen SoilFrozen Soil and Amount PrecipitationFrozen Soil and Precipitation Time
Munsary
SM: overall 0.75 ± 0.10 0.84 ± 0.08 0.75 ± 0.10 0.75 ± 0.16 0.75 ± 0.16 0.81 ± 0.11
SM: 2 mths 0.80 ± 0.09 0.88 ± 0.05 0.80 ± 0.09 0.80 ± 0.12 0.80 ± 0.12 0.84 ± 0.08
SM: 6 wks 0.75 ± 0.09 0.84 ± 0.08 0.75 ± 0.09 0.75 ± 0.15 0.75 ± 0.15 0.81 ± 0.12
SM: 1 mth 0.70 ± 0.11 0.80 ± 0.10 0.70 ± 0.11 0.69 ± 0.20 0.69 ± 0.20 0.77 ± 0.14
WL: overall 0.56 ± 0.08 0.63 ± 0.07 0.56 ± 0.08 0.50 ± 0.07 0.50 ± 0.07 0.55 ± 0.10
WL: 2 mths 0.62 ± 0.09 0.67 ± 0.05 0.62 ± 0.09 0.52 ± 0.09 0.52 ± 0.09 0.63 ± 0.08
WL: 6 wks 0.55 ± 0.06 0.66 ± 0.05 0.55 ± 0.06 0.51 ± 0.06 0.51 ± 0.06 0.58 ± 0.05
WL: 1 mth 0.51 ± 0.06 0.56 ± 0.05 0.51 ± 0.06 0.48 ± 0.06 0.48 ± 0.06 0.45 ± 0.06
Knockfin Heights
SM: overall 0.69 ± 0.10 0.78 ± 0.09 0.69 ± 0.10 0.72 ± 0.08 0.72 ± 0.08 0.71 ± 0.09
SM: 2 mths 0.73 ± 0.11 0.81 ± 0.10 0.73 ± 0.11 0.74 ± 0.07 0.74 ± 0.07 0.74 ± 0.08
SM: 6 wks 0.69 ± 0.10 0.77 ± 0.09 0.69 ± 0.10 0.70 ± 0.09 0.70 ± 0.09 0.71 ± 0.09
SM: 1 mth 0.66 ± 0.10 0.75 ± 0.09 0.66 ± 0.10 0.70 ± 0.09 0.70 ± 0.09 0.67 ± 0.10
WL: overall 0.36 ± 0.25 0.55 ± 0.14 0.36 ± 0.25 0.25 ± 0.20 0.25 ± 0.20 0.35 ± 0.14
WL: 2 mths 0.40 ± 0.29 0.62 ± 0.15 0.40 ± 0.29 0.30 ± 0.20 0.30 ± 0.20 0.41 ± 0.14
WL: 6 wks 0.37 ± 0.27 0.56 ± 0.12 0.37 ± 0.27 0.23 ± 0.20 0.23 ± 0.20 0.30 ± 0.13
WL: 1 mth 0.32 ± 0.26 0.49 ± 0.16 0.32 ± 0.26 0.21 ± 0.22 0.21 ± 0.22 0.32 ± 0.14
Table 3. Assessing for significant difference between Pearson outcomes (no data removed and precipitation time) at the more intact (Munsary) and degraded (Knockfin Heights) sites using corcor [56].
Variable 1rVariable 2rFisher’s zp-ValueSignificant
MUN SM ppt time0.88MUN SM no removal0.803.110.0018Yes
KH SM ppt time0.81KH SM no removal0.732.410.0160Yes
MUN WL ppt time0.67MUN WL no removal0.620.880.3799No
KH WL ppt time0.62KH WL no removal0.403.340.0008Yes
MUN SM ppt time0.88KH SM ppt time0.812.620.0087Yes
MUN SM ppt time0.88MUN WL ppt time0.675.340.0000Yes
MUN WL ppt time0.67KH WL ppt time0.620.820.4098No
KH WC ppt time0.81KH WL ppt time0.624.270.0000Yes
Table 4. Cross correlations for the 6-week rolling data for the different land cover, Knockfin Heights (KH) and Munsary (MUN) when applying different preprocessing. The Wick data are the Wick weather data, with temperature adjusted based on altitude; local data are the local weather data, soil moisture (SM) and water level (WL).
Location/DataNo Data RemovedPrecipitation TimePrecipitation AmountFrozen SoilFrozen Soil and Amount PrecipitationFrozen Soil and Precipitation Time
Whole area 0.86 ± 0.02 0.87 ± 0.02 0.87 ± 0.02 0.89 ± 0.02 0.89 ± 0.02 0.89 ± 0.02
KH Wick 0.87 ± 0.02 0.87 ± 0.02 0.87 ± 0.02 0.89 ± 0.02 0.89 ± 0.02 0.89 ± 0.02
KH local 0.78 ± 0.01 0.68 ± 0.04 0.78 ± 0.01 0.87 ± 0.01 0.87 ± 0.01 0.74 ± 0.04
KH SM 0.96 ± 0.03 0.95 ± 0.02 0.96 ± 0.01 0.96 ± 0.01 0.96 ± 0.01 0.94 ± 0.02
KH WL 0.89 ± 0.06 0.82 ± 0.06 0.89 ± 0.06 0.82 ± 0.10 0.82 ± 0.10 0.77 ± 0.10
MUN Wick 0.84 ± 0.02 0.84 ± 0.02 0.84 ± 0.02 0.87 ± 0.02 0.87 ± 0.02 0.87 ± 0.02
MUN local 0.81 ± 0.03 0.65 ± 0.04 0.81 ± 0.03 0.78 ± 0.03 0.78 ± 0.03 0.67 ± 0.04
MUN SM 0.97 ± 0.03 0.96 ± 0.05 0.97 ± 0.03 0.97 ± 0.03 0.97 ± 0.03 0.96 ± 0.04
MUN WL 0.88 ± 0.05 0.81 ± 0.03 0.88 ± 0.05 0.86 ± 0.05 0.86 ± 0.05 0.78 ± 0.03
Table 5. Cross correlation ranges between precipitation and InSAR Coherence for different land cover types across the Flow Country. Precipitation data from Wick and data removed based on whether the ground is frozen. Rolling mean of 6 weeks.
Site TypeCross Correlation Range
Buildings0.89–0.92
Drains0.83–0.93
Gulleys0.86–0.88
Peat (Forsinard)0.88–0.92
Peat (Knockfin Heights)0.86–0.92
Peat (Munsary)0.86–0.90
Plantations0.88–0.90
Pools0.86–0.89
Disclaimer/Publisher’s Note: The statements, opinions and data contained in all publications are solely those of the individual author(s) and contributor(s) and not of MDPI and/or the editor(s). MDPI and/or the editor(s) disclaim responsibility for any injury to people or property resulting from any ideas, methods, instructions or products referred to in the content.