Assessment and Validation of FAPAR, a Satellite-Based Plant Health and Water Stress Indicator, over Uganda
Highlights
- Monthly photosynthetic activity (FAPAR) over Uganda has been increasing, becoming highly variable and dominated by a moderate activity of 0.35–0.45 units.
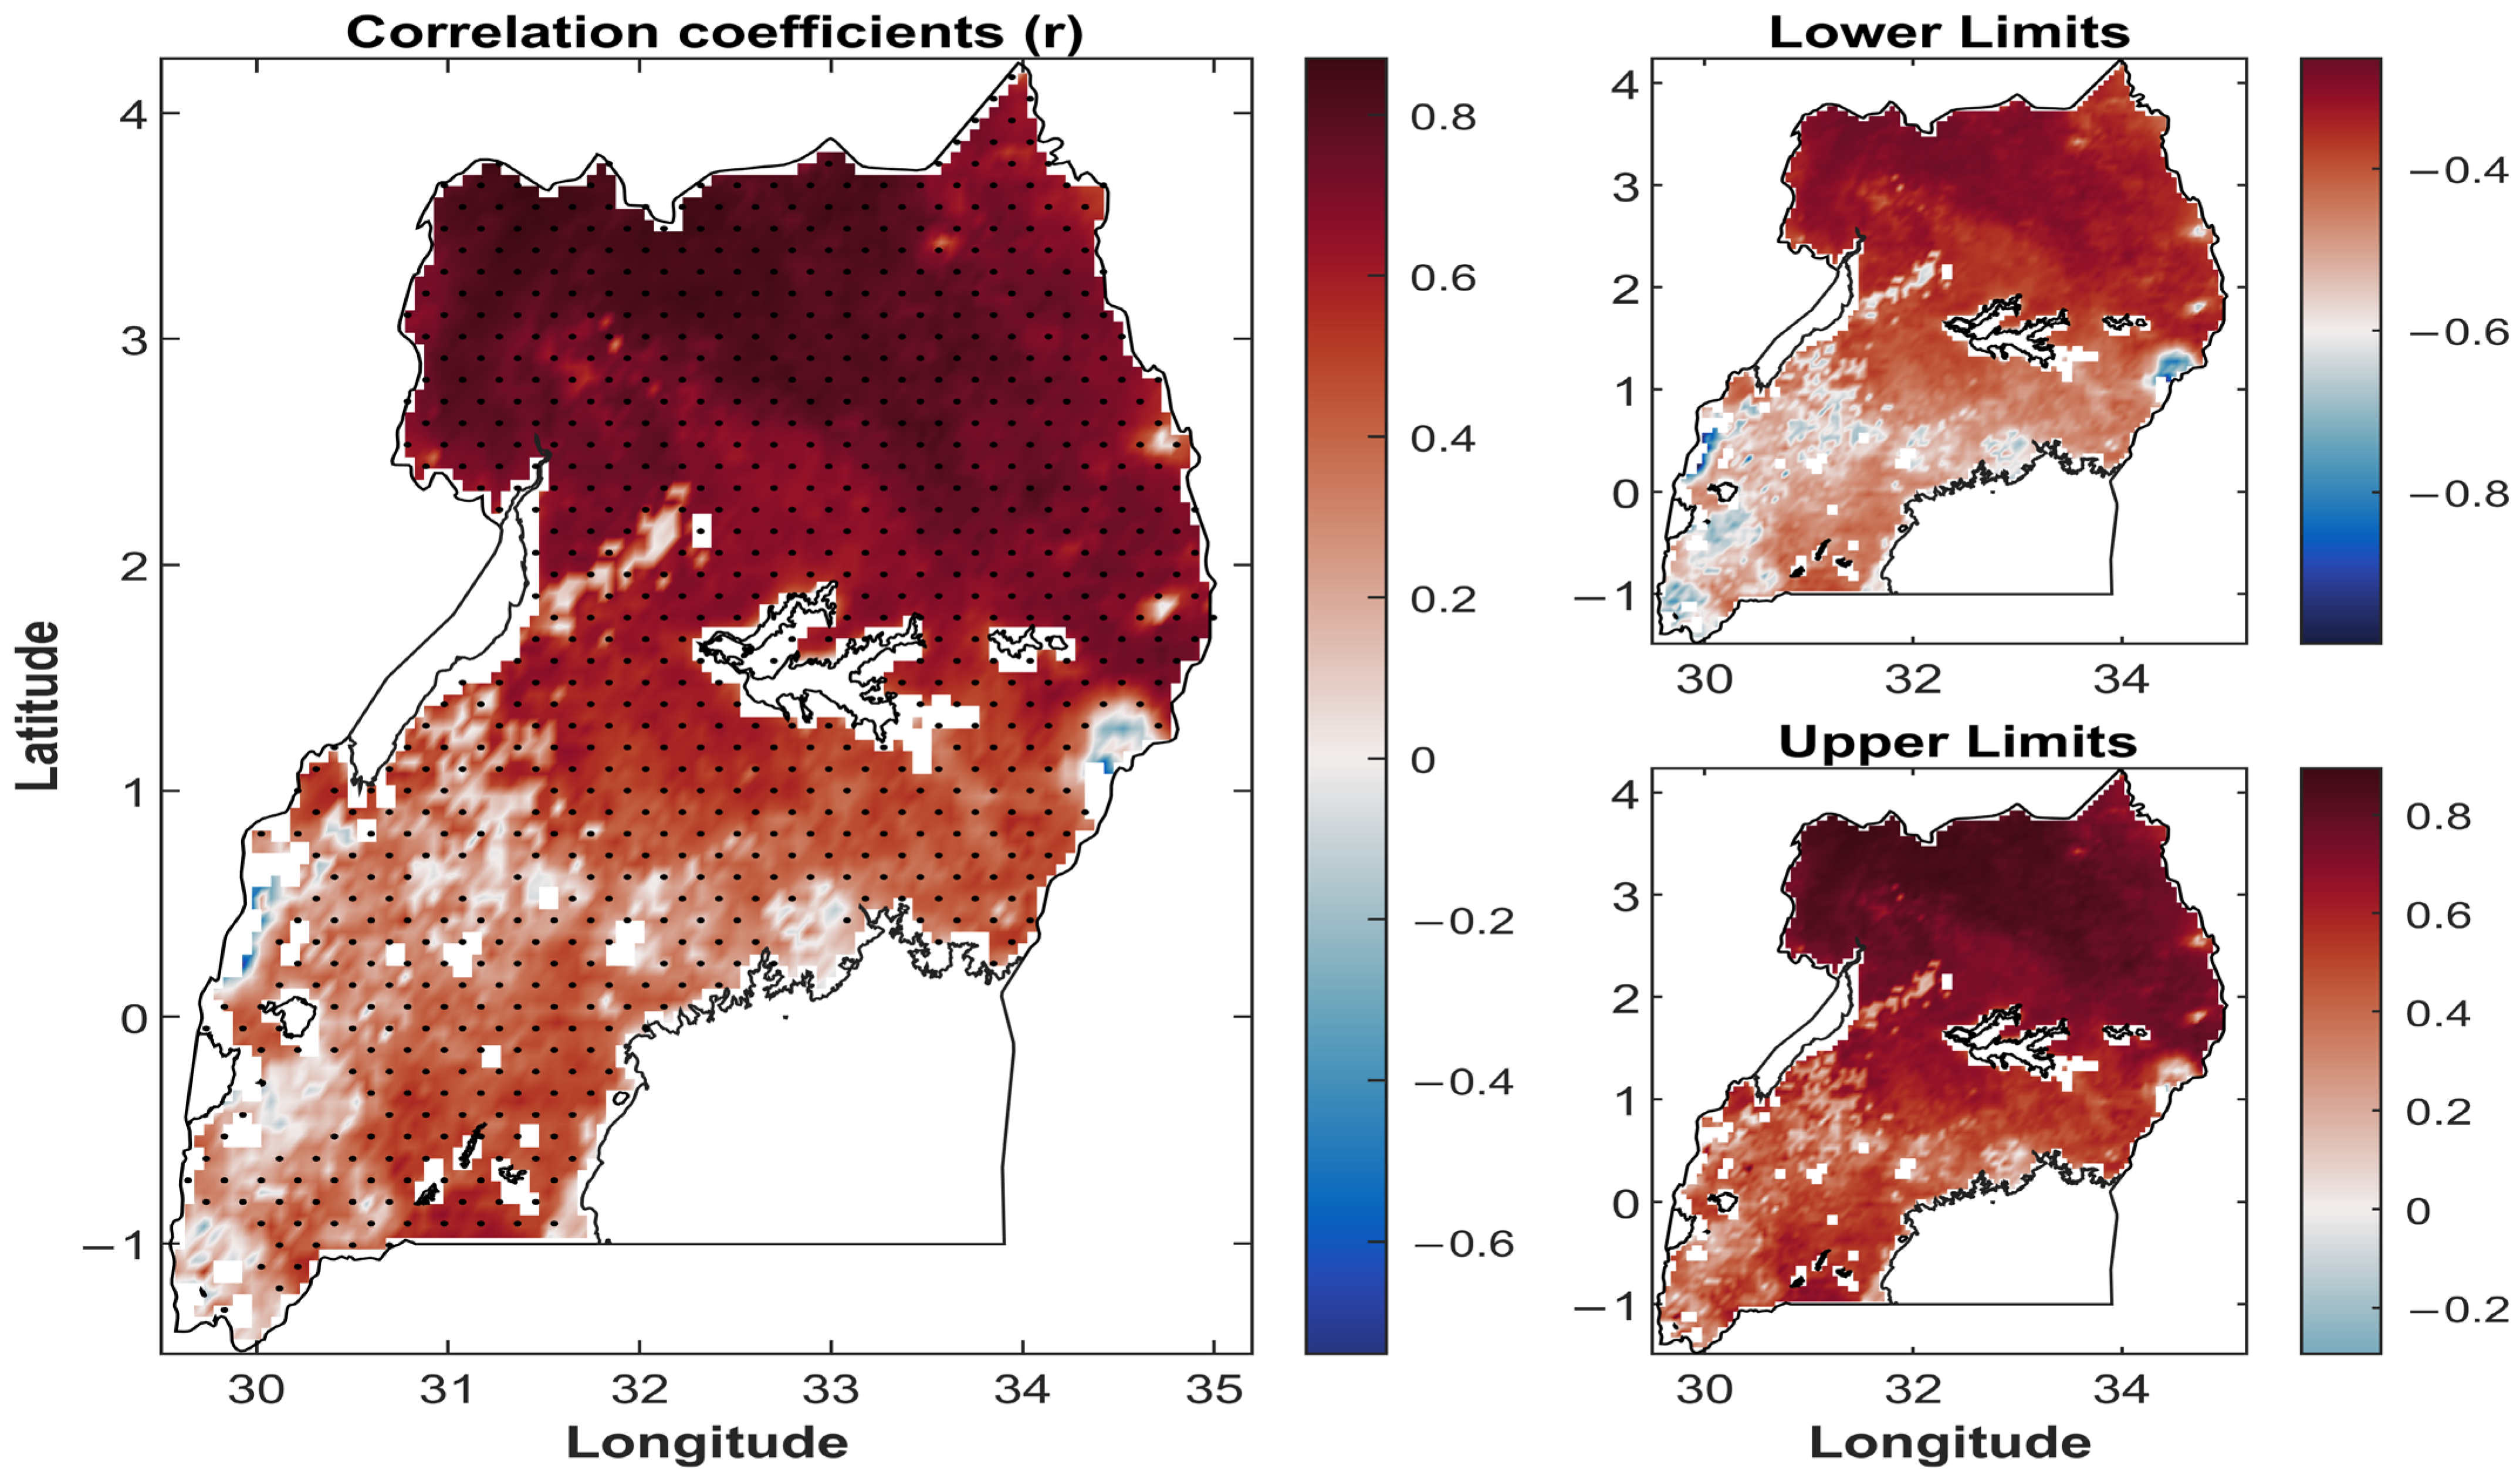
- The Standardized FAPAR Index (SFI) had strong positive and negative correlations with the scale 3 Standardized Precipitation and Evapotranspiration Index (SPEI-03) and crop water stress index (CWSI), respectively.
- The observed distribution and patterns of photosynthetic activity are jointly governed by precipitation, evapotranspiration, LULC, and teleconnections.
- Satellite-based FAPAR products can suitably track ecosystem functionality over Uganda, with an emphasis on water stress.
Abstract
1. Introduction
- (i)
- Explore the spatiotemporal variability of FAPAR of Uganda;
- (ii)
- Determine trends in FAPAR and FAPAR-centered stress indices (SFI > −1);
- (iii)
- Compare and indirectly validate FAPAR using the Standardized Precipitation and Evapotranspiration Index at scale 3 (SPEI-03) and crop water stress index (CWSI) over Uganda at high spatial resolutions to facilitate their smooth adoption in Uganda.
2. Description of Study Area
3. Data and Methods
3.1. Data Sources and Preprocessing
3.1.1. Data Acquisition
3.1.2. Computation of Standardized FAPAR Index (SFI), Scale-03 Standardized Precipitation and Evapotranspiration Index (SPEI-03), and Crop Water Stress Index (CWSI)
3.2. Data Analysis
3.2.1. Climatology and Variability Analysis
3.2.2. Non-Parametric Statistical Test for Trends in FAPAR and FAPAR-Centered Stress (SFI < −1)
3.2.3. Spatiotemporal Correlation Analysis
4. Results
4.1. FAPAR Climatology over Uganda (1983–2013)
4.2. Trend in FAPAR and FAPAR-Centered Stress Indices (SFI < −1) over Uganda (1983–2013)
4.3. Correlation Between Standardized FAPAR Index and Agricultural Drought Indicators
5. Discussions
5.1. Spatiotemporal Variability of FAPAR and FAPAR-Centered Stress Indices over Uganda
5.2. Performance of FAPAR in Drought and Plant Water Stress Monitoring
6. Conclusions
Supplementary Materials
Author Contributions
Funding
Data Availability Statement
Acknowledgments
Conflicts of Interest
References
- Qin, H.; Wang, C.; Zhao, K.; Xi, X. Estimation of the fraction of absorbed photosynthetically active radiation (fPAR) in maize canopies using LiDAR data and hyperspectral imagery. PLoS ONE 2018, 13, e0197510. [Google Scholar] [CrossRef]
- Cammalleri, C.; Verger, A.; Lacaze, R.; Vogt, J.V. Harmonization of GEOV2 fAPAR time series through MODIS data for global drought monitoring. Int. J. Appl. Earth Obs. Geoinf. 2019, 80, 1–12. [Google Scholar] [CrossRef]
- Liang, S.; Wang, J. Fraction of absorbed photosynthetically active radiation. In Advanced Remote Sensing, 2nd ed.; Liang, S., Wang, J., Eds.; Academic Press: Cambridge, MA, USA, 2020; pp. 447–476. [Google Scholar] [CrossRef]
- Copernicus European Drought Observatory (EDO). Edo Indicator Factsheet, Brussels, Belgium; 2023; pp. 1–5. Available online: https://edo.jrc.ec.europa.eu/ (accessed on 24 September 2025).
- Gitelson, A.A. Remote estimation of fraction of radiation absorbed by photosynthetically active vegetation: Generic algorithm for maize and soybean. Remote Sens. Lett. 2019, 10, 283–291. [Google Scholar] [CrossRef]
- Zhang, Y.; Hu, Z.; Wang, J.; Gao, X.; Yang, C.; Yang, F.; Wu, G. Temporal upscaling of MODIS instantaneous FAPAR improves forest gross primary productivity (GPP) simulation. Int. J. Appl. Earth Obs. Geoinf. 2023, 121, 103360. [Google Scholar] [CrossRef]
- Bayat, B.; Camacho, F.; Nickeson, J.; Cosh, M.; Bolten, J.; Vereecken, H.; Montzka, C. Toward operational validation systems for global satellite-based terrestrial essential climate variables. Int. J. Appl. Earth Obs. Geoinf. 2021, 95, 102240. [Google Scholar] [CrossRef]
- Oyana, T.; Kayendeke, E.; Adu-Prah, S. Assessing Performance of Leaf Area Index in a Monitored Mountain Ecosystem on Mount Elgon-Uganda. Int. J. Appl. Geospat. Res. 2017, 8, 64–80. [Google Scholar] [CrossRef][Green Version]
- Gobron, N. Fraction of Absorbed Photosynthetically Active Radiation by Green Vegetation. In Advanced Remote Sensing; Academic Press: Cambridge, MA, USA, 2012; pp. 383–414. [Google Scholar] [CrossRef]
- Gobron, N.; Marioni, M.; Robustelli, M.; Vermote, E. Can we use the QA4ECV black-sky fraction of absorbed photosynthetically active radiation (FAPAR) using AVHRR surface reflectance to assess terrestrial global change? Remote Sens. 2019, 11, 3055. [Google Scholar] [CrossRef]
- Claverie, M.; Matthews, J.L.; Vermote, E.F.; Justice, C.O. A 30+ year AVHRR LAI and FAPAR climate data record: Algorithm description and validation. Remote Sens. 2016, 8, 263. [Google Scholar] [CrossRef]
- Peng, J.; Muller, J.-P.; Blessing, S.; Giering, R.; Danne, O.; Gobron, N.; Kharbouche, S.; Ludwig, R.; Müller, B.; Leng, G.; et al. Can we use satellite-based FAPAR to detect drought? Sensors 2019, 19, 3662. [Google Scholar] [CrossRef]
- Ssembajwe, R.; Twah, A.; Nakabugo, R.; Katende, S.; Mulinde, C.; Ddumba, S.D.; Bamutaze, Y.; Voda, M. Wind and Humidity Nexus over Uganda in the Context of Past and Future Climate Volatility. Climate 2025, 13, 86. [Google Scholar] [CrossRef]
- Wang, N.; Jassogne, L.; van Asten, P.J.; Mukasa, D.; Wanyama, I.; Kagezi, G.; Giller, K.E. Evaluating coffee yield gaps and important biotic, abiotic, and management factors limiting coffee production in Uganda. Eur. J. Agron. 2015, 63, 1–11. [Google Scholar] [CrossRef]
- Basalirwa, C.P.K. Delineation of Uganda into climatological rainfall zones using the method of principal component analysis. Int. J. Climatol. 1995, 15, 1161–1177. [Google Scholar] [CrossRef]
- Mugume, I. Optimization of Numerical Models for Operational Weather. Ph.D. Thesis, Makerere University, Kampala, Uganda, 2018. [Google Scholar]
- Stanton, M.C.; Adriko, M.; Arinaitwe, M.; Howell, A.; Davies, J.; Allison, G.; LaCourse, E.J.; Muheki, E.; Kabatereine, N.B.; Stothard, J.R. Intestinal schistosomiasis in Uganda at high altitude (>1400m): Malacological and epidemiological surveys on Mount Elgon and in Fort Portal crater lakes reveal extra preventive chemotherapy needs. Infect. Dis. Poverty 2017, 6, 26–35. [Google Scholar] [CrossRef]
- Ssembajwe, R.; Mulinde, C.; Ddumba, S.D.; Kagezi, G.H.; Opio, R.; Kobusinge, J.; Mugagga, F.; Bamutaze, Y.; Gidudu, A.; Voda, M.; et al. Dynamics and associations of selected agrometeorological variables in Robusta growing regions of Uganda. Agric. Water Manag. 2025, 307, 109257. [Google Scholar] [CrossRef]
- Funk, C.; Rowland, J.; Eilerts, G.; White, L. A Climate Trend Analysis of Uganda; Famine Early Warning Systems Network—Informing Climate Change Adaptation Series 2012–3062; U.S. Geological Survey: Reston, VA, USA, 2012; Volume Fact Sheet, pp. 1–4. [Google Scholar]
- Karamage, F.; Zhang, C.; Liu, T.; Maganda, A.; Isabwe, A. Soil erosion risk assessment in Uganda. Forests 2017, 8, 52. [Google Scholar] [CrossRef]
- Land Cover Viewer: Eastern & Southern Africa; Regional Centre For Mapping Resource For Development: Nairobi, Kenya, 2014; Land Use, Land Cover Data.
- Abatzoglou, J.T.; Dobrowski, S.Z.; Parks, S.A.; Hegewisch, K.C. TerraClimate, a high-resolution global dataset of monthly climate and climatic water balance from 1958–2015. Sci. Data 2018, 5, 170191. [Google Scholar] [CrossRef]
- MATLABR2024a, The MathWorks Inc.: Natick, MA, USA, 2019. Available online: https://www.mathworks.com (accessed on 18 May 2025).
- Lehmann, R. 3σ-Rule for Outlier Detection from the Viewpoint of Geodetic Adjustment. J. Surv. Eng. 2013, 139, 157–165. [Google Scholar] [CrossRef]
- Greene, C.A.; Thirumalai, K.; Kearney, K.A.; Delgado, J.M.; Schwanghart, W.; Wolfenbarger, N.S.; Thyng, K.M.; Gwyther, D.E.; Gardner, A.S.; Blankenship, D.D. The Climate Data Toolbox for MATLAB. Geochem. Geophys. Geosyst. 2019, 20, 3774–3781. [Google Scholar] [CrossRef]
- Jones, P.W. First- and Second-Order Conservative Remapping Schemes for Grids in Spherical Coordinates. Mon. Weather Rev. 1999, 127, 2204–2210. [Google Scholar] [CrossRef]
- Zhang, Y.; Chen, H.; Fu, S. Improvement to Patched Grid Technique with High-Order Conservative Remapping Method. J. Aircr. 2011, 48, 884–893. [Google Scholar] [CrossRef]
- Schulzweida, U. CDO User Guide; Version 2.3.0; Zenodo: Geneva, Switzerland, 2023. [Google Scholar] [CrossRef]
- Gebrehiwot, T.; van der Veen, A.; Maathuis, B. Spatial and temporal assessment of drought in the Northern highlands of Ethiopia. Int. J. Appl. Earth Obs. Geoinf. 2011, 13, 309–321. [Google Scholar] [CrossRef]
- WMO. Standardized Precipitation Index User Guide No. 1090; WMO: Geneva, Switzerland, 2012. [Google Scholar]
- Wu, W.; Li, R.; Shao, J. Assessment of Regional Spatiotemporal Variations in Drought from the Perspective of Soil Moisture in Guangxi, China. Water 2022, 14, 289. [Google Scholar] [CrossRef]
- Vicente-Serrano, S.M.; Beguería, S.; López-Moreno, J.I. A Multiscalar Drought Index Sensitive to Global Warming: The Standardized Precipitation Evapotranspiration Index. J. Clim. 2010, 23, 1696–1718. [Google Scholar] [CrossRef]
- Ssembajwe, R.; Nguefack, J.; Mezafack, K.L.; Kagezi, G.H.; Gidudu, A.; Arinaitwe, G.; Voda, M. Spatiotemporal dynamics and drivers of agricultural droughts in the agroecological zones of Cameroon. Int. J. Appl. Earth Obs. Geoinf. 2025, 140, 104581. [Google Scholar] [CrossRef]
- Jackson, R.D.; Idso, S.B.; Reginato, R.J.; Pinter, P.J. Canopy temperature as a crop water stress indicator. Water Resour. Res. 1981, 17, 1133–1138. [Google Scholar] [CrossRef]
- Adams, R.P. K-Means Clustering and Related Algorithms; Princeton University: Princeton, NJ, USA, 2018; pp. 1–18. [Google Scholar]
- Yue, S.; Wang, C. The Mann-Kendall Test Modified by Effective Sample Size to Detect Trend in Serially Correlated Hydrological Series. Water Resour. Manag. 2004, 18, 201–218. [Google Scholar] [CrossRef]
- Alashan, S. Combination of modified Mann-Kendall method and Şen innovative trend analysis. Eng. Rep. 2020, 2, e12131. [Google Scholar] [CrossRef]
- Tabari, H.; Marofi, S.; Aeini, A.; Hosseinzadeh, P.; Mohammadi, K. Trend analysis of reference evapotranspiration in the western half of Iran. Agric. For. Meteorol. 2011, 152, 128–136. [Google Scholar] [CrossRef]
- He, Q.; Wang, M.; Liu, K.; Li, K.; Jiang, Z. GPRChinaTemp1km: A high-resolution monthly air temperature data set for China (1951–2020) based on machine learning. Earth Syst. Sci. Data 2022, 14, 3273–3292. [Google Scholar] [CrossRef]
- Burkey, J. A Non-Parametric Monotonic Trend Test Computing Mann-Kendall Tau, Tau-b, and Sen’s Slope Written in Mathworks-MATLAB Implemented Using Matrix Rotations; Department of Natural Resources and Parks, Science and Technical Services section: Seattle, DC, USA, 2006; Available online: http://www.mathworks.com/matlabcentral/fileexchange/authors/23983 (accessed on 24 September 2025).
- Welz, T.; Doebler, P.; Pauly, M. Fisher transformation based confidence intervals of correlations in fixed- and random-effects meta-analysis. Br. J. Math. Stat. Psychol. 2022, 75, 1–22. [Google Scholar] [CrossRef]
- Mohapatra, S.; Weisshaar, J.C. Modified Pearson correlation coefficient for two-color imaging in spherocylindrical cells. BMC Bioinform. 2018, 19, 428. [Google Scholar] [CrossRef]
- Nsubuga, F.W.; Rautenbach, H. Climate change and variability: A review of what is known and ought to be known for Uganda. Int. J. Clim. Change Strateg. Manag. 2018, 10, 752–771. [Google Scholar] [CrossRef]
- Nsubuga, F.N.W.; Olwoch, J.M.; de Rautenbach, C.J.W.; Botai, O.J. Analysis of mid-twentieth century rainfall trends and variability over southwestern Uganda. Theor. Appl. Climatol. 2014, 115, 53–71. [Google Scholar] [CrossRef]
- Majaliwa, J.G.M.; Tenywa, M.M.; Bamanya, D.; Majugu, W.; Isabirye, P.; Nandozi, C.; Nampijja, J.; Musinguzi, P.; Nimusiima, A.; Sridher, G.; et al. Characterization of Historical Seasonal and Annual Rainfall and Temperature Trends in Selected Climatological Homogenous Rainfall Zones of Uganda. Glob. J. Sci. Res. 2015, 15, 21–40. [Google Scholar]
- Kalisa, W.; Igbawua, T.; Henchiri, M.; Ali, S.; Zhang, S.; Bai, Y.; Zhang, J. Assessment of climate impact on vegetation dynamics over East Africa from 1982 to 2015. Sci. Rep. 2019, 9, 16865. [Google Scholar] [CrossRef]
- Luwa, J.K.; Bamutaze, Y.; Mwanjalolo, J.G.M.; Waiswa, D.; Pilesjö, P.; Mukengere, E.B. Impacts of land use and land cover change in response to different driving forces in Uganda: Evidence from a review. Afr. Geogr. Rev. 2021, 40, 378–394. [Google Scholar] [CrossRef]
- Irish Aid. Uganda Climate Action Report for 2016. Resilience and Economic Inclusion Team, pp. 1–12, 2016. Available online: https://www.irishaid.ie/media/irishaidpublications/UGA-Country-Climate-Action-Reports-Uganda-2015.pdf (accessed on 25 March 2025).
- Dusenge, M.E.; Duarte, A.G.; Way, D.A. Plant carbon metabolism and climate change: Elevated CO2 and temperature impacts on photosynthesis, photorespiration and respiration. New Phytol. 2019, 221, 32–49. [Google Scholar] [CrossRef] [PubMed]
- Fathurrahman, F. Effects of Carbon Dioxide Concentration on the Growth and Physiology of Albizia saman (Jacq.) Merr. J. Ecol. Eng. 2023, 24, 302–311. [Google Scholar] [CrossRef]
- Wang, S.; Zhang, Y.; Ju, W.; Chen, J.M.; Ciais, P. Recent global decline of CO2 fertilization effects on vegetation photosynthesis. Science 2020, 370, 1295–1300. [Google Scholar] [CrossRef]
- Kaminski, T.; Knorr, W.; Scholze, M.; Gobron, N.; Pinty, B.; Giering, R.; Mathieu, P.P. Consistent assimilation of MERIS FAPAR and atmospheric CO2 into a terrestrial vegetation model and interactive mission benefit analysis. Biogeosciences 2012, 9, 3173–3184. [Google Scholar] [CrossRef]
- Hackländer, J.; Parente, L.; Ho, Y.F.; Hengl, T.; Simoes, R.; Consoli, D.; Şahin, M.; Tian, X.; Jung, M.; Wheeler, I.; et al. Land potential assessment and trend-analysis using 2000–2021 FAPAR monthly time-series at 250 m spatial resolution. PeerJ 2024, 12, e16972. [Google Scholar] [CrossRef]
- Ogwang, J.I. Explore the Dynamics of Land-Use Changes and Its Impacts on Land Surface Temperature in Greater Kampala Metropolitan Area. Ph.D. Thesis, Makerere University, Kampala, Uganda, 2021. [Google Scholar]
- Barón, M.; Flexas, J.; Delucia, E.H. Photosynthetic responses to biotic stress. In Terrestrial Photosynthesis in a Changing Environment a Molecular, Physiological and Ecological Approach; Cambridge University Press: Cambridge, UK, 2011; pp. 331–350. [Google Scholar] [CrossRef]
- Bilgin, D.D.; Zavala, J.A.; Zhu, J.; Clough, S.J.; Ort, D.R.; Delucia, E.H. Biotic stress globally downregulates photosynthesis genes. Plant Cell Environ. 2010, 33, 1597–1613. [Google Scholar] [CrossRef] [PubMed]
- Vats, S. Biotic and Abiotic Stress Tolerance in Plants; Springer: Singapore, 2018; pp. 1–367. [Google Scholar] [CrossRef]
- Tushemereirwe, W.; Bagabe, M. Review of disease distribution and pest status in Africa. In Mobilizing IPM for Sustainable Banana Production in Africa; International Plant Genetic Resources Institute: Rome, Italy, 1999; pp. 139–147. [Google Scholar]
- Roux, J.; Coutinho, T.A.; Byabashaija, D.M.; Wingfield, M.J. Diseases of plantation Eucalyptus in Uganda. S. Afr. J. Sci. 2001, 97, 16–18. [Google Scholar]
- Mulema, J.; Nankinga, C.; Kagorora, J.P.K.; Tusiime, G.; Amayo, R.; Chemonges, M.; Gumisiriya, C.; Kato, F.; Kigongo, B.M.; Ochwo-Ssemakula, M.; et al. Prioritising non-native pest species to inform plant health biosecurity policy decisions and to safeguard agriculture, forestry, biodiversity, and livelihoods in Uganda. Front. Agron. 2025, 7, 1601845. [Google Scholar] [CrossRef]
- Magara, G.; Okrah, A.; Yao, Y.I.S.; Yeboah, E.; Darko, G.; Akimana, D.; Awuku, V.; Quist, I.; Sarfo, I. A Quantitative Assessment of Drought Trends in Uganda Using Statistical Models for Hydrological Indicators. Int. J. Environ. Clim. Change 2025, 15, 517–537. [Google Scholar] [CrossRef]
- Landmann, T.; Dubovyk, O. Mapping Vegetation Productivity Dynamics And Degradation Trends Over East Africa Using A Decade Of Medium Resolution Modis Time-Series Data. In Proceedings of the 2013 IEEE International Geoscience and Remote Sensing Symposium-IGARSS, Melbourne, Australia, 21–26 July 2013; pp. 1801–1804. [Google Scholar]
- Rossi, S.; Weissteiner, C.; Laguardia, G.; Kurnik, B.; Robustelli, M.; Niemeyer, S.; Gobron, N. Potential of MERIS fAPAR for drought detection. In Proceedings of the 2nd MERIS/(A)ATSR User Workshop, Frascati, Italy, 22–26 September 2008; Volume 2008. [Google Scholar]
- Beguería, S.; Vicente-Serrano, S.M.; Reig, F.; Latorre, B. Standardized precipitation evapotranspiration index (SPEI) revisited: Parameter fitting, evapotranspiration models, tools, datasets and drought monitoring. Int. J. Climatol. 2014, 34, 3001–3023. [Google Scholar] [CrossRef]
- Cammalleri, C.; McCormick, N.; Toreti, A. Analysis of the relationship between yield in cereals and remotely sensed fAPAR in the framework of monitoring drought impacts in Europe. Nat. Hazards Earth Syst. Sci. 2022, 22, 3737–3750. [Google Scholar] [CrossRef]
- Wen, W.; Timmermans, J.; Chen, Q.; Van Bodegom, P.M. Monitoring the combined effects of drought and salinity stress on crops using remote sensing in the Netherlands. Hydrol. Earth Syst. Sci. 2022, 26, 4537–4552. [Google Scholar] [CrossRef]
- Shahmohammadi, A.; Rolle, M.; Tamea, S. Vegetation Indices for plant water stress detection from satellite imagery. In Return Dissemination Workshop 1–2 February; Zenodo: Geneva, Switzerland, 2024; pp. 73–75. [Google Scholar] [CrossRef]
- Hedberg, O. Altitudinal zonation of the vegetation on the east african mountains. Proc. Linn. Soc. Lond. 1955, 165, 134–136. [Google Scholar] [CrossRef]
- Soto, G.E.; Wilcox, S.W.; Clark, P.E.; Fava, F.P.; Jensen, N.D. Mapping rangeland health indicators in eastern Africa from 2000 to 2022. Earth Syst. Sci. Data 2024, 16, 5375–5404. [Google Scholar] [CrossRef]
- Verrelst, J.; Halabuk, A.; Atzberger, C.; Hank, T.; Steinhauser, S.; Berger, K. A comprehensive survey on quantifying non-photosynthetic vegetation cover and biomass from imaging spectroscopy. Ecol. Indic. 2023, 155, 110911. [Google Scholar] [CrossRef]
- Xu, D.; An, D.; Guo, X. The Impact of Non-Photosynthetic Vegetation on LAI Estimation by NDVI in Mixed Grassland. Remote Sens. 2020, 12, 1979. [Google Scholar] [CrossRef]

| Variable | Temporal | Spatial | Period | Notes | Reference |
|---|---|---|---|---|---|
| FAPAR | Daily | ~5 km | 1983–2013 | Directly sourced from NOAA-CDR | [11] |
| SPEI-03 | Monthly | ~4 km | 1983–2013 | Computed from precipitation and potential evapotranspiration data | [22,34] |
| CWSI | Monthly | ~4 km | 1983–2013 | Computed from actual and potential evapotranspiration data | [22,34] |
Disclaimer/Publisher’s Note: The statements, opinions and data contained in all publications are solely those of the individual author(s) and contributor(s) and not of MDPI and/or the editor(s). MDPI and/or the editor(s) disclaim responsibility for any injury to people or property resulting from any ideas, methods, instructions or products referred to in the content. |
© 2025 by the authors. Licensee MDPI, Basel, Switzerland. This article is an open access article distributed under the terms and conditions of the Creative Commons Attribution (CC BY) license (https://creativecommons.org/licenses/by/4.0/).
Share and Cite
Ssembajwe, R.; Twah, A.; Kagezi, G.H.; Löytty, T.; Kobusinge, J.; Gidudu, A.; Arinaitwe, G.; Du, Q.; Voda, M. Assessment and Validation of FAPAR, a Satellite-Based Plant Health and Water Stress Indicator, over Uganda. Remote Sens. 2025, 17, 3501. https://doi.org/10.3390/rs17203501
Ssembajwe R, Twah A, Kagezi GH, Löytty T, Kobusinge J, Gidudu A, Arinaitwe G, Du Q, Voda M. Assessment and Validation of FAPAR, a Satellite-Based Plant Health and Water Stress Indicator, over Uganda. Remote Sensing. 2025; 17(20):3501. https://doi.org/10.3390/rs17203501
Chicago/Turabian StyleSsembajwe, Ronald, Amina Twah, Godfrey H. Kagezi, Tuula Löytty, Judith Kobusinge, Anthony Gidudu, Geoffrey Arinaitwe, Qingyun Du, and Mihai Voda. 2025. "Assessment and Validation of FAPAR, a Satellite-Based Plant Health and Water Stress Indicator, over Uganda" Remote Sensing 17, no. 20: 3501. https://doi.org/10.3390/rs17203501
APA StyleSsembajwe, R., Twah, A., Kagezi, G. H., Löytty, T., Kobusinge, J., Gidudu, A., Arinaitwe, G., Du, Q., & Voda, M. (2025). Assessment and Validation of FAPAR, a Satellite-Based Plant Health and Water Stress Indicator, over Uganda. Remote Sensing, 17(20), 3501. https://doi.org/10.3390/rs17203501


