Article

Remote Sensing and AI Coupled Approach for Large-Scale Archaeological Mapping in the Andean Arid Highlands: Case Study in Altos Arica, Chile

by
Maria Elena Castiello
1,2,*,
Jürgen Landauer
3 and
Thibault Saintenoy
2,4
1
Institute d’Archéologie et de Sciences de l’Antiquité, University of Lausanne, CH-1015 Lausanne, Switzerland
2
Institute of Heritage Sciences, Spanish National Research Council (INCIPIT-CSIC), 15707 Santiago de Compostela, Spain
3
Landauer Research, 71642 Ludwigsburg, Germany
4
Département des Lettres et Sciences Humaines, Université des Antilles, 97275 Schœlcher Cedex, Martinique, France
*
Author to whom correspondence should be addressed.
Remote Sens. 2025, 17(20), 3499; https://doi.org/10.3390/rs17203499
Submission received: 4 September 2025 / Revised: 13 October 2025 / Accepted: 16 October 2025 / Published: 21 October 2025

Abstract

Highlights

What are the main findings?
  • CNN-based detection proves effective in identifying archaeological structures like roundhouses and corrals in the Azapa Valley of Chilean highlands, even with limited training data.
  • Integrating high-resolution satellite imagery with AI enables efficient large scale archaeological mapping across rugged and hard-to-access terrain.
What are the implications of the main findings?
  • GeoAI tools help reveal and elevate lesser-known archaeological sites and fostering the “heritagization” process of shared cultural landscapes in Bolivia, Chile, and Peru.
  • This method offers a scalable foundation for heritage protection and landscape management, with strong potential for applications in similarly challenging regions worldwide.

Abstract

Artificial intelligence algorithms for automated archaeological site detection have been scarcely applied in the Andean highlands, regions that preserve a significant amount of surface archaeological architecture but have not yet been fully explored or mapped due to the difficult terrain. This paper presents a case study of the application of convolutional neural networks (CNNs) to automatically identify archaeological architecture in the Azapa valley in the Arica y Parinacota region of Chile. Using a high-resolution and big regional-scale archaeological geodatabase created through a systematic and detailed photo-interpretation survey of satellite imagery and fieldwork, our study demonstrates the efficiency of CNN-based automated detection in identifying archaeological stone structures such as roundhouses and corrals in the Chilean highlands. After outlining the technical protocol for automated detection, we present the results and discuss the potential of our AI model for archaeological mapping in arid highland environments, from a regional to a more extended and global perspective.

1. Introduction

The Andes Mountain range, the longest on Earth, extends over 7000 km and plays a fundamental role in shaping the region’s environmental, cultural, and socioeconomic fabric [1]. Its ecological and geological diversity is matched by its cultural richness, with indigenous groups such as the Quechua, Aymara, and Mapuche preserving vibrant traditions that reflect the Andes’ multifaceted history [2]. In particular, the highland regions of the South-Central Andes, like Arica y Parinacota in northern Chile, that lay between 3000 and 6000 m a.s.l., preserve abundant remains from their pre-Hispanic populations, including residential buildings, agro-pastoral infrastructures, sophisticated water management systems and the Inca Road network (known as Qhapaq Ñan [3,4]). These archaeological features, consisting of dry stone architecture, are still visible today on aerial imagery, especially from planes, UAVs (drones) and high-resolution satellite imagery. However, much of the region remains poorly studied compared to other areas, such as the Peruvian [5] or Argentinian Andes [6].

1.1. Remote Sensing and AI in Archaeology

Over the last two decades, the growing availability of very high-resolution satellite imagery in accessible repositories such as Google Earth has significantly advanced archaeological mapping efforts [7,8,9]. Argyrou and Agapiou [10] provide a comprehensive synthesis of AI-driven approaches in archaeological Remote Sensing (RS), emphasizing the scalability and adaptability of Artificial Intelligence (AI) and Deep Learning (DL) methodologies across diverse geomorphological and cultural settings.
Automated methods, particularly those employing techniques like Convolutional Neural Networks (CNNs), have emerged as vital tools for identifying archaeological remains at larger scales. During their early development, these techniques succeeded in detecting relatively simple geometric shapes such as burial mounds or charcoal kilns over small areas. Then, ref. [11] systematically benchmarked Mask R-CNN and U-Net architectures for archaeological object detection on LiDAR-derived datasets, introducing evaluation metrics adapted to the specific spatial and morphological challenges of cultural-heritage data. Recent advances now enable the detection of complex structures, such as agricultural fields and hollow roads over broader, more heterogeneous environments. For example, studies by [12,13,14] presented the application of CNNs in detecting intricate archaeological features across different landscapes, ranging from Irish ringforts to burial mounds and stone walls. However, the automated identification of composite structures, such as Roman villas and hillforts, remains challenging due to their variability in shape and appearance [15]. Various investigations have further expanded the scale and scope of applications [16,17,18,19,20,21,22,23,24]. Landauer et al. [25] have developed a DL-based model to assist archaeological work in mapping the landscapes of Khmer-era Cambodia. Bundzel et al. [26] utilized DL models to identify Mayan structures in Guatemala across an area of 2144 km2, while [27] combined Random Forest and YOLOv3 to detect burial mounds in Spain’s Galicia region over a vast 30,000 km2. A study on hillfort detection using DL across Europe by [28] spans a total of 180,000 km2. These innovations highlight the growing capability of AI in addressing the “Big Data” challenge by automating large-scale archaeological surveys.

1.2. Applications in Andean Arid Highlands

In the Andes, ref. [29] highlight the value of integrating remote sensing with archaeology to study human–environment interactions in arid landscapes. By combining Landsat 8 image and GIS analysis with field surveys, the authors identified prehistoric chert (toolstone) sources in Chile’s Atacama Desert, an area used by hunter–gatherer groups 11,500–1500 years ago; Ref. [30] underscored the analytical power of multisensor RS by combining UAV photogrammetry, satellite imagery, and digital elevation models to reconstruct the Cutamalla terrace system in Peru, refining interpretations of pre-Hispanic agricultural landscapes; Ref. [31] exemplified the integration of AI-based image classification with high-resolution aerial surveys in the Nazca Pampa, southern Peru, employing a convolutional neural network-driven detection pipeline that enabled the discovery and field verification of over three hundred previously undocumented geoglyphs. In parallel, ref. [32] implemented diffusion and transformer-based models for water-body segmentation in the high Andean regions of Peru, demonstrating the applicability of state-of-the-art architectures in complex mountainous terrains. A more recent work by [33] presents an attempt of developing a vision foundation model for multi-spectral remote sensing data of Peru, utilizing SOTA DINOv2 framework. Along with other programs, such as those developed by [5,34,35], these studies aim to understand settlement pattern and human adaptation phenomena with AI-based methodologies.

1.3. Research Gaps

Despite these significant methodological and regional advances, applications of DL to archaeological site detection in Chilean highlands remain scarce. Many sites in northern Chile have been discovered by accident rather than through systematic exploration [36]. This imbalance reflects both the uneven availability of annotated training data and the challenges posed by the diverse geomorphological and spectral characteristics of Andean landscapes. The region’s difficult terrain makes traditional archaeological surveys and post-processing work highly labor-intensive and time-consuming. The manual inspection of aerial imagery is both costly and resource-intensive [37]. Research on such topics is scattered across subregions and disciplines [35], complicating efforts to consolidate findings, to generate structured archaeological maps and datasets and develop standard protocols for photointerpretation and geospatial recording. Furthermore, archaeological research in northern Chile often competes for funding with studies in more densely populated and politically prioritized areas [38,39]. Thus, despite the cultural wealth, the northern Chilean Andes remain poorly mapped and the archaeological landscapes highly vulnerable to anthropogenic and climatic pressures such as natural erosion [40,41,42,43].
These gaps are particularly urgent as Andean archaeological heritage faces increasing threats from climate change, expanding agricultural frontiers and mining activities, which recently have heavily impacted or destroyed sites that were significant to both scientific research and local and indigenous communities [44]. Finally, we can observe that mountain areas globally are undergoing shifts in land use driven by a combination of physical, demographic, and sociocultural urbanization factors. With their wealth of natural and cultural assets, tourism development and the rise of “touristification” have become one of the significant forces behind urban growth. These processes are not only transforming the valley floors but are now extending to the highest peaks, posing fresh challenges for sustainability that planners and policymakers must address [45]. This underscores the urgent need to document, preserve, and analyze those invaluable archaeological resources with the most efficient and advanced methods. Addressing this gap requires the integration of high-resolution remote sensing datasets, domain-adapted convolutional architectures, and robust validation frameworks grounded in archaeological field data.
Here, we apply a CNN-based approach to automate the detection of pre-Hispanic structures over a 190 km2 area in the Azapa valley in the Arica y Parinacota region of Chile. We present a case study on the automatic detection of an object class that has not previously been the subject of automated search. The task is particularly challenging due to (a) the high variability in object shape, including frequent partial overlaps, and (b) the varying degrees of structural decay. Building on a new high-precision geospatial archaeological dataset, derived from systematic photointerpretation of high-resolution satellite imagery (WorldView-2 by DigitalGlobe), this study introduces a clear workflow to identify archaeological features and validate results through ground-truthing. The study area represents an ideal testing ground for the proposed AI-based method, as the available satellite data are virtually free of occlusions, with no cloud cover and minimal vegetation. By focusing on Inca and Pre-Inca circular structures, the methodology provides critical tools for advancing the mapping, analysis, and thus fostering the preservation of this region’s cultural heritage.
The aim of our study is to (a) present a new case study, from a rarely studied region of the Andes, where automated detection has the potential to significantly advance the understanding of archaeological remains at a landscape-wide scale; (b) develop and apply a DL-RS approach to create comprehensive records of circular architectural features, thereby filling the gap of scarce geospatial databases in the Chilean Andes; (c) evaluate the efficacy of a neural network model trained with limited data, demonstrating that an AI-based system can achieve high accuracy in detecting archaeological features; (d) validate the methodology through ground-truthing and demonstrate its utility in terrains that are difficult to access (desertic and of very high altitude); (e) highlight a cultural heritage common to three modern-day countries (Bolivia, Chile and Peru) and promote “heritagization” processes by providing critical tools for advancing the mapping, analysis, and thus fostering the preservation of this cultural heritage.

1.4. Altos de Arica Case Study

Altos de Arica, an arid elevated area situated in the northern part of Chile, serves as the surrounding desert landscape of the Azapa valley in the Arica y Parinacota region. This area holds significant archaeological value, owing to its distinctive characteristics and the extensive temporal span of over 10,000 years of human history it encapsulates. Such material legacy shed light on the cultural, ceremonial and economic practices of pre-Columbian societies living in this region [46,47,48,49,50]. The study area is marked by the resilience and the evolution of cultural practices in a challenging desert environment: From the early societies of the archaic period (ca. 7th millennium BCE), associated with the Chinchorro mummies, to the Tiwanaku cultural influence (6th–10th CE), a highland empire centered near Lake Titicaca, that introduced distinctive pottery and advances in agricultural techniques which furthermore transformed the valley into a fertile agricultural zone [51], to the Inca expansion (15th–16th centuries CE), which numerous geoglyphs and complex road network reflect the incorporation of the area into the administrative, commercial and religious system of the Inca Empire [52,53,54].
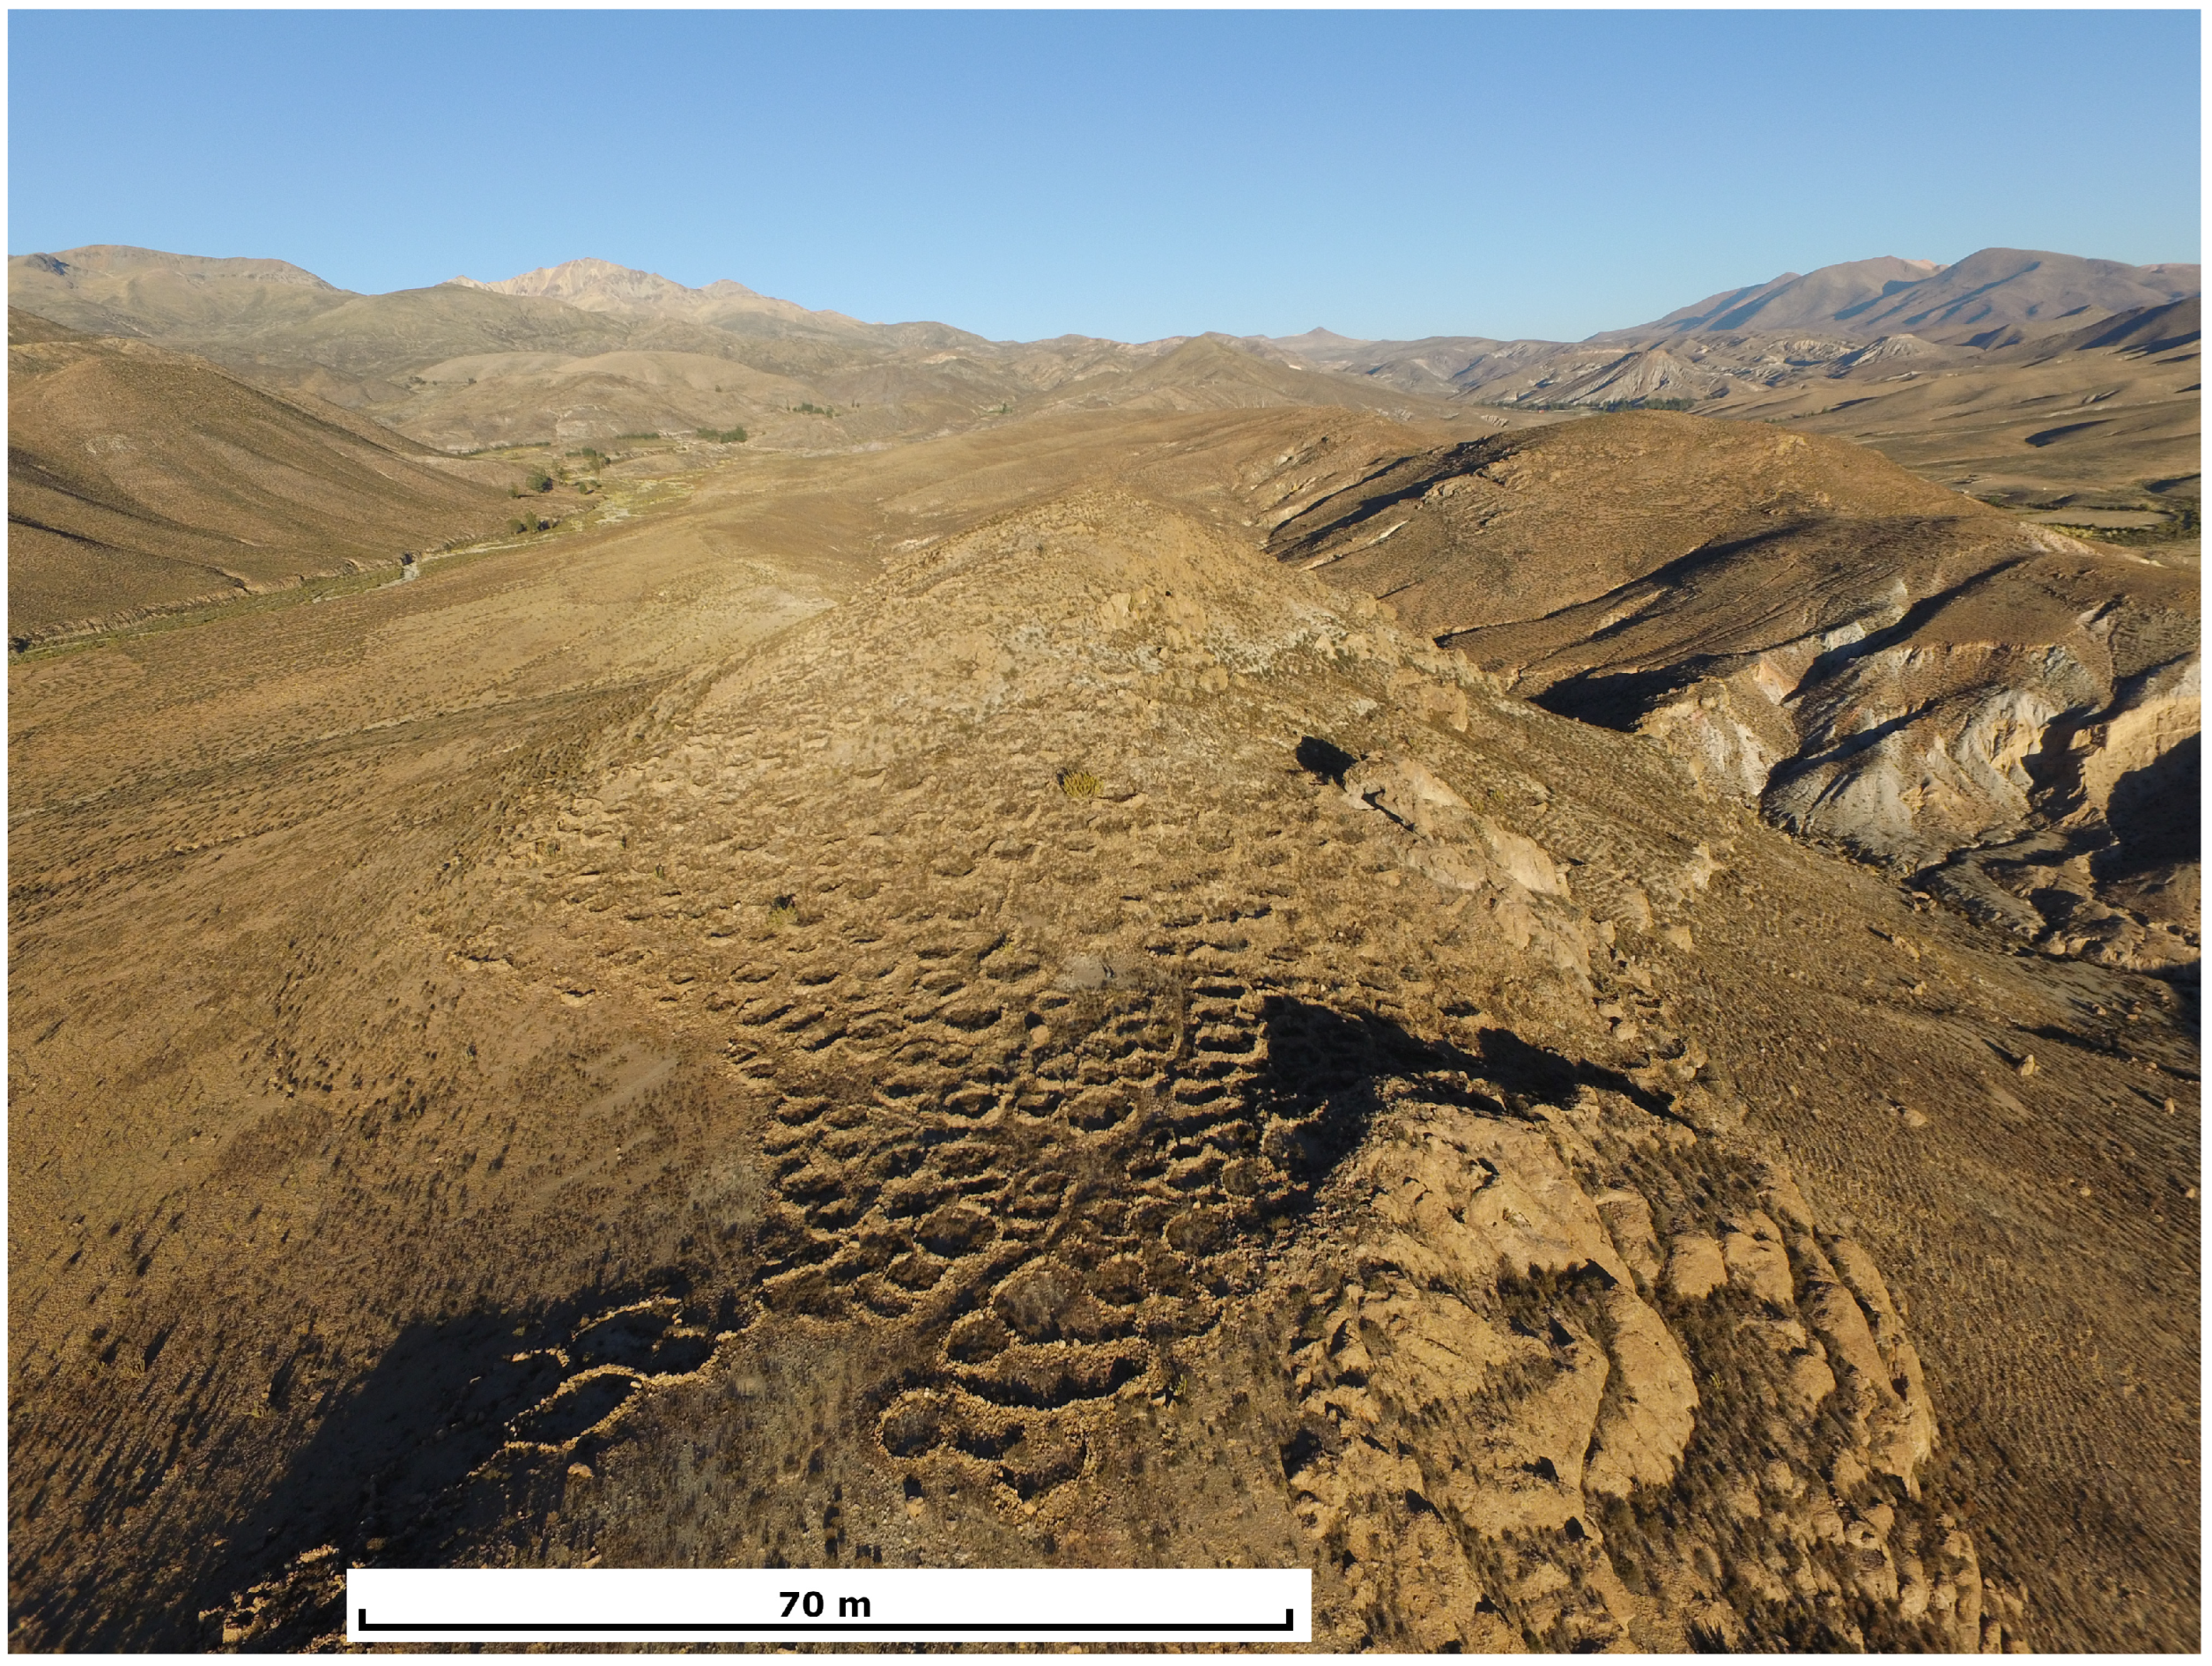
In 2017, Saintenoy and colleagues published the results of a first systematic and detailed photointerpretation effort [37,55] to exhaustively map stone architectures visible in the Azapa valley (Figure 1). This was accomplished using very high-resolution satellite imagery (0.5 m/pixel) from WorldView-2 and Pleiades sensors, combined with a 4 m/pixel digital elevation model generated through photogrammetry of WorldView-2 RGB images. WorldView-2 imagery provided the best photo-realistic definition for identifying structures, while Pleiades multispectral imagery (including near-infrared) helped differentiate certain vegetation formations that might otherwise be misinterpreted as stone structures. The systematic photo survey analysis resulted in the identification of 1200 archaeological sites (clusters of structures; Figure 2), 2000 hectares of agricultural areas, and a 600 km long network of pathways and roads distributed over the entire northern part of Chile, at the border with Peru and Bolivia. Complemented by pedestrian surveys for detailed recording of architecture and surface artifacts, as well as archaeological excavations for stratigraphic characterization at key sites, these results helped construct a detailed archaeological narrative of a mountainous agropastoral territory that originated during the Late pre-Hispanic period (14th–16th centuries CE) and underwent subsequent transformations.
The most typical architectural vestige of the Late pre-Hispanic period is the circular stone wall enclosure with a single opening (Figure 3) commonly referred to as “pucara” or hillforts when grouped in large clusters [56]. Structures with diameters ranging from 3 to 7 m and masonry made of double walls were primarily residential roundhouses, while larger, more irregular enclosures, without ground leveling were used as corrals [57]. Stone roundhouses appear in clusters of varying sizes, forming a hierarchy of residential settlements. The largest clusters, with up to 300 roundhouses, are associated with terraces, corrals, plazas, pathways, storage facilities, funerary architecture, and occasionally rectangular structures reflecting Inca imperial influence during the 15th and 16th centuries CE. Although numerous roundhouses were identified through photointerpretation, fieldwork has shown that the total number of such structures is likely undercounted. Due to their significance in understanding the Late pre-Hispanic settlement system and hierarchy, additional surveys of this architectural type were prioritized as part of the ADArchaeoSA—Automated Detection of Archaeological Sites in the Andes research project. To enhance their detection, we developed a complementary ML protocol (following [58,59]), using the existing database that was digitalized for this purpose as input data. Both roundhouses and corrals were selected as objects of interest (OoI) for the detection procedure implemented in this study.

2. Materials and Methods

2.1. Archaeological Data and Features Annotation

To deploy the ML protocol, we selected an area of the existing Azapa upper basin’s archaeological database containing 1034 circular structures. Of these, 813 structures covering an area of ca. 182 km2 were extracted along with their associated geographic coordinates to build the training dataset (as part of the ADArchaeoSA research project), while 221 structures over an area of 8.75 km2 were retained as testing dataset for model validation. The shapes were manually digitized as vector shapefiles in an ArcGIS Pro environment [60], referenced to the World Geodetic System (1984) and projected to the Universal Transverse Mercator System, zone 19S. Wherever possible, a single polygon represents a single instance or structure. However, due to collapsed material, determining precise boundaries between structures is sometimes challenging [61]. The training dataset was validated through ground-truthing conducted in 2022 and further corroborated by more recent fieldworks.

2.2. AI Training Dataset Generation

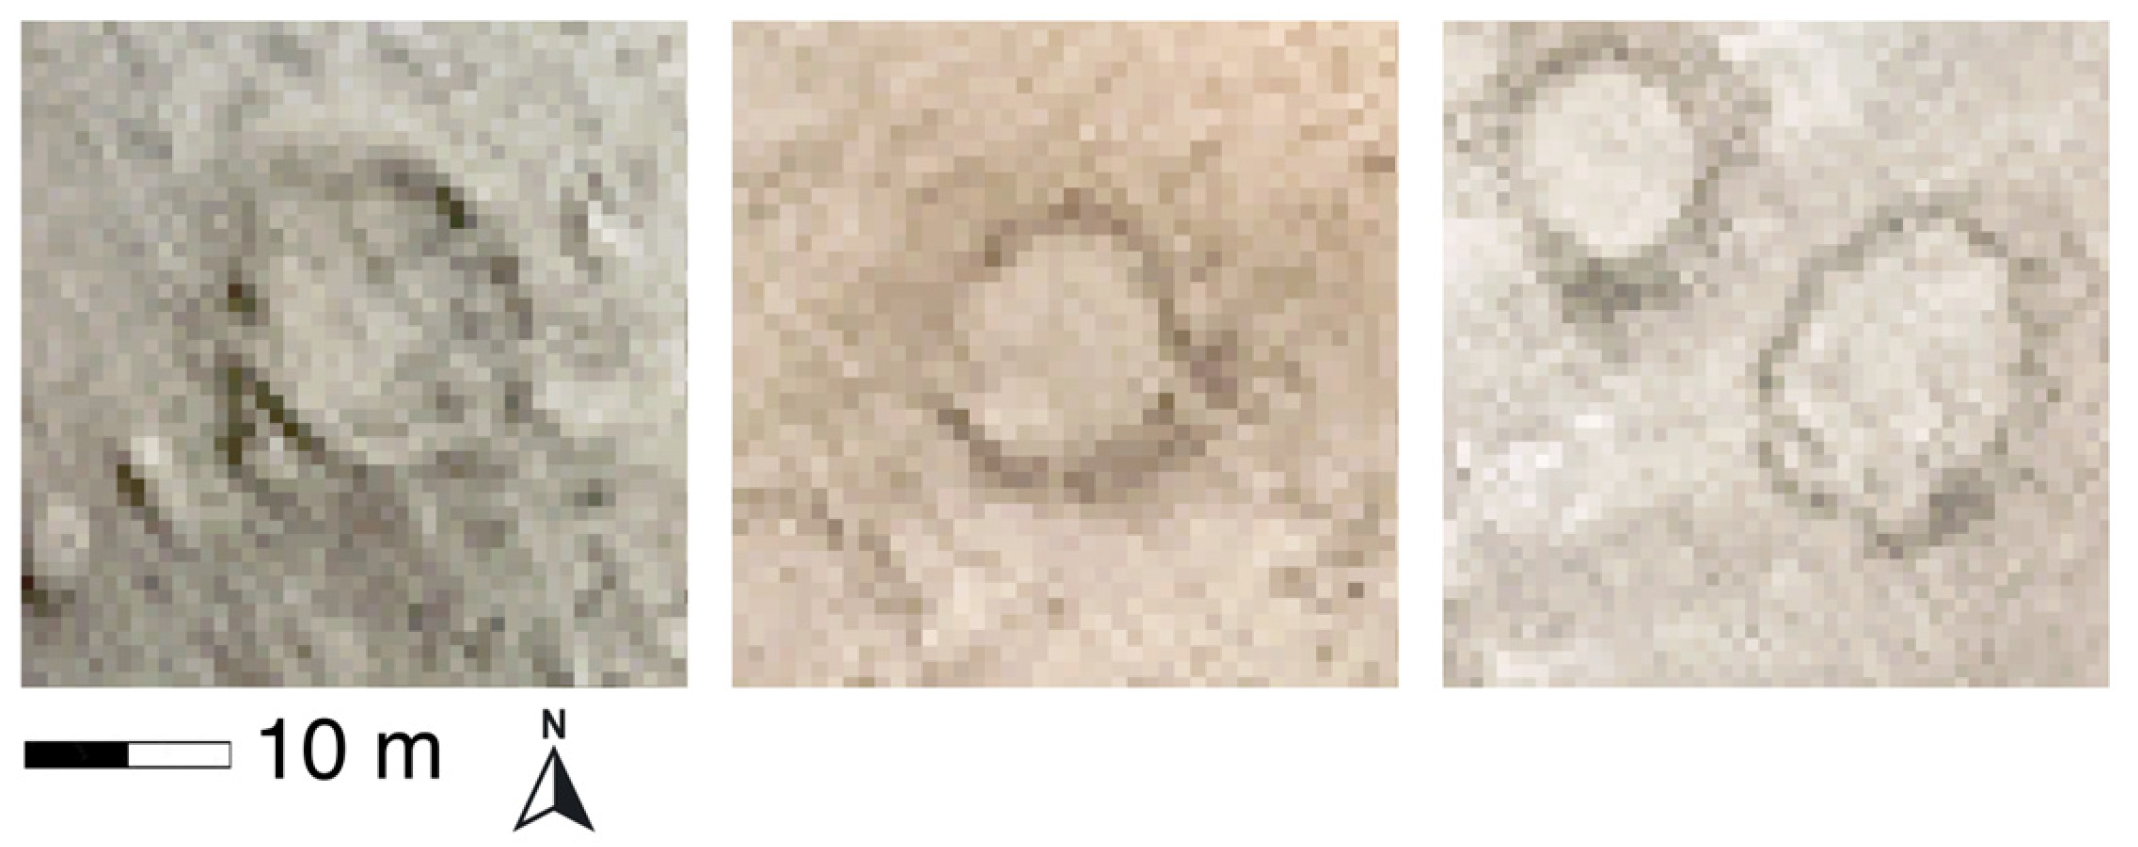
We then processed high-resolution satellite imagery captured by the WorldView-2 sensor of DigitalGlobe/Maxar Technologies. The pixel resolution of the RGB image chosen is 0.5 m (more details on image acquisition metrics in Supplementary Table S1), which provides excellent visibility of the anthropogenic traces we focused on. The scene was first acquired during the dry season, when vegetation cover is minimal (NDVI vegetation indices calculated from Landsat 8 images show that vegetation reaches its lowest levels in August, corresponding to the peak of the dry season). To ensure the geospatial accuracy of the archaeological records, the scene was ortho-rectified using a 4 m DigitalGlobe DEM acquired for this purpose and to enable additional spatial analysis, relief visualization, and contextualization, as further detailed in [37]. Our study area presents favorable conditions for this analysis, as this mountainous region has sparse vegetation due to low rainfall and limited water resources. Generally, the key factor for successful site detection is the textural contrast between the stone walls and the terrain, as well as the presence of slight shadows at the foot of the walls, which help highlight the archaeological structures. In our case study, the contrast between the stone walls and the terrain texture was decisive. For each structure, a 64 × 64 px patch around its center was extracted from the satellite imagery (see Figure 4) and these labeled data were used as positive examples of the features of interest for the CNN model—our training dataset. Approximately 8000 negative samples—landscape patches without archaeological structures—were generated by choosing random coordinates where no archaeological features were located within the study area. This process, that has proved its usefulness in [59], was further validated by an accurate satellite image manual inspection of the region.

2.3. Classification Algorithm

The processed image and the high precision archaeological training dataset were then used to train a binary neural network classifier on local hardware, an RTX 3060 GPU (NVIDIA; Santa Clara, CA, USA) with 16 GB memory run 64- and 32-bit mode alternatively, based on the modern ConvNeXT V2 architecture by Facebook Research [62], that was pre-trained on the well-known ImageNet dataset. Various data augmentation techniques were applied, including random resizing and cropping of training images [63], horizontal and vertical flipping, and slight adjustments in scale and brightness. Of particular benefit was the random erasing technique [64] in which randomly selected patches of an image are replaced with random noise, thereby contributing to better regularization. In order to face the possible overfitting and overconfidence of the model, we used LabelSmoothingCrossEntropy loss, which improves regularization and reduces overfitting. The Deep Learning libraries applied were Fast.ai [65] built on top of PyTorch (version 2.8.0) [66]. The model was fine-tuned using the Ranger optimization algorithm, a combination of RAdam and Lookahead, for 30 epochs with a learning rate of 0.001 and a batch size of 192. The resulting classifier was then used to conduct a grid search across a larger region in the North of the study area, while data from the validation region (in the Southwest) were reserved for evaluating model performance and not used for training. Specifically, for each point on the grid, a 64 × 64 px patch surrounding it was extracted from the satellite tiles and presented to the classifier.

3. Results

The main output generated by the AI model is a continuous probability score, ranging from 0.0 to 1.0, assigned to each of the grid points. This score represents the likelihood of “archaeological structures being nearby”, or more precisely, within the dimensions of the patch.
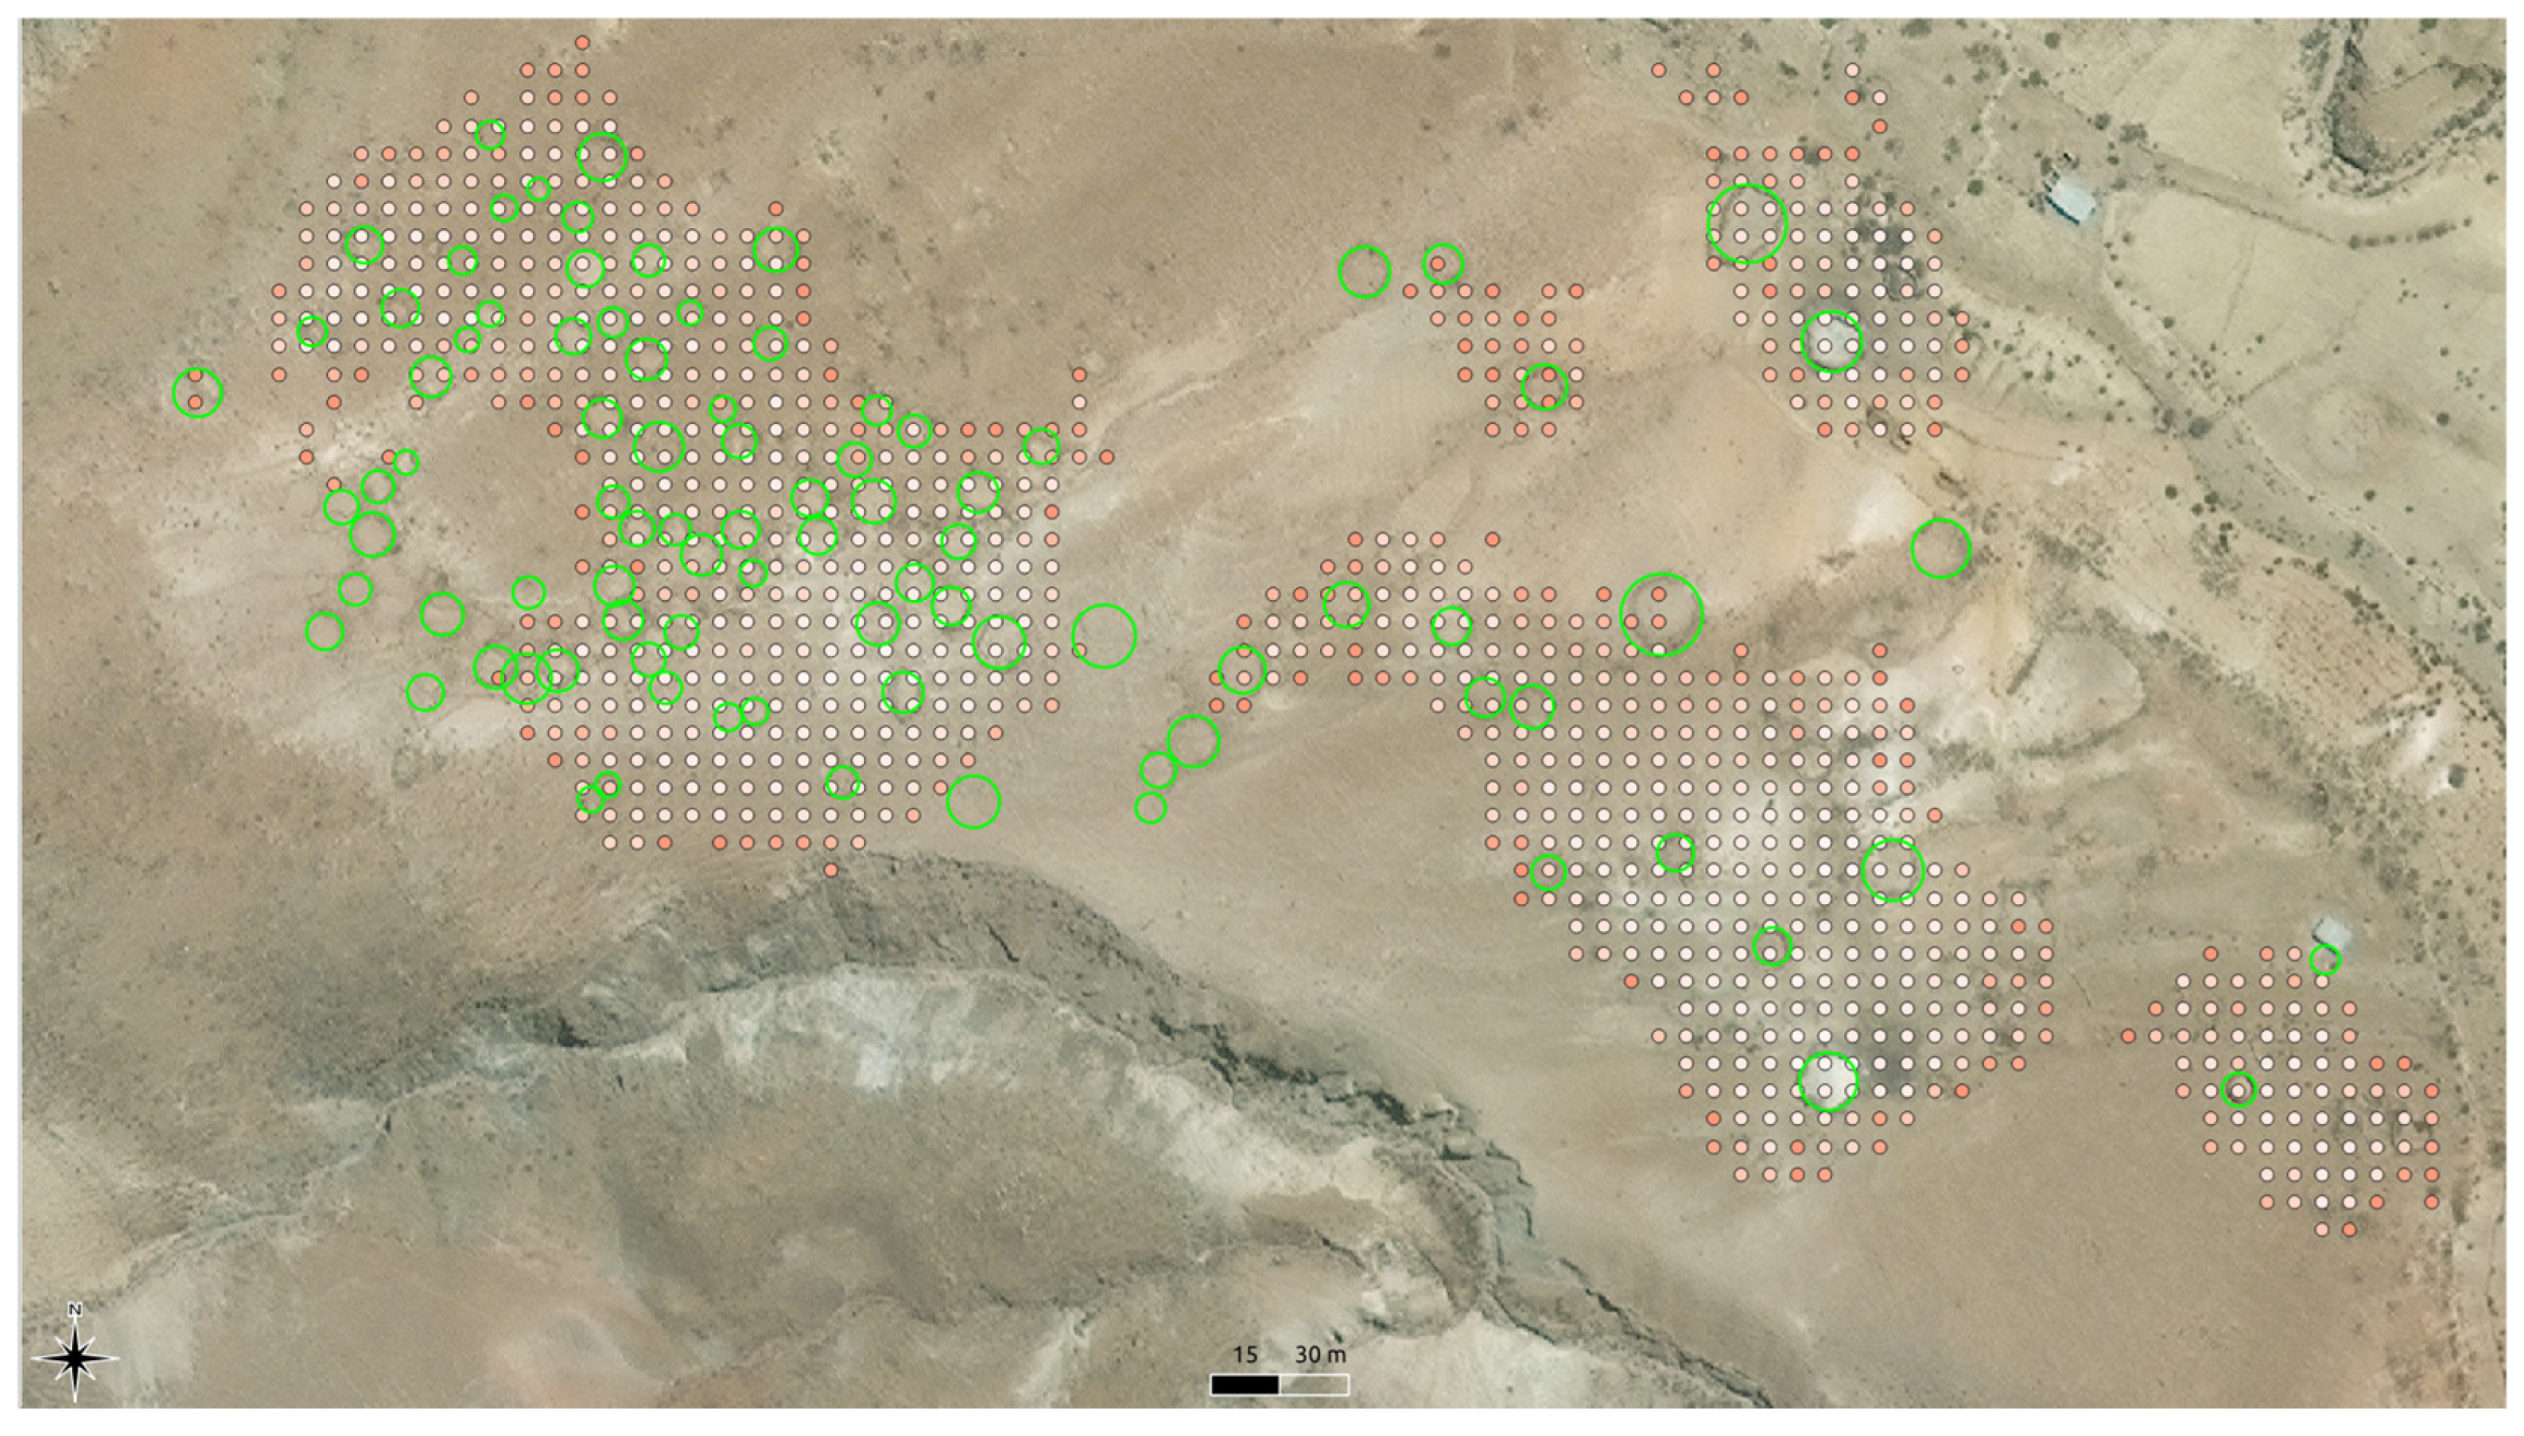
Preliminary results, obtained empirically, suggest that substantial overlap of the patches yields better detection results. A grid step-sized 6 m was found to be optimal as Figure 5 illustrates. Here, green circles represent the ground truth, namely archaeological structures previously documented by archaeologists. Dots in varying shades of a red scale (from red to white) indicate the grid points and the computed likelihood of an archaeological structure being nearby, with brighter (pink/white) dots corresponding to higher probability scores. Grid points with scores below 0.5 were omitted for better visibility.

Model Assessment and Validation

An ideal AI system designed to automate the search for previously unknown archaeological structures within a given study area would detect all such structures or at least a high percentage of them (True Positives, TPs), while missing out as few structures as possible (False Negatives, FNs). Equally important, however, is achieving a minimal or relatively low number of False Positives (FPs), as every detected result must be verified by human experts—a process that is often both time-consuming and costly. Statistical methods, such as the F1 score [67] and the Matthew Correlation Coefficient (MCC) [68] are the preferred approaches in similar contexts [69] because they balance the trade-off between achieving a high detection rate (TP) and minimizing FP. The F1 score is calculated as the harmonic mean of precision and recall, defined as:
F 1 = 2 · P r e c i s i o n · R e c a l l P r e c i s i o n + R e c a l l
where
P r e c i s i o n = T P T P + F P
and
R e c a l l = T P T P + F N
while the MCC can be understood as a correlation coefficient between the predicted and actual classifications, ranging from −1 to +1. An MCC of +1 indicates perfect predictions, 0 indicates no better than random guessing, and −1 indicates total disagreement between predictions and true outcomes [70], which reads as follows:
M C C = ( T P · T N ) ( F P · F N ) T P + F P · T P + F N · T N + F P · ( T N + F N )
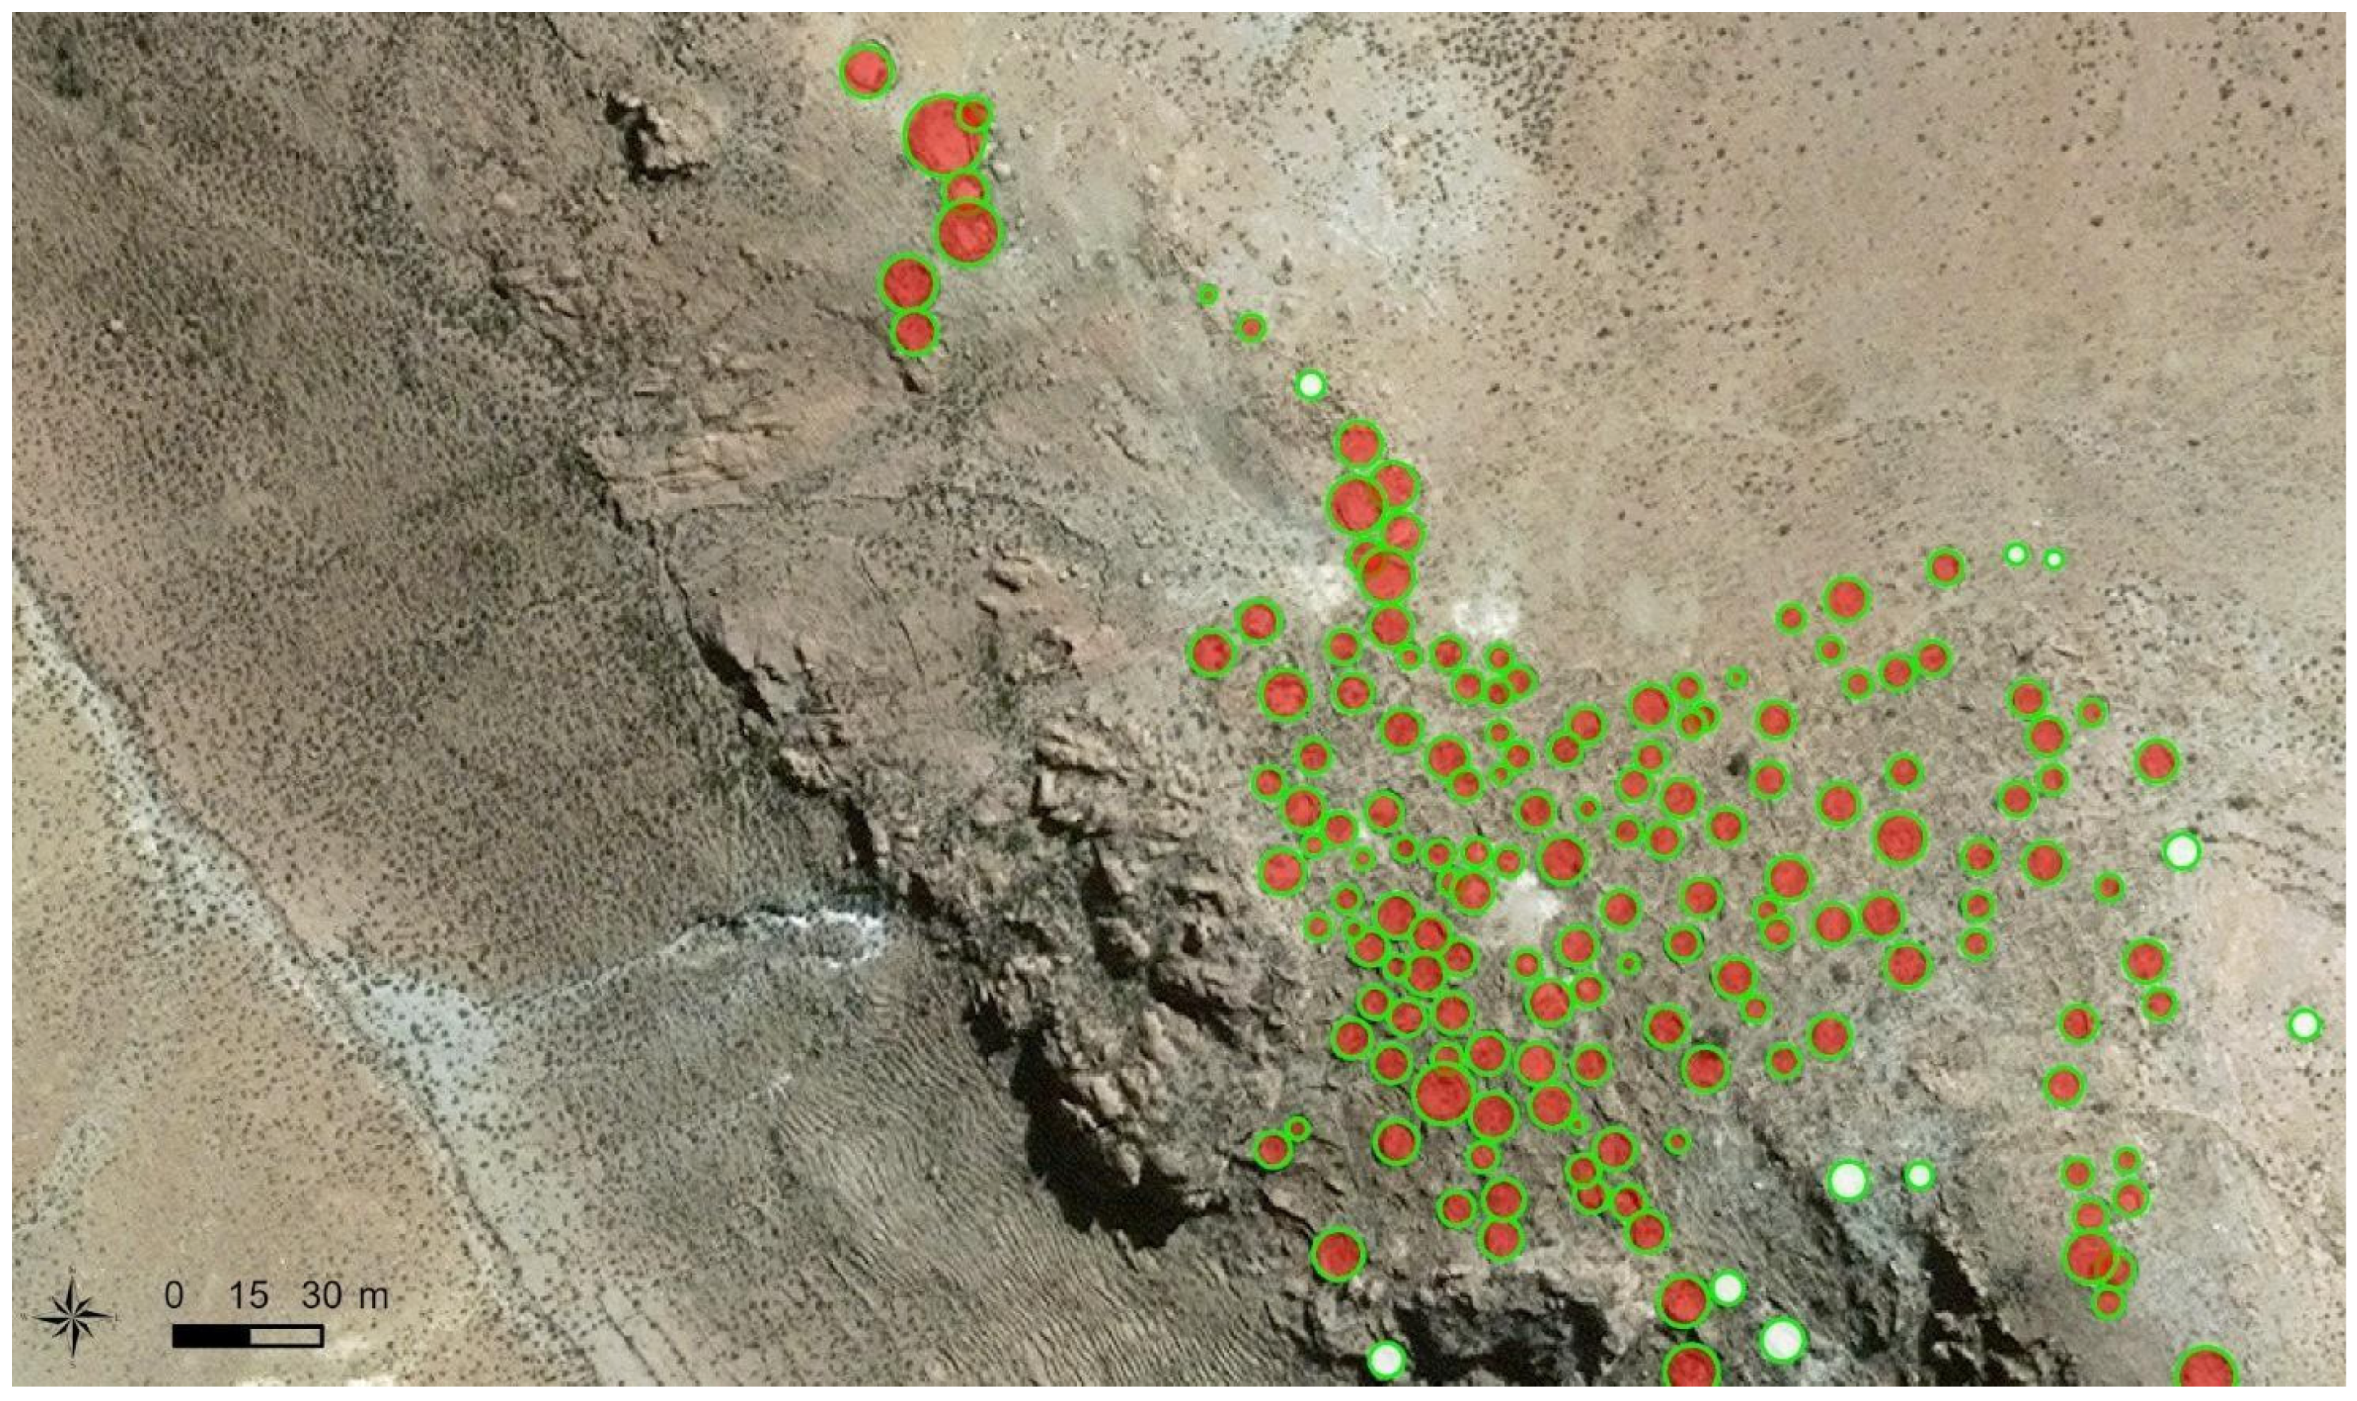
In our approach, a structure is considered identified by the AI if at least one grid point with a probability score above a predefined threshold falls within 6 m (grid step size) from the circular boundary of the structure. Consequently, all grid points with a probability score above the threshold and located within 6 m from a known structure are considered as TP. Conversely, FP are grid points with probability scores above the discrimination threshold but located further away than 6 m from any known structures. True Negatives (TN) correspond to grid points correctly classified as not being near archaeological structures, and False Negatives (FN) represent grid points within 6 m from an actual structure but with a probability score below the discrimination threshold. Here, Precision measures the proportion of grid points with high probability scores identifying actual structures (indicating how many of the positive grid points correspond to a real structure), while Recall reflects the proportion of grid points with high probability scores relative to all grid points located near actual structures (indicating what proportion of known structures is detected). Achieving high precision ensures fewer FPs, while high recall ensures that most of the archaeological structures are detected. While TN is rarely used directly in our context, the focus is on maximizing TP and minimizing FP and FN to improve precision, recall, and, ultimately, the F1 score and the MCC.
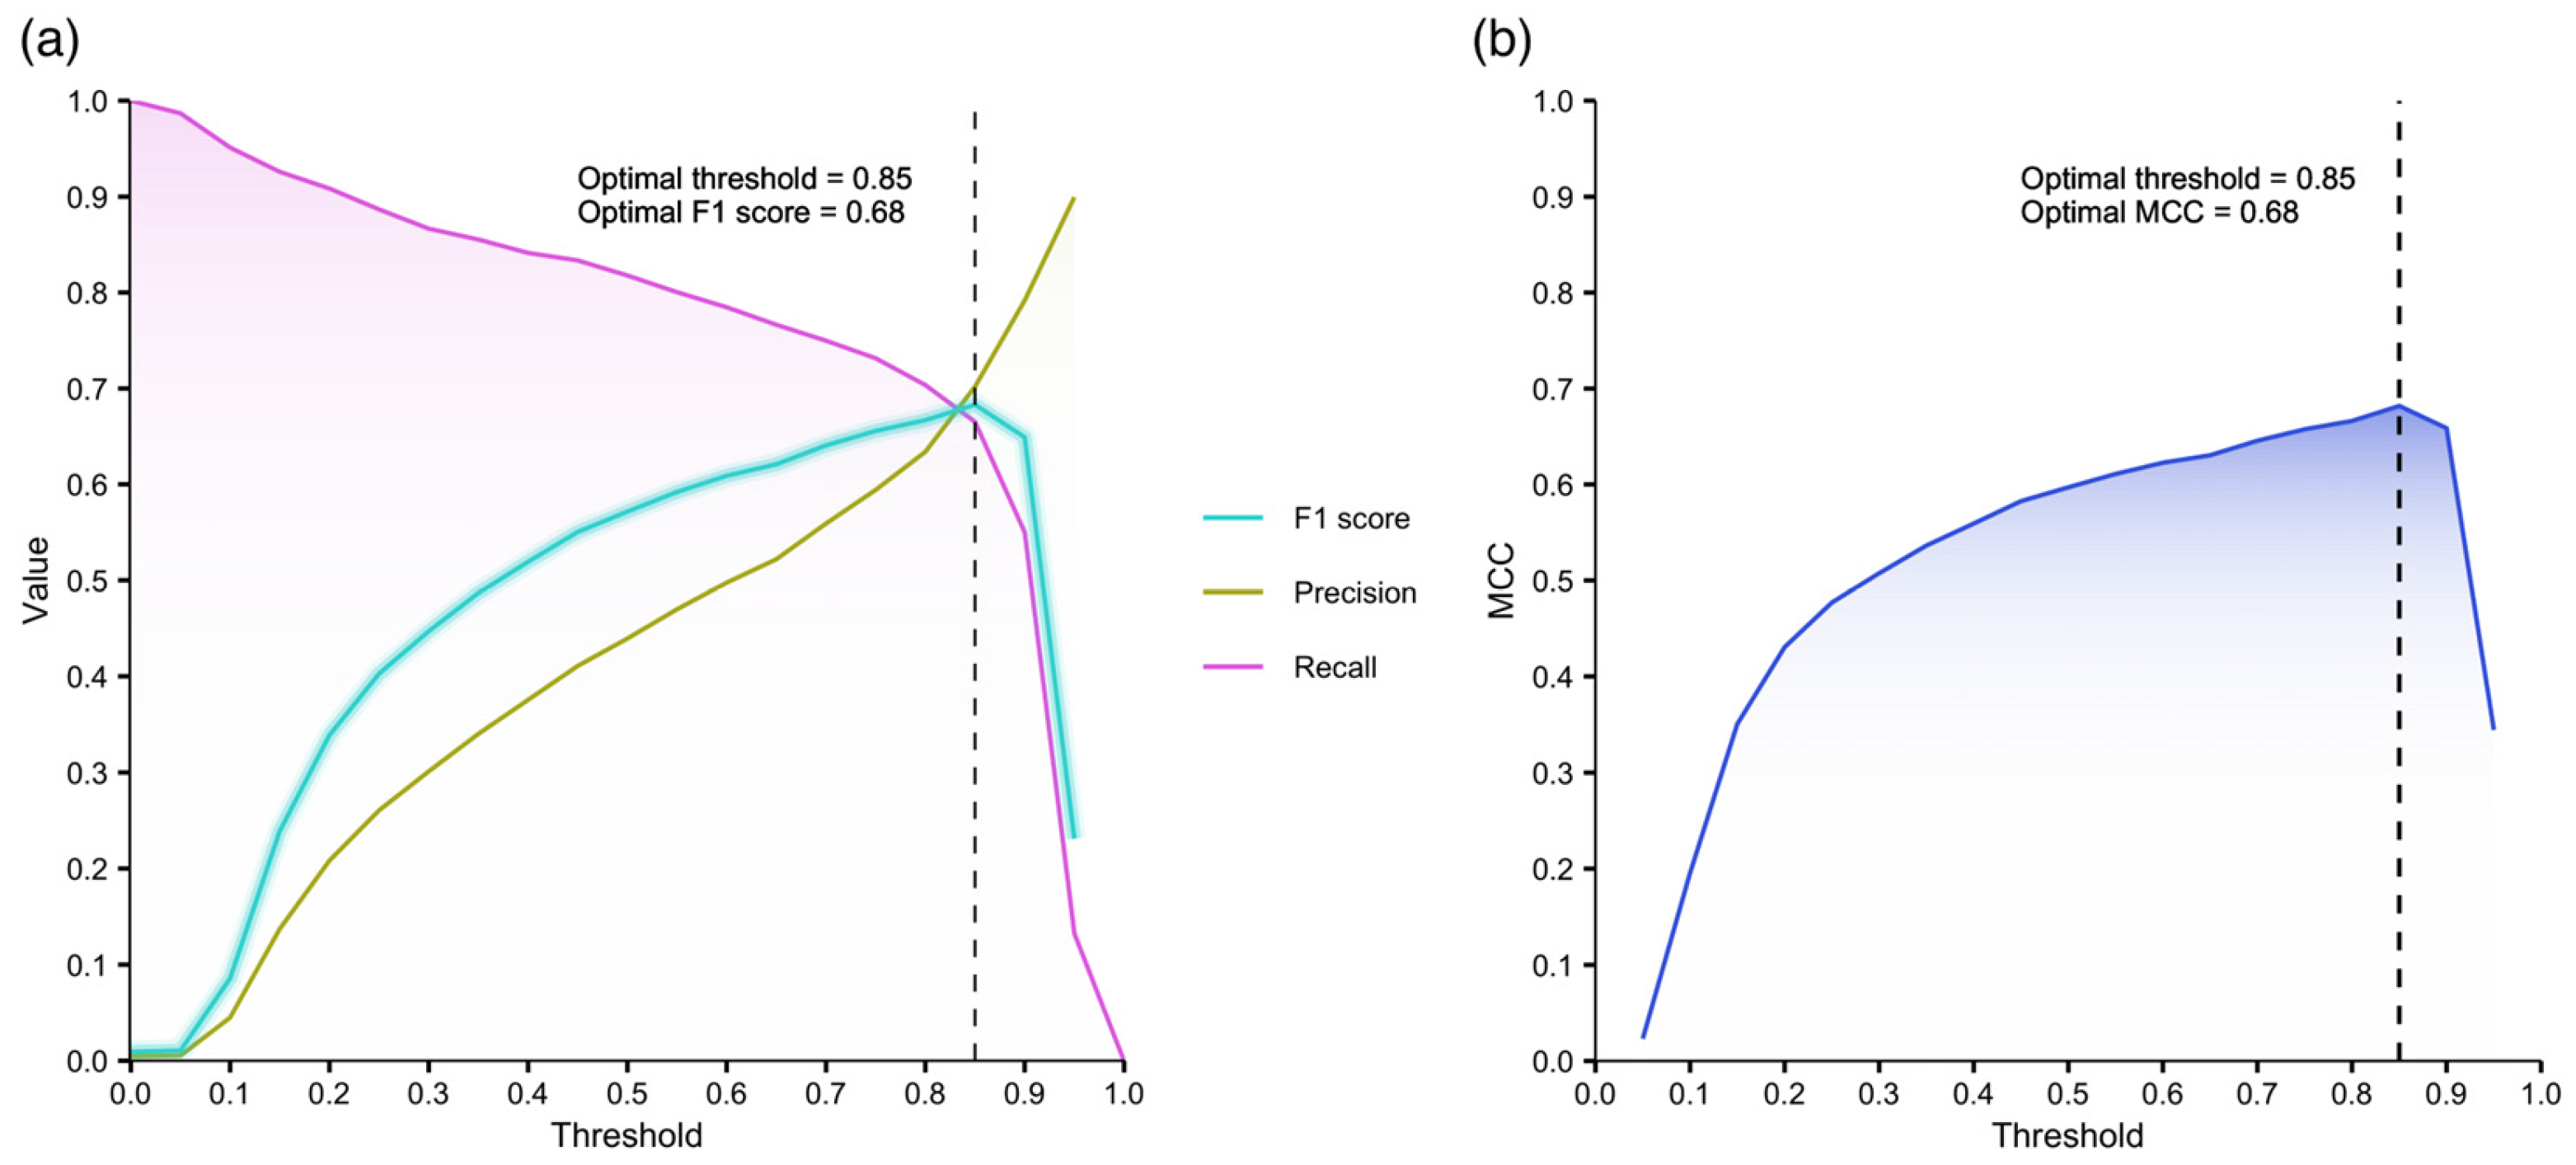
To evaluate the prediction quality of our model, we selected a section in the southwest (SW) of the study area, covering a total size of 8.75 km2, for high resolution-scale validation, where the team had previously identified 221 archaeological structures on the field, not used for model training. To determine the optimal discrimination threshold, we computed Precision, Recall and thus F1 score, as well as the MCC for each threshold between 0 and 1 with an interval of 0.05. As shown in Figure 6 (Figure 6a for F1 score, Figure 6b for MCC) in our case, both F1 score and MCC suggest an optimal threshold of 0.85, achieving a F1 score and a MCC of 0.68.
In addition to the evaluation metrics based on grid point probability scores as shown in Figure 6, we also assessed our model’s performance in terms of the proportion of identified sites (i.e., sites with a grid point with a probability score above the discrimination threshold located within 6m from their boundaries) and the extent of potential false positives, quantified as the cumulative area represented by grid points (6 × 6 m each) with probability scores above the discrimination threshold that are located more than 6 m away from any known structure. The objective is to optimize structure detection and provide precise predictions for areas that warrant manual verification. An illustration of identified vs. unidentified structures is shown in Figure 7, and Table 1 summarizes the corresponding data for various threshold values tested. For instance, at a confidence score threshold of 0.85, the model identifies 187 structures, achieving an 85% detection rate. Simultaneously, 324 grid points with probability scores > 0.85 fall outside the 6 m limit from known structures (FP), corresponding to an area of 11,664 m2—merely 0.13% of the total test area size of 8.75 km2.
These findings highlight the AI model’s practical utility: instead of investigating the entire 8.75 km2 test area, archaeologists only need to verify FPs within 0.13% of the original area, significantly reducing the workload. As shown in Table 1, increasing the threshold value improves precision by reducing the number of FP but also reduces the percentage of correctly identified structures. This allows archaeologists to adjust the threshold value based on available time and resources, balancing the trade-off between recall and precision to achieve optimal results for specific fieldwork scenarios.

4. Discussion

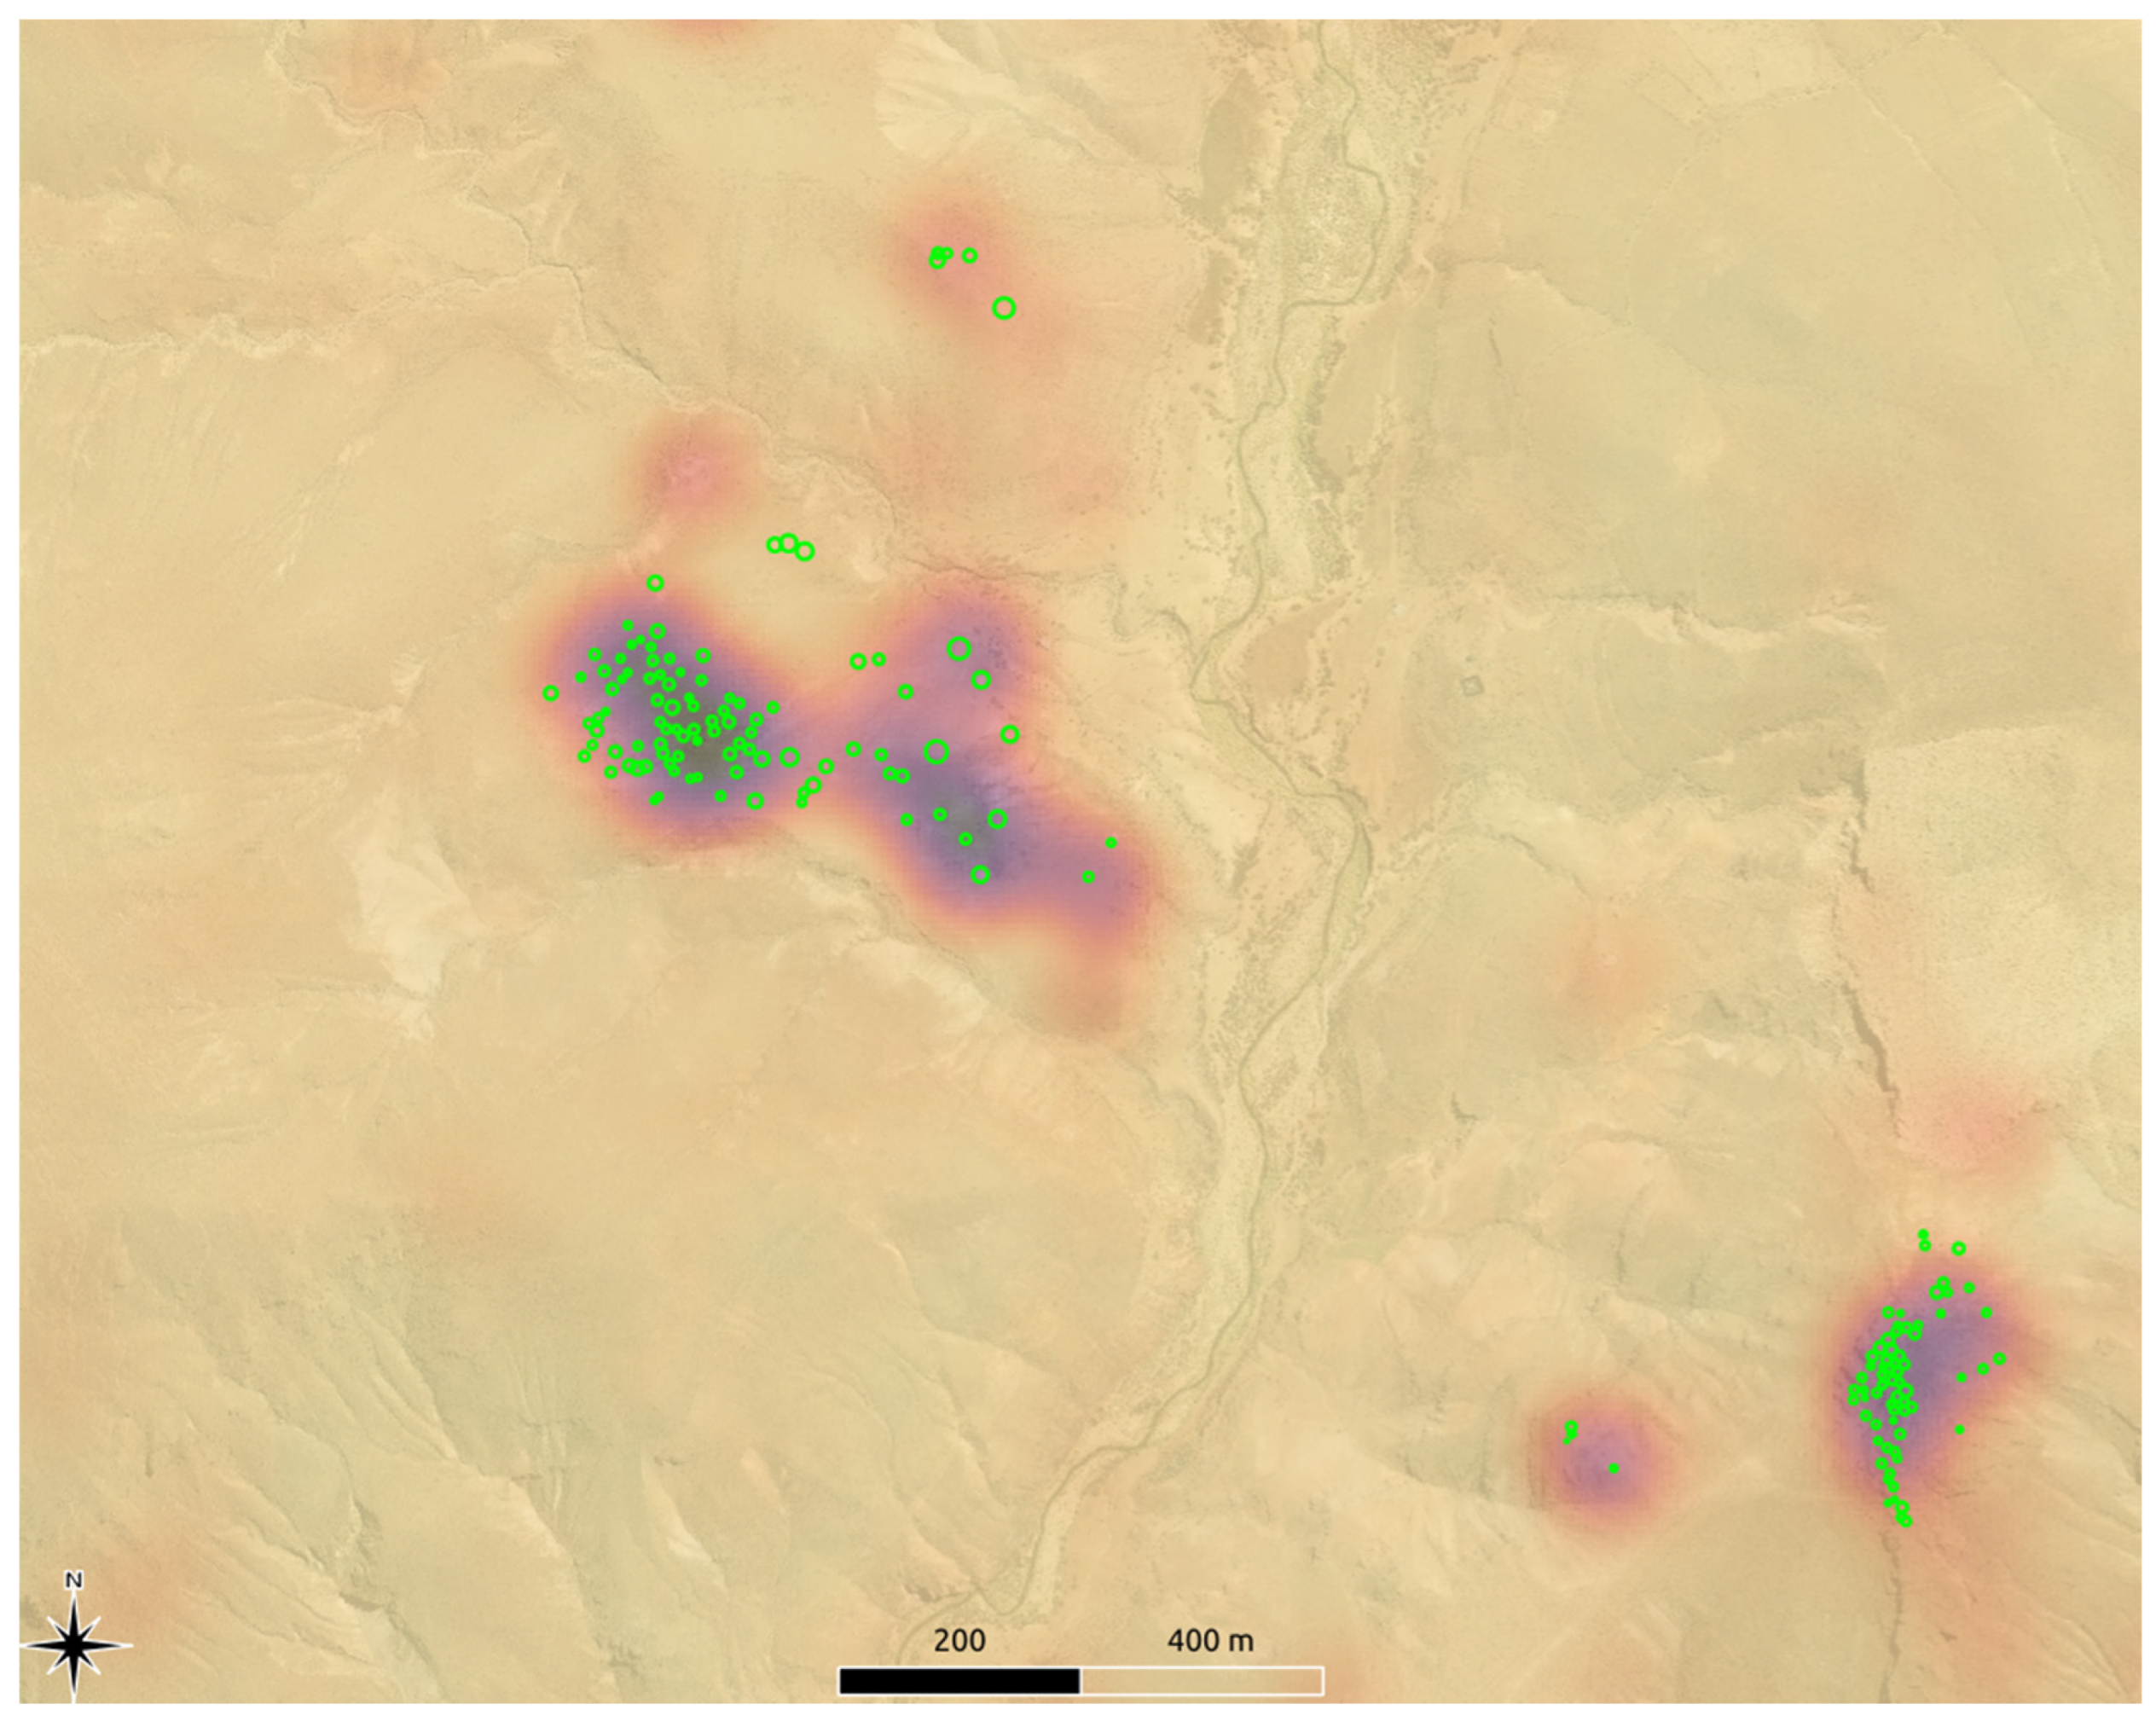
From an archaeological point of view, most of the known structures are identified by the AI procedure, though some are missing. The grid search approach revealed itself efficient not primarily at pinpointing individual structures, but instead at identifying areas with high probabilities. Given the patch size of 64 × 64 px, which is relatively large compared to the average structure diameter of just 6 m, grid points farther away from structures may still yield higher scores. This can result in relatively large “point clouds” around structures, especially when they appear in clusters (see Figure 5). Smaller patch sizes were also tested but produced suboptimal results. The AI procedure thus seems somewhat biased towards detecting structures in close proximity, making it easier to identify larger clusters than isolated occurrences. Further research is needed to address this limitation. We hypothesize that this bias is due to the resolution of the satellite imagery (0.5 m/px), where average structures with a diameter of approximately 12 px are harder to detect unless they appear in clusters. Fortunately, isolated occurrences of archaeological features are relatively rare. This issue is further clarified when the grid search results are visualized not as dots but as a heatmap, as shown in Figure 8.
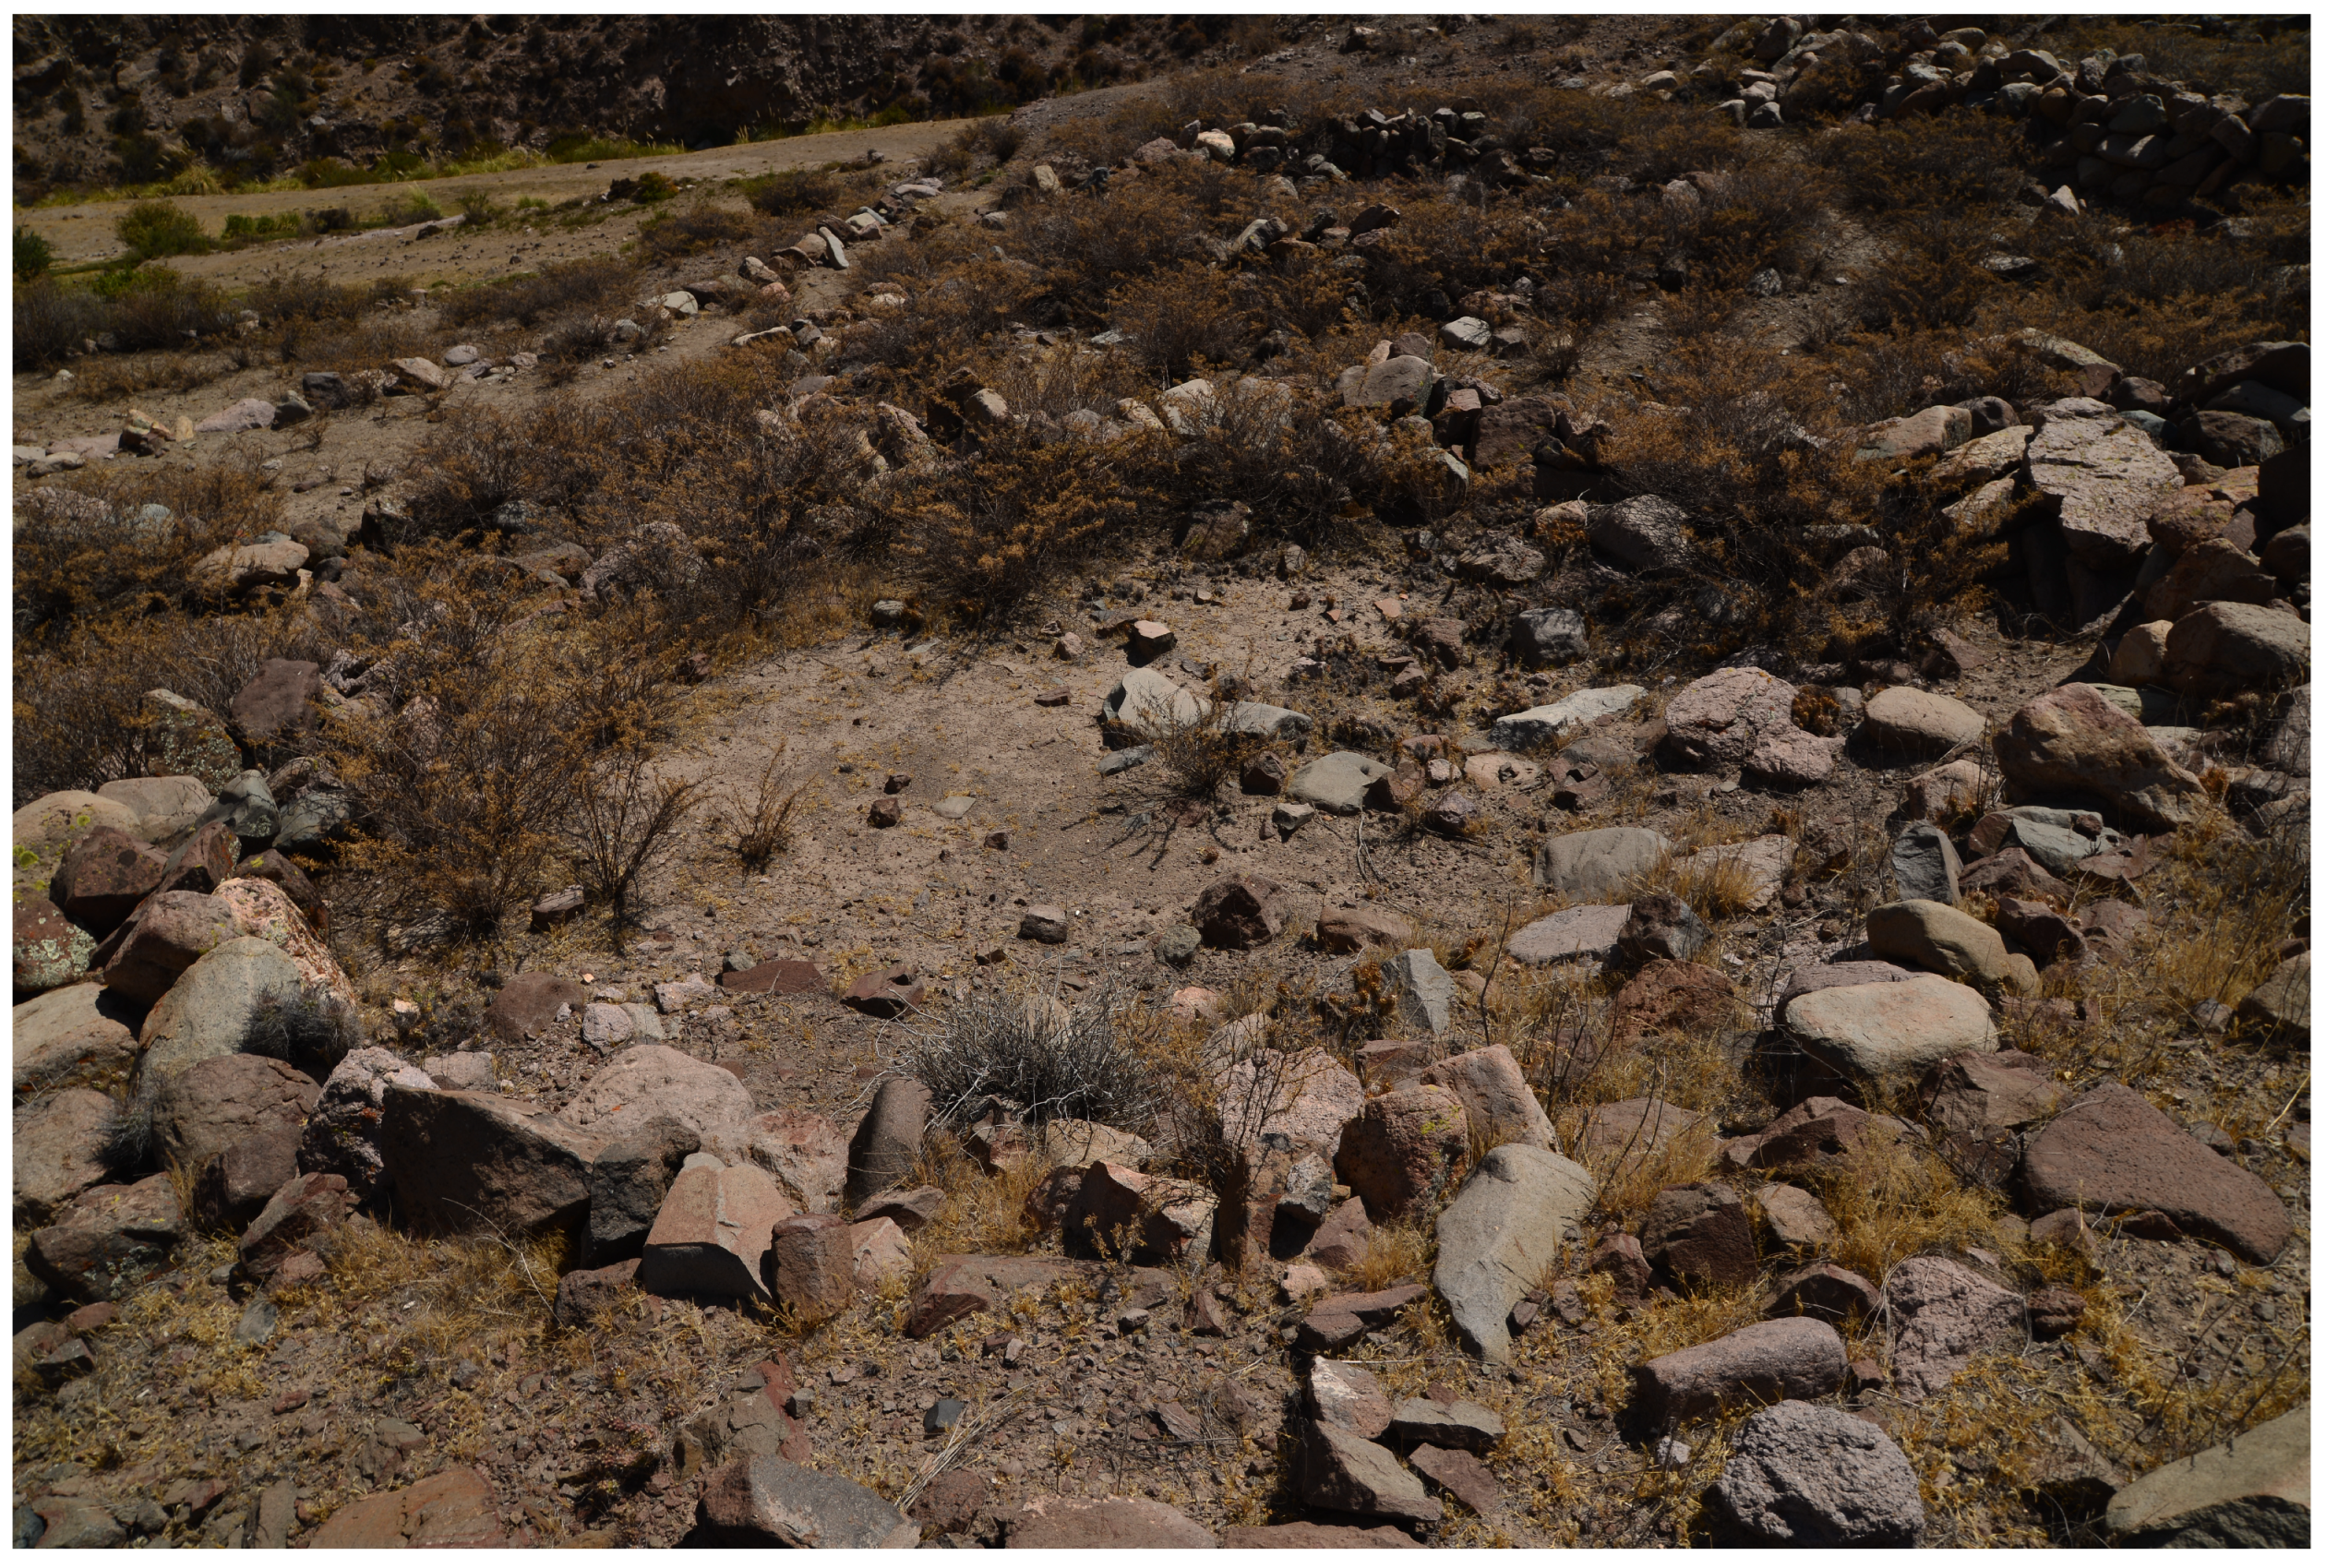
Furthermore, while manually verifying the model results, most of the known structures that were not identified by the model appeared to correspond to structures in poor conservation conditions, with collapsed walls and sometimes partially covered by vegetation (Figure 9). This aspect could also be used as an effective tool to identify scarcely conserved structures and thus monitor the degradation status of archeological sites, e.g., by comparing the model results for the same sites obtained on satellite image time series.
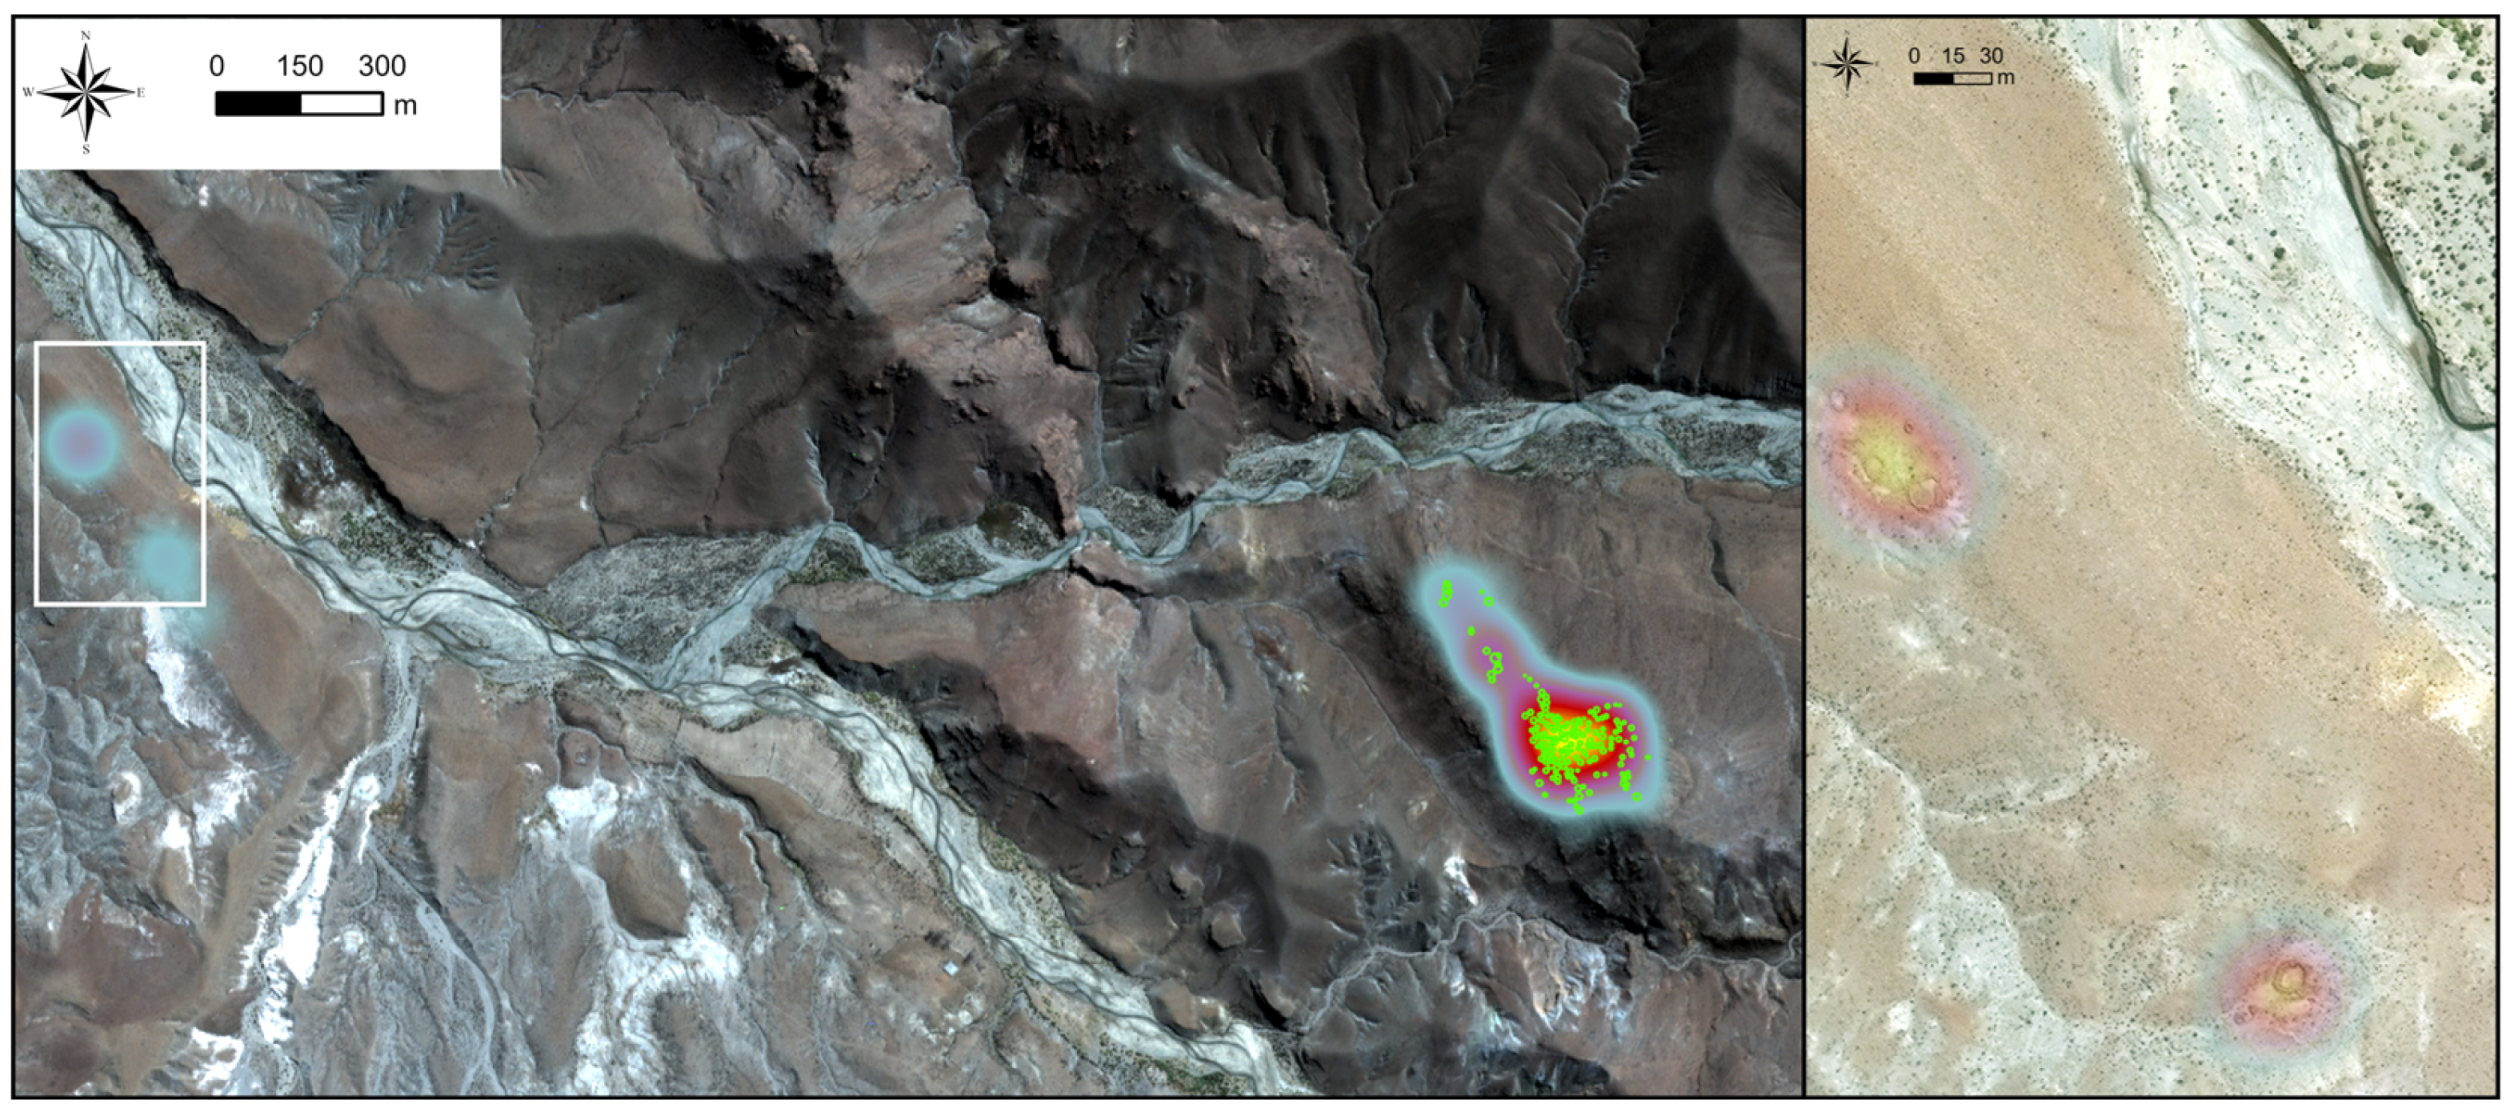
The model also suggested high probability scores > 0.85 in areas not previously surveyed, but where new circular structures were detected (Figure 10). These previously unknown structures were verified during subsequent fieldworks and could hence be included to enrich the original dataset.
Our results also highlight the constraints of the training dataset, especially in terms of the need for more diverse and well-represented land texture types and archaeological feature shapes. While our model performs well in detecting Pucara-type circular structures, its performance may decrease when applied to regions where feature geometry or landscape context differs substantially from the training data. Nevertheless, the broader applicability of similar CNN-based approaches has been demonstrated in other archaeological settings, including the detection of ancient road networks [59], hill fortifications [28], and Khmer-era temple moats in Cambodia [25], where features are less uniform and often irregularly shaped. These comparable architectures reinforce the value of our model and suggest that, with suitable retraining and data augmentation, the general framework can be adapted to varied archaeological and environmental contexts. The principal limitation of our method thus lies in the dependence on consistent feature geometry for optimal performance, whereas its main advantages include its efficiency with limited training data, reproducibility, and potential for rapid large-area mapping, making this kind of work replicable even in resource-constrained research environments. Human verification remains critical for refining AI predictions and addressing false positives.
Since detecting archaeological sites often requires identifying subtle differences in land textures, future research could aim at broadening the image availability and the archaeological training dataset by incorporating more high-resolution images and a greater variety of geographical regions. This would enhance the model’s ability to generalize across different landscapes, expanding the classification system and testing the method’s effectiveness across a wider range of regions and datasets. Additionally, future research could investigate the potential of incorporating newer DL architectures, possibly stemming from Foundation Models such as ChatGPT, into the study. These advanced architectures are particularly effective at capturing fine-grained details and complex spatial patterns, which are often crucial for identifying subtle archaeological features that may be hidden within broader land texture types. A quantitative comparison of these models could provide valuable insights into their respective strengths and weaknesses, helping to identify more effective methods for large-scale and varied environment applications.
Finally, our study contributes to shed light on a region too long considered marginal and subordinate to the more prominent socio-political centers of the Altiplano or the coastal plains, advocating for its recognition as a dynamic and significant player in Andean history and archaeology. The population growth and increased appearance of settlements during pre-Hispanic times in these areas (including the newly identified structures distributed over a territory larger than initially known), naturally unsuitable for agriculture, can possibly be explained by looking at broader, more extensive interaction networks developed between the altiplano and the coast. These networks may have contributed to shaping and articulating the social and environmental space of the Altos de Arica and the Precordillera.
In this context, the process of heritagization holds particular significance. It is especially important for indigenous communities who often trace back their origins to ancient pre-Hispanic settlements and connections. Such process is even more urgent since the rural exodus and development of urban-centered modernity along the Pacific coast caused a loss of common historical identity. The lack of extensive surveys of archaeological sites for these difficult-to-access mountainous areas (existing archaeological maps focus on the coastal area of Arica) hinders its recognition as an area of major cultural interest. By providing a tool for the development of such archaeological maps where resources are restricted, our model fosters a more systematic understanding of this high mountainous area and its archaeological importance, thereby laying the foundations for the enforcement of protection measures and the promotion of its threatened heritage.
This research presents a new case study from a scarcely investigated, difficult to access region in the Chilean Andes and demonstrates that integrating DL and RS approaches can significantly contribute to creating comprehensive geospatial archaeological databases, even with limited training data. We applied a binary neural network classifier based on the modern ConvNeXT V2 architecture to effectively identify pre-Inca roundhouses in the Azapa valley, Arica y Parinacota Region, Northern Chile.
The detection process achieved a very high recognition rate while minimizing the area that must be double-checked for potential unknown structures, thus allowing archaeologists to expand their dataset with reduced time resources. Our results were validated through ground-truthing, allowing the recording of previously unknown archaeological remains. The evaluation of the predictions suggests that the preservation status of archaeological structures may play an important role in algorithmic performance, pointing to future refinements, such as parallel classification sessions targeting damaged structures or the monitoring of conservation status.
While the modeling protocol is robust, future research could focus on broadening image availability and diversifying the archaeological dataset to enhance the model’s ability to generalize across different landscapes and a wider range of object classes.
Ultimately, the implications of this study go beyond enhancing mapping efficiency, demonstrating the potential for highlighting a cultural heritage common to three modern-day countries (Bolivia, Chile and Peru) and promoting “heritagization” processes. It also paves the way for broader adoption of DL technologies in archaeological research in Chile, where such applications are still very scarce, providing a baseline recommendation for most efficient protection and management of this landscape. The resulting protocol can be further used for long-term monitoring of site status and to help archaeologists and local cultural heritage managers understand and deal with archaeological disasters and damage at the supra regional and local scales.

Supplementary Materials

The following supporting information can be downloaded at: https://www.mdpi.com/article/10.3390/rs17203499/s1, Table S1: WorldView2 image acquisition metrics.

Author Contributions

M.E.C.: conceptualization; data curation; methodology; results validation; writing—original draft and final version; funding acquisition; J.L.: methodology; results validation; writing—original draft and final version; T.S.: source data acquisition and curation; results validation; writing—original draft. All authors have read and agreed to the published version of the manuscript.

Funding

This research was supported by the Schweizerischer Nationalfonds zur Förderung der wissenschaftlichen Forschung (Swiss National Science Foundation) under the project “ADArchaeoSA—Automated Detection of Archaeological Sites in the Andes”, Grant number P500PH_202781.

Data Availability Statement

The WorldView2 image utilized in this study was acquired from DigitalGlobe/Maxar under a restricted license. The source archaeological data which precise locations must remain inaccessible for security reasons are available for consultation on the Redes Andina website: https://redesandinas.hypotheses.org/ (accessed on 4 September 2025). The code is available upon request to the corresponding author.

Acknowledgments

The authors acknowledge the support provided by Cristian Gonzales, PhD student at University College London.

Conflicts of Interest

The authors declare no conflicts of interest.

Abbreviations

The following abbreviations are used in this manuscript:
AIArtificial Intelligence
CNNConvolutional Neural Networks
DEMDigital Elevation Model
FNFalse Negative
FPFalse Positive
DLDeep Learning
GISGeographical Information System
MLMachine Learning
NDVINormalized Difference Vegetation Index
OoIObjects of Interest
RSRemote Sensing
TNTrue Negative
TPTrue Positive

References

  1. Espinoza, J.C.; Garreaud, R.; Poveda, G.; Arias, P.A.; Molina-Carpio, J.; Masiokas, M.; Viale, M.; Scaff, L. Hydroclimate of the Andes part I: Main climatic features. Front. Earth Sci. 2020, 8, 64. [Google Scholar] [CrossRef]
  2. Borsdorf, A.; Stadel, C. The Andes. A Geographical Portrait; Springer: New York, NY, USA, 2015. [Google Scholar]
  3. Agüero, C.; Uribe, M. Las sociedades Formativas de San Pedro de Atacama: Asentamiento, cronología y proceso. Estud. Atacameños 2011, 42, 53–78. [Google Scholar] [CrossRef]
  4. Saintenoy, T.; Llobera, M.; Thiéry, N.; Crespo Fernández, M.; Fábrega-Álvarez, P.; Santos, R. Topological insights into the diachrony of ancient road networks: Exploratory predictive modelling in the Andean highlands. J. Archaeol. Sci. 2025, 174, 106125. [Google Scholar] [CrossRef]
  5. Zimmer-Dauphinee, J.; Wernke, S.A. Semantic Segmentation and Classification of Active and Abandoned Agricultural Fields through Deep Learning in the Southern Peruvian Andes. Remote Sens. 2024, 16, 3546. [Google Scholar] [CrossRef]
  6. Lazzari, M.; Oltean, I.; Oyaneder Rodríguez, A.; Scattolin, M.C.; Pereyra Domingorena, L. Andean Landscape Legacies: Comprehensive Remote Sensing Mapping and GIS Analysis of Long-Term Settlement and Land Use for Sustainable Futures (NW Argentina). Remote Sens. 2024, 16, 3795. [Google Scholar] [CrossRef]
  7. Luo, L.; Wang, X.; Guo, H.; Lasaponara, R.; Zong, X.; Masini, N.; Wang, G.; Shi, P.; Khatteli, H.; Chen, F.; et al. Airborne and spaceborne remote sensing for archaeological and cultural heritage applications: A review of the century (1907–2017). Remote Sens. Environ. 2019, 232, 111280. [Google Scholar] [CrossRef]
  8. Masini, N.; Coluzzi, R.; Lasaponara, R. On the Airborne Lidar Contribution in Archaeology: From Site Identification to Landscape Investigation. In Laser Scanning, Theory and Application; InTech Open: London, UK, 2011; pp. 263–290. [Google Scholar]
  9. Lasaponara, R.; Masini, N. Satellite remote sensing in archaeology: Past, present and future perspectives. J. Archaeol. Sci. 2011, 38, 1995–2002. [Google Scholar] [CrossRef]
  10. Argyrou, A.; Agapiou, A. A review of artificial intelligence and remote sensing for archaeological research. Remote Sens. 2022, 14, 6000. [Google Scholar] [CrossRef]
  11. Fiorucci, M.; Verschoof-van der Vaart, W.B.; Soleni, P.; Le Saux, B.; Traviglia, A. Deep learning for archaeological object detection on LiDAR: New evaluation measures and insights. Remote Sens. 2022, 14, 1694. [Google Scholar] [CrossRef]
  12. Phelan, K.; Riordan, D. Detection of Ringforts from Aerial Photography Using Machine Learning. In Proceedings of the 31st Irish Signals and Systems Conference (ISSC), Letterkenny, Ireland, 11–12 June 2020; pp. 1–6. [Google Scholar] [CrossRef]
  13. Trotter, E.F.L.; Fernandes, A.C.M.; Fibæk, C.S.; Keßler, C. Machine learning for automatic detection of historic stone walls using LiDAR data. Int. J. Remote Sens. 2022, 43, 2185–2211. [Google Scholar] [CrossRef]
  14. Guyot, A.; Lennon, M.; Lorho, T.; Hubert-Moy, L. Combined Detection and Segmentation of Archaeological Structures from LiDAR Data Using a Deep Learning Approach. J. Comput. Appl. Archaeol. 2021, 4, 1. [Google Scholar] [CrossRef]
  15. McCoy, M.D. Geospatial Big Data and archaeology: Prospects and problems too great to ignore. J. Archaeo-Log. Sci. 2017, 84, 74–94. [Google Scholar] [CrossRef]
  16. Doyle, C.; Luzzadder-Beach, S.; Beach, T. Advances in remote sensing of the Early Anthropocene in tropical wetlands: From biplanes to lidar and machine learning. Prog. Phys. Geogr. Earth Environ. 2023, 47, 293–312. [Google Scholar] [CrossRef]
  17. Suh, J.W.; Ouimet, W. Mapping stone walls in Northeastern USA using deep learning and LiDAR data. GIScience Remote Sens. 2023, 60, 2196117. [Google Scholar] [CrossRef]
  18. Character, L.; Ortiz, A., Jr.; Beach, T.; Luzzadder-Beach, S. Archaeological machine learning for shipwreck detection using lidar and sonar. Remote Sens. 2021, 13, 1759. [Google Scholar] [CrossRef]
  19. Character, L.; Beach, T.; Luzzadder-Beach, S.; Cook, D.; Schank, C.; Valdez, F., Jr.; Mallner, M. Machine learning for cave entrance detection in a Maya archaeological area. Phys. Geogr. 2023, 45, 416–438. [Google Scholar] [CrossRef]
  20. Bickler, S.H. Machine learning arrives in archaeology. Adv. Archaeol. Pract. 2021, 9, 186–191. [Google Scholar] [CrossRef]
  21. Rosenzweig, M.S. Confronting the present: Archaeology in 2019. Am. Anthropol. 2020, 122, 284–305. [Google Scholar] [CrossRef]
  22. Davis, D.S. Object-based image analysis: A review of developments and future directions of automated feature detection in landscape archaeology. Archaeol. Prospect. 2018, 25, 155–163. [Google Scholar] [CrossRef]
  23. Davis, D.S. Defining what we study: The contribution of machine automation in archaeological research. Digit. Appl. Archaeol. Cult. Herit. 2020, 18, e00152. [Google Scholar] [CrossRef]
  24. Sevara, C.; Pregesbauer, M.; Doneus, M.; Verhoeven, G.; Trinks, I. Pixel versus object–a comparison of strategies for the semi-automated mapping of archaeological features using airborne laser scanning data. J. Archaeol. Sci. Rep. 2016, 5, 485–498. [Google Scholar]
  25. Landauer, J.; Klassen, S.; Wijker, A.P.; van der Kroon, J.; Jaszkowski, A.; Verschoof-van der Vaart, W.B. Beyond the Greater Angkor Region: Automatic large-scale mapping of Angkorian-period reservoirs in satellite imagery using deep learning. PLoS ONE 2025, 20, e0320452. [Google Scholar] [CrossRef] [PubMed]
  26. Bundzel, M.; Jaščur, M.; Kováč, M.; Lieskovský, T.; Sinčák, P.; Tkáčik, T. Semantic Segmentation of Airborne LiDAR Data in Maya Archaeology. Remote Sens. 2020, 12, 3685. [Google Scholar] [CrossRef]
  27. Berganzo-Besga, I.; Orengo, H.A.; Lumbreras, F.; Carrero-Pazos, M.; Fonte, J.; Vilas-Estévez, B. Hybrid MSRM-Based Deep Learning and Multitemporal Sentinel 2-Based Machine Learning Algorithm Detects Near 10k Archaeological Tumuli in North-Western Iberia. Remote Sens. 2021, 13, 4181. [Google Scholar] [CrossRef]
  28. Landauer, J.; Maddison, S.; Fontana, G.; Posluschny, A.G. Archaeological Site Detection: Latest Results from a Deep Learning Based Europe Wide Hillfort Search. J. Comput. Appl. Archaeol. 2025, 8, 42–58. [Google Scholar] [CrossRef]
  29. Borie, C.; Parcero-Oubiña, C.; Kwon, Y.; Salazar, D.; Flores, C.; Olguín, L.; Andrade, P. Beyond Site Detection: The Role of Satellite Remote Sensing in Analysing Archaeological Problems. A Case Study in Lithic Resource Procurement in the Atacama Desert, Northern Chile. Remote Sens. 2019, 11, 869. [Google Scholar] [CrossRef]
  30. Mader, C.; Godde, P.; Behl, M.; Binder, C.; Hägele, E.; Isla, J.; Leceta, F.; Lyons, M.; Marsh, E.; Odenthal, R.; et al. An integrative approach to ancient agricultural terraces and forms of dependency: The case of Cutamalla in the prehispanic Andes. Front. Environ. Archaeol. 2024, 3, 1328315. [Google Scholar] [CrossRef]
  31. Sakai, M.; Sakurai, A.; Lu, S.; Olano, J.; Albrecht, C.M.; Hamann, H.F.; Freitag, M. AI-Accelerated Nazca Survey Nearly Doubles the Number of Known Figurative Geoglyphs and Sheds Light on Their Purpose. Proc. Natl. Acad. Sci. USA 2024, 121, e2407652121. [Google Scholar] [CrossRef]
  32. Perez-Torres, W.I.; Uman-Flores, D.A.; Quispe-Quispe, A.B.; Palomino-Quispe, F.; Bezerra, E.; Leher, Q.; Paixão, T.; Alvarez, A.B. Exploratory Analysis Using Deep Learning for Water-Body Segmentation of Peru’s High-Mountain Remote Sensing Images. Sensors 2024, 24, 5177. [Google Scholar] [CrossRef]
  33. Guo, J.; Zimmer-Dauphinee, J.R.M.; Nieusma, J.M.; Lu, S.; Liu, Q.; Deng, R.; Cui, C.; Yue, J.; Lin, Y.; Yao, T.; et al. DeepAndes: A Self-Supervised Vision Foundation Model for Multi-Spectral Remote Sensing Imagery of the Andes. Computer Vision and Pattern Recognition. arXiv 2025, arXiv:2504.20303. [Google Scholar] [CrossRef]
  34. Arkush, E.; Kohut, L.E.; Housse, R.; Smith, R.D.; Wernke, S.A. A new view of hillforts in the Andes: Expanding coverage with systematic imagery survey. Antiquity 2024, 98, 172–192. [Google Scholar] [CrossRef]
  35. Zimmer-Dauphinee, J.; VanValkenburgh, P.; Wernke, S.A. Eyes of the machine: AI-assisted satellite archaeological survey in the Andes. Antiquity 2024, 98, 245–259. [Google Scholar] [CrossRef]
  36. Jackson, D.; Méndez, C. Hallazgo o búsqueda de sitios paleoindios: Problemas de investigación en torno a los primeros poblamientos. Rev. Werken 2004, 5, 9–14. [Google Scholar]
  37. Saintenoy, T.; Ajata, R.; Guevara, A.L.R.; Sepulveda, M. Arqueología del territorio aldeano prehispánico tardío en los Altos de Arica: Aportes de la fotointerpretación satelital para el estudio regional de la cuenca alta de Azapa. Estud. Atacameños. Arqueol. Antropol. Surandinas 2017, 44, 85–110. [Google Scholar] [CrossRef]
  38. Osorio, D.; Jackson, D.; Ugalde, P.C.; Latorre, C.; De Pol-Holz, R.; Santoro, C.M. Hakenasa Cave and its relevance for the peopling of the southern Andean Altiplano. Antiquity 2011, 85, 1194–1208. [Google Scholar] [CrossRef]
  39. LeFebvre, R.P. Hakenasa: The archaeology of a rock shelter in the altiplano of northern Chile. Available from ProQuest Dissertations and Theses Global. (305154028). 2004. Available online: https://www.proquest.com/dissertations-theses/hakenasa-archaeology-rock-shelter-altiplano/docview/305154028/se-2 (accessed on 10 May 2024).
  40. Haboucha, R.; Jofré, D. Safeguarding Indigenous Heritage in the Chilean Atacama Desert: Negotiating Identity Claims and Community Perceptions of Long-term Climate Change. Herit. Soc. 2021, 14, 216–241. [Google Scholar] [CrossRef]
  41. Romero, H.; Méndez, M.; Smith, P. Mining development and environmental injustice in the Atacama Desert of northern Chile. Environ. Justice 2012, 5, 70–76. [Google Scholar] [CrossRef]
  42. Grosjean, A.; Santoro, C.M.; Thompson, L.G.; Núñez, L.; Standen, V.G. Mid-Holocene Climate and Culture Change in the South Central Andes. In Climate Change and Cultural Dynamics; Anderson, D.G., Maasch, K.A., Sandweiss, D.H., Eds.; Academic Press: Cambridge, MA, USA, 2007; pp. 51–115. [Google Scholar] [CrossRef]
  43. Méndez-Quirós, P.; Jackson, D. Urban expansion in northern Chile and its implications for cultural heritage. J. Anthropol. Archaeol. 2005, 24, 408–423. [Google Scholar]
  44. Payntar, N.D. A Multi-Temporal Analysis of Archaeological Site Destruction using Landsat Satellite Data and Machine Learning, Moche Valley, Peru. J. Comput. Cult. Herit. 2023, 16, 3. [Google Scholar] [CrossRef]
  45. Branca, D.; Haller, A. Urbanization, Touristification and Verticality in the Andes: A Profile of Huaraz, Peru. Sustainability 2021, 13, 6438. [Google Scholar] [CrossRef]
  46. Méndez-Quirós, P.; Barceló, J.A.; Santana-Sagredo, F.; Uribe, M. Modeling long-term human population dynamics using kernel density analysis of 14c data in the Atacama desert (18o–21oS). Radiocarbon 2023, 65, 665–679. [Google Scholar] [CrossRef]
  47. Rothhammer, F.; Santoro, C.M. El Desarrollo Cultural En El Valle De Azapa, Extremo Norte De Chile Y Su Vinculación Con Los Desplazamientos Poblacionales Altiplánicos. Lat. Am. Antiq. 2001, 12, 59–66. [Google Scholar] [CrossRef]
  48. Núñez, L.; Santoro, C. El tránsito Arcaico-Formativo en la Circumpuna y Valles Occidentales del Centro Sur Andino: Hacia los cambios “neolíticos”. Chungara 2011, 43, 487–530. [Google Scholar] [CrossRef]
  49. Núñez, L.; Dillehay, T.D. Movilidad Migratoria, Armonía Social y Desarrollo en los Andes Meridionales: El Caso de la Sociedad San Pedro de Atacama; Universidad Católica del Norte: Antofagasta, Chile, 1995; ISBN 9567012261. [Google Scholar]
  50. True, D.L.; Núñez, A.L.; Núñez, H.P. Archaeological Investigations in Northern Chile: Project Tarapaca—Preceramic Resources. Am. Antiq. 1970, 35, 170–184. [Google Scholar] [CrossRef]
  51. Uribe, M.; Gallardo, F. Tiwanaku en Chile: Nuevas evidencias, nuevos debates. Boletín Mus. Chil. Arte Precolomb. 2004, 13, 35–50. [Google Scholar]
  52. Saintenoy, T. Beyond Inca roads: The Redes Andinas project explores complex palimpsests of Andean Road networks. Antiquity 2024, 98, e22. [Google Scholar] [CrossRef]
  53. Santoro, C.; Uribe, M. Inca Imperial Colonization in Northern Chile. In The Oxford Handbook of the Incas; Sonia, A., Covey, A., Eds.; Oxford University Press: Oxford, UK, 2018; pp. 355–374. [Google Scholar] [CrossRef]
  54. Hidalgo, J.; Focacci, G. Historia prehispánica de Arica y el valle de Azapa. In Chungara: Revista de Antropología Chilena No. 16/17, actas x Congreso Nacional de Arqueologia Chilena (Octubre 1986); Universidad de Tarapaca: Arica, Chile, 1986; pp. 137–147. Available online: https://www.jstor.org/stable/27801889 (accessed on 4 September 2025).
  55. Saintenoy, T.; González Estefane, F.; Uribe Rodríguez, M. Desde la perspectiva de la isla: El ordenamiento territorial incaico en la transecta andina Arica-Carangas (18° S). Lat. Am. Antiq. 2019, 30, 393–414. [Google Scholar] [CrossRef]
  56. Muñoz, I.; Chacama, J. Transformación del paisaje social en Arica, Norte de Chile: De pescadores arcaicos a agricultores incipientes. Estud. Atacameños 2012, 44, 123–140. [Google Scholar] [CrossRef]
  57. Housse, R. Territorialité et Fortifications Entre la Côte Pacifique et l’Altiplano Méridional Andin à l’Intermédiaire Récent (1100–1450 Apr. J.-C.); Archéologie et Préhistoire; Université Panthéon-Sorbonne: Paris, France, 2021; Available online: https://theses.hal.science/tel-03519307v1 (accessed on 4 September 2025).
  58. Trier, Ø.D.; Cowley, D.; Waldeland, A.U. Using deep neural networks on airborne laser scanning data: Results from a case study of semi-automatic mapping of archaeological topography on Arran, Scotland. Archaeol. Prospect. 2019, 26, 165–175. [Google Scholar] [CrossRef]
  59. Verschoof-van der Vaart, W.B.; Landauer, J. Using CarcassonNet to automatically detect and trace hollow roads in LiDAR data from The Netherlands. J. Cult. Herit. 2021, 47, 143–154. [Google Scholar] [CrossRef]
  60. Esri. ArcGIS Pro, Version 2.9; Environmental Systems Research Institute: Redlands, CA, USA, 2021.
  61. Kokalj, Ž.; Džeroski, S.; Šprajc, I.; Štajdohar, J.; Draksler, A.; Somrak, M. Machine learning-ready remote sensing data for Maya archaeology. Sci. Data 2023, 10, 558. [Google Scholar] [CrossRef]
  62. Woo, S.; Debnath, S.; Hu, R.; Chen, X.; Liu, Z.; Kweon, I.S.; Xie, S. ConvNeXt V2: Co-Designing and Scaling ConvNets with Masked Autoencoders. In Proceedings of the IEEE/CVF Conference on Computer Vision and Pattern Recognition (CVPR), Vancouver, BC, Canada, 17–24 June 2023; pp. 16133–16142. [Google Scholar]
  63. Szegedy, C.; Liu, W.; Jia, Y.; Sermanet, P.; Reed, S.; Anguelov, D.; Erhan, D.; Vanhoucke, V.; Rabinovich, A. Going Deeper with Convolutions. In Proceedings of the IEEE Conference on Computer Vision and Pattern Recognition (CVPR), Boston, MA, USA, 7–12 June 2015; pp. 1–9. [Google Scholar] [CrossRef]
  64. Zhong, Z.; Zheng, L.; Kang, G.; Li, S.; Yang, Y. Random Erasing Data Augmentation. Proc. AAAI Conf. Artif. Intell. 2020, 34, 13001–13008. [Google Scholar] [CrossRef]
  65. Howard, J.; Gugger, S. Fastai: A Layered API for Deep Learning. Information 2020, 11, 108. [Google Scholar] [CrossRef]
  66. Paszke, A.; Gross, S.; Massa, F.; Lerer, A.; Bradbury, J.; Chanan, G.; Killeen, T.; Lin, Z.; Gimelshein, N.; Antiga, L.; et al. PyTorch: An Imperative Style, High-Performance Deep Learning Library. arXiv 2019, arXiv:1912.01703. [Google Scholar]
  67. Powers, D.M. Evaluation: From precision, recall and F-measure to ROC, informedness, markedness and correlation. arXiv 2020, arXiv:2010.16061. [Google Scholar] [CrossRef]
  68. Matthews, B.W. Comparison of the predicted and observed secondary structure of T4 Phage Lysozyme. Biochim. Biophisica Acta 1974, 405, 442–451. [Google Scholar] [CrossRef]
  69. Baldi, P.; Brunak, S.; Chauvin, Y.; Andersen, C.A.; Nielsen, H. Assessing the accuracy of prediction algorithms for classification: An overview. Bioinformatics 2000, 16, 412–424. [Google Scholar] [CrossRef]
  70. Chicco, D.; Jurman, G. The advantages of the Matthews correlation coefficient (MCC) over F1 score and accuracy in binary classification evaluation. BMC Genom. 2020, 21, 6. [Google Scholar] [CrossRef]
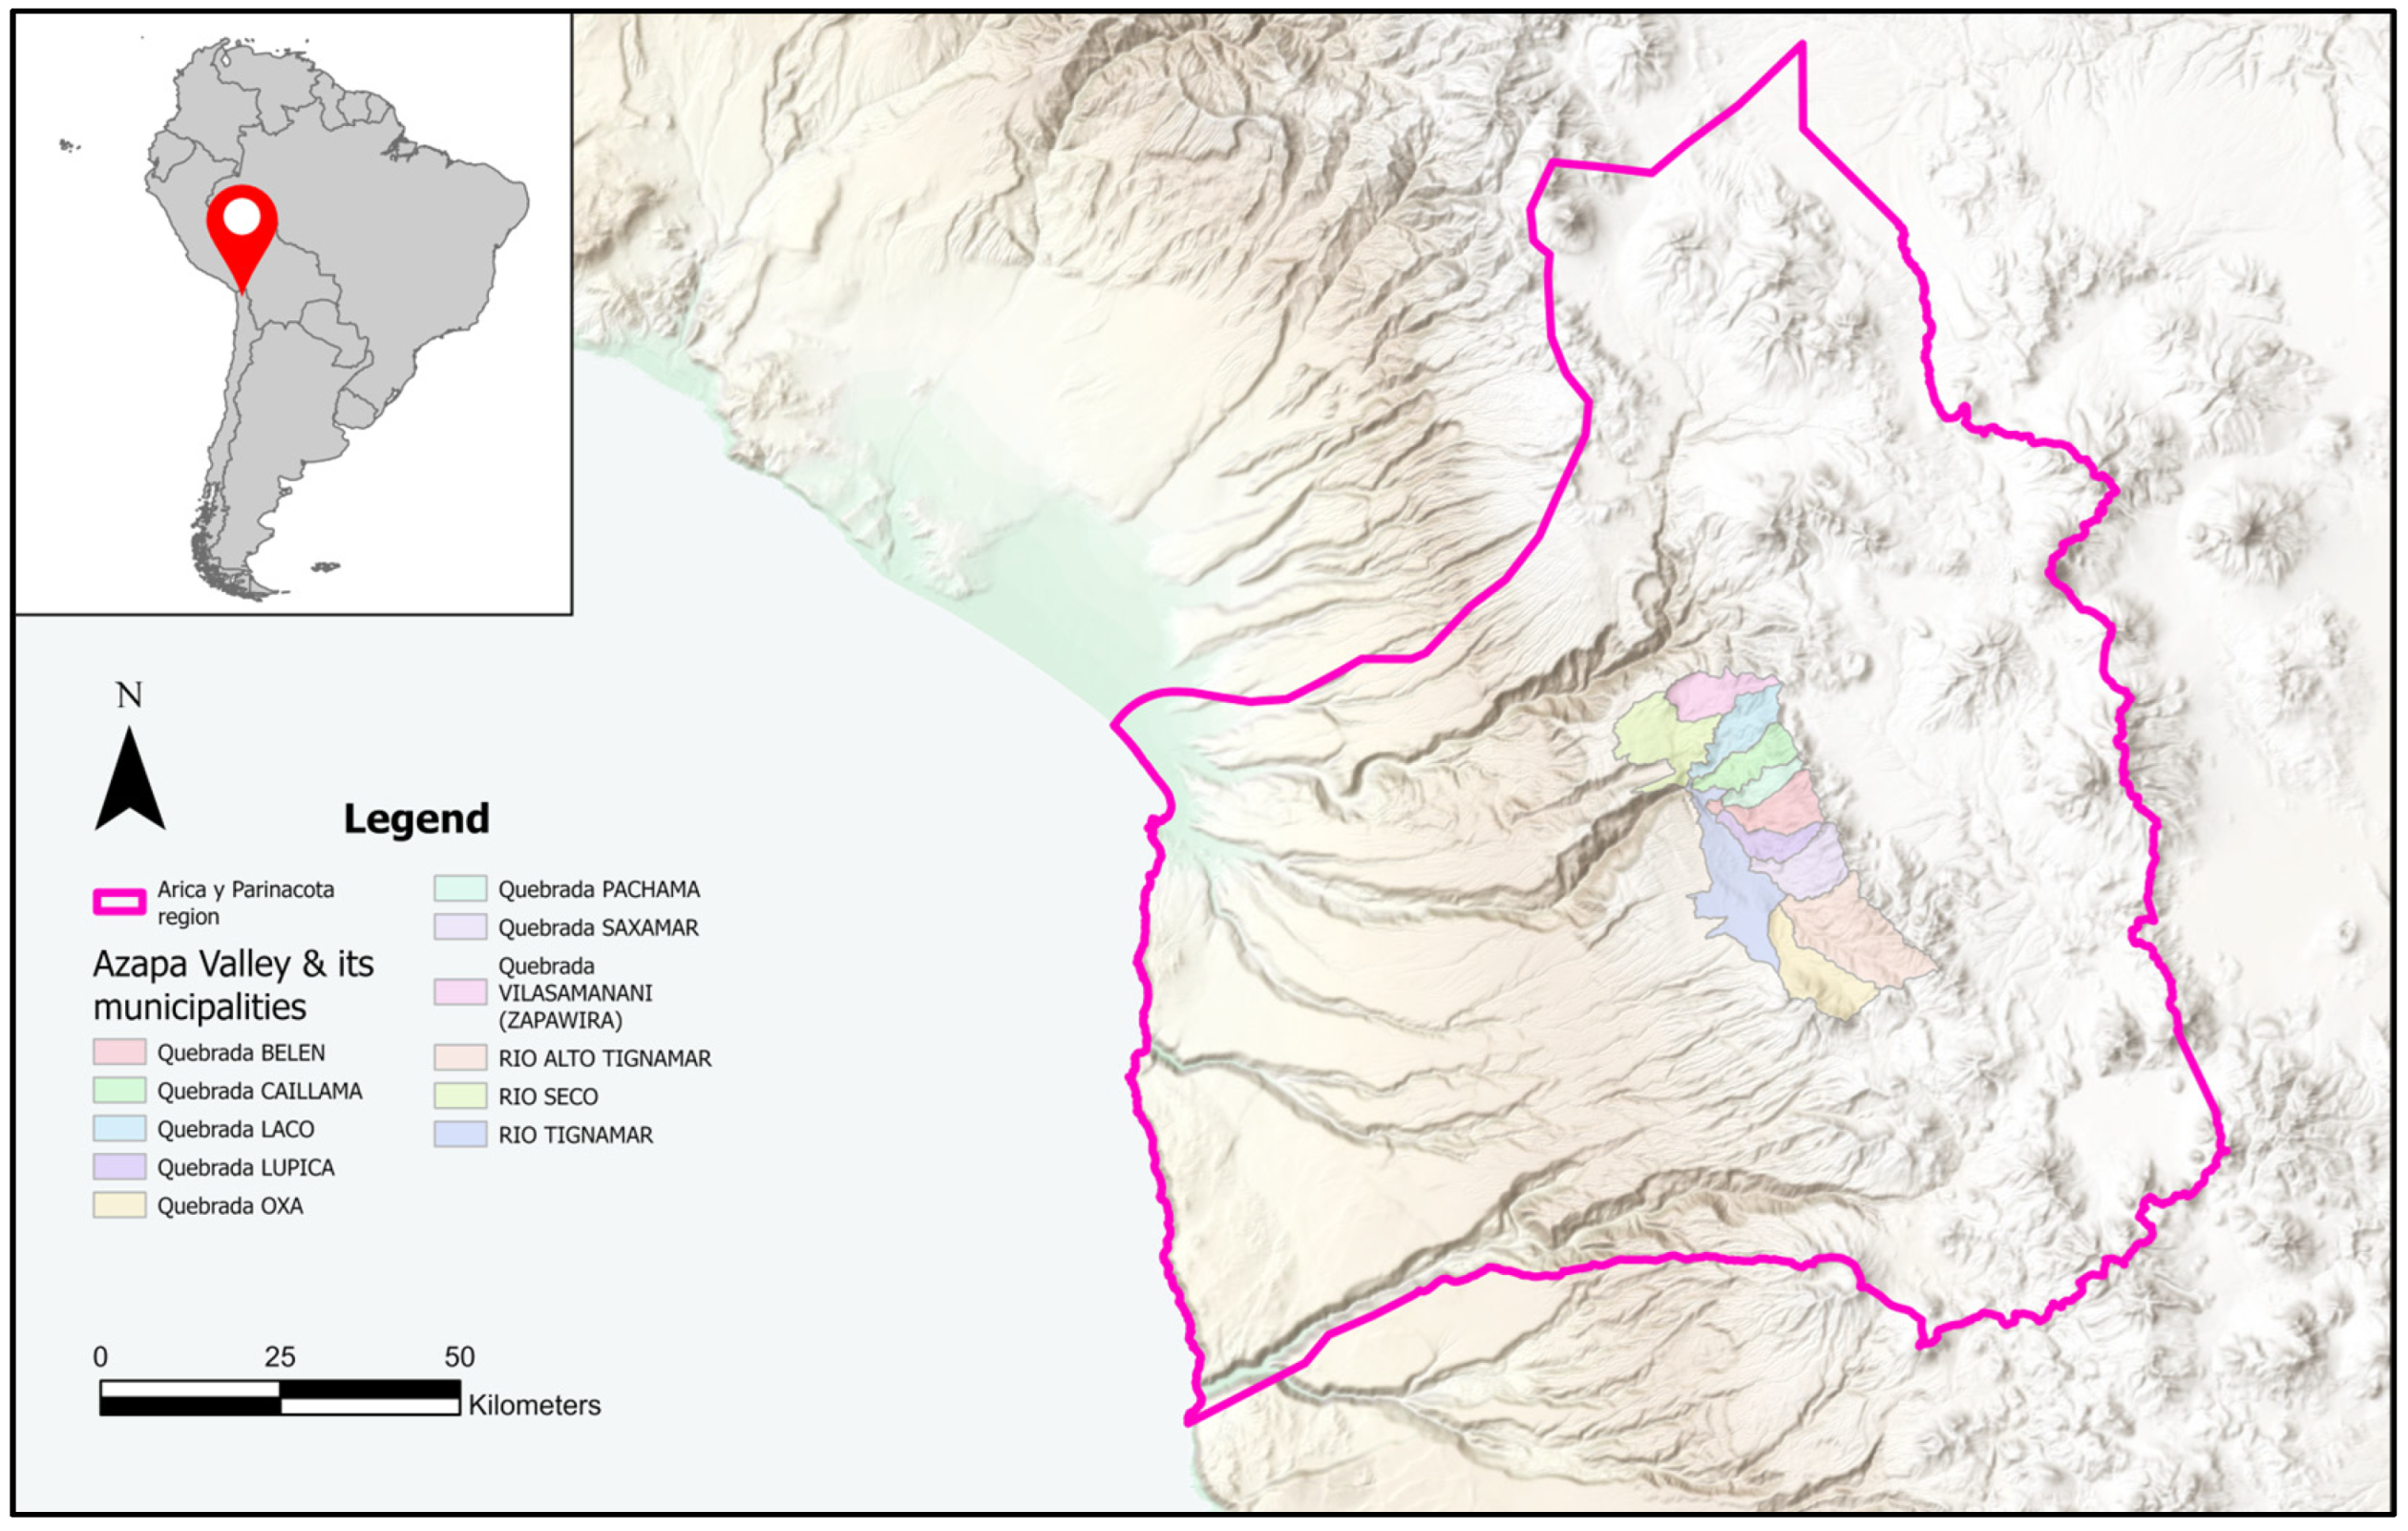
Figure 1. Study area. The purple line marks the Arica y Parinacota region and the colored polygons the Azapa valley with the different modern municipalities.
Remotesensing 17 03499 g001
Figure 2. Drone image of the Late pre-Hispanic residential settlement “Saxamara”. Example of a circular structure cluster.
Remotesensing 17 03499 g002
Figure 3. Close view of a typical Pre-Inca/Inca stone roundhouse (circular structure/pucara).
Remotesensing 17 03499 g003
Figure 4. Examples of 64 × 64 px patches around well-preserved structures.
Remotesensing 17 03499 g004
Figure 5. Map of the grid search. Green circles are the digitalized archaeological structures. Dots in varying shades of a red scale (from red to white) indicate the grid points and the computed likelihood of an archaeological structure being nearby. Red indicates low probability; white indicates high probability. For better visualization, grid points with probability values < 0.5 are not shown.
Remotesensing 17 03499 g005
Figure 6. Precision, Recall, F1 score and optimal discrimination threshold (a); MCC and optimal threshold (b). Values are shown for Precision (brown), Recall (purple), F1 score (teal) and MCC (blue) for each threshold interval of 0.05. The dashed vertical line indicates the optimal discrimination threshold of 0.85 with a F1 score resp. a MCC of 0.68.
Remotesensing 17 03499 g006
Figure 7. SW area showing prediction results (Saxamara site). Examples for identified (red circles) and non-identified structures (white circles) within the test region at threshold 0.85.
Remotesensing 17 03499 g007
Figure 8. Heatmap of structure detection. Darker, violet areas represent higher probability of archaeological features being present. Green circles represent the location of the already known archaeological structure.
Remotesensing 17 03499 g008
Figure 9. Illustration of a circular structure in poor conservation condition with collapsed walls.
Remotesensing 17 03499 g009
Figure 10. Concentration of grid points with probability scores > 0.85 and newly detected structures. Left: Detail of the SW test area with known structures (green circles) and concentration of grid points with probability scores > 0.85, blue colors indicating low concentrations and yellow colors indicating high concentrations. Right: Zoom into the white rectangle from the left panel, group of newly identified structures.
Remotesensing 17 03499 g010
Table 1. Prediction results in SW test area using different thresholds. The bold line indicates the optimal discrimination threshold according to the F1 score and MCC tests presented in Figure 6.
ThresholdIdentified Structures% of Structures IdentifiedNon-Identified StructuresTP
Grid Points
FP
Grid Points
FN
Grid Points
FP Area [m2]FP Area
(% of Test Area)
PrecisionRecallF1 scoreMCC
0.520794%14938119720943,0920.49%0.440.820.570.60
0.5520593%16918103622937,2960.43%0.470.800.590.62
0.620492%1790090924732,7240.37%0.500.780.610.62
0.6520392%1887980526828,9800.33%0.520.770.620.63
0.719890%2386067828724,4080.28%0.560.750.640.65
0.7519689%2583957330820,6280.24%0.590.730.660.66
0.819186%3080746634016,7760.19%0.630.700.670.67
0.8518785%3476332438411,6640.13%0.700.670.680.68
0.917680%4563116651659760.07%0.790.550.650.66
0.959443%127152179956120.01%0.900.130.230.34
Disclaimer/Publisher’s Note: The statements, opinions and data contained in all publications are solely those of the individual author(s) and contributor(s) and not of MDPI and/or the editor(s). MDPI and/or the editor(s) disclaim responsibility for any injury to people or property resulting from any ideas, methods, instructions or products referred to in the content.