Technical Note

Generating Accurate De-Noising Vectors for Sentinel-1: 10 Years of Continuous Improvements

1
Aresys s.r.l., Via Luigi Cadorna, 66a, 20055 Vimodrone, Italy
2
E-Geos, an ASI/Telespazio Company, Via Tiburtina, 965, 00156 Roma, Italy
3
CLS Group, 300, rue Pierre Rivoalon, 29280 Plouzané, France
4
ESA, Via Galileo Galilei, 1, 00044 Frascati, Italy
5
Starion for ESA, Via di Grotte Portella 28, 00044 Frascati, Italy
*
Author to whom correspondence should be addressed.
Remote Sens. 2025, 17(20), 3474; https://doi.org/10.3390/rs17203474
Submission received: 21 August 2025 / Revised: 19 September 2025 / Accepted: 9 October 2025 / Published: 17 October 2025
(This article belongs to the Section Earth Observation Data)

Abstract

Highlights

What are the main findings?
  • The noise vectors annotated in the S-1 L1 products have been optimized during the last 10 years to represent, with the highest accuracy, the effective thermal noise level in the data.
  • The lessons learned from S-1A and S-1B allowed obtaining high-quality noise vectors for S-1C and S-1D from the beginning of the operational phase.
What is the implication of the main finding?
  • The optimized noise vectors can be used by the users to de-noise the S-1 data, which is particularly useful in obtaining unbiased radiometric measures, especially over low-backscatter areas and cross-pol data.
  • It will be possible to generate good-quality noise vectors for past S-1 products as well, exploiting dedicated open-source S-1 tools.

Abstract

The Copernicus Programme is a joint European initiative developed by the European Commission (EC) and the European Space Agency (ESA) to provide accurate, up-to-date, and comprehensive Earth observation data for environmental monitoring, climate change analysis, disaster management, and security. The Copernicus program comprises a series of dedicated satellite missions, i.e., the Sentinels spanning a wide range of the electromagnetic spectrum with different sensing techniques. Sentinel-1 is the radar imaging component of Copernicus. It is a two-satellite constellation placed in the same orbit and spaced 180° apart. The all-weather, day-and-night images of Earth’s surface are systematically provided by Sentinel-1 to the Copernicus service component and to scientific users. The Sentinel-1 SAR data are suitable for interferometric and radiometric applications, whose performance depends on the thermal noise level in the data. The paper provides a comprehensive overview of the activities spanning 10 years, focused on properly measuring, characterizing, and removing the thermal noise from S-1 data.

Graphical Abstract

1. Introduction

The first-generation Sentinel-1 [1] is composed of four satellite units developed in two batches. The first two units (S-1A and S-1B) were launched two years apart in 2014 and 2016. The third unit (S-1C) was launched in December 2024 while the fourth one (S-1D) should be be launched before the end of 2025. Sentinel-1 is characterized by large-scale and repetitive observations, systematic production, and a free and open data policy, i.e., the mission is designed to acquire data globally, to systematically process and deliver products with a timeliness compliant with operational use. Furthermore, the data is made freely available to an ever-growing user community. The S-1A and S-1B constellation has performed as intended, up to the failure of the S-1B spacecraft in December 2021.
The Sentinel-1 satellites carry an advanced C-band Synthetic Aperture Radar instrument [2], providing fast scanning in elevation and in azimuth to enable the implementation of the TOPSAR acquisition mode [3]. The raw data acquired by the SAR instrument are packetized on-board into the so-called Instrument Source Packets (ISPs), downlinked through the dedicated ground stations, and finally included in the SAFE Level-0 products that are available to the users. The Level-0 products are then ingested by the S-1 Instrument Processing Facility (IPF) [4], the sub-system of the S-1 Payload Data Ground Segment (PDGS) [5] responsible for the generation of the Level-1 and Level-2 products.
The SAFE L1 products, freely available to all users, provide high-resolution RADAR images of the Earth’s surface for land and ocean services. The high coherence of the data is exploited for interferometric applications [6], whereas other applications only rely upon the image intensity [7]. The latter, also exploiting the availability of polarimetric data (e.g., change detection), is gaining importance and reaching a similar level of performance compared to those based on optical images. The applications exploiting the data intensity to retrieve geophysical parameters such as soil moisture [8], or wind speed over ocean [9], require calibrated SAR images [10]. Furthermore, for scenes with low backscatter, the instrument’s thermal noise power shall be completely removed to obtain unbiased measures. The S-1 IPF does not perform the noise subtraction operationally, but provides, in the product annotations, the relevant information needed for the operation. The noise-power information is retrieved from dedicated pulses in the S-1 acquisition timeline [11].
The S-1 noise characterization and calibration is one of the many tasks of the SAR Mission Performance Cluster (SAR MPC), an international consortium of SAR experts in charge of the continuous monitoring of the S-1 instruments’ status and of the L1 and L2 products’ quality. The MPC is responsible for detecting any potential issues and for implementing the necessary actions (e.g., updating the processor’s configuration files) to ensure that no data quality degradation occurs for the users.
The paper provides a comprehensive overview of the activities, carried out in the framework of the SAR MPC since the launch of S-1A, to improve the quality of the de-noising vectors in the S-1 products.

2. Methods

2.1. SAR Data and Thermal Noise

The focused Single-Look Complex (SLC) data are complex numbers including the desired signal component, providing information on the backscatter properties of the observed targets, and an unavoidable thermal noise component. The Signal-to-Noise Ratio (SNR) is the ratio between signal and thermal noise power and depends on the system design and on the backscatter level in the imaged scene.
The sensitivity of a SAR system, i.e., the Normalized Radar Cross-Section (NRCS) of a distributed target resulting in S N R = 1 , is a standard quality parameter called Noise-Equivalent Sigma Nought (NESZ). The NESZ of a system can be modeled as:
N E S Z = 4 · 4 π 3 · R 3 · k · T · B r g · F · V S · sin θ i n c · L P T X · d c · G · λ 3 · c ,
where
  • R is the slant range.
  • k is the Boltzmann constant.
  • T is the system temperature.
  • B r g is the range bandwidth of the transmitted pulse.
  • F is the noise figure of the system.
  • V S is the satellite velocity.
  • θ i n c is the incidence angle.
  • L is the loss term that includes system losses, propagation losses, and processing losses.
  • P T X is the transmitted power.
  • d c is the transmission duty cycle, i.e., the product of the Tx pulse length and of the Pulse Repetition Frequency (PRF).
  • G is the two-way antenna gain in the direction of the target.
  • λ is the RADAR wavelength.
  • c is the speed of light.
The NESZ equation, Equation (1), is evaluated during the early phases of a mission to predict the expected system performance and to ease the system design process by identifying the optimal instrument, antenna, acquisition, geometry, and processing configurations. As an example, Figure 1 shows the predicted NESZ for the S-1 TopSAR Interferometric Wide Swath (IWS) mode at minimum (about 698 km, image on the left) and maximum (about 725 km, image on the right) satellite altitude. The NESZ is provided as a function of the incidence angle for the three IWS sub-swaths (IW1 in blue, IW2 in green, and IW3 in red). The better performance of IW3 is related to the implementation of a narrower beam in the elevation direction, resulting in a higher antenna gain. The predicted NESZ level has been verified on the data during the Commissioning Phase [12] and is continuously verified as part of the SAR MPC activities.
The thermal noise affects the quality of SAR images from both a radiometric and an interferometric point of view. The accuracy of the interferometric phase σ ϕ can be modeled as:
σ ϕ = 1 γ 1 γ 2 2 N ,
where γ is the so-called interferometric coherence and N is the number of independent looks considered for the phase estimation. The interferometric coherence, a quality indicator for interferometric images, depends on several parameters, including for instance the temporal and spatial baseline of the interferometric pair and the nature of the targets. The interferometric coherence component related to the thermal noise can be expressed as:
γ t h = 1 1 + S N R 1 .
The radiometric resolution ρ R A D , represents the capability of the SAR system to distinguish targets with similar backscattering properties. The radiometric resolution is again dependent on the SNR and on the number of looks N considered for the estimation of the target amplitude:
ρ R A D = 10 log 10 1 + 1 + S N R 1 N ,
The quality parameters reported above suggest that:
  • it is paramount to know the SNR of a SAR image to be able to assess the accuracy of the geophysical parameters that will be measured from that image;
  • the effect of thermal noise can be partially mitigated by increasing the number of looks used for the phase or amplitude estimation, at the cost of a proportional reduction in the geometric resolution.
The problem of estimating the noise level from SAR data will be discussed in the following sections. Focusing on the thermal noise mitigation aspect, it is worth noting that increasing the number of looks allows us to improve the radiometric resolution, but:
  • targets below the thermal noise level will not be discernible in the SAR image;
  • the estimation of the reflectivity of targets close to the thermal noise level will be biased.
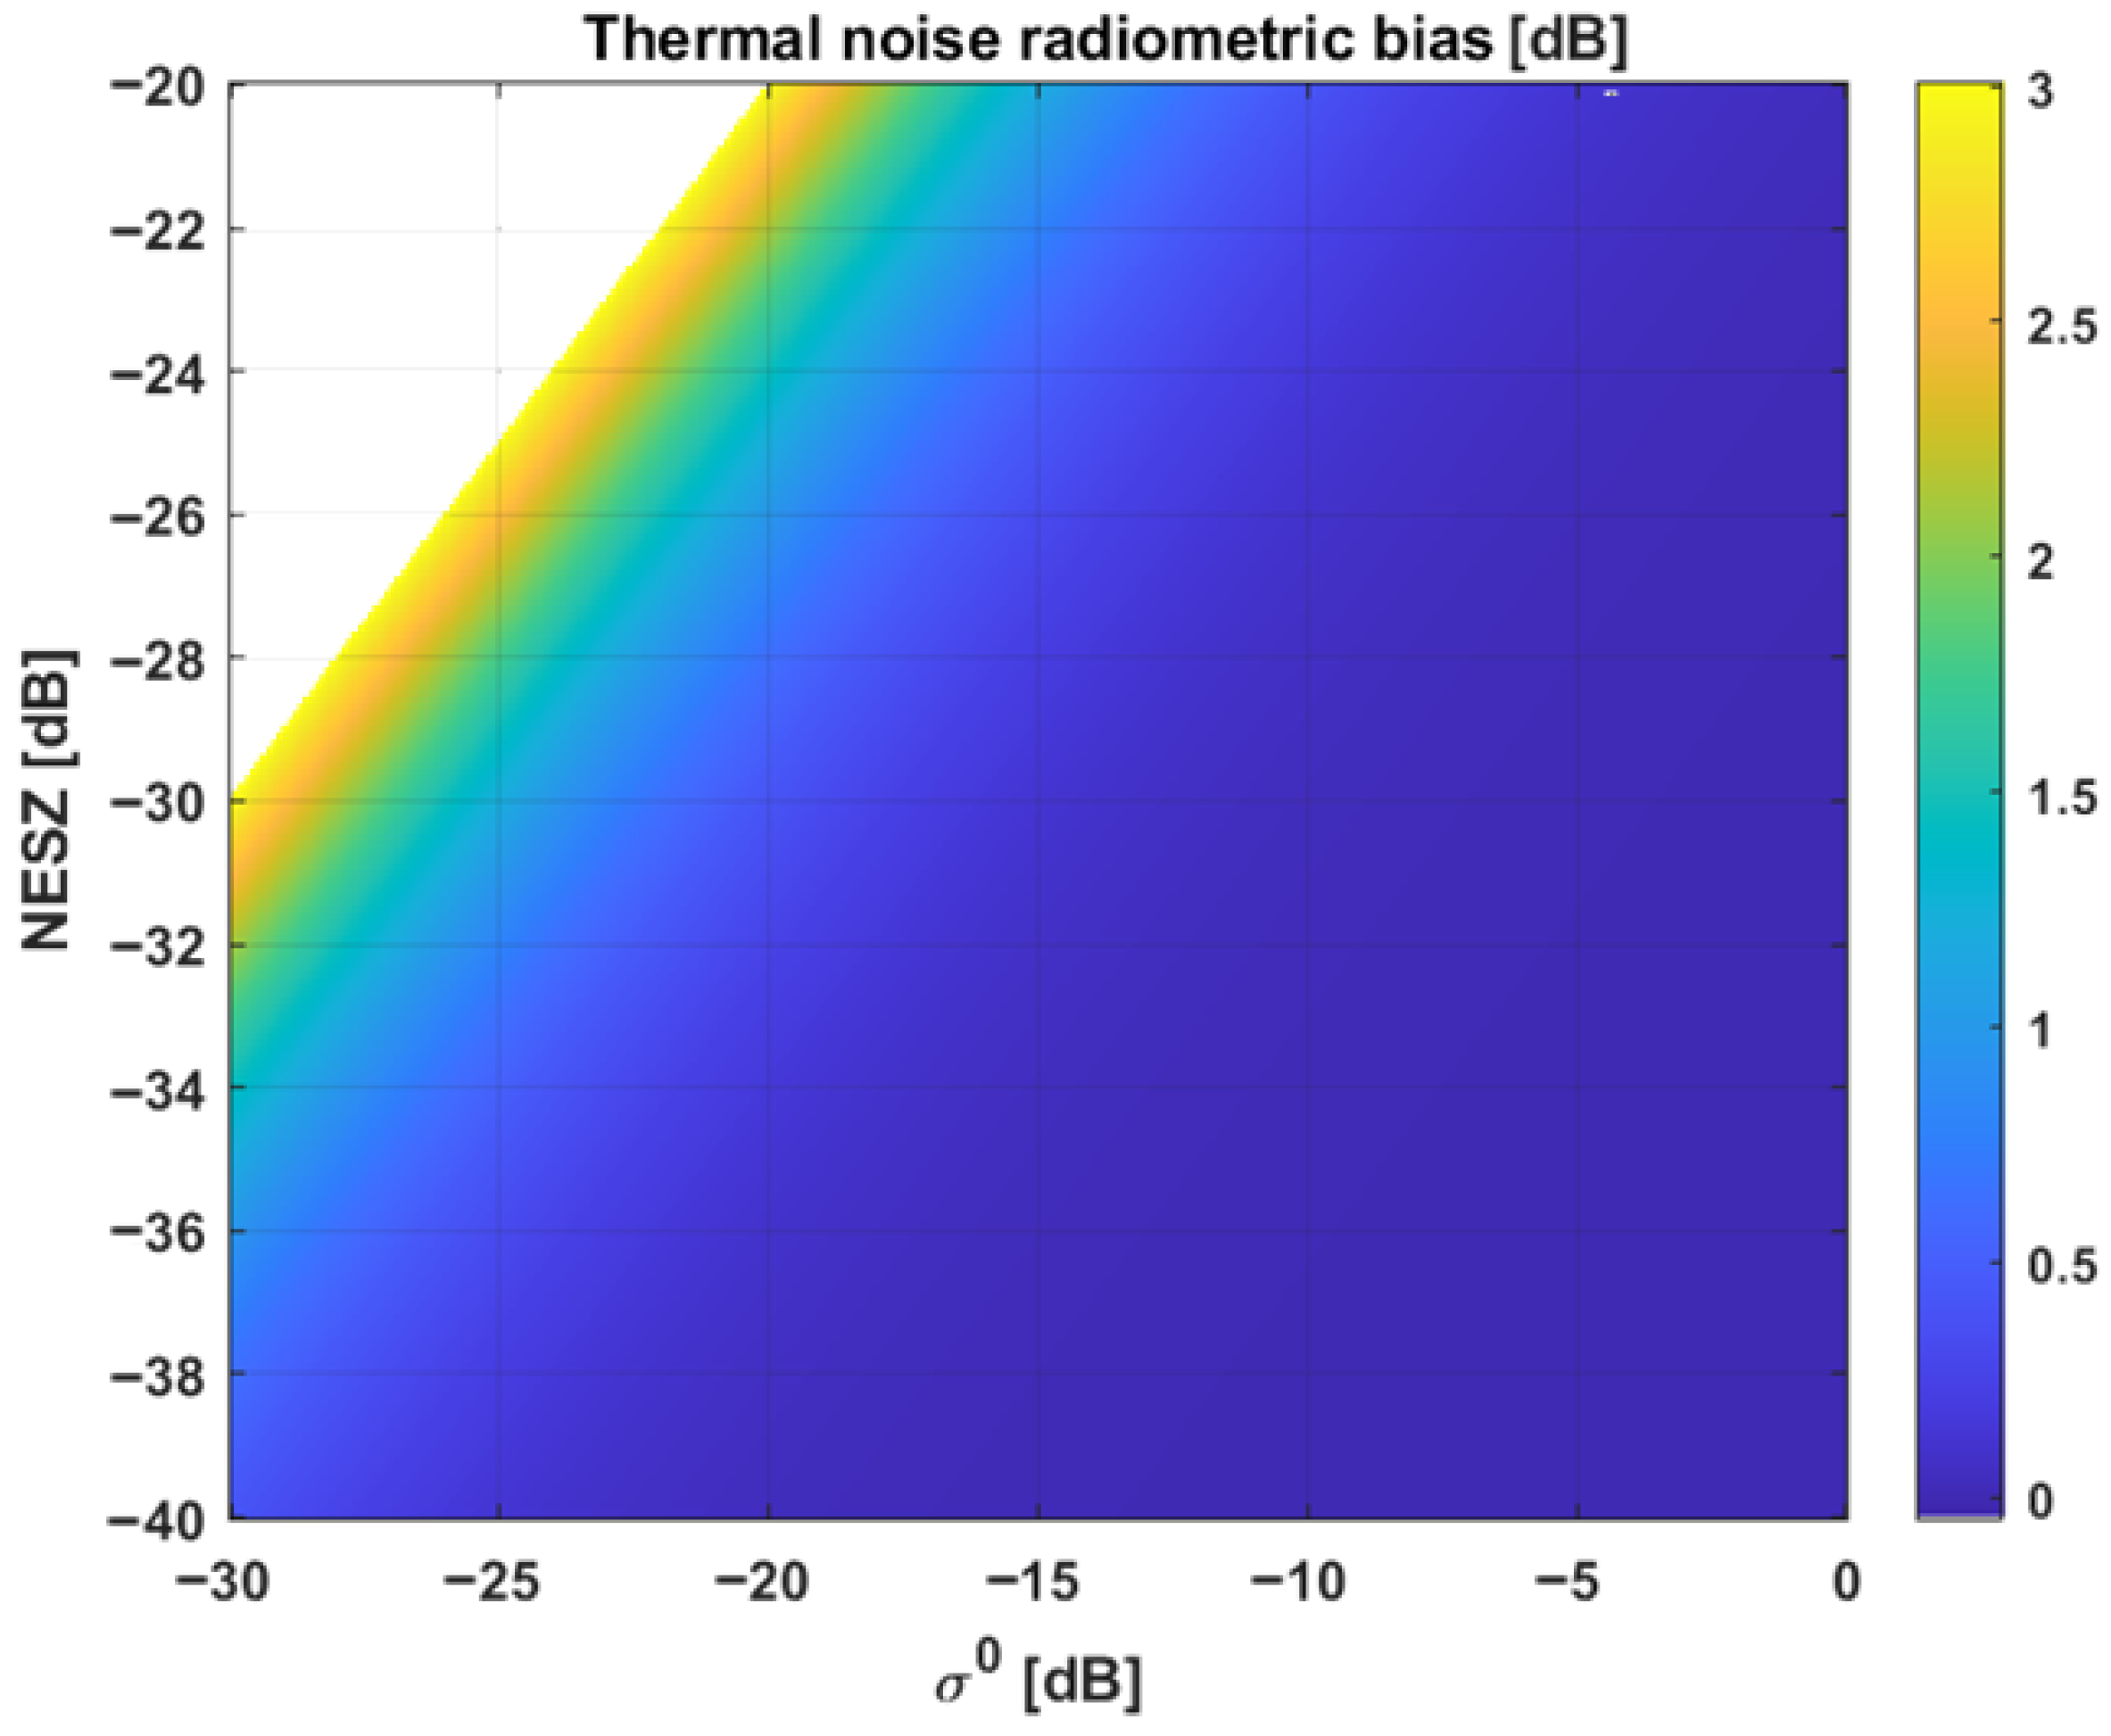
Figure 2 represents the radiometric bias introduced by the thermal noise as a function of the system NESZ (vertical axis) and of the target NRCS (horizontal axis). The white area represents the targets below the system sensitivity. The bias can be up to 3 dB for targets with NRCS close to the NESZ and disappears with the increase in the SNR, becoming negligible for SNR > 10 dB. The introduced radiometric bias can be mitigated by subtracting the expected thermal noise level from the data, the so-called de-noising operation. The effectiveness of the de-noising operation depends on the accuracy of the knowledge of the thermal noise level.
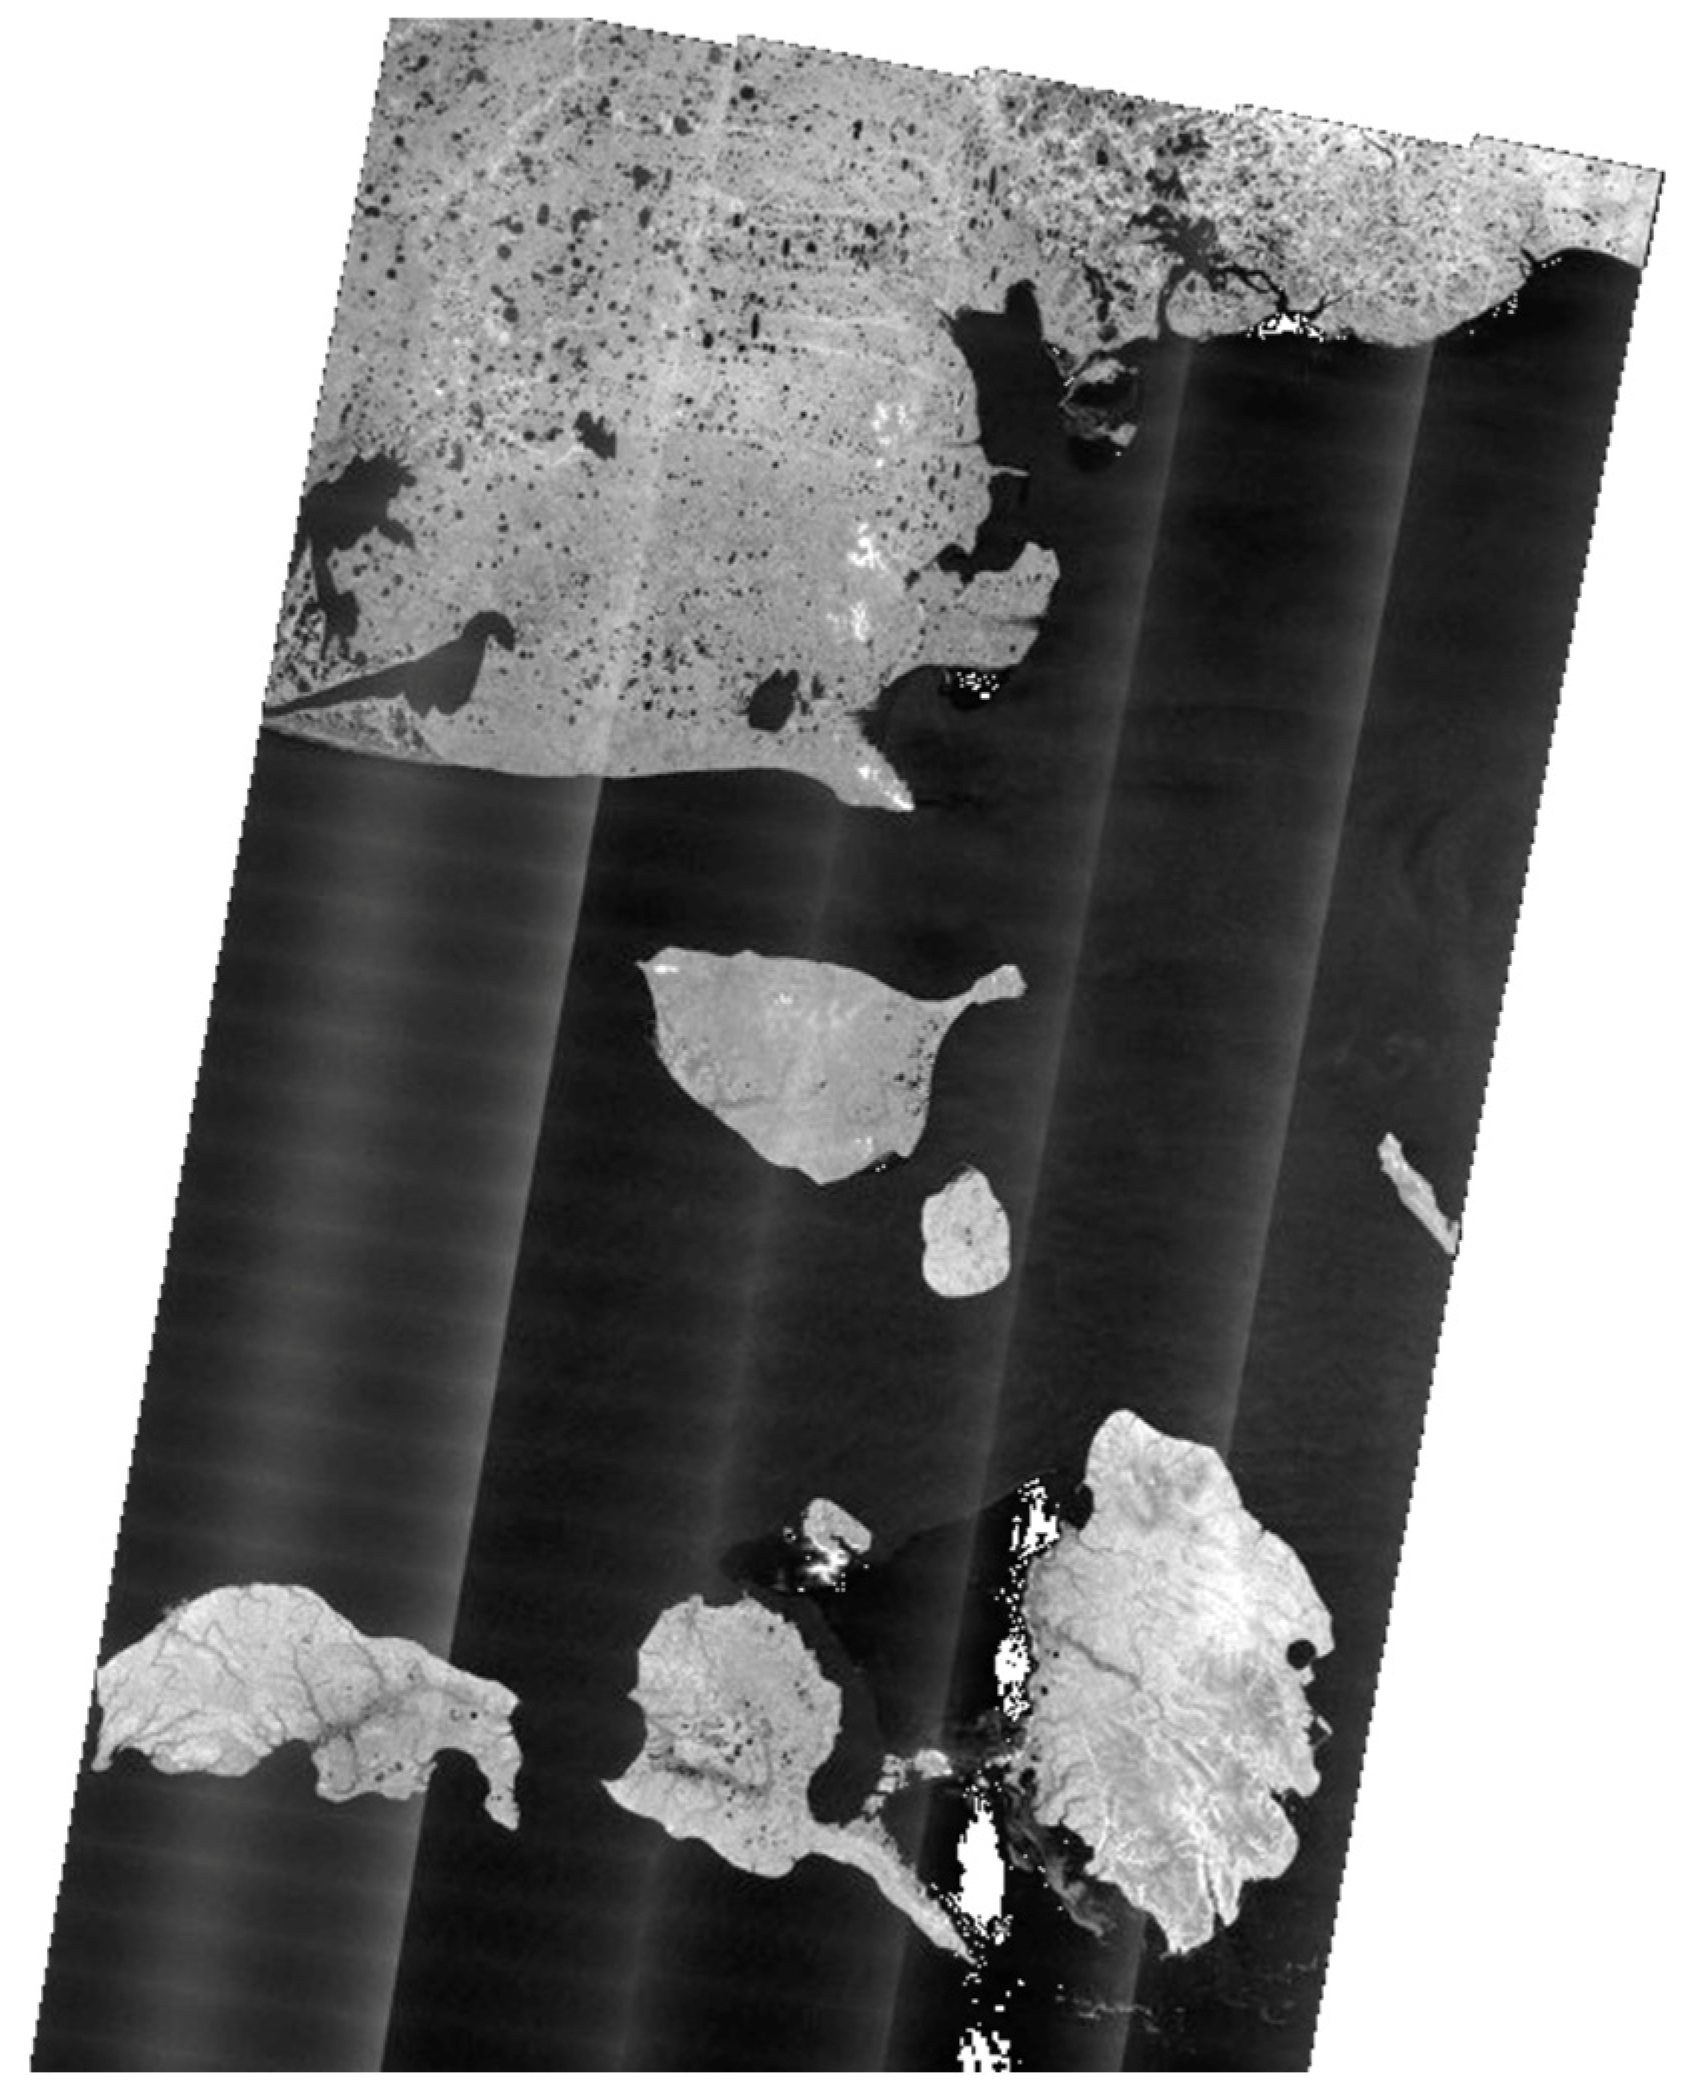
Figure 3 provides an example of the thermal noise effect in the cross-pol channel of an S1A EW product. The image shows discontinuities at bursts and sub-swaths edges over the sea, where the backscatter is very close or below the NESZ level. On the other hand, no discontinuities are observed over land where the backscatter is larger.

2.2. SAR Data Radiometric Corrections

The SAR processor performs range and azimuth compression of the acquired raw data [13] and implements a set of corrections aimed at compensating for the data distortions introduced by the instrument (e.g., the antenna patterns) and by the acquisition geometry (e.g., the spread losses). Figure 4 represents a flow chart of the radiometric corrections applied by the S-1 IPF during L1 product generation. Please note that the implemented radiometric corrections affect both signal and noise.

2.2.1. Internal Calibration

The S-1 instrument implements an internal calibration strategy aimed at measuring the instrument phase and gain drifts during an acquisition (e.g., due to temperature variations). The drifts are measured through dedicated calibration pulses that characterize a certain portion of the instrument. The pulses used for the internal calibration are LFM chirps either with the nominal bandwidth of the swaths (during pre- and post-amble; see Section 2.3.2 for more details) or with a 100 MHz bandwidth during data acquisition. The combination of the different pulses allows the processor to reconstruct the signal replica that is then compressed with the reference chirp to compute the instrument gain and phase as a function of time.
S-1A and S-1B instruments make use of 5 calibration pulses (Tx, Rx, TA, APDN, and EPDN) while, following a simplification of the instrument design, S-1C and S-1D only use 3 calibration pulses (TX, RX and EPDN). The calibration pulses are collected at regular intervals during an acquisition. A full calibration cycle requires about 5.5 s (corresponding to two burst cycles) for IW mode and about 3 s for EW mode (corresponding to a single burst cycle). A complete description of the internal calibration functionality is reported in [11].
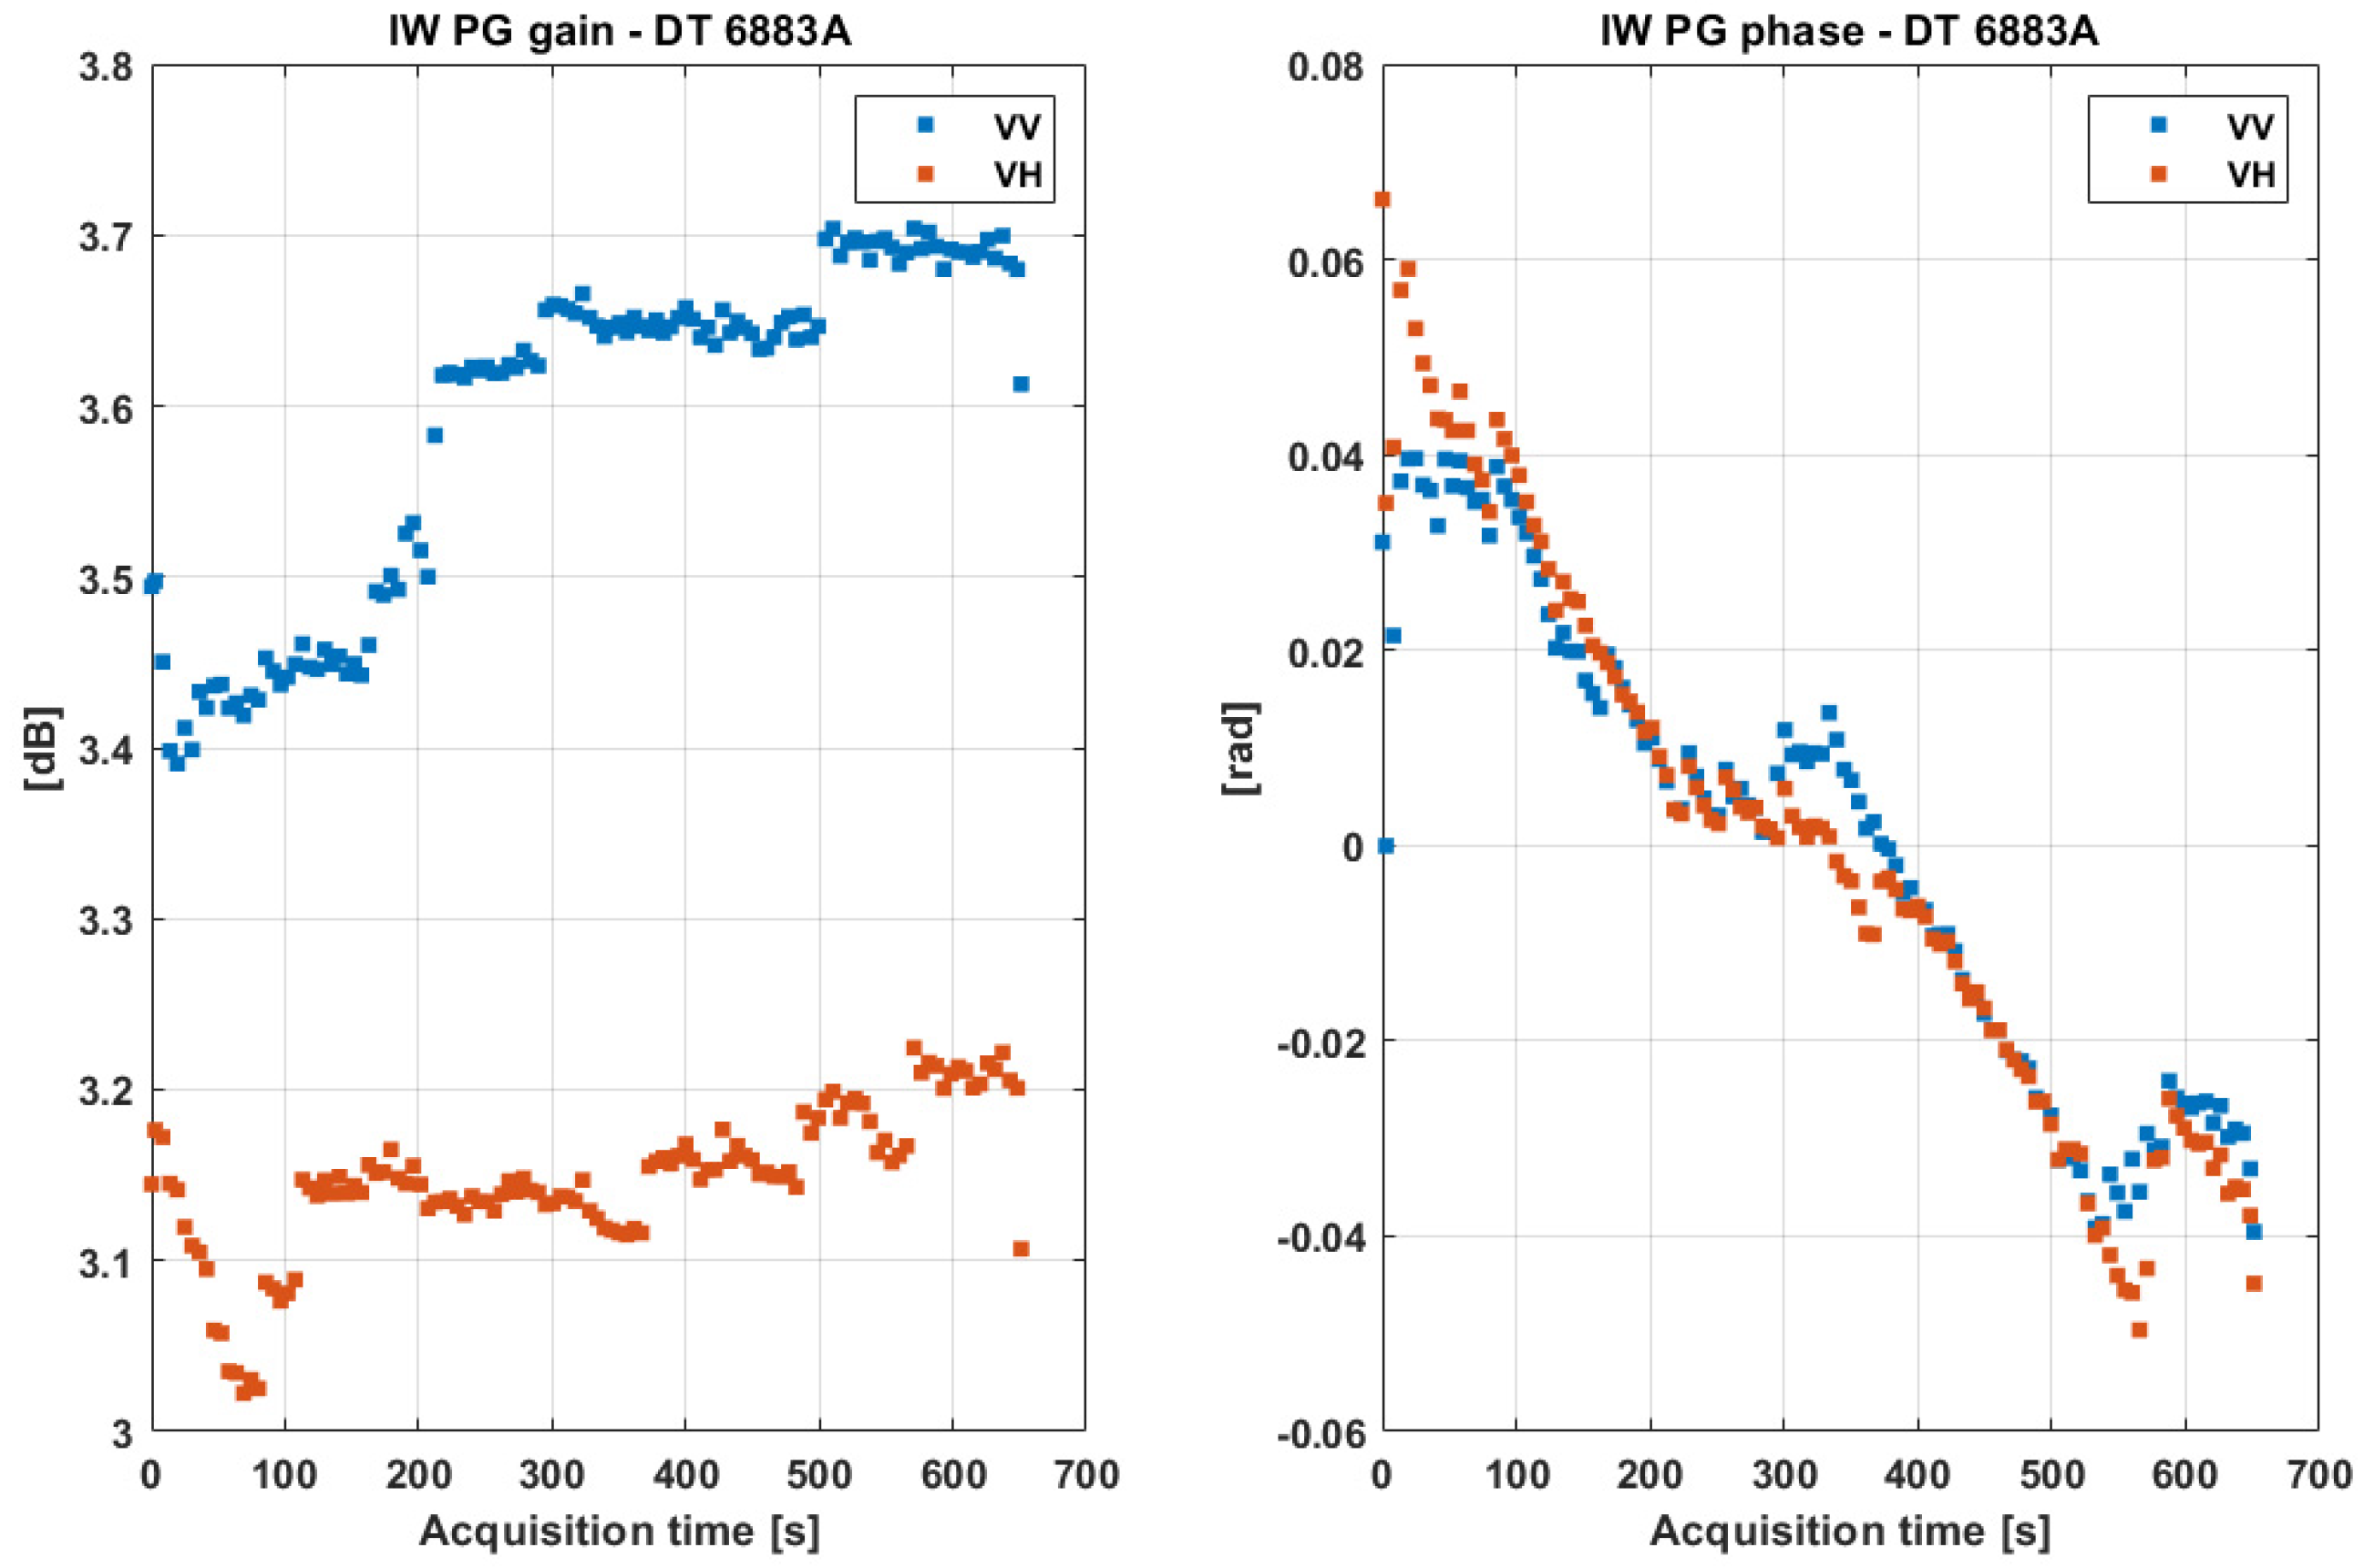
An example of the PG evolution during a data take of more than 10 min is reported in Figure 5. The blue dots represent the co-pol (VV) channel while the orange ones the cross-pol 8VH) channel. The peak-to-peak amplitude variation (plot on the left) is about 0.3 dB for the co-pol channel and about 0.2 dB for the cross-pol channel, whereas the peak-to-peak phase variation (lot on the right) is less than 7 degrees for both channels. Please note that an inessential phase constant has been removed for the phase values to align them on the same vertical scale of the plot. The observed gain and phase variations are related to the temperature increase observed during the data acquisition, which are only partially mitigated by the on-board temperature compensation strategy. Quick oscillations of both the phase and the amplitude can be observed at the beginning of the acquisition when the temperature variation is faster. A more linear trend is observed after that. Overall, the phase variation is smoother than the amplitude variation since the dependency of the phase on temperature is more important.
The S1 IPF exploits the gain and phase values from the internal calibration sequences to compensate the raw data by linearly interpolating them. The applied radiometric correction is:
G c h t = P G r e f P G t
The PG values are reported in the L1 annotations (replicaInformationList section). The internal calibration results are also useful for the long-term monitoring of instrument health. The long-term PG monitoring for IW VV pol is reported in Figure 6. A few jumps in the time series can be observed, which are related to past instrument events:
  • The largest jump happened in September 2014 following the updating of the on-board Rx gain settings after the Commissioning Phase. This was needed to improve the efficiency of the flexible dynamic block adaptive quantization (FDBAQ) implemented on-board [14]
  • A few jumps can be observed till mid 2015, due to intermittent failures in tile 5. This was fixed in 2015 by switching to a redundant configuration for tile 5.
  • A small jump is observed in June 2016 due to an on-board issue affecting tile 11. Since then, the lower half of the tile 11 has been operated with reduced Tx power, resulting in the observed PG reduction.
  • Finally, a very small decrease in time likely due to instrument aging can be observed.
Figure 6. Evolution of mean PG gain value for S1A IW1 VV from the mission start in April 2014 until today.
Remotesensing 17 03474 g006

2.2.2. Antenna Patterns

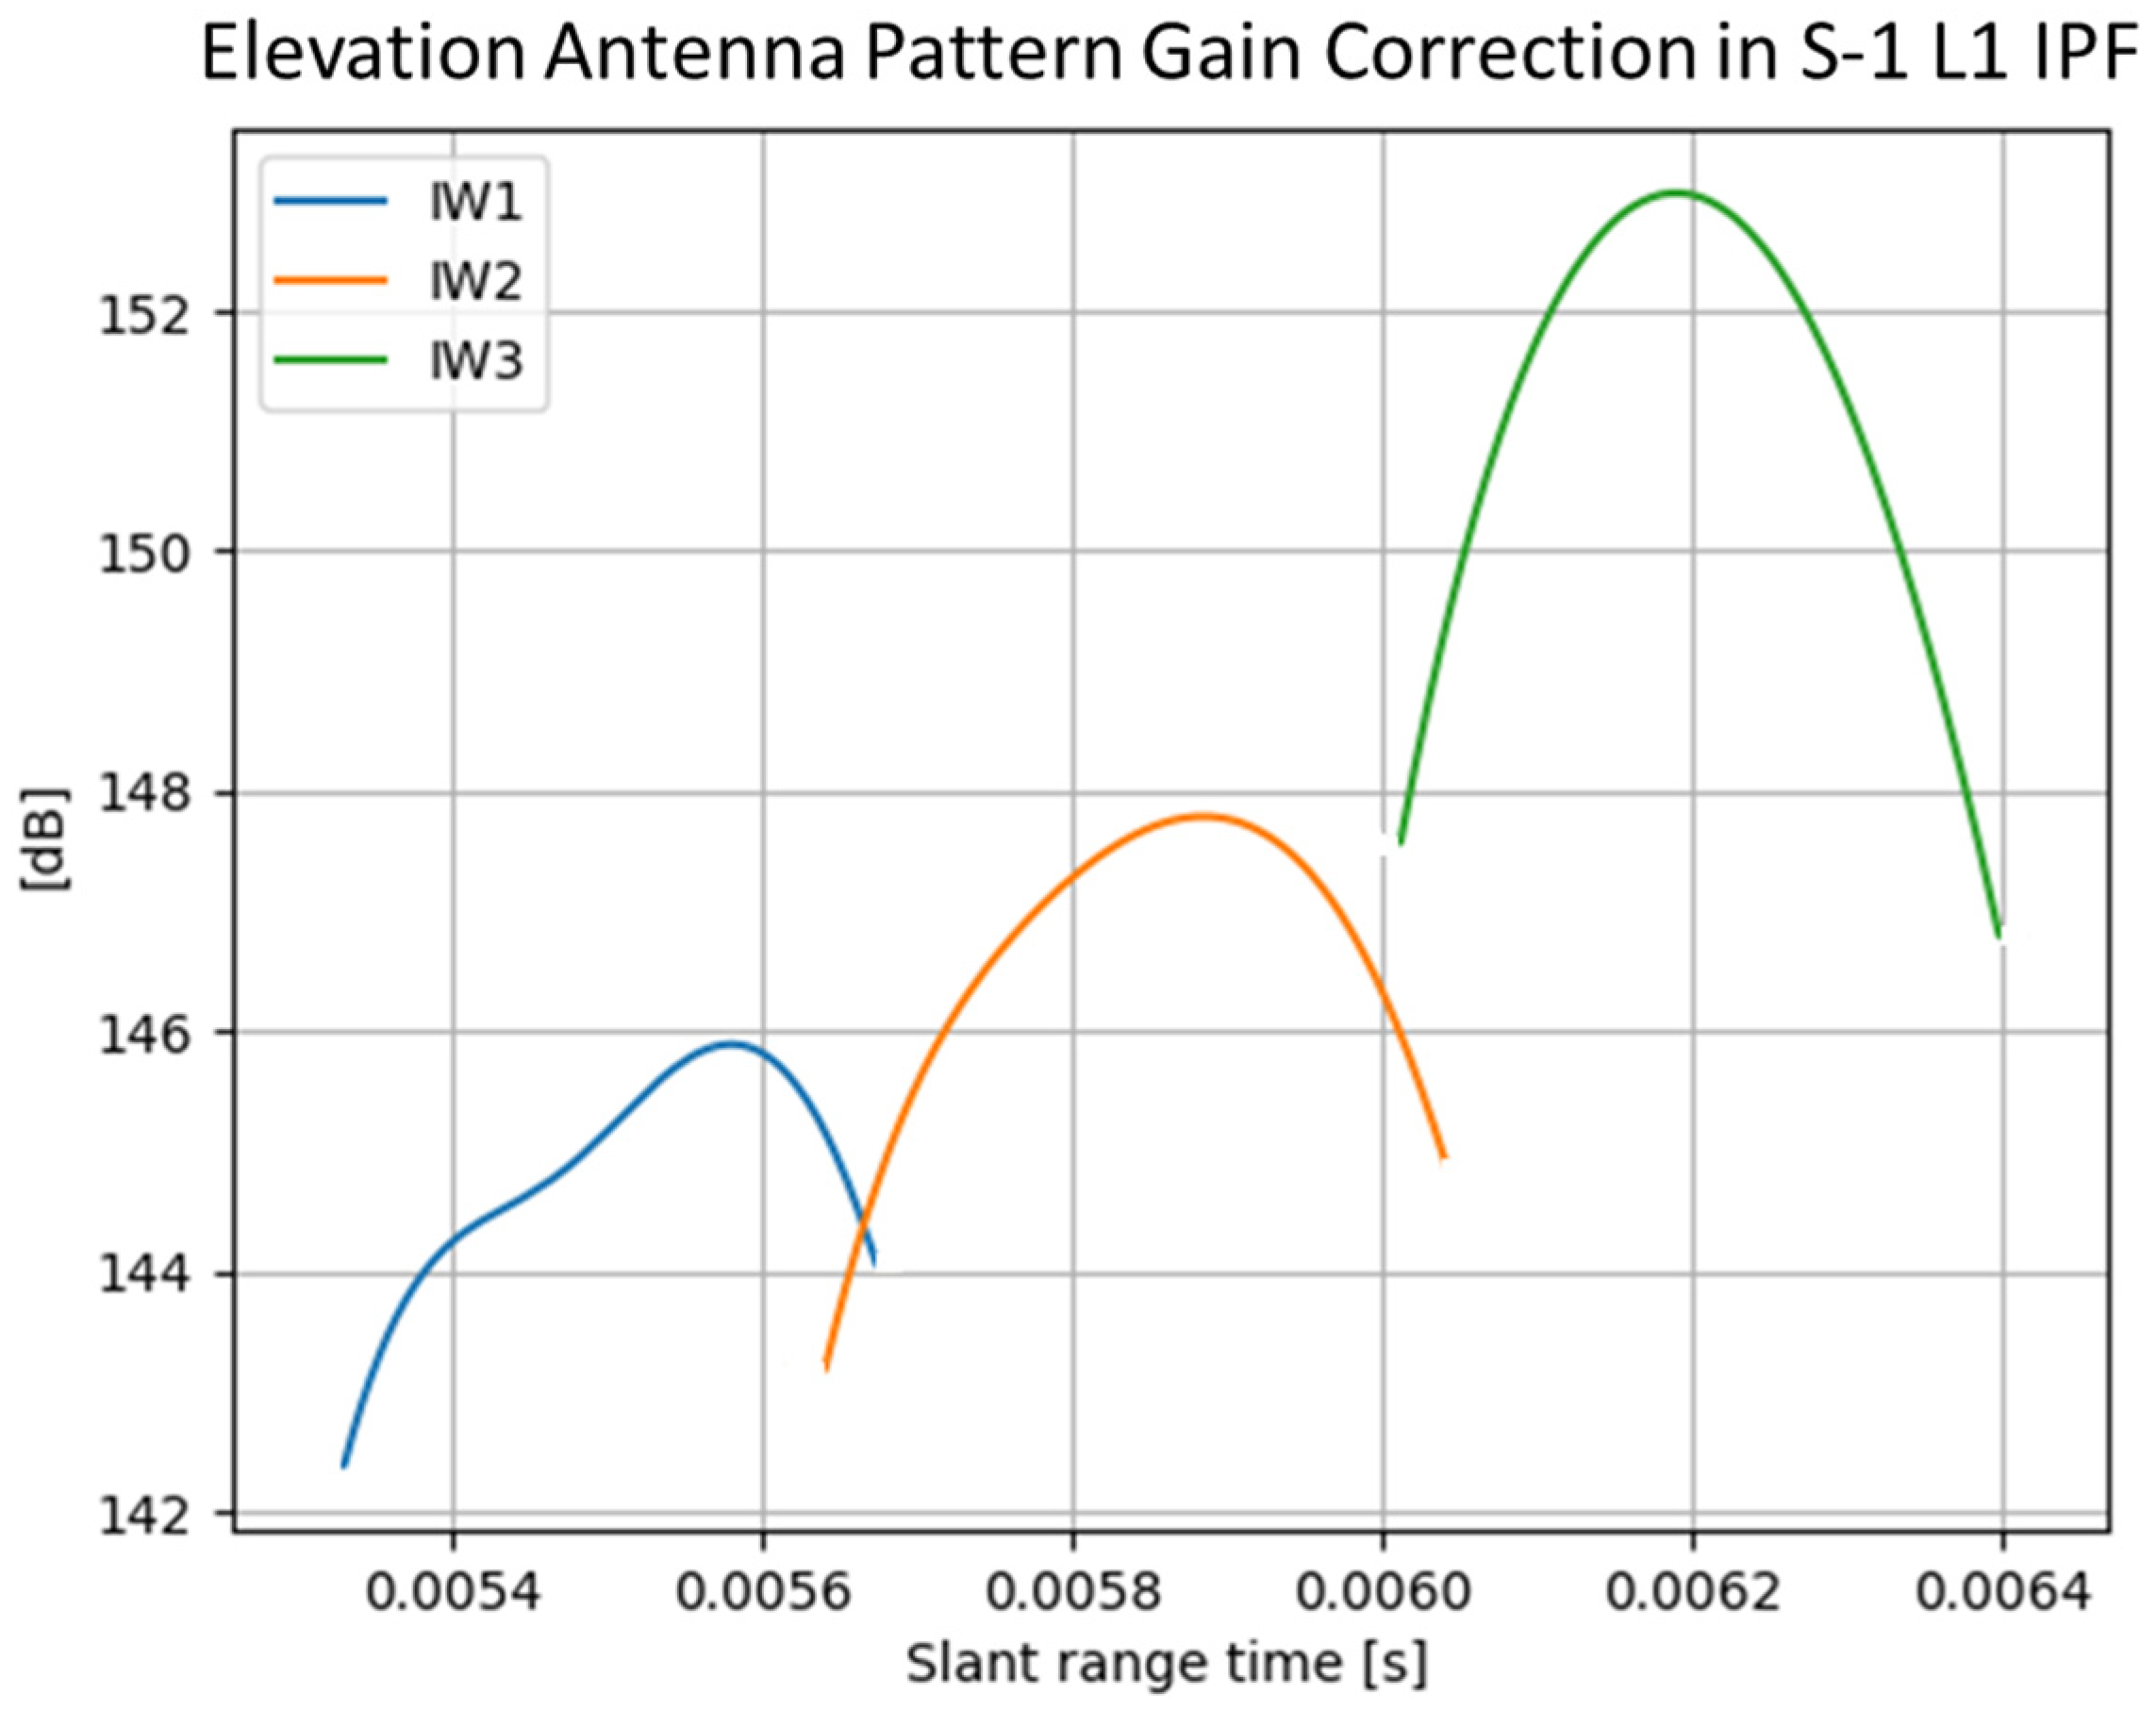
The antenna-pattern compensation removes the gain variations in range and azimuth (scalloping profiles for TopSAR data only) introduced by the SAR antenna. The applied correction is described in Section 9.5 of the L1 IPF ATBD [13] and depends on the sub-swath on the polarization and on the acquisition geometry (conversion from slant range to antenna off-boresight angle). The antenna-pattern correction changes the level of the data. The antenna patterns are generated with the S1 AM, refined according to Rain Forest measurements [15,16], and finally annotated in the AUX-CAL file, while the correction applied to the data is annotated in the L1 data. Figure 7 provides an example of the S1A elevation antenna patterns annotated in TopSAR IW product and used during the processing for the radiometric correction of the data.

2.2.3. De-Scalloping

The elevation-antenna-pattern compensation discussed above is applied to all the S-1 data independently on the acquisition mode. A second radiometric correction is only applied to TopSAR data and is related to the azimuth gain of the elementary antenna patterns (i.e., to the gain of each TRM). This is an additional weight that affects all the TopSAR beams not pointing to the antenna boresight.
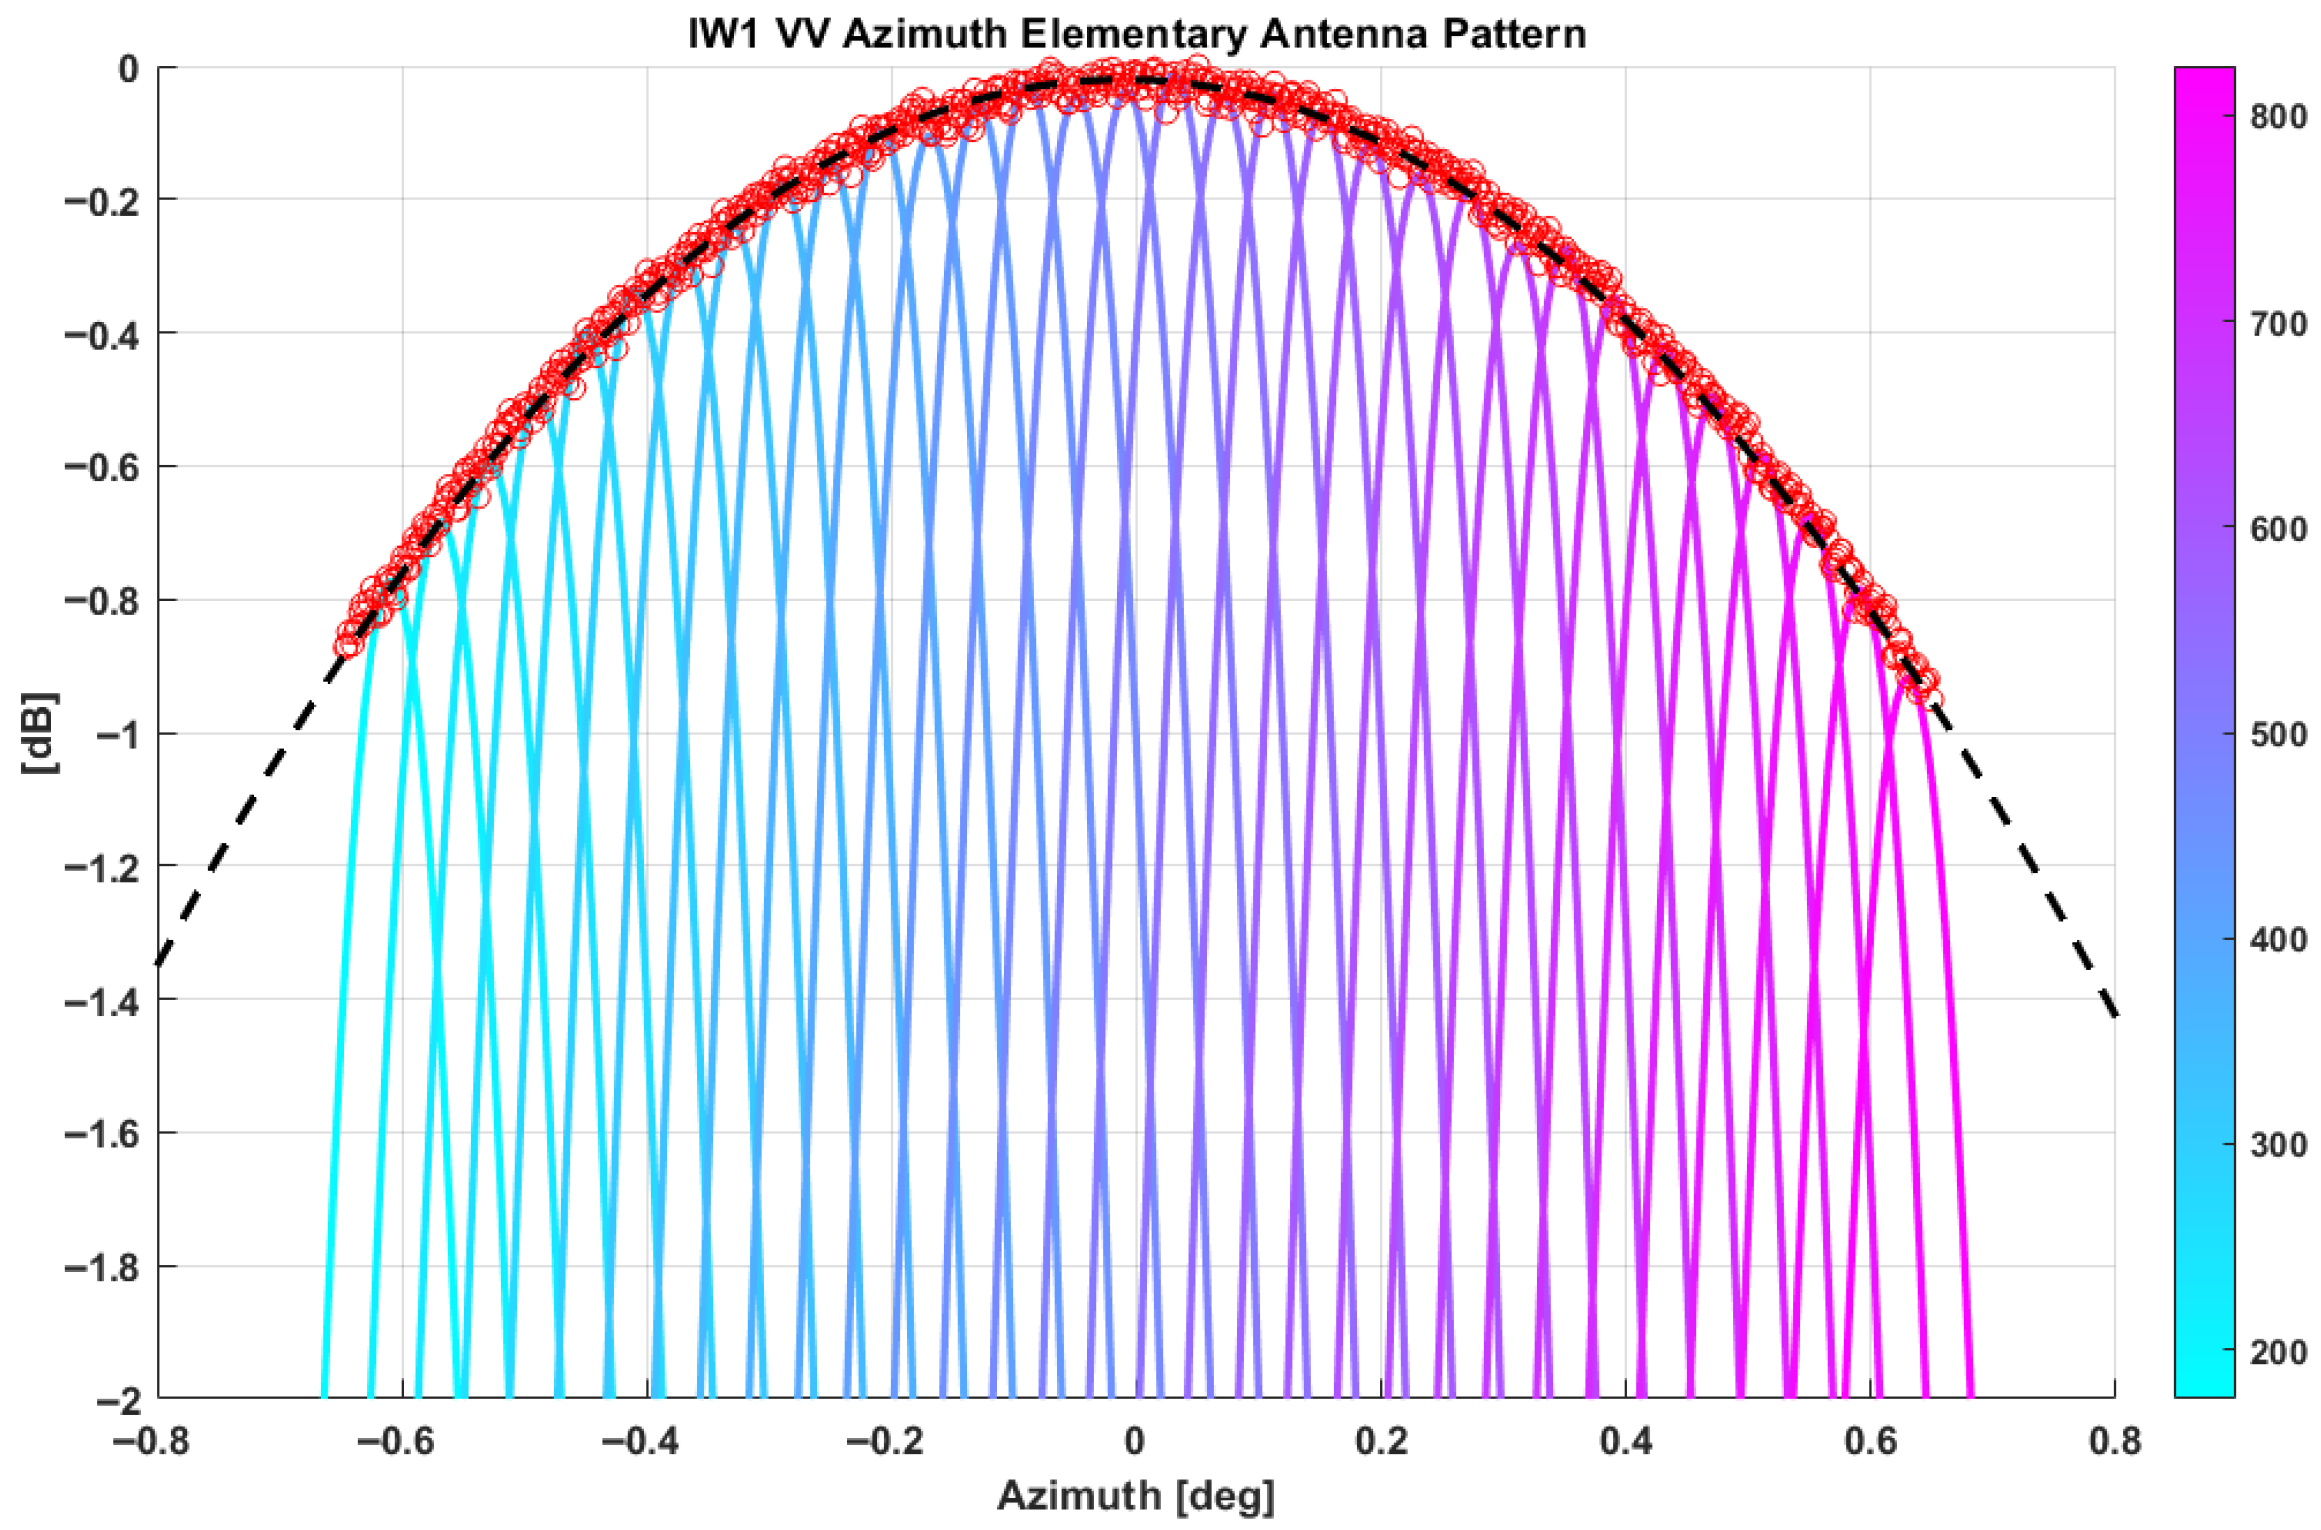
Figure 8 represents the azimuth elementary antenna pattern for IW1 VV (they are quite similar for all TopSAR beams). TopSAR IW1 azimuth steering is obtained by implementing 648 patterns. The cold-colored patterns represented in the image are a subset (1 out of 20) of all the 648 azimuth antenna patterns (the corresponding pattern index is reported in the color bar) as predicted by the S-1 AM. On the other hand, the red dots represent the peak of each azimuth pattern in gain and angular position. Finally, the black dashed line represents the antenna pattern model that is used to compensate the S-1 products, showing very good agreement with the peak’s envelope.

2.2.4. Spread Losses

The spread losses are an attenuation term related to the propagation of the spherical waves emitted by the SAR and backscattered by the targets on ground. The energy density of the waves attenuates proportionally to the square of the propagation distance R (i.e., the slant range), resulting in a two-way attenuation proportional to R 4 . This term is partially compensated by the fact that the antenna footprint increases proportionally to the propagation distance, resulting in an attenuation proportional to R 3 . The S-1 IPF applies the spread losses compensation according to the following equation:
G s l t = 2 · R r e f c · t 3
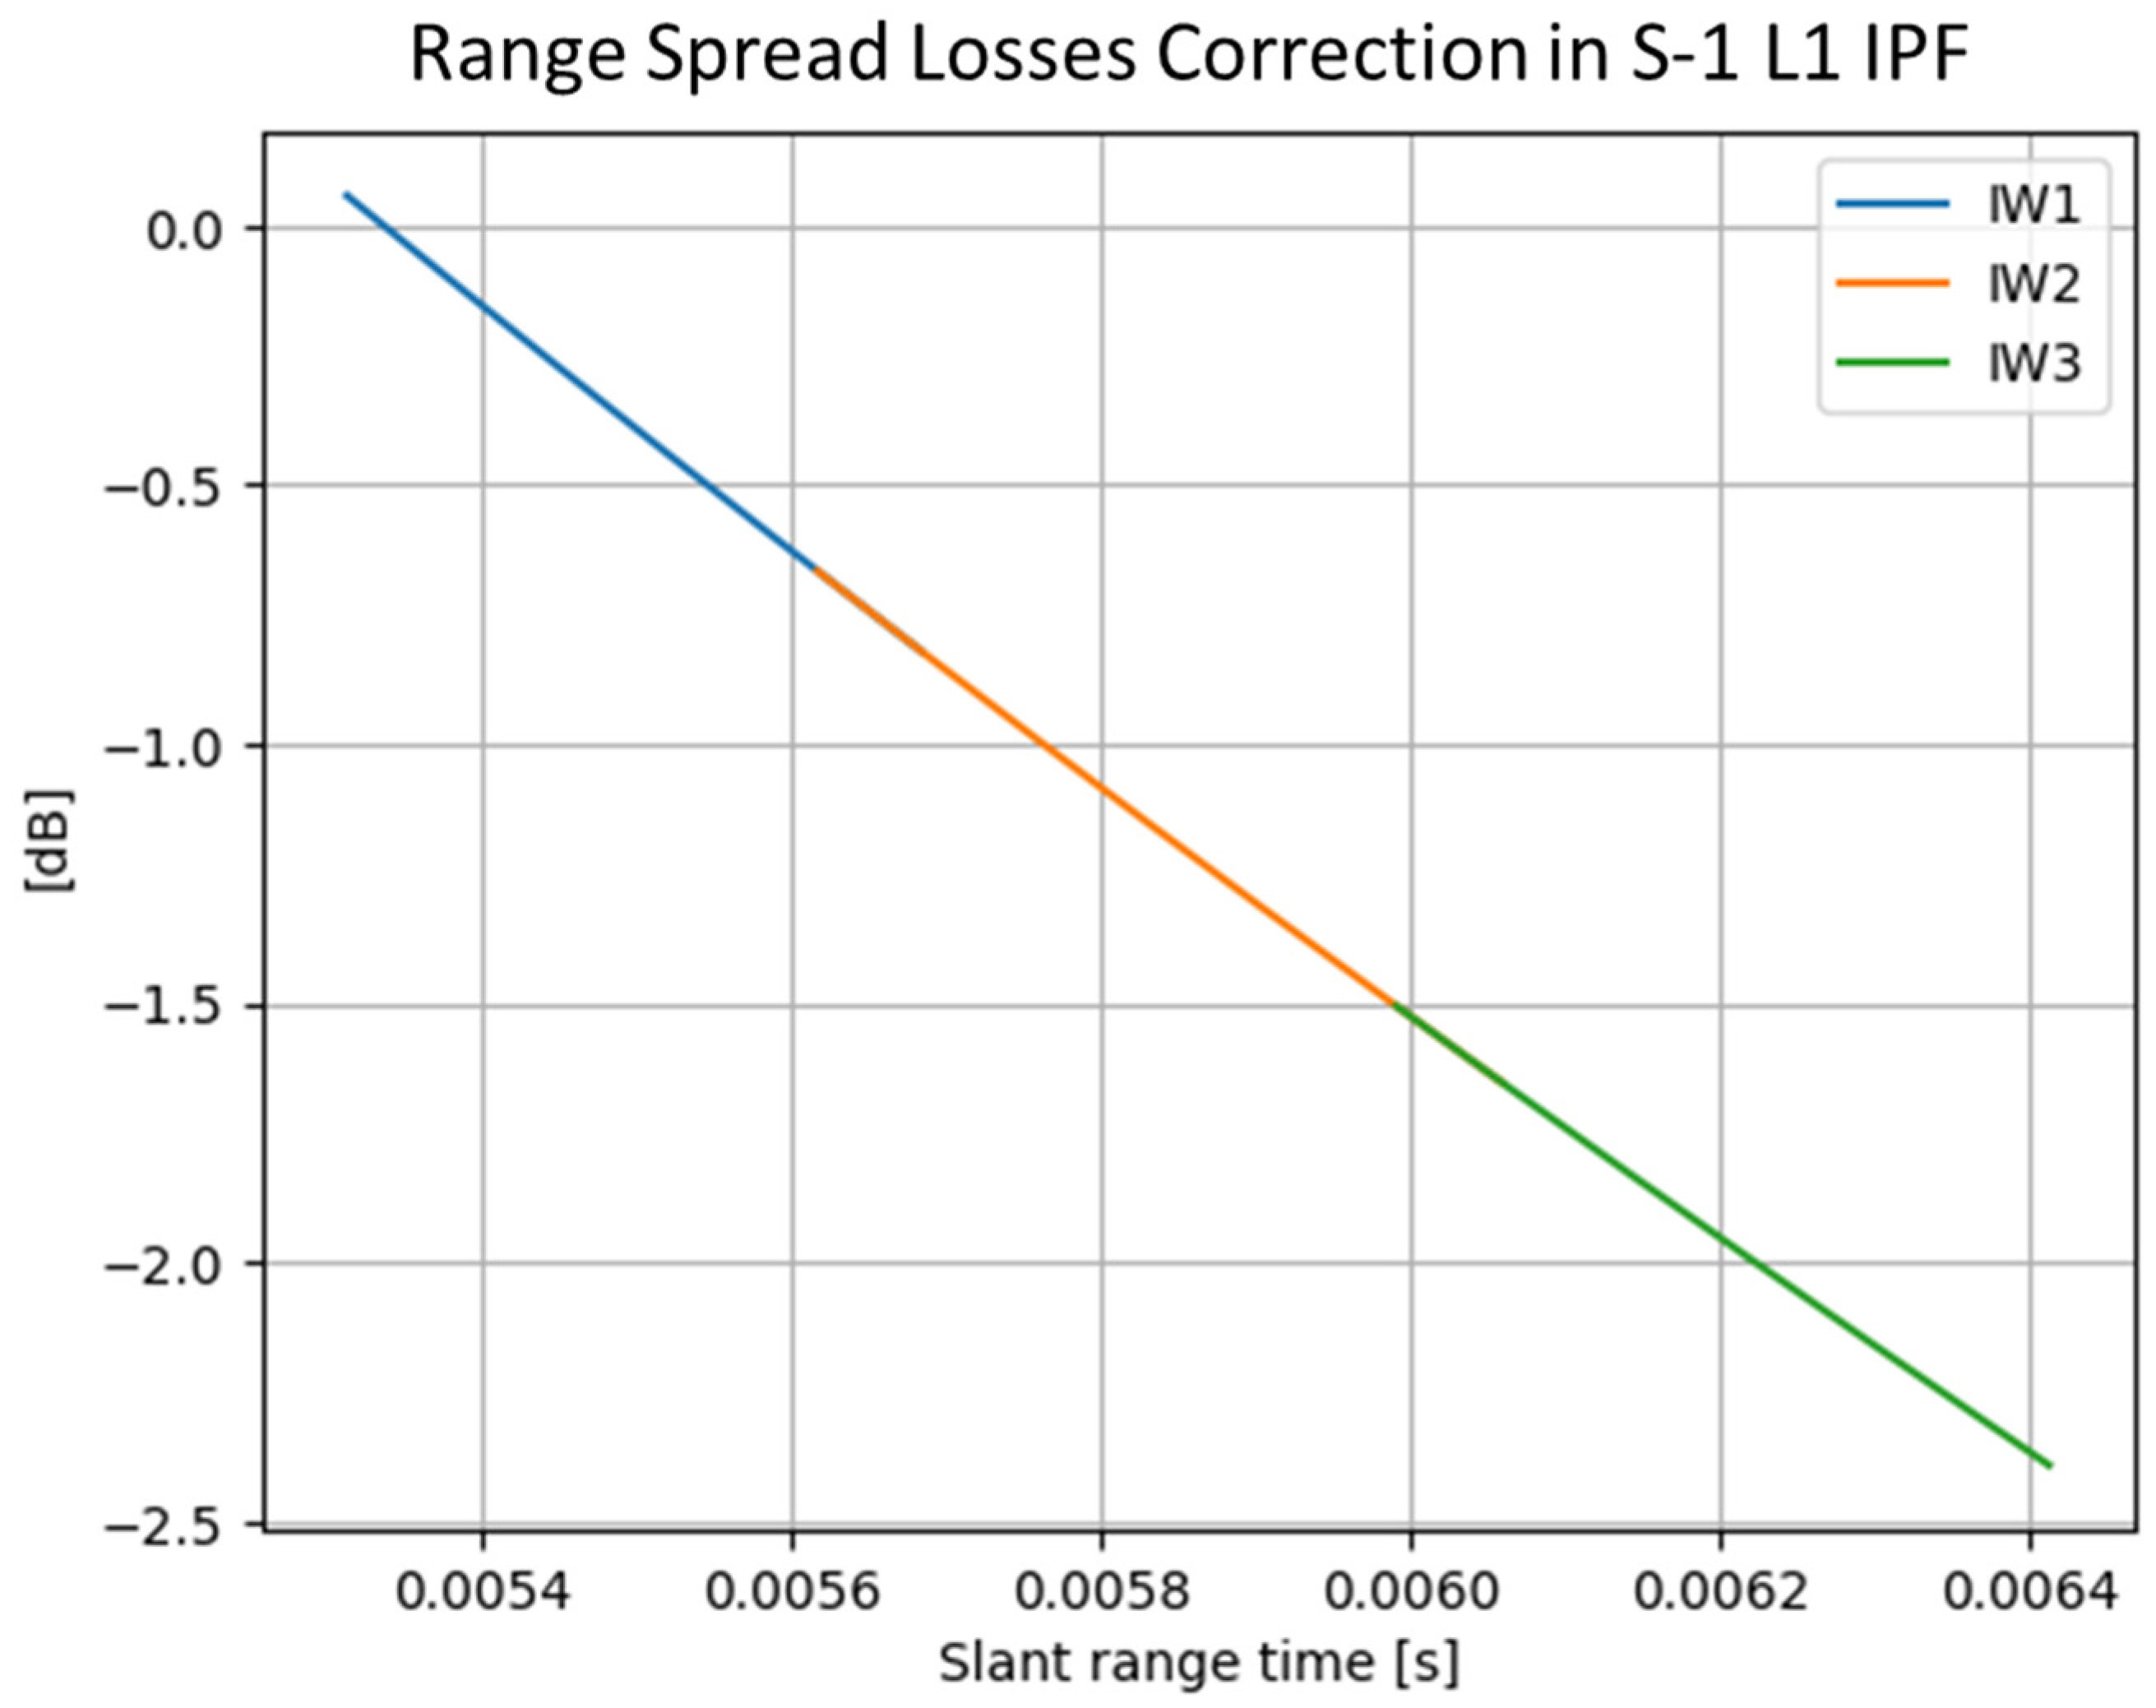
where t is the slant-range axis of the product, c is the speed of light and R r e f is a configurable reference distance set to 800 km for all S-1 products. Figure 9 represents an example of the spread losses correction applied by the processor for an IW product. The variation is around 2 dB.

2.2.5. Processing Gain

The processing gain is a configurable gain value that is sub-swath and polarization dependent. Ideally, with the S-1 IPF normalized as discussed in Section 2.3.1, the processing gains should be the same for all the beams and polarization. Nevertheless, due to non-idealities both at instrument and processing level, this is not the case, and the processing gain is exploited to perform a fine tuning of the data calibration and ensuring that a single calibration constant can be used for all the beams and polarizations. Please note that, during the processor normalization activities, the normalization of the pulse length was not included in the processing chain. The pulse length is then included in the processing gains and is the main contributor to the observed difference.
The processing gains for the different TopSAR sub-swaths (S1A) are reported for information in Table 1. The pulse length of each sub-swath is also reported, and the total gain obtained by combining the processing gains and the pulse length is provided. The overall gain for all beams (except EW1) is around 120 dB, with peak-to-peak variations smaller than 1 dB.

2.2.6. Overall Processor Radiometric Corrections

The combination of all the radiometric corrections above result in a global radiometric correction k r a d i , j to the data:
k r a d i , j = G pg ( i ) G ds ( i ) G eap ( i , j ) G rsl ( j ) k proc
where G pg ( i ) is the internal calibration gain correction, G ds ( i ) is the de-scalloping function, G eap ( i , j ) is the elevation antenna pattern, G rsl j is the spreading loss correction and k proc is the applied processing gain.
Please note that there is an additional small radiometric correction applied to the data to equalize the instrument gain within the Rx window. It is not listed in Equation (7) above because it is intended to equalize the channel, i.e., after such correction, the noise floor is flat, and the data only depend on the contributions discussed above. More details on this correction are reported in Appendix A.
The combination of all the radiometric corrections discussed in this section (and in the Appendix A) results, in the end, in radiometrically calibrated S-1 L1 products [17]. Residual calibration errors that could arise from instrument non-idealities are characterized during the Commissioning Phase using acquisitions over point-target sites (corner reflectors and transponders) and over Rain Forest, and finally corrected with the calibration constant, a unit-dependent value that ensures the correct radiometric calibration of the data.
The applicable calibration constant values for the different S-1 units are reported in Table 2. Please note that the reported values are in linear units and that the data are divided by the calibration constant. The value for S-1D unit will be assessed during the Commissioning Phase in the first months of 2026.

2.3. SAR Data De-Noising

2.3.1. De-Noising Vector Model

Based on the radiometric corrections discussed in Section 2.2, the model of the focused, detected, and calibrated S-1 SAR data d f o c ( i , j ) can be re-written as:
d f o c i ,   j = s f o c ( i ,   j ) + n f o c   ( i ,   j ) = k r a d i ,   j · k s · s r a w i ,   j + k n · n r a w i ,   j
where k r a d i ,   j is the model in Equation (7), s r a w i ,   j and n r a w i ,   j are the signal and thermal noise components in the raw data, after instrument source packets decoding [18], and k s and k n are the “hidden” gains introduced in the processing chain by the different processing steps:
  • Range compression.
  • Azimuth compression.
  • Range spectrum windowing.
  • Doppler spectrum whitening and windowing.
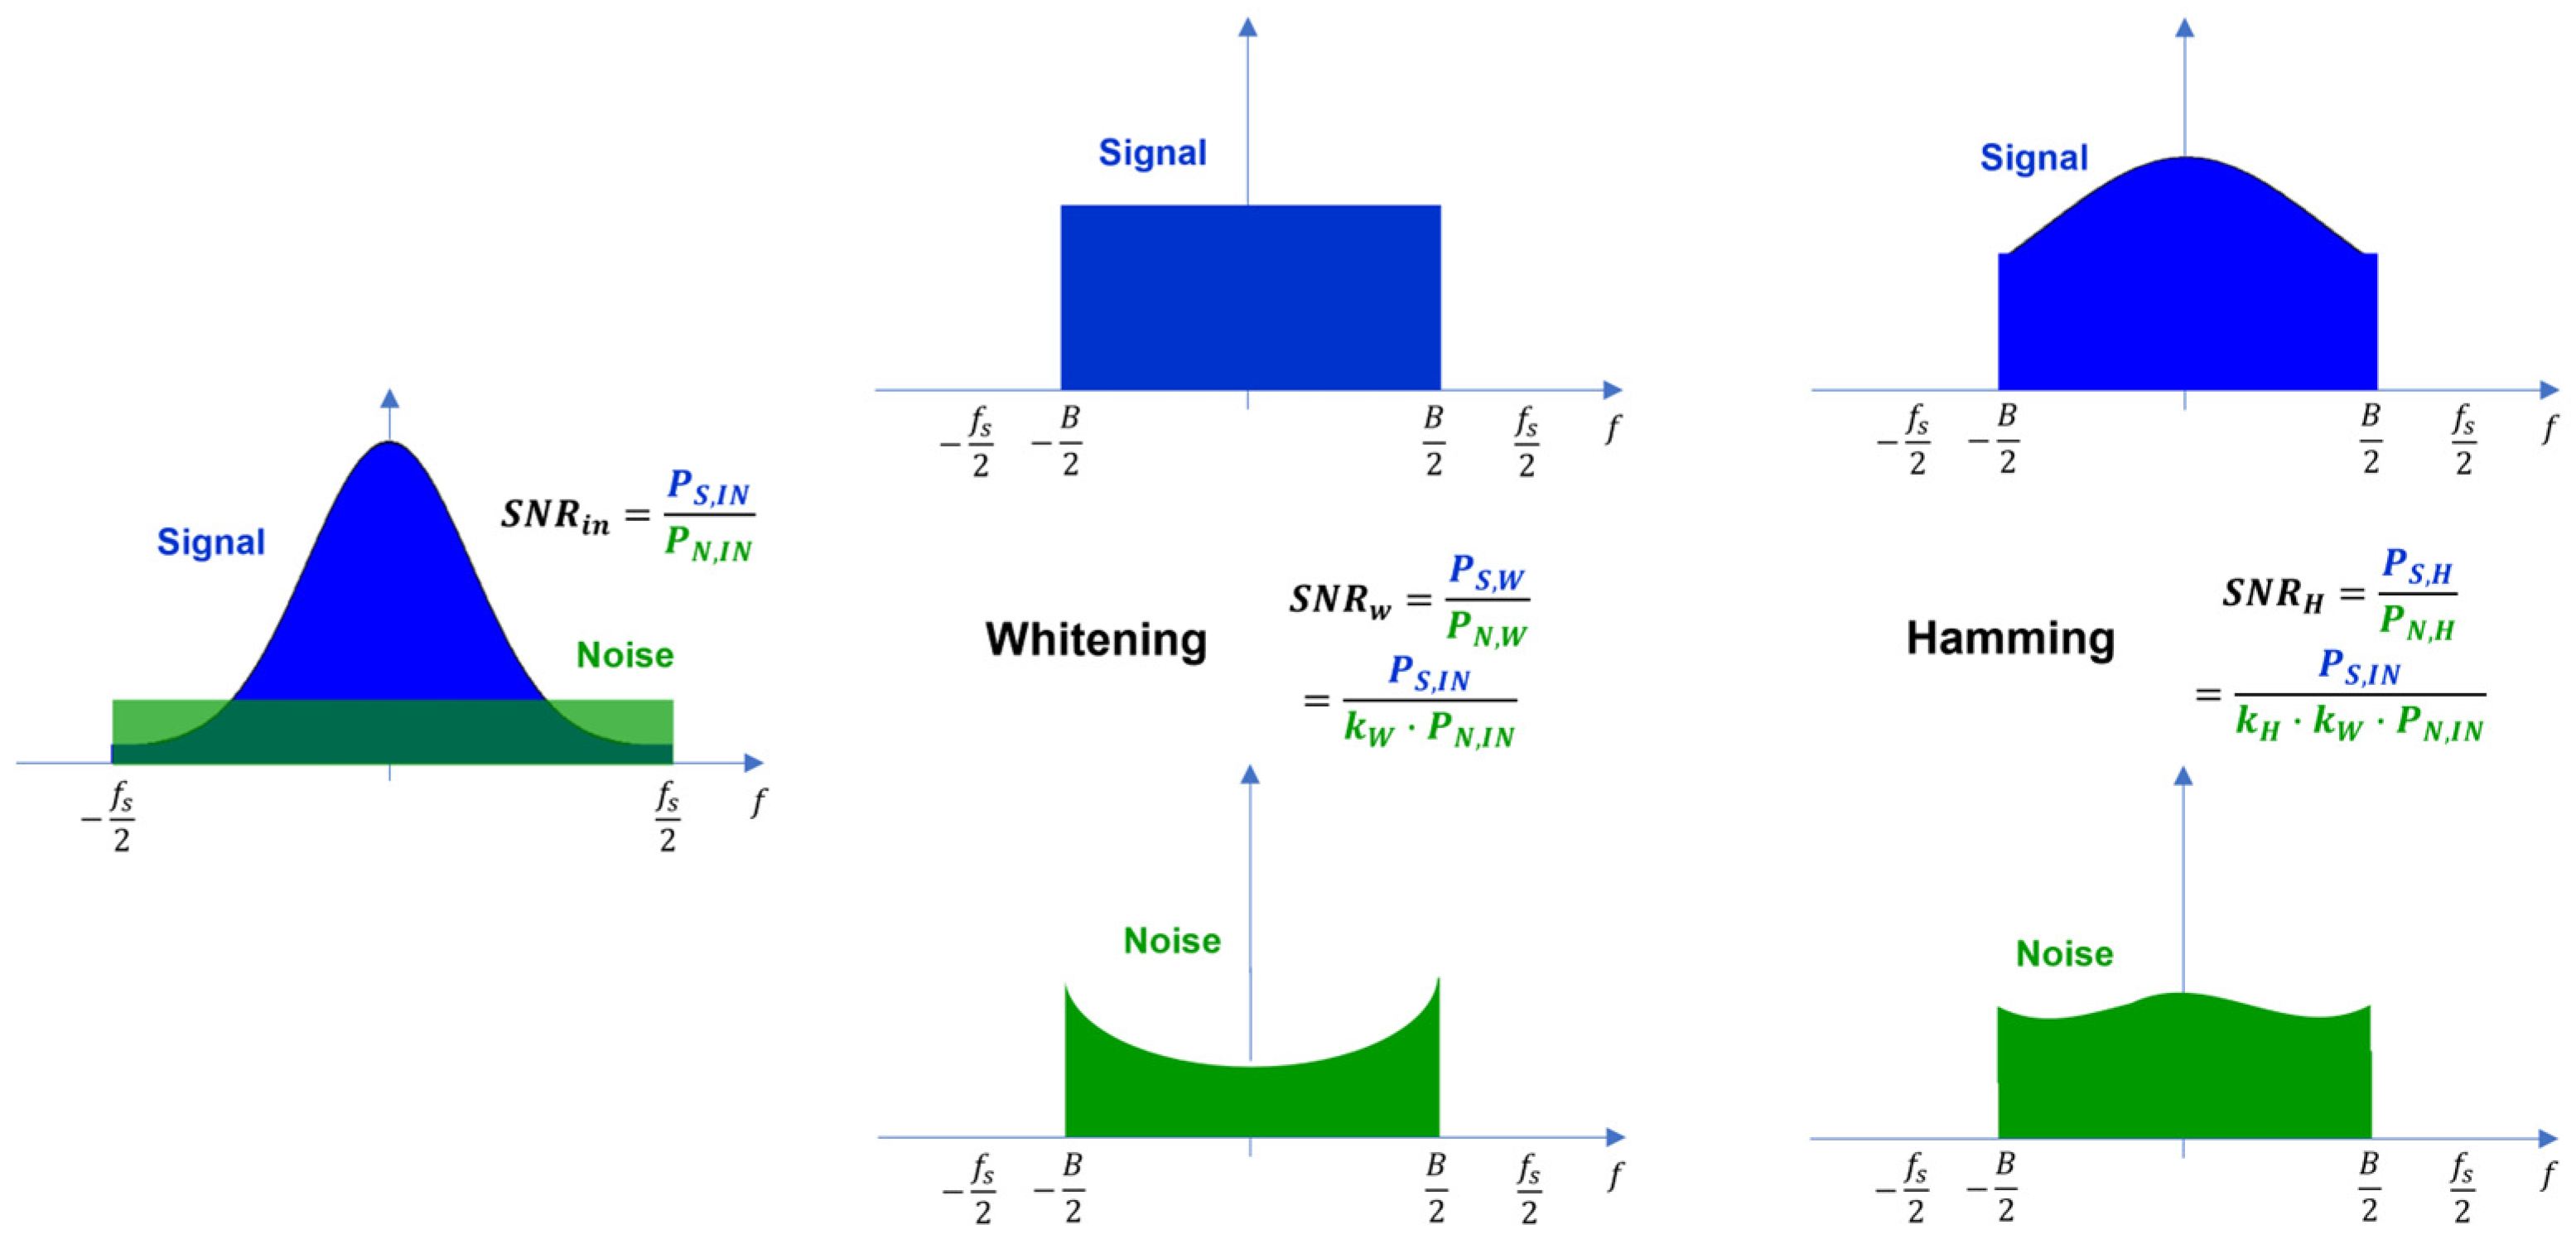
s f o c ( i ,   j ) and n f o c   i ,   j are the noise and signal levels in the focused data. It is worth noting that the k s and k n gains are different even if the signal and noise go through the same processing chain. This is because the spectrum of the SAR signal is quite different from the spectrum of the thermal noise, resulting in the filters having a different effect. This is graphically illustrated in Figure 10.
If the SAR processor is normalized, the k s factor is independent from the processing configuration parameters, such as processed bandwidths and applied windows. The IPF processor was normalized:
  • For TopSAR IW and EW modes with the deployment of IPF 2.82 on the 28 March 2017.
  • For Stripmap and Wave modes with the deployment of IPF 2.90 on the 13 March 2018.
The de-noising procedure consists of subtracting the expected level of noise to obtain an unbiased estimate of the signal component s ^ f o c :
s ^ f o c i ,   j = d f o c i ,   j n ^ f o c   ( i ,   j )
where n ^ f o c   ( i ,   j ) is the model of the noise level computed by the processor. The n ^ f o c   ( i ,   j ) model is derived as:
n ^ f o c   i ,   j = k r a d i ,   j · k n o r m · n p o w i · k n o i s e
where
  • k r a d is again the combination of all the radiometric corrections as reported in Equation (7).
  • The k n o r m factor is computed internally by the IPF and then applied to the de-noising vectors to ensure that they are correctly aligned to the noise level in the data for each L1 product (SLC and GRD with different resolution levels). This aspect is further discussed in Section 3.2.
  • n p o w i is the noise power measured from the noise pulses that are acquired at the begin (pre-amble) and at the end (post-amble) of each data acquisition process. Further details on this topic are provided in Section 2.3.2.
  • k n o i s e is the noise calibration factor that is needed to align the de-noise vectors generated by IPF to the actual noise level measured in the data. k n o i s e for S-1 is empirically derived exploiting dedicated acquisitions over very low backscatter areas. The cross-polarization data of such acquisitions can be assumed to be signal-free; hence, they can be exploited for the derivation of the k n o i s e factor. The noise calibration procedure is discussed in Section 3.1.
The de-noising procedure is not applied operationally by the S-1 IPF; rather, the noise vectors are annotated in the L1 products so that users can easily implement the de-noising step. More details on the de-noising procedure are reported in [19]. Please note that, even if the noise vectors are annotated in both SLC and GRD products, the de-noising operation is only applicable to detected products (i.e., SLC products must be detected and possibly multi-looked before noise subtraction).

2.3.2. Noise Power from Noise Pulses

The S-1 acquisition timelines are made of a fixed pattern of three distinct components:
  • Pre-amble: The initial part of the acquisition, including warmup echoes for instrument stabilization and noise and internal calibration pulses aimed at characterizing the instrument status.
  • SAR imaging: The central part of the data acquisition, when SAR echoes are recorded according to the timeline of the current acquisition mode. Interleaved to the SAR echoes, calibration pulses are acquired for TopSAR, Wave and (optionally) for Stripmap modes. For S-1C and D, additional noise pulses for TopSAR and Wave modes will be acquired during the SAR imaging (see Section 3.1 for more details).
  • Post-amble: The final part of the acquisition, including internal calibration and noise pulses.
During the noise-pulse acquisition, the instrument is in receive only mode to avoid recording unwanted returns from the Earth’s surface as instrument noise. The noise pulses undergo the whole S-1 receiving chain and are finally digitized with a 5 bits quantizer implementing Block-Adaptive Quantization (BAQ5).
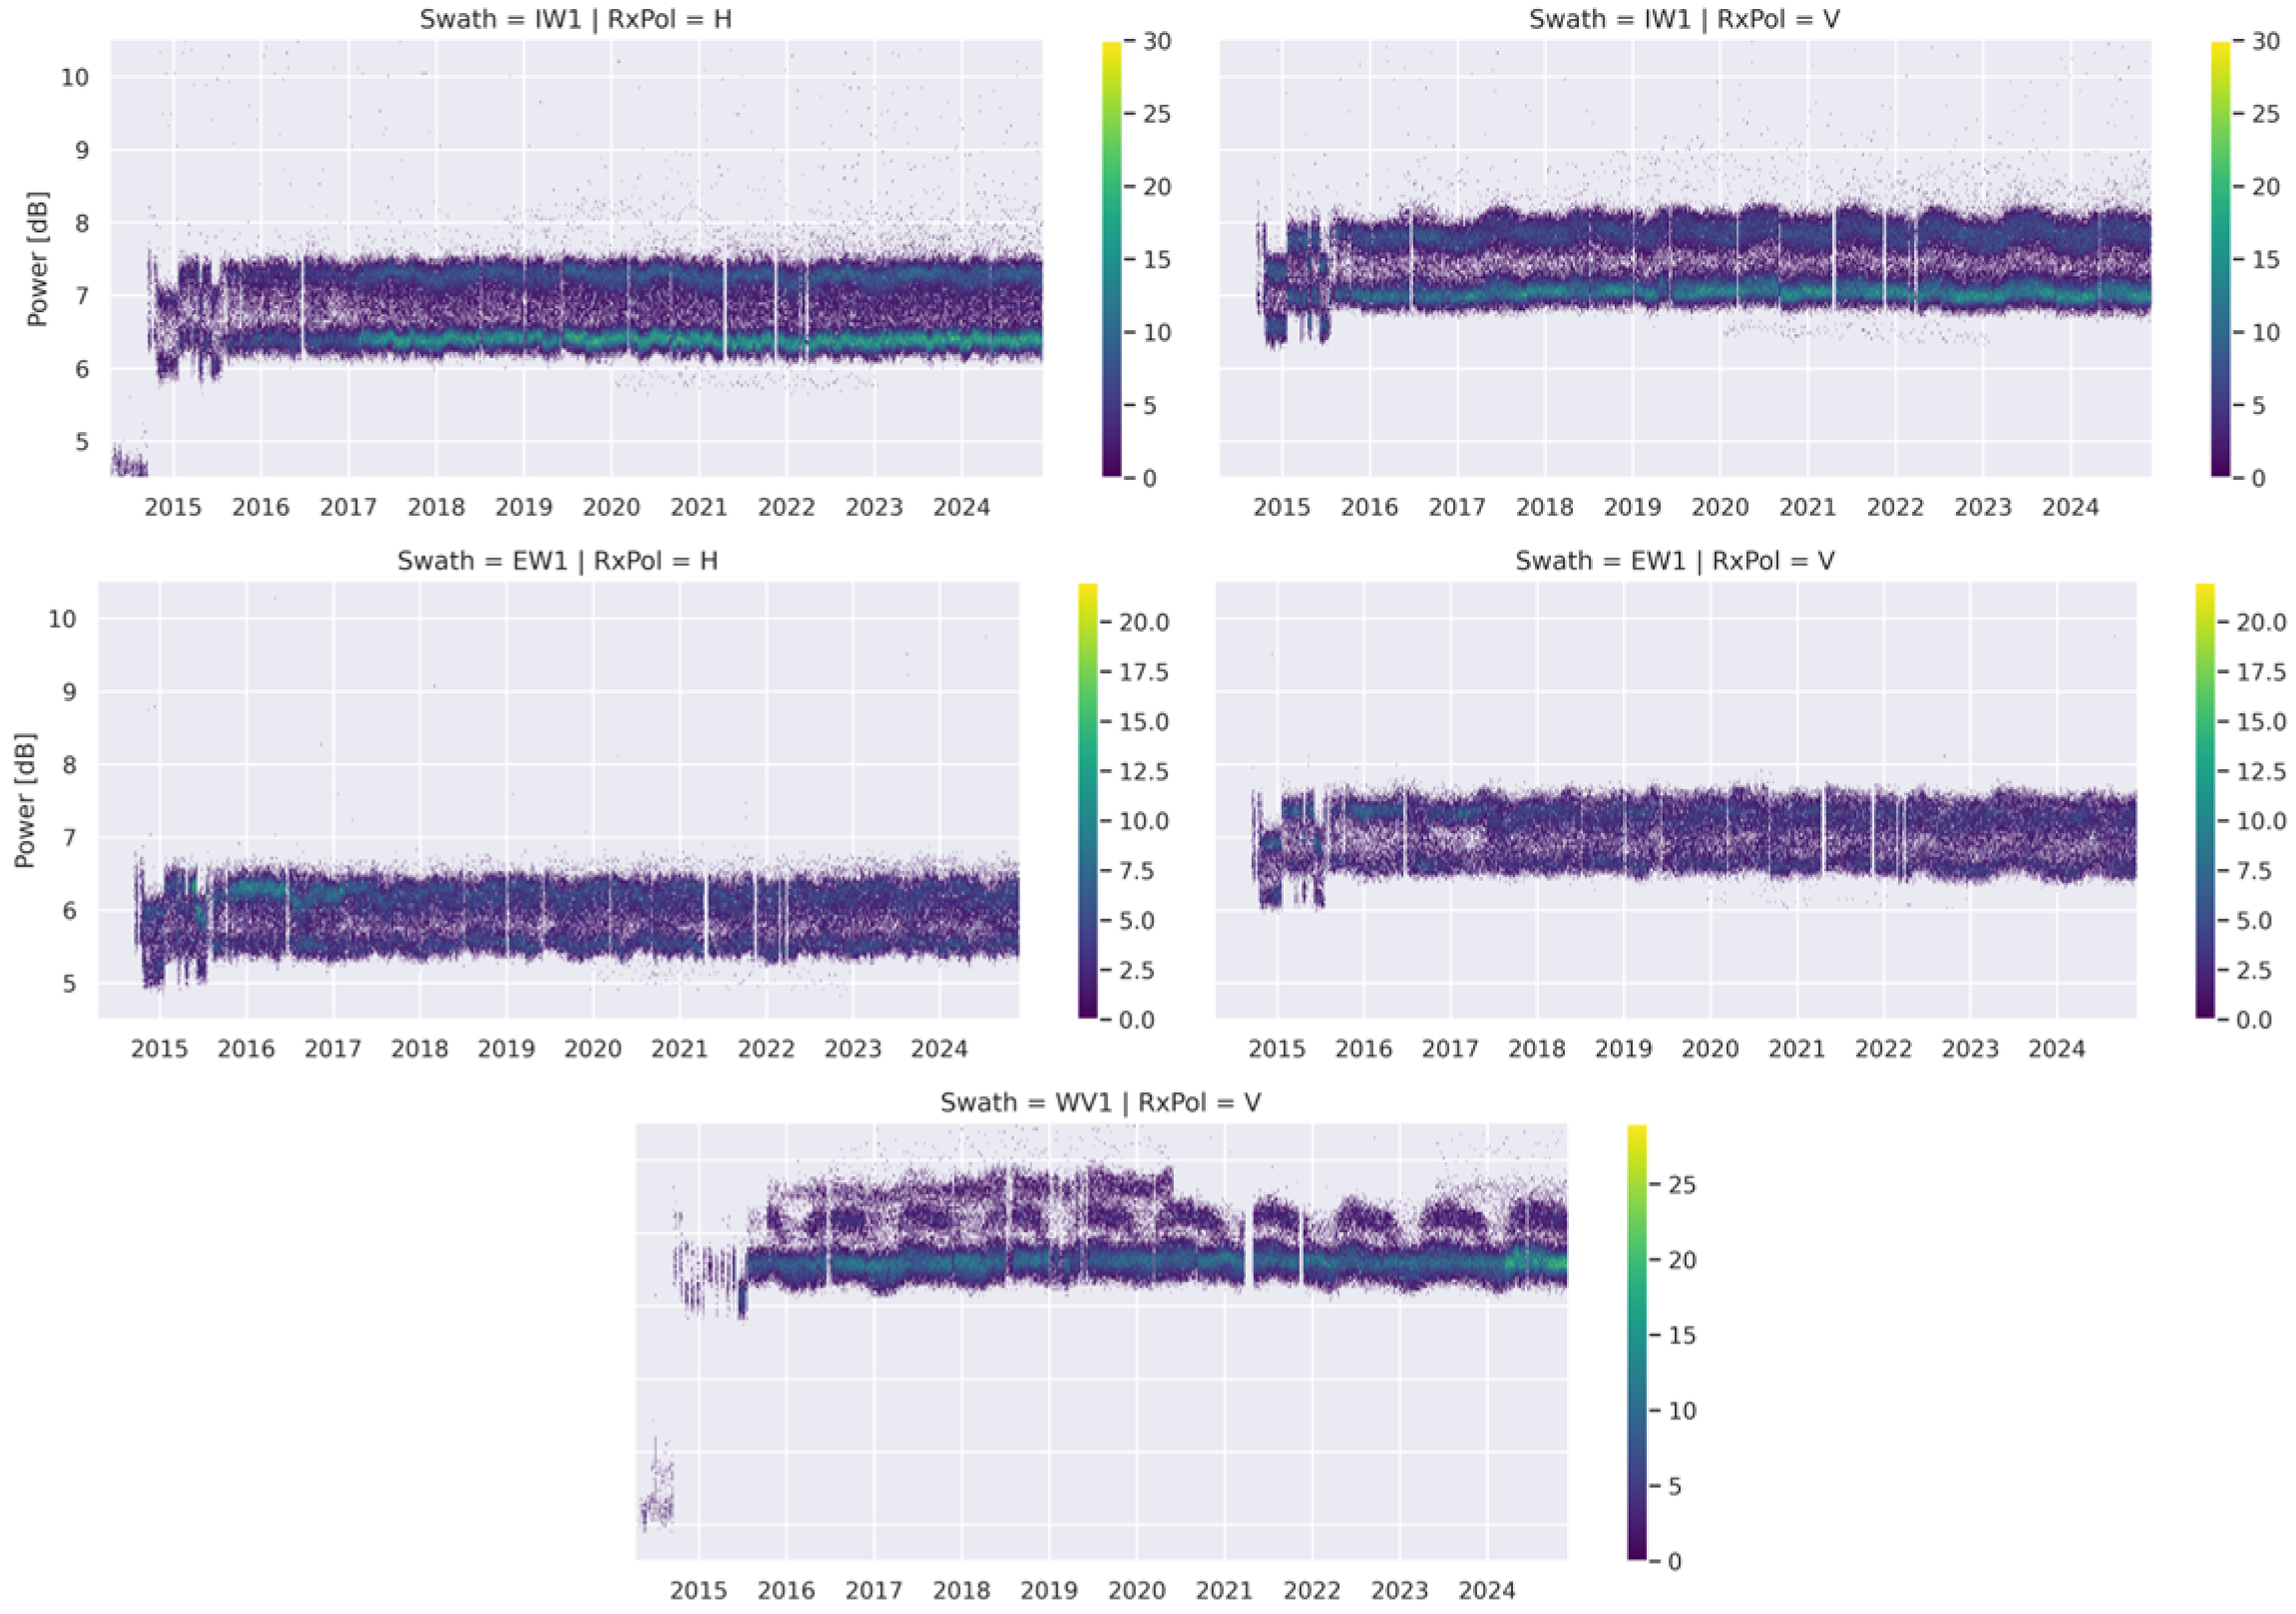
The acquired noise pulses are continuously monitored in the framework of the SAR MPC activities as a check of the instrument health status [20]. As an example, the long-term noise-power monitoring for IW1 (VV and VH), EW1 (HH and HV) and WV1 (HH) is reported in Figure 11.
The noise power estimated from the noise pulses shows a bimodal behavior related to the scene in the antenna footprint when the noise pulses are acquired. This is due to the different Earth emissivity values between land and sea, resulting in a different noise level of about 1 dB for the two scenes. Due to this, the sole usage of the noise pulses in the pre- and post-amble sections of the data takes did not allow for the correct estimation of the noise level in the whole acquisition resulting in a wrong data de-noising operation.
To cope with this issue, a new de-noising strategy for TopSAR products, based on the usage of the so-called rank echoes was defined (the first echoes in each burst are free from signal returns and hence equivalent to noise pulses). Figure 12 shows an example of an S-1A noise-power map derived from IW1 VH rank echoes acquired in November 2018. The sea/land noise-power difference can be clearly observed.
The rank echoes are processed by the L1 IPF, computing the average power of each sequence. Due to how the instrument works, not all the sequences are used, as discussed in [13,21]. In particular:
  • For the TopSAR IW mode, only rank echoes from even bursts (counting from the beginning of the data acquisition process) are kept, avoiding the noise-power fluctuations induced by the instrument.
  • For the TopSAR EW mode, the rank echoes from EW2 cannot be used since they contain the returns from Tx calibration pulses. The noise-power level is estimated from the rank echoes of EW3.
The noise power from rank echoes is also discarded in case its difference with the power from the following sequence exceeds a certain threshold (configurable in the L1 IPF). This allows us to discard rank echo sequences that have been contaminated by RFI and that would bias the noise vectors to be used for the de-noising operation.
The effectiveness of the new strategy can be observed in Figure 13 and Figure 14. The first represents two TopSAR IW GRD product quick looks. The product on the left has been de-noised considering only the pre- and post-amble noise pulses, whereas the product on the right has been de-noised considering the rank echoes. The red and blue dashed lines represent the location of the range profiles shown in Figure 14. In the plot on the left, a clear discontinuity at the sub-swaths boundary (IW1-IW2) can be observed. In the plot on the right, thanks to the better estimated noise-power value, the discontinuity at the sub-swath boundary is no longer visible.
The usage of rank echoes for the generation of the noise vectors in S1 L1 products has been operational since 26 June 2018, following the deployment of L1 IPF version 2.9.1 (see Section 3.2 for more details on noise-related IPF evolutions).

2.4. Calibration of Noise Vectors

The calibration of the de-noising vectors, annotated in the S-1 L1 products, is performed by comparison with the data level measured from products acquired over very-low-backscatter scenes. Originally, Doldrums or desert areas were used for this purpose due to their reduced backscatter level, especially for the cross-pol channel. Nevertheless, acquired data had to be checked since signal contamination could be present, introducing a bias in the noise calibration procedure.
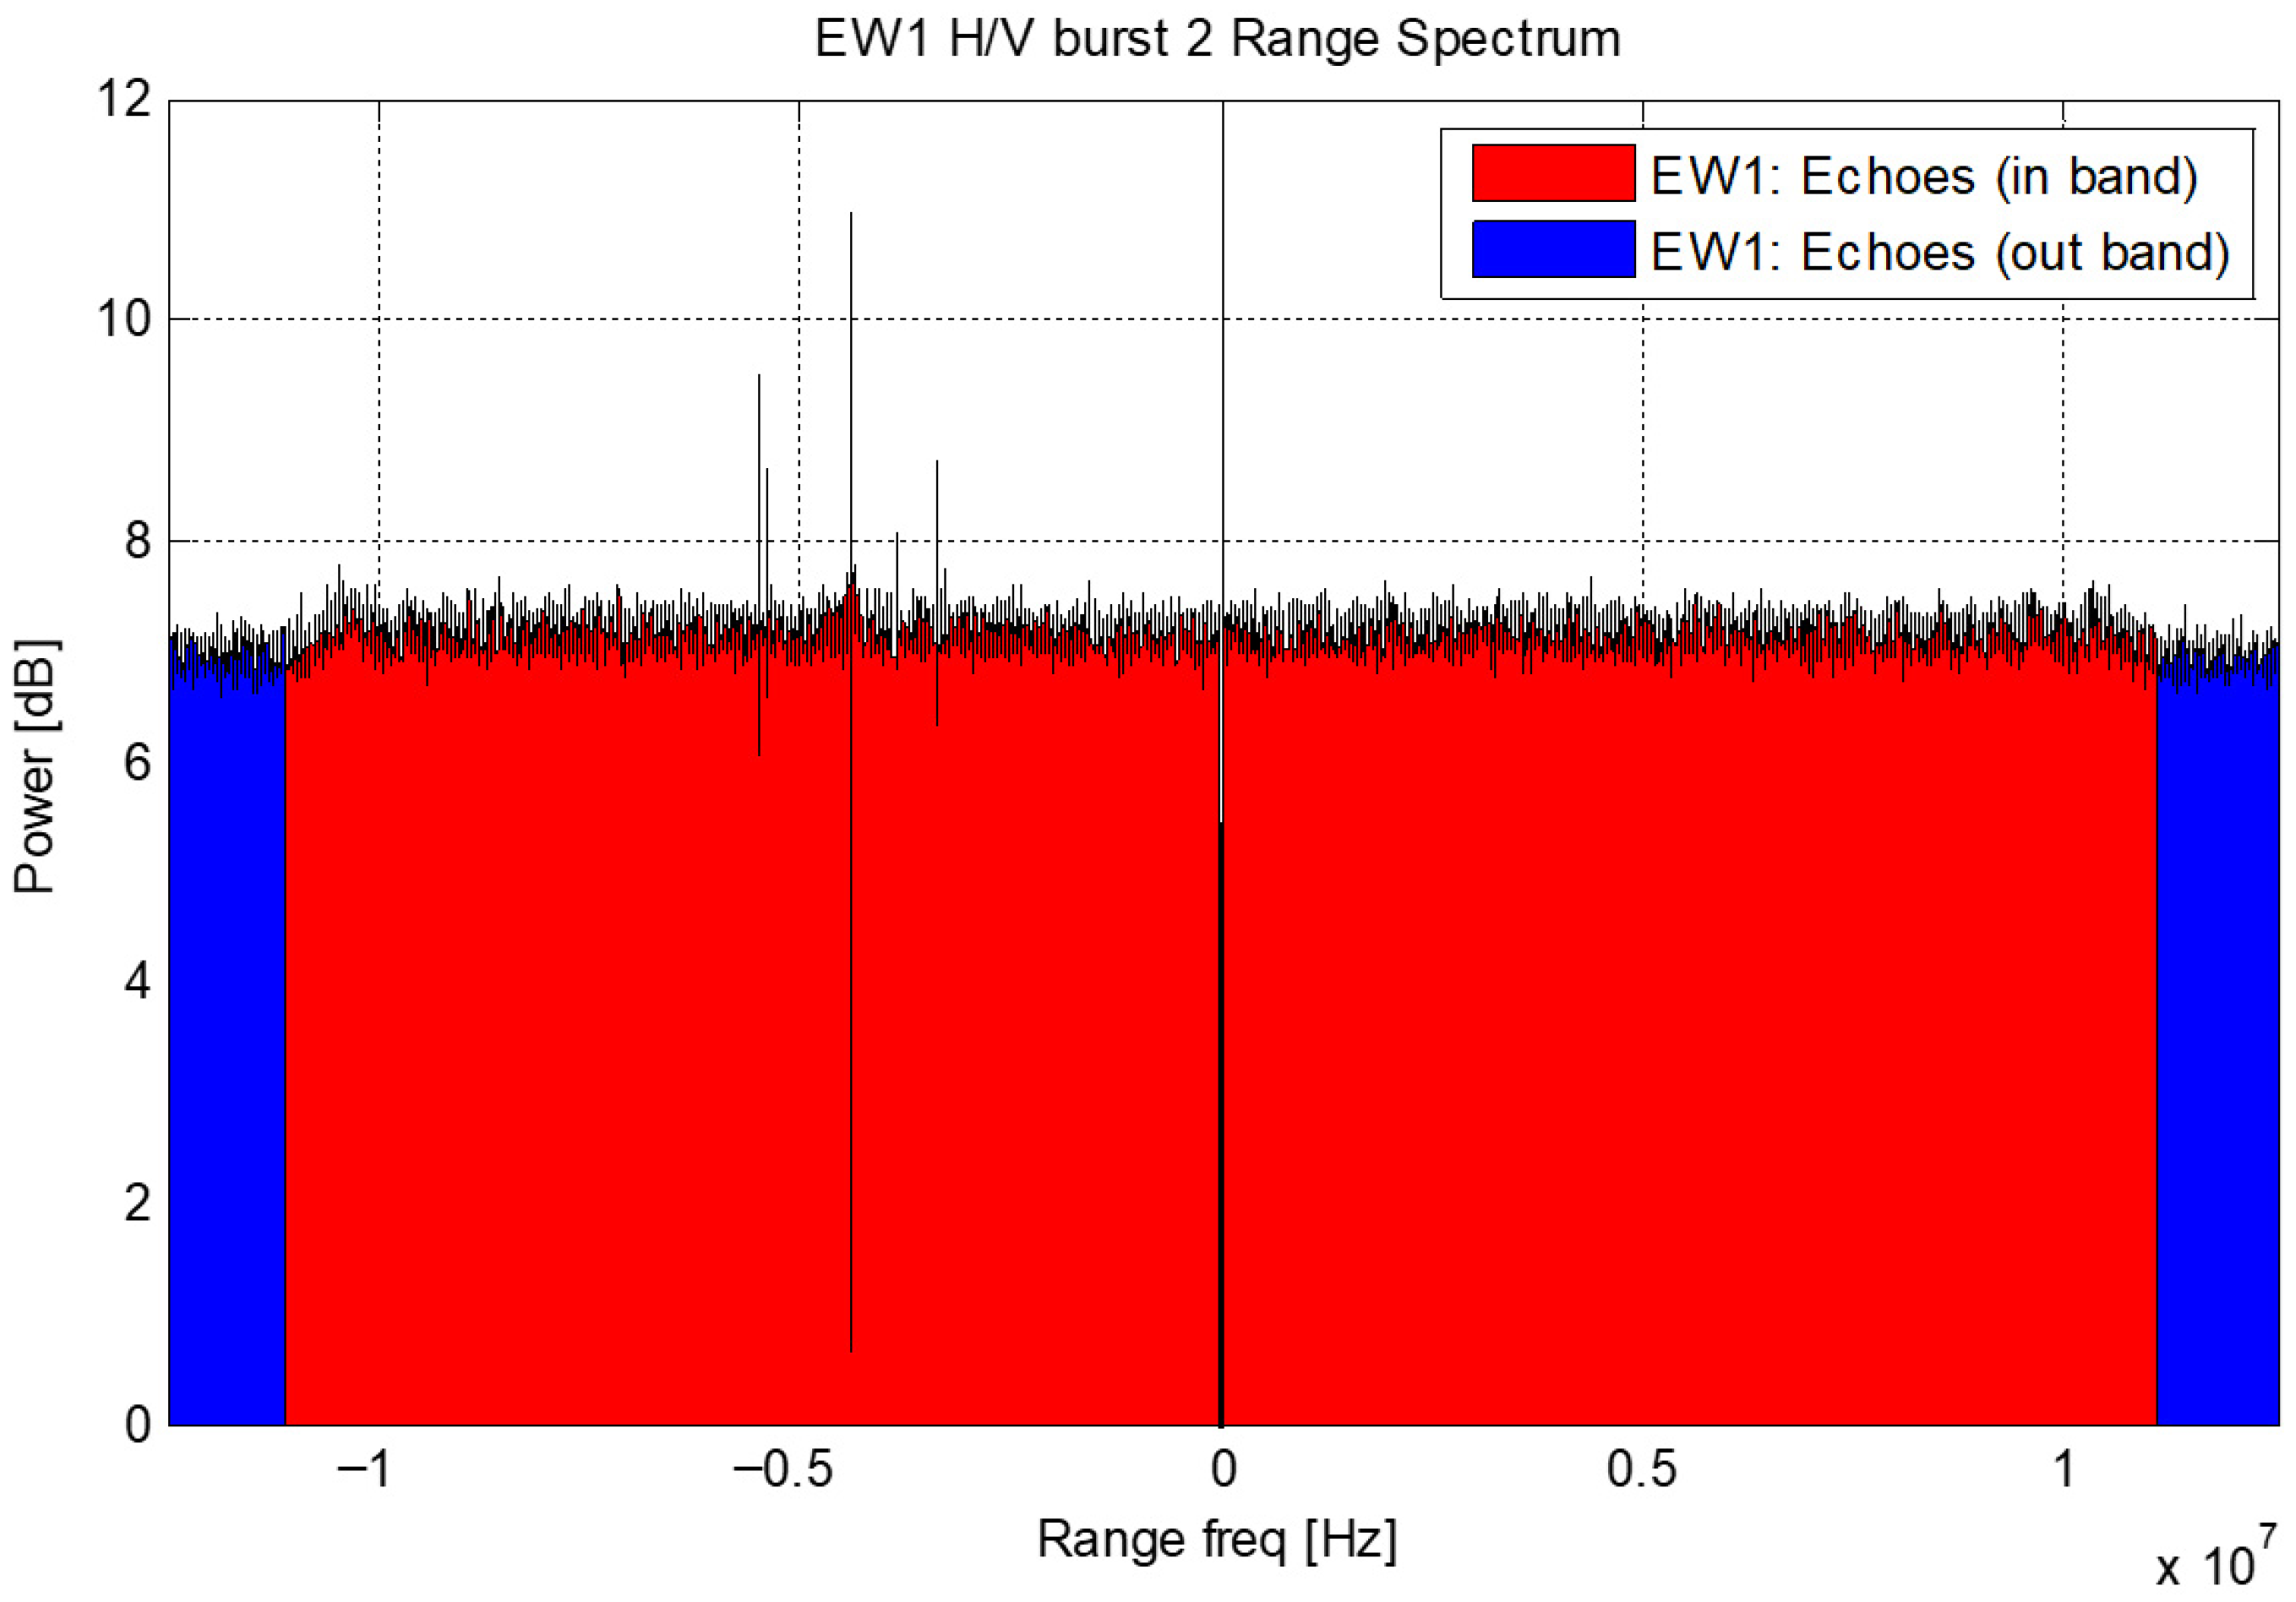
In November 2021, following the deployment of IPF 3.3.3, a new parameter was introduced in the L1 annotations. The in–out-band power ratio represents the ratio between the range spectrum power within the chirp bandwidth and the range spectrum power out of the chirp bandwidth. The parameter is computed for each TopSAR burst while, for the time being, it is not computed for Stripmap and Wave acquisitions. The in–out-band power ratio is computed after equalizing the range spectrum, i.e., after removing the spectral shaping introduced by the S-1 on-board filters. An example of the equalized spectrum of an EW1 HV polarization burst with almost no signal component is reported in Figure 15. The red part is the spectrum portion used for the in-band power computation, while the blue is the out-of-band part.
An in–out-band power ratio very close (ideally equal) to 1 suggests that the burst is suitable for the noise-vector calibration, since no backscatter is present.
The noise-vector calibration is performed statistically, analyzing a certain number of bursts (e.g., 20) for each sub-swath and polarization. The bursts with an in–out-band power ratio closest to 1 are selected (but only those larger than 1, to avoid issues with RFI contamination that can make the parameter smaller than 1). The procedure is performed in two steps:
  • The noise level is measured from each analyzed product.
  • The noise calibration constant is computed by minimizing the distance between each noise profile and the corresponding noise vector annotated in the data.
The first step is straightforward for TopSAR bursts with an in–out-band power ratio close to 1, since no signal is present. The noise level in the data is obtained by performing an incoherent averaging of the power of the pixels of each range bin. A noise-level vector as a function of range is obtained. The same averaging is performed over the 2D noise vectors annotated in the data for that burst, to ensure that the azimuth variation does not introduce any bias in the results. The final accuracy of the estimated noise level can be expressed as a function of the number of averaged pixels N :
ρ n o i s e = 10 log 10 1 + 1 N .
In the second step, to find the correction constant k, the following minimization problem is solved:
argmin k f k = min k d a t a d B k + n o i s e d B 2 2  
where k R , data, noise, and R N are global vectors containing all the points in the selected data. The solution of the problem is equivalent to computing m e a n d a t a d B n o i s e d B . Please note that, working in the dB domain, the relative weight of all the points in the data and noise vectors is comparable.

3. Results

3.1. Validation of Noise-Vector Calibration Method

To validate the noise-vector recalibration, the difference between data and old/new noise calibration factors is performed for all analyzed products in each mode and pol combination, to see if the residual error is reduced.
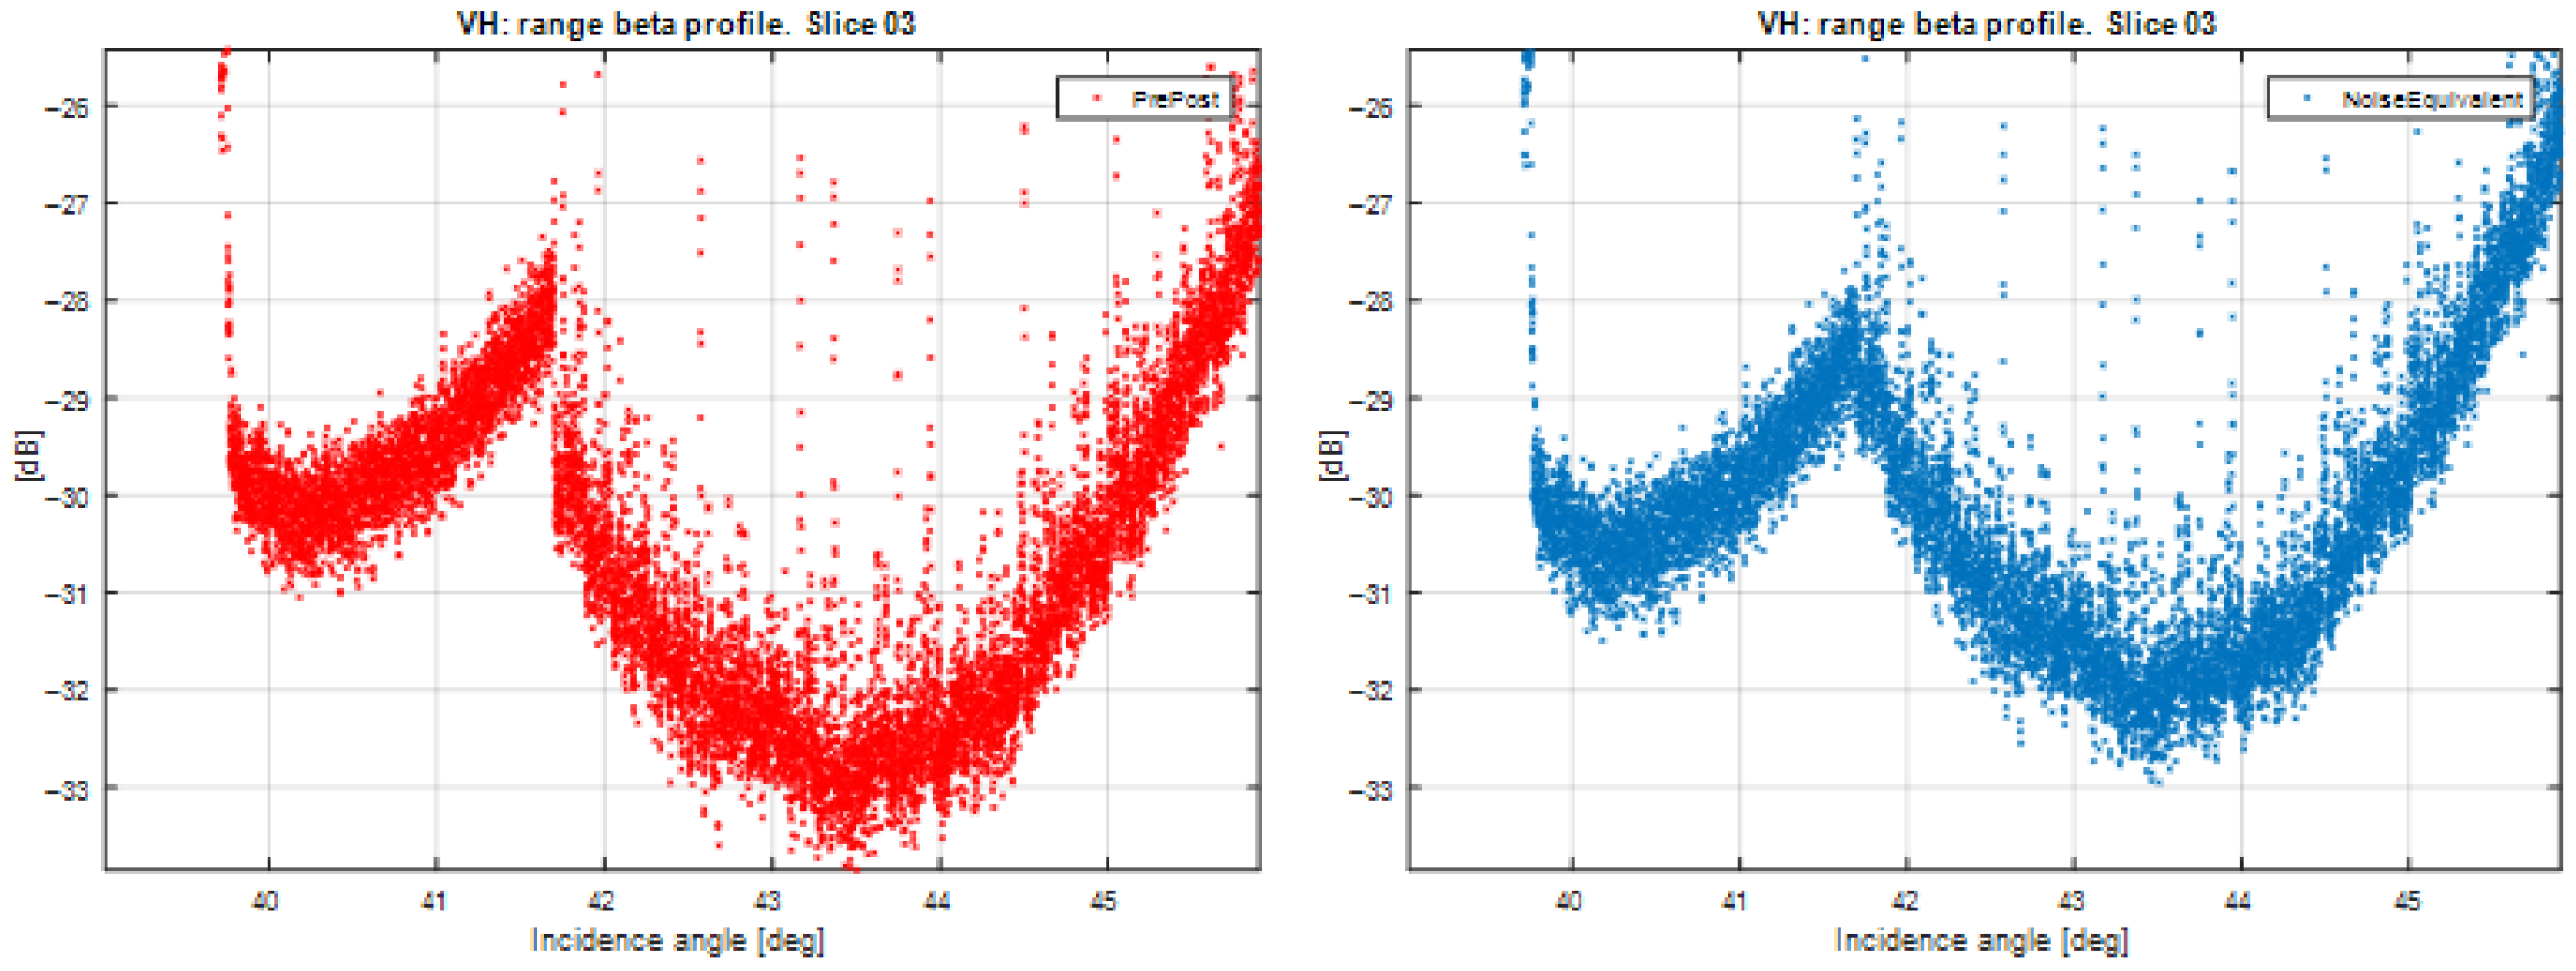
In Figure 16, the residual differences between data and old noise vectors (on the left) and new noise vectors (on the right) are shown, considering all selected bursts from EW1 VH. All the bursts have been cumulated over a common incidence angle axis. The colors in the plot represent the density of points: yellow represents high density and blue represents low density. It is clearly visible that the recalibrated noise vector is better aligned with the data levels, implying that the residual differences are closer to zero.
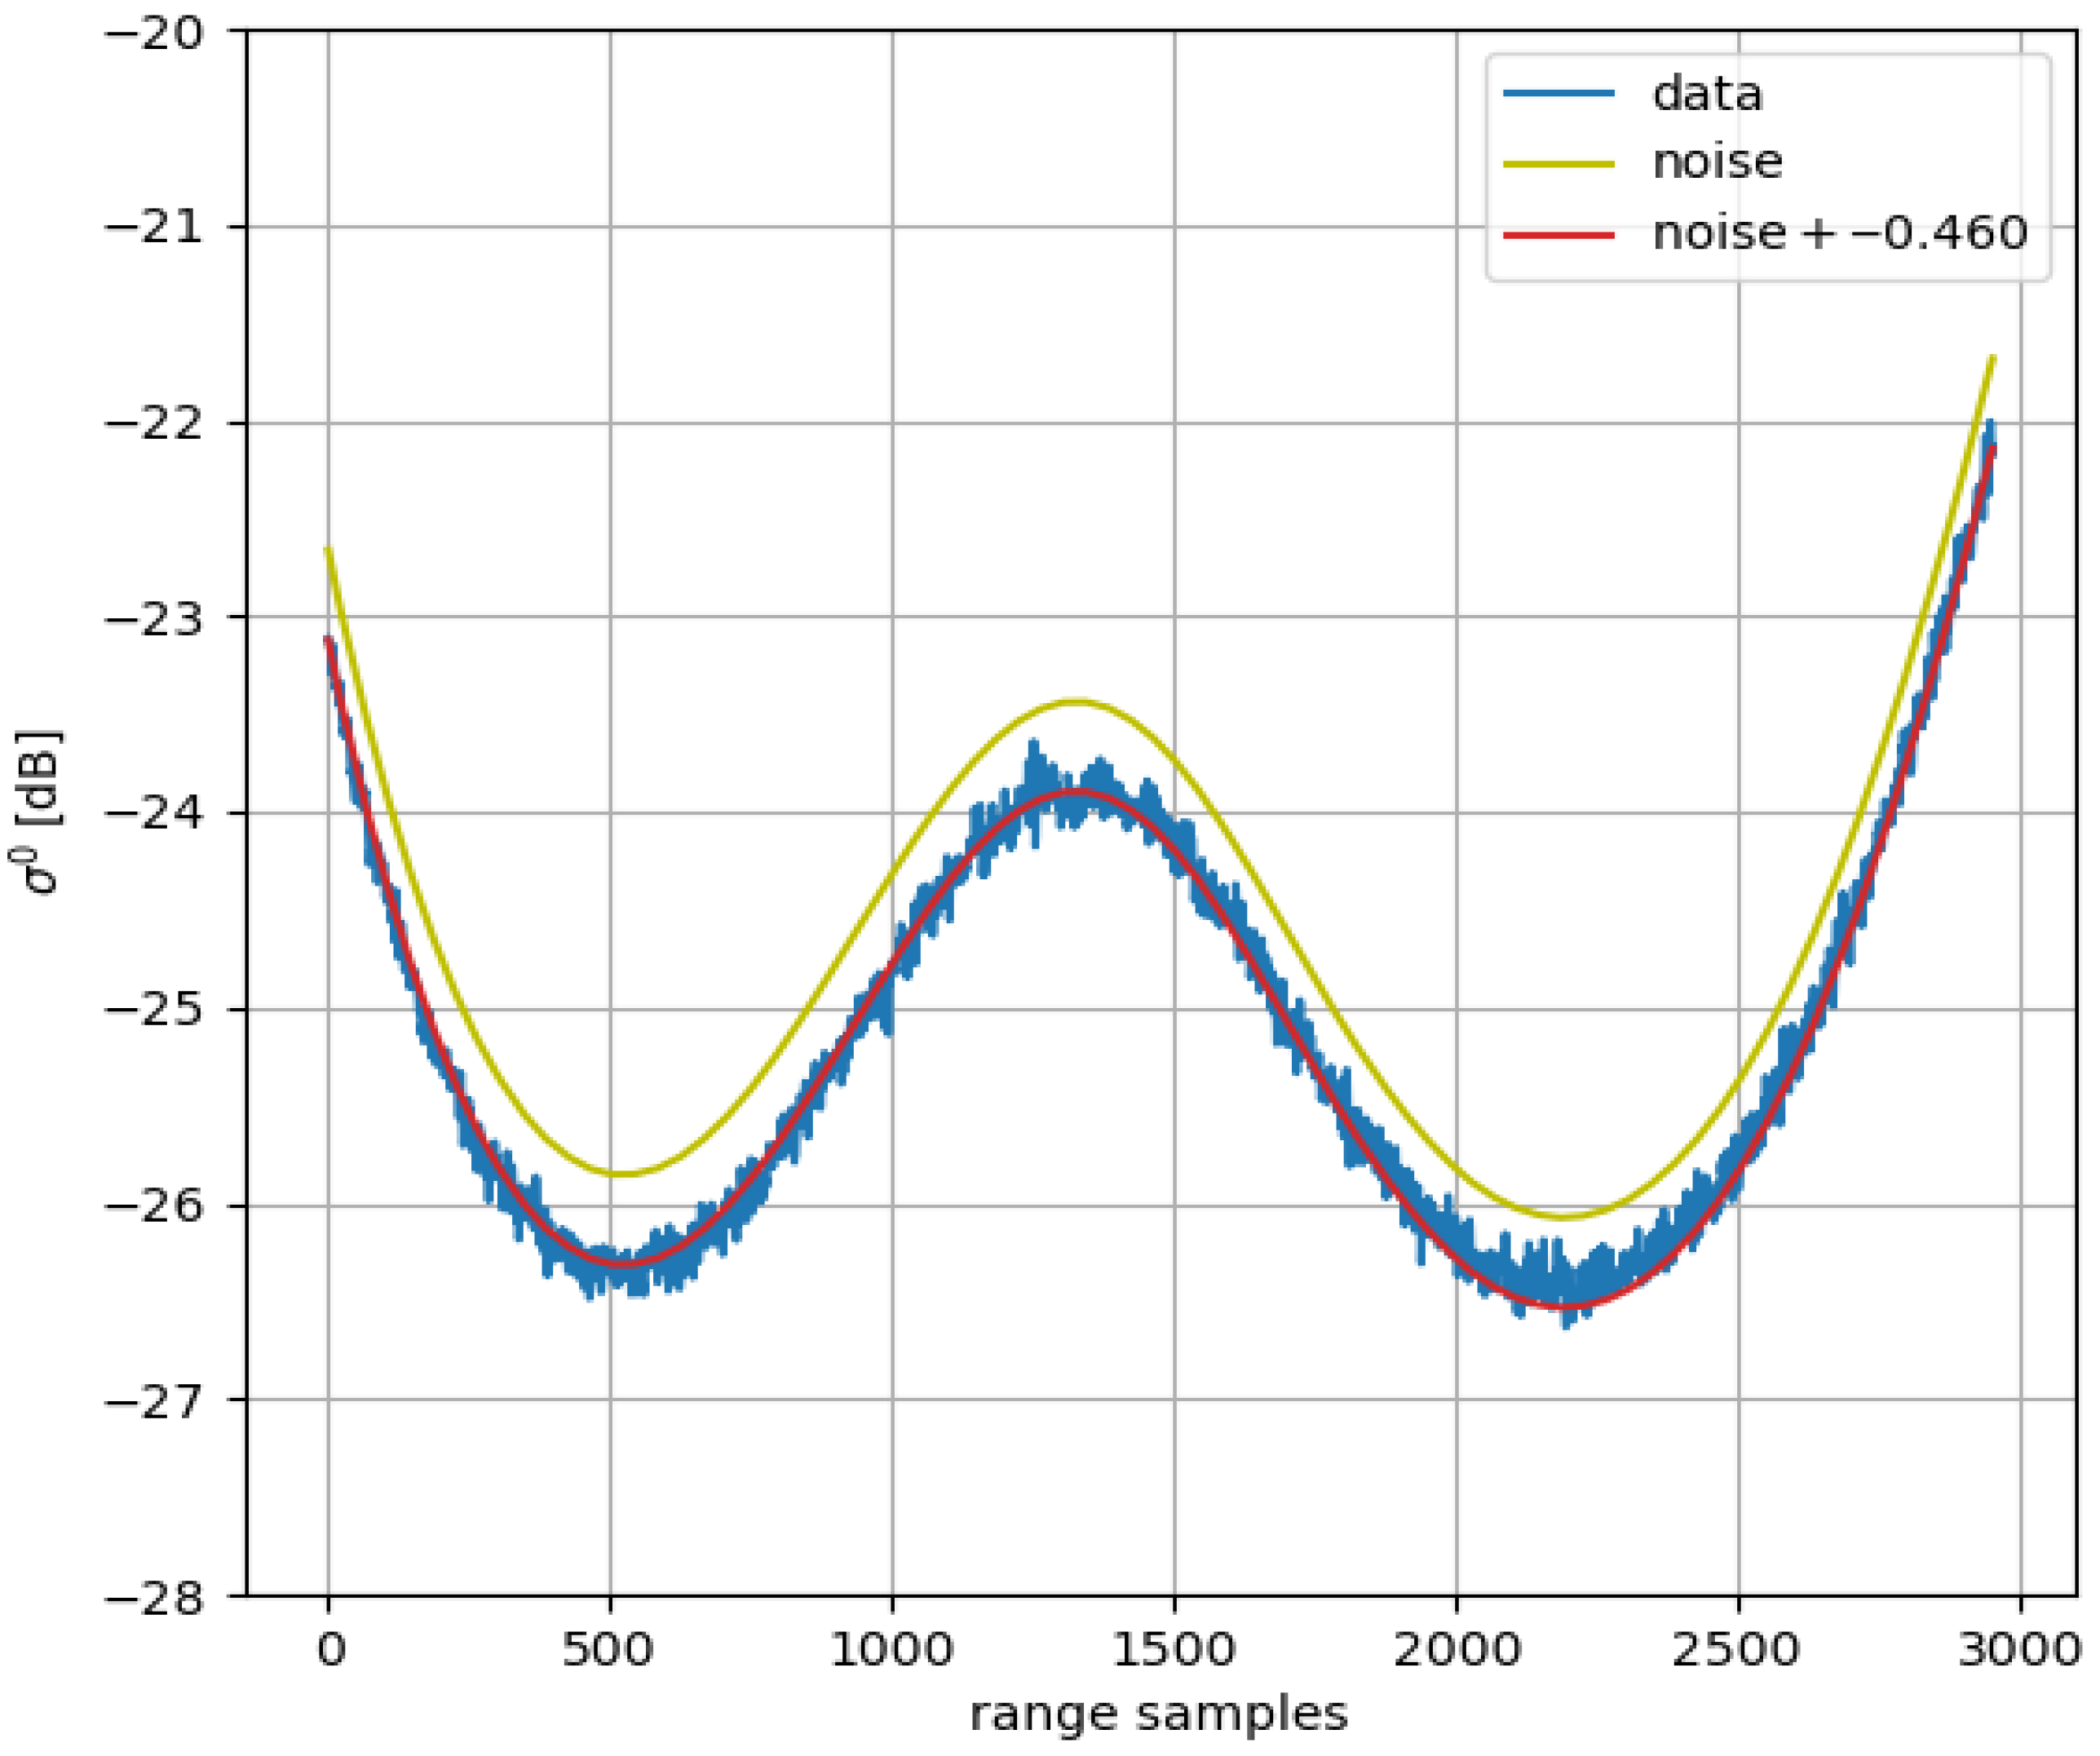
The new noise calibration factor is derived as the product between the old noise calibration factor and the estimated correction constant, k, (which becomes an additive constant in dB). A sample result of the noise calibration procedure is provided in Figure 17, where the data profile measured over an S1 EW1 sub-swath for a product acquired over calm water is reported in blue. The original de-noising vector annotated in the product, reported in yellow, suggests a miscalibration that is recovered after the re-calibration procedure. The result is the red de-noising vector, showing a very good match with the data profile.
The procedure discussed herein would also be applicable to Stripmap data but, unfortunately, the in–out-band power ratio is currently not computed and annotated for Stripmap data (this information will be available after the deployment of IPF 4.0 in October 2025), making the identification of suitable data more difficult. The situation is even worse for WV data, which have no in–out-band power ratio and are only acquired in a co-pol channel with a larger backscatter level than the cross-pol.
To overcome this issue, the data are filtered, excluding all the pixels with an amplitude outside a configurable percentile. The filtered data are then multi-looked with a configurable window, allowing us to expand the data mask to neighboring pixels and further reducing the signal contamination.
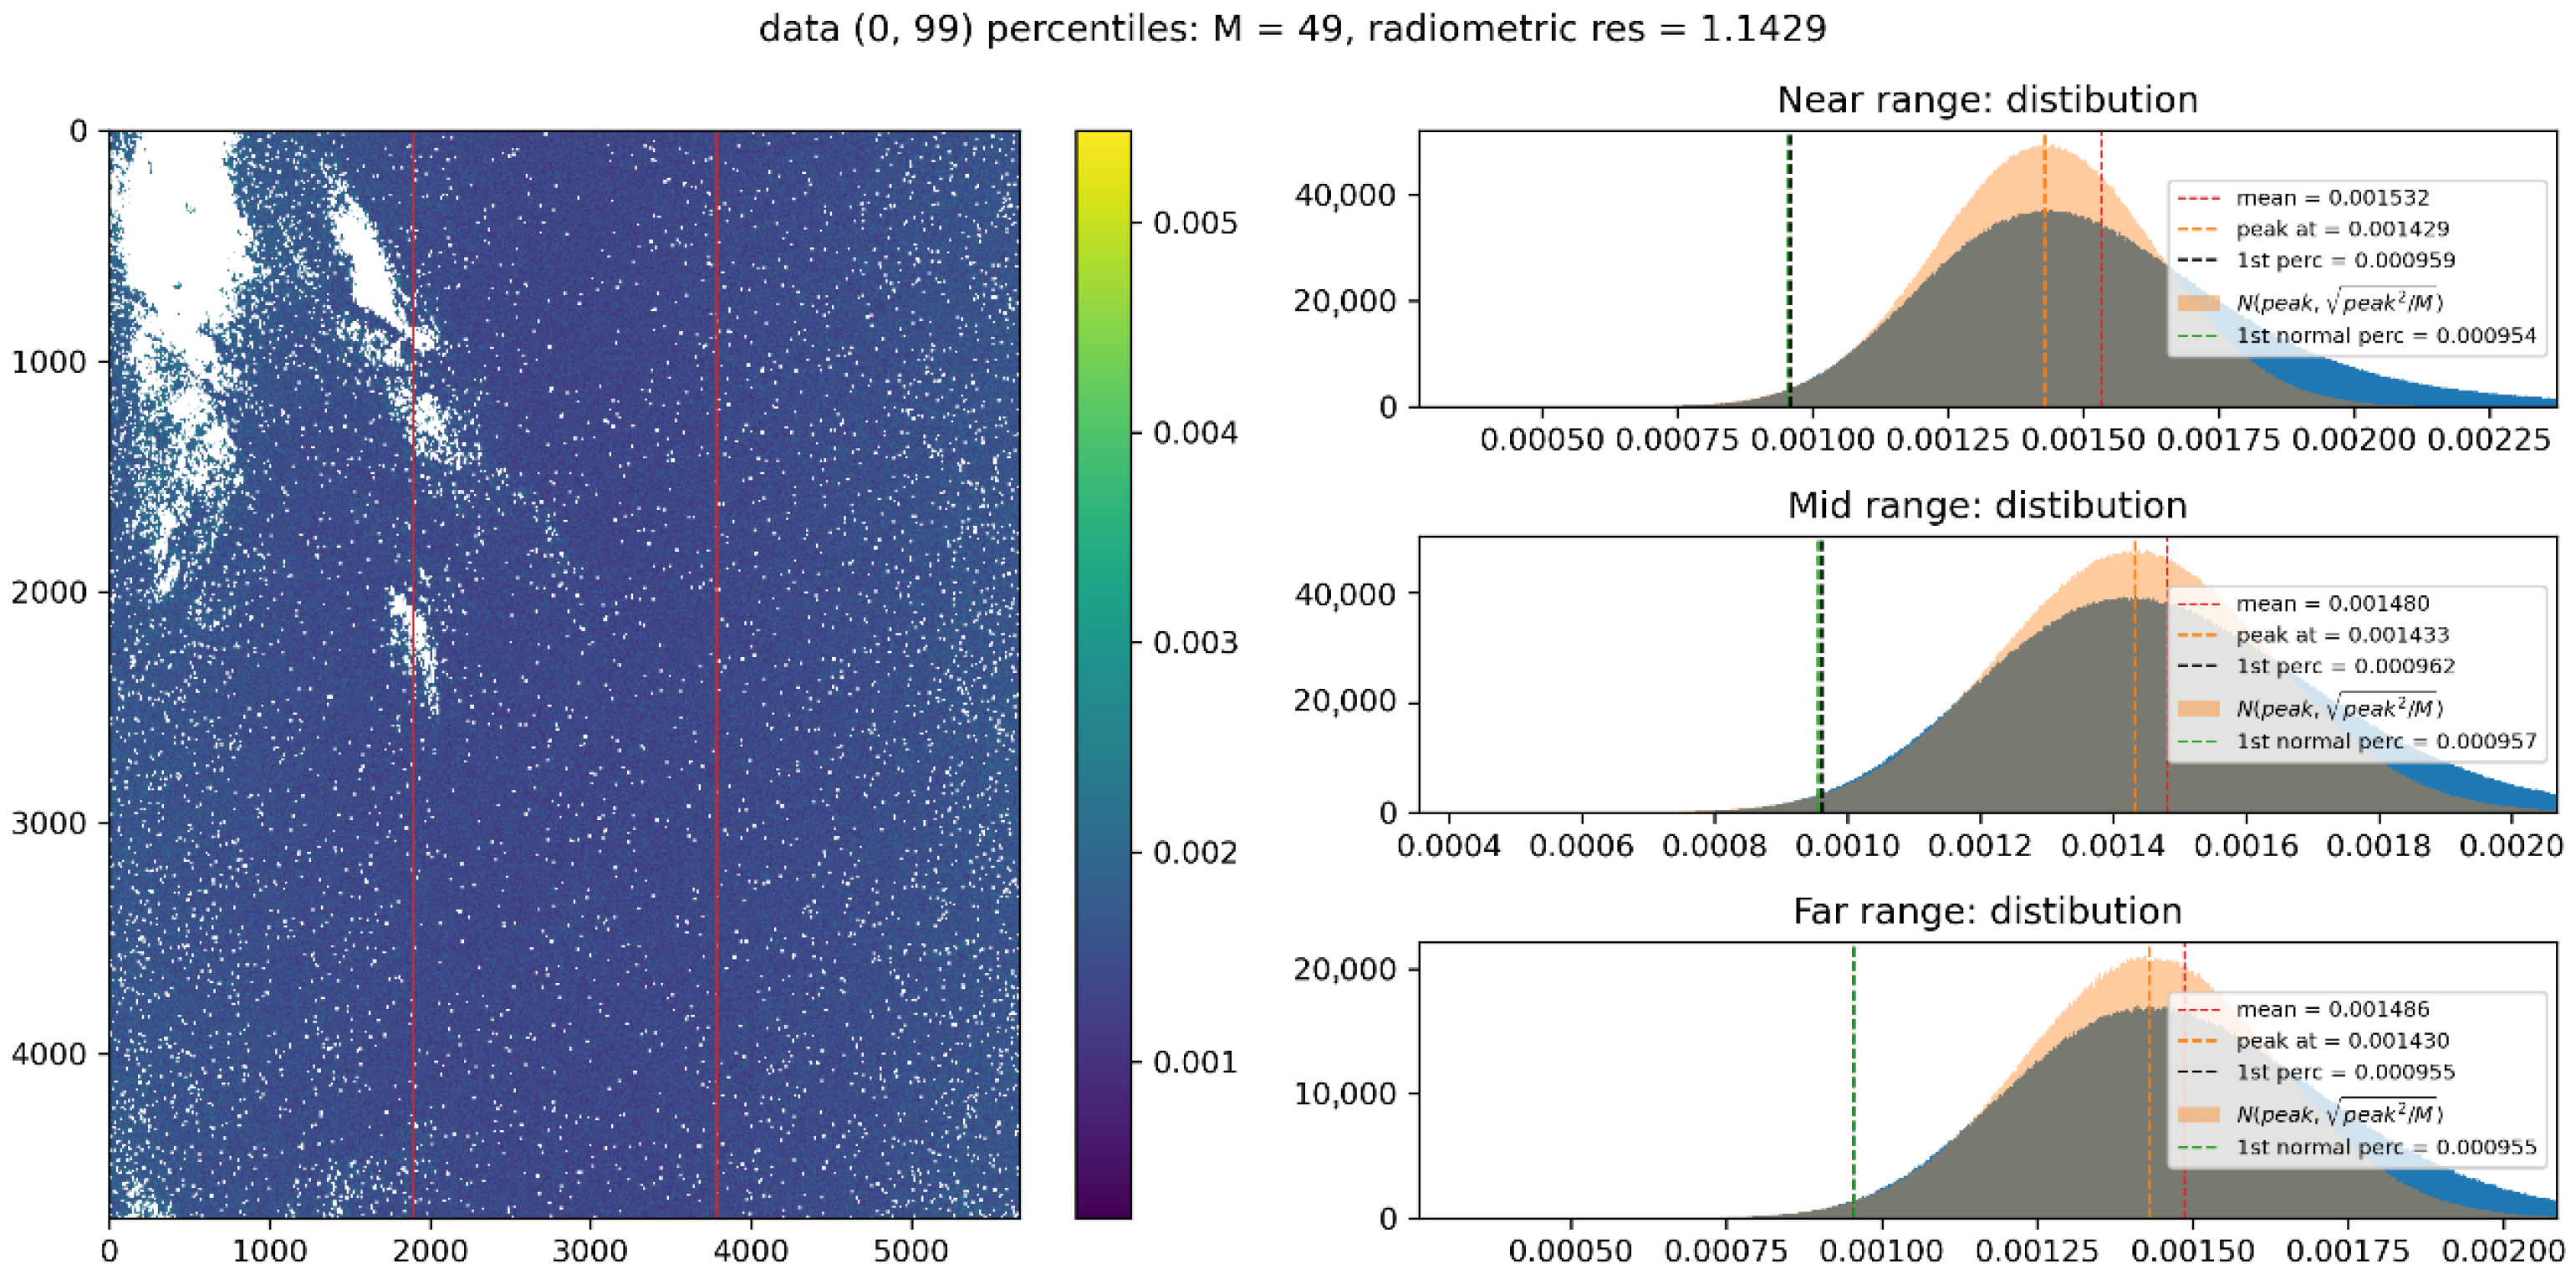
Figure 18 shows an example of an S1A WV imagette after processing on the left (outlier exclusion + multi-looking), and on the right the data distribution within the imagette (divided in near/mid/far range) in blue, compared against a Gaussian distribution (light orange) centered at the data distribution peak and with the expected standard deviation (based on the number of pixels in the multi-looking window).
The two distributions have very similar low-percentile values (such as 1st percentile shown in the figure); this information is used as a quality indicator that the distribution of the residual is not distorted by the signal and, hence, the peak of the (blue) data distribution is a measure of the imagette noise level.
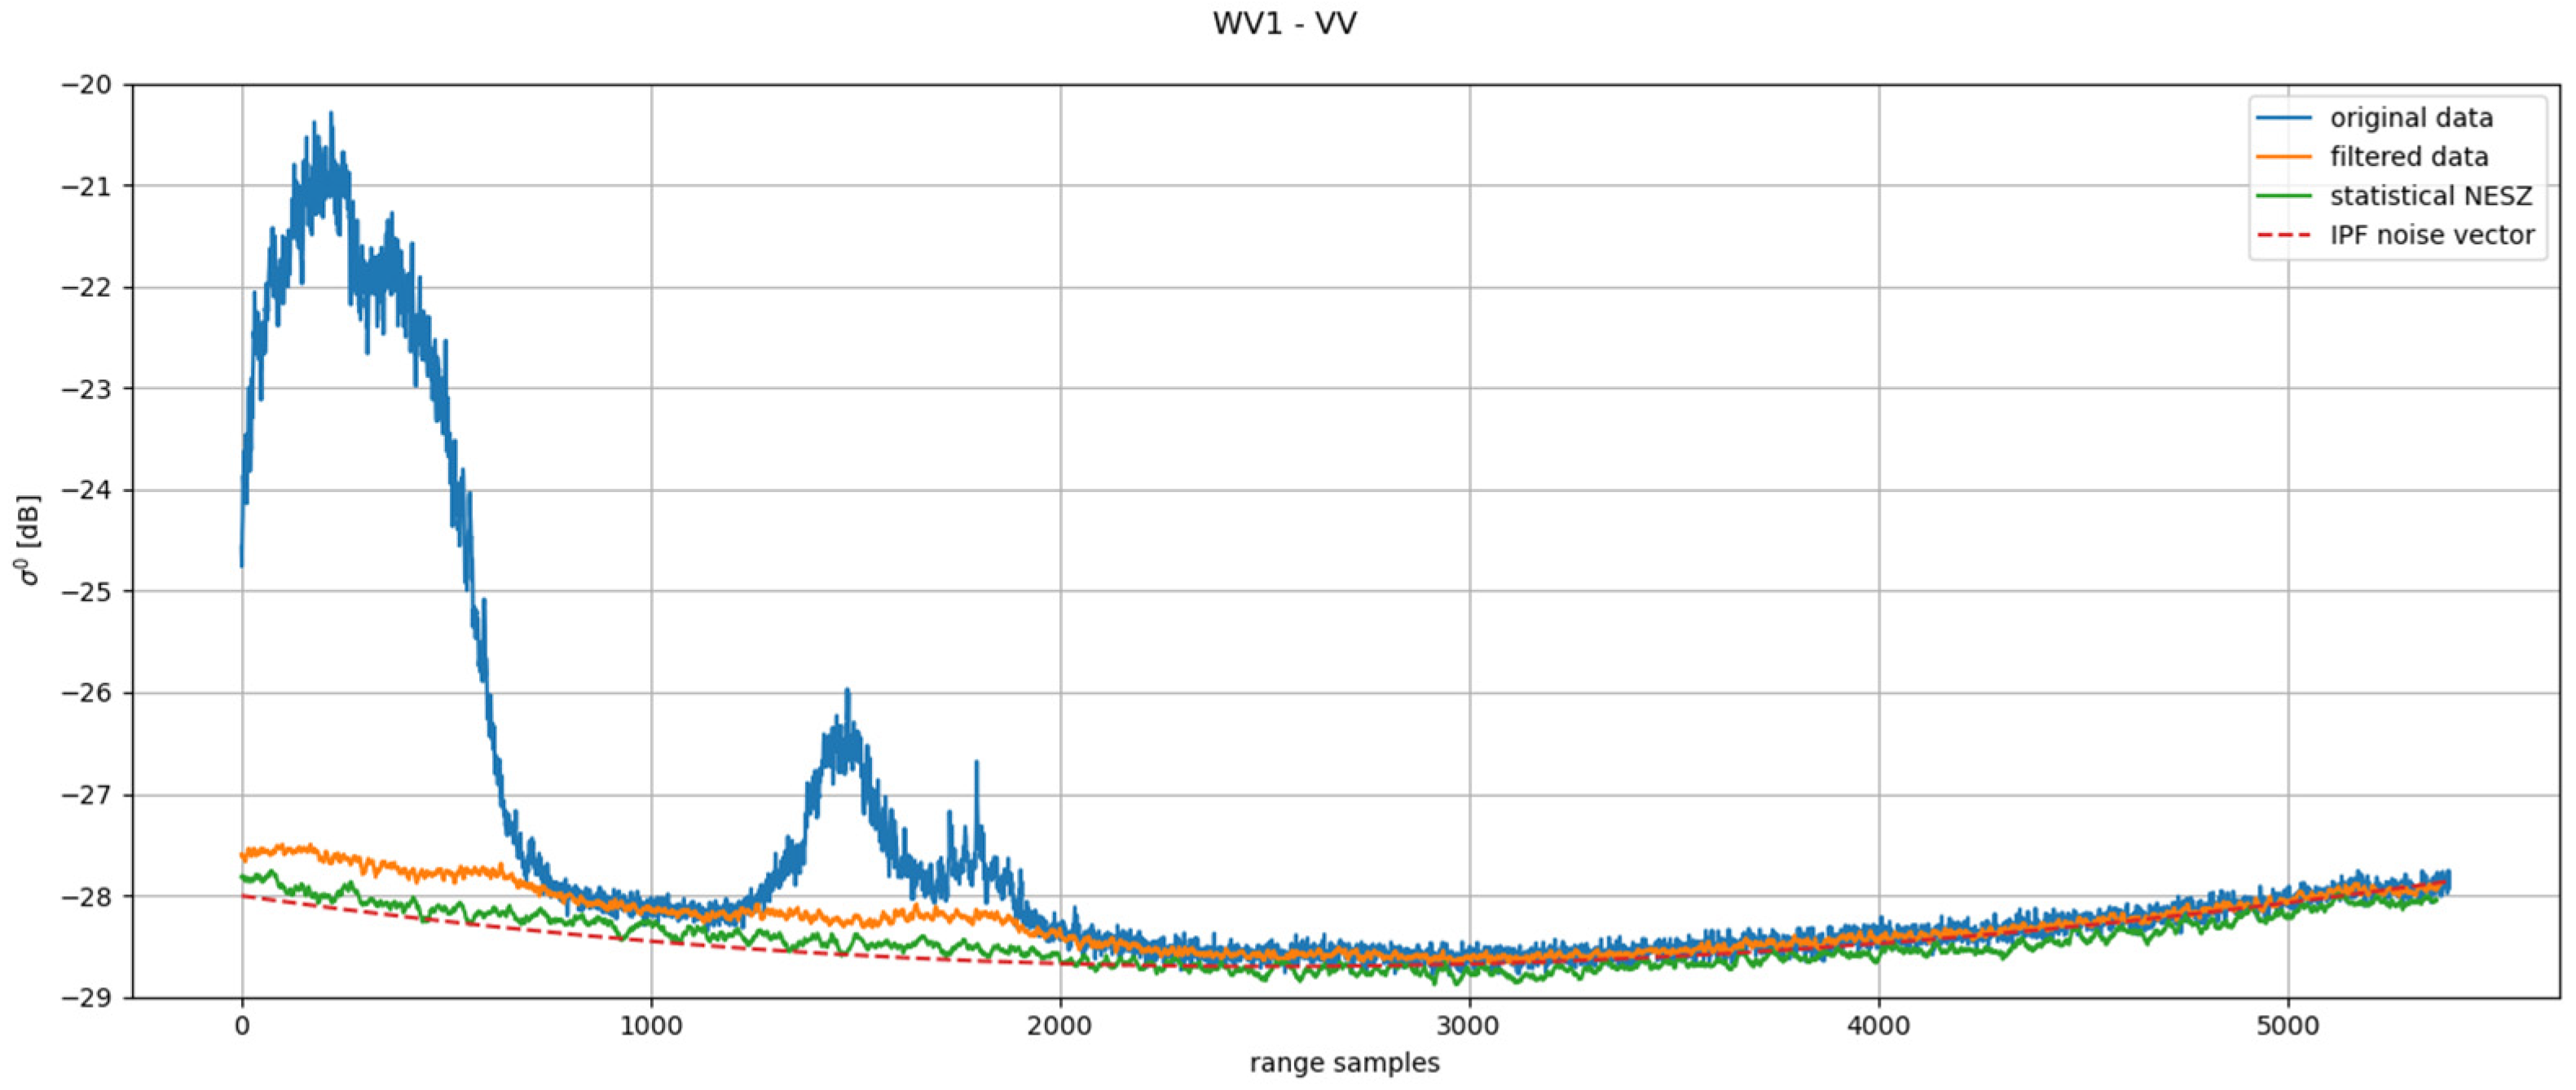
Moreover, Figure 19 shows the radiometric profile of the data in range compared to the noise vector computed by the IPF. The blue line shows the original data profile, which is clearly affected by signal in the first half; the orange profile indicates the data after processing (i.e., outlier exclusion + multi-looking), which is still slightly affected by some residual noise; finally, the green profile is the statistical estimation of NESZ proposed using the method described above, where the profile is obtained as the distribution peak value in azimuth for each range sample. The red dashed line is the IPF noise vector read from the annotation file, for the selected imagette. In general, the statistical method proposed for the estimation of the NESZ (for data affected by signal) produces a profile (green) which is in good agreement with the IPF noise vector. On the contrary, filtering out the outliers from the data may not be enough to eliminate the effects of the signal in the profile (orange). In conclusion, the NESZ and noise-vector profiles seem very similar, implying that for the Wave mode the noise vector is well calibrated.

3.2. Noise-Vector Evolution in L1 IPF

The S1 IPF has been updated several times since the launch of S1A in 2014 to improve the quality of the noise vectors annotated in the products. Table 3 provides a list of the main IPF updates related to noise vectors.
Some of the listed improvements represents bug fixes or minor improvements that contributed to the increase in the annotated noise vectors’ quality. The main improvements in the annotated noise vectors’ quality include:
  • The azimuth variation in the noise vectors for TopSAR modes was introduced in March 2018 with IPF 2.9.0. This was introduced to account for the scalloping correction applied to the TopSAR bursts (see Section 2.2.3). The de-scalloping operation introduces an azimuth dependency of the noise level in TopSAR burst that was not captured by the original noise vectors, providing only the noise variation in the range direction.
  • The usage of ranked echoes for noise-vector computation started with the deployment of IPF 2.9.1 on June 2018. As discussed in Section 2.3.2, this allowed for better tracking of the noise-power variation during the data acquisition.
  • The normalization of the noise vectors was introduced with IPF 3.1.0 in June 2019. Previously, the same noise vectors were annotated for all the product levels (SLC and GRD with different resolutions).
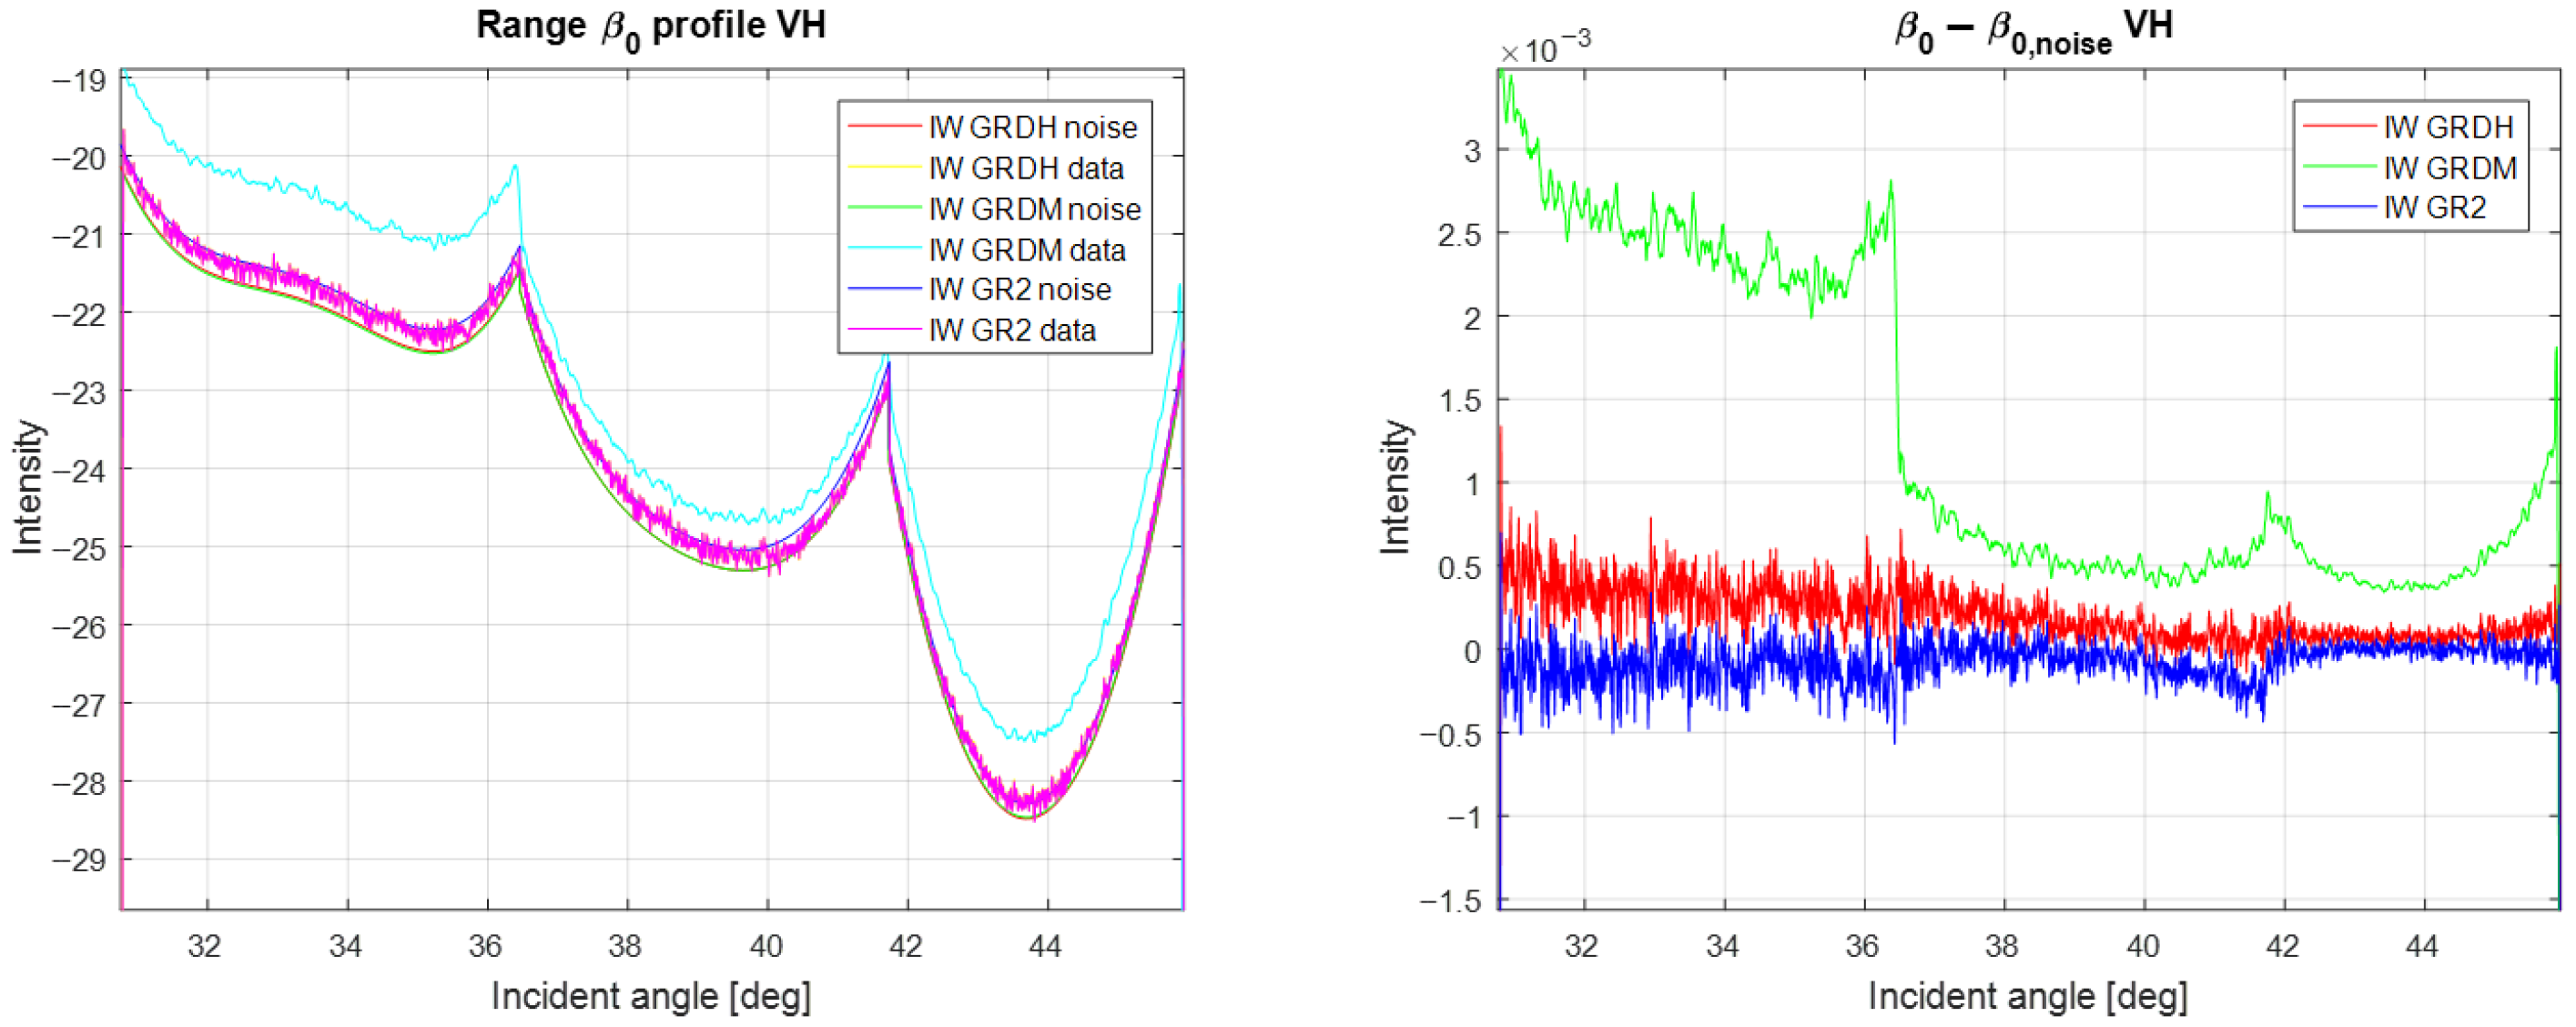
The issue with the noise-vector normalization is reported in Figure 20 for a product with very low backscatter, processed with IPF 3.0.0. The image on the left represents both the noise level and the noise vectors for 3 different GRD products. The GRDH (high resolution) and GRD2 (which is an internal product generated for the L2 processing chain) products have the same data level (yellow and pink lines are overlapped) because they are generated with the same processing configuration. On the other hand, the noise vectors (red and blue lines) were slightly different due to inconsistent configuration files. The GRDM product (medium resolution) shows instead a larger data level (light-blue line) due to the different processing configuration, but the same noise vector of the GRDH product, due to the missing noise normalization functionality. The reported discrepancies result in the de-noised data shown on the right, presenting a different level for each GRD product.
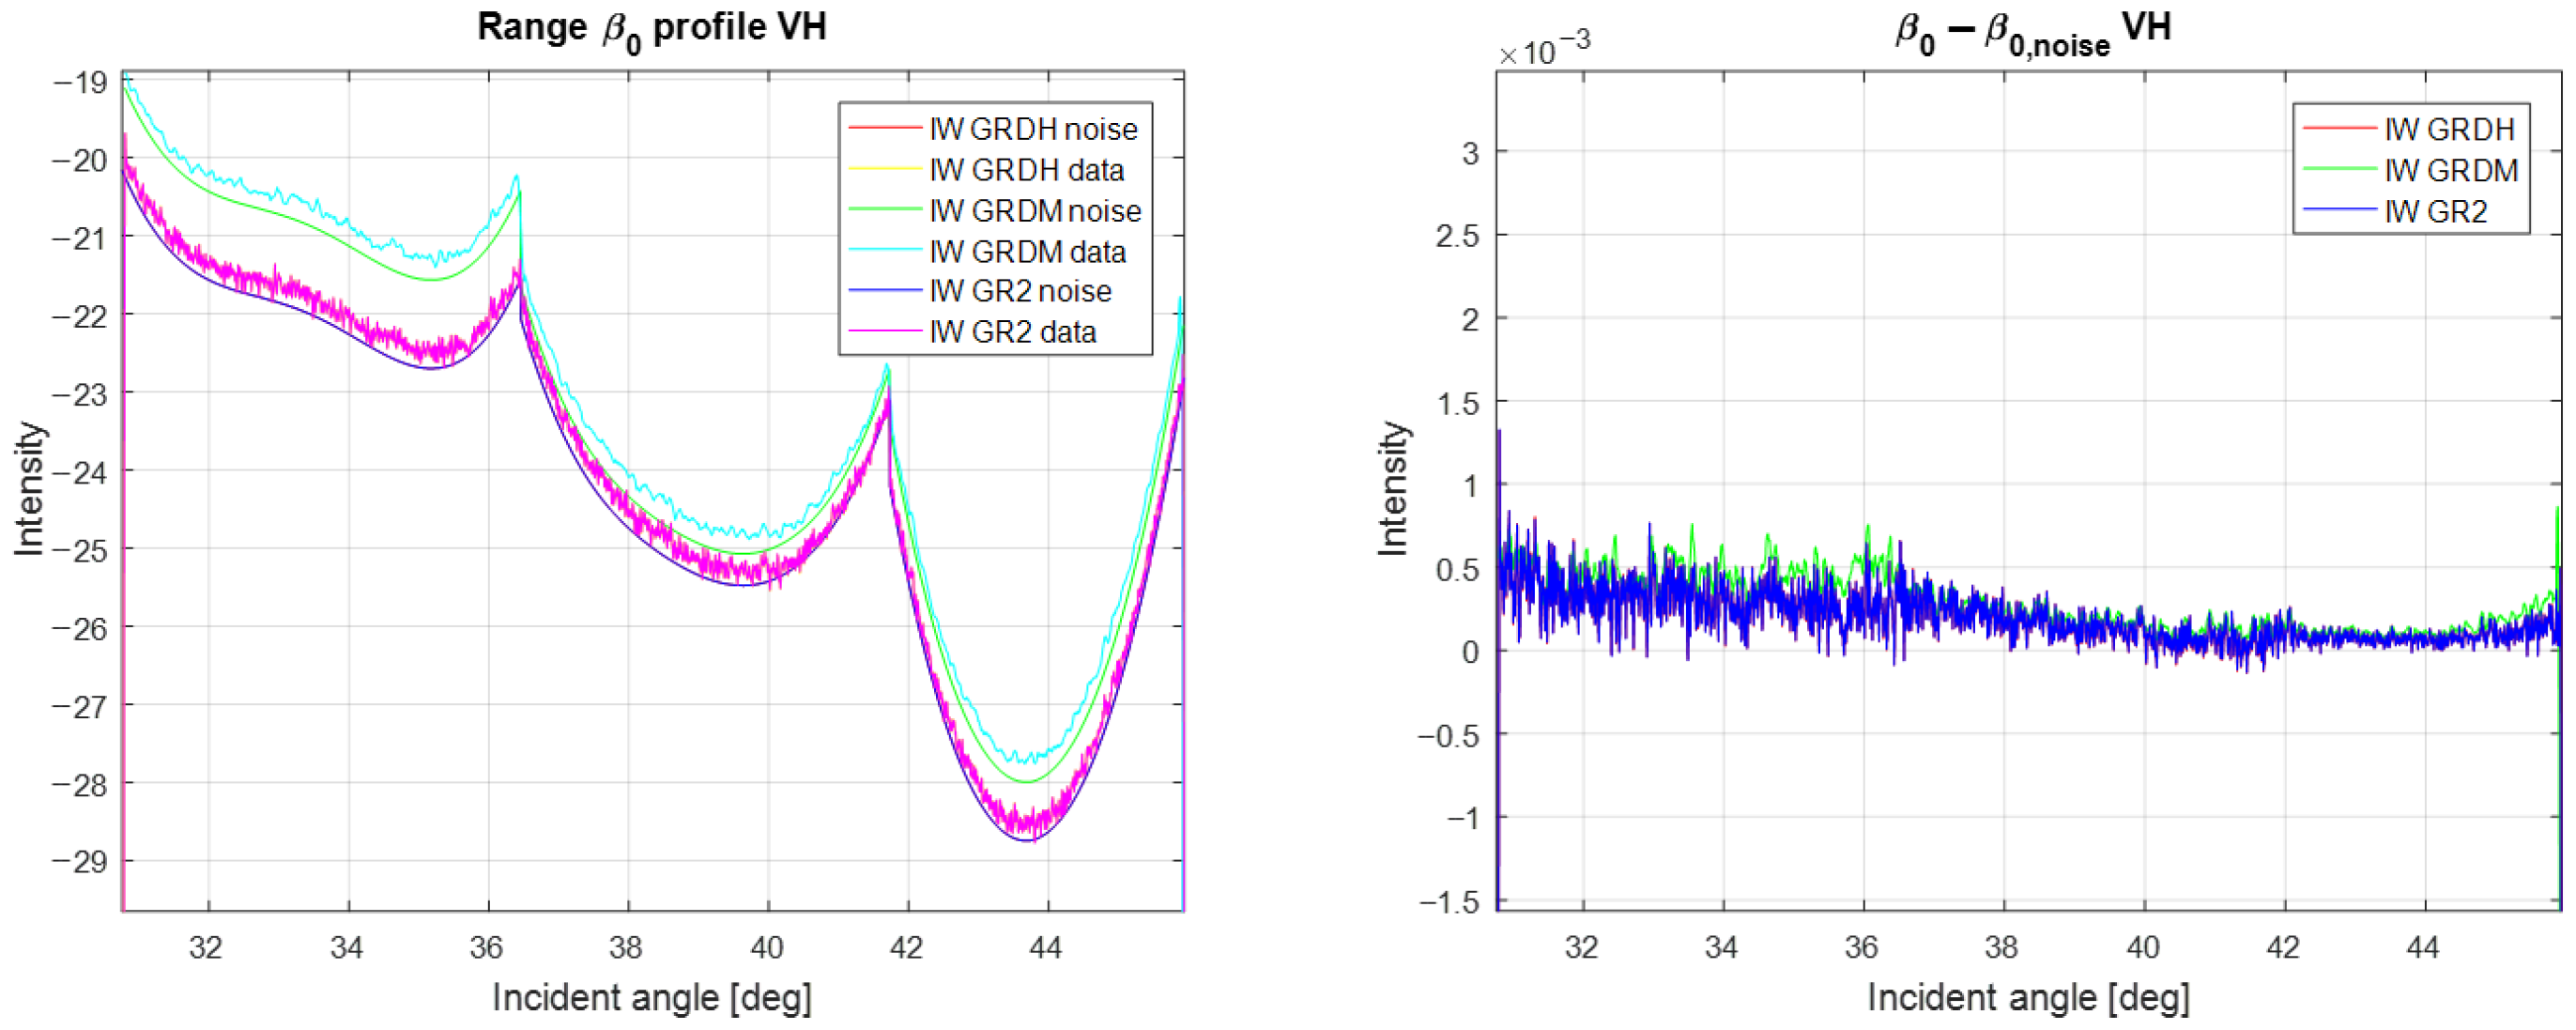
Figure 21 shows the same product processed with IPF 3.1.0 including the noise normalization functionality. The GRDH and GRD2 noise vectors are now aligned, while the noise vectors of the GRDM product have been updated to account for the actual processing configuration. The image on the right shows that the de-noised data are the same for all the GRD product levels.
The noise normalization factor for the different products is computed according to the following model:
k n o r m = l o o k ( W a / G a a p ) 2 ( f n ) p r o c B W 1 2 p r o c B W G a a p 2 ( f n ) l o o k W a 2 ( f n )
where G a a p is the azimuth antenna pattern; W a is the window used for the generation of looks; p r o c B W f n represents the spectrum integration over the total processed bandwidth for the considered sub-swath; l o o k f n represents the spectrum integration on the considered frequency looks.
Following the deployment of IPF 3.7.0, the noise vectors annotated in the S1 products can be considered of high quality with no (or just very minor) residual issues.

3.3. Re-Calibration of Noise Vectors

The last step of the noise-vector quality optimization was the re-calibration of the noise vectors to ensure the best possible alignment between data and noise vectors. This was achieved by implementing the calibration procedure discussed in Section 3.1 over S1A IW and EW TopSAR bursts processed with IPF 3.7.0. The calibration of the noise calibration constants resulted in the updates reported in Table 4. The performed analyses suggested that no update of the Wave mode noise calibration constants was needed.
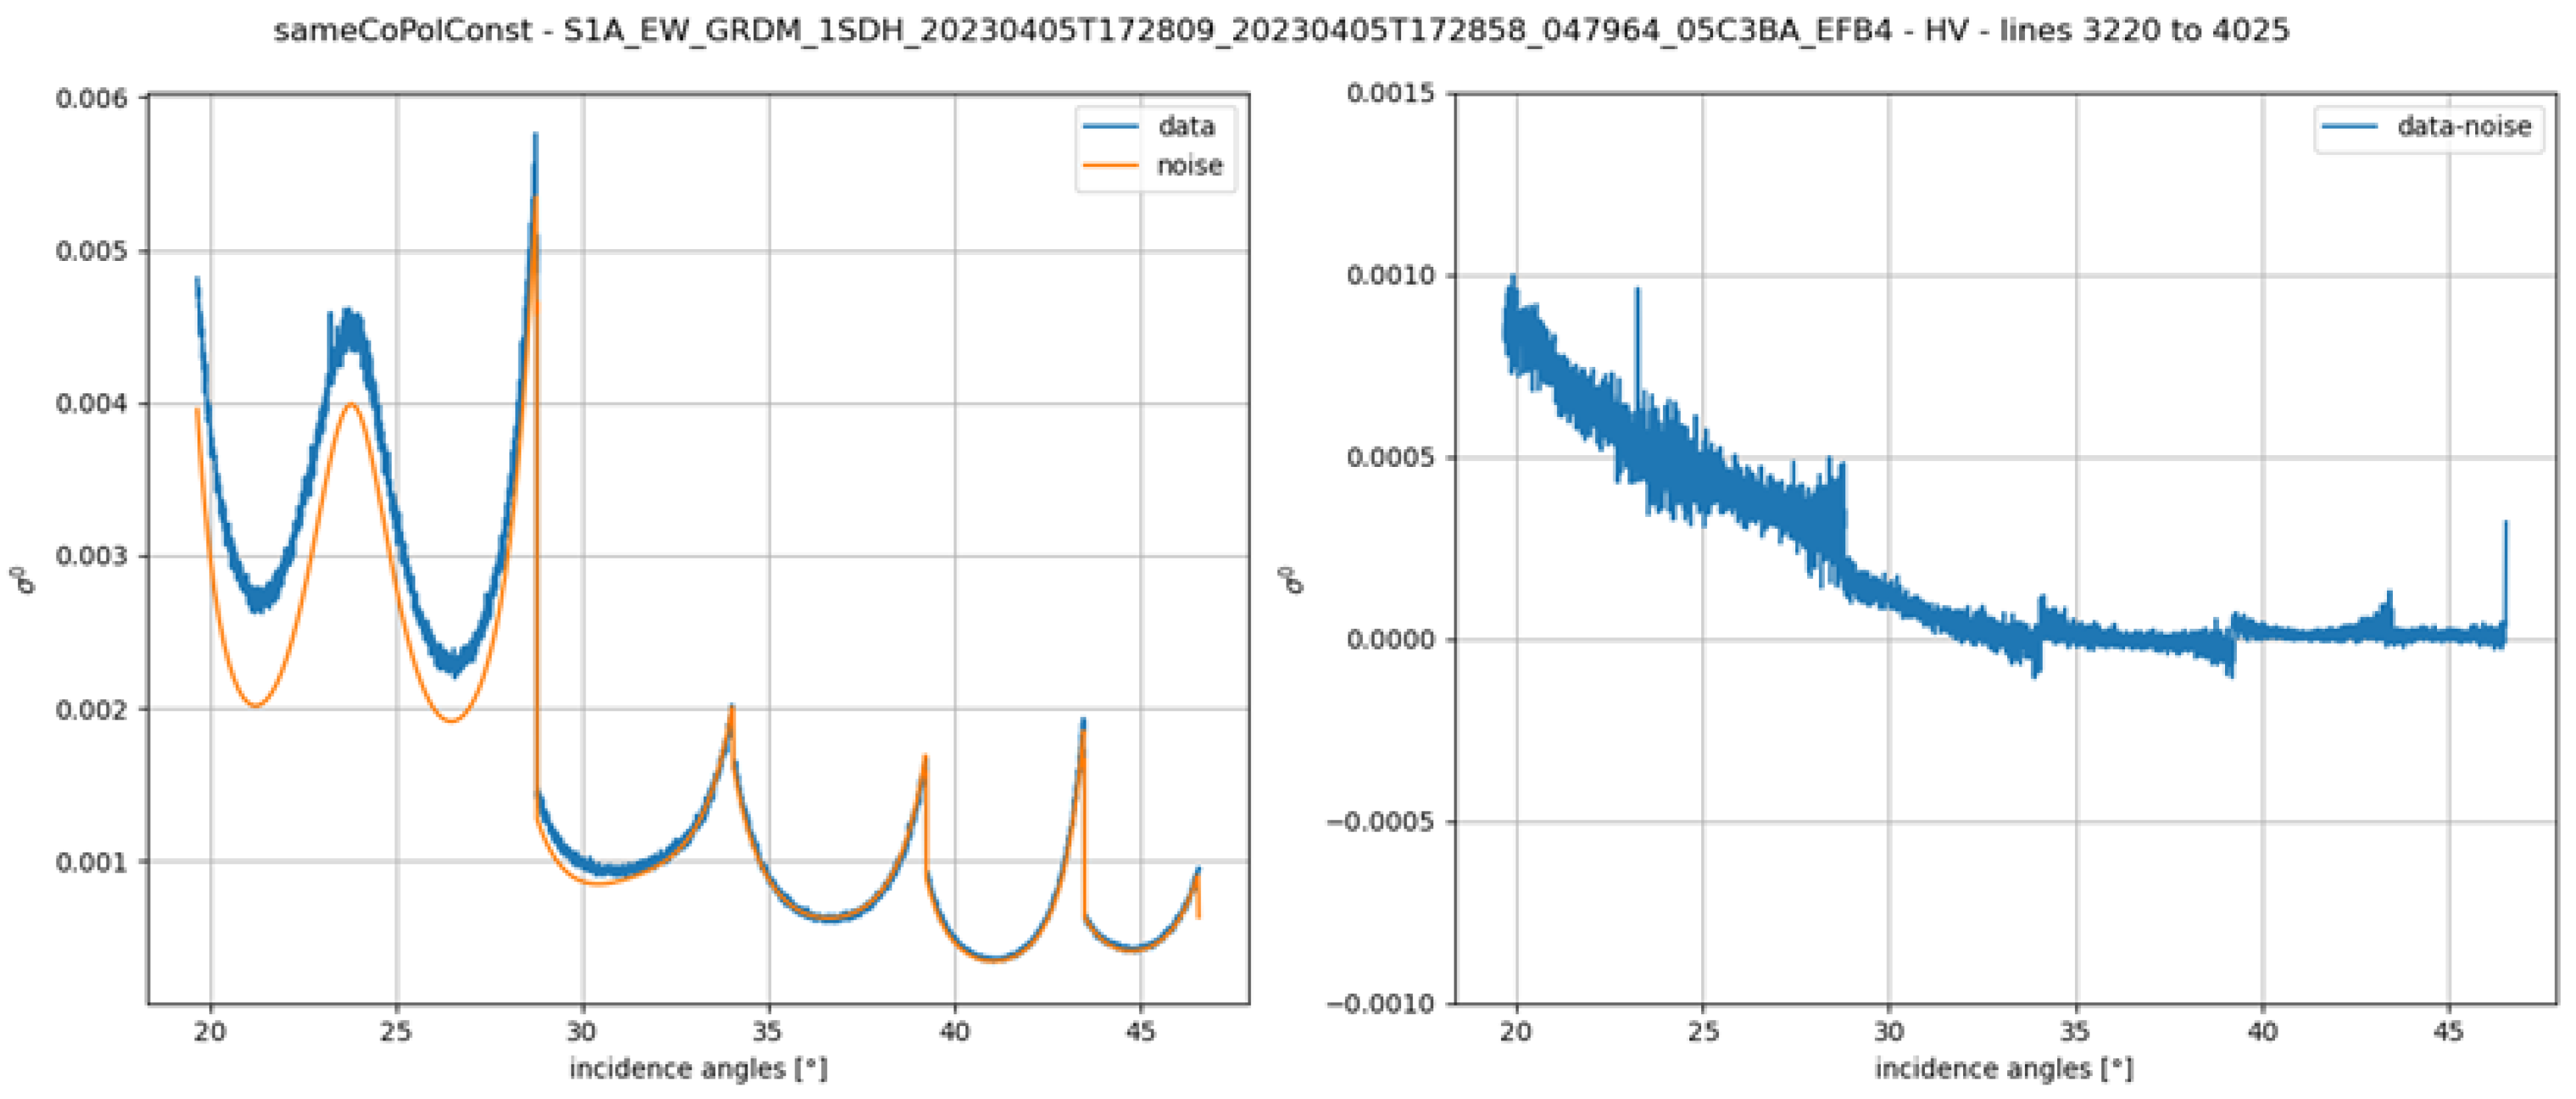
The result of the optimization of noise calibration constants for EW receiving V polarization is shown in Figure 22 and Figure 23. Figure 22 shows on the left the data level (blue) and the noise vectors (orange) for a low-backscatter GRD processed with IPF 3.7.0. The noise calibration constants before the optimization were used. The de-noised data shown on the right present some discontinuities at the sub-swath boundaries.
Figure 23 shows the same data processed with the optimized noise calibration constant. The de-noised data show a much better continuity between the sub-swaths after the de-noising operation.
The optimization of noise calibration constants was also performed for S-1B even if it has not been operational since the end of December 2021. To identify suitable bursts, data acquired after IPF 3.4.0 deployment (introduction of the in–out-band power ratio annotation) in November 2021 were considered. This resulted in the availability of just a couple of months of data. The optimization was performed for both receiving polarizations of TopSAR IW but only for the receiving V polarization of TopSAR EW, since no suitable EW H Rx-pol products were acquired during those two months. The results of the optimization are reported in Table 5.

3.4. S-1 Data De-Noising Results

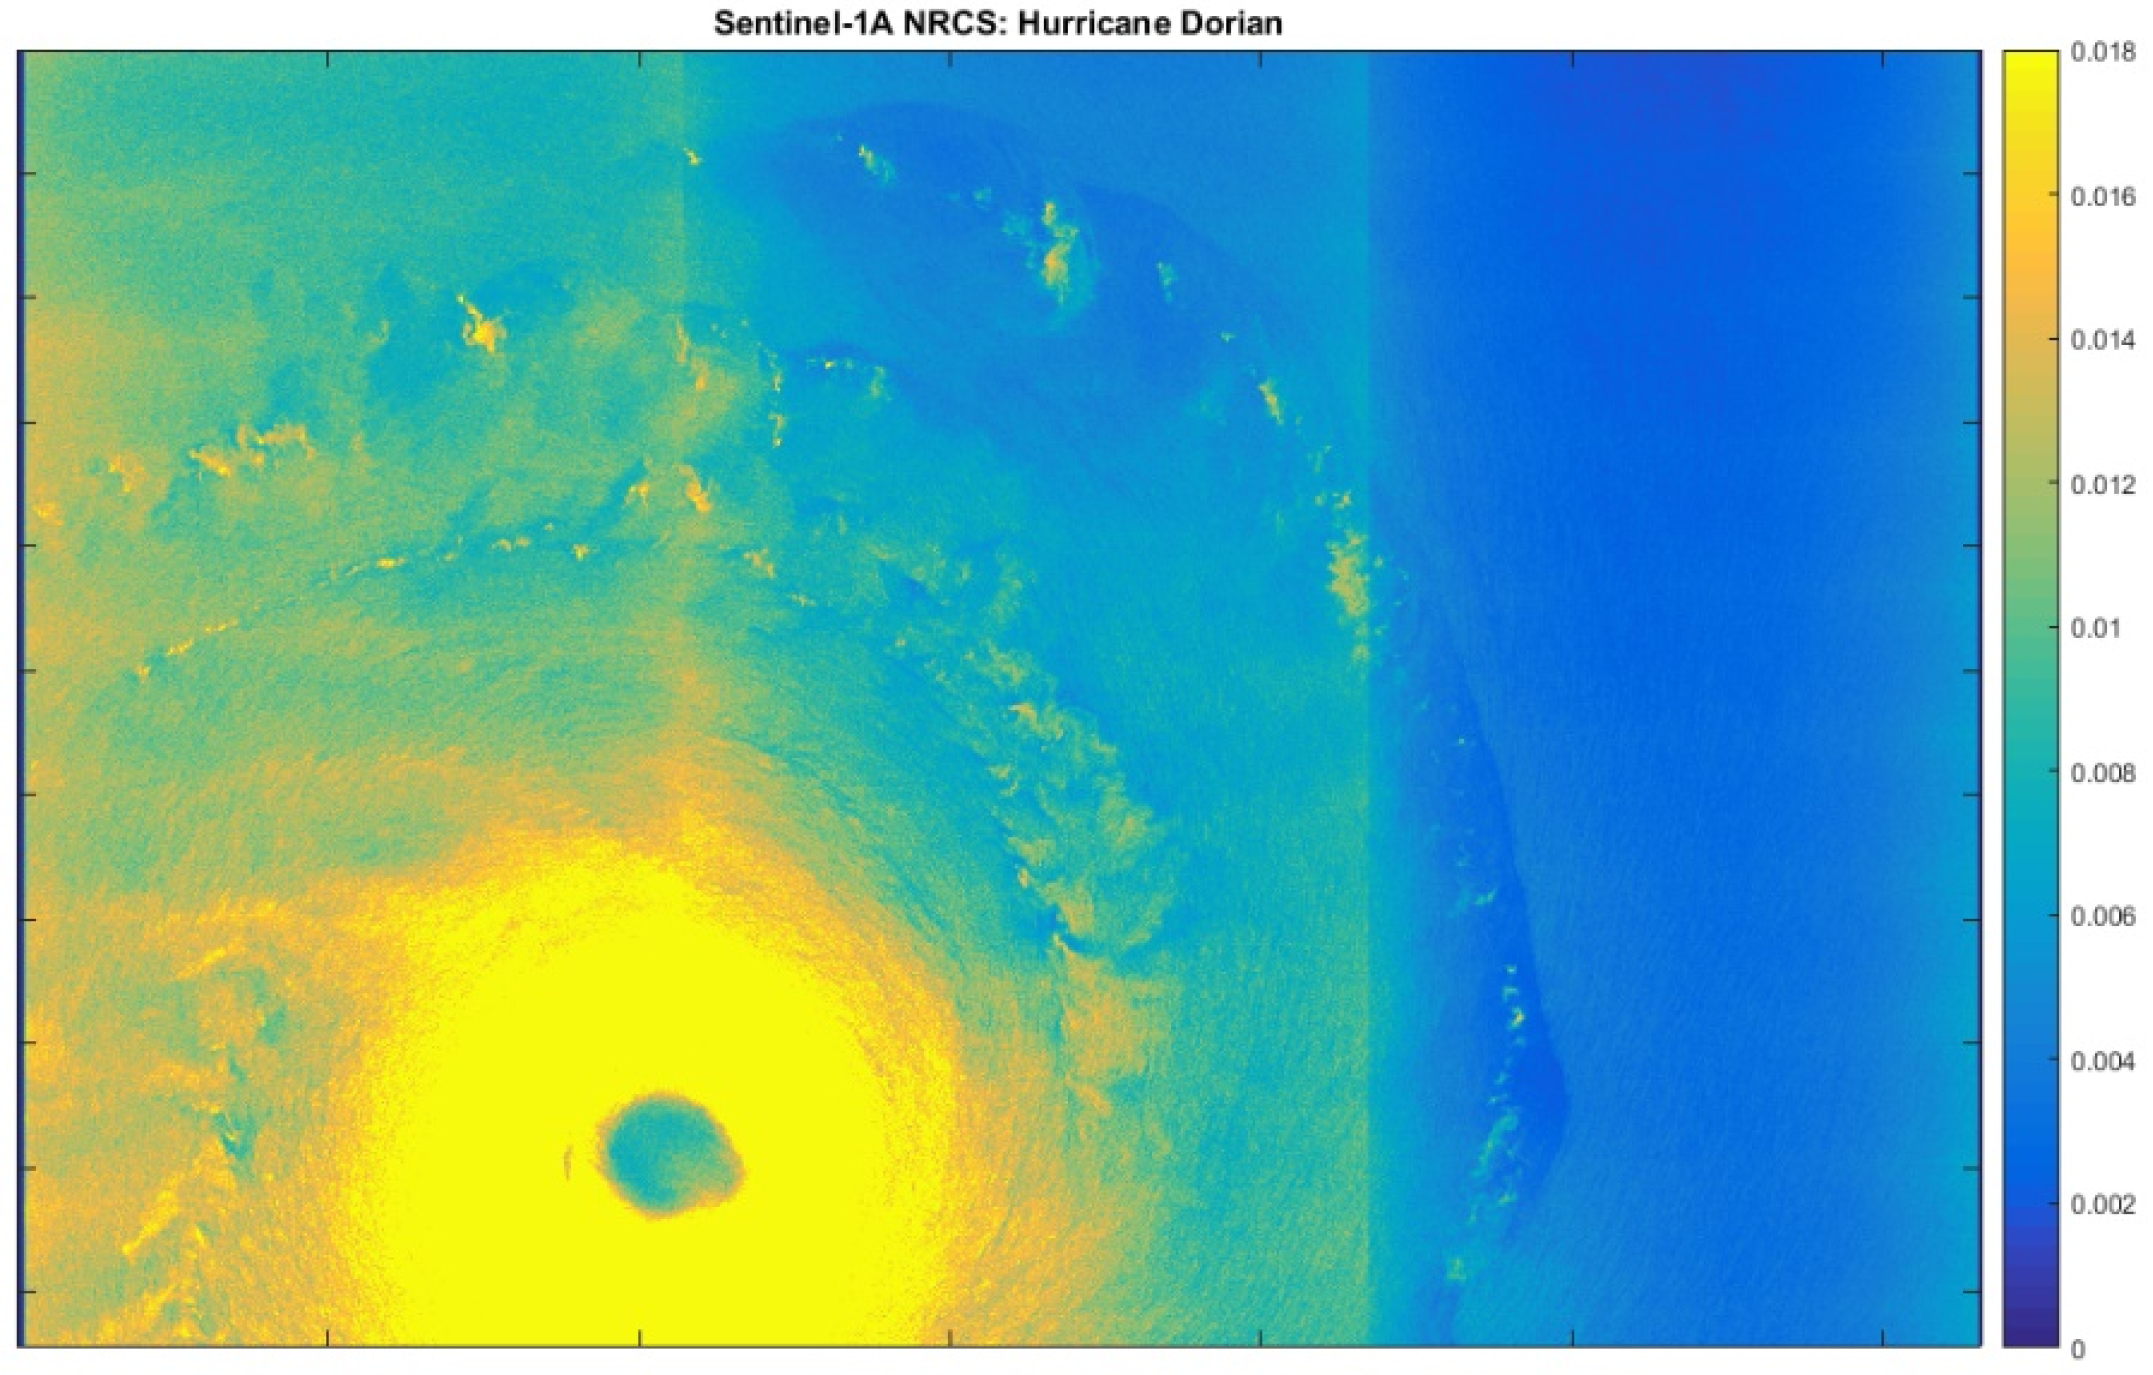
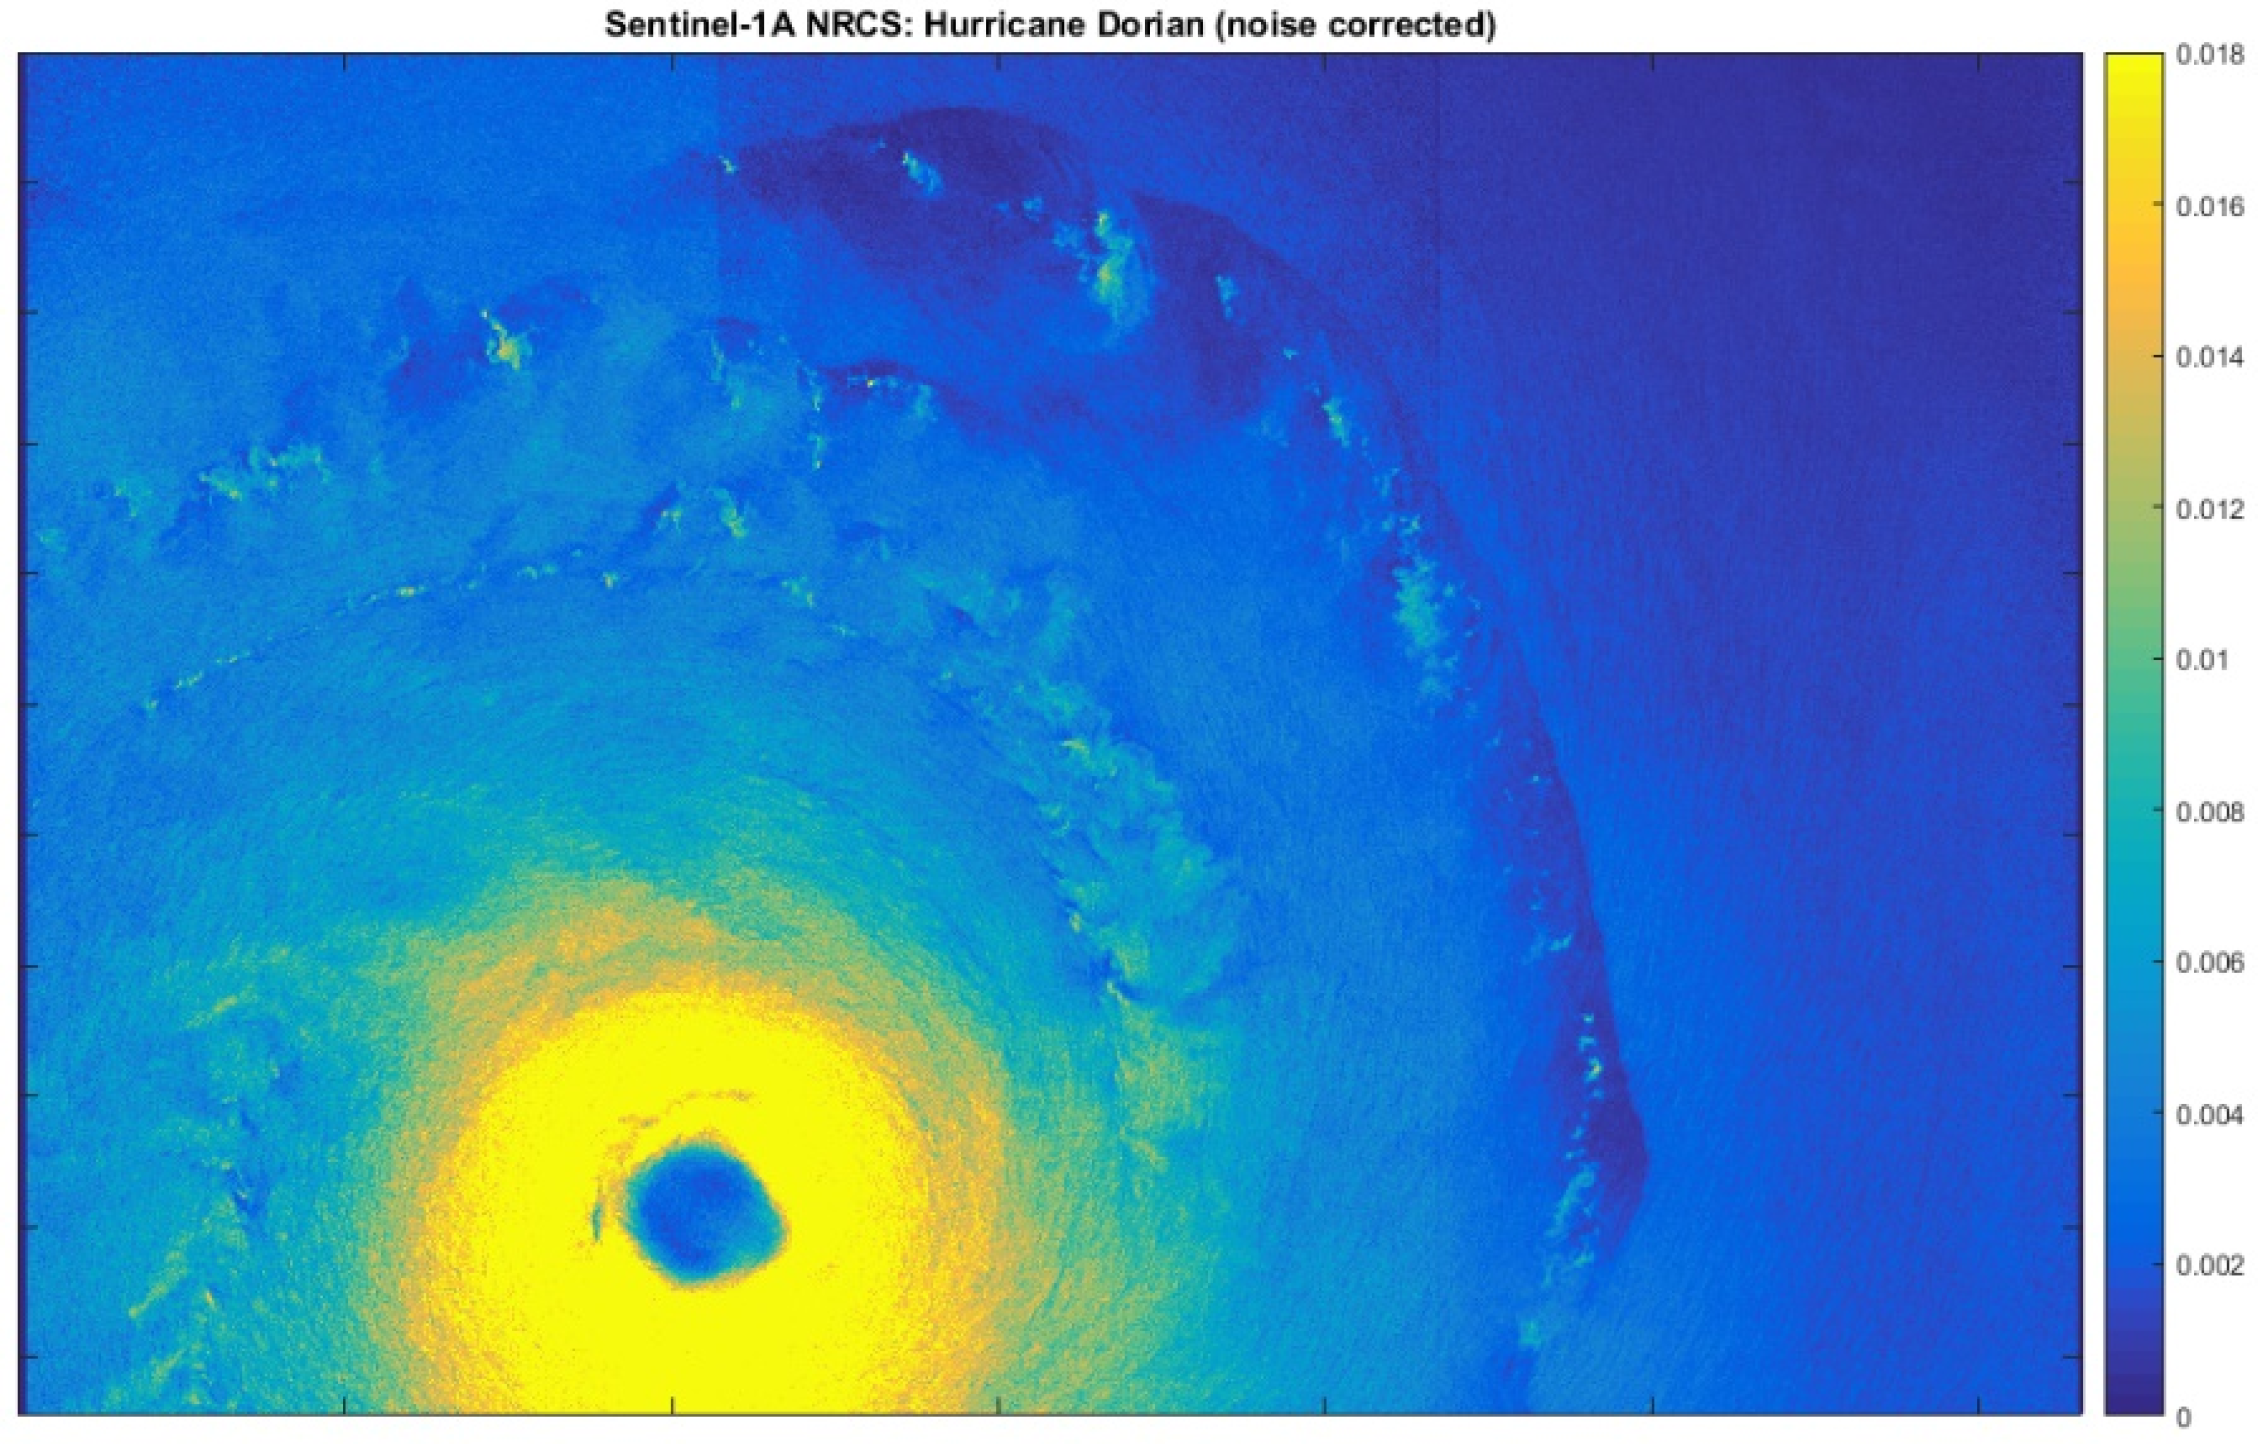
A sample result of the data de-noising operation over the cross-pol channel of a SAR image is shown in Figure 24 and Figure 25. The S-1A image was acquired in TopSAR IW mode on the 30 August 2019. It represents the Hurricane Dorian. The backscatter intensity in the SAR image is proportional to the wind speed. Due to the very high winds of the hurricane, the co-pol channel can be saturated, resulting in an under-estimation of the winds.
On the other hand, the cross-pol image, having a lower backscatter value, does not suffer from any saturation issues but, as can be observed in Figure 24, some discontinuity at the sub-swath boundaries is apparent due to the presence of thermal noise.
Figure 25 represents the same image after applying the de-noising operation to the data. Thanks to the well-calibrated noise vectors, the discontinuities between the sub-swaths have been almost completely removed.
A final note on the de-noising operation is related to data with very low values close to the noise floor. If the data level is exactly at the noise floor, i.e., there is no backscatter, half of the values after de-noising will be negative. By clipping these values to 0, the estimated radiometric values will have a slight positive bias depending on the number of pixels averaged. The bias will be even larger if the negative pixels are discarded instead of being clipped to 0. This issue disappears if a certain signal level is present.
To avoid radiometric biases for very low SNR areas, the best approach is keeping negative pixels after the de-noising and measuring the radiometric level of the data including the negative values. This way, the measured radiometric level will be unbiased. In case of data portions showing a negative level after de-noising, which could happen in the case of calibrating non-perfect noise vectors, such blocks should be discarded by the analysis since are very close to the noise floor level. More sophisticated methods to obtain an unbiased signal level after data de-noising have also been proposed in the literature [22,23,24,25].

4. Discussion

4.1. Retro-Calibration of Noise Vectors

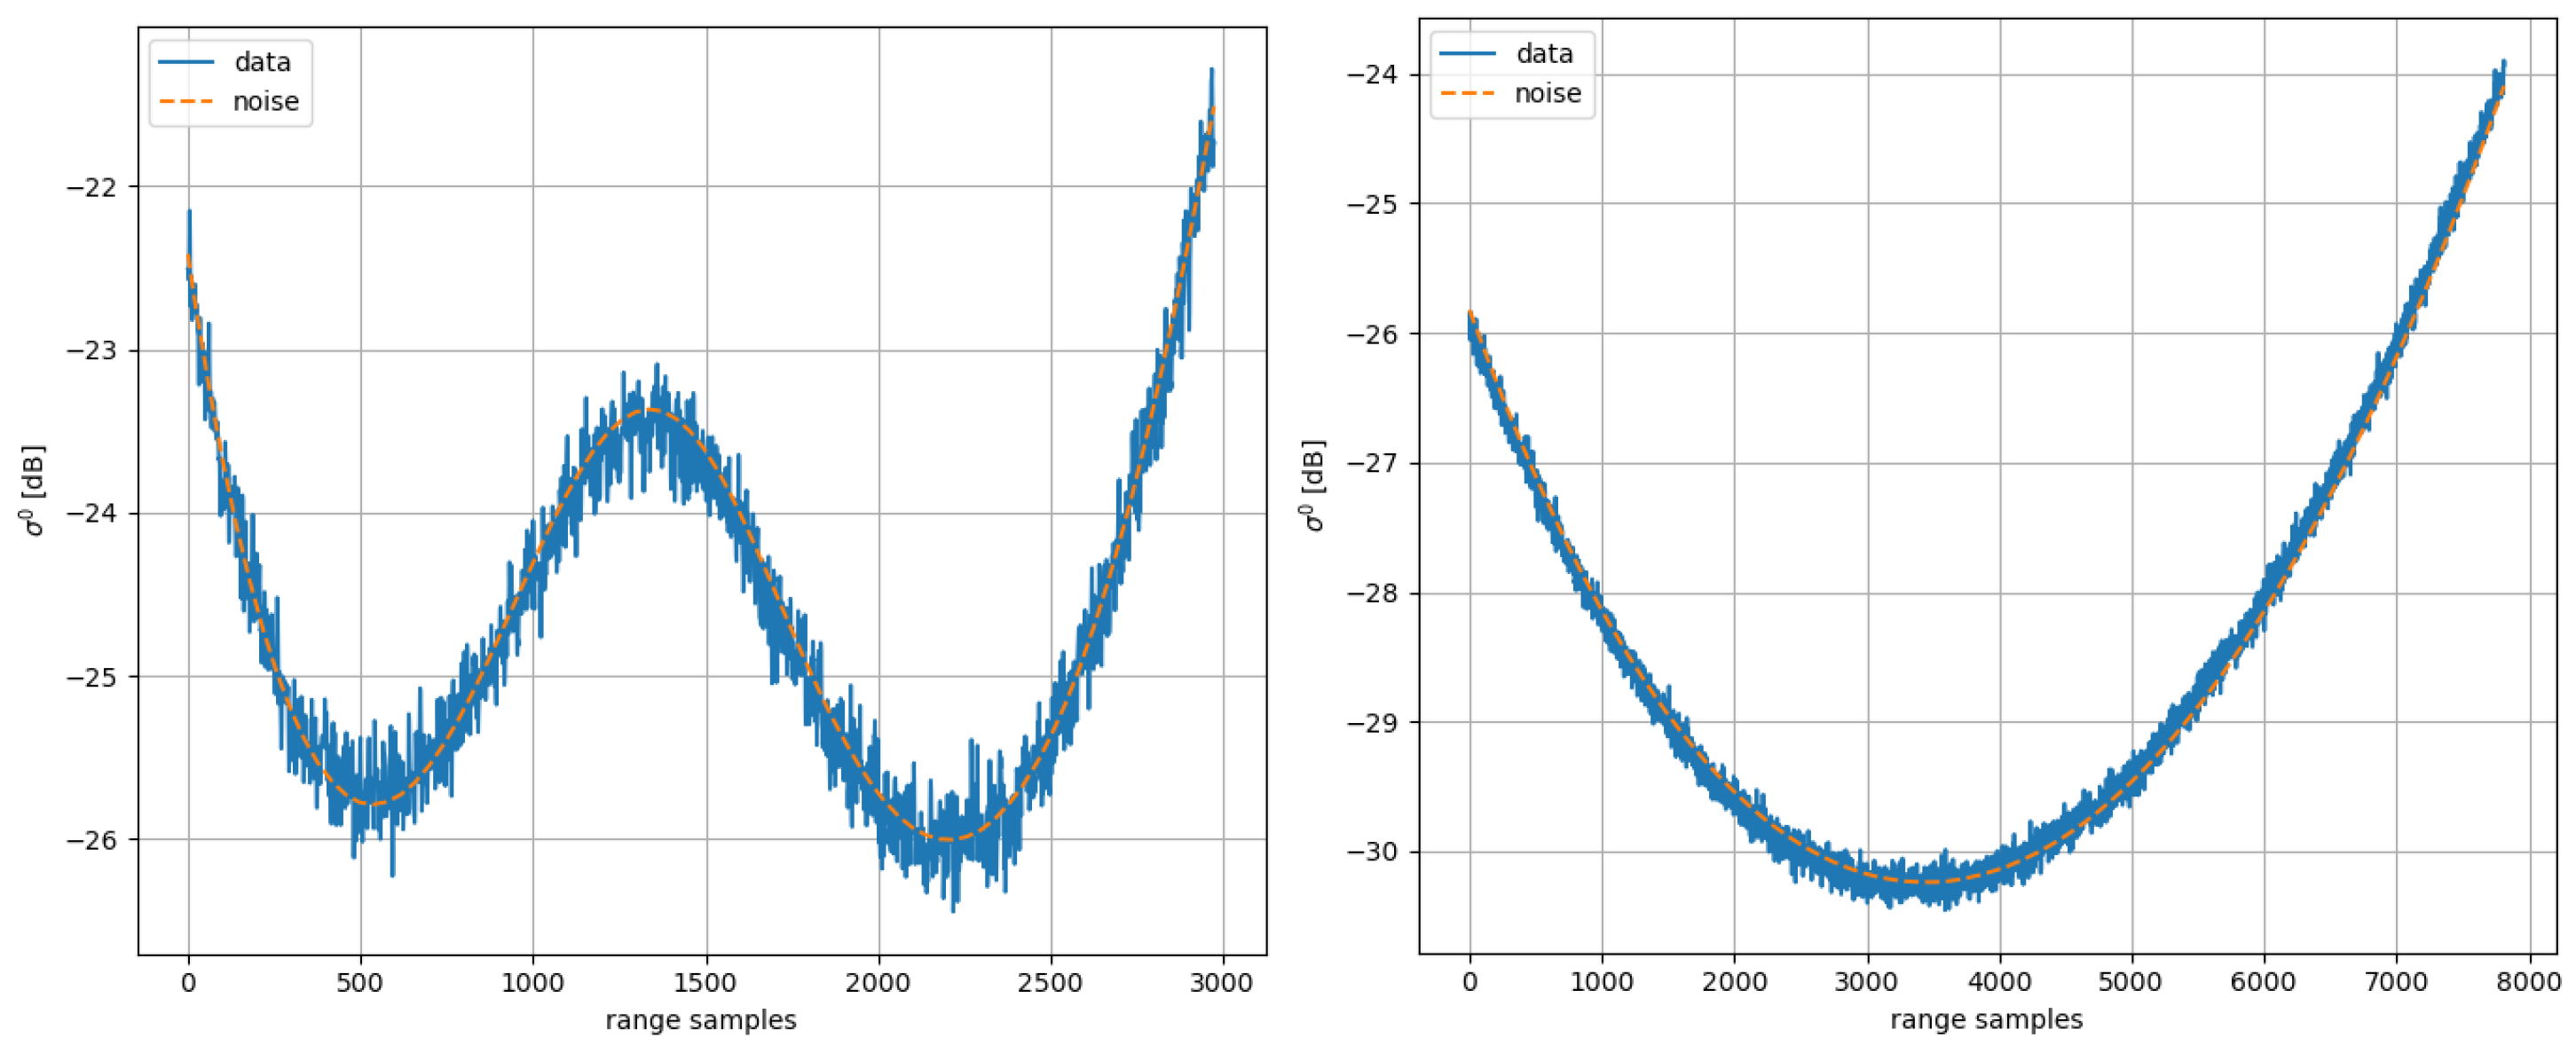
Following the recent update of the noise calibration constants for S1A and S1B, the noise vectors annotated in the products show good agreement with the data in the case of very-low-backscatter scenes. A couple of examples of this are reported in Figure 26.
S-1 data users can perform a retro-calibration of the noise vectors by applying the following correction to the noise vectors n o l d annotated in the products generated before the last AUX-CAL update:
n n e w = n o l d · 10 k n o i s e 10
where k n o i s e are the constant updates reported in Table 4 and Table 5. If the elevation-antenna-pattern retro-calibration [16] is also performed by the user, the shape of the noise vectors shall also be updated accordingly.
The retro-calibration proposed herein does not allow the user to fix the noise-vector issues that have been discussed in the previous sections and that have been fixed with the deployment of IPF versions 3.5.1, 3.6.1, and 3.7.1. An example of this is shown in Figure 27, for S-1B data. The top image shows that the retro-calibration allows us to correctly align the noise vector with the data, but that a residual misalignment between the vector and the data is still present. The misalignment issue, a bug in the operational processor, was fixed with deployment of IPF version 3.5.1. This is further confirmed with the bottom plot, showing the global results before (left) and after (right) the re-calibration. While the level has been correctly adjusted, a residual trend as a function of the incidence angle cannot be corrected through the simple retro-calibration approach.
The retro-calibration formula provided herein is valid till IPF 3.1.0 deployment. The accuracy for products generated using previous IPF versions will be further reduced due to the missing noise normalization feature discussed in Section 3.2.

4.2. Auxiliary Noise Tools for S-1 Data Users

The activities discussed in this paper have led, over the last 10 years, to several improvements in the quality of the noise vectors annotated in the S-1 L1 products. To make this possible for all the S-1 data users generating high-quality noise vectors for the whole S-1 product catalogue, two new tools are currently under development in the framework of SAR MPC:
  • A tool to generate the engineering products (L0N) that are needed to exploit ranked echoes for the de-noising of S-1A and S-1B products acquired before 2018.
  • A tool to generate accurate de-noising vectors, starting from L1 product annotations and exploiting the updated algorithms and the latest calibration results reported in this paper. This second tool would allow for overcoming the limitations of the retro-calibration approach proposed in Section 4.2.
The auxiliary noise tools will be made available to the public to support the ad hoc generation of noise vectors for archive products.

4.3. S-C/D Noise-Related Evolutions

The Sentinel-1C was successfully launched on 5 December 2024, while the D unit is expected to be launched before the end of 2025. Overall, the C and D units are quite similar to A and B units, with the main difference being:
  • A slight modification to the instrument design that allowed for a reduction in the number of internal calibration pulses from 5 to 3 (see Section 2.2.1 for more details).
  • The inclusion of an AIS receiver to enhance the ship detection capability of the mission. Please note that AIS functionality is independent from the SAR and does not have any impact on SAR data quality and on the thermal noise topic discussed in this paper.
The reduction in the number of calibration pulses allowed us to include new noise pulses in the timeline of TopSAR modes that, combined with the ranked echoes currently used for S-1A, will allow for even better tracking of the noise-power evolution within the data acquisition.
Additionally, new noise pulses were included in the Wave mode timeline before and after each acquired imagette. This will allow for a big improvement in the accuracy of the WV data de-noising vectors with respect to those generated for S-1A and B, which could only make use of the noise pulses in the pre- and post-amble of the acquisitions. This is very useful, since WV acquisitions can be very long, spanning from Pole to Pole over the Atlantic and Pacific Oceans.
The only acquisition mode that will not be improved is the Stripmap mode. Nevertheless, as Stripmap acquisitions are usually very short, the impact of the noise variations in Stripmap data is negligible.
Finally, it is worth noting that C and D units will benefit from all the noise-related activities performed for S1A and B and described in this paper. For this reason, the quality of the noise vectors is expected to be good from the beginning of the mission. As an example, the following image represents the comparison between the data and the noise vectors for two bursts (EW1 VH on the left and IW3 HV on the right) computed on products generated after S1C IOCR (May 2025). Quite good agreement is observed. The residual offset between the data and the noise vectors will be corrected in September 2025 with the circulation of an updated AUX-CAL file that will also improve the noise vectors for Stripmap and Wave data.

5. Conclusions

A complete overview of the de-noising-related activities performed since the launch of S-1A in 2014 has been provided in this paper.
In the Section 2, first, the effects of the thermal noise on the SAR data is described; then, the radiometric corrections applied during L1 processing, and that shapes the noise floor in the data, which are discussed. Finally, the usage of ranked echoes for the generation of the noise vectors and their re-calibration strategy is presented.
In the Section 3, the results of the re-calibration activities are presented along with the evolutions of the S-1 L1 IPF related to noise vectors. Finally, an example of the accurate de-noising operation performed on the cross-pol channel of an S-1 product acquired over Hurricane Dorian is reported.
In the Section 4, a quick method for the retro-calibration of noise vectors is proposed and its limitations are highlighted. Tools for the accurate retro-calibration of the noise vectors are currently under development in the framework of the SAR MPC activities. Finally, the noise-related evolutions in Sentinel-1C and D units are also discussed.

Author Contributions

A.R. is responsible for the instrument verification in the framework of the SAR MPC and provided the historical records for the 10 years of activities described herein. He took care of coordinating and organizing the paper contributions. L.F. and B.M. are responsible for the noise-vector calibration in the framework of the SAR MPC. R.P., M.S. and N.F. have contributed to and implemented the IPF evolutions. G.H. and P.V. coordinated the SAR MPC team and supported the noise-vector recalibration activities. N.M., M.P. and A.V. led the SAR MPC project and supported all the activities described herein. All authors have read and agreed to the published version of the manuscript.

Funding

The SAR Mission Performance Cluster (MPC) Service is financed by the European Union, through the Copernicus Programme implemented by ESA (ESA Contract No. 4000135998/21/I-BG). Views and opinion expressed are however those of the author(s) only and the European Commission and/or ESA cannot be held responsible for any use which may be made of the information contained therein.

Data Availability Statement

All the data used in this paper are freely available to the community and can be downloaded from the Copernicus Data Space Ecosystem (CDSE, https://dataspace.copernicus.eu/) after registration.

Acknowledgments

The authors wish to thank all the SAR MPC colleagues that contributed to the improvement of the S-1 de-noising vectors since the launch of S-1A in 2014. We would like to thank Peter Meadows from BAE for (among the others) actively monitoring the noise vectors and noise level during the first S-1 years.

Conflicts of Interest

The authors Andrea Recchia, Beatrice Mai, Laura Fioretti, Martin Steinisch, Riccardo Piantanida were employed by the company Aresys s.r.l. The author Niccolò Franceschi was employed by the company E-Geos an ASI/Telespazio company. The authors Guillaume Hajduch and Pauline Vincent were employed by the company CLS Group. The remaining author declares that the research was conducted in the absence of any commercial or financial relationships that could be construed as a potential conflict of interest.

Appendix A

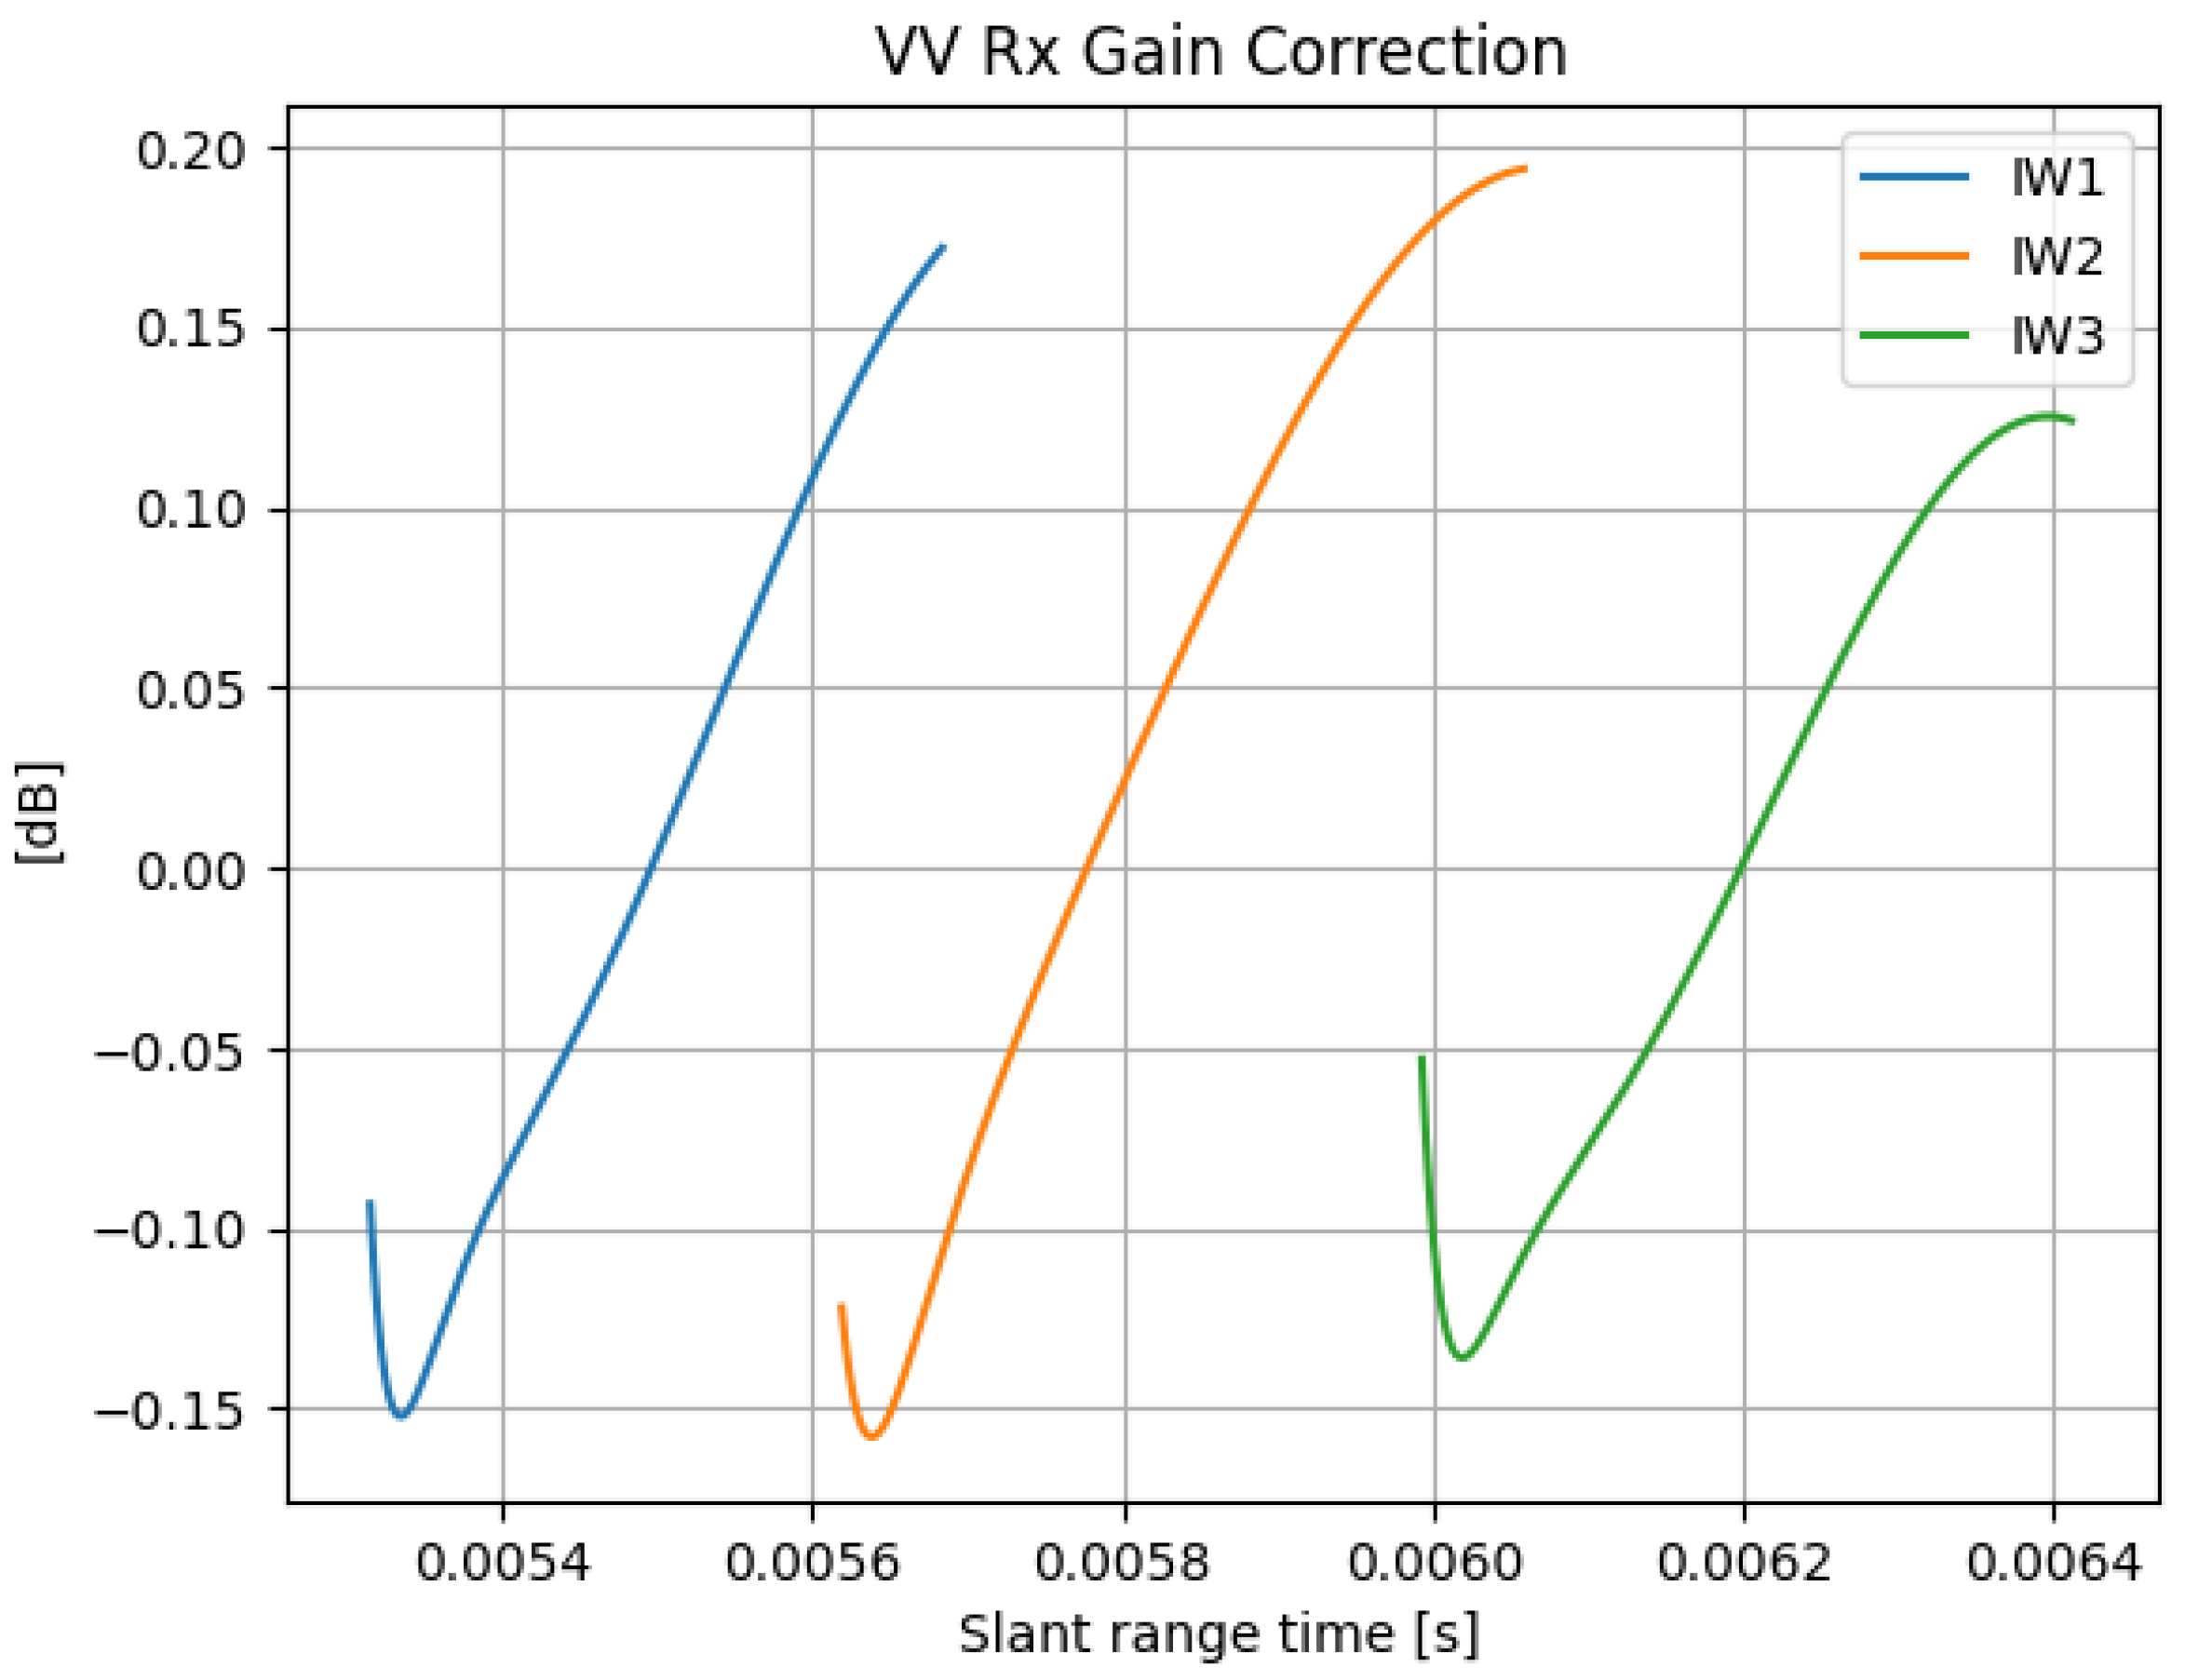
The Rx gain correction compensates for an instrument-induced gain variation that depends on the sub-swath and on the receiving polarization. The correction to be applied is estimated from dedicated noise-only acquisitions performed during the Commissioning Phase. The correction is made of two terms: a quick exponential drop G e x p and a slower gain increase modeled with a polynomial function G p o l y . The models for the corrections are reported in the following equations:
G R X d b = G e x p + G p o l y
G e x p d b = a e b t e x p sin d t e x p + φ + c
G p o l y d b = p 4 t p o l y 4 + p 3 t p o l y 3 + p 2 t p o l y 2 + p 1 t p o l y + p 0 q 2 t p o l y 2 + q 1 t p o l y + q 0
where t e x p is the elapsed time from the opening of the Rx window and t p o l y = t e x p + t is the time from the end of the Tx pulse and the opening of the Rx window (changing as a function of the orbit time).
The Rx gain correction does not change the absolute radiometric level of the data, since it is computed as a function with a unitary average value. An example of the Rx gain correction evaluated for an IW product (Rx pol V) is shown in Figure A1. The two components of the correction (fast exponential drop and slower gain increase) can be observed. Please note that the gain variation within the Rx window affects both the signal and the noise components. This means that after the correction in the processor, the noise level in the Rx window can be assumed to be flat.
Figure A1. Rx gain correction evaluated for the V-pol receiving IW sub-swaths.
Remotesensing 17 03474 g0a1

References

  1. Davidson, M.; Snoeij, P.; Attema, E.; Rommen, B.; Floury, N.; Levrini, G.; Duesmann, B. Sentinel-1 Mission Overview. In Proceedings of the 8th European Conference on Synthetic Aperture Radar (EUSAR), Aachen, Germany, 7–10 June 2010. [Google Scholar]
  2. Rostan, F.; Riegger, S.; Pitz, W.; Torre, A.; Torres, R. The C-SAR instrument for the GMES sentinel-1 mission. In Proceedings of the IEEE International Geoscience and Remote Sensing Symposium, Barcelona, Spain, 23–27 July 2007. [Google Scholar]
  3. De Zan, F.; Guarnieri, A.M. TOPSAR: Terrain Observation by Progressive Scans. IEEE Trans. Geosci. Remote Sens. 2006, 44, 2352–2360. [Google Scholar] [CrossRef]
  4. Miranda, N.; Rosich, B.; Putignano, C. The Sentinel-1 data processor and operational products. In Proceedings of the IEEE International Geoscience and Remote Sensing Symposium, Munich, Germany, 27 July 2012. [Google Scholar]
  5. Rosich, B.; Miranda, N.; Potin, P.; Putignano, C.; Sabella, G.; Geudtner, D. Sentinel-1 Ground Segment. In Proceedings of the IEEE International Geoscience and Remote Sensing Symposium, Munich, Germany, 22–27 July 2012. [Google Scholar]
  6. Hanssen, R.; Rocca, F. Sentinel 1: Interferometric applications. In Proceedings of the IEEE International Geoscience and Remote Sensing Symposium, Cape Town, South Africa, 12–17 July 2009. [Google Scholar]
  7. Schmullius, C.; Cartus, O.; Riedel, T.; Santoro, M.; Thiel, C.; Christian, T. Thiel Sentinel-1 Land Applications based on Multi-temporal Data Acquisitions. In Proceedings of the 7th European Conference on Synthetic Aperture Radar, Friedrichshafen, Germany, 2–5 June 2008. [Google Scholar]
  8. Loew, A.; Ludwig, R. Mauser Derivation of surface soil moisture from ENVISAT ASAR wide swath and image mode data in agricultural areas. IEEE Trans. Geosci. Remote. Sens. 2006, 44, 889–899. [Google Scholar] [CrossRef]
  9. Mouche, A.; Chapron, B.; Zhang, B. Husson Combined Co- and Cross-Polarized SAR Measurements Under Extreme Wind Conditions. IEEE Trans. Geosci. Remote. Sens. 2017, 55, 6746–6755. [Google Scholar] [CrossRef]
  10. Snoeij, P.; Geudtner, D.; Østergaard, A.; Navas-Traver, I.; Brown, M.; Rommen, B.; Bibby, D.; Torres, R.; Schwerdt, M.; Zink, M.; et al. Sentinel-1 in-orbit calibration plan. In Proceedings of the 9th European Radar Conference, Amsterdam, The Netherlands, 31 October–2 November 2012. [Google Scholar]
  11. S1-PL-ASD-PL-0001; Sentinel 1 SAR Instrument Calibration and Characterisation Plan. Astrium: Friedrichshafen, Germany, 2014.
  12. Schmidt, K.; Schwerdt, M.; Miranda, N.; Reimann, J. Radiometric Comparison within the Sentinel-1 SAR Constellation over a Wide Backscatter Range. Remote Sens. 2020, 12, 854. [Google Scholar] [CrossRef]
  13. MPC-0307; Sentinel-1 Level 1 Detailed Algorithm Definition. SAR Mission Performance Center (MPC): Brest, France, 2022.
  14. Guccione, P.; Belotti, M.; Giudici, D.; Guarnieri, A.M.; Navas-Traver, I. Sentinel-1A: Analysis of FDBAQ Performance on Real Data. IEEE Trans. Geosci. Remote. Sens. 2015, 53, 6804–6812. [Google Scholar] [CrossRef]
  15. Recchia, A.; Giudici, D.; Piantanida, R.; Miranda, N.; Guarnieri, A.M. Sentinel-1 Radiometric Accuracy Enhancement Exploiting Antenna Model Refinement Technique. In Proceedings of the IGARSS 2018—2018 IEEE International Geoscience and Remote Sensing Symposium, Valencia, Spain, 22–27 July 2018; pp. 6360–6363. [Google Scholar] [CrossRef]
  16. Schmidt, K.; Schwerdt, M.; Hajduch, G.; Vincent, P.; Recchia, A.; Pinheiro, M. Radiometric Re-Compensation of Sentinel-1 SAR Data Products for Artificial Biases due to Antenna Pattern Changes. Remote Sens. 2023, 15, 1377. [Google Scholar] [CrossRef]
  17. MPC-0677; Sentinel-1 Level-1 IPF Radiometric Corrections. SAR Mission Performance Center (MPC): Brest, France, 2024.
  18. MPC-0474; Sentinel-1 Level-0 Data Decoding Package. SAR Mission Performance Center (MPC): Brest, France, 2020.
  19. MPC-0392; Thermal Denoising of Products Generated by the S-1 IPF. SAR Mission Performance Center (MPC): Brest, France, 2017.
  20. SAR-MPC-0634; S-1 Annual Performance Report for 2023. SAR Mission Performance Center (MPC): Brest, France, 2024.
  21. Monti-Guarnieri, A.; Giudici, D.; Recchia, A. Identification of C-Band Radio Frequency Interferences from Sentinel-1 Data. Remote Sens. 2017, 9, 1183. [Google Scholar] [CrossRef]
  22. Korosov, A.; Demchev, D.; Miranda, N.; Franceschi, N.; Park, J.W. Thermal Denoising of Cross-Polarized Sentinel-1 Data in Interferometric and Extra Wide Swath Modes. IEEE Trans. Geosci. Remote. Sens. 2022, 60, 5218411. [Google Scholar] [CrossRef]
  23. Sun, Y.; Li, X.-M. Denoising Sentinel-1 Extra-Wide Mode Cross-Polarization Images Over Sea Ice. IEEE Trans. Geosci. Remote. Sens. 2021, 59, 2116–2131. [Google Scholar] [CrossRef]
  24. Lee, P.Q.; Xu, L.; Clausi, D.A. Sentinel-1 additive noise removal from cross-polarization extra-wide TOPSAR with dynamic least-squares. Remote. Sens. Environ. 2020, 248, 111982, ISSN 0034–4257. [Google Scholar] [CrossRef]
  25. Balss, U.; Breit, H.; Fritz, T. Noise-Related Radiometric Correction in the TerraSAR-X Multimode SAR Processor. IEEE Trans. Geosci. Remote. Sens. 2010, 48, 741–750. [Google Scholar] [CrossRef]
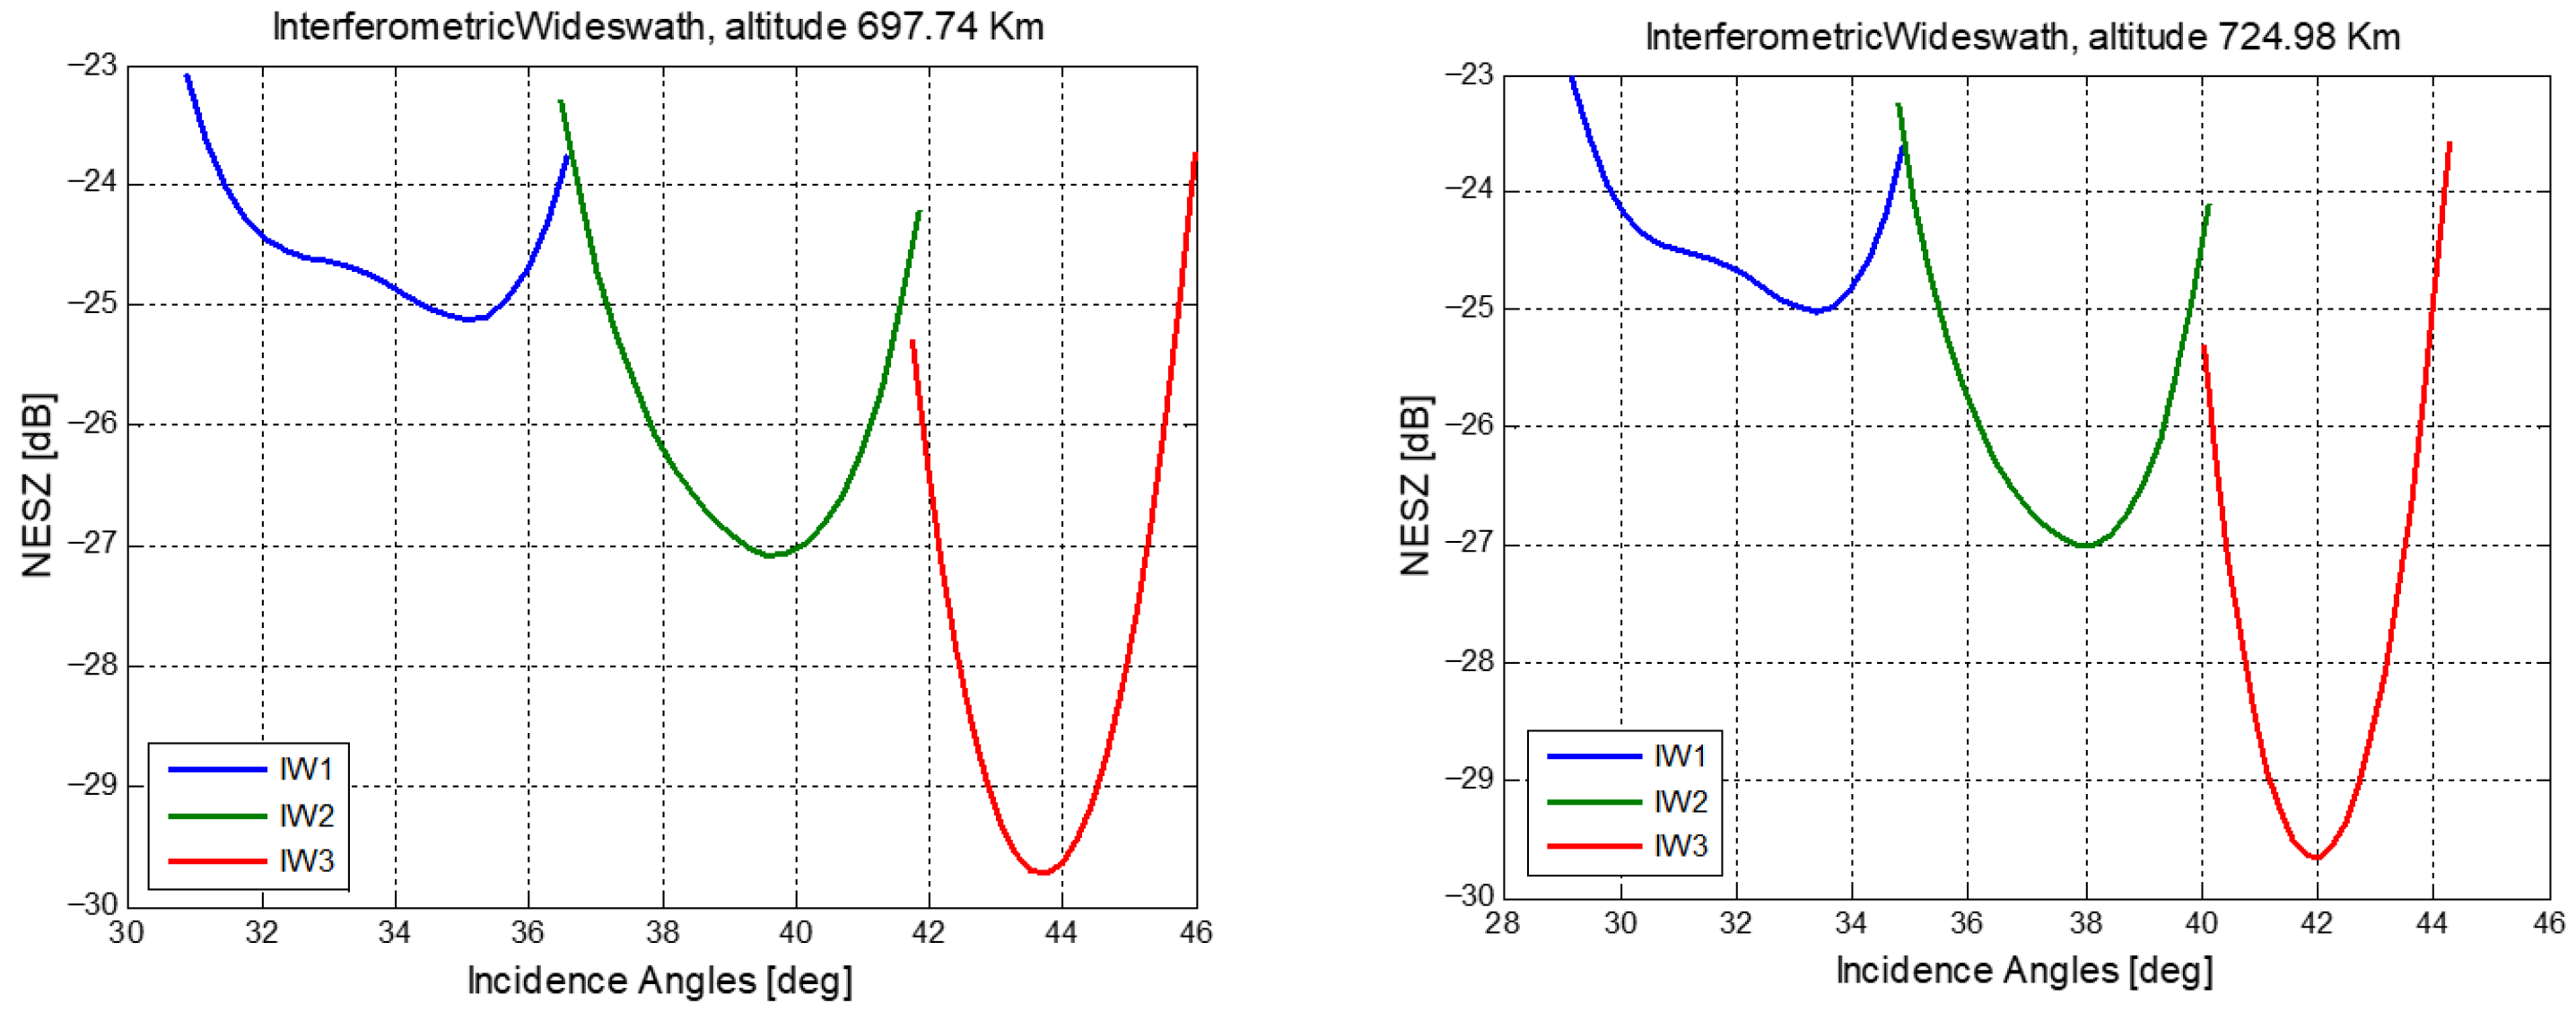
Figure 1. Sentinel-1 TopSAR Interferometric Wide Swath mode predicted NESZ at minimum (left) and maximum (right) satellite altitude.
Remotesensing 17 03474 g001
Figure 2. Radiometric bias introduced by the thermal noise as a function of the system Noise-Equivalent Sigma Nought (NESZ, vertical axis) and of the target Normalized Radar Cross-Section ( σ 0 , horizontal axis).
Remotesensing 17 03474 g002
Figure 3. Quick look of the cross-pol channel of an S-1A EW product acquired over low-backscatter sea areas. The effect of thermal noise can be observed as discontinuities at bursts and sub-swath edges that are not observed over land.
Remotesensing 17 03474 g003
Figure 4. Radiometric corrections applied in a standard SAR processing chain.
Remotesensing 17 03474 g004
Figure 5. Sample PG gain [dB] (left) and phase [rad] (right) correction for S-1A TopSAR IW dual-pol (VV and VH) long (more than 19 min) data take 6883A acquired on 7 May 2024. The blue dots represent the PG of the co-pol channel (VV) while the red dots those of the cross-pol channel (VH).
Remotesensing 17 03474 g005
Figure 7. Antenna-pattern gain as a function of the slant-range time for the three IW sub-swaths from an S1A product. The inverse of the reported patterns is applied to the data during the processing.
Remotesensing 17 03474 g007
Figure 8. Azimuth elementary antenna pattern used for the de-scalloping correction. Cold-colored patterns represent a subset of the azimuth antenna patterns for the TopSAR azimuth steering (the corresponding pattern index is shown in the color bar). The red dots represent the peak of each azimuth pattern. The black dashed line in the model is used to compensate the S-1 products.
Remotesensing 17 03474 g008
Figure 9. Spread-losses compensation for an S-1A TopSAR IW product.
Remotesensing 17 03474 g009
Figure 10. Effect of Doppler spectrum whitening and windowing on the signal (blue) and on the thermal noise (green). The two components undergo the same processing chain, but the final spectrum is quite different due to the original spectral shape. The effect is a change in the SNR level in the data, i.e., a different processing gain for signal and noise.
Remotesensing 17 03474 g010
Figure 11. Long-term evolution of noise power for S1A IW1, EW1, WV1 modes, from the start of the mission in April 2014 until today.
Remotesensing 17 03474 g011
Figure 12. S-1A noise-power map from IW1 VH ranked echoes.
Remotesensing 17 03474 g012
Figure 13. TopSAR IW GRD product quick look. (Left) Product de-noised considering only pre- and post-amble noise pulses. (Right) Product de-noised considering ranked echoes. The red and blue dashed lines represent the location of the range profiles shown in Figure 14. The white arrows represent the azimuth and range directions.
Remotesensing 17 03474 g013
Figure 14. Range profiles from the IW GRD products shown Figure 13. (Left) Product de-noised considering only pre- and post-amble noise pulses. (Right) Product de-noised considering ranked echoes.
Remotesensing 17 03474 g014
Figure 15. Equalized range spectrum of an EW1 VH burst. The red part represents the spectral portion within the chirp bandwidth. The blue part represents the spectral portion outside the chirp bandwidth.
Remotesensing 17 03474 g015
Figure 16. Global result of de-nosing vector recalibration. (Left) Original noise vectors vs. data difference. (Right) Updated noise vectors vs. data difference for the analyzed EW1 VH bursts. All the bursts have been cumulated over a common incidence angle axis. The colors in the plot represent the density of points (yellow: high density; green: medium density; blue: low density).
Remotesensing 17 03474 g016
Figure 17. (Blue) Data profile measured over S1 EW1 sub-swath for a product acquired over calm water. (Yellow) Original de-noising vector annotated in the product. (Red) De-noising vector after re-calibration.
Remotesensing 17 03474 g017
Figure 18. (Left) Signal masking performed over an S-1A WV imagette. (Right) Comparison of the data distribution (blue) with a theoretical distribution (orange) centered at the same peak value and with the expected standard deviation (based on the number of pixels in the multi-looking window). The red boxes in the image on the left represent the near, mid and fare range regions whose statistics are reported in the right plots.
Remotesensing 17 03474 g018
Figure 19. Original radiometric data profile (blue) of the S1A WV imagette reported in Figure 18. Data profile after processing, i.e., outlier exclusion + multi-looking (orange). Statistical estimation of NESZ (green) where the profile is obtained as the distribution peak value in azimuth for each range sample. The red dashed line is the IPF noise vector read from the annotation file for the selected imagette.
Remotesensing 17 03474 g019
Figure 20. (Left) Data level and noise vectors for different GRD products (high resolution, medium resolution, and internal for L2 products) generated with IPF version 3.0.0. (Right) De-noised data levels for different GRD products generated with IPF version 3.0.0.
Remotesensing 17 03474 g020
Figure 21. (Left) Data levels and noise vectors for different GRD products (high resolution, medium resolution, and internal for L2 products) generated with IPF version 3.1.0. (Right) De-noised data levels for different GRD products generated with IPF version 3.1.0.
Remotesensing 17 03474 g021
Figure 22. (Left) Data levels (blue) and noise vectors (orange) for a GRD product processed with IPF 3.7.0 with non-optimized calibration constants. (Right) De-noised data.
Remotesensing 17 03474 g022
Figure 23. (Left) Data levels (blue) and noise vectors (orange) for a GRD product processed with IPF 3.7.0 with optimized calibration constants. (Right) De-noised data.
Remotesensing 17 03474 g023
Figure 24. Normalized Radar Cross-Section of the cross-pol channel (VH polarization) of the S1A IW DV image acquired on the 30 August 2019 (22:46:38 UTC) over Hurricane Dorian.
Remotesensing 17 03474 g024
Figure 25. Normalized Radar Cross-Section of the cross-pol channel (VH polarization) of the S1A IW DV image acquired on the 30 August 2019 (22:46:38 UTC) over Hurricane Dorian. The thermal noise level annotated in the L1 product has been removed.
Remotesensing 17 03474 g025
Figure 26. Comparison of noise vector (orange) and data (blue) on selected examples for S1A EW1 VH (left) and S1A IW3 HV (right) GRD bursts with low in–out-band power ratio.
Remotesensing 17 03474 g026
Figure 27. (Top) A comparison of noise vectors (yellow line) and data (blue) on a selected example for S1B EW2 HV GRD burst with low in–out-band power ratio. The red line is the recalibrated noise vector. (Bottom) Global result of de-nosing vector recalibration for S1B EW2 HV. All the bursts have been cumulated over a common incidence angle axis. The colors in the plot represent the density of points (yellow: high density; green: medium density; blue: low density). The red line represents the expected level.
Remotesensing 17 03474 g027
Table 1. Processing gain (from S1A AUX-PP1) and pulse length for the different TopSAR sub-swaths.
Sub-SwathPol.Proc. Gain [dB]Pulse Length
[μs]
Pulse Length
[dB]
Total Gain [dB]
IW1VV120.0152.410.00120.01
IW2VV119.6362.000.73 120.36
IW3VV119.7353.390.08119.81
EW1HH121.5830.34−2.37119.21
EW2HH122.9525.78−3.07119.88
EW3HH122.4230.34−2.37120.05
EW4HH122.9726.34−2.98119.99
EW5HH121.9430.66−2.32119.62
Table 2. Calibration constant values for S-1 units.
UnitCalibration Constant
S-1A1.0
S-1B1.393
S-1C0.899
S-1DTo be determined during the S1D Commissioning Phase
Table 3. List of S1 L1 IPF evolutions related to noise vectors.
IPF VersionStart Operation DateUpdates
2.8.228 March 2017Radiometric normalization of the TOPS processor.
2.9.013 March 2018Radiometric normalization of the Stripmap and Wave processor.
Update for noise-vector annotations to include azimuth antenna element patterns.
2.9.126 June 2018Activation of the ranked-echo usage for noise-power estimation.
3.1.026 June 2019Consistent noise-level annotation for all the L1 products (SLC, GRDM, GRDH, GR2).
3.3.130 June 2020Fixed a failure in the NRT Slicing mode on EW products when pre-amble and/or post-amble are missing in L0N products.
3.4.04 November 2021Discarded last EW ranked echo from noise-power estimation as it may be contaminated by nadir returns.
Introduction of the in–out-band power ratio annotation.
3.5.123 March 2022Correction of the misalignment between the elevation antenna pattern and the annotated thermal noise vector.
3.6.130 March 2023Introduction of annotation in the manifest of L0 A/C/N products used during the processing.
Avoid missing data in range de-noising vectors for TOPS GRD products on long data takes.
3.7.119 October 2023Improvement of noise-vector quality when noise pulses are affected by RFI contamination.
Fixing of a bug in the indexing of noise vectors in TOPS/SLC products.
Table 4. List of S1A noise calibration constant updates.
ModeSub-SwathRx PolarizationNoise Calibration Constant Update [dB]
IWIW1V0.095
IW2−0.026
IW30.323
IW1H0.107
IW20.003
IW30.208
EWEW1V0.035
EW2−0.131
EW3−0.038
EW40.161
EW50.035
EW1H−0.469
EW2−0.707
EW3−0.730
EW4−0.393
EW5−0.421
Table 5. List of S1B noise calibration constant updates.
ModeSub-SwathRx PolarizationNoise Calibration Constant Update [dB]
IWIW1V−0.178
IW2−0.352
IW3−0.071
IW1H−0.040
IW2−0.024
IW30.133
EWEW1V−0.321
EW2−0.677
EW3−0.554
EW4−0.344
EW5−0.425
EW1H-
EW2-
EW3-
EW4-
EW5-
Disclaimer/Publisher’s Note: The statements, opinions and data contained in all publications are solely those of the individual author(s) and contributor(s) and not of MDPI and/or the editor(s). MDPI and/or the editor(s) disclaim responsibility for any injury to people or property resulting from any ideas, methods, instructions or products referred to in the content.