Article

Integration of UAV and Remote Sensing Data for Early Diagnosis and Severity Mapping of Diseases in Maize Crop Through Deep Learning and Reinforcement Learning

1
Department of Computer Engineering, San Jose State University, 1 Washington Square, San Jose, CA 95192, USA
2
Department of Applied Data Science, San Jose State University, 1 Washington Square, San Jose, CA 95192, USA
*
Author to whom correspondence should be addressed.
Remote Sens. 2025, 17(20), 3427; https://doi.org/10.3390/rs17203427 (registering DOI)
Submission received: 6 August 2025 / Revised: 4 October 2025 / Accepted: 11 October 2025 / Published: 13 October 2025

Abstract

Highlights

What are the main findings?
  • A framework combining UAV, satellite, and weather data to detect crop diseases.
  • Ensemble deep learning and reinforcement learning improve classification and severity mapping.
What is the implication of the main finding?
  • Enables near real-time, scalable crop disease management to reduce yield losses.
  • Early detection and hotspot mapping optimize water and pesticide use for sustainability.

Abstract

Accurate and timely prediction of diseases in water-intensive crops is critical for sustainable agriculture and food security. AI-based crop disease management tools are essential for an optimized approach, as they offer significant potential for enhancing yield and sustainability. This study centers on maize, training deep learning models on UAV imagery and satellite remote-sensing data to detect and predict disease. The performance of multiple convolutional neural networks, such as ResNet-50, DenseNet-121, etc., is evaluated by their ability to classify maize diseases such as Northern Leaf Blight, Gray Leaf Spot, Common Rust, and Blight using UAV drone data. Remotely sensed MODIS satellite data was used to generate spatial severity maps over a uniform grid by implementing time-series modeling. Furthermore, reinforcement learning techniques were used to identify hotspots and prioritize the next locations for inspection by analyzing spatial and temporal patterns, identifying critical factors that affect disease progression, and enabling better decision-making. The integrated pipeline automates data ingestion and delivers farm-level condition views without manual uploads. The combination of multiple remotely sensed data sources leads to an efficient and scalable solution for early disease detection.

1. Introduction

Crop health is central to ensure global food security and economic stability. Crop diseases that specifically affect water-intensive crops such as maize and wheat represent significant challenges to the productivity of agriculture. These diseases can lead to large yield losses and economic impacts. For example, diseases like Northern Leaf Blight (NLB), which can be caused by fungal pathogen Setosphaeria, have inflicted significant losses on maize production in regions like the United States and Ontario, with estimates reaching up to 14 million metric tons in 2015, resulting in an economic loss of USD 1.9 billion [1].Other diseases, such as Gray Leaf Spot, Fusarium Stalk Rot, and Tar Spot, also contribute to the yield losses, further exacerbating the economic burden [2,3,4,5]. Recent estimates suggest that annual yield losses caused by corn diseases range from 7.5% to 13.5% of grain production, causing a loss of billions of dollars in revenue [6], causing severe issues in multiple states in the USA. A minimal annual yield loss of 2% translates into severe economic losses, contributing heavily to global food security and resource conservation. These recurring losses underscore the urgent need for advanced, technology-driven approaches to disease detection and management.
Traditional methods of disease detection typically involve manual crop inspection that are labor intensive, time consuming, and susceptible to human error; such limitations highlight the urgent need for automated and innovative solutions. AI-powered solutions have become essential since the global precision agriculture market is expected to expand at a compound annual growth rate (CAGR) of 12% by 2030 [2]; they hold the potential to transform agricultural disease management. Adoption of technology such as predictive analytics and drone-based photography can save water waste, increase agricultural yields, and significantly help to reduce the need for chemical input. There are notable gaps in existing research, particularly in the integration of hybrid models, reinforcement learning, and multi-source data fusion for real-time crop disease prediction. To address these challenges in agriculture and gaps in the research, this paper focuses on building an automated pipeline solution that offers real-time prediction for crop diseases by using multiple remotely sensed data sources. The combination of these data sources along with powerful deep learning models contributes to an effective and accurate solution. Convolutional neural networks (CNNs) are utilized for classifying the diseases from the UAV images, and sequential models are used to classify diseases for remote sensing data and also generating spatial severity maps to identify hotspots, which is useful for farmers to allocate water and pesticides efficiently. In order to improve the prediction accuracy, a meta-learner ensemble model is used to synthesize the output of these individual models, creating a robust system with high accuracy.
We utilize reinforcement learning to enhance disease prediction using fusion of vegetation indices, weather factors, and geography. Salient features are captured by a CNN with an adaptive, feedback-driven decision support, improving robustness over static classifiers. By continuously learning from outcomes, the RL component enables adaptive decision-making that improves model robustness in real-world deployments.
Strength lies in the integration of several data sources, i.e., UAV imagery, satellite remote sensing, and weather data, to provide a unified image of crop health and disease progression. This integrated image enables early detection and severity mapping, and actionable intelligence for farm-level management. The central research question in this work is if fusion of data from multiple sources (satellite, UAV, and weather) with hybrid reinforcement learning and deep learning can be used to improve precision and flexibility in forecasting crop diseases. For this purpose, our aim is to develop and validate a scalable pipeline that provides real-time classification, severity mapping, and actionable recommendations for sustainable disease management. Unlike existing work, our method integrates multi-source information and reinforcement learning to enable real-time adaptive disease prediction and decision-making. Experimental results demonstrate superior performance, with UAV image classification having more than 92% accuracy and ensemble models achieving improved robustness across heterogeneous inputs. Overall, these developments establish the technical merit and practical relevance of the proposed system to precision agriculture. The deliverables provide detailed information about crop disease management, helping farmers and agricultural researchers mitigate losses and improve productivity to make informed decisions about sustainable agricultural health and efficiency.
This paper is arranged as follows: Section 2 summarizes existing research for the prediction of diseases in crops along with the technological products available to address the issue and the research gaps; Section 3.1 outlines the collection, pre-processing, and validation performed on various datasets to prepare them for training and testing; Section 3.3 delves into the deep learning techniques used for the prediction, classification, and severity mapping of crop disease along with a comparison of performance for all models; Section 5 provides a comprehensive view on the behavior of the system and the justification of the results, while Section 5 suggests potential ideas that can be explored to further optimize this area of research; and Section 6 concludes the paper by giving an outline of the study and its contributions to the area of disease prediction for water-intensive crops.

2. Related Work

2.1. Literature Review

Diseases affecting water-intensive crops heavily affect resource utilization as well as food security. Ref. [7] emphasized the importance of early detection of diseases like Northern Leaf Blight and Common Rust, which can cause substantial yield reduction in crops such as maize. Advanced monitoring methods are encouraged in order to avoid production reductions associated with diseases in crops [8]. The need for timely detection and mitigation of vulnerabilities is further highlighted by [9] by establishing the critical relationship between late discovery and rapid progression of disease. The studies analyzed in this section have mainly been selected on the basis of their effectiveness of crop disease detection and classification by evaluating various relevant data sources. The data in Table 1 and Table 2 covers field studies on crop diseases in maize and other cereal crops where the methods are transferable for our use case. Most of these studies have been performed on UAV and remote sensing data which form the foundation of our approach.
  • Relevant Works Based on UAV Drone Data (Table 1)
The authors in [10] have emphasized the importance of using machine learning models (ResNet, LSTM for model convergence along with SVM and PCA for image classification) fused with multi-modal data to harvest an exceptional performance and continuous disease monitoring. The study utilizes remote sensing data and weather indices to monitor diseases in corn crops, and the approach achieved a very high accuracy of 95% [11]. This paper mainly focuses on combining drone imagery with deep learning techniques like CNN to analyze images of leaves of rice plants. The paper presents a transformative approach towards disease detection by utilizing GPS to map the position of infected plants. A study, [12], has been conducted to detect plant diseases leveraging Unmanned Aerial Vehicles (UAVs) and deep learning where performance of several ML algorithms like Random Forest (RF), Naive Bayes, decision trees, and convolutional neural networks (CNNs) have been compared. The results highlighted the performance of CNN (89.45%), which was the highest, while decision tree had the lowest accuracy. This leads to the suggestion that CNNs are a powerful tool for UAV-based disease detection for crops in South Asia. To further solidify this suggestion, we can refer to studies by Prasad, Mehta, Horak, and Bae [13], who explored a combination of Generative Adversarial Networks (GANs) and UAVs to detect apple leaf diseases. The performance of three deep learning models—DCGAN, standard GAN, and CNN—were evaluated using drone imagery, with CNN achieving the highest accuracy, thus proving that it is a very promising and effective approach. According to [14], the classification of the health of rice crops is performed using drone images. ResNet50 (94%) demonstrated the highest accuracy, followed by YOLOv4 (90.28%) and DenseNet-121 (78.69%). Shill and Rahman [15] used YOLOv4 and YOLOv3 to classify plant health in sugarcane using UAV-captured images. The study found that YOLOv4 significantly outperformed others, with an accuracy of 92%, and it was recommended by the authors for real-time monitoring.
The authors of [2] utilized machine learning models, including support vector regression (SVR), Random Forest (RF), decision trees (DT), and Naive Bayes (NB), to model a complex relationship between environmental factors and crop yields, particularly for water-intensive staple crops like potato and maize. Out of these, Random Forest and SVR gave the most promising results. Although we review methods across crops for transferability, our empirical study and primary scope are maize foliar diseases.
Table 1. Comparison of relevant works based on UAV drone data.
ReferenceRegionPurposeModels UsedAccuracyInput Parameters
[7]Iowa, USAQuantitative phenotyping of maize diseaseYOLOv3, CNN, ResNet-5090%, 85%, 93%UAV images, field metrics
[10]Tamil Nadu, IndiaCorn crop disease using multisensor fusionSensor Fusion, EfficientNetB072%, 94%Multispectral UAV images
[11]JapanRice disease detection and mapping using dronesANN, CNN, SVM88.63%, 75.2%, 63.52%Rice leaf images
[12]South AsiaCrop disease detection using UAV and DLDT, RF, Naive Bayes, CNN64%, 71%, 86.32%, 89.45%Potato plant diseases
[13]GermanyCrop disease detection using GAN and UAVDCGAN, GAN, CNN92%, 76.65%, 53.01%Apple leaf diseases
[16]California, USASoybean disease detection using UAVEfficientNetB0, Mask R-CNN89%, 86%NDVI + RGB data
[17]SpainWheat disease detectionMobileNet, VGG-1688%, 95.23%High-res UAV images
[14]Andhra Pradesh, IndiaRice crop disease classificationYOLOv4, DenseNet-121, ResNet-5090.23%, 78.69%, 94%UAV imagery
[15]BangladeshSugarcane disease classificationDenseNet121, YOLOv3, SSD92%, 64.15%, 84%UAV drone images
[18]Beijing, ChinaCucumber disease classification (4 types)DCNN, RF, SVM, AlexNet93.4%Cucumber symptom images
B.
Relevant Works Based on Remote Sensing and Weather Data (Table 2)
Refs. [2,7,19] focus on yield prediction, while Refs. [3,8,10] propose methods for crop disease detection and monitoring. Studies such as [4,20] developed systems for severity estimation and distribution using sequential data. Ref. [7] leverages machine learning models like YOLOv3, CNN, and ResNet50 to detect and assess the quantity of Northern Leaf Blight in maize, which is a water-intensive crop, using UAV imagery and models like 3D-CNN and Bi-LSTM to assess hyperspectral imagery. Out of these, ResNet50 achieved 93% accuracy, which establishes its capacity for practical applications in precision agriculture. To detect disease using vegetation indices like NDVI and sequential images, models like 3D-CNN and Bi-LSTM resulted in an accuracy of 71.11% and 85.69%, respectively. The authors in [19] processed the photos using convolutional neural networks to identify insect infestation and disease using historical weather, soil, and crop data. The accuracy of the model illustrates how deep learning may be used to analyze large volumes of satellite imagery and remote sensing data for real-time monitoring, resulting in a very effective detection. The authors in [8] used models like DenseNet-201 to analyze remote sensing data with average accuracy of 89%. Although prior work by John et al. [21] works on improving carbon monitoring in agriculture using remote sensing data and machine learning, it is primarily focused on greenhouse flux estimation and analysis of agricultural carbon dynamics. In the study [3], the authors detect the yield in barley crops using weather data such as temperature and humidity, which is analyzed using Gradient Boosting with an accuracy of 86%. Further, spectral data and vegetation indices are evaluated using LSTM with an accuracy of 88.96%. Ref. [22] used hyperspectral imaging sensors to identify plant stress in agriculture; convolutional neural networks (CNNs) were used for diagnosis, along with object detection and segmentation. However, this method’s accuracy was limited to approximately 75%, and resizing image inputs for pre-trained networks provided minimal improvement.
Table 2. Comparison of relevant works based on remote sensing satellite data and weather data.
ReferenceRegionPurposeModels UsedAccuracyInput Parameters
[7]USAUAV + hyperspectral maize phenotyping3D-CNN, Bi-LSTM71.11%, 85.69%NDVI + sequential UAV data
[2]RwandaYield prediction for beans cropNaive Bayes, SVR85.23%, 87.88%Time-series rainfall, soil quality
[19]PolandPredict crop yields based on historical weather, soil, and crop dataCNN, SGB model, EWOISN-FE, R modelHigh Degree of AccuracyData from weather stations, soil sensors, drones, and satellites
[8]Cairo, EgyptPaddy disease detection using thermal imageryDenseNet-201, MobileNet, Inception, DenseNet-201 + DWT, MobileNet + DWT, Inception + DWTQ-SVM: 89%, 88.4%, 87.1%, 90.4%, 89.5%, 87.6%; C-SVM: 89%, 87.6%, 87.3%, 89%, 89.2%, 87.9%Thermal + Remote sensing
[3]NetherlandsBarley yield detectionGradient Boosting, LSTM86%, 88.96%Weather + Vegetation indices
[10]Tamil Nadu, IndiaCorn disease monitoringCNN-RNN, LSTM, Hybrid89%, 91.25%, 62.02%Remote sensing + Weather data
[4]ChinaDisease severity detectionSVR, Random Forest92.13%, 85%Vegetation indices
[20]ChinaSugarcane disease severity distributionXGBoost, Bi-LSTM91%, 96.33%Time-series spectral data
Most of these studies achieve high accuracy for specific scenarios by highlighting the promise of deep learning in plant disease detection, but they do not provide much information on hybrid models that integrate multiple sources of data, such as drone imagery with remote sensing sources. In addition, the implementation of reinforcement learning along with these models remains underexplored. To address such gaps, our study proposes a deep learning framework that incorporates both UAV-based imagery and remote sensing data with vegetation indices along with a focus on critical water-intensive crops such as maize. The ensemble and RL-based approach in our study aims to address both detection and severity while enhancing spatial reasoning, which is underexplored.

2.2. Review of Current Technology and Solutions for Crop Disease Detection

Table 3 represents an overall summary of the models used in this study after analyzing previous studies in this domain; these models have been selected on the basis of their ability to handle the data modalities used in this work, as well as their complementary strengths for the detection and classification of diseases for these types of data. Improved VGG-16, ResNet-50, DenseNet-121, and EfficientNet-B0 have been extensively utilized in our project to perform tasks like detecting and classifying images that are captured from UAV drone and remote sensing satellite, and these models utilize their deep convolutional architectures to deliver high accuracy and detailed feature extraction. Besides this, LSTM and Bi-LSTM are used to predict trends in the disease progression over time by analyzing time-series data like weather patterns and vegetation indices. SVR is used to monitor and detect the disease severity levels, which is specifically used to analyze the non-linear relationships that are present in remote sensing satellite data.
Table 4 summarizes various crop disease detection mobile applications and compares their features, as reported by vendor documentation at the time of writing. Listed products were selected on basis of their ability to detect and classify crop diseases by utilizing AI to identify issues in various data sources. These applications work on identifying diseases through user-captured images, that are taken with smartphones or tablets in the field; some also support remotely collected data sources. Additionally, some of the applications offer disease risk forecasting, which could be a helpful tool for preventative measures. Agrio provides subscription-based pricing, recommended treatment, and preventative measures, which provides a potentially more comprehensive service; also, this makes it stand out among other products. These products can be beneficial for large scale deployment as they offer drone, weather, and remote sensing data integration.

3. Materials and Methods

Machine learning models are utilized in this study for detection and classification of diseases in water-intensive crops like maize. By leveraging different types of data such as imagery, weather information, and remote sensing images, the machine learning models can predict results with better accuracy than traditional methods, as they can be inaccurate. This process is very important for modern agriculture, as we need an automated process of detection and classification of crop diseases.

3.1. Data Engineering

3.1.1. Data Selection and Processing

Maize was chosen as a primary crop for this study because of its high water requirement and economic importance. The study was carried out in agriculturally intensive regions with suitable UAV flight conditions. The raw data has been taken from trusted data sources for optimal results of the model’s accuracy. Four aspects were considered while selecting data and building the data processing pipeline (Figure 1):
  • UAV-Based Crop Disease Detection and Classification: This component involved the acquisition of high-resolution aerial images via Unmanned Aerial Vehicles (UAVs). Each image was accompanied by metadata such as geolocation, timestamp, and labeled disease annotations.
  • Remote Sensing Data: Satellite-derived remote sensing data was collected, which enabled the extraction of vegetation indices such as NDVI, EVI, and NDRE, which serve as indirect indicators of plant health.
  • IoT-Based Weather Data Analysis:Environmental parameters were obtained using Internet of Things (IoT)-based weather sensors and public meteorological datasets. The features included temporal (date and time), spatial (location coordinates), and climatic variables such as precipitation, temperature, humidity, wind speed, pressure, and elevation.
  • Severity-Based Disease Distribution Analysis: Aggregated data such as location, total infected crops, total infected crops per disease, and total crops in a farmland was used to map severity hotspots.

3.1.2. Data Acquisition

Data acquisition is a very crucial step, as it forms the foundation of accuracy of a model. After extensive research, the data was categorized into drone imagery (UAV), weather data (IoT-based), and multispectral remote sensing data.

3.1.3. UAV-Based Imagery

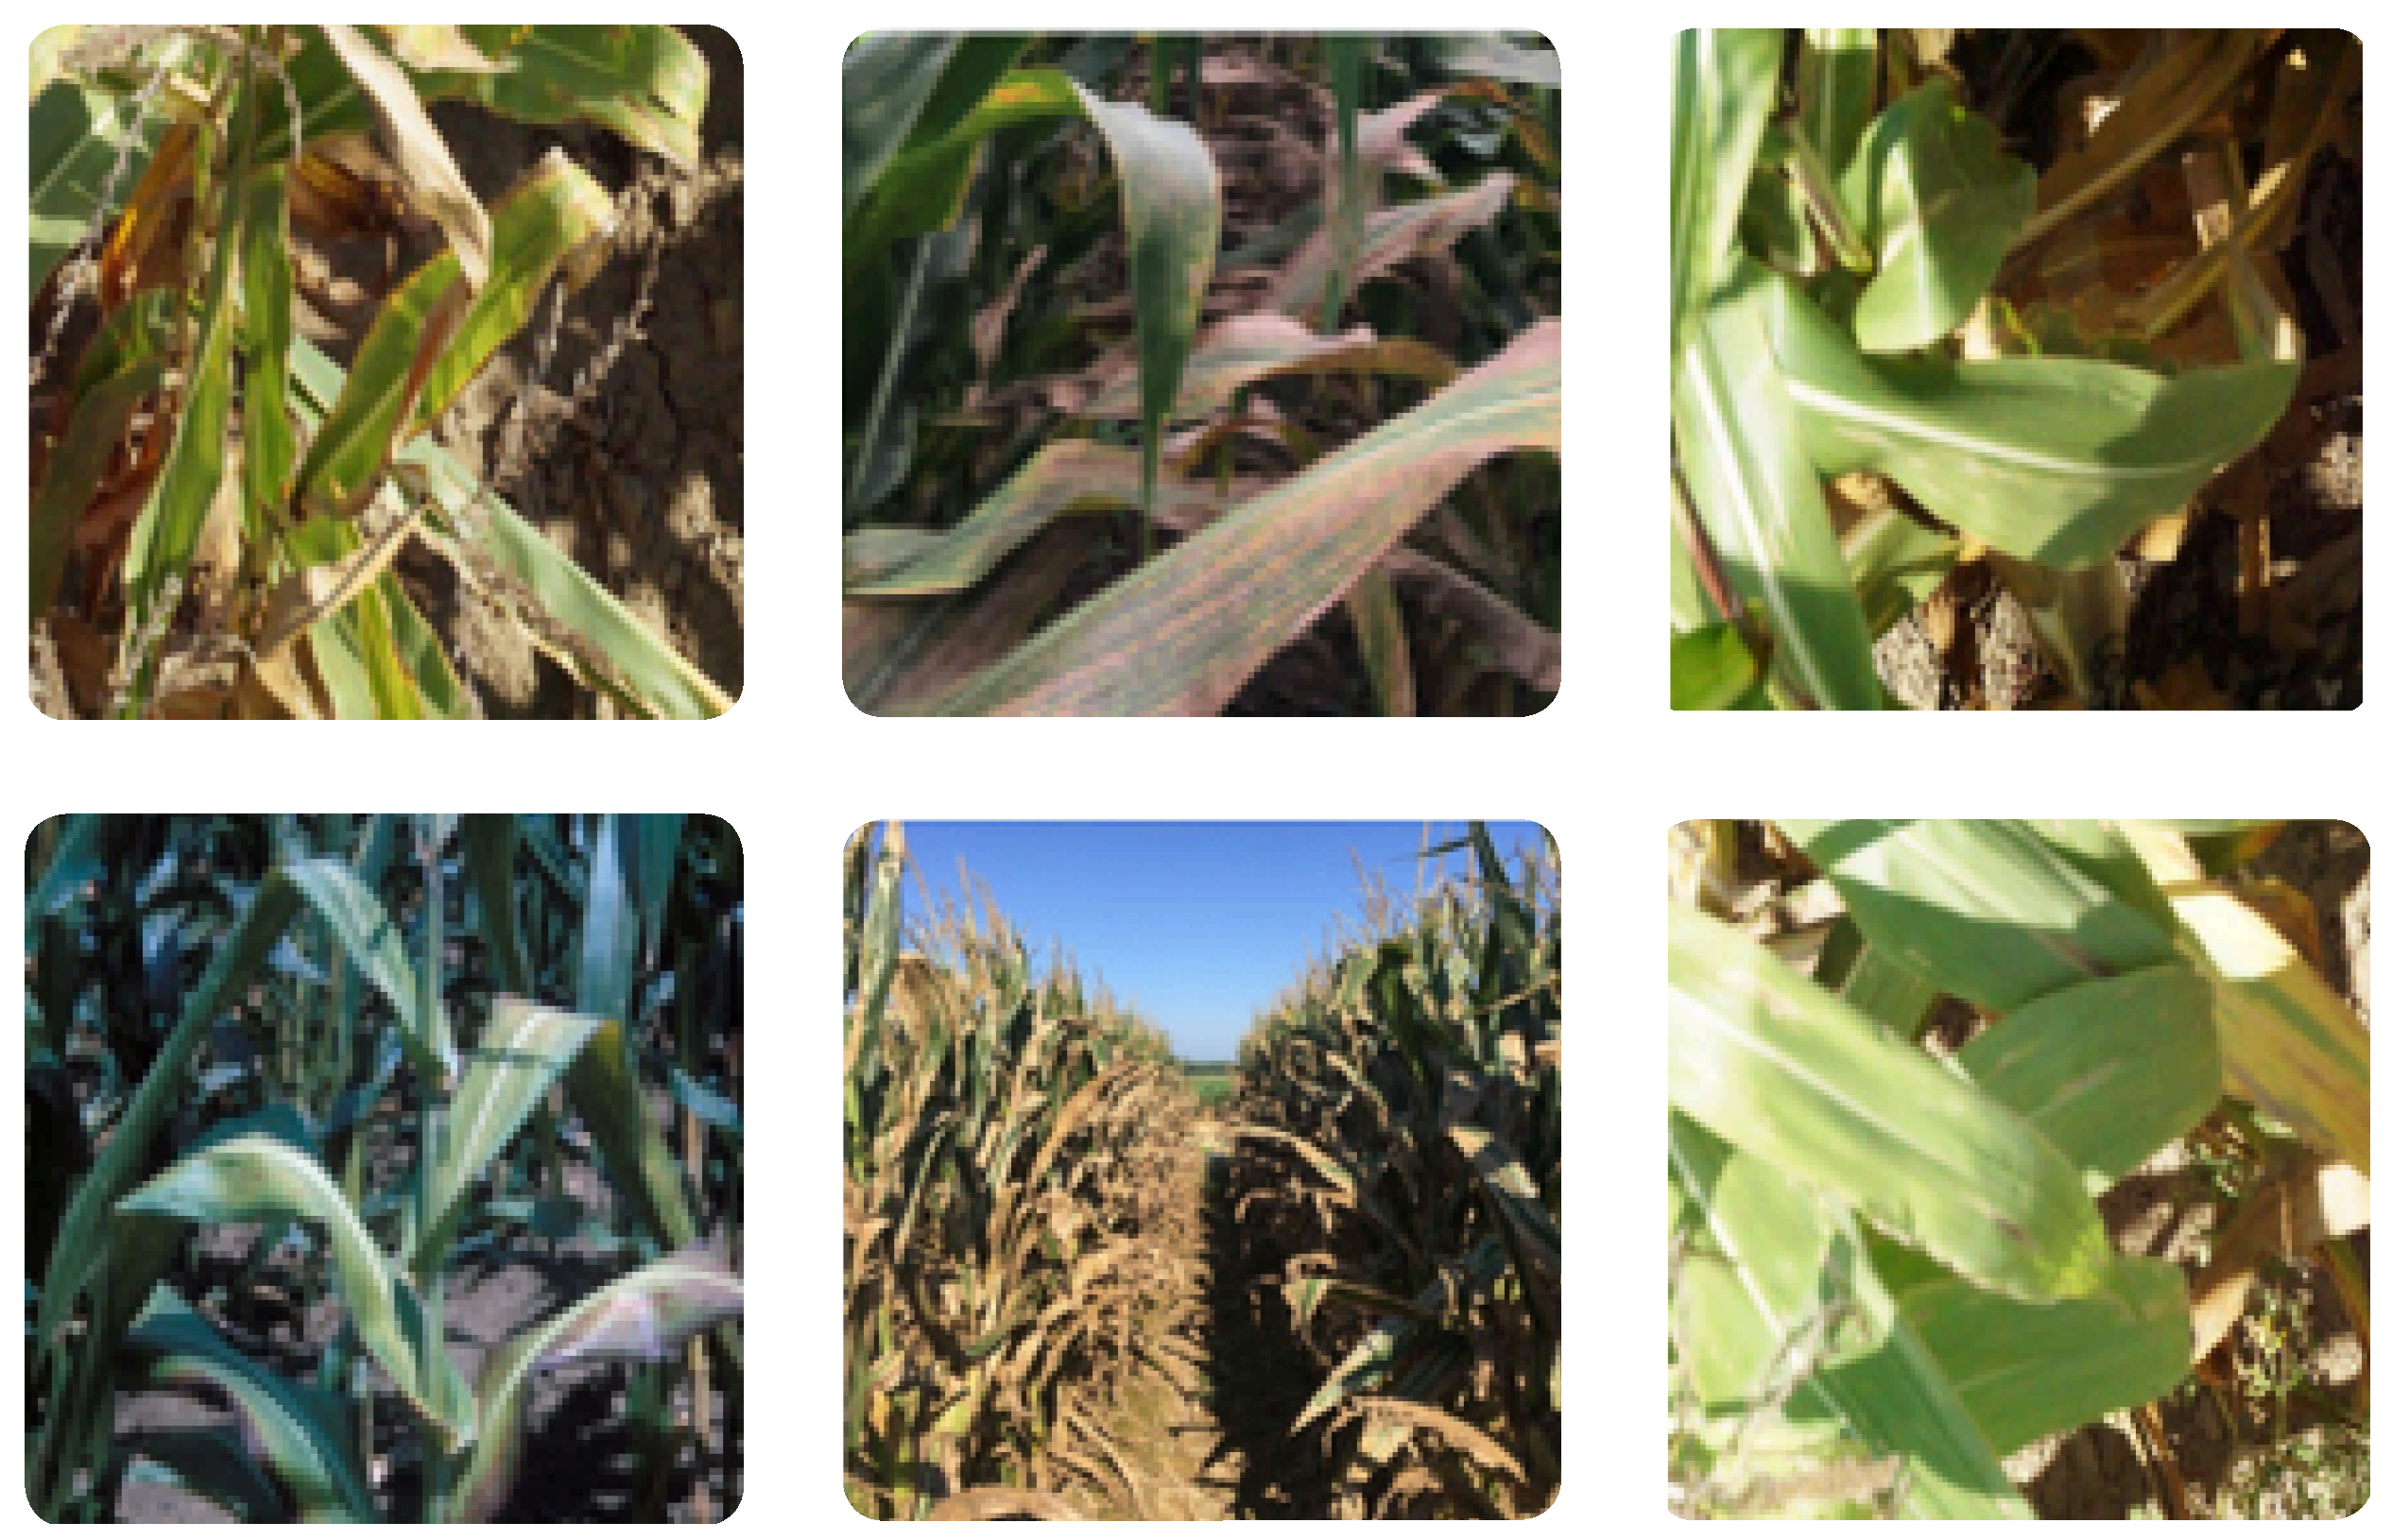
High-resolution images captured by the Unmanned Aerial Vehicle (UAV) are useful in identifying the symptoms of diseases such as discoloration and spotting. Two datasets from UAV-based imagery were finalized. The first drone dataset was derived from a field trial of corn planted on Cornell University’s Musgrave Research Farm [25,26], which is a 450-acre field-crop research facility (Figure 2. The dataset consists of 9967 high-resolution images and 42,117 expert-verified annotations classified into 5 classes with 42,117 annotations and 55 GB storage(Table 5. The images were manually filtered for quality by human experts.
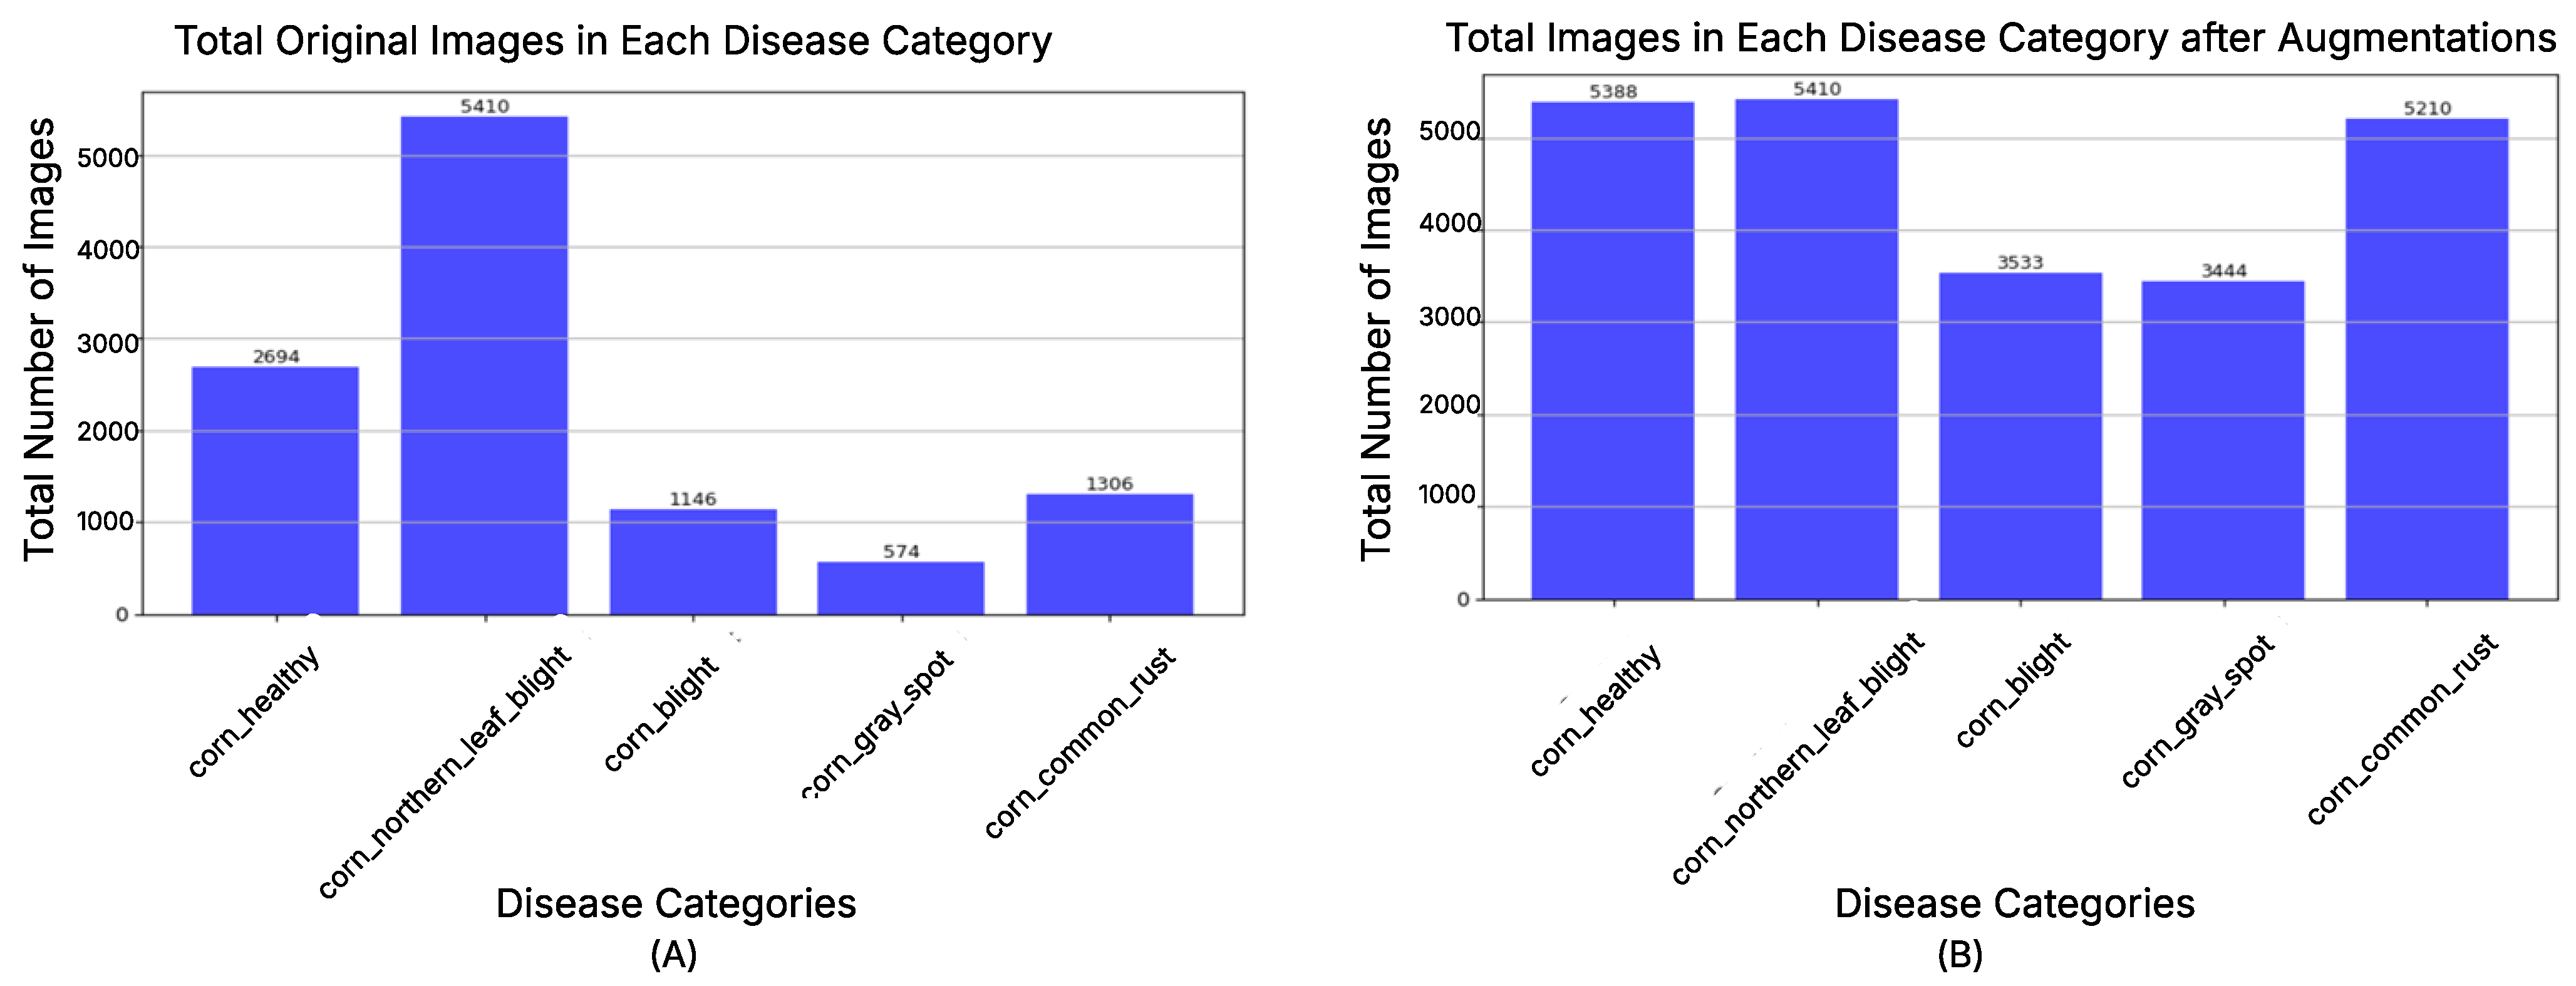
Significant class imbalance was exhibited by the dataset. In the corn dataset particularly, NLB instances vastly outnumber healthy samples, which necessitated the use of augmentation and oversampling techniques during pre-processing. Some other farms considered were Delaney Farm (Syracuse, NY, USA), Stoughton Farms (Newark Valley, NY, USA), and Turek Farms (King Ferry, NY, USA).
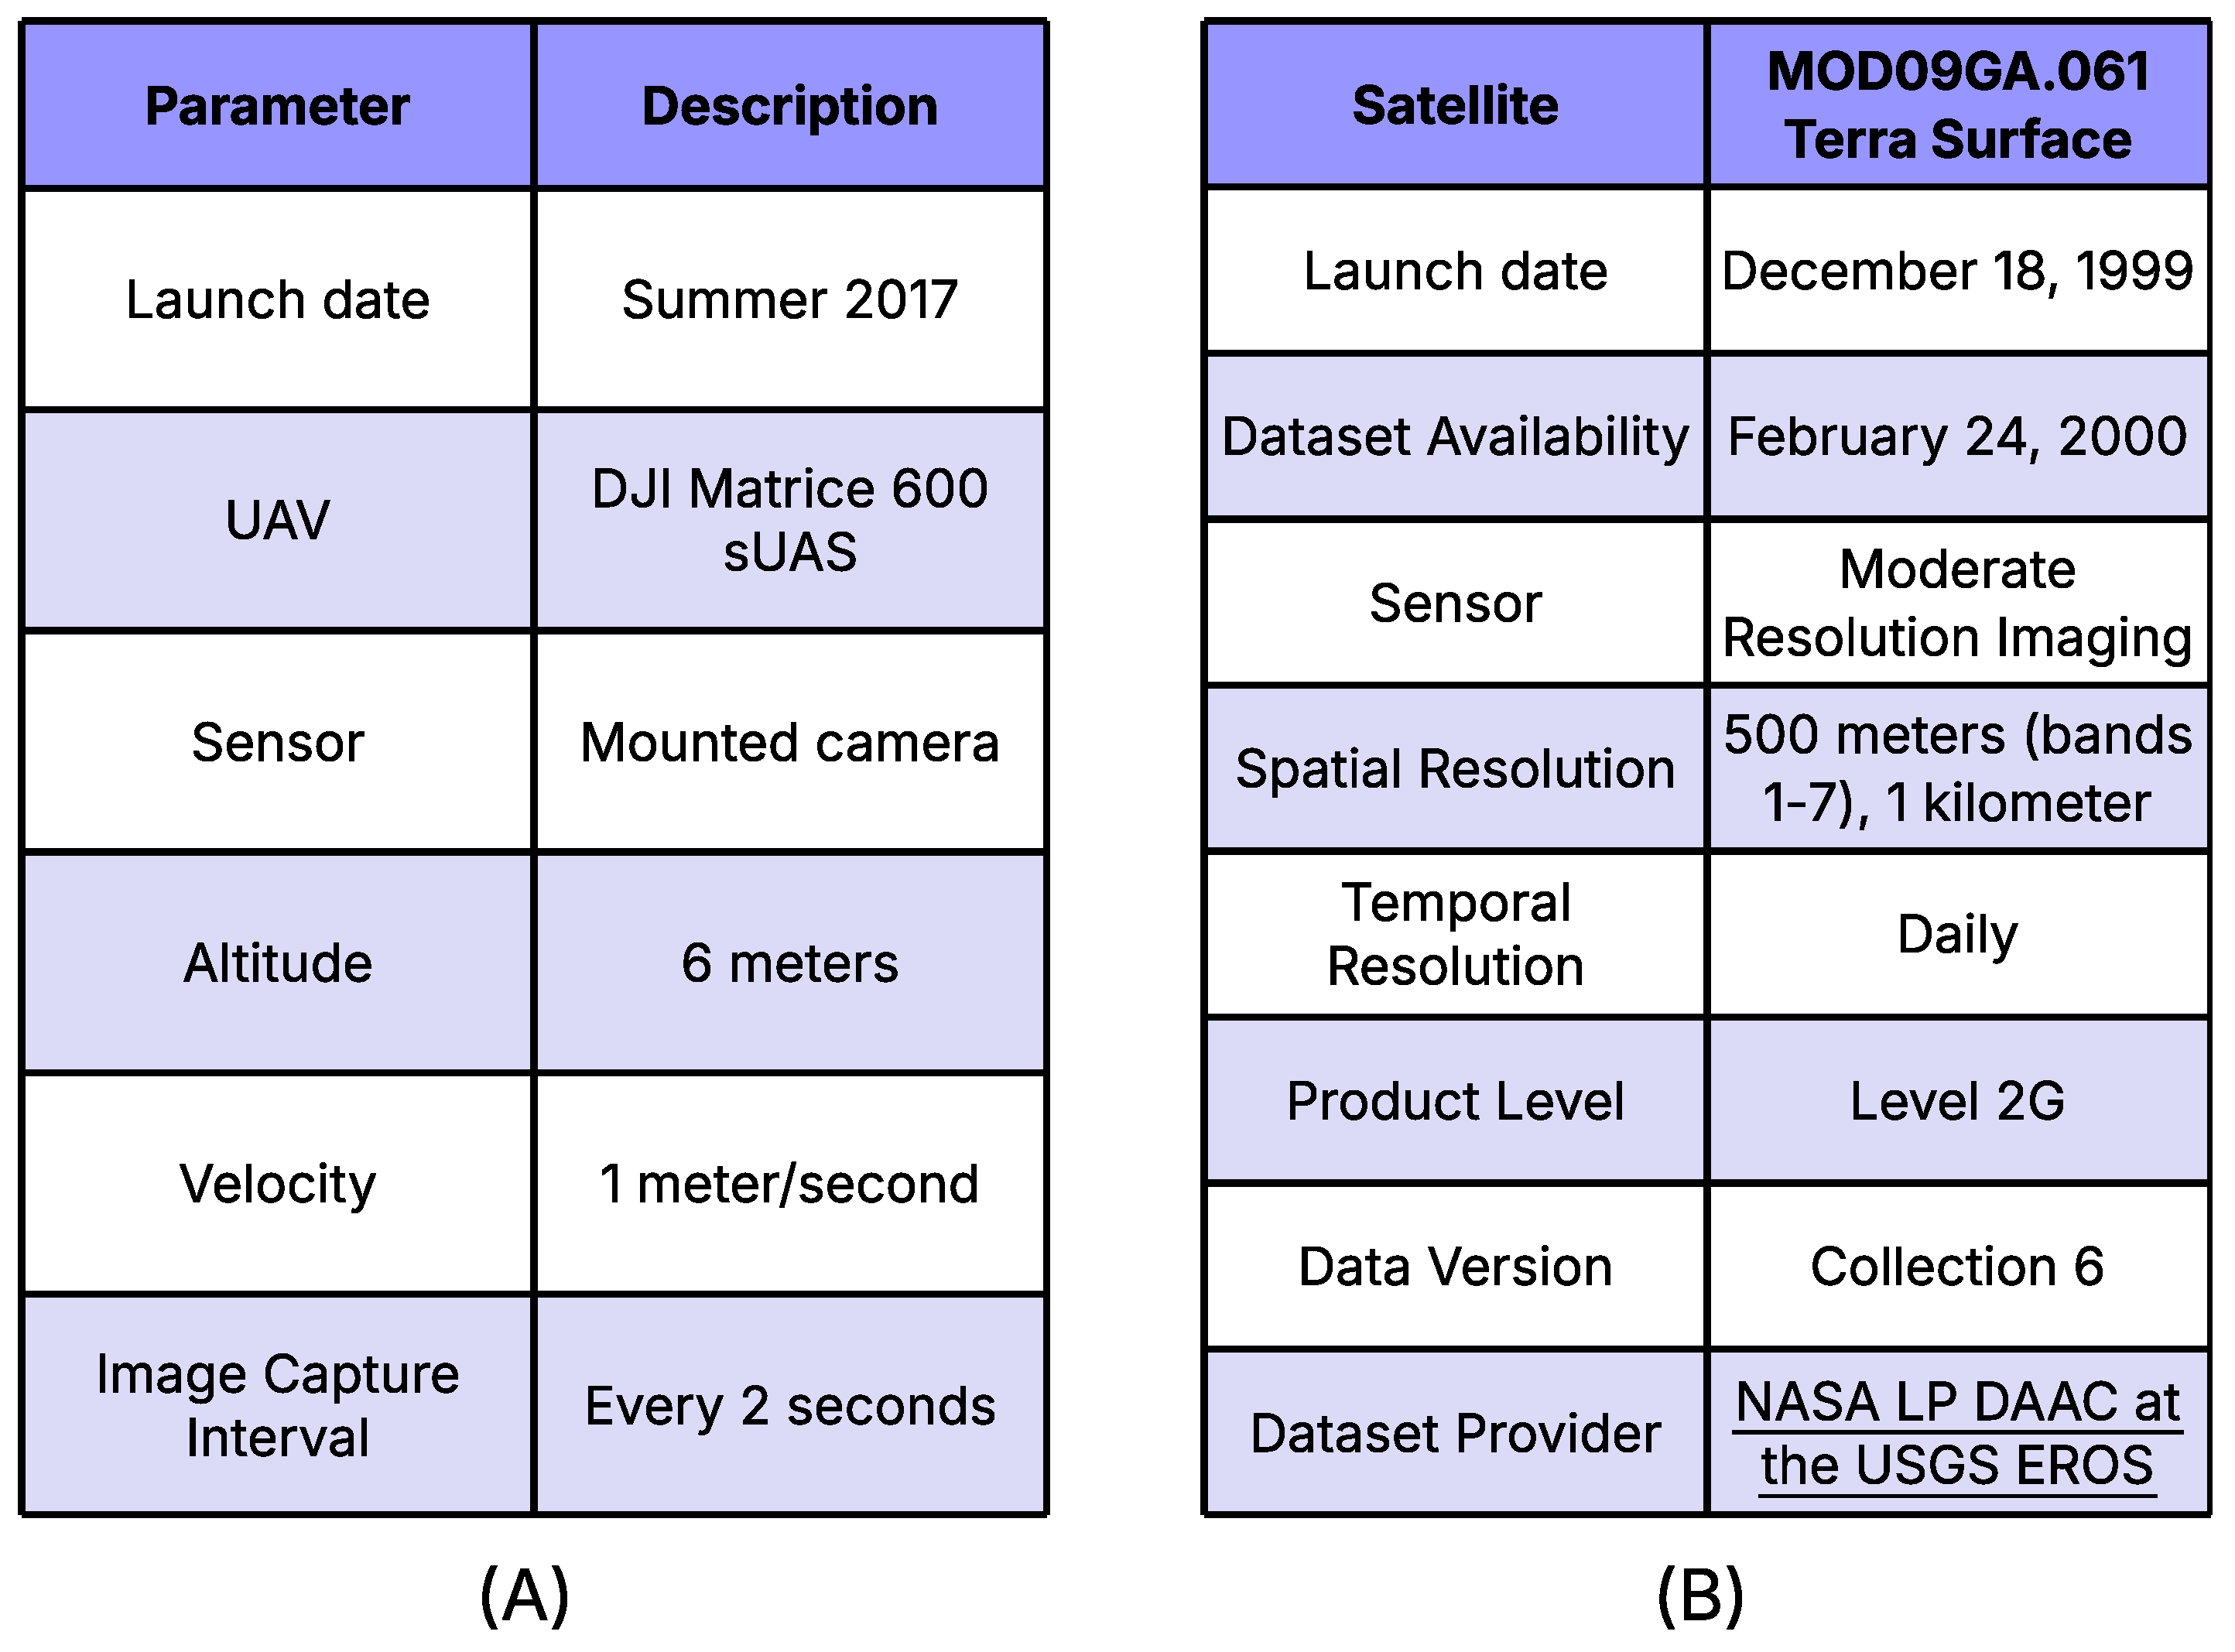
At Musgrave Research Farm, the farm was arranged in two-row plots with a length of 5.64 m and inter-row spacing of 0.76 m. The trials were rain-fed and managed with conventional corn cultivation. The images were captured every two seconds, and the drone flew at an altitude of 6 m with a velocity of 1 m/s. The original UAV data has been used as ground truth, which forms the basis for model validation.

3.1.4. Remote Sensing Data

Since plants have distinct spectral patterns which can shift under stress, we have considered evaluation on the basis of remote sensing imagery. The dataset used is MOD09GA.061, which is acquired from the MODIS instrument, a core component of NASA’s Terra and Aqua satellites. Table 6 gives metadata for MOD09GA.061 dataset.
The seven spectral bands [27] are used to calculate various vegetation indices such as Enhanced Vegetation Index (EVI), Green Chlorophyll Vegetation Index (GCI), Normalized Difference Red Edge Index (NDRE), Moisture Stress Index (MSI) and Structure Insensitive Pigment Index (SIPI). Figure 3B summarizes the metadata for the MOD09GA.061 product. This product provides daily global coverage at spatial resolutions of 500 m and 1 km across multiple spectral bands. The dataset supports the calculation of vegetation indices that are sensitive to chlorophyll content, moisture stress, and canopy structure, which are critical parameters for assessing plant health in precision agriculture applications.

3.1.5. IoT-Based Weather Data

Weather records were retrieved from the National Centers for Environmental Information (NCEI) [28]. Data from 2017 to 2018 were considered, and observations were recorded based on parameters such as air temperature, precipitation, kind of weather, evaporation, wind speed, and direction. Additionally, monthly climate factors that are strongly correlated with water demand are included. The data was taken from a single weather station on a daily basis which was present at Syracuse Hancock International Airport; the weather series were then merged to the farmlands by time and location.

3.1.6. Data Preprocessing

The gathered data from such datasets are often prone to missing attribute values and outliers. Anomalous data was pre-processed to avoid erroneous outcomes.

3.1.7. UAV-Based Imagery

The original images (6000 × 4000 pixels) were resized, i.e., the resolution was reduced to 224 × 224 pixels to reduce computational complexity while preserving relevant features. The format of the images was converted to NumPy arrays for model compatibility and efficient processing. Several augmentation techniques like rotations (90°, 180°, 270°) and flipping were applied. This resulted in 7 augmented versions for each original image. One-Hot Encoding was used to pre-process labels by converting categorical disease labels for model training.

3.1.8. Remote Sensing Data

The pre-processing stages for remote sensing satellite data is shown in Table 7. The focus was placed on relevant bands (NIR, RED, SWIR) with normalization applied for uniformity. To improve vegetation index analysis, the non-vegetative noise was removed by applying cloud and shadow masking, after which vegetation indices (NDVI, EVI, SIPI, GCI, MSI, NDRE) were calculated to assess crop health. Temporal and spatial data was extracted and the final dataset was structured as feature vectors which can be used as input for ML models. Feature scaling was performed to ensure that all features contribute equally to the model. MinMaxScaler (sklearn) is applied on training and test data. This is performed after splitting to avoid data leakage. Several vegetation indices (Equations (1)–(5)) were computed from MODIS reflectance data to characterize crop health.
The vegetation indices used in this study are defined in Equations (1)–(5), with short descriptions of their relevance for crop disease monitoring.
MSI = NIR SWIR NIR + SWIR
NDRE = NIR RE NIR + RE
EVI = 2.5 NIR RED NIR + C 1 RED C 2 BLUE + L
GCI = NIR Green 1
SIPI = NIR BLUE NIR RED
  • Description of vegetation indices:
  • MSI: Highlights plant water stress; higher values indicate disease-prone areas [29].
  • NDRE: Detects chlorophyll reduction from early disease stress [30].
  • EVI: Improves canopy health monitoring in dense crops [31].
  • GCI: Estimates chlorophyll concentration, a key disease indicator [32].
  • SIPI: Reflects carotenoid/chlorophyll ratio under disease stress [33].

3.1.9. IoT-Based Weather Data

Initial comprehensive analysis of the data indicated that a number of null values were present across the columns of the dataset. Irrelevant columns such as minute, city, and sky_condition were removed along with other bulky rows, resulting in a clear and suitable dataset. Imputation technique was implemented to cover null values in key fields like Altitude, Precipitation, and Pressure. Non-numeric entries were transformed into integer or float values. Categorical disease labels were converted to binary, as demonstrated by this: “NLB” = 1, “Healthy” = 0.

3.1.10. Data Validation

The three datasets were divided into a 75:25 ratio, where 75% of the data was used to train the models and 25% of the data was used for testing (Table 8).
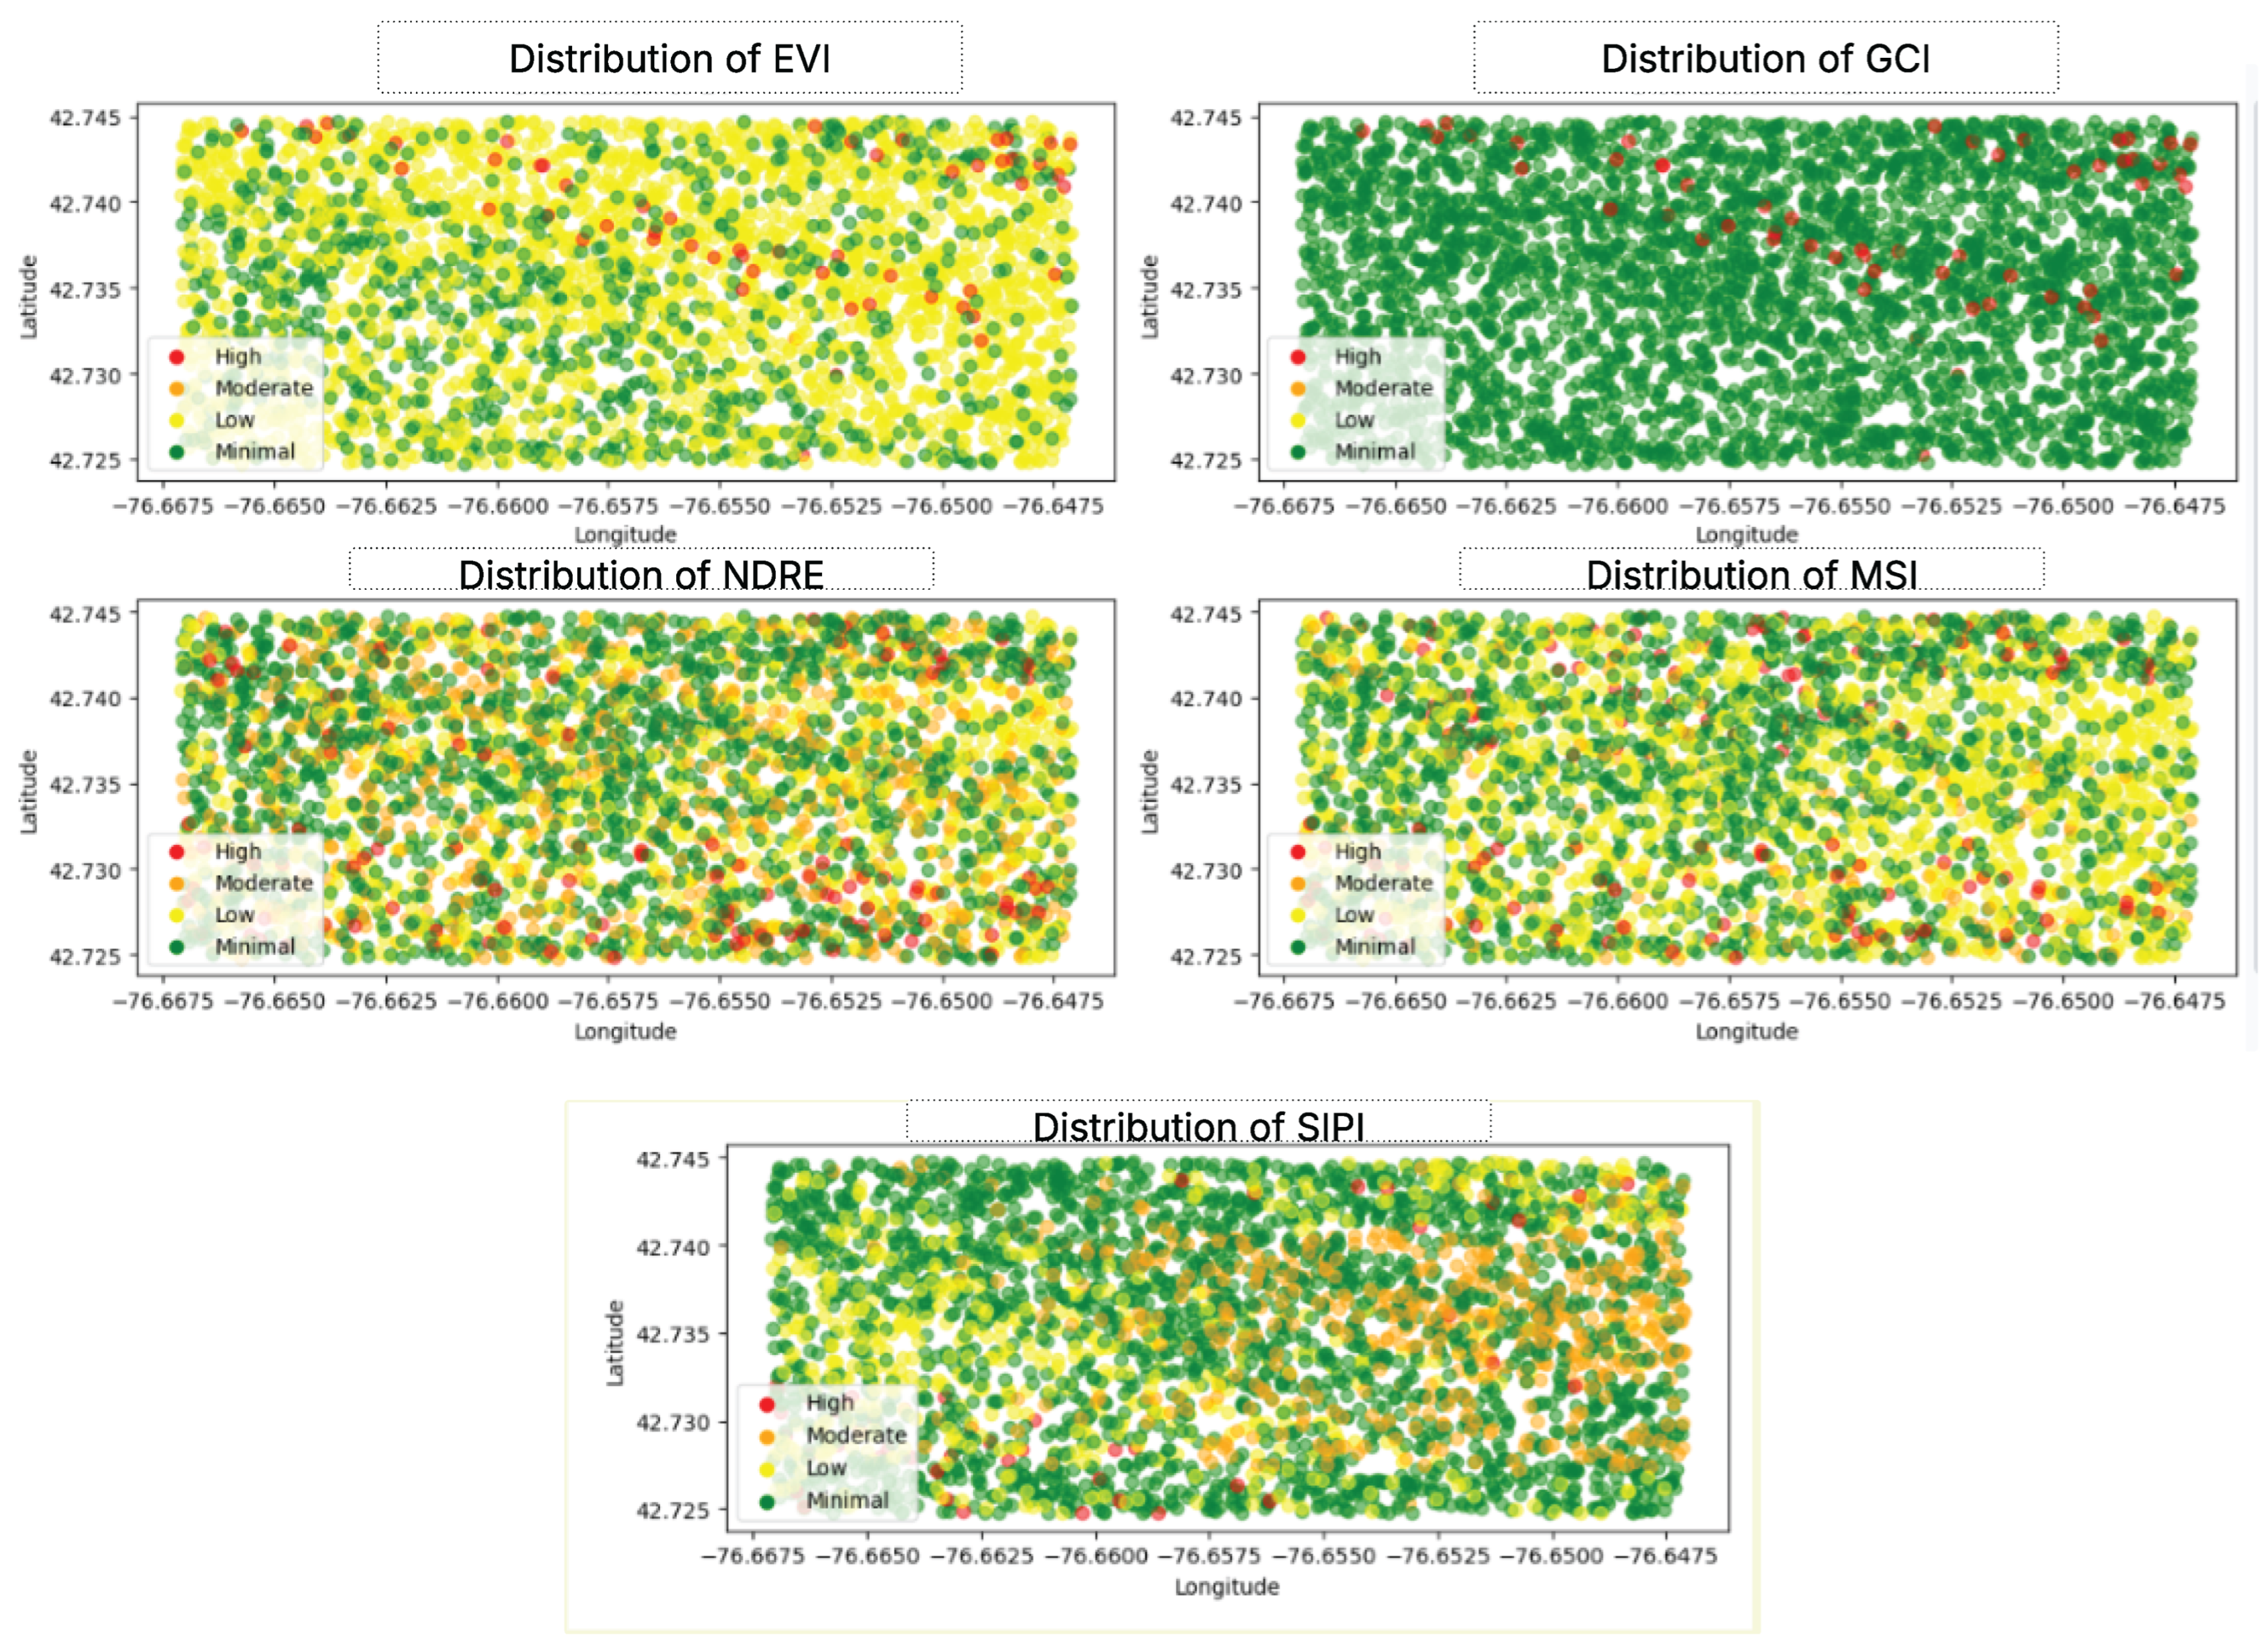
For hybrid models, the original datasets were used without augmentation. Exploratory Data Analysis (EDA) was performed to understand the temporal distribution of data. This analysis revealed a high concentration of data acquisition during certain times of the day. Figure 4 shows the post-augmentation class counts, which confirmed that the augmentation corrected the original 12:1 imbalance. Table 9 lists the acceptable ranges for each vegetation index. Any observation falling outside these bounds was discarded (<1.7% of samples). Figure 5 illustrates the geospatial distribution of the vegetation indices calculated. These visualizations demonstrate the spatial consistency and severity gradation captured by the indices and support the validation of remote sensing-derived health estimates. Color mapping reflects disease severity, i.e., red = high, yellow = moderate, and green = minimal.
These pre-processing steps were necessary to build a suitable high quality input dataset for building a robust system.

3.2. Training Environment and Configuration

The system uses Google Cloud Storage (100 GB) to store the image and csv data. The following specifications were utilized for model training: vCPU: 2 (Intel Xeon CPU@2.30 GHz), RAM: 40 GB, GPU: NVIDIA A100, Storage: 79 GB, and it was deployed on Google Colab Pro. vCPU: 2 (Intel Xeon CPU@2.30 GHz) with 40 GB RAM was used for prediction instance. All CNN’s were trained for 10 Epochs using the Adam Optimizer with a learning rate of 0.001. They were compiled with categorical entropy loss.

3.3. Model Development

3.3.1. Crop Disease Detection and Classification Using Drone Data (UAV)

This study presents a comprehensive model that uses drone data to detect and classify crop diseases. Drone data will provide valuable insights about crop health by capturing images of the crops and fields of high resolution. Our proposed model utilizes machine learning as well as deep learning algorithms to extract meaningful information from the drone images to identify the water-intensive crop diseases such as Northern Leaf Blight (NLB) that are identified in corn crops and other diseases that affect maize crops. Figure 6 summarizes our UAV pipeline from image capture and pre-processing to model training and inference for per-image disease classification. The UAV workflow comprises data acquisition, augmentation, a CNN backbone with a classification head, and post-processing to produce per-sample predictions.
  • 1. Improved VGG-16:
Improved VGG-16 model is employed because of its superior image classification capacity for UAV data. The improved results effectively reduce necessary computation while enhancing accuracy, thereby rendering the model much more efficient for real-time disease detection over vast agricultural fields. The key part of changes here is the use of depth-wise separable convolutions, which helped achieve 30% parameter reduction and cut down computational costs by around 40%. The neural network has three more convolutional layers in addition to 16 total layers in VGG-16. The input for the VGG-16 model is a fixed size of 224 × 224. Little 3 × 3 convolutional filters with a stride of 1 are used for fine feature detection, which was used to detect illness. Max-pooling layers with a stride of 2 and a 2 × 2 size are employed in between the convolutional layers to shrink the spatial dimensions of the feature maps, which reduces overfitting. Additionally, the architecture is followed by three fully connected layers (4096, 4096, 1000 units) and then a softmax output layer, which outputs a five class probability for Healthy, Northern Leaf Blight, Blight, Gray Leaf Spot, and Common Rust. Every convolutional and fully connected layer of VGG-16 uses the Rectified Linear Unit (ReLU) activation function, which outputs positive input values or zero for negative values. However, ReLU activation can lead to the ReLU problem, where neurons outputting negative values are assigned zero, effectively turning them off, which can potentially be addressed using Leaky ReLU, which has not been considered in this study. Categorical cross-entropy loss function is used, which is suitable with the softmax output layer because it gives probabilities as an interpretable class-wise output.
  • 2. Improved ResNet50:
This model was chosen due to its effective deep learning architecture with a stable gradient flow, which addressed the vanishing gradient issue sometimes found in deep networks. It excels at multi-class image classification tasks. ResNet-50 has 50 layers, which consist of convolutional, pooling, and fully connected layers with a special type of feed-forward residual blocks and skip connections. Residual blocks are important to the architecture of ResNet-50 because skip connection layers allow effective flow of gradients during backpropagation. This enables it to capture intricate patterns inherent in crop images, critical in differentiating between subtle disease-associated textures and colors. The input image size is 224 × 224, and the model begins with one convolutional and one max pooling layer followed by four bottleneck blocks. The maximum usable dimension is 2048. For multi-class classification, we implement a categorical cross-entropy loss function in ResNet-50, which minimizes the discrepancy between the actual and predicted class labels during training. The final softmax output layer computes probability for the five illness categories mentioned previously. Residual Learning improves training speed and classification precision. It works well for a hybrid approach, using both image and textual data for better classification. Figure 7 portrays the accuracy with which ResNet-50 classifies the crop health.
  • 3. Improved DenseNet-121:
DenseNet-121 is ideal for fine-grained disease detection and to address the vanishing gradient issue as each layer is connected to every other layer in a feed-forward fashion, which allows better feature propagation and reuse. It is a convolutional neural network with 121 layers, which includes bottleneck dense blocks, convolution 2D layers, and pooling in dense blocks. Growth rate (k) is used to balance between complexity and efficiency by controlling the number of feature maps added per layer. Bottleneck layers with 1 × 1 convolutions are used to make the model computationally lighter. Transitional layers consist of batch normalization and pooling to manage dimensionality. ReLU activation function is used after each layer (batch normalization + convolutional), to capture non-linearity. The loss function used was sparse categorical cross-entropy and softmax activation layer outputs normalized form, which were considered as probability for the disease classes.
  • 4. Improved EfficientNet-B0:
EfficientNet-B0 is ideal for real-time deployment of a large crop disease detection system, as it is easily scalable and resource-efficient. The improved EfficientNet-B0 includes SE blocks to improve the focus on leaf yellowing and spotting patterns associated with diseases like Northern Leaf Blight and Gray Leaf Spot that are biologically significant. Finer disease details may be captured by EfficientNet-B0 with input resolution increased up to 320 × 320 pixels without compromising the efficiency needed for real-time analysis. In addition, some Gaussian data augmentation methods such as random cropping, rotation, and horizontal flipping were used to increase the diversity of the dataset for assisting in learning disease patterns under varying conditions. This augmentation leads to more robust models in the presence of diverse real-world conditions including UAV data acquired at varying times of day and under different atmospheric conditions.
  • 5. Ensemble Model (Soft Voting):
Once the models (Improved VGG-16, Improved ResNet-50, Improved DenseNet-121, and Improved EfficientNet-B0) are trained, these individual models are integrated into a Model Ensemble (Meta-Learner) approach with soft voting. This ensemble aggregates the predictions from various models to improve the overall accuracy of the disease prediction, and thus it helps to minimize the errors and provides more precise outputs including disease severity distribution. The model that is more confident gets more weight in the result, so ensembles can make use of each model’s strengths. After this, the system generates the output classes which categorizes the crops into Northern Leaf Blight (NLB), Common Rust, Gray Leaf Spot, Blight, and Healthy. These predictions were converted to spatial visualization of disease severity and disease progression.

3.3.2. Crop Disease Detection and Severity Classification Using Remote Sensing Data

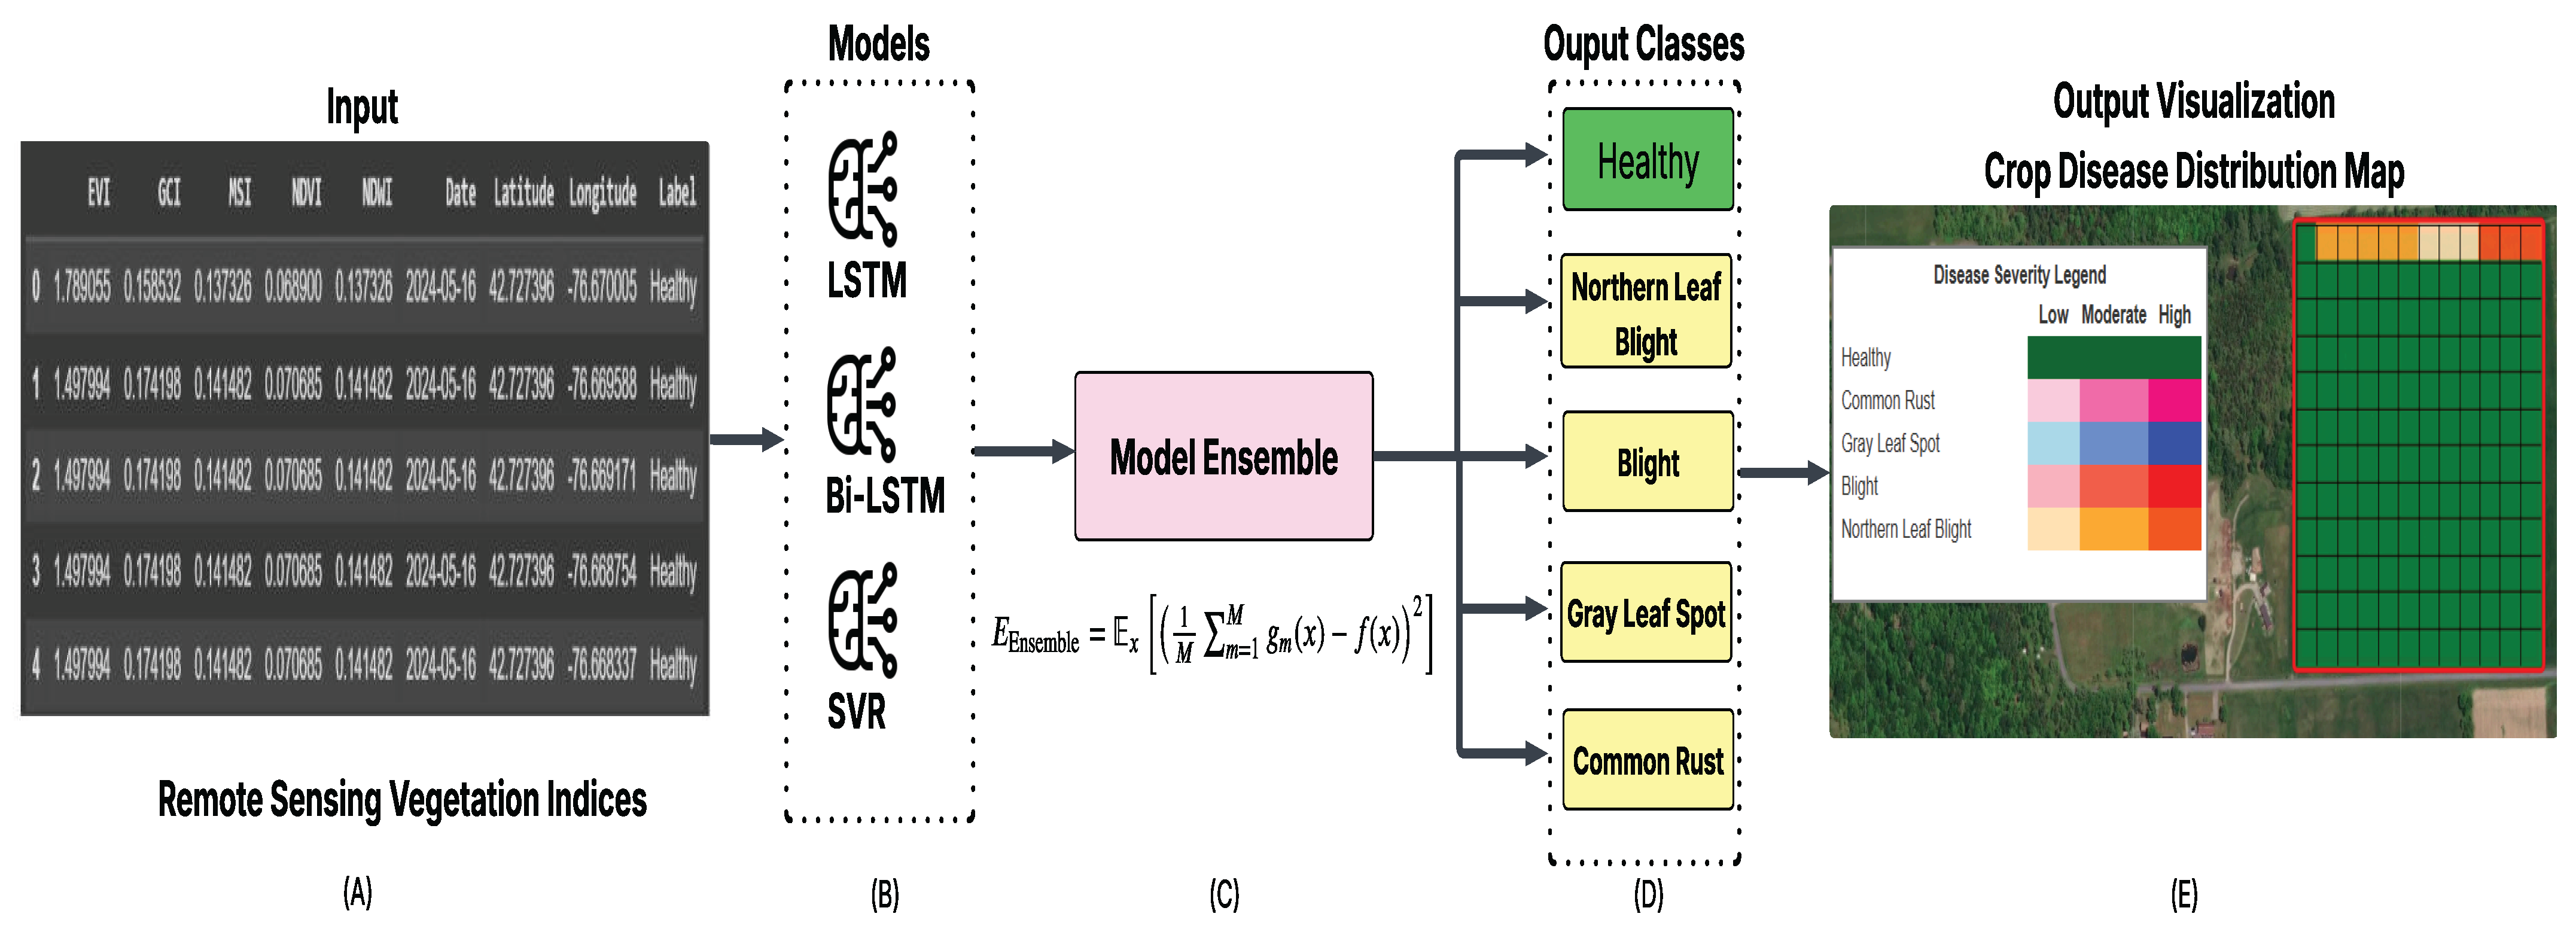
Remote sensing is a very reliable and powerful tool for crop disease classification, as it allows for wide area observation by covering entire fields or regions without physical access. It is ideal for monitoring disease progression and detecting early signs of crop stress, as it provides repeated measurements over time. The data is captured in visible, near-infrared and shortwave infrared bands, which enables detection of physiological changes in plants before visible symptoms appear. Parameters like moisture levels, chlorophyll content, and pigment degradation can be derived by calculation of vegetation indices, which are a strong indicator of crop health. The data is gathered from MODIS satellite (MOD09GA.061). An important part of this workflow is adding health labels, which indicate whether the plants are “Healthy” or affected by specific diseases. Figure 8 shows satellite images are turned into disease-severity maps for each 500 m grid cell.
  • Input data:
  • Latitude, Longitude, Date.
  • Spectral Bands: NIR, Green, Red, Red Edge, Blue.
  • Vegetation indices used:
The vegetation indices used in this study are defined in Equations (1)–(5).
  • 1. Improved LSTM
The LSTM model is proposed as a core model to analyze sequential remote sensing and weather data to identify trends in disease intensity. LSTMs are highly effective at handling time-series data with long-term dependencies, making them ideal for agricultural projects where disease development is gradual and influenced by cumulative weather and environmental conditions. This model takes sequences of vegetation indices (e.g., NDVI, GCI, EVI) extracted from remote sensing data and applies a unidirectional LSTM layer to process the inputs. It can predict severity levels for each type of disease (NLB, Blight, etc.) which are used to create a severity distribution map in order to classify areas according to intensity of disease. It can detect pre-disease states based on environmental progression, which acts as an early warning system.
  • 2. Improved Bi-LSTM
Bi-LSTM is used to analyze the temporal changes and the trend of severity according to it. It uses vegetation indices and processes the data both forward and backward, which improves the understanding of past and future states. This bidirectional capability is especially useful when looking at evolving trends in the severity of disease that may be less evident based only on current data. Bi-LSTM helps us understand how the specific environmental changes during an epidemic and seasonal transitions over time can influence disease severity. For each pixel, the final layer of the model outputs a spatial distribution map reflecting different severity classes by means of predicted course codes (i.e., Low, Moderate, High). This is shown on a grid of farmlands, which can be used to identify disease intensity by spatial zones. Bi-LSTM supports risk forecasting and zonal prioritization to apply preventative measures.
  • 3. Improved Support Vector Regression (SVR)
Support vector regression (SVR) was used to predict disease severity using remote sensing (vegetation indices) and weather data. The major advantage of SVR is in capturing the non-linear relationships or interactions present among all indices, including NDVI, GCI, and various weather factors, when predicting disease intensity. Composed of individual vegetation indexes, each having unique spectral information on crop health, SVR tried to combine these indices to make accurate predictions about the severity of the disease. The SVR model utilizes a kernel function to project the input data into a higher dimensional space, enabling it to identify the most influential support vectors and historical data points that significantly impact the prediction of disease severity. The model focuses only on key data points, hence leading to reduced noise and better generalization. The estimated spatial severity maps of the model for every farmland area in terms of disease hotspots (moderate, high, extreme severity) are produced as output, which allows targeted intervention and cost-effective resource allocation.

3.3.3. Crop Disease Detection and Classification Using Weather Data

Weather patterns are highly dynamic in nature, and therefore it is complicated in predicting and detecting the disease. Data-driven approaches are required that can help in analyzing weather data and classify and detect crop diseases accurately. The review of the literature by Catal, C et al. [3] and the case studies on Irish potatoes and maize by Kuradusenge et al. [2] provide a solid foundation for the development of our models. Improved weather data modeling can be accomplished by combining variables specific to use cases, carefully selecting features, integrating external data sources like satellite images, analyzing time and space variability, applying ensemble learning for dependable predictions, calibrating for uncertain predictions, employing explainable artificial intelligence techniques for transparent predictions, and continuously monitoring the data for adaptive modeling.
  • 1. Random Forest Classifier (RFC)
Random Forest Classifier is suitable for this study, as it captures complex non-linear relationships between meteorological variables and crop health. After data pre-processing, the model was trained where feature engineering and data augmentation were given utmost importance. It leverages ensemble learning through multiple decision trees to extract meaningful insights; this also reduces the risk of overfitting. RFC is robust and scalable, which are important factors while working with weather data, as it can handle large datasets with numerous variables. It provided the predicted disease label as output.
  • 2. Support Vector Machines (SVM)
Support Vector Machines have the ability to delineate hyperplanes in multidimensional space to distinguish different classes, which enables the model to identify complex patterns in the data. It provides excellent generalization for non-linear separable data spaces. Studies such as [1,3] were used to identify the robustness of an SVM model to navigate complex agricultural data. To classify data points in a multidimensional space by constructing hyperplanes, SVM was used. The kernel and regularization parameters were key for defining complexity and margin. The hyperparameter tuning process was guided by insights from [6]. A study by Wani et al. [5] was referred for data pre-processing and training of the SVM model. SVM was found to be very effective in terms of accuracy and model innovation, especially for non-linear datasets.
  • 3. Gaussian Naive Bayes (GNB)
Gaussian Naive Bayes is useful for multi-factor environments like agriculture, as it assumes conditional independence between features. It is suitable for real-time prediction, as it is fast and computationally light, which makes it practical for farmer support systems. Insights from previous studies by Kim et al. [34] and Bock et al. [35] involved handling of the different types of features and data augmentation techniques to improve the performance of the model. The model was trained alongside SVM for comparative analysis.
Table 10 presents a detailed analysis and justification for the selection of all machine learning models in this study and the result in comparison to other models.

3.3.4. Reinforcement Learning

This study incorporates a Deep Q-Learning (DQL)-based reinforcement learning (RL) framework to optimize crop disease detection using data from weather monitoring systems and UAV platforms. The model learns to choose optimal actions for accurate disease classification by continuously interacting with a dynamic agricultural environment. The following are the components for the state vector at each step:
  • UAV data and Vegetation indices from remote sensing data: NDVI, EVI, GCI, MSI, NDWI.
  • Weather data such as temperature, humidity, precipitation, and wind speed.
  • Spatial data (grid cell locations i.e; latitude and longitude).
This state data is processed by a convolutional neural network (CNN), to extract spatial and temporal patterns relevant to crop health. The core of the reinforcement learning model is a Deep Q-Network (DQN) which maps the state vectors and calculates a Q-value by applying a Deep Q-Learning formula. This reflects the model’s confidence in selecting a specific action based on the current situation. The formula depicted in Equation (6) indicates how the model learns from the current state (s), action (a), and the resulting reward to improve the prediction. Here, q(s, a) is the old value and the part on the right is the learned value.
q new ( s , a ) = ( 1 α ) q ( s , a ) old value + α R t + 1 + γ max a q ( s , a ) learned value
The primary objective of the model is to maximize the disease detection reward, which measures how effectively its actions identify and categorize crop diseases. The reward policy is presented in Table 11. Rewards are computed based on classification accuracy, with higher rewards for correct disease identification and penalties for incorrect or missed detections. This model enables an adaptive decision-making policy based on real-time weather data and provides a feedback-based learning loop to improve the detection accuracy over time.
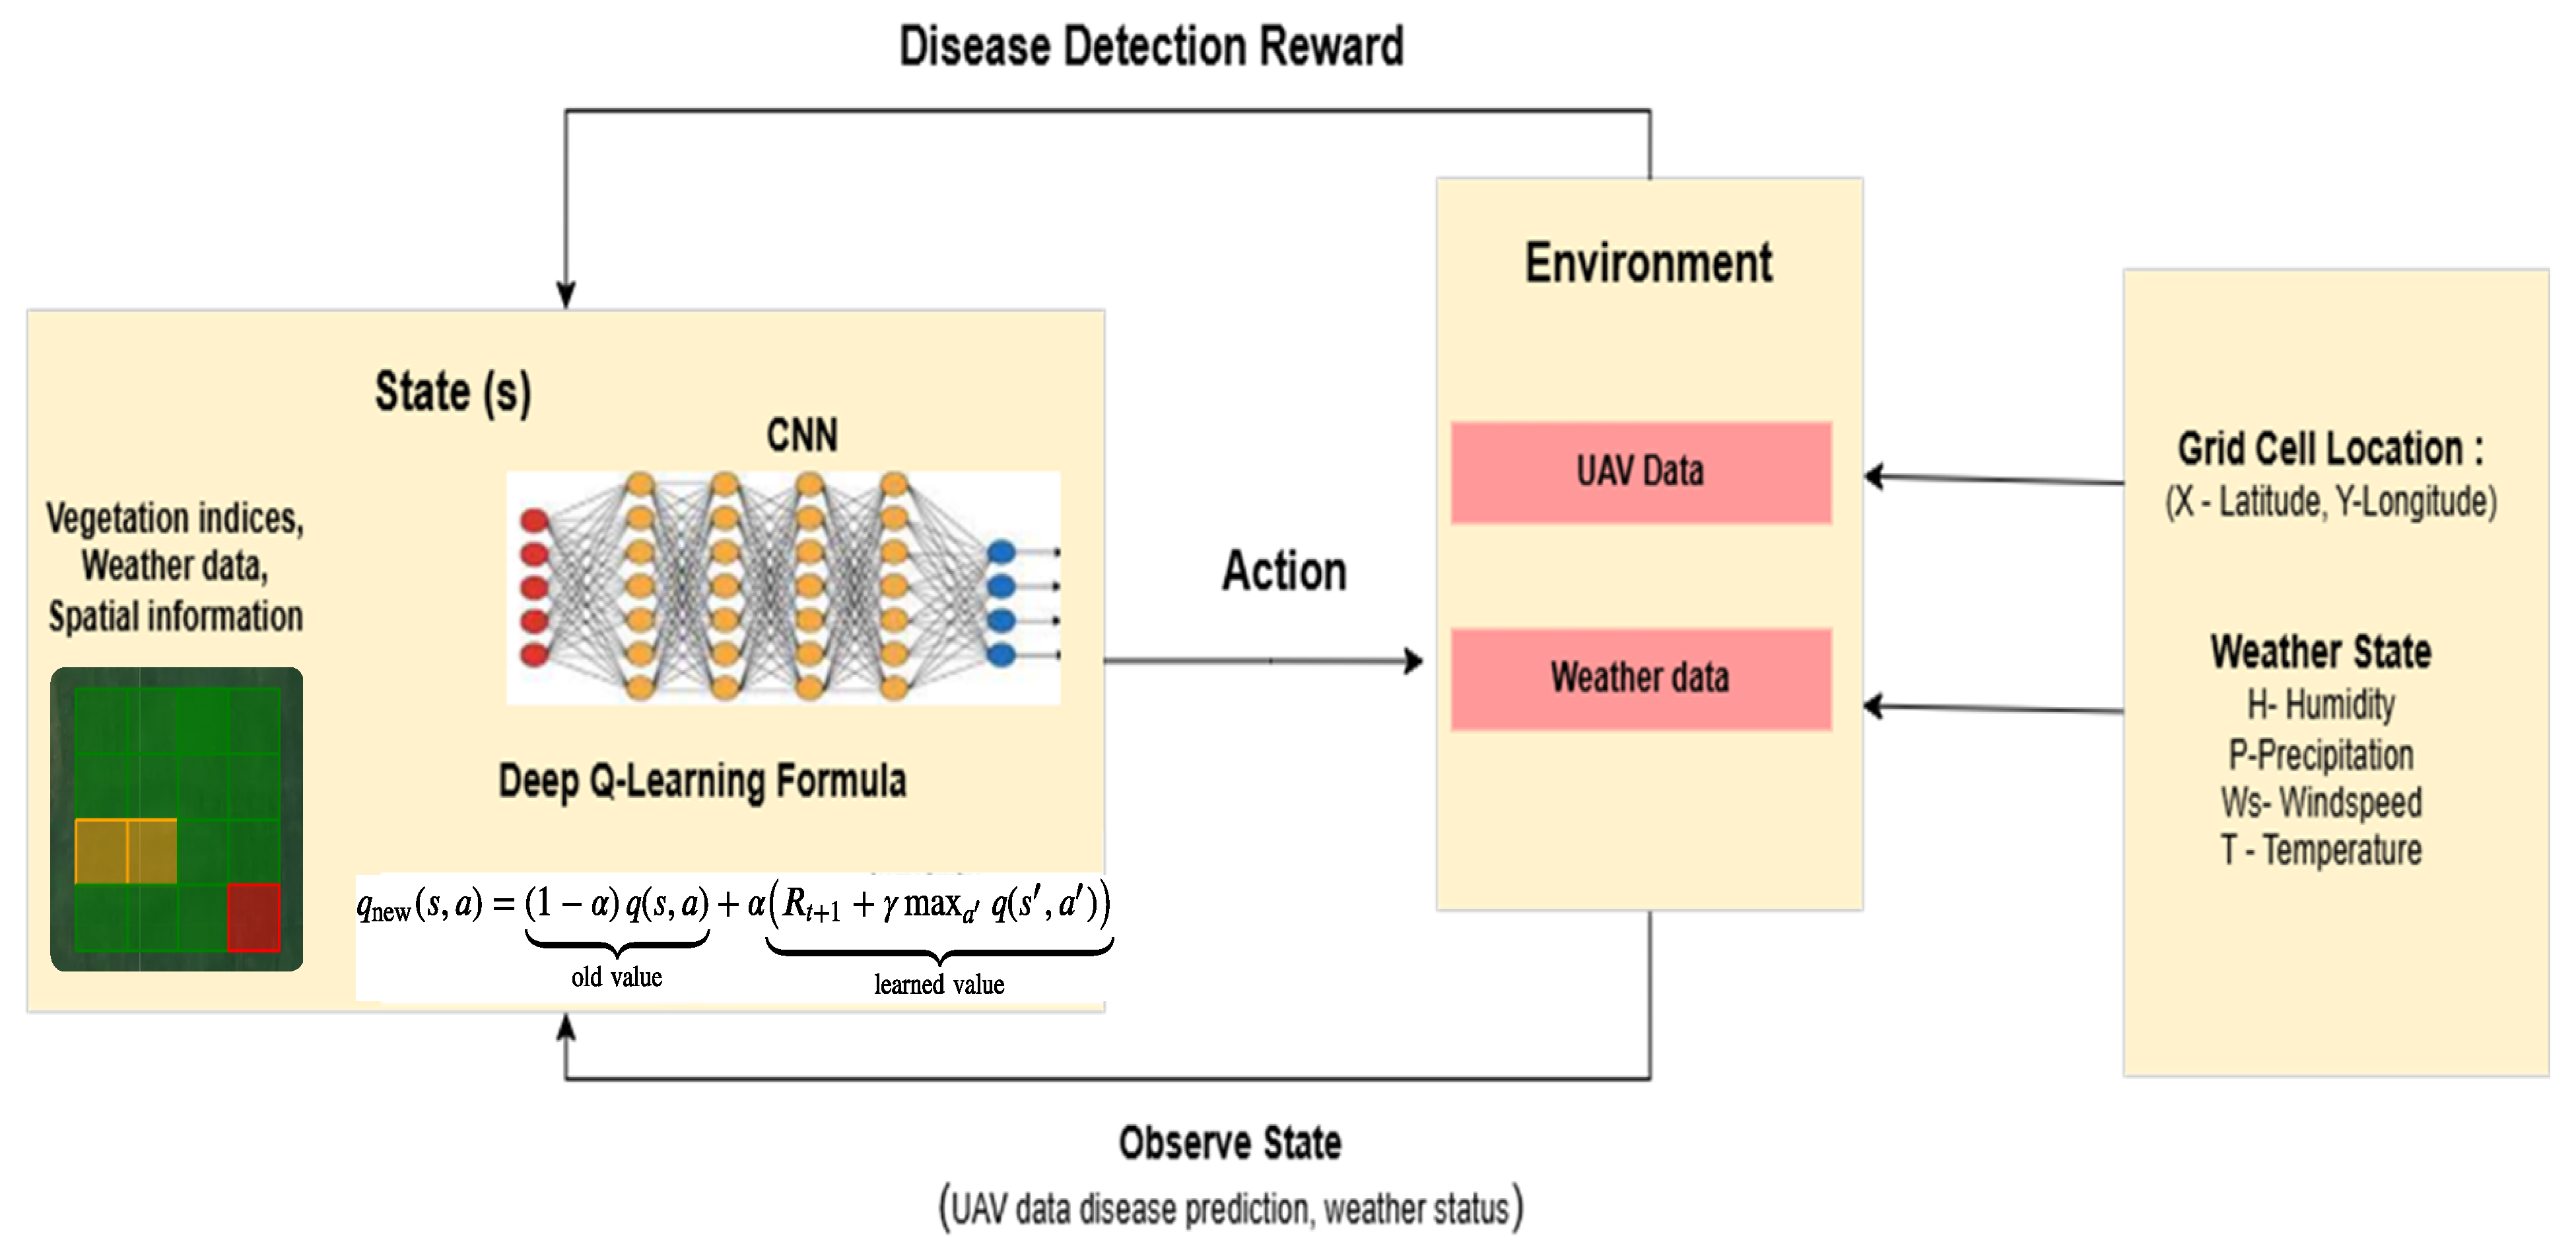
Figure 9 presents the complete flow for the reinforcement learning model where the CNN takes vegetation indices, spatial information (grid cells), and weather data and decides the action on the basis of the environment for the current cell. Then it selects the next cell on the basis of the result and decides the reward; it gives a positive signal if the disease is detected or a hotspot is highlighted, and a negative signal if low-value cells are encountered. The Q-function is updated, and iteratively the model focuses on emerging hotspots and disease mapping.

3.4. Model Evaluation

In order to build an accurate model, the performance of the model on unseen data is evaluated using certain model evaluation metrics. In this study, model evaluation was performed using metrics such as Accuracy, Precision, Recall, F1 Score, Intersection Over Union (IOU), Mean Squared Error (MSE), Cross-Entropy Loss, MSE Loss, Receiver Operating Characteristic (ROC) curve, and Area Under Curve (AUC).

3.4.1. Accuracy

Accuracy is used to measure the proportion of instances (both positive and negative) that are correctly classified among all the instances. It is one of the most commonly used metrics to evaluate classification models by providing an overall performance assessment. However, accuracy may not be suitable for imbalanced datasets. The formula for accuracy is
Accuracy = T P + T N T P + T N + F P + F N
where T P is the number of true positives, T N is the number of true negatives, F P is the number of false positives, and F N is the number of false negatives.

3.4.2. Precision

Precision measures the proportion of positive predictions that are correct. It is defined as
Precision = T P T P + F P
This metric is particularly important in scenarios such as disease prediction, where minimizing false positives is critical.

3.4.3. Recall

Recall, also known as sensitivity, measures the proportion of actual positive instances that are correctly predicted. It is defined as
Recall = T P T P + F N
Recall emphasizes capturing all actual positive instances and is crucial when missing positives is costly.

3.4.4. F1 Score

The F1 score is the harmonic mean of precision and recall and provides a balance between the two. It is especially useful when both false positives and false negatives are important. The formula is
F 1 Score = 2 × Precision × Recall Precision + Recall

3.4.5. Intersection over Union (IoU)

IoU is used to measure the overlap between predicted and ground truth bounding boxes in object detection and image segmentation tasks. It is calculated as
IoU = Area of Intersection Area of Union
A higher IoU indicates better alignment between prediction and ground truth.

3.4.6. Mean Squared Error (MSE)

MSE is a regression metric that measures the average of the squares of the differences between actual and predicted values. The formula is
MSE = 1 n i = 1 n ( y i y ^ i ) 2
where y i is the observed value, y ^ i is the predicted value, and n is the number of observations.

3.4.7. Cross-Entropy Loss

This loss function is used in classification tasks to measure the difference between predicted and actual probability distributions. It is defined as
Cross - Entropy Loss = i y i log ( y ^ i )
where y i is the true label (0 or 1) and y ^ i is the predicted probability.

3.4.8. Mean Squared Error (MSE) Loss

MSE Loss is commonly used in regression tasks as a loss function to minimize the squared difference between predicted and actual values during training:
MSE = 1 n i = 1 n ( y i y ^ i ) 2

3.4.9. Receiver Operating Characteristic (ROC) Curve

The ROC curve plots the True Positive Rate (TPR) against the False Positive Rate (FPR) at various threshold settings. It evaluates a model’s ability to distinguish between classes.

3.4.10. Area Under Curve (AUC)

AUC is the area under the ROC curve. A value closer to 1 indicates better separability, while a value close to 0.5 implies poor performance. AUC can be interpreted as the probability that a randomly chosen positive example ranks higher than a randomly chosen negative one.
Table 10 gives a summary of the models utilized in this study, the input data, the rationale for selecting them, and the observed benefits and restrictions.

4. Results

4.1. UAV (Drone) Data

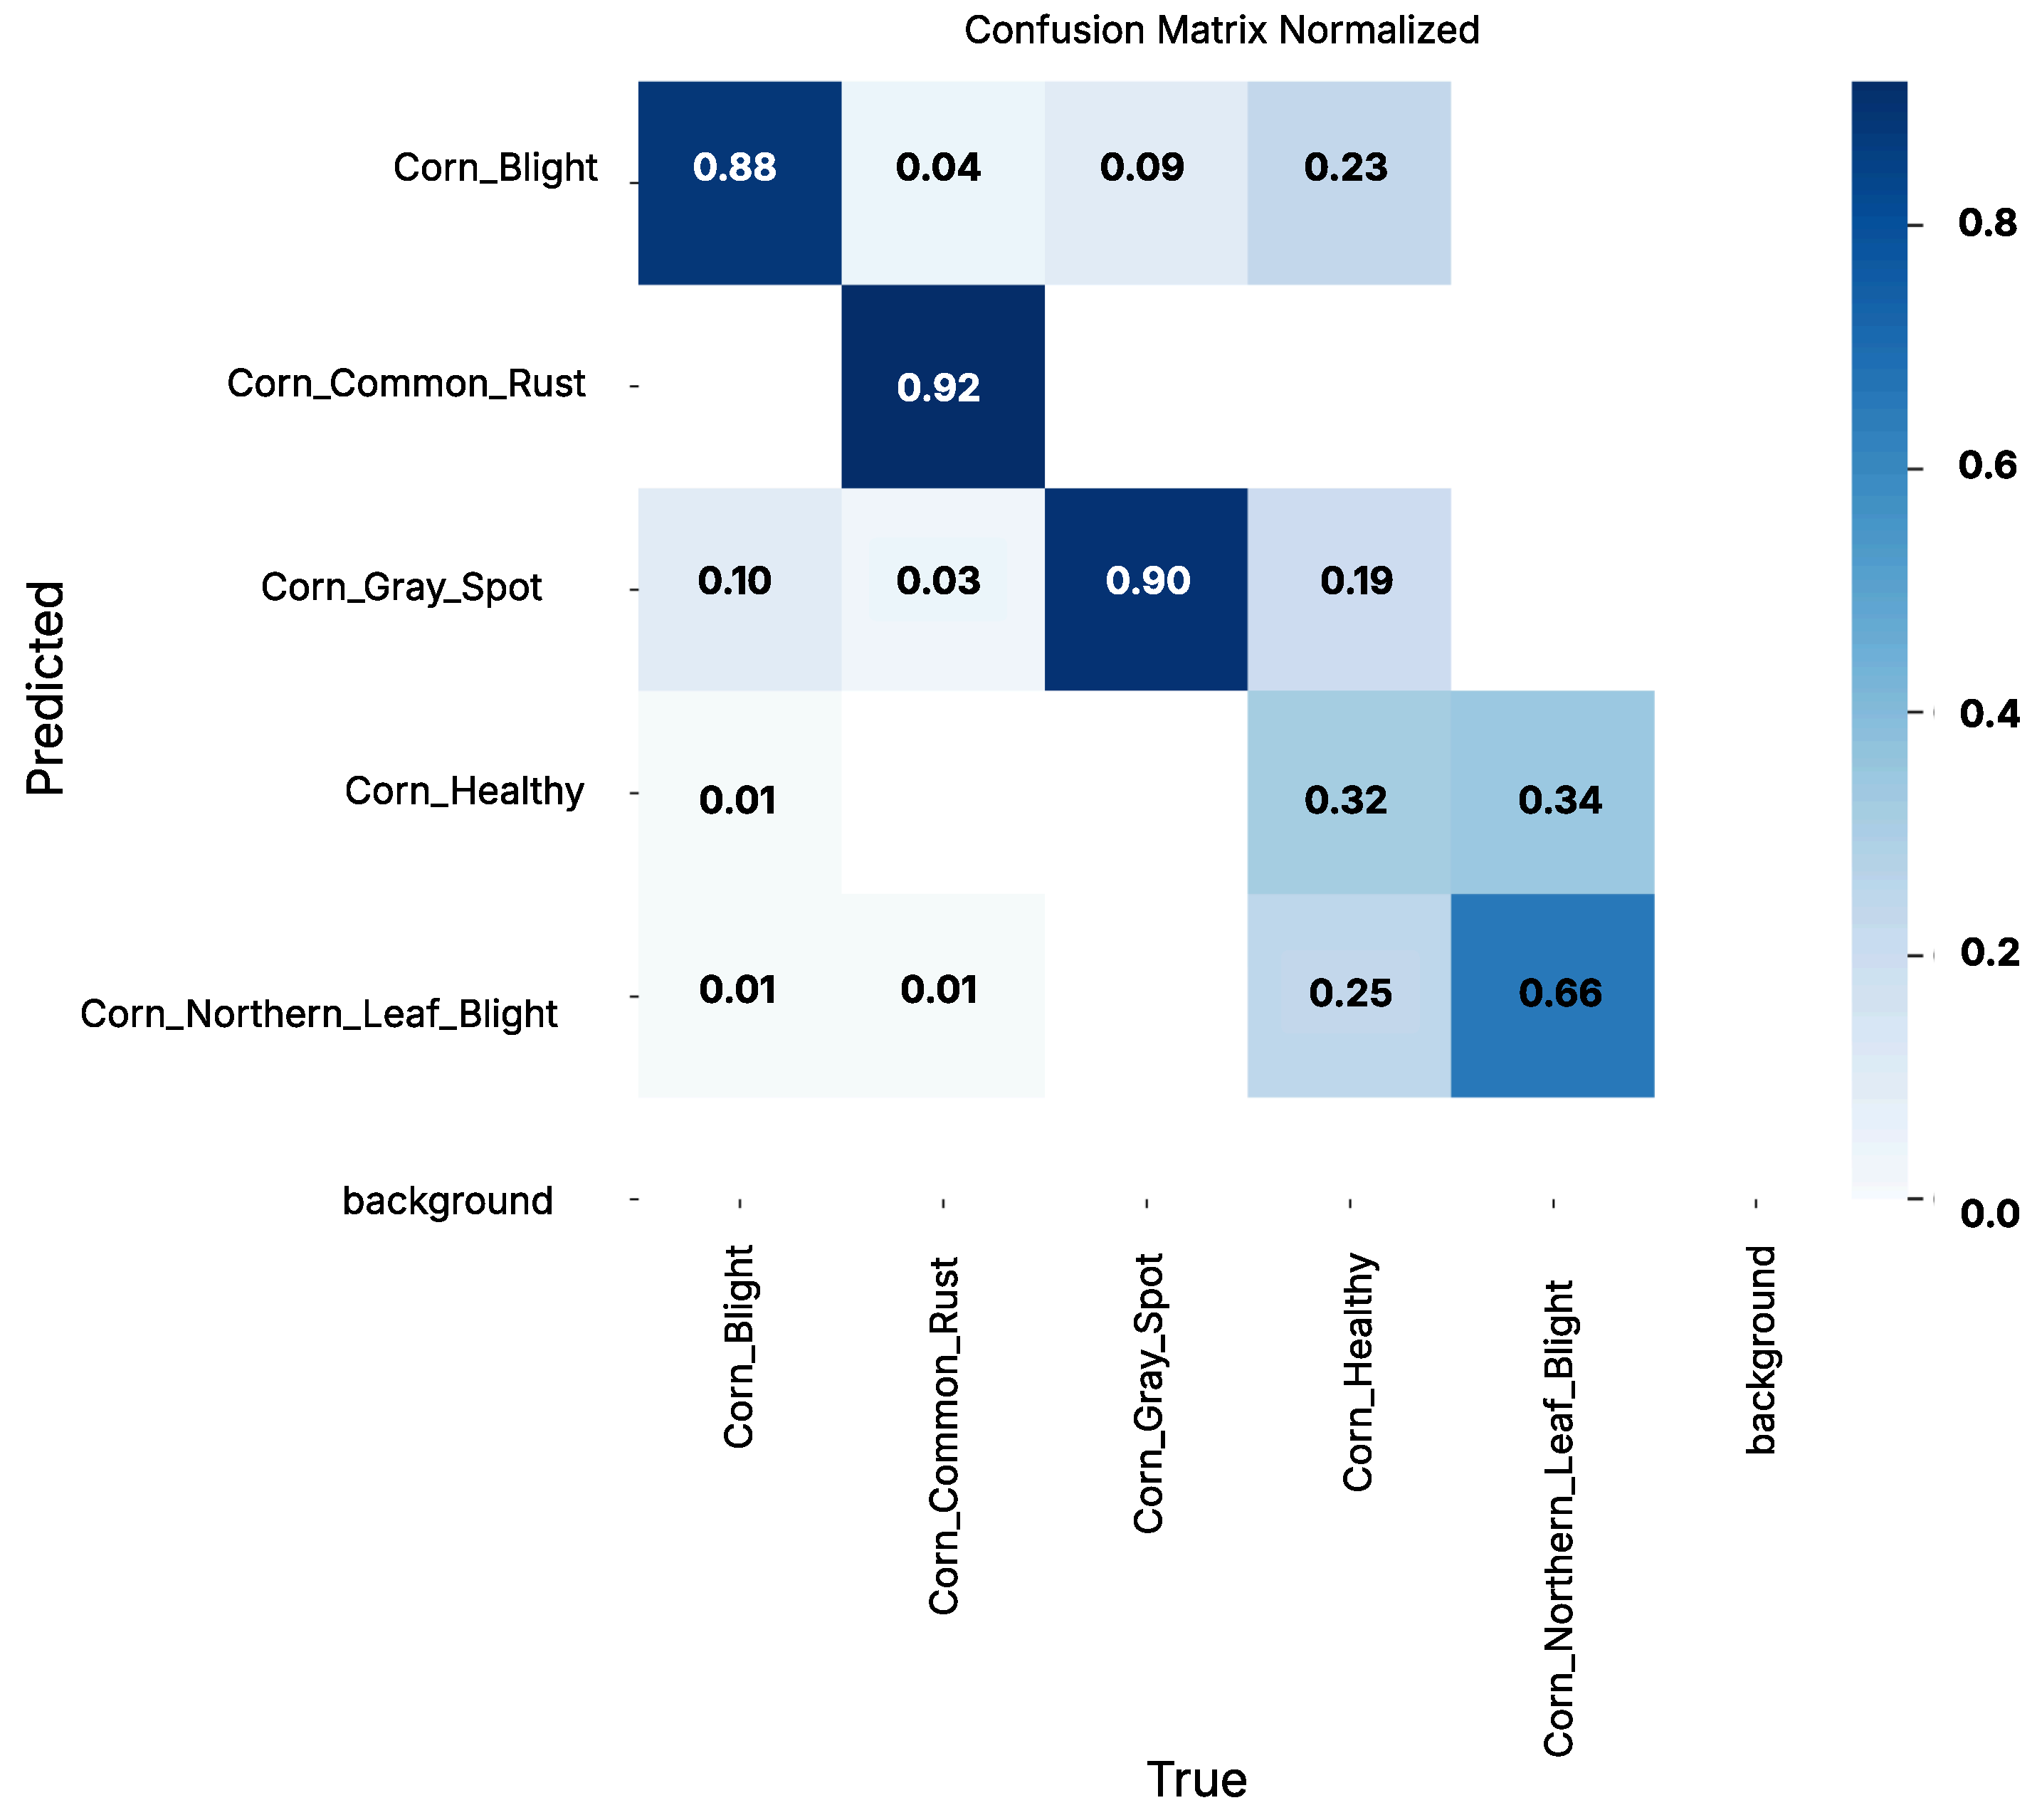
Data derived through seven different farmlands using UAV (drone) has been used to train multiple deep learning models to detect and classify crop diseases. Among all the base models trained using this dataset, ResNet-50 gave the best results with a test accuracy of 92.54%. It demonstrated outstanding precision (93.20%), recall (92.20%), and F1-score (92.40%), indicating excellent balance between true positives and false positives. Figure 10 shows the normalized confusion matrix for the final ResNet-50 model. Class imbalance and overlapping visual cues (e.g., diffuse chlorosis vs. early lesions) are the main causes of residual errors. Only 0.32 of true Healthy images are predicted as Healthy, while 0.66 of true NLB images are correctly recognized. There may occasionally be confusion between necrotic spot patterns, as indicated by smaller off-diagonal terms between Blight and Gray Leaf Spot (0.09–0.10). The models superior performance is a result of skip connections and deep residual blocks.
VGG-16 showed low performance for Healthy and NLB classes, possibly due to lower feature variety and overlap in visual patterns, but it still gave strong results with an overall accuracy of 90.12%. DenseNet-121 achieved a comparatively lower result with accuracy of 88.77%, which can be due to its underperformance when visual distinctions between classes are subtle. EfficientNet-B0 offered strong test accuracy of 91.40% with computational efficiency, which makes it suitable for real-time deployment. It benefits from SE Blocks and compound scaling, which improves its sensitivity to disease indicators.
Table 12 depicts a comparison of all CNN models used in the study to analyze UAV data primarily focusing on accuracy, precision, recall and f-score. Overall, the ensemble approach and the hybrid approach show promising results in this case.
Table 13 presents a model-wise overview of the sample size used for the UAV dataset for each class. The metrics for testing along with the accuracy are mentioned in order to draw a comparison for all CNNs utilized for this dataset in the study.
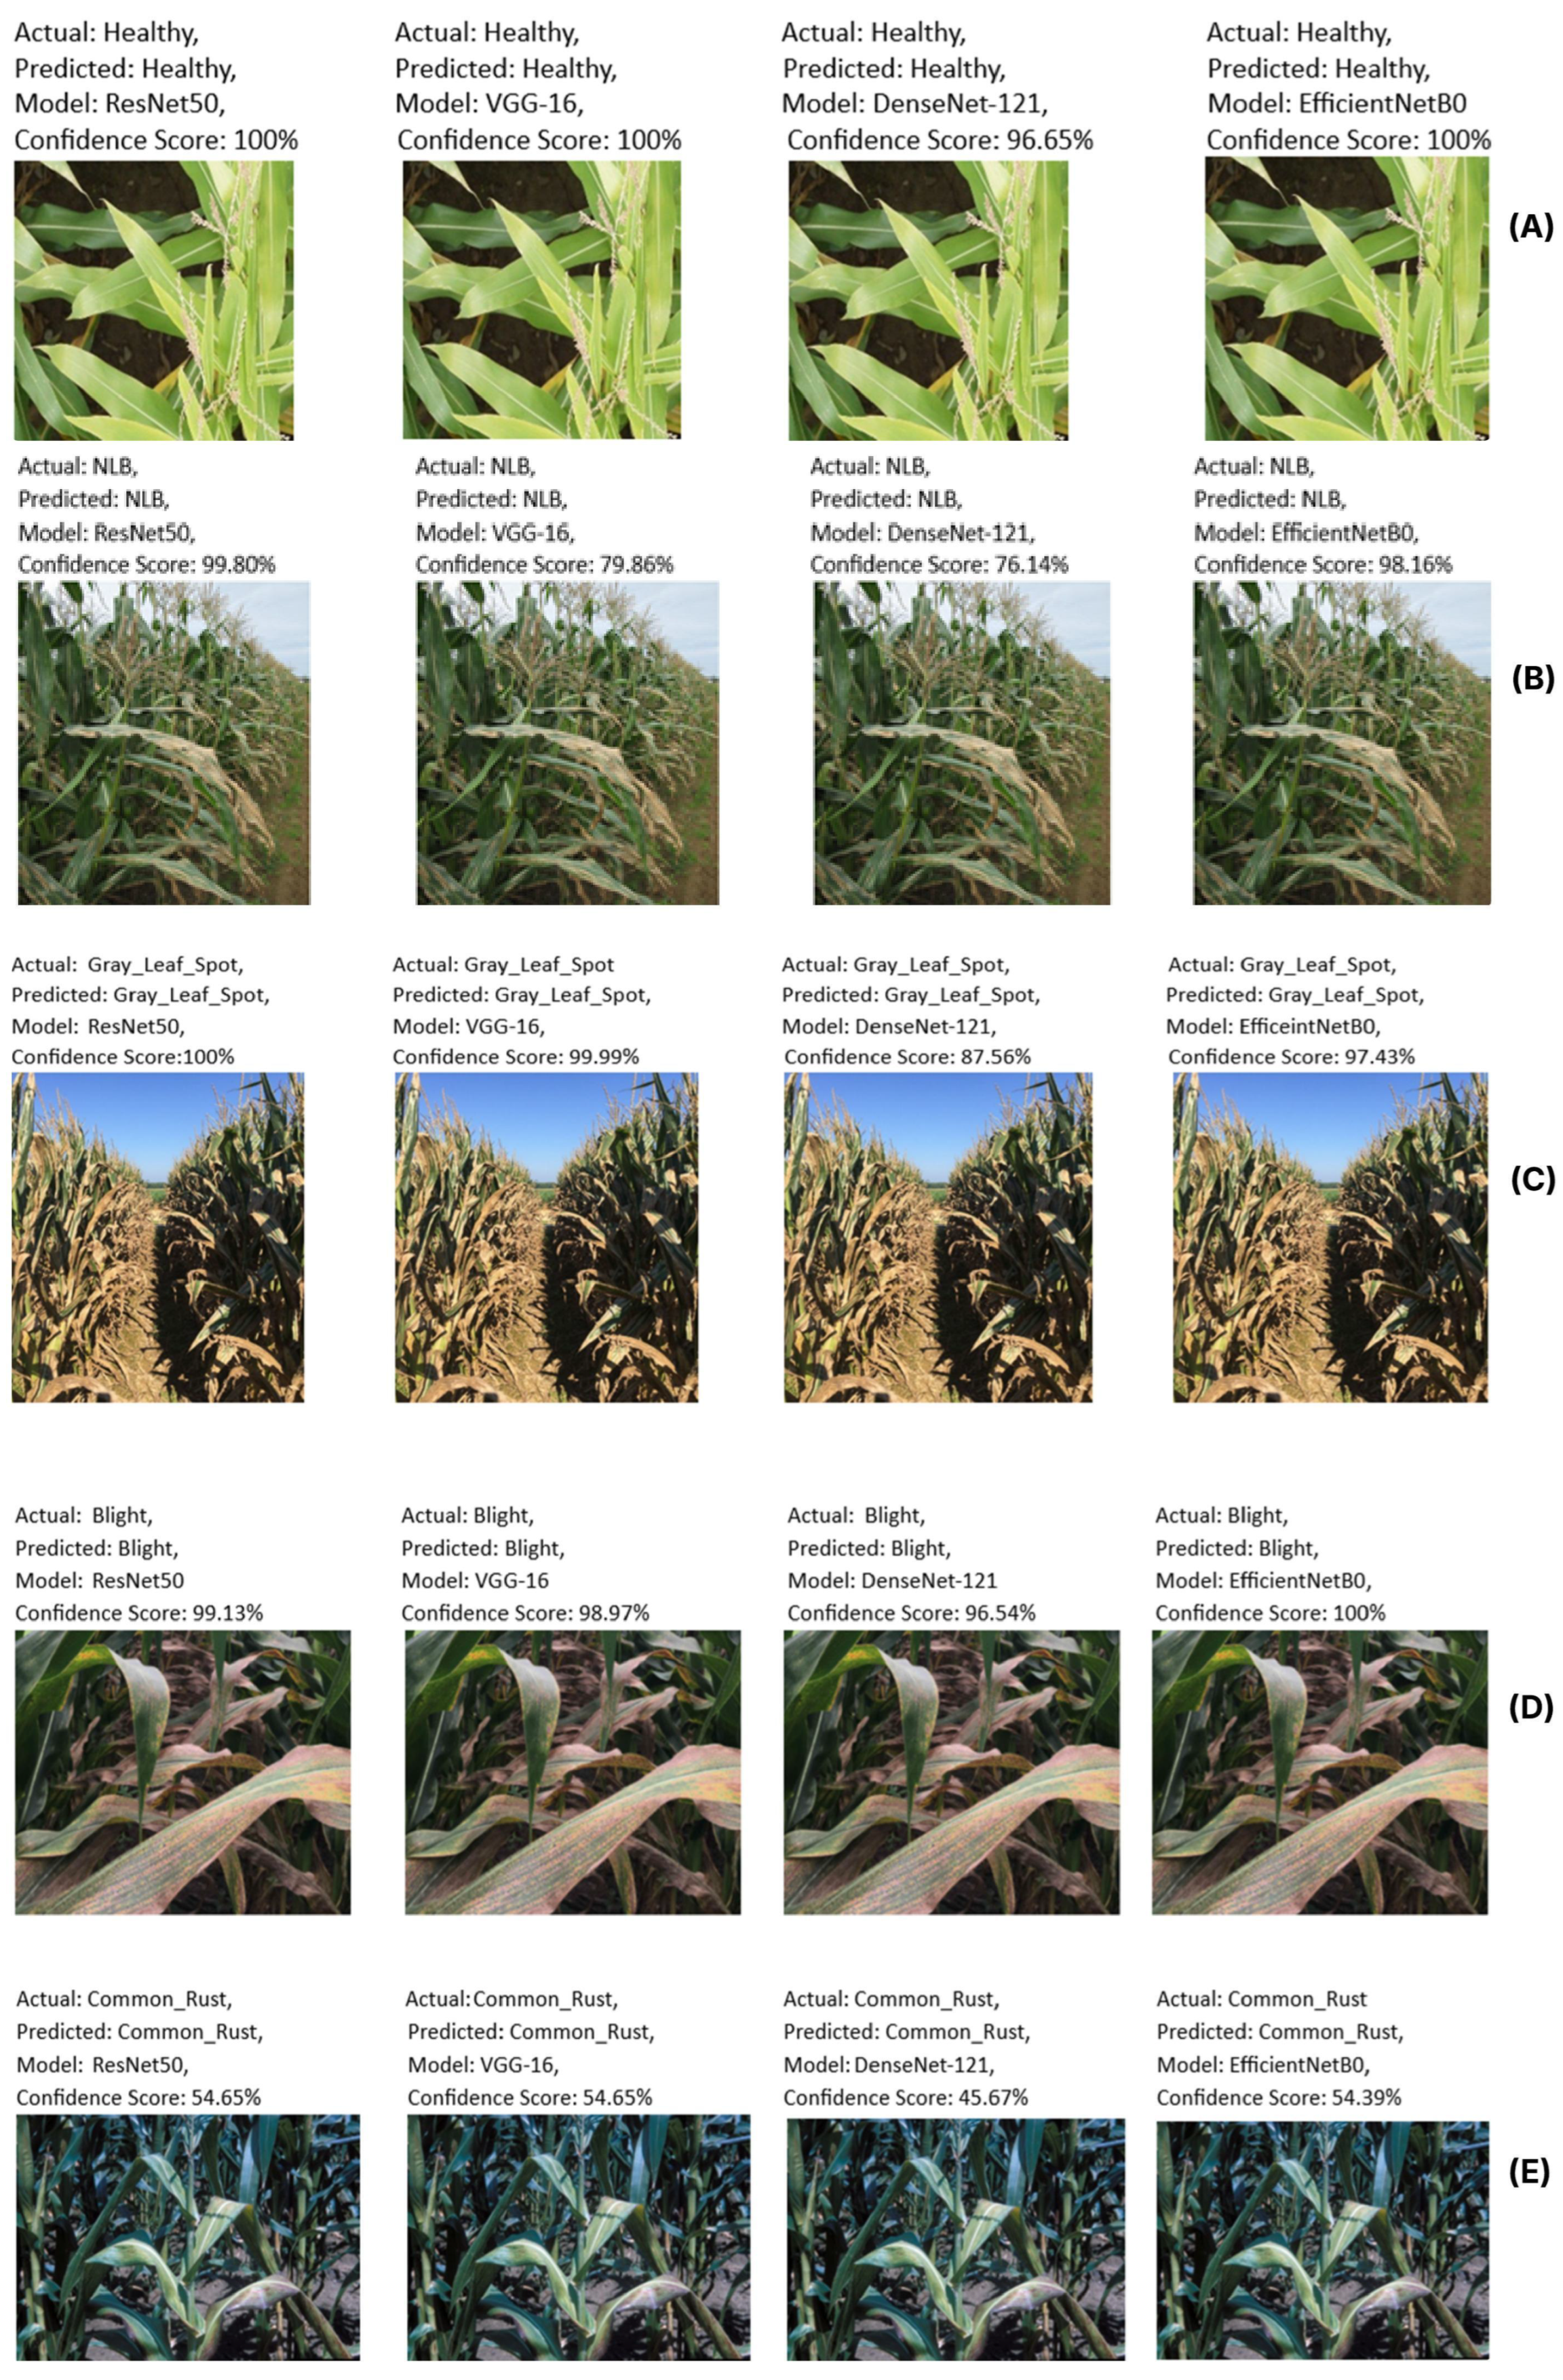
Refer to Figure A1 in Appendix A, which shows a picturized comparison of CNN models used to detect disease in maize for UAV data with confidence score as well as actual and predicted class.

4.2. Remote Sensing and Weather Data

Table 14 shows the test set performance of each trained model using remote sensing data, primarily through the use of a model ensemble, which combines predictions from multiple models to improve overall accuracy.
LSTM exhibited the best scores in crop disease severity and classification, with weighted accuracy of 80%. It was selected for its ability to handle sequential and temporal patterns in vegetation indices. LSTM proved effective with a relatively low MAPE (Mean Absolute Percentage Error) of 2.89% to 4.21%. Its limitations include low performance for “Healthy” class, which can be due to imbalance in spectral signatures. Bi-LSTM proved efficient for early-stage severity detection, but it is more computationally expensive compared to LSTM and also underperformed in complex disease classes. Performance of SVR was relatively low compared to others with high testing times, suggesting less suitability for real-time deployment. This ensemble produced stable predictions for ambiguous disease severity zones.
Some models, such as SVM and Random Forest Classifier, were initially trained using only weather data. The Random Forest Classifier gave limited accuracy of 70%, so it was later replaced with Support Vector Machine, which boosted the accuracy to 82%. The data collection for these models was done on a daily basis with the following hyperparameters: C = 100, Kernel = Linear.

4.3. Reinforcement Learning

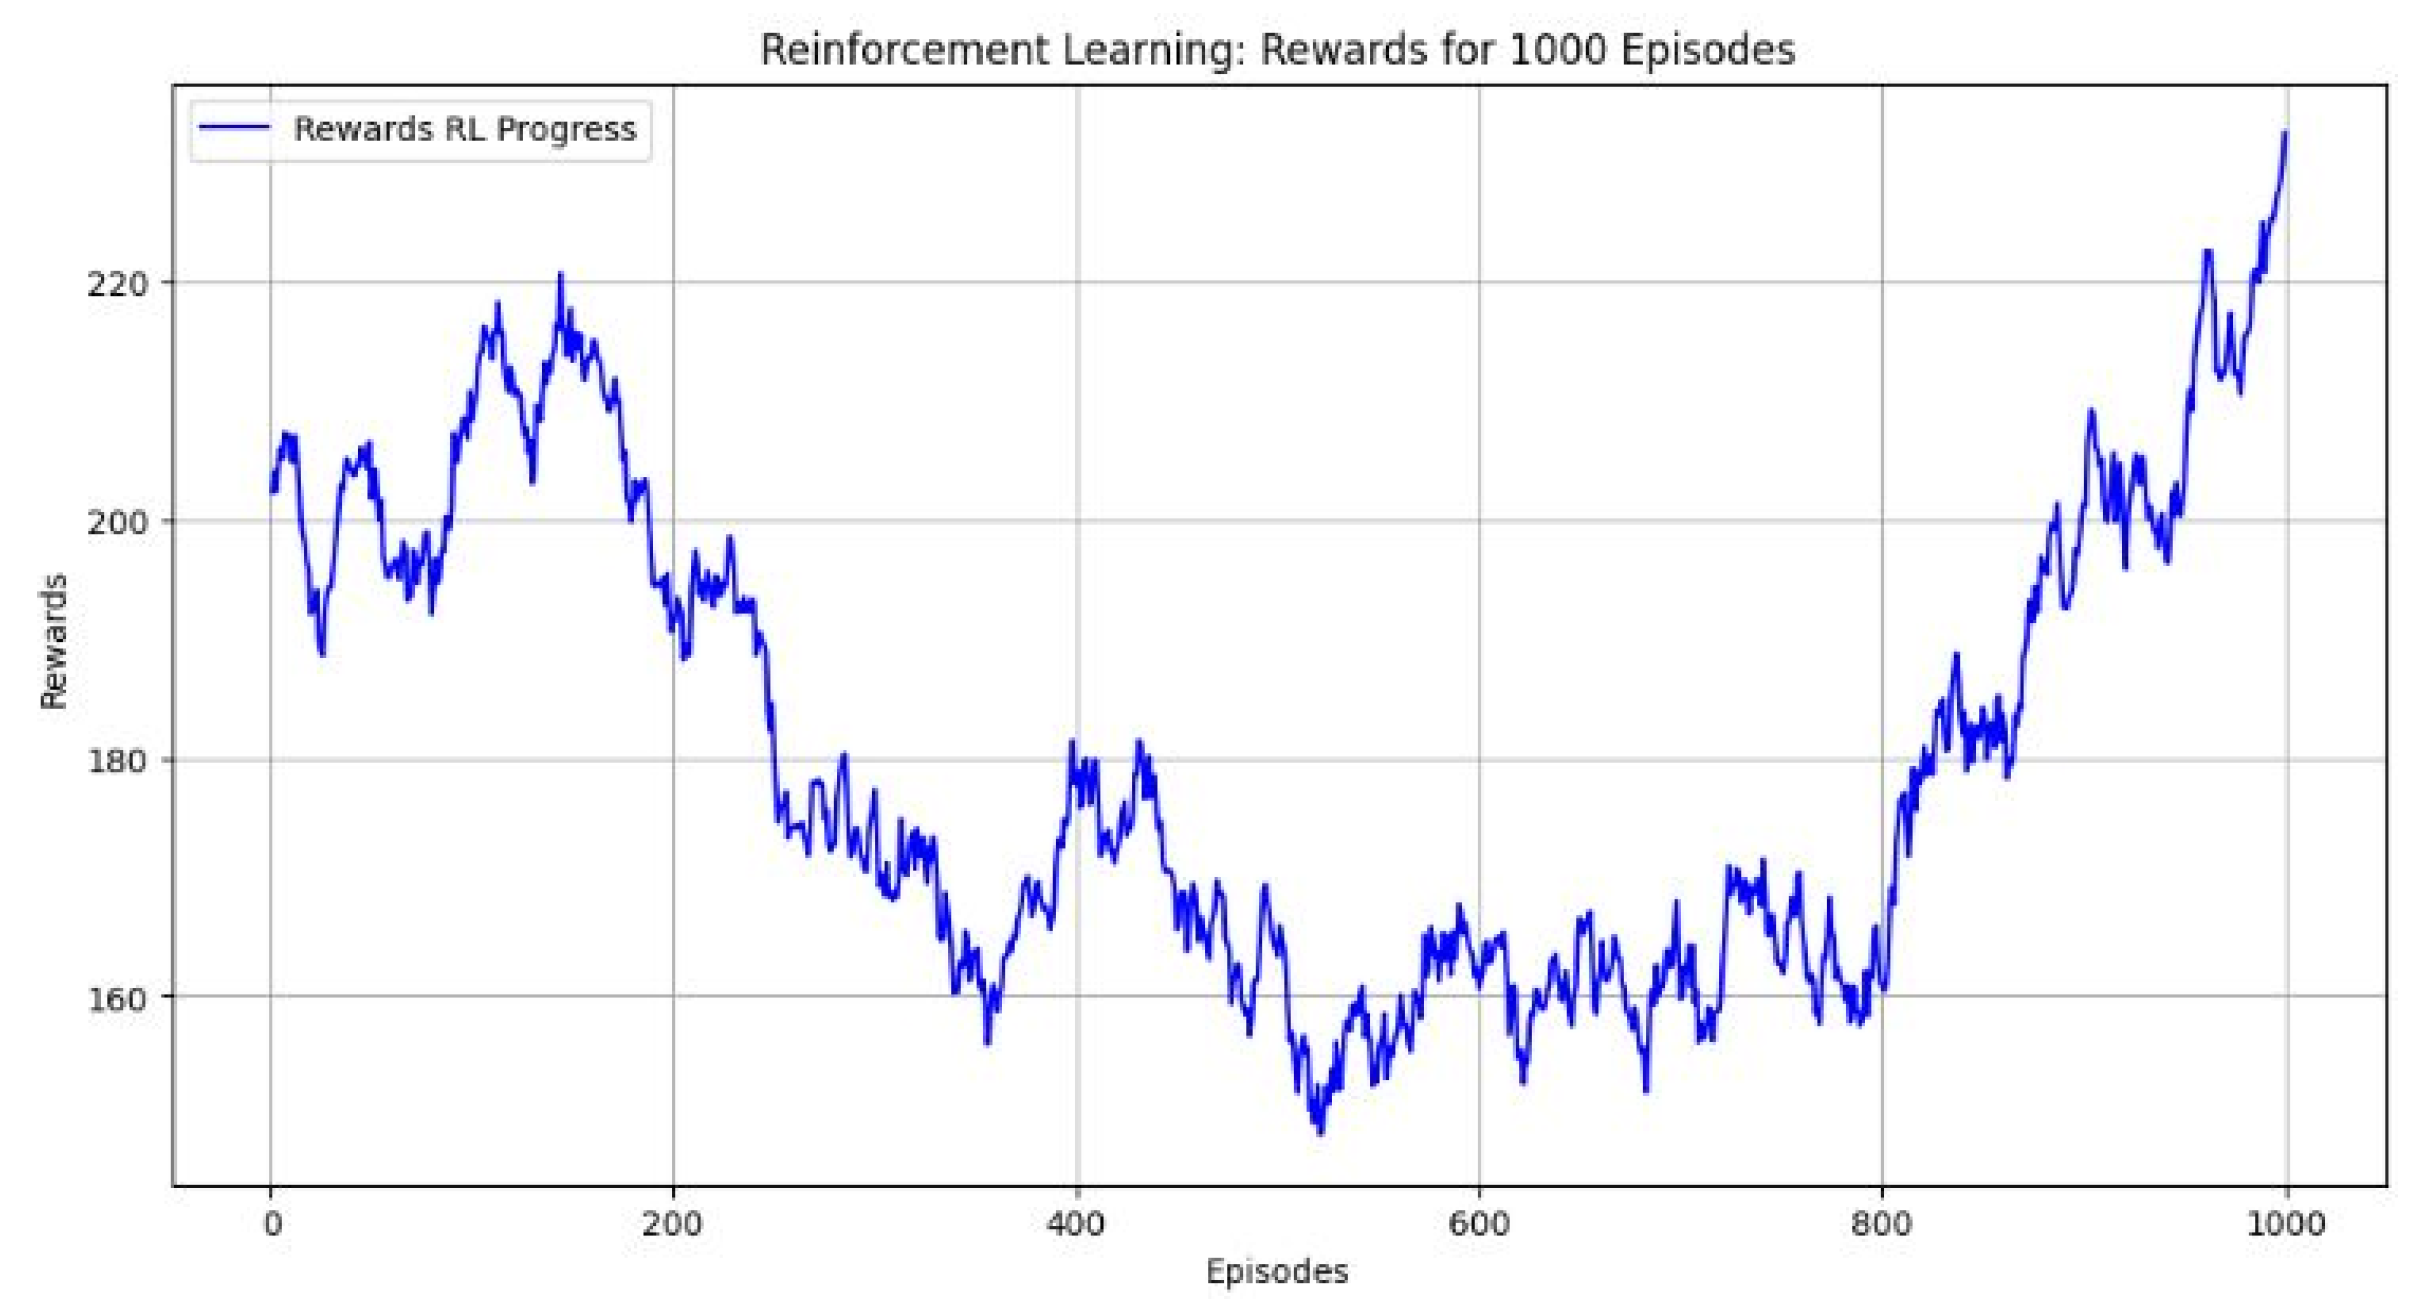
The reinforcement learning model demonstrated progressive improvement in disease classification accuracy through continuous interaction with UAV and weather data environments. The results were visualized as spatial distribution maps showing varying levels of disease severity across the farmland grid (categorized as Healthy, Low, Moderate, High). From Figure 11 we observe that the performance of our RL model increases as the number of episodes increase. The total rewards achieved by the RL model amount to 240, demonstrating significant progress during the training phase.
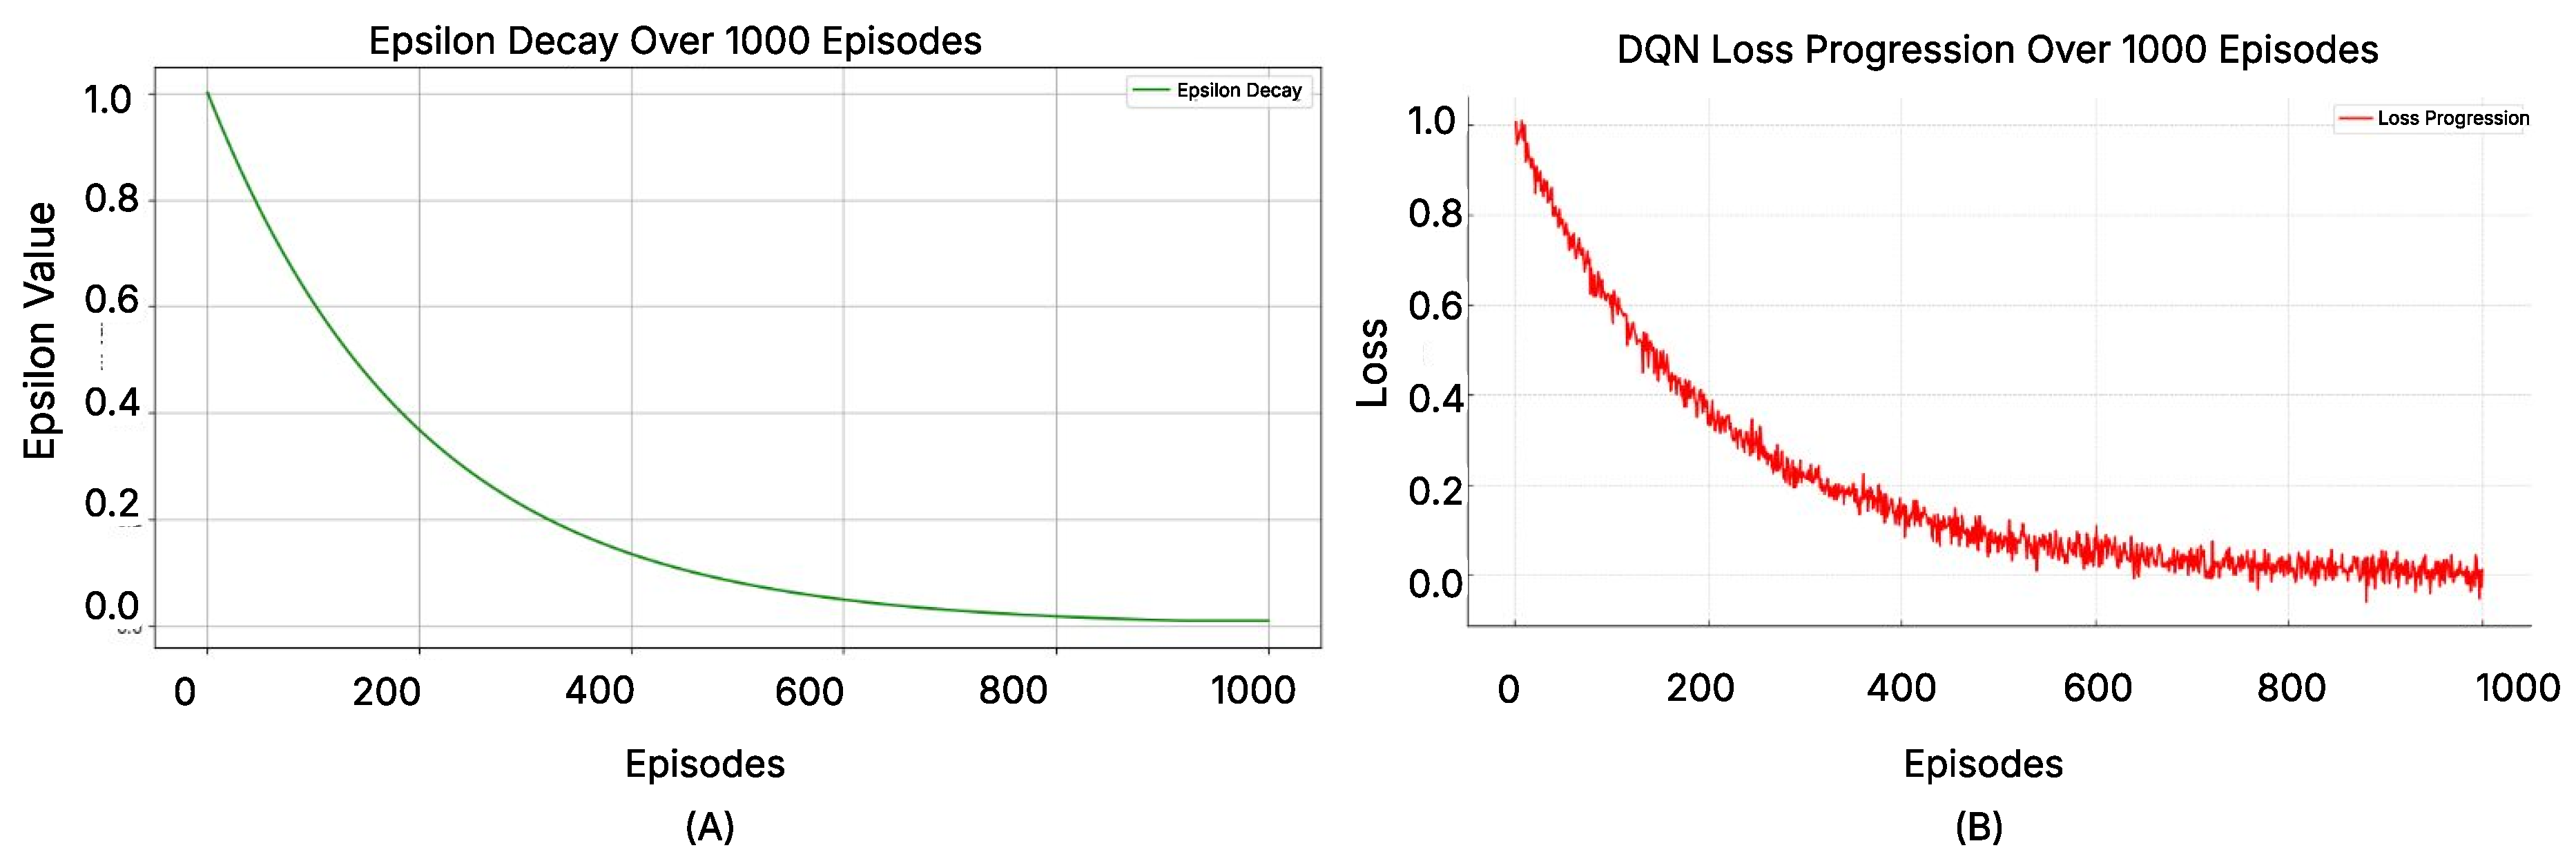
Figure 12A depicts that the Epsilon value decreases over time as the agent shifts from exploration to exploitation. The loss progression chart (Figure 12B) shows how the model error (or loss) decreases over episodes, reflecting the learning process and the improvement in predicting optimal actions. Overall, the RL approach enhanced model adaptability, especially under changing environmental conditions, proving its suitability for long-term disease monitoring.

5. Discussion

Beyond numerical results, the observed performance aligns with architectural choices for the machine learning models. Table 12 summarizes these justifications. The performance trend between models is consistent with their design architecture and improvements added for this project. For UAV imagery, the improved VGG-16 utilized depth-wise separable convolutions, batch normalization, and spatial dropout to reduce parameters and computational cost without compromising stability. This enabled detection of subtle signs such as minute spots and coloration changes in leaf tissue in high-resolution drone imagery. ResNet-50 outperformed other models by using residual connections to alleviate vanishing gradients and SE blocks to enhance disease-related features, leading to consistently high accuracy. DenseNet-121 was compact and efficient for feature reuse but still less competitive and required careful tuning in spite of task-specific layers and pooling. EfficientNet-B0 balanced performance and efficiency with the use of SE blocks and higher input resolution and could be deployed for real-time processing on UAVs and edge devices with slightly decreased accuracy compared to ResNet-50 and the hybrid ensemble.
LSTM and Bi-LSTM were effective in capturing temporal vegetation patterns for remote sensing indices. Attention mechanisms in LSTM improved on the previous detection of the onset of disease, while Bi-LSTM identified past and future relationships but with high computational needs. SVR, being simple yet efficient, was also not capable of grasping the complexity of non-linear correlations in seasonal spectral changes, further highlighting the need for sequential deep learning models as well as ensemble methods. Collectively, these results point towards the possibility of near real-time monitoring of crop disease for enabling immediate and specific management in the field.
Disease detection is improved by Model Ensemble techniques; this method achieved perfect accuracy for “Common Rust,” “Blight,” and “Gray Leaf Spot.” With remarkable accuracy of 98.32% for “Gray Leaf Spot” and 95.68% for “Blight,” “NLB” also shows relatively lower confidence scores (around 82–88%), suggesting that this disease type may benefit from additional training data or enhanced feature extraction methods. Ensemble models are perfect for high-stakes applications that need the highest level of accuracy because they leverage the advantages of distinct architectures to achieve thorough and balanced illness diagnosis. The improved VGG-16 and ResNet-50 models effectively extracted important features from images. We adjusted different activation functions, changed the number of neurons, and froze some layers to improve performance.
We created separate models to analyze remote sensing data, which includes vegetation indices. We used LSTM, SVR, and Bi-LSTM models because they effectively identify patterns and relationships in the data.
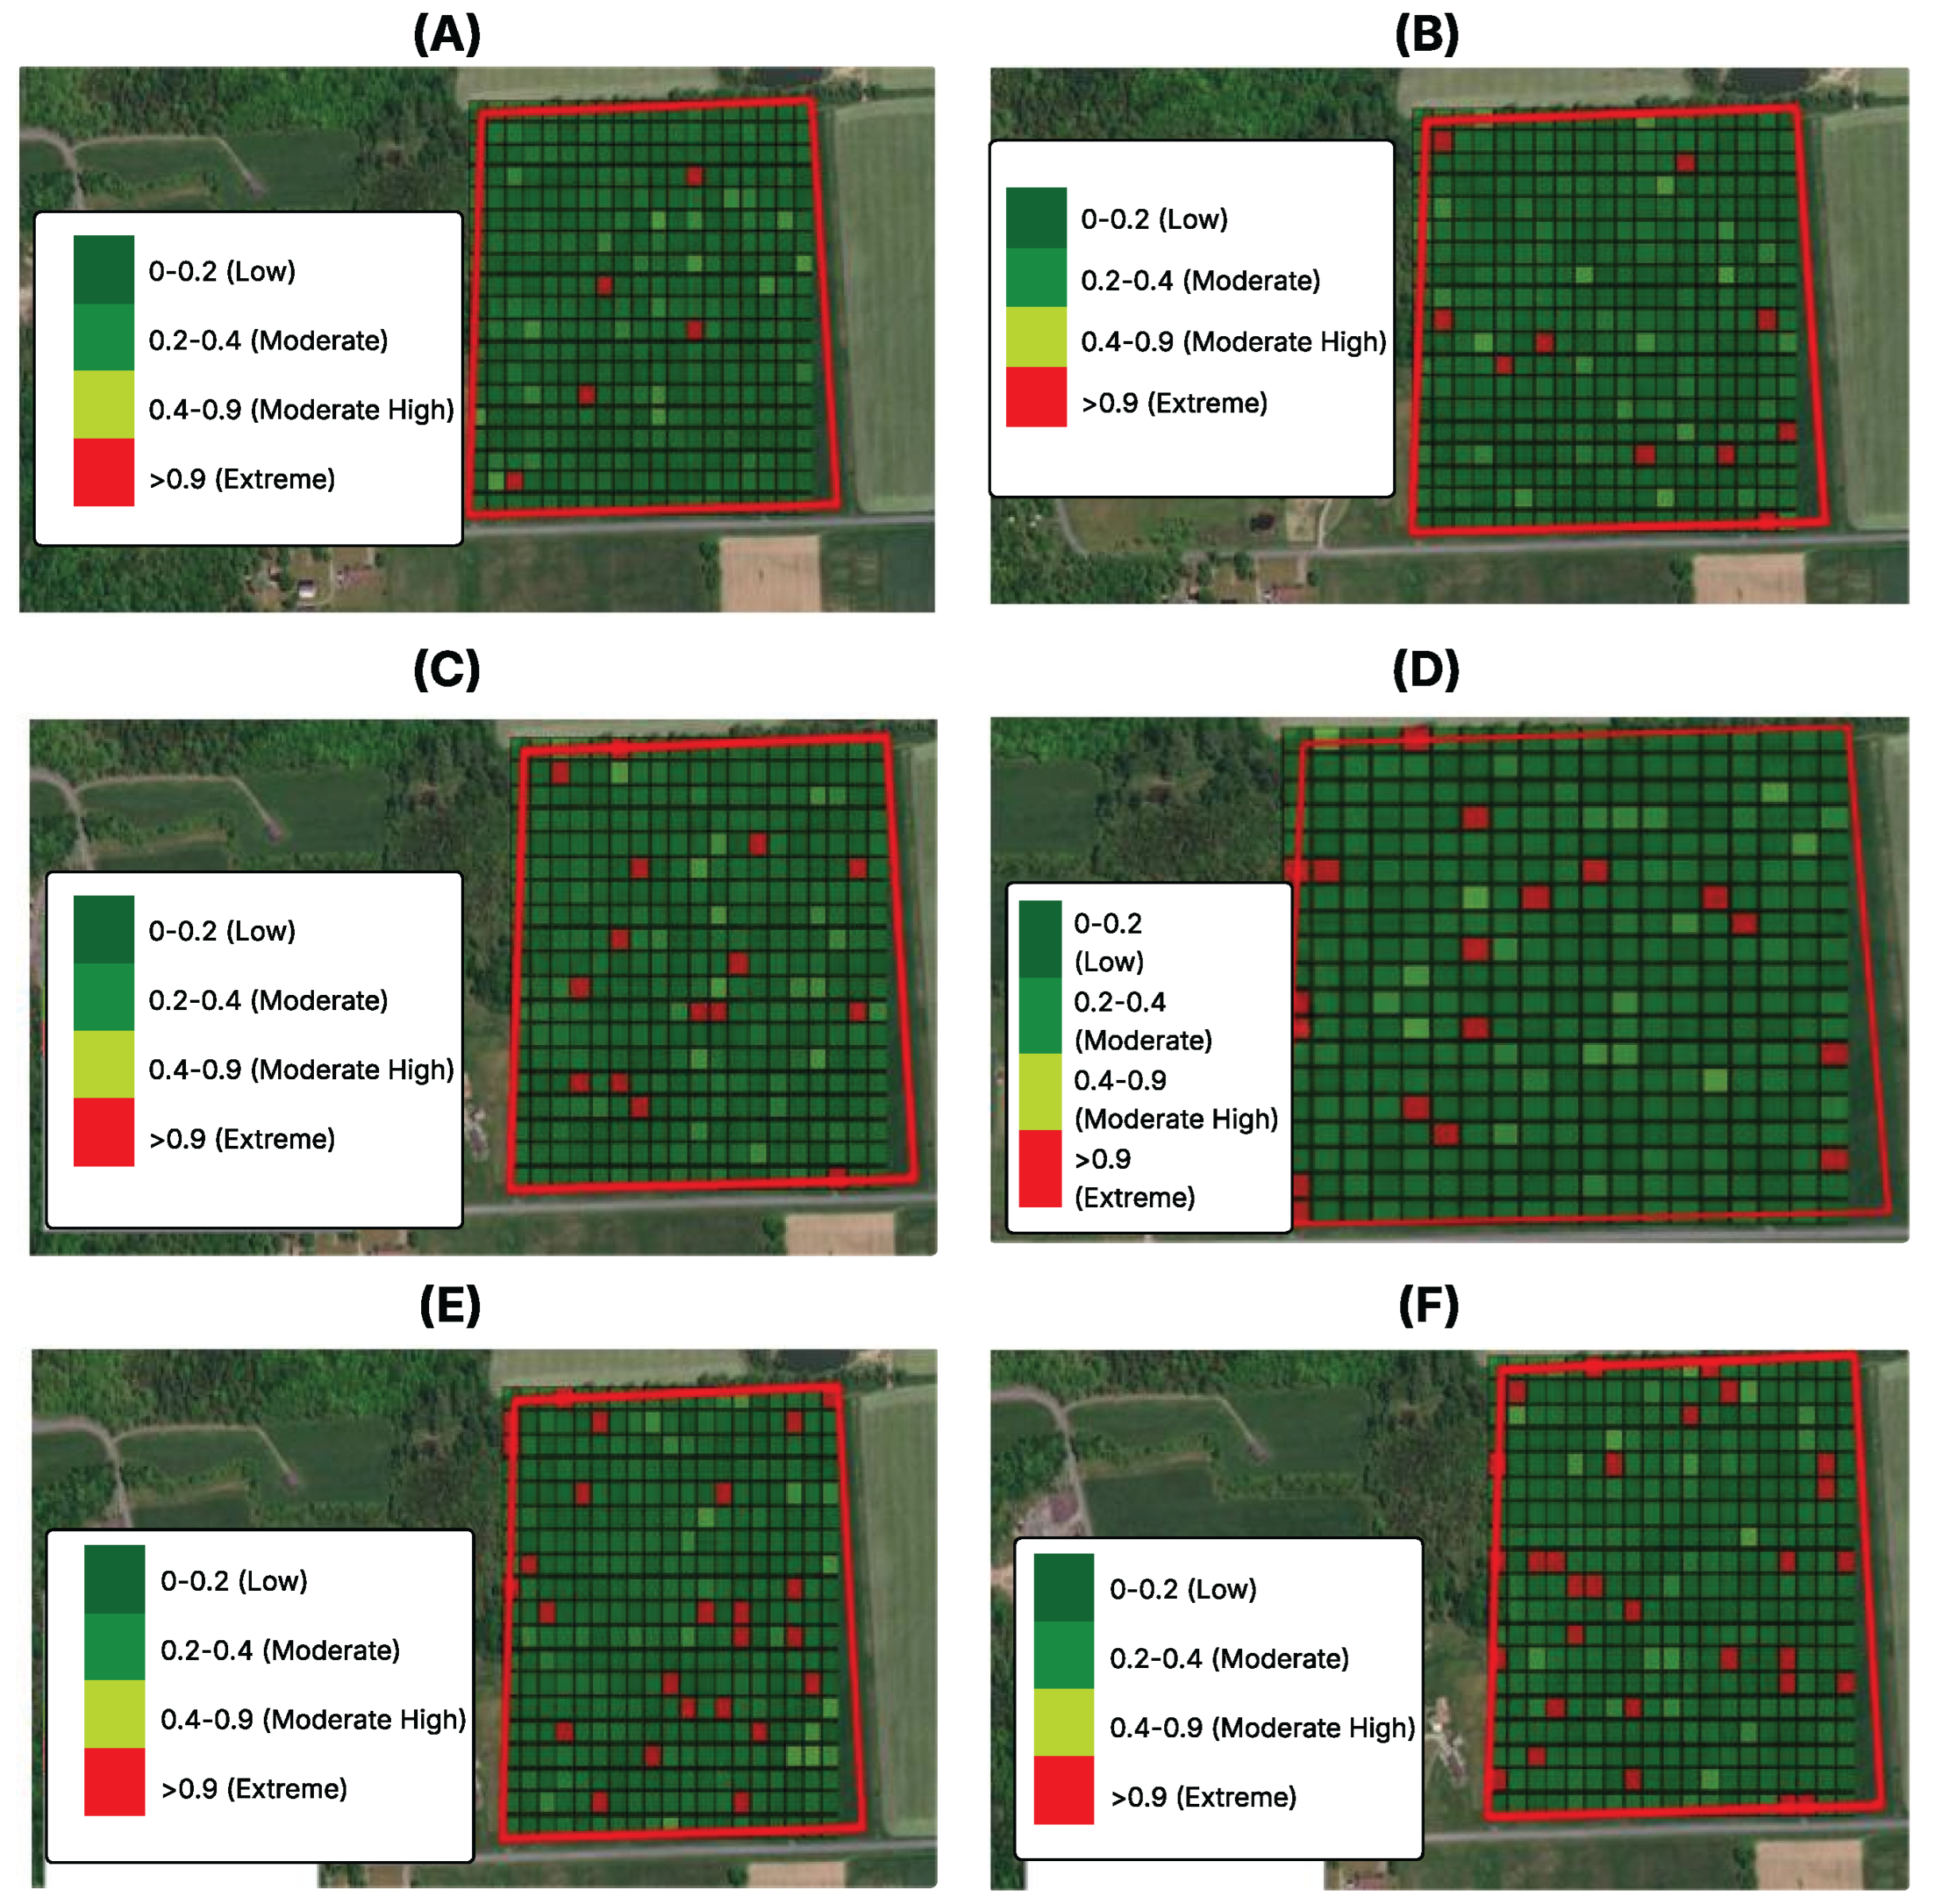
The pipeline also issues severity-based alerts and supports time-lapse review of historical changes, translating maps into immediate, severity-triggered actions and follow-up monitoring. These severity-mapped hotspots transform the models results into visual aid for the user to provide actionable insights daily. Because inference is near real-time (1.7 s), these interventions are operationally feasible in the field (Figure 13).
UAV layers reveal fine, within-field disease patches for precise targeting, while satellite layers provide broader coverage; together they guide rapid, localized response and season-long management. Certain challenges were faced due to factors such as limited availability of labeled drone datasets and remote sensing data collection. The unavailability of labeled drone datasets made the task difficult, along with low-quality remote sensing data from MODIS satellites. Detailed features of the predictions, specifically daily disease checking, had been affected. Difficulty was faced during optimization of models for accuracy and processing.

Future Works

Future developments should be cast in light of the inclusion of real drone-captured imagery of actual field conditions and the extension of the model to handle other diseases for more crop varieties, in order to have wide applicability and usefulness for a system. Inclusion of data from more parts of the world would not only refine the accuracy of the model, but also enhance its applicability and relevance globally, thus making the system more usable by a wider audience. In addition, a multi-modal approach for sensor fusion can also be implemented to improve the robustness of the system. This involves creating a parallel branch to process numerical data like temperature, rainfall, and remote sensing indices (NDVI, NDWI) alongside the UAV images. Both types of data can be processed independently to extract high level features, which can be used to get a more comprehensive and accurate determination of classes. Also, currently remote sensing datasets are being used for generating severity maps. To further enhance the severity maps, a combination of UAV data along with remote sensing data can be used. Development of a web portal with interactive features will greatly enhance the ease of use of a real-time crop disease prediction system. Integration of features for disease classification and severity mapping will greatly enhance the functionality of the tool. Further development of functionalities to show disease progression results will make it a powerful aid for decision-making in agriculture. Collaborations with agricultural researchers and technologists can further enhance and refine the model.

6. Conclusions

This study provides a robust solution for accurate disease detection, classification, and severity mapping for water-intensive crops. It uses a hybrid model, together with reinforcement learning to predict diseases with an accuracy of 93.64%. Usage of different datasets like UAV imagery, remote sensing data, and weather data provide a comprehensive solution which is scalable and offers real-time processing. The processing time for the proposed model is 1.7 s, which would help farmers take immediate action to contain the spread of the disease. These results demonstrate the feasibility of near real-time crop disease monitoring that can support rapid response and management in agricultural settings. The inclusion of advanced deep learning models such as VGG-16, ResNet-50, and LSTM along with data augmentation techniques improved the models efficiency and its ability to generalize. Also, the integration of vegetation indices further increased the predictive power of models, and this diverse data approach enabled a more detailed exploration of spatial distribution trends due to incorporation of severity maps. Certain models, such as ResNet-50 and EfficientNet-B0, depicted high confidence levels, particularly in detecting Common Rust and Blight, where they achieved confidence scores of 100%. However, there is slight variation in confidence for “Healthy” crops, with scores around 85–86% across models, indicating that distinguishing healthy plants from diseased ones remains a nuanced task. Disease detection is further improved by adapting an ensemble model, which resulted in much higher accuracy. Unlike other general CNN architectures, we worked on improved versions of models which were specifically designed for big data processing in agriculture and multi-class classification problems. To further enhance the predictions from each model, we added a Meta Learner layer. This layer combines the models’ outputs, resulting in better classification accuracy. Each model is fine-tuned for its specific type of data. By using different models for drone data and remote sensing data, we increase the reliability of disease detection and classification. This supports early action and better crop management, leading to better disease management and reducing crop damage. A significant achievement and the novelty in this study was using innovative reinforcement learning to predict crop disease for remote sensing data and the use of a hybrid ensemble model, which produced good results. We used UAV data annotations as ground truth, and based on location coordinates for UAV images and ground truth labels, we designed the innovative reward policy, as listed in Table 11. Using these innovative techniques to predict disease not only helps farmers with instant analysis but also significantly reduces time in decision-making to protect crops. One of our key achievements was the development of disease distribution maps that demonstrate where diseases are occurring within crops and how severe these are on particular farmland. We visualized the spread of these diseases much more accurately using geospatial data and machine learning. This would help farmers and those in the agriculture profession to make better decisions.
Speed had to be balanced while working with large datasets. Overall, the study provides insights on a robust system that provides valuable insights on crop disease detection, classification, and severity analysis, which is important to conserve ecosystems and reduce the rate of chemical run-off. It contributes to building a strong farming system that can mitigate the effects of crop diseases, especially in water-intensive crops like maize, which promotes a sustainable future.

Author Contributions

Conceptualization, J.G.; Methodology, K.G., M.H., P.A. and S.G.; Software, K.G., M.H., P.A. and S.G.; Validation, K.G., M.H., P.A. and S.G.; Formal analysis, K.G., M.H., P.A. and S.G.; Investigation, K.G., M.H., P.A. and S.G.; Resources, J.G.; Data curation, K.G., M.H., P.A. and S.G.; Writing—original draft, N.B.; Writing—review & editing, N.B.; Visualization, K.G.; Supervision, J.G.; Project administration, K.G., M.H., P.A. and S.G. All authors have read and agreed to the published version of the manuscript.

Funding

This research received no external funding.

Data Availability Statement

The original contributions presented in the study are included in the article, further inquiries can be directed to the corresponding author.

Conflicts of Interest

The authors declare no conflict of interest.

Abbreviations

The following abbreviations are used in this manuscript:
DLDeep Learning
DTDecision Trees
MAPEMean Absolute Percentage Error
NLBNorthern Leaf Blight

Appendix A. Additional Figures

Figure A1. Output result classes for each model: (A) Healthy Crop; (B) Northern Leaf Blight Disease; (C) Gray Leaf Spot Disease; (D) Blight Disease; (E) Common Rust Disease.
Remotesensing 17 03427 g0a1

References

  1. Serraj, R.; Pingali, P. (Eds.) Agriculture and Food Systems to 2050: Global Trends, Challenges and Opportunities; World Scientific: London, UK, 2018. [Google Scholar] [CrossRef]
  2. Kuradusenge, M.; Hitimana, E.; Hanyurwimfura, D.; Rukundo, P.; Mtonga, K.; Mukasine, A.; Uwitonze, C.; Ngabonziza, J.; Uwamahoro, A. Crop Yield Prediction Using Machine Learning Models: Case of Irish Potato and Maize. Agriculture 2023, 13, 225. [Google Scholar] [CrossRef]
  3. Van Klompenburg, T.; Kassahun, A.; Catal, C. Crop yield prediction using machine learning: A systematic literature review. Comput. Electron. Agric. 2020, 177, 105709. [Google Scholar] [CrossRef]
  4. Mahlein, A.K. Plant disease detection by imaging sensors–parallels and specific demands for precision agriculture and plant phenotyping. Plant Dis. 2016, 100, 241–251. [Google Scholar] [CrossRef] [PubMed]
  5. Wani, J.A.; Sharma, S.; Muzamil, M.; Ahmed, S.; Sharma, S.; Singh, S. Machine learning and deep learning based computational techniques in automatic agricultural diseases detection: Methodologies, applications, and challenges. Arch. Comput. Methods Eng. 2022, 29, 641–677. [Google Scholar] [CrossRef]
  6. Iheke, O.R.; Ihuoma, U.U. Effect of Urbanization on Agricultural Production in Abia State;International Journal of Agricultural Science. Res. Technol. Ext. Educ. Syst. 2016, 5, 83. [Google Scholar]
  7. Stewart, E.L.; Wiesner-Hanks, T.; Kaczmar, N.; DeChant, C.; Wu, H.; Lipson, H.; Nelson, R.J.; Gore, M.A. Quantitative Phenotyping of Northern Leaf Blight in UAV Images Using Deep Learning. Remote Sens. 2019, 11, 2209. [Google Scholar] [CrossRef]
  8. Attallah, O. Deep learning-based model for paddy diseases classification by thermal infrared sensor: An application for precision agriculture. ISPRS Annals of Photogrammetry. ISPRS Ann. Photogramm. Remote Sens. Spatial Inf. Sci. 2023, X-1/W1-2023, 779–784. [Google Scholar] [CrossRef]
  9. Nagasubramanian, K.; Jones, S.; Singh, A.K.; Sarkar, S.; Singh, A.; Ganapathysubramanian, B. Plant disease identification using explainable 3D deep learning on hyperspectral images. Plant Methods 2019, 15, 98. Available online: https://plantmethods.biomedcentral.com/articles/10.1186/s13007-019-0479-8 (accessed on 27 November 2024).
  10. Navaneethan, S.; Sampath, J.; Kiran, S. Development of a Multi-Sensor Fusion Framework for Early Detection and Monitoring of Corn Plant Diseases. In Proceedings of the 2023 2nd International Conference on Automation, Computing and Renewable Systems (ICACRS), Pudukkottai, India, 11–13 December 2023; pp. 856–861. [Google Scholar] [CrossRef]
  11. Kitpo, N.; Inoue, M.M. Early Rice Disease Detection and Position Mapping System using Drone and IoT Architecture. In Proceedings of the 2018 12th South East Asian Technical University Consortium (SEATUC), Yogyakarta, Indonesia, 12–13 March 2018; pp. 1–5. [Google Scholar] [CrossRef]
  12. Shahi, T.; Xu, C.Y.; Neupane, A.; Guo, W. Recent Advances in Crop Disease Detection Using UAV and Deep Learning Techniques. Remote Sens. 2023, 15, 2450. [Google Scholar] [CrossRef]
  13. Prasad, A.; Mehta, N.; Horak, M.; Bae, W. A Two-Step Machine Learning Approach for Crop Disease Detection Using GAN and UAV Technology. Remote Sens. 2022, 14, 4765. [Google Scholar] [CrossRef]
  14. Vardhan, J.; Swetha, K.S. Detection of healthy and diseased crops in drone captured images using Deep Learning. arXiv 2023, arXiv:2305.13490. [Google Scholar] [CrossRef]
  15. Shill, A.; Rahman, M.A. Plant Disease Detection Based on YOLOv3 and YOLOv4. In Proceedings of the 2021 International Conference on Automation, Control and Mechatronics for Industry 4.0 (ACMI), Rajshahi, Bangladesh, 8–9 July 2021; pp. 1–6. [Google Scholar] [CrossRef]
  16. Chin, R.; Catal, C.; Kassahun, A. Plant disease detection using drones in precision agriculture. Precis. Agric. 2023, 24, 1663–1682. [Google Scholar] [CrossRef]
  17. Johannes, A.; Picon, A.; Alvarez-Gila, A.; Echazarra, J.; Rodriguez-Vaamonde, S.; Navajas, A.D.; Ortiz-Barredo, A. Automatic plant disease diagnosis using mobile capture devices, applied on a wheat use case. Comput. Electron. Agric. 2017, 138, 200–209. [Google Scholar] [CrossRef]
  18. Ma, J.; Du, K.; Zheng, F.; Zhang, L.; Gong, Z.; Sun, Z. A recognition method for cucumber diseases using leaf symptom images based on deep convolutional neural network. Comput. Electron. Agric. 2018, 154, 18–24. [Google Scholar] [CrossRef]
  19. Kowalska, A.; Ashraf, H. Advances in Deep Learning Algorithms for Agricultural Monitoring and Management. Appl. Res. Artif. Intell. Cloud Comput. 2021, 6, 68–88. [Google Scholar]
  20. Liang, Q.; Xiang, S.; Hu, Y.; Coppola, G.; Zhang, D.; Sun, W. PD2SE-Net: Computer-assisted plant disease diagnosis and severity estimation network. Comput. Electron. Agric. 2019, 157, 518–529. [Google Scholar] [CrossRef]
  21. John, A.; Bhyregowda, P.; Dutta, M.; Liu., J.; Gao, J. Advanced Carbon Monitoring in Agriculture using Remote Sensing and Machine Learning Techniques. In Proceedings of the 2025 IEEE Conference on Artificial Intelligence (CAI), Santa Clara, CA, USA, 5–7 May 2025. [Google Scholar] [CrossRef]
  22. Gao, Z.; Luo, Z.; Zhang, W.; Lv, Z.; Xu, Y. Deep Learning Application in Plant Stress Imaging: A Review. AgriEngineering 2020, 2, 430–446. [Google Scholar] [CrossRef]
  23. DeChant, C.; Wiesner-Hanks, T.; Chen, S.; Stewart, E.L.; Yosinski, J.; Gore, M.A.; Nelson, R.J.; Lipson, H. Automated identification of northern leaf blight-infected maize plants from field imagery using deep learning. Phytopathology 2017, 107, 1426–1432. [Google Scholar] [CrossRef]
  24. Devi, E.A.; Gopi, S.; Padmavathi, U.; Arumugam, S.R.; Premnath, S.P.; Muralitharan, D. Plant disease classification using CNN-LSTM techniques. In Proceedings of the 2023 5th International Conference on Smart Systems and Inventive Technology (ICSSIT), Tirunelveli, India, 23–25 January 2023; IEEE: Piscataway, NJ, USA, 2023; pp. 1225–1229. [Google Scholar] [CrossRef]
  25. UAV dataset Musgrave Research Farms. Available online: https://www.kaggle.com/datasets/alexanderyevchenko/corn-disease-drone-images (accessed on 1 December 2024).
  26. Musgrave Research Farm. Available online: https://cals.cornell.edu/agricultural-experiment-station/research-farms/musgrave-research-farm (accessed on 27 November 2024).
  27. Multispectral Remote Sensing with MODIS Data in Python |Earth Lab. (n.d.). Earth Data Science. Available online: https://www.earthdatascience.org/courses/use-data-open-source-python/multispectral-remote-sensing/modis-data-in-python (accessed on 27 November 2024).
  28. Available online: https://www.ncei.noaa.gov/access/search/data-search/local-climatological-data?pageNum=1&startDate=2017-12-31T00:00:00&endDate=2018-12-31T23:59:59&bbox=43.120,-76.219,42.976,-76.075 (accessed on 27 November 2024).
  29. Hunt, E.R.; Rock, B.N. Detection of changes in leaf water content using near- and middle-infrared reflectances. Remote Sens. Environ. 1989, 30, 43–54. [Google Scholar] [CrossRef]
  30. Gitelson, A.A.; Merzlyak, M.N.; Lichtenthaler, H.K. Detection of red edge position and chlorophyll content by reflectance measurements near 700 nm. J. Plant Physiol. 1996, 148, 501–508. [Google Scholar] [CrossRef]
  31. Huete, A.; Didan, K.; Miura, T.; Rodriguez, E.P.; Gao, X.; Ferreira, L.G. Overview of the radiometric and biophysical performance of the MODIS vegetation indices. Remote Sens. Environ. 2022, 83, 195–213. [Google Scholar] [CrossRef]
  32. Gitelson, A.A.; Kaufman, Y.J.; Merzlyak, M.N. Use of a green channel in remote sensing of global vegetation from EOS-MODIS. Remote Sens. Environ. 1996, 58, 289–298. [Google Scholar] [CrossRef]
  33. Peñuelas, J.; Filella, I.; Gamon, J.A. Assessment of photosynthetic radiation-use efficiency with spectral reflectance. New Phytologist 1995, 131, 291–296. [Google Scholar] [CrossRef]
  34. Kim, W.-S.; Lee, D.-H.; Kim, Y.-J. Machine vision-based automatic disease symptom detection of onion downy mildew. Comput. Electron. Agric. 2020, 168, 105099. [Google Scholar] [CrossRef]
  35. Bock, C.; Poole, G.; Parker, P.; Gottwald, T.R. Plant disease severity estimated visually, by digital photography and image analysis, and by hyperspectral imaging. Crit. Rev. Plant Sci. 2010, 29, 59–107. [Google Scholar] [CrossRef]
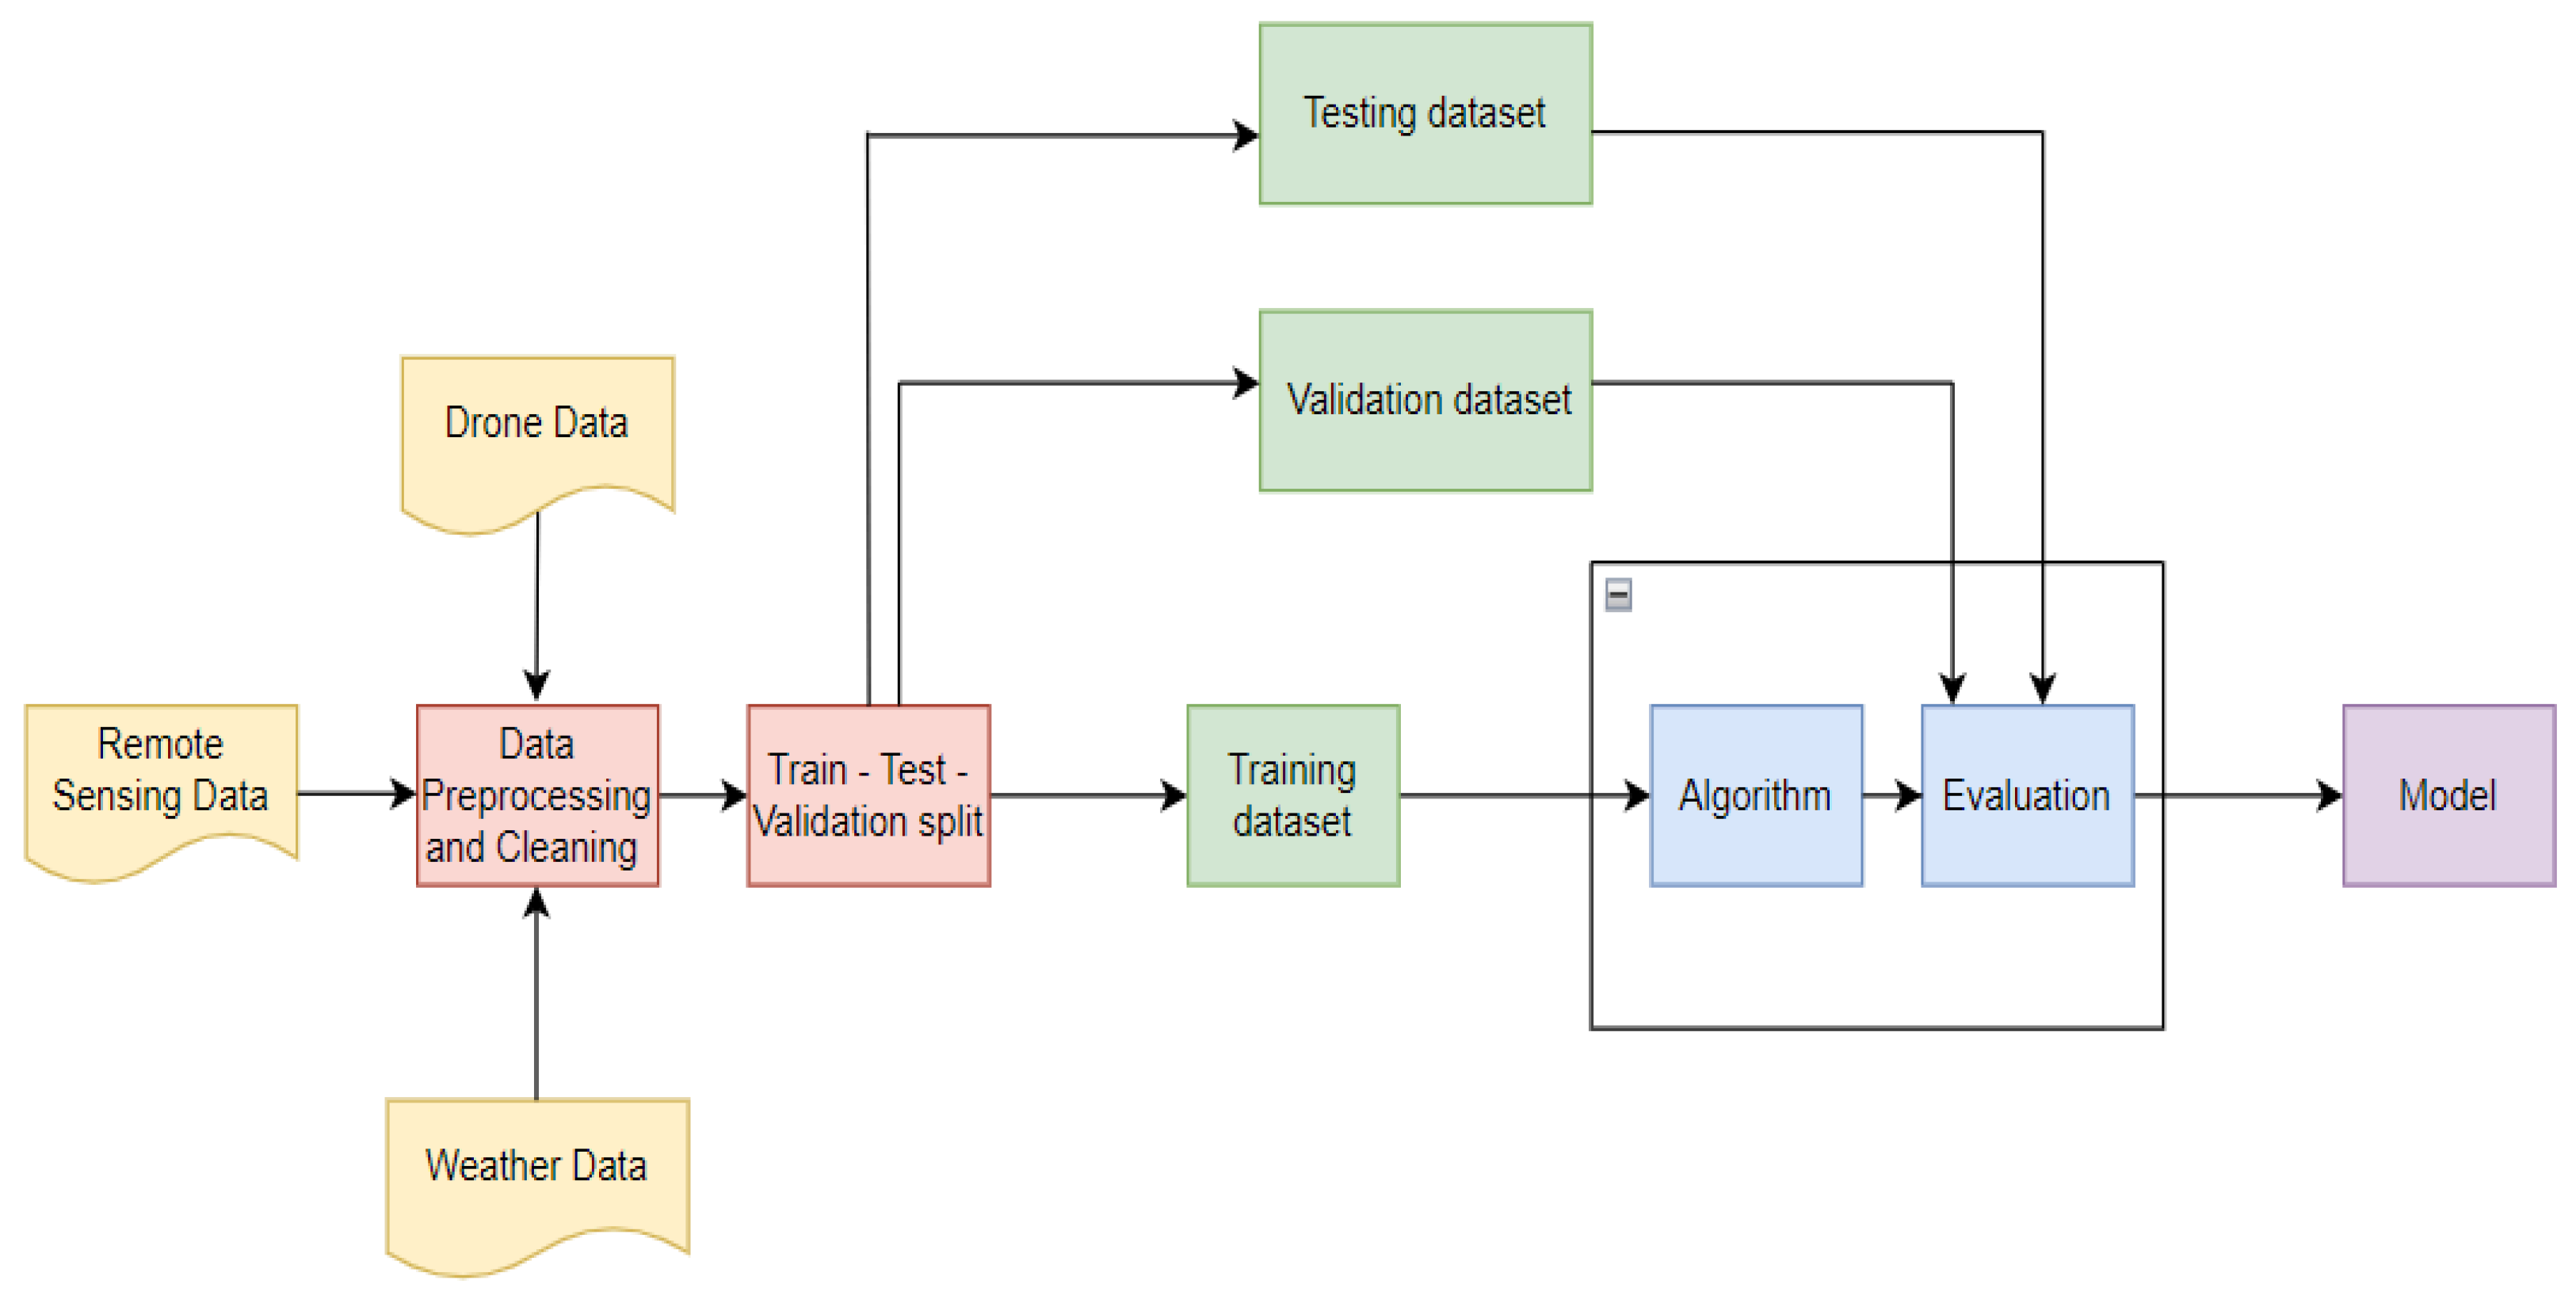
Figure 1. Data flow and management.
Remotesensing 17 03427 g001
Figure 2. Sample of UAV data for maize crop.
Remotesensing 17 03427 g002
Figure 3. Metadata for UAV data and remote sensing data. (A) UAV-based imagery collection configuration and metadata. (B) Remote sensing metadata for MOD09GA.061.
Remotesensing 17 03427 g003
Figure 4. Class counts of training images before and after augmentation. (A) Raw dataset showing pronounced class imbalance (bars = number of samples per class). (B) After applying data augmentation to the training set, minority classes are upsampled and the distribution becomes more balanced. Panels share the same y-axis scale.
Remotesensing 17 03427 g004
Figure 5. Spatial severity maps for EVI, GCI, NDRE, MSI, and SIPI indices across the study area. Each colored point represents the centroid of a 500 m × 500 m MODIS grid cell; color indicates disease severity.
Remotesensing 17 03427 g005
Figure 6. Model architecture For UAV data. (A) UAV image acquisition and ground truth labels. (B) Pre-processing: resize/normalize and data augmentation. (C) Feature extractor (backbone) with (D) classification/detection head producing per-sample predictions. (E) Training loop with mini-batches and early stopping; loss/metrics are computed per epoch. (F) Inference and post-processing to generate class probabilities.
Remotesensing 17 03427 g006
Figure 7. ResNet-50 classification for corn crop; the classifier takes a UAV image and outputs a label: healthy or any type of disease. Except for common rust (yellow); all other classes gave good results (green).
Remotesensing 17 03427 g007
Figure 8. Architectural model of remote sensing data for crop disease detection. (A) Vegetation-index time-series inputs from satellite imagery. (B) Base learners (LSTM, Bi-LSTM, SVR). (C) Ensemble combiner. (D) Multi-class outputs (Healthy, Common Rust, Gray Leaf Spot, Blight, Northern Leaf Blight). (E) Per-cell crop disease distribution map with a shared legend (low→high), rendered on a 500 m grid.
Remotesensing 17 03427 g008
Figure 9. Reinforcement learning (Deep Q-Learning) framework for spatial crop disease scouting.
Remotesensing 17 03427 g009
Figure 10. Normalized confusion matrix for ResNet-50.
Remotesensing 17 03427 g010
Figure 11. Reinforcement learning rewards for 1000 episodes.
Remotesensing 17 03427 g011
Figure 12. (A) Epsilon decay over 1000 episodes. (B) DQN loss progression over 1000 episodes.
Remotesensing 17 03427 g012
Figure 13. Visualizations of crop disease progression with severity for the study area at four points in the 2023 season. (A) January. (B) February. (C) March. (D) April. (E) May. (F) June.
Remotesensing 17 03427 g013
Table 3. Comparison of relevant deep learning models for crop disease detection and classification.
ModelPurposeAdvantagesDisadvantagesUse Case
Improved VGG-16 [18]Image Classification for crop diseasesReduces computational cost, high accuracy with depth-wise convolutionsComputationally expensive for deep layersIdentify and classify diseases (Blight, Common Rust, NLB, Gray Leaf Spot, Healthy) from UAV imagery
Improved DenseNet-121 [7]Detect disease patterns and fine texturesFeature reuse, effective on UAV data, prevents overfittingHigh complexity, requires extensive pre-processingExtract and identify subtle disease features like leaf spots and discoloration
Improved ResNet-50 [14]Multi-class disease classificationHandles vanishing gradient problems, robust to subtle disease featuresMemory intensive, slower inferenceClassify multiple diseases from UAV images with high feature complexity
Improved EfficientNet-B0 [15]Real-time disease detectionScalable, handles high-resolution imagesComplex patterns not effectively identified without high resolutionMonitoring large-scale farmland diseases using UAV
Improved LSTM [23]Sequential data analysis for disease progressionTime-series handling, robust for temporal predictionsHigh computational time, sensitive to hyper-parametersPredicting disease progression using weather and vegetation indices
Improved Bi-LSTM [24]Capturing temporal and bidirectional patternsDisease progression analysis, learns historical and future dependenciesRequires substantial data, resource intensiveAnalyzing disease trends in historical and future contexts
SVR [12]Estimate disease severity levelsCaptures non-linear featuresLimited performance for complex patternsEstimating severity levels from remote sensing satellite data
Table 4. Technology survey of crop disease detection platforms.
ProductPlantSnapFasalAgrioPlantix
Features
Disease risk forecastingYesYesYesNo
Treatment recommendationsYesYesYesYes
Preventative measure recommendationsNoYesYesYes
AI-powered disease analysisYesYesYesYes
Data Type
DroneNoNoYesNo
WeatherNoYesYesYes
Remote sensingNoYesYesNo
Cost
Pay-per-acre serviceNoNoNoNo
Subscription-based pricingNoYesYesNo
Premium modelYesNoYesYes
Table 5. UAV data classification for maize crop.
CropDisease/HealthyTotal Images
CornNorthern Leaf Blight (NLB)5410
Healthy2694
Common Rust1306
Gray Leaf Spot574
Blight1146
Table 6. MOD09GA.061 dataset for vegetation analysis.
FieldsData TypeDescriptionRangeUnit
LatitudeFloatLatitude of the inner grid centroid42.8762Degree
LongitudeFloatLongitude of the inner grid centroid−76.9817Degree
DateDatetimeImage capture range from MODIS(1 November 2017, 31 December 2018)NA
EVIFloatFrom NIR, Red, Blue bands−1 to +1NA
GCIFloatFrom NIR and Green bands−1 to +1NA
NDREFloatFrom NIR and Red Edge bands−1 to +1NA
SIPIFloatFrom NIR, Red, Blue bands0 to 1NA
MSIFloatFrom NIR and SWIR bands0 and aboveNA
Table 7. Stages of processing for remote sensing data.
StageColumn/TypeNumber
Rawsurf_Refl_b01
surf_Refl_b02
surf_Refl_b03
surf_Refl_b049967 rows, 18 columns
surf_Refl_b05
surf_Refl_b06
surf_Refl_b07
ProcessedGCI
SIPI
MSI9967 rows, 18 columns
NDRE
EVI
PreparationTraining data7475 rows, 14 columns
Test data2492 rows, 5 columns
Table 8. Row/column counts for UAV data at each processing stage.
DatasetRawAfter Pre-ProcessingAfter AugmentationPrepared (Train/Test)
UAV images (Visual model)9967 images9967 images22,937 images17,202/5735 images
Weather + Remote Sensing9967 × 189967 × 189967 × 187475 × 14/2492 × 5
Table 9. Spectral Vegetation-Index (VI) ranges and corresponding crop health indicators.
Vegetation IndexRange/ThresholdHealth Indicator
NDRE 1 to 0.20 Developing crop
0.20 to 0.60 Unhealthy crop
0.60 to 1.00 Healthy crop
SIPI 0.80 to 1.80 Healthy crop
Other valuesUnhealthy crop
GCI 0.20 to 0.80 Green, healthy crop
Other valuesUnhealthy crop
EVI0.0 to 0.2Unhealthy vegetation
0.2 to 0.5Moderate vegetation
0.5 to 0.9Healthy vegetation
Table 10. Model comparison.
ModelInputJustificationAccuracyMerits and Drawbacks
Improved VGG-16Drone ImagesModified with depth-wise separable convolutions, batch normalization, dropout; reduces compute and improves accuracy for UAV images.Common Rust—99.19%, NLB—84.02%, Blight—92%, Gray Leaf Spot—93.10%, Healthy—83.04%Merits: Efficient for high-resolution images; robust to appearance variation. Drawbacks: High computational cost for deeper layers.
Improved ResNet-50Drone ImagesEnhanced with SE blocks and residual connections to emphasize disease-specific features and stabilize deep training.Common Rust—100%, NLB—88.34%, Blight—97.41%, Gray Leaf Spot—98.32%, Healthy—86.14%Merits: Captures visual and textural features; robust classification. Drawbacks: Slightly more complex model.
Improved DenseNet-121Drone ImagesDense connections with task-specific layers to capture fine-grained textures and improve UAV disease detection.Common Rust—97.36%, NLB—82%, Blight—86.29%, Gray Leaf Spot—83.65%, Healthy—82.14%Merits: Captures complex patterns and features. Drawbacks: Requires more memory, slower inference.
Improved EfficientNet-B0Drone ImagesCompound scaling and SE blocks with resized inputs for efficient, high-accuracy classification at lower cost.Common Rust—100%, NLB—85.73%, Blight—86.29%, Gray Leaf Spot—83.65%, Healthy—82.14%Merits: Flexible scaling across devices. Drawbacks: May miss subtle patterns unless higher-resolution inputs are used.
LSTMRemote Sensing DataLearns temporal patterns in vegetation indices to capture disease progression over time.Common Rust—88.90%, NLB—76.34%, Blight—83.41%, Gray Leaf Spot—85.46%, Healthy—68.98%Merits: Handles sequential dependencies. Drawbacks: Computationally heavy; hyperparameter-sensitive.
Bi-LSTMRemote Sensing DataCaptures both past and future dependencies in sequential data for better disease trend analysis.Common Rust—89.18%, NLB—64.02%, Blight—84%, Gray Leaf Spot—82.56%, Healthy—76.04%Merits: Robust to noise with bidirectional context. Drawbacks: Higher computational demand, needs more data.
SVRRemote Sensing DataMaps vegetation indices to disease classes using kernel functions; effective for smaller datasets.Common Rust—87.36%, NLB—78.32%, Blight—78.29%, Gray Leaf Spot—78.65%, Healthy—68.14%Merits: Simple, low computation. Drawbacks: Limited on highly non-linear patterns.
Table 11. Innovative reward policy for RL-based crop disease detection.
RewardScenario
[+1, −1]If the model moves to a grid where NDVI is increasing, reward +1. Otherwise, reward −1.
[+1, −1]If the model moves to a grid with optimal temperature (20–30 °C), reward +1. Otherwise, reward −1.
[0, +1]If the model moves to a grid with stable NDRE (low plant stress), reward +1. Otherwise, reward 0.
[0, −1]If the model moves to a grid where EVI is decreasing, reward −1. Otherwise, reward 0.
[−1, +1]If the model moves to a grid with high SIPI (good chlorophyll content), reward +1. Otherwise, reward −1.
[−1, +1]If the model moves to a grid with low SIPI (low chlorophyll content), reward −1. Otherwise, reward +1.
[0, +1]If the model moves to a grid where temperature and NDVI are both favorable, reward +1. Otherwise, reward 0.
Table 12. Performance comparison of different models for UAV-based crop disease detection.
ModelAccuracy (%)Precision (%)Recall (%)F1-Score (%)
ResNet-5092.5493.2092.2092.40
VGG-1690.1290.0090.0291.32
EfficientNetB091.4091.3891.3891.20
DenseNet-12188.7790.0889.1889.42
Hybrid Model93.6494.3592.1893.14
Ensemble (Soft Voting)91.9893.8090.1692.36
Table 13. Performance of individual models on UAV data (per class).
ModelClassesTraining SamplesTesting SamplesAccuracy (%)Testing Time (s)
ResNet-50NLB4033137788.3414.09
Blight265587897.419.85
Common Rust39001310100.0013.10
Gray Leaf Spot261782198.3210.13
Healthy3997134986.1413.21
VGG-16NLB4033137784.0214.10
Blight265587892.0010.10
Common Rust3900131099.1913.19
Gray Leaf Spot261782193.1010.15
Healthy3997134983.0413.28
DenseNet-121NLB4033137782.0014.10
Blight265587886.2910.10
Common Rust3900131097.3613.19
Gray Leaf Spot261782183.6510.10
Healthy3997134982.1413.54
EfficientNetB0NLB4033137785.7310.15
Blight265587893.0010.15
Common Rust39001310100.0013.10
Gray Leaf Spot261782193.8710.18
Healthy3997134985.7813.21
Hybrid ModelNLB4033137788.3414.09
Blight265587897.419.85
Common Rust39001310100.0013.10
Gray Leaf Spot261782198.3210.13
Healthy3997134986.1413.21
Model Ensemble (Soft Voting)NLB4033137785.7313.21
Blight265587893.0010.01
Common Rust39001310100.0013.14
Gray Leaf Spot261782193.8710.11
Healthy3997134985.7813.24
Table 14. Model performance for remote sensing dataset (per class).
ModelClassTrain SamplesTest SamplesMAPE (%)Accuracy (%)Testing Time (s)
LSTMNLB403313774.2176.3414.50
Blight26558783.2683.4110.10
Common Rust390013102.8988.9013.50
Gray Leaf Spot26178213.3585.4610.25
Healthy399713492.0568.9813.21
Bi-LSTMNLB403313773.9564.0213.90
Blight26558782.9884.009.45
Common Rust390013103.1289.1812.60
Gray Leaf Spot26178213.4182.569.98
Healthy399713491.8976.048.20
SVRNLB403313774.8778.3215.30
Blight26558783.8578.2911.05
Common Rust390013103.4987.3614.75
Gray Leaf Spot26178213.7878.6511.42
Healthy399713492.2568.148.80
Model EnsembleNLB403313772.7682.2113.20
Blight26558782.1288.679.78
Common Rust390013101.9493.5012.98
Gray Leaf Spot26178212.0190.4210.50
Healthy399713491.6279.237.85
Disclaimer/Publisher’s Note: The statements, opinions and data contained in all publications are solely those of the individual author(s) and contributor(s) and not of MDPI and/or the editor(s). MDPI and/or the editor(s) disclaim responsibility for any injury to people or property resulting from any ideas, methods, instructions or products referred to in the content.