Integration of UAV and Remote Sensing Data for Early Diagnosis and Severity Mapping of Diseases in Maize Crop Through Deep Learning and Reinforcement Learning
Abstract
Highlights
- A framework combining UAV, satellite, and weather data to detect crop diseases.
- Ensemble deep learning and reinforcement learning improve classification and severity mapping.
- Enables near real-time, scalable crop disease management to reduce yield losses.
- Early detection and hotspot mapping optimize water and pesticide use for sustainability.
Abstract
1. Introduction
2. Related Work
2.1. Literature Review
- Relevant Works Based on UAV Drone Data (Table 1)
| Reference | Region | Purpose | Models Used | Accuracy | Input Parameters |
|---|---|---|---|---|---|
| [7] | Iowa, USA | Quantitative phenotyping of maize disease | YOLOv3, CNN, ResNet-50 | 90%, 85%, 93% | UAV images, field metrics |
| [10] | Tamil Nadu, India | Corn crop disease using multisensor fusion | Sensor Fusion, EfficientNetB0 | 72%, 94% | Multispectral UAV images |
| [11] | Japan | Rice disease detection and mapping using drones | ANN, CNN, SVM | 88.63%, 75.2%, 63.52% | Rice leaf images |
| [12] | South Asia | Crop disease detection using UAV and DL | DT, RF, Naive Bayes, CNN | 64%, 71%, 86.32%, 89.45% | Potato plant diseases |
| [13] | Germany | Crop disease detection using GAN and UAV | DCGAN, GAN, CNN | 92%, 76.65%, 53.01% | Apple leaf diseases |
| [16] | California, USA | Soybean disease detection using UAV | EfficientNetB0, Mask R-CNN | 89%, 86% | NDVI + RGB data |
| [17] | Spain | Wheat disease detection | MobileNet, VGG-16 | 88%, 95.23% | High-res UAV images |
| [14] | Andhra Pradesh, India | Rice crop disease classification | YOLOv4, DenseNet-121, ResNet-50 | 90.23%, 78.69%, 94% | UAV imagery |
| [15] | Bangladesh | Sugarcane disease classification | DenseNet121, YOLOv3, SSD | 92%, 64.15%, 84% | UAV drone images |
| [18] | Beijing, China | Cucumber disease classification (4 types) | DCNN, RF, SVM, AlexNet | 93.4% | Cucumber symptom images |
- B.
- Relevant Works Based on Remote Sensing and Weather Data (Table 2)
| Reference | Region | Purpose | Models Used | Accuracy | Input Parameters |
|---|---|---|---|---|---|
| [7] | USA | UAV + hyperspectral maize phenotyping | 3D-CNN, Bi-LSTM | 71.11%, 85.69% | NDVI + sequential UAV data |
| [2] | Rwanda | Yield prediction for beans crop | Naive Bayes, SVR | 85.23%, 87.88% | Time-series rainfall, soil quality |
| [19] | Poland | Predict crop yields based on historical weather, soil, and crop data | CNN, SGB model, EWOISN-FE, R model | High Degree of Accuracy | Data from weather stations, soil sensors, drones, and satellites |
| [8] | Cairo, Egypt | Paddy disease detection using thermal imagery | DenseNet-201, MobileNet, Inception, DenseNet-201 + DWT, MobileNet + DWT, Inception + DWT | Q-SVM: 89%, 88.4%, 87.1%, 90.4%, 89.5%, 87.6%; C-SVM: 89%, 87.6%, 87.3%, 89%, 89.2%, 87.9% | Thermal + Remote sensing |
| [3] | Netherlands | Barley yield detection | Gradient Boosting, LSTM | 86%, 88.96% | Weather + Vegetation indices |
| [10] | Tamil Nadu, India | Corn disease monitoring | CNN-RNN, LSTM, Hybrid | 89%, 91.25%, 62.02% | Remote sensing + Weather data |
| [4] | China | Disease severity detection | SVR, Random Forest | 92.13%, 85% | Vegetation indices |
| [20] | China | Sugarcane disease severity distribution | XGBoost, Bi-LSTM | 91%, 96.33% | Time-series spectral data |
2.2. Review of Current Technology and Solutions for Crop Disease Detection
3. Materials and Methods
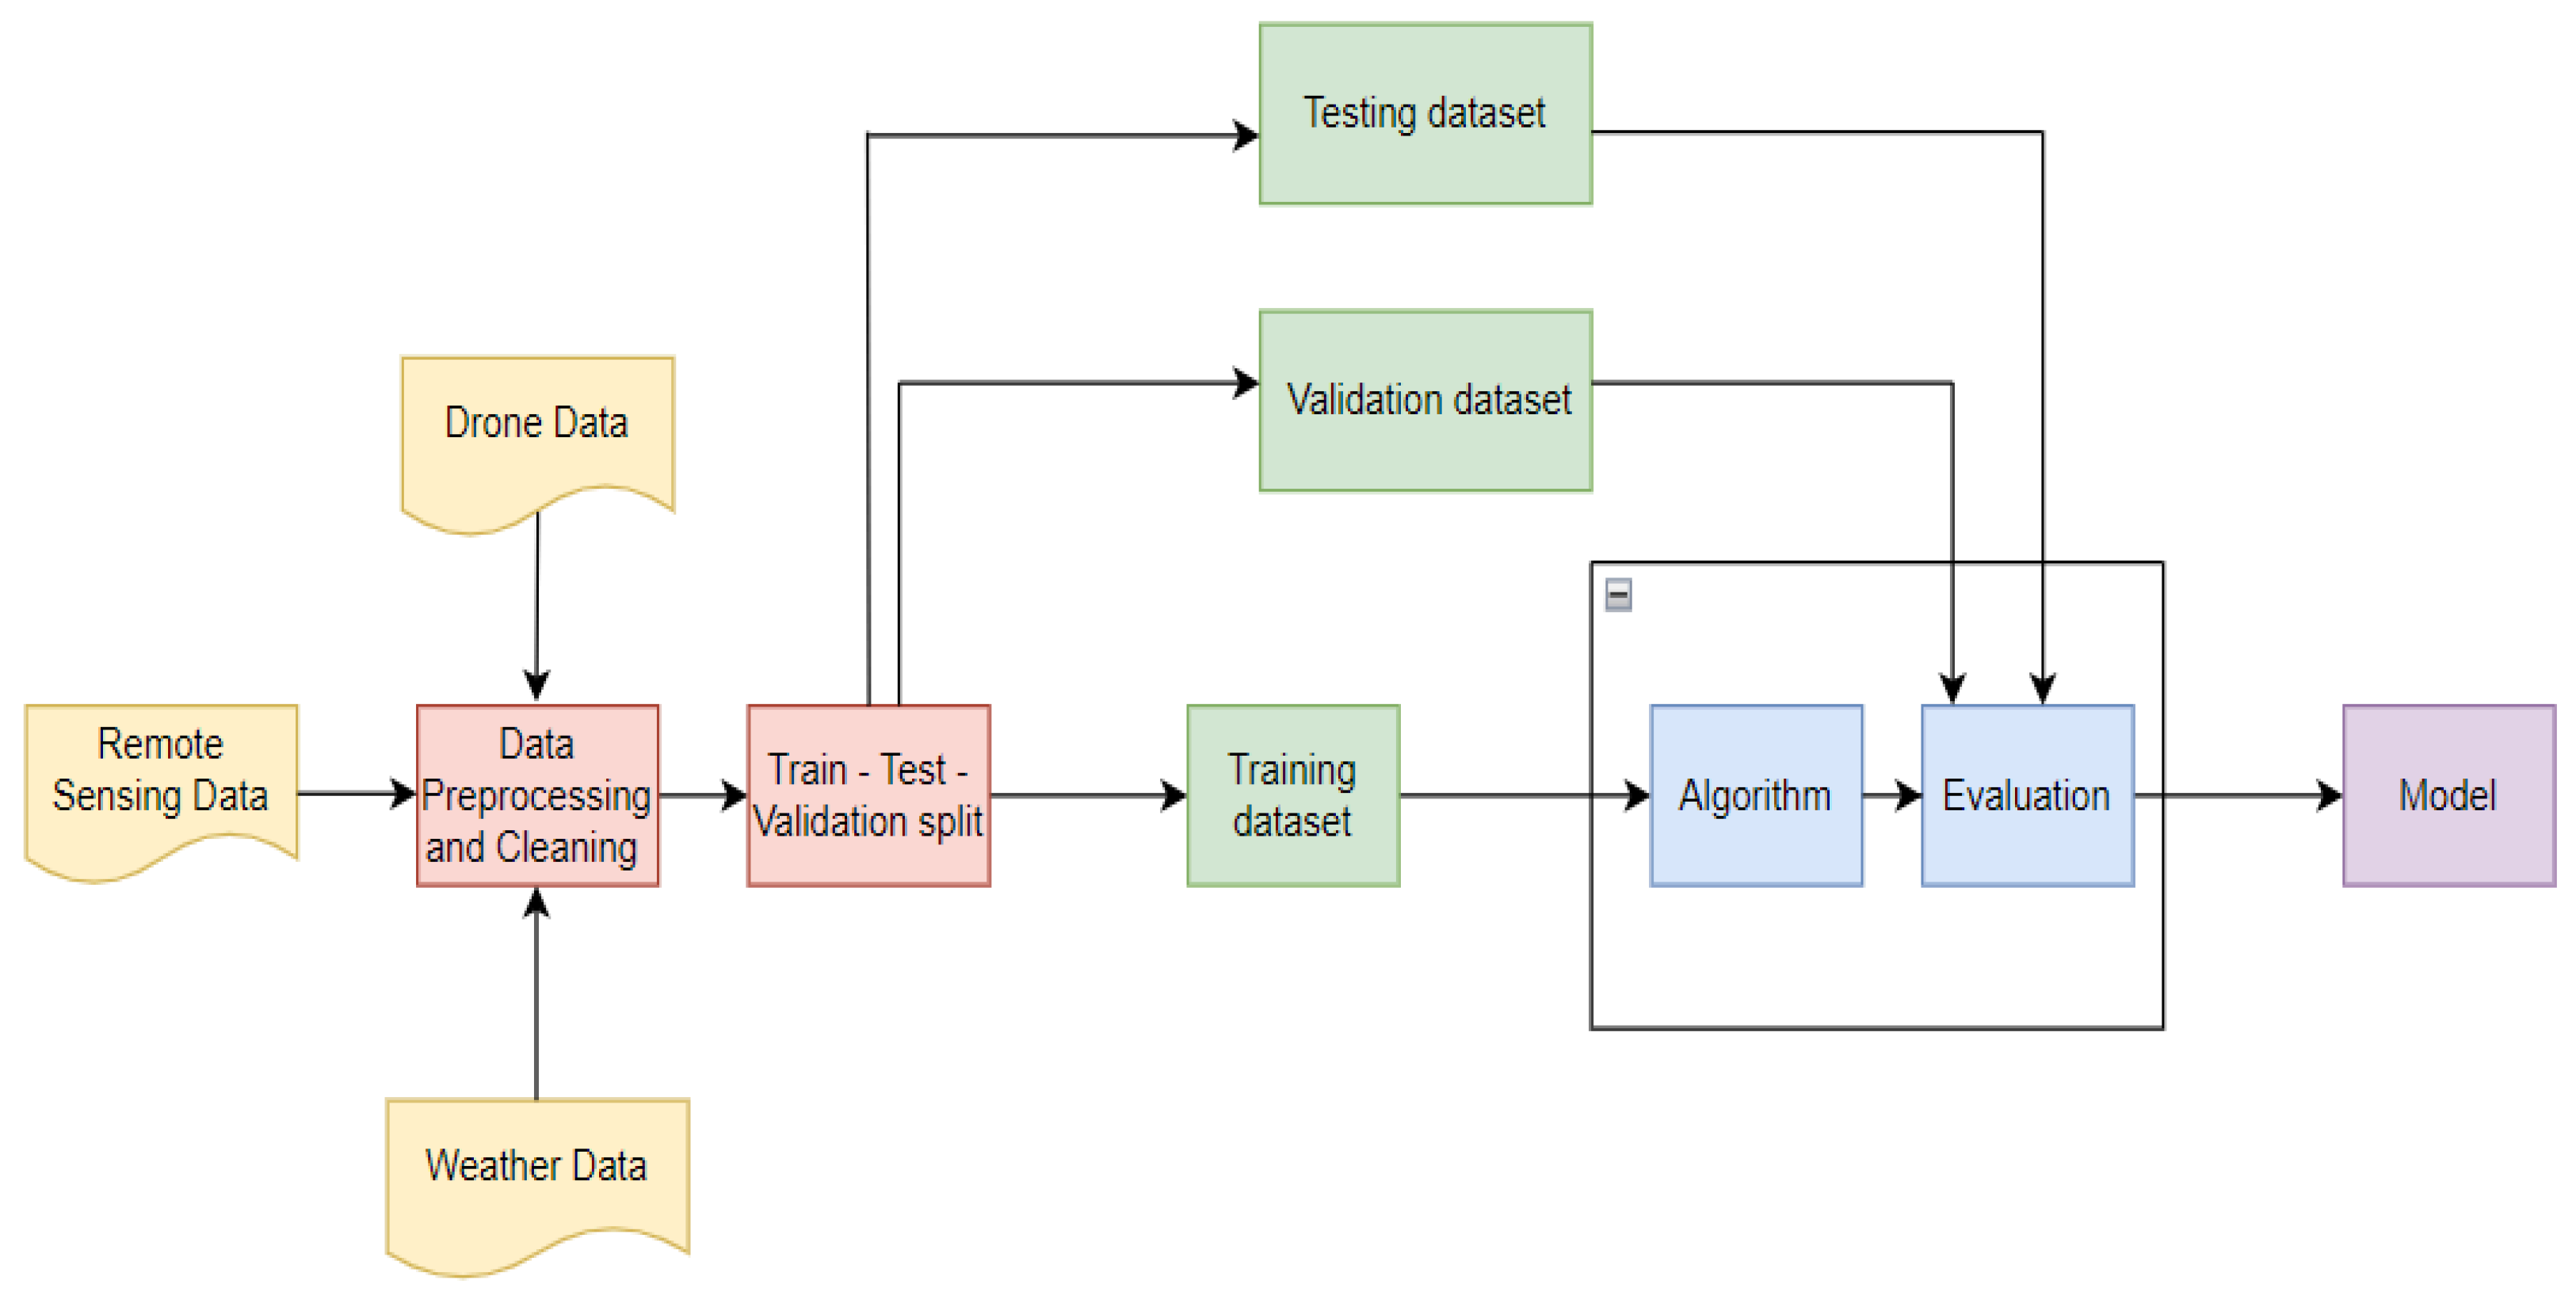
3.1. Data Engineering
3.1.1. Data Selection and Processing
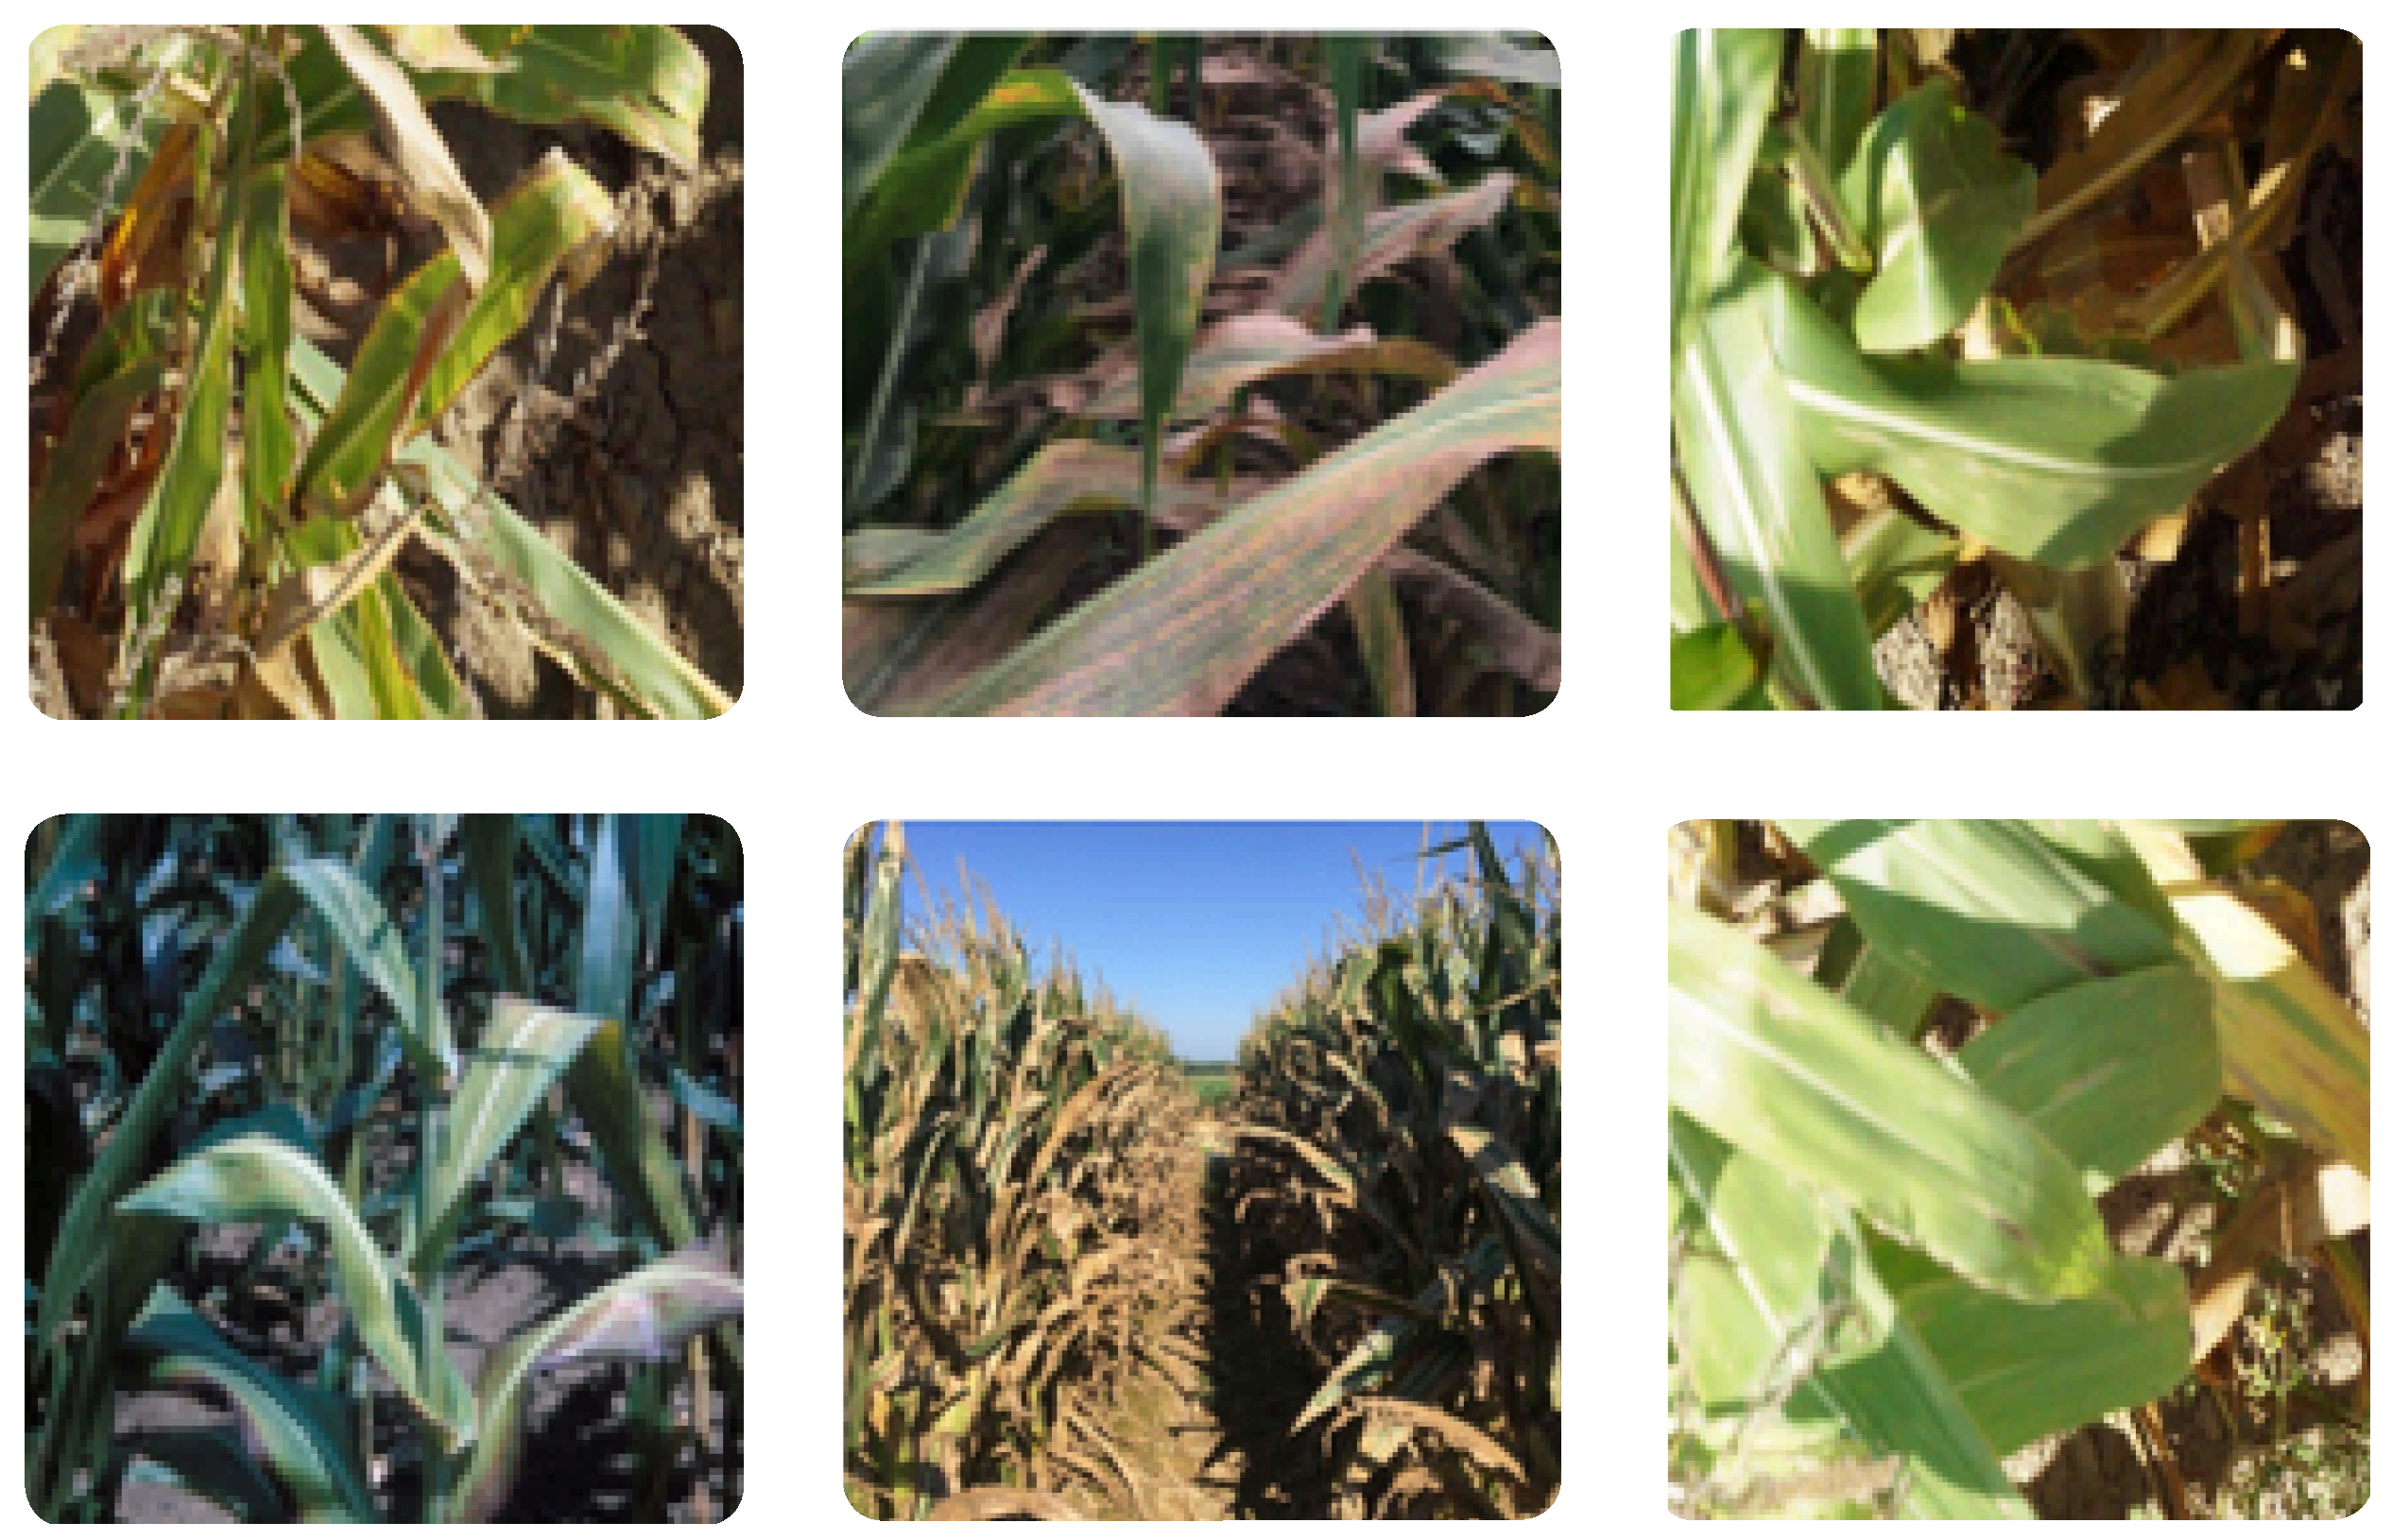
- UAV-Based Crop Disease Detection and Classification: This component involved the acquisition of high-resolution aerial images via Unmanned Aerial Vehicles (UAVs). Each image was accompanied by metadata such as geolocation, timestamp, and labeled disease annotations.
- Remote Sensing Data: Satellite-derived remote sensing data was collected, which enabled the extraction of vegetation indices such as NDVI, EVI, and NDRE, which serve as indirect indicators of plant health.
- IoT-Based Weather Data Analysis:Environmental parameters were obtained using Internet of Things (IoT)-based weather sensors and public meteorological datasets. The features included temporal (date and time), spatial (location coordinates), and climatic variables such as precipitation, temperature, humidity, wind speed, pressure, and elevation.
- Severity-Based Disease Distribution Analysis: Aggregated data such as location, total infected crops, total infected crops per disease, and total crops in a farmland was used to map severity hotspots.
3.1.2. Data Acquisition
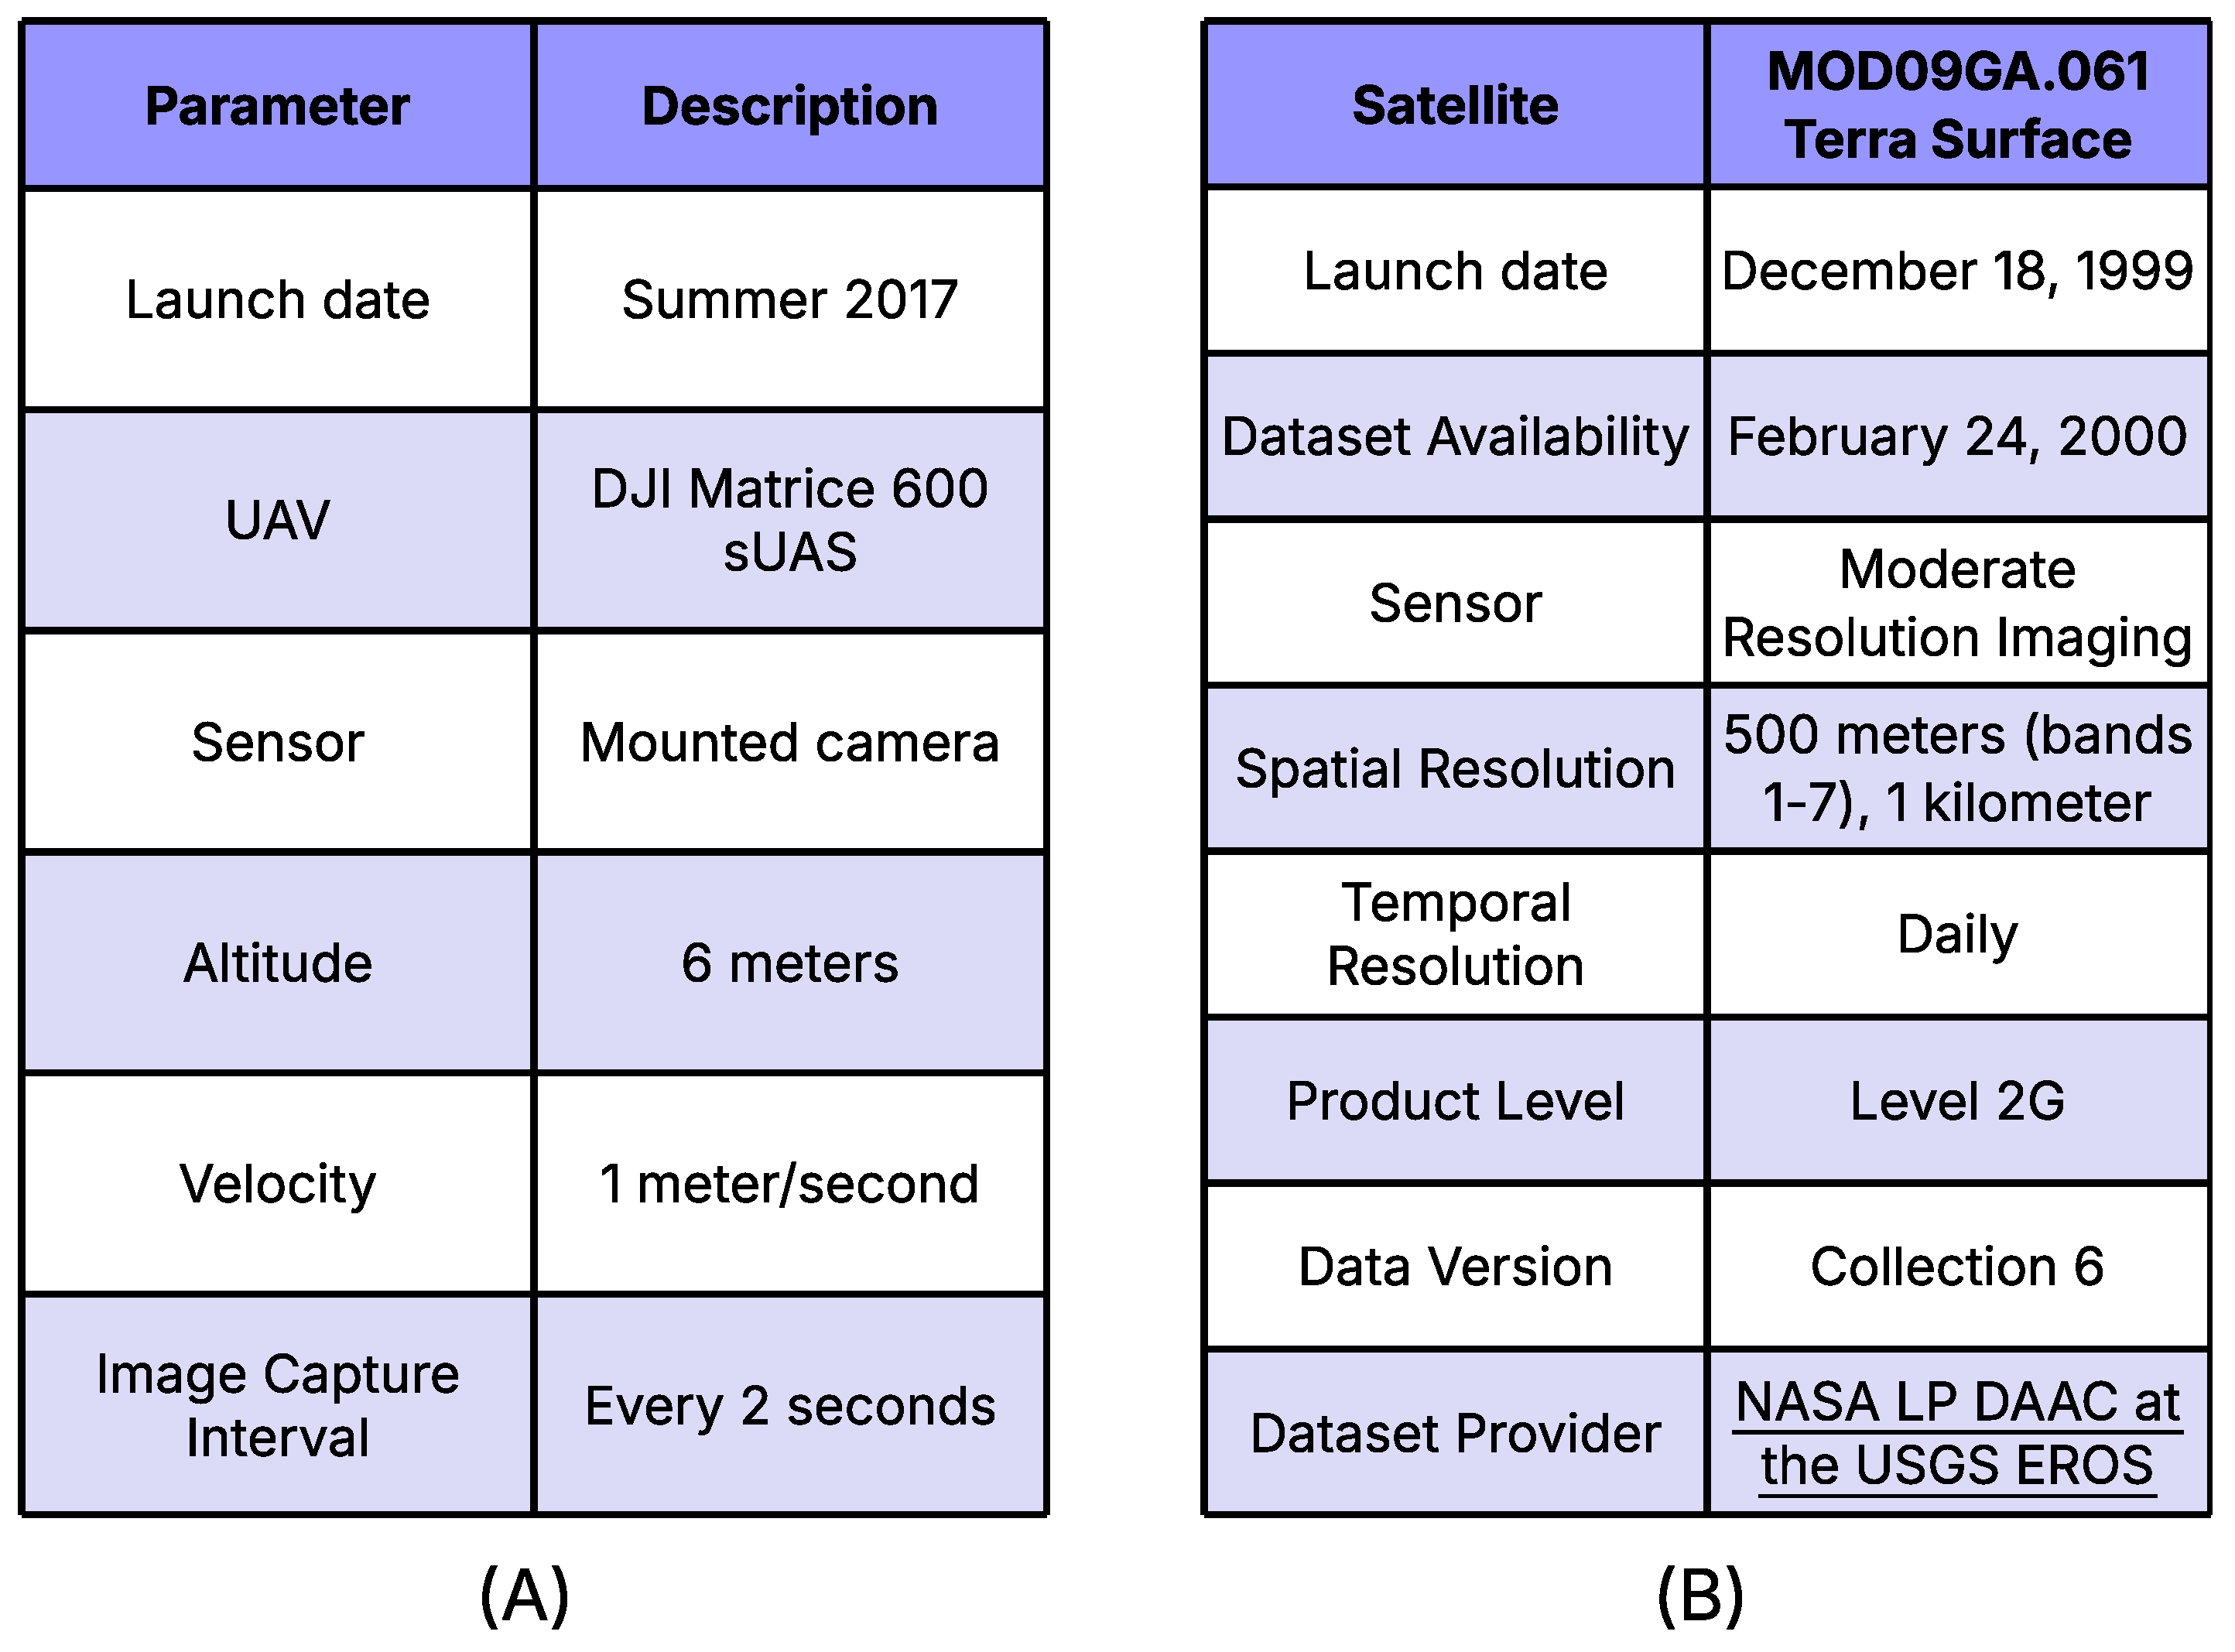
3.1.3. UAV-Based Imagery
3.1.4. Remote Sensing Data
3.1.5. IoT-Based Weather Data
3.1.6. Data Preprocessing
3.1.7. UAV-Based Imagery
3.1.8. Remote Sensing Data
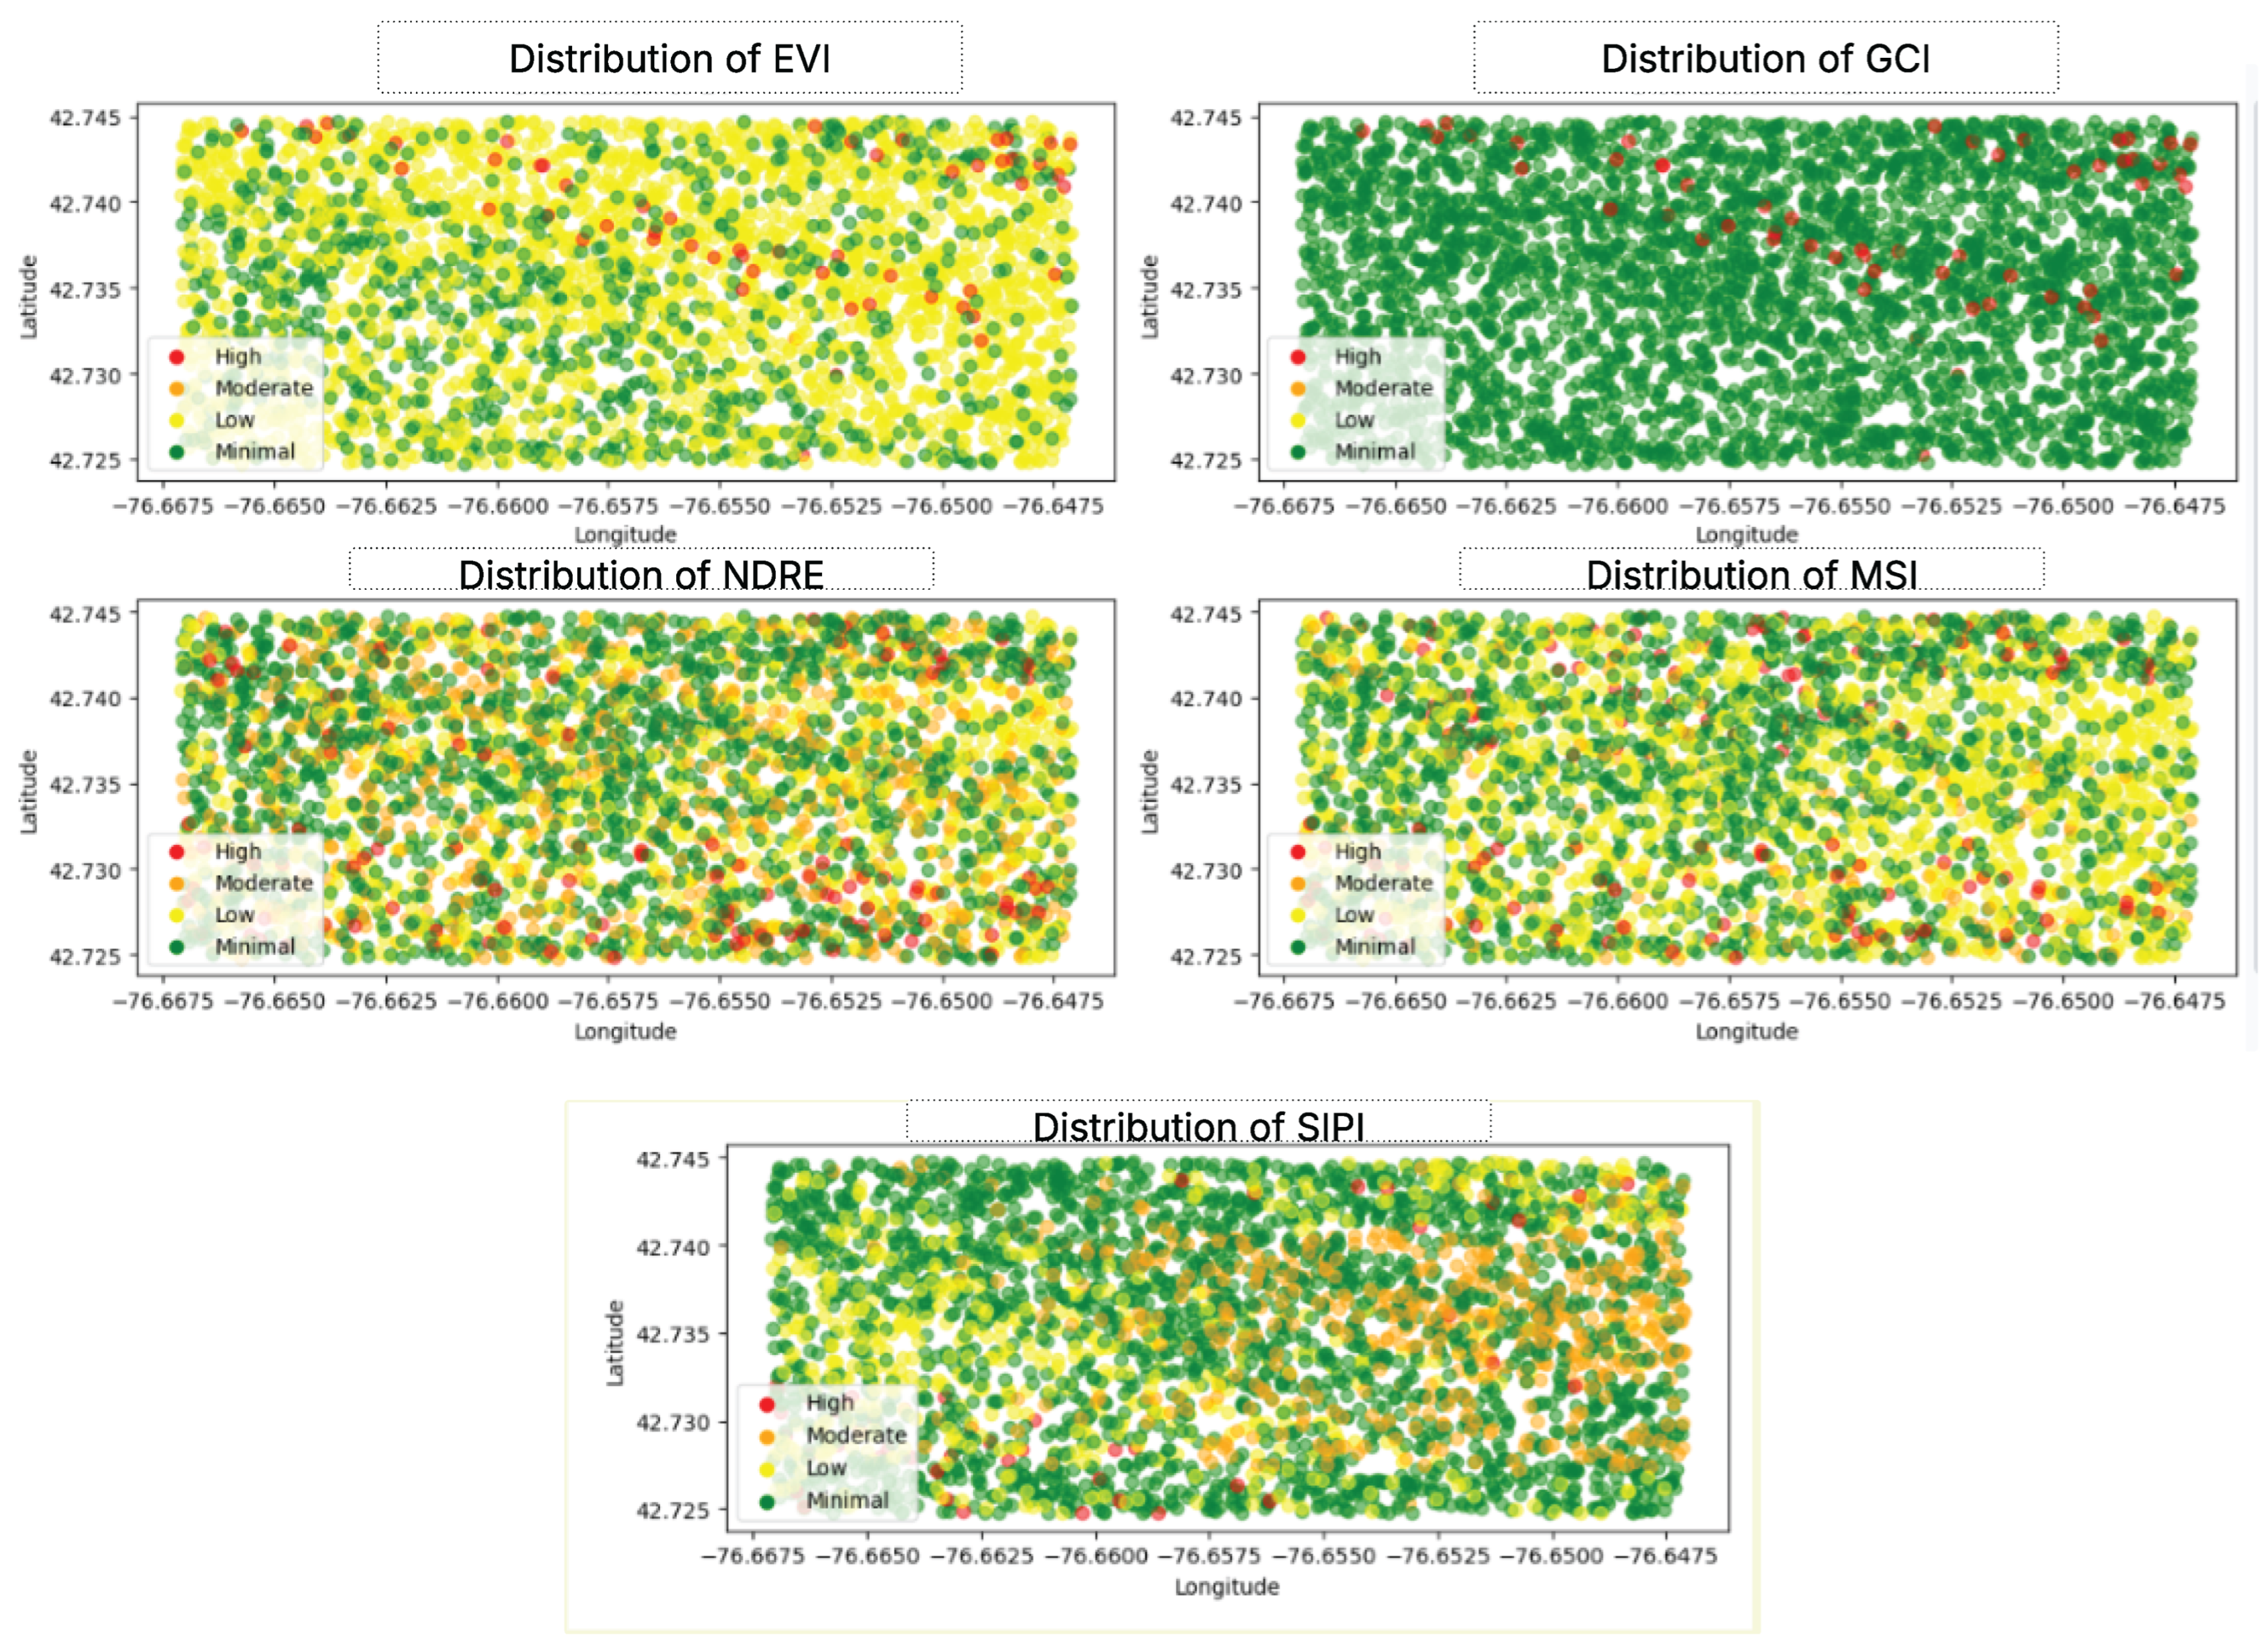
- Description of vegetation indices:
- MSI: Highlights plant water stress; higher values indicate disease-prone areas [29].
- NDRE: Detects chlorophyll reduction from early disease stress [30].
- EVI: Improves canopy health monitoring in dense crops [31].
- GCI: Estimates chlorophyll concentration, a key disease indicator [32].
- SIPI: Reflects carotenoid/chlorophyll ratio under disease stress [33].
3.1.9. IoT-Based Weather Data
3.1.10. Data Validation
3.2. Training Environment and Configuration
3.3. Model Development
3.3.1. Crop Disease Detection and Classification Using Drone Data (UAV)
- 1. Improved VGG-16:
- 2. Improved ResNet50:
- 3. Improved DenseNet-121:
- 4. Improved EfficientNet-B0:
- 5. Ensemble Model (Soft Voting):
3.3.2. Crop Disease Detection and Severity Classification Using Remote Sensing Data
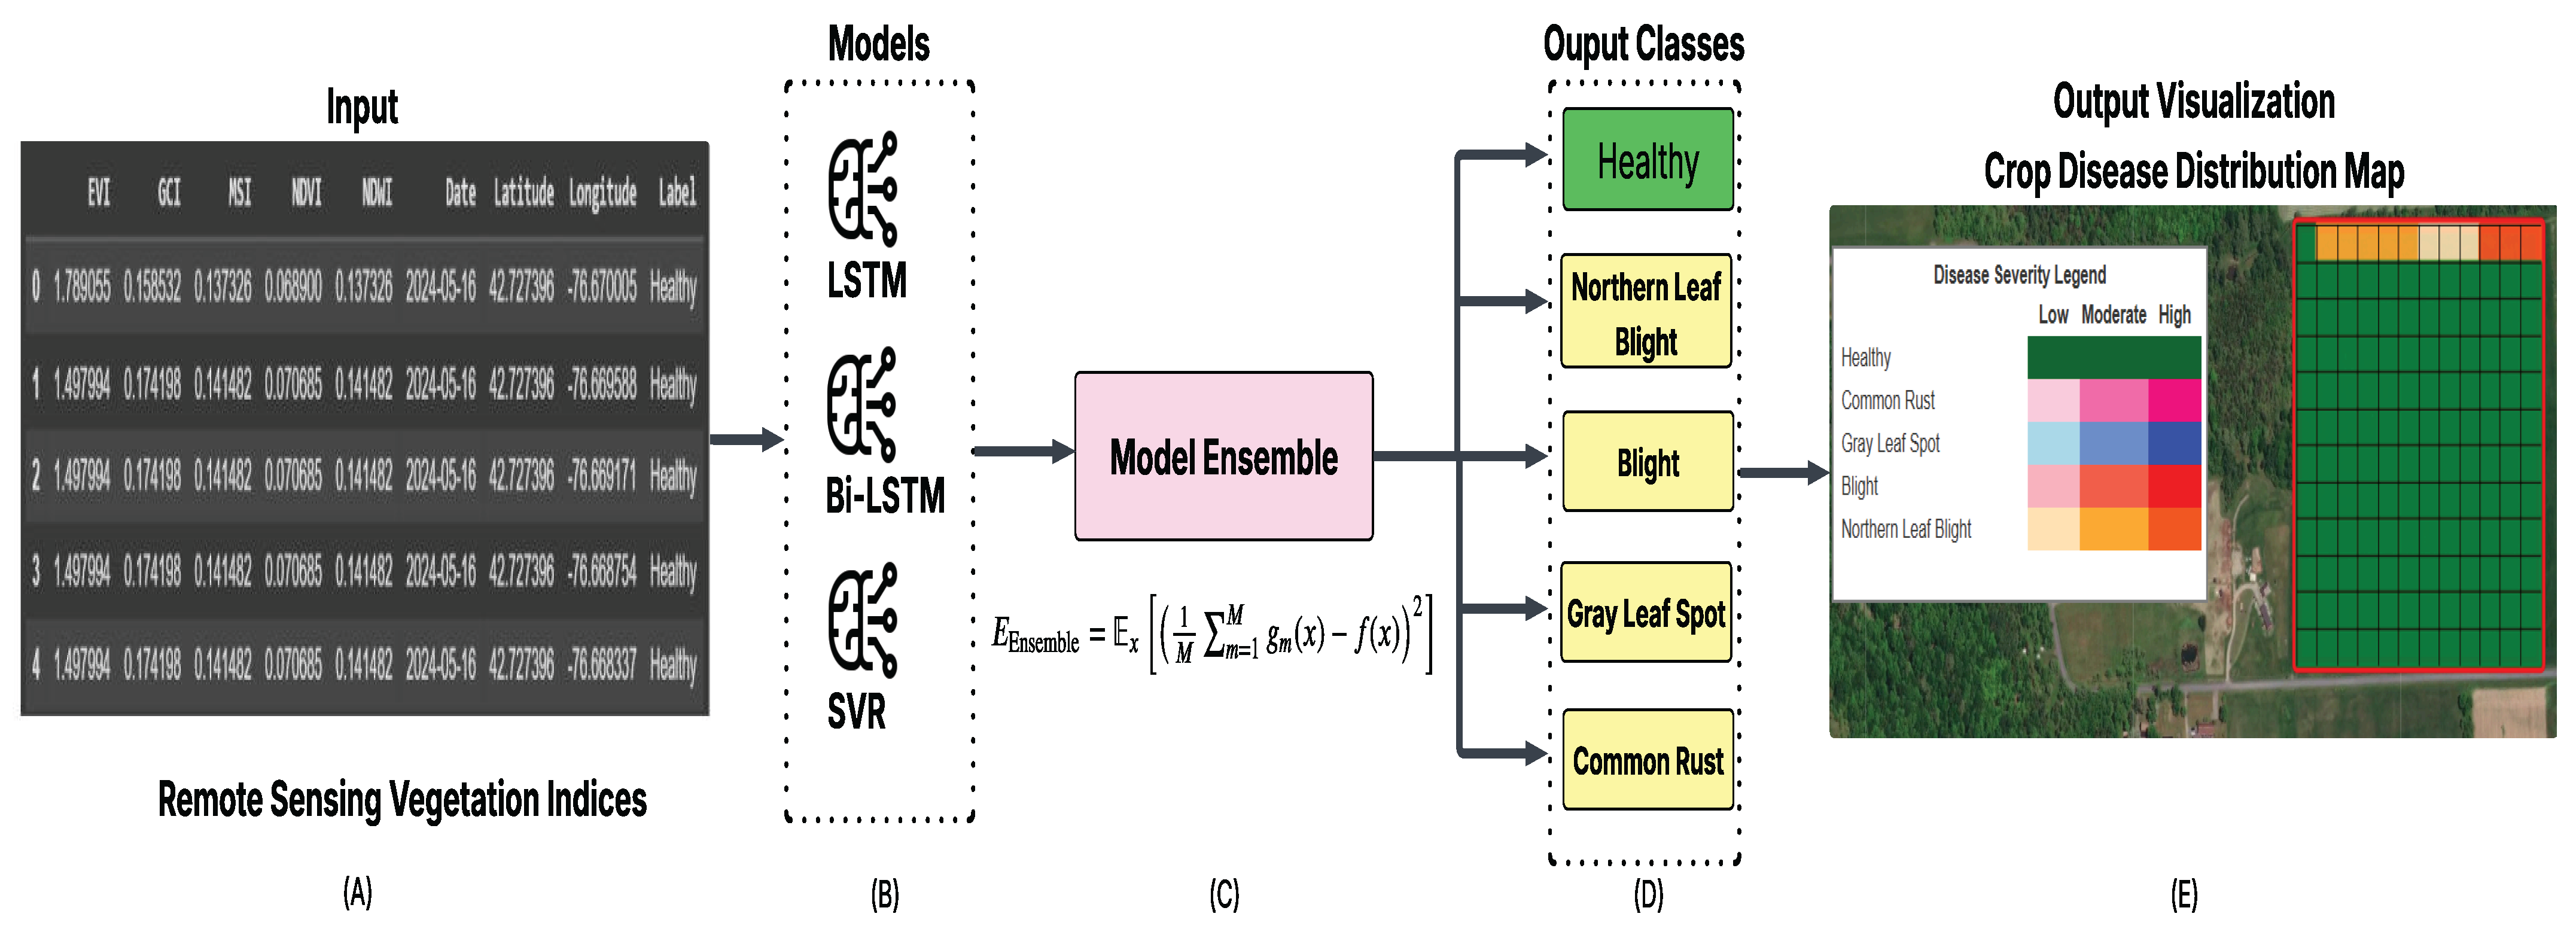
- Input data:
- Latitude, Longitude, Date.
- Spectral Bands: NIR, Green, Red, Red Edge, Blue.
- Vegetation indices used:
- 1. Improved LSTM
- 2. Improved Bi-LSTM
- 3. Improved Support Vector Regression (SVR)
3.3.3. Crop Disease Detection and Classification Using Weather Data
- 1. Random Forest Classifier (RFC)
- 2. Support Vector Machines (SVM)
- 3. Gaussian Naive Bayes (GNB)
3.3.4. Reinforcement Learning
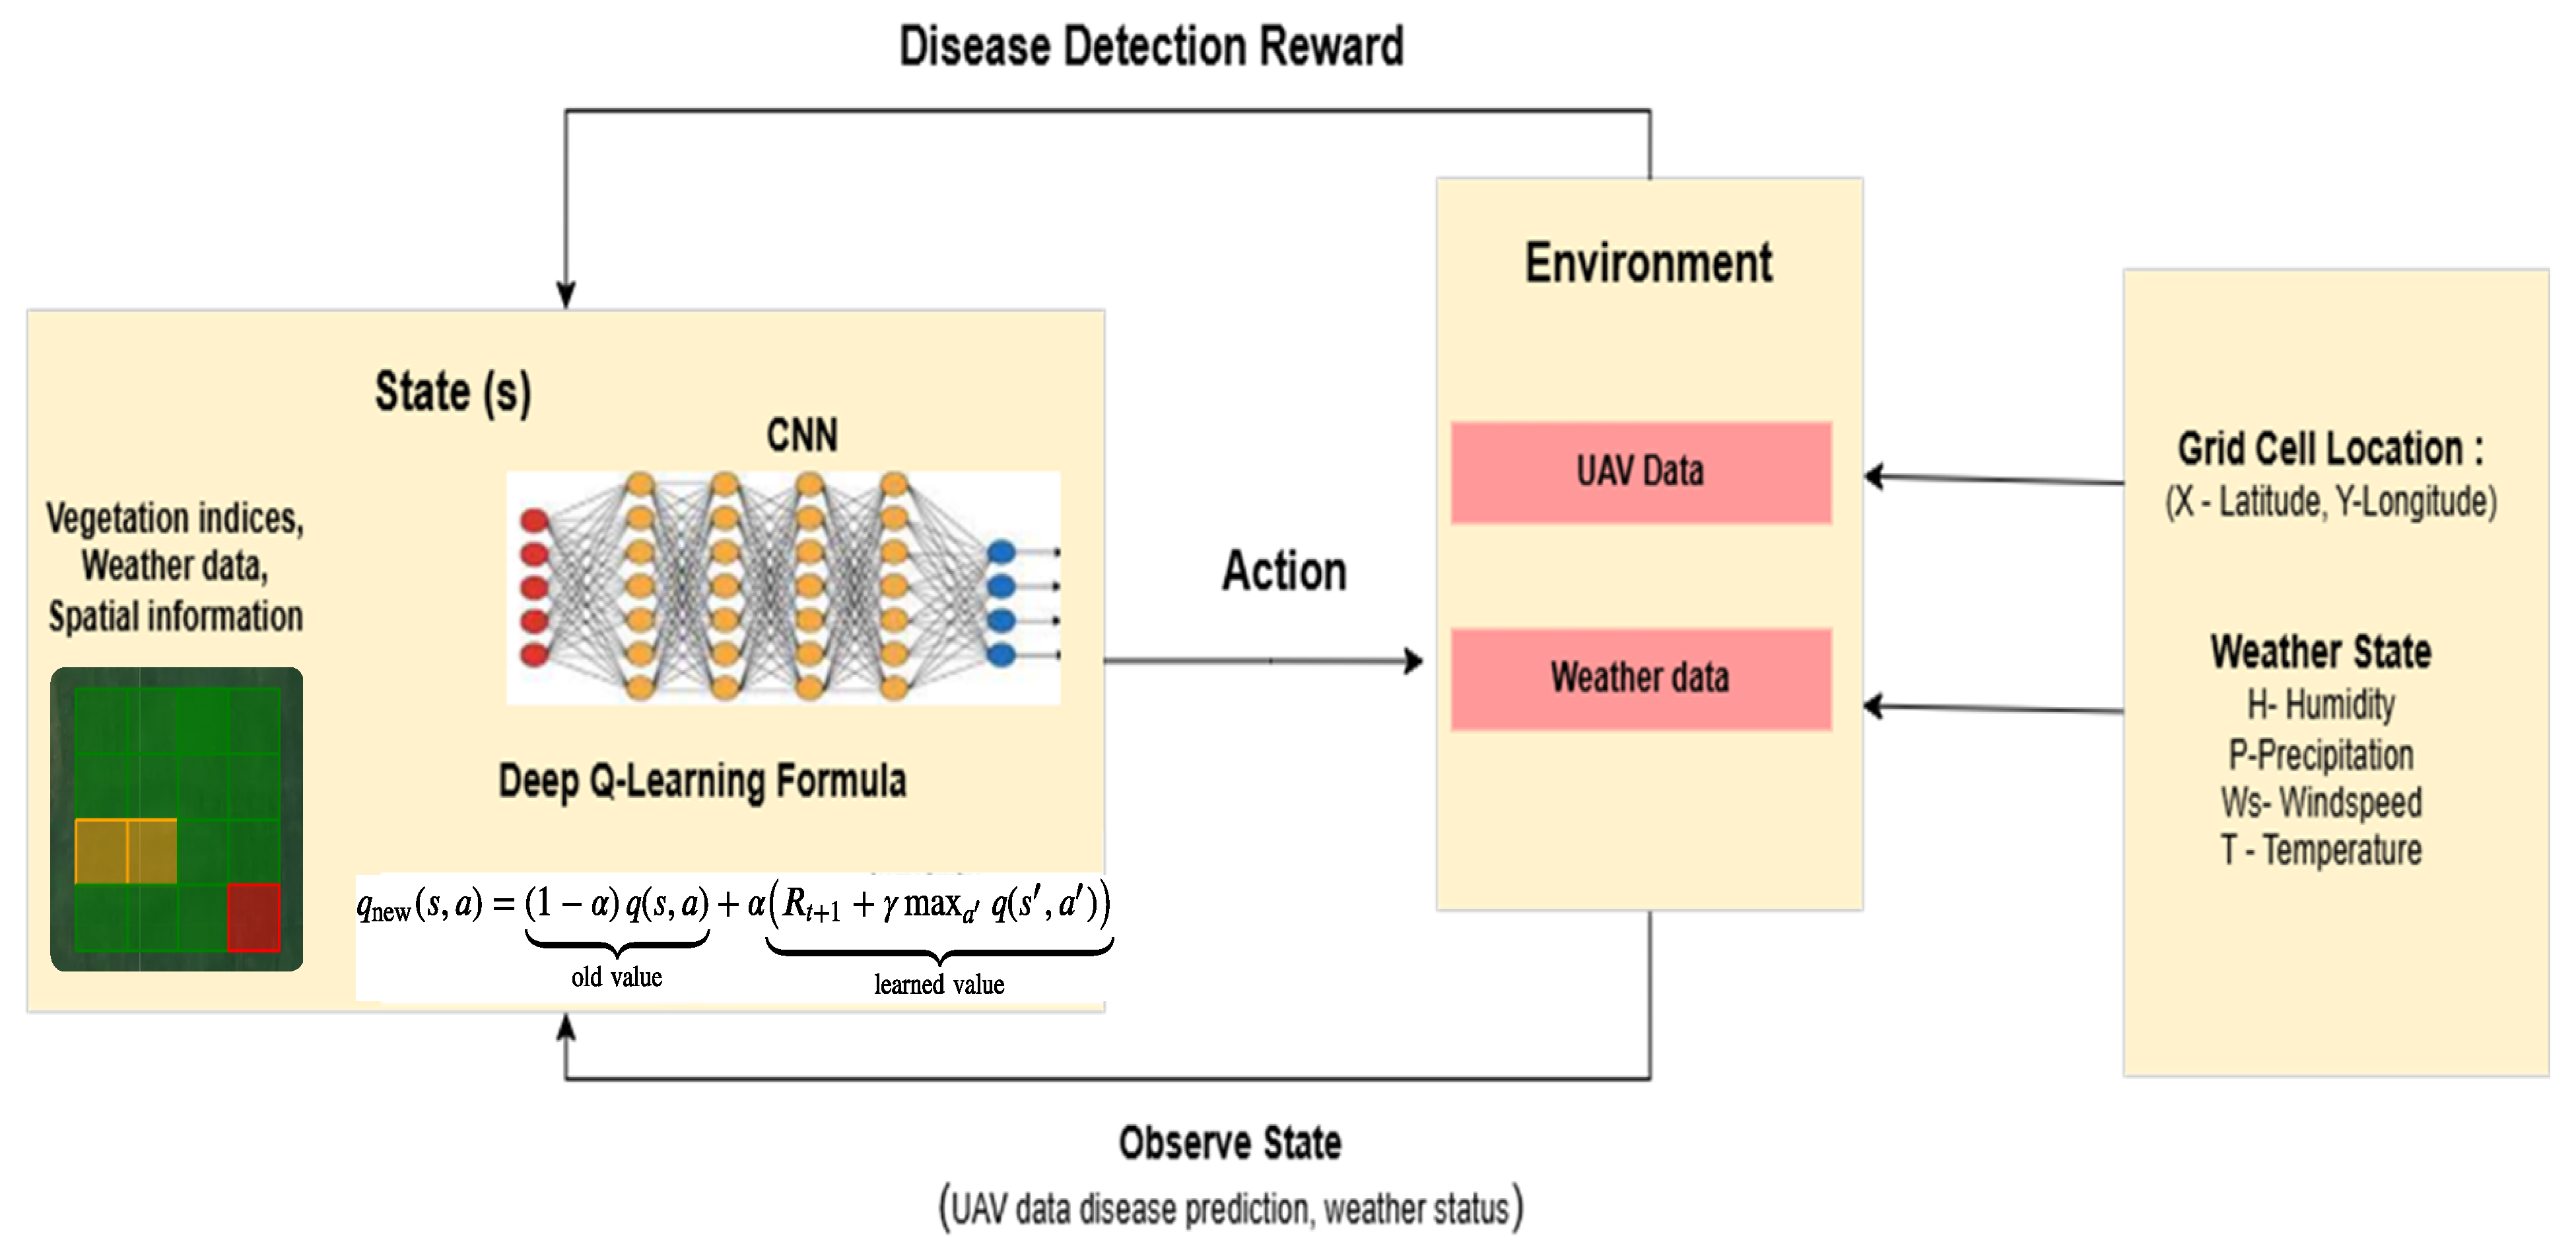
- UAV data and Vegetation indices from remote sensing data: NDVI, EVI, GCI, MSI, NDWI.
- Weather data such as temperature, humidity, precipitation, and wind speed.
- Spatial data (grid cell locations i.e; latitude and longitude).
3.4. Model Evaluation
3.4.1. Accuracy
3.4.2. Precision
3.4.3. Recall
3.4.4. F1 Score
3.4.5. Intersection over Union (IoU)
3.4.6. Mean Squared Error (MSE)
3.4.7. Cross-Entropy Loss
3.4.8. Mean Squared Error (MSE) Loss
3.4.9. Receiver Operating Characteristic (ROC) Curve
3.4.10. Area Under Curve (AUC)
4. Results
4.1. UAV (Drone) Data
4.2. Remote Sensing and Weather Data
4.3. Reinforcement Learning
5. Discussion
Future Works
6. Conclusions
Author Contributions
Funding
Data Availability Statement
Conflicts of Interest
Abbreviations
| DL | Deep Learning |
| DT | Decision Trees |
| MAPE | Mean Absolute Percentage Error |
| NLB | Northern Leaf Blight |
Appendix A. Additional Figures
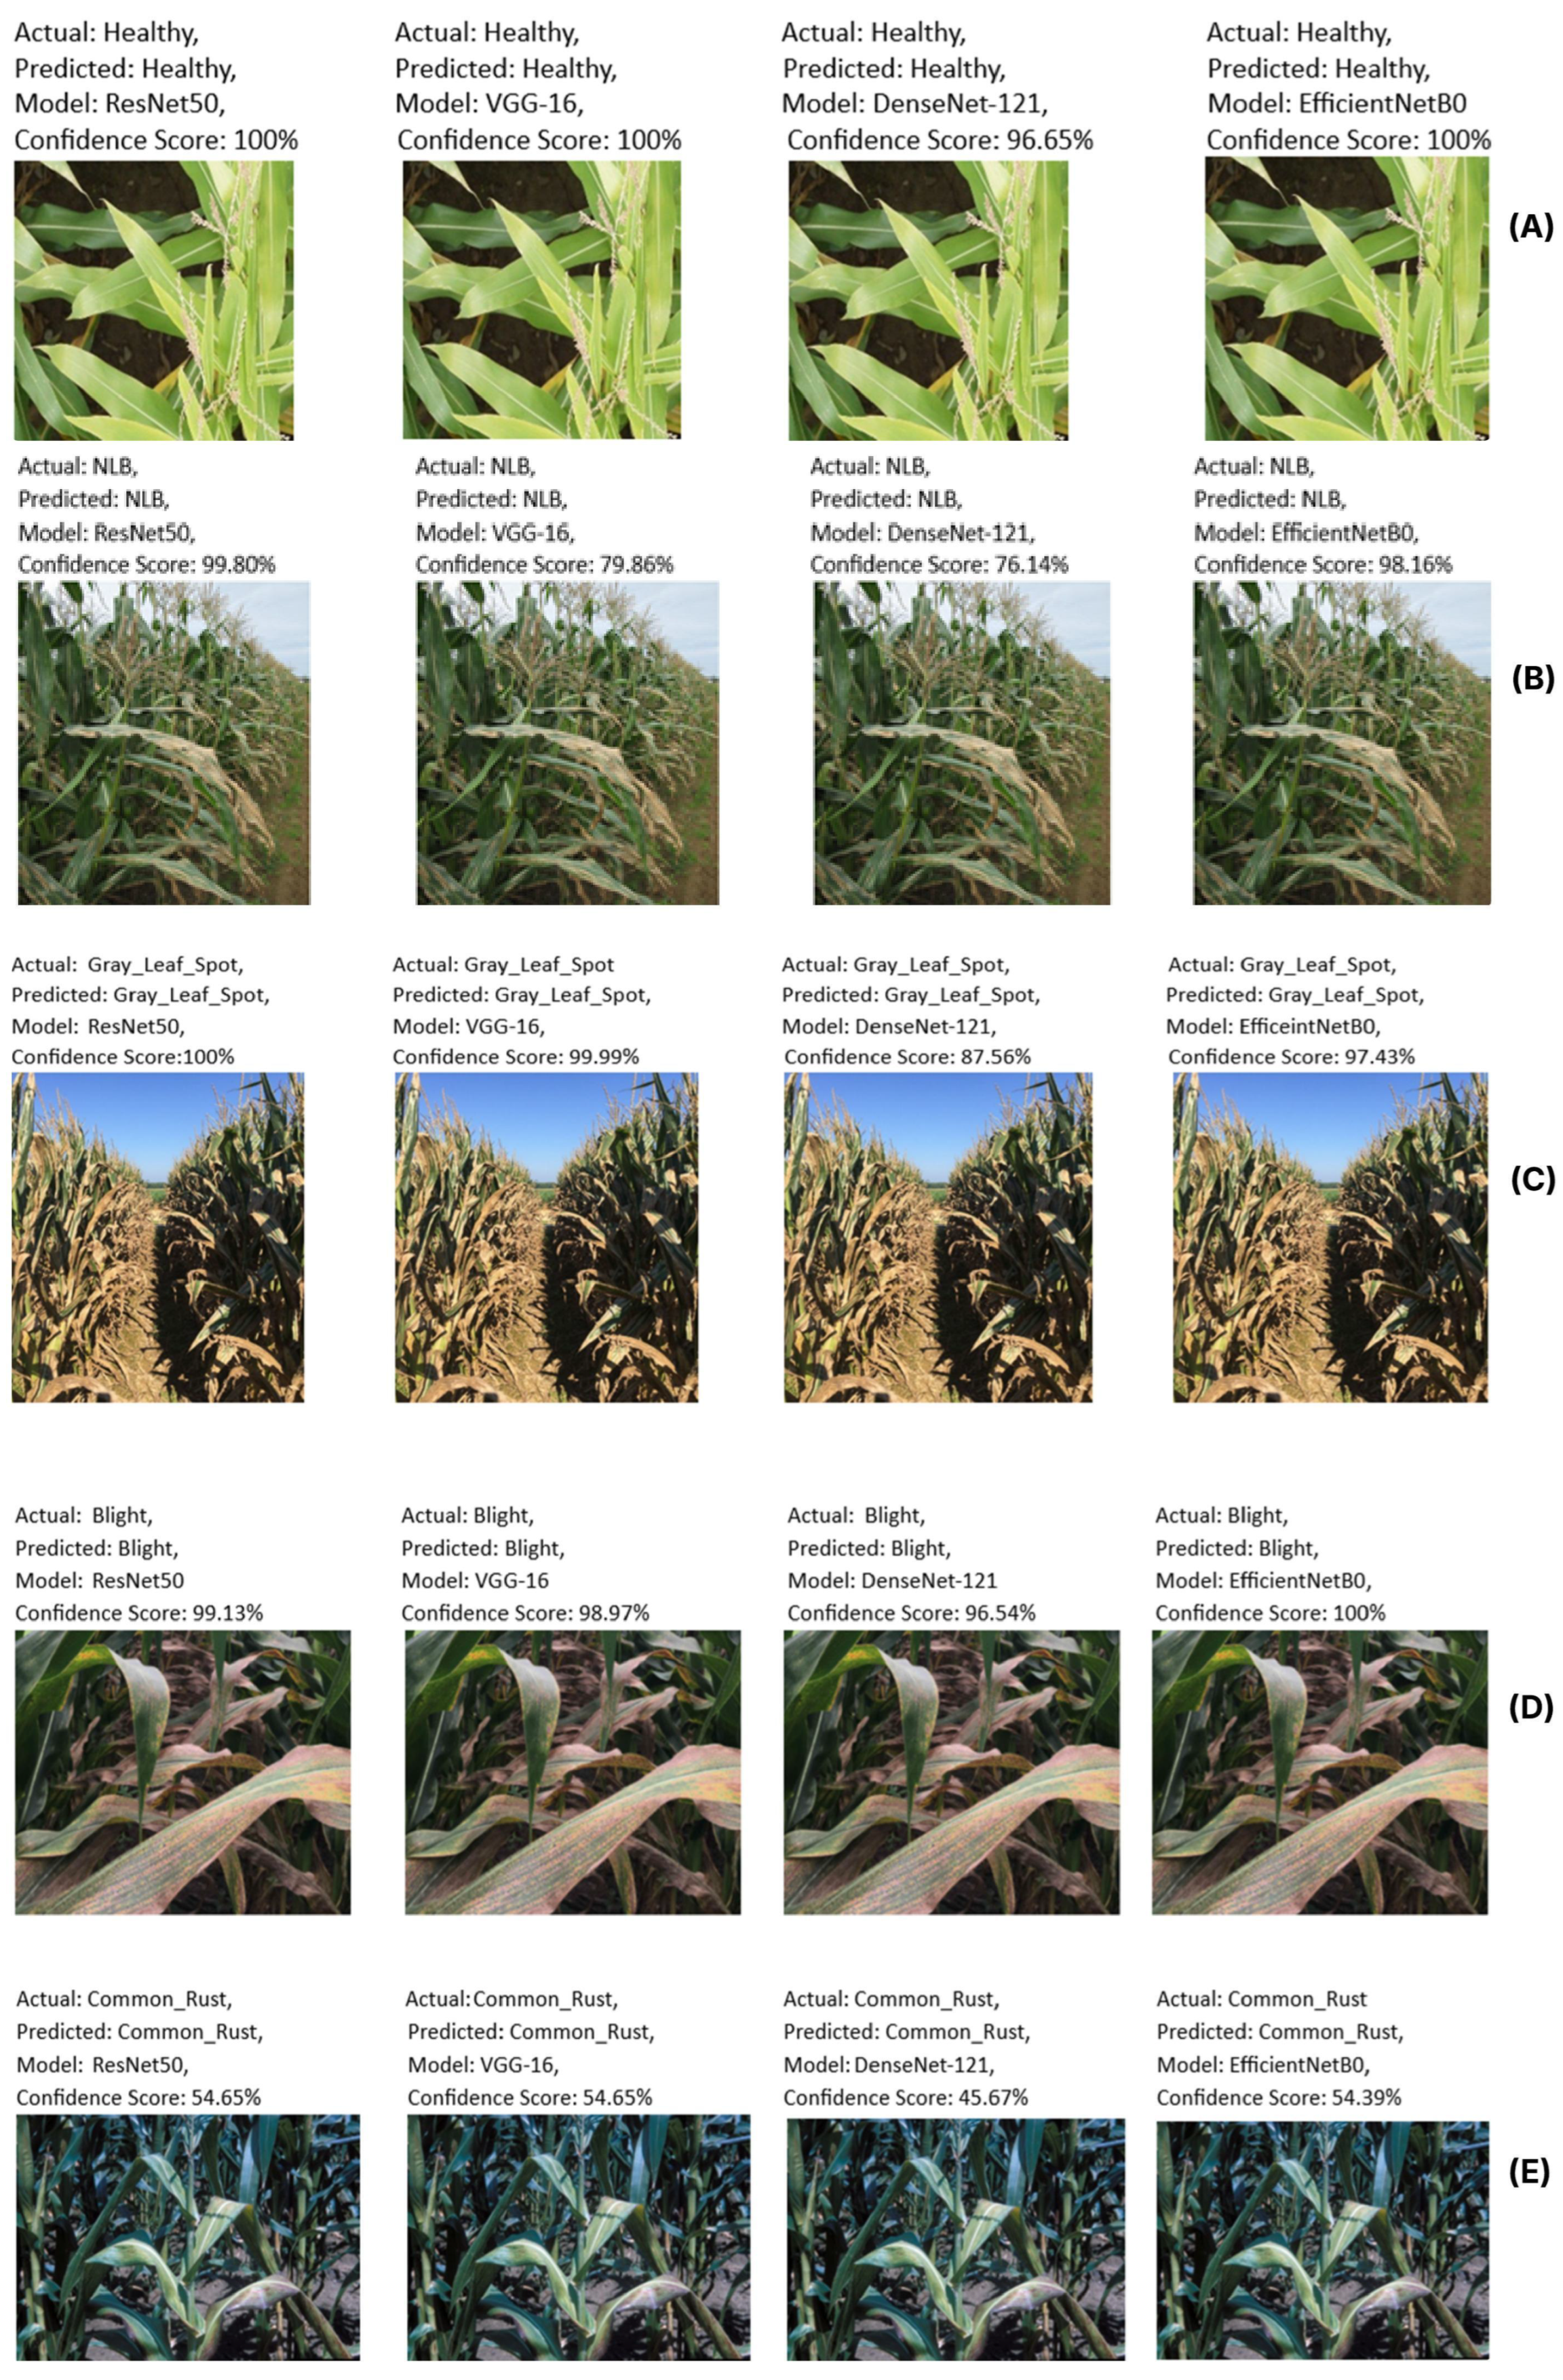
References
- Serraj, R.; Pingali, P. (Eds.) Agriculture and Food Systems to 2050: Global Trends, Challenges and Opportunities; World Scientific: London, UK, 2018. [Google Scholar] [CrossRef]
- Kuradusenge, M.; Hitimana, E.; Hanyurwimfura, D.; Rukundo, P.; Mtonga, K.; Mukasine, A.; Uwitonze, C.; Ngabonziza, J.; Uwamahoro, A. Crop Yield Prediction Using Machine Learning Models: Case of Irish Potato and Maize. Agriculture 2023, 13, 225. [Google Scholar] [CrossRef]
- Van Klompenburg, T.; Kassahun, A.; Catal, C. Crop yield prediction using machine learning: A systematic literature review. Comput. Electron. Agric. 2020, 177, 105709. [Google Scholar] [CrossRef]
- Mahlein, A.K. Plant disease detection by imaging sensors–parallels and specific demands for precision agriculture and plant phenotyping. Plant Dis. 2016, 100, 241–251. [Google Scholar] [CrossRef] [PubMed]
- Wani, J.A.; Sharma, S.; Muzamil, M.; Ahmed, S.; Sharma, S.; Singh, S. Machine learning and deep learning based computational techniques in automatic agricultural diseases detection: Methodologies, applications, and challenges. Arch. Comput. Methods Eng. 2022, 29, 641–677. [Google Scholar] [CrossRef]
- Iheke, O.R.; Ihuoma, U.U. Effect of Urbanization on Agricultural Production in Abia State;International Journal of Agricultural Science. Res. Technol. Ext. Educ. Syst. 2016, 5, 83. [Google Scholar]
- Stewart, E.L.; Wiesner-Hanks, T.; Kaczmar, N.; DeChant, C.; Wu, H.; Lipson, H.; Nelson, R.J.; Gore, M.A. Quantitative Phenotyping of Northern Leaf Blight in UAV Images Using Deep Learning. Remote Sens. 2019, 11, 2209. [Google Scholar] [CrossRef]
- Attallah, O. Deep learning-based model for paddy diseases classification by thermal infrared sensor: An application for precision agriculture. ISPRS Annals of Photogrammetry. ISPRS Ann. Photogramm. Remote Sens. Spatial Inf. Sci. 2023, X-1/W1-2023, 779–784. [Google Scholar] [CrossRef]
- Nagasubramanian, K.; Jones, S.; Singh, A.K.; Sarkar, S.; Singh, A.; Ganapathysubramanian, B. Plant disease identification using explainable 3D deep learning on hyperspectral images. Plant Methods 2019, 15, 98. Available online: https://plantmethods.biomedcentral.com/articles/10.1186/s13007-019-0479-8 (accessed on 27 November 2024).
- Navaneethan, S.; Sampath, J.; Kiran, S. Development of a Multi-Sensor Fusion Framework for Early Detection and Monitoring of Corn Plant Diseases. In Proceedings of the 2023 2nd International Conference on Automation, Computing and Renewable Systems (ICACRS), Pudukkottai, India, 11–13 December 2023; pp. 856–861. [Google Scholar] [CrossRef]
- Kitpo, N.; Inoue, M.M. Early Rice Disease Detection and Position Mapping System using Drone and IoT Architecture. In Proceedings of the 2018 12th South East Asian Technical University Consortium (SEATUC), Yogyakarta, Indonesia, 12–13 March 2018; pp. 1–5. [Google Scholar] [CrossRef]
- Shahi, T.; Xu, C.Y.; Neupane, A.; Guo, W. Recent Advances in Crop Disease Detection Using UAV and Deep Learning Techniques. Remote Sens. 2023, 15, 2450. [Google Scholar] [CrossRef]
- Prasad, A.; Mehta, N.; Horak, M.; Bae, W. A Two-Step Machine Learning Approach for Crop Disease Detection Using GAN and UAV Technology. Remote Sens. 2022, 14, 4765. [Google Scholar] [CrossRef]
- Vardhan, J.; Swetha, K.S. Detection of healthy and diseased crops in drone captured images using Deep Learning. arXiv 2023, arXiv:2305.13490. [Google Scholar] [CrossRef]
- Shill, A.; Rahman, M.A. Plant Disease Detection Based on YOLOv3 and YOLOv4. In Proceedings of the 2021 International Conference on Automation, Control and Mechatronics for Industry 4.0 (ACMI), Rajshahi, Bangladesh, 8–9 July 2021; pp. 1–6. [Google Scholar] [CrossRef]
- Chin, R.; Catal, C.; Kassahun, A. Plant disease detection using drones in precision agriculture. Precis. Agric. 2023, 24, 1663–1682. [Google Scholar] [CrossRef]
- Johannes, A.; Picon, A.; Alvarez-Gila, A.; Echazarra, J.; Rodriguez-Vaamonde, S.; Navajas, A.D.; Ortiz-Barredo, A. Automatic plant disease diagnosis using mobile capture devices, applied on a wheat use case. Comput. Electron. Agric. 2017, 138, 200–209. [Google Scholar] [CrossRef]
- Ma, J.; Du, K.; Zheng, F.; Zhang, L.; Gong, Z.; Sun, Z. A recognition method for cucumber diseases using leaf symptom images based on deep convolutional neural network. Comput. Electron. Agric. 2018, 154, 18–24. [Google Scholar] [CrossRef]
- Kowalska, A.; Ashraf, H. Advances in Deep Learning Algorithms for Agricultural Monitoring and Management. Appl. Res. Artif. Intell. Cloud Comput. 2021, 6, 68–88. [Google Scholar]
- Liang, Q.; Xiang, S.; Hu, Y.; Coppola, G.; Zhang, D.; Sun, W. PD2SE-Net: Computer-assisted plant disease diagnosis and severity estimation network. Comput. Electron. Agric. 2019, 157, 518–529. [Google Scholar] [CrossRef]
- John, A.; Bhyregowda, P.; Dutta, M.; Liu., J.; Gao, J. Advanced Carbon Monitoring in Agriculture using Remote Sensing and Machine Learning Techniques. In Proceedings of the 2025 IEEE Conference on Artificial Intelligence (CAI), Santa Clara, CA, USA, 5–7 May 2025. [Google Scholar] [CrossRef]
- Gao, Z.; Luo, Z.; Zhang, W.; Lv, Z.; Xu, Y. Deep Learning Application in Plant Stress Imaging: A Review. AgriEngineering 2020, 2, 430–446. [Google Scholar] [CrossRef]
- DeChant, C.; Wiesner-Hanks, T.; Chen, S.; Stewart, E.L.; Yosinski, J.; Gore, M.A.; Nelson, R.J.; Lipson, H. Automated identification of northern leaf blight-infected maize plants from field imagery using deep learning. Phytopathology 2017, 107, 1426–1432. [Google Scholar] [CrossRef]
- Devi, E.A.; Gopi, S.; Padmavathi, U.; Arumugam, S.R.; Premnath, S.P.; Muralitharan, D. Plant disease classification using CNN-LSTM techniques. In Proceedings of the 2023 5th International Conference on Smart Systems and Inventive Technology (ICSSIT), Tirunelveli, India, 23–25 January 2023; IEEE: Piscataway, NJ, USA, 2023; pp. 1225–1229. [Google Scholar] [CrossRef]
- UAV dataset Musgrave Research Farms. Available online: https://www.kaggle.com/datasets/alexanderyevchenko/corn-disease-drone-images (accessed on 1 December 2024).
- Musgrave Research Farm. Available online: https://cals.cornell.edu/agricultural-experiment-station/research-farms/musgrave-research-farm (accessed on 27 November 2024).
- Multispectral Remote Sensing with MODIS Data in Python |Earth Lab. (n.d.). Earth Data Science. Available online: https://www.earthdatascience.org/courses/use-data-open-source-python/multispectral-remote-sensing/modis-data-in-python (accessed on 27 November 2024).
- Available online: https://www.ncei.noaa.gov/access/search/data-search/local-climatological-data?pageNum=1&startDate=2017-12-31T00:00:00&endDate=2018-12-31T23:59:59&bbox=43.120,-76.219,42.976,-76.075 (accessed on 27 November 2024).
- Hunt, E.R.; Rock, B.N. Detection of changes in leaf water content using near- and middle-infrared reflectances. Remote Sens. Environ. 1989, 30, 43–54. [Google Scholar] [CrossRef]
- Gitelson, A.A.; Merzlyak, M.N.; Lichtenthaler, H.K. Detection of red edge position and chlorophyll content by reflectance measurements near 700 nm. J. Plant Physiol. 1996, 148, 501–508. [Google Scholar] [CrossRef]
- Huete, A.; Didan, K.; Miura, T.; Rodriguez, E.P.; Gao, X.; Ferreira, L.G. Overview of the radiometric and biophysical performance of the MODIS vegetation indices. Remote Sens. Environ. 2022, 83, 195–213. [Google Scholar] [CrossRef]
- Gitelson, A.A.; Kaufman, Y.J.; Merzlyak, M.N. Use of a green channel in remote sensing of global vegetation from EOS-MODIS. Remote Sens. Environ. 1996, 58, 289–298. [Google Scholar] [CrossRef]
- Peñuelas, J.; Filella, I.; Gamon, J.A. Assessment of photosynthetic radiation-use efficiency with spectral reflectance. New Phytologist 1995, 131, 291–296. [Google Scholar] [CrossRef]
- Kim, W.-S.; Lee, D.-H.; Kim, Y.-J. Machine vision-based automatic disease symptom detection of onion downy mildew. Comput. Electron. Agric. 2020, 168, 105099. [Google Scholar] [CrossRef]
- Bock, C.; Poole, G.; Parker, P.; Gottwald, T.R. Plant disease severity estimated visually, by digital photography and image analysis, and by hyperspectral imaging. Crit. Rev. Plant Sci. 2010, 29, 59–107. [Google Scholar] [CrossRef]


| Model | Purpose | Advantages | Disadvantages | Use Case |
|---|---|---|---|---|
| Improved VGG-16 [18] | Image Classification for crop diseases | Reduces computational cost, high accuracy with depth-wise convolutions | Computationally expensive for deep layers | Identify and classify diseases (Blight, Common Rust, NLB, Gray Leaf Spot, Healthy) from UAV imagery |
| Improved DenseNet-121 [7] | Detect disease patterns and fine textures | Feature reuse, effective on UAV data, prevents overfitting | High complexity, requires extensive pre-processing | Extract and identify subtle disease features like leaf spots and discoloration |
| Improved ResNet-50 [14] | Multi-class disease classification | Handles vanishing gradient problems, robust to subtle disease features | Memory intensive, slower inference | Classify multiple diseases from UAV images with high feature complexity |
| Improved EfficientNet-B0 [15] | Real-time disease detection | Scalable, handles high-resolution images | Complex patterns not effectively identified without high resolution | Monitoring large-scale farmland diseases using UAV |
| Improved LSTM [23] | Sequential data analysis for disease progression | Time-series handling, robust for temporal predictions | High computational time, sensitive to hyper-parameters | Predicting disease progression using weather and vegetation indices |
| Improved Bi-LSTM [24] | Capturing temporal and bidirectional patterns | Disease progression analysis, learns historical and future dependencies | Requires substantial data, resource intensive | Analyzing disease trends in historical and future contexts |
| SVR [12] | Estimate disease severity levels | Captures non-linear features | Limited performance for complex patterns | Estimating severity levels from remote sensing satellite data |
| Product | PlantSnap | Fasal | Agrio | Plantix |
|---|---|---|---|---|
| Features | ||||
| Disease risk forecasting | Yes | Yes | Yes | No |
| Treatment recommendations | Yes | Yes | Yes | Yes |
| Preventative measure recommendations | No | Yes | Yes | Yes |
| AI-powered disease analysis | Yes | Yes | Yes | Yes |
| Data Type | ||||
| Drone | No | No | Yes | No |
| Weather | No | Yes | Yes | Yes |
| Remote sensing | No | Yes | Yes | No |
| Cost | ||||
| Pay-per-acre service | No | No | No | No |
| Subscription-based pricing | No | Yes | Yes | No |
| Premium model | Yes | No | Yes | Yes |
| Crop | Disease/Healthy | Total Images |
|---|---|---|
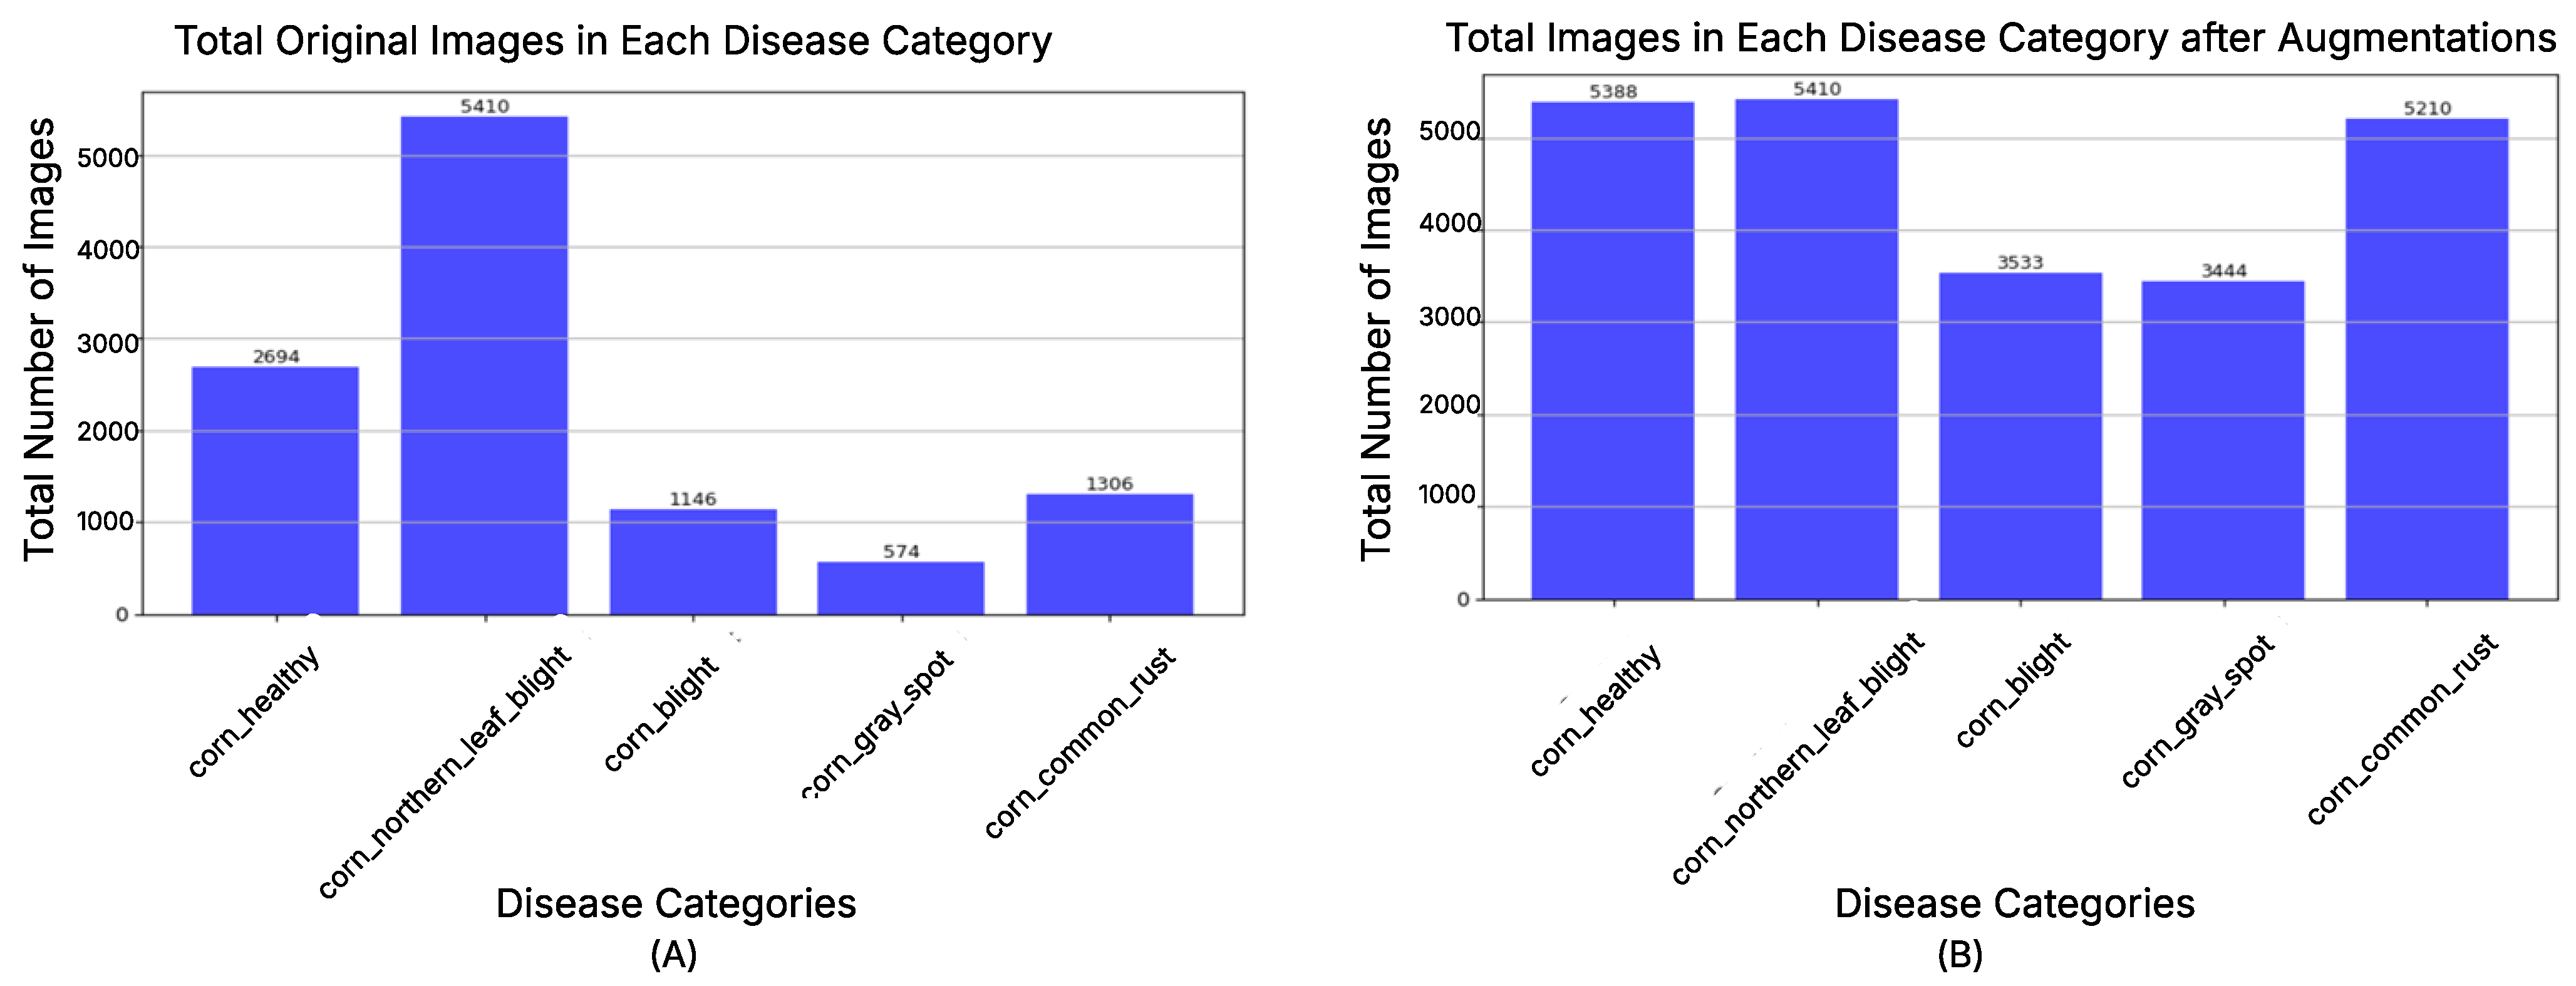
| Corn | Northern Leaf Blight (NLB) | 5410 |
| Healthy | 2694 | |
| Common Rust | 1306 | |
| Gray Leaf Spot | 574 | |
| Blight | 1146 |
| Fields | Data Type | Description | Range | Unit |
|---|---|---|---|---|
| Latitude | Float | Latitude of the inner grid centroid | 42.8762 | Degree |
| Longitude | Float | Longitude of the inner grid centroid | −76.9817 | Degree |
| Date | Datetime | Image capture range from MODIS | (1 November 2017, 31 December 2018) | NA |
| EVI | Float | From NIR, Red, Blue bands | −1 to +1 | NA |
| GCI | Float | From NIR and Green bands | −1 to +1 | NA |
| NDRE | Float | From NIR and Red Edge bands | −1 to +1 | NA |
| SIPI | Float | From NIR, Red, Blue bands | 0 to 1 | NA |
| MSI | Float | From NIR and SWIR bands | 0 and above | NA |
| Stage | Column/Type | Number |
|---|---|---|
| Raw | surf_Refl_b01 | |
| surf_Refl_b02 | ||
| surf_Refl_b03 | ||
| surf_Refl_b04 | 9967 rows, 18 columns | |
| surf_Refl_b05 | ||
| surf_Refl_b06 | ||
| surf_Refl_b07 | ||
| Processed | GCI | |
| SIPI | ||
| MSI | 9967 rows, 18 columns | |
| NDRE | ||
| EVI | ||
| Preparation | Training data | 7475 rows, 14 columns |
| Test data | 2492 rows, 5 columns |
| Dataset | Raw | After Pre-Processing | After Augmentation | Prepared (Train/Test) |
|---|---|---|---|---|
| UAV images (Visual model) | 9967 images | 9967 images | 22,937 images | 17,202/5735 images |
| Weather + Remote Sensing | 9967 × 18 | 9967 × 18 | 9967 × 18 | 7475 × 14/2492 × 5 |
| Vegetation Index | Range/Threshold | Health Indicator |
|---|---|---|
| NDRE | to | Developing crop |
| to | Unhealthy crop | |
| to | Healthy crop | |
| SIPI | to | Healthy crop |
| Other values | Unhealthy crop | |
| GCI | to | Green, healthy crop |
| Other values | Unhealthy crop | |
| EVI | 0.0 to 0.2 | Unhealthy vegetation |
| 0.2 to 0.5 | Moderate vegetation | |
| 0.5 to 0.9 | Healthy vegetation |
| Model | Input | Justification | Accuracy | Merits and Drawbacks |
|---|---|---|---|---|
| Improved VGG-16 | Drone Images | Modified with depth-wise separable convolutions, batch normalization, dropout; reduces compute and improves accuracy for UAV images. | Common Rust—99.19%, NLB—84.02%, Blight—92%, Gray Leaf Spot—93.10%, Healthy—83.04% | Merits: Efficient for high-resolution images; robust to appearance variation. Drawbacks: High computational cost for deeper layers. |
| Improved ResNet-50 | Drone Images | Enhanced with SE blocks and residual connections to emphasize disease-specific features and stabilize deep training. | Common Rust—100%, NLB—88.34%, Blight—97.41%, Gray Leaf Spot—98.32%, Healthy—86.14% | Merits: Captures visual and textural features; robust classification. Drawbacks: Slightly more complex model. |
| Improved DenseNet-121 | Drone Images | Dense connections with task-specific layers to capture fine-grained textures and improve UAV disease detection. | Common Rust—97.36%, NLB—82%, Blight—86.29%, Gray Leaf Spot—83.65%, Healthy—82.14% | Merits: Captures complex patterns and features. Drawbacks: Requires more memory, slower inference. |
| Improved EfficientNet-B0 | Drone Images | Compound scaling and SE blocks with resized inputs for efficient, high-accuracy classification at lower cost. | Common Rust—100%, NLB—85.73%, Blight—86.29%, Gray Leaf Spot—83.65%, Healthy—82.14% | Merits: Flexible scaling across devices. Drawbacks: May miss subtle patterns unless higher-resolution inputs are used. |
| LSTM | Remote Sensing Data | Learns temporal patterns in vegetation indices to capture disease progression over time. | Common Rust—88.90%, NLB—76.34%, Blight—83.41%, Gray Leaf Spot—85.46%, Healthy—68.98% | Merits: Handles sequential dependencies. Drawbacks: Computationally heavy; hyperparameter-sensitive. |
| Bi-LSTM | Remote Sensing Data | Captures both past and future dependencies in sequential data for better disease trend analysis. | Common Rust—89.18%, NLB—64.02%, Blight—84%, Gray Leaf Spot—82.56%, Healthy—76.04% | Merits: Robust to noise with bidirectional context. Drawbacks: Higher computational demand, needs more data. |
| SVR | Remote Sensing Data | Maps vegetation indices to disease classes using kernel functions; effective for smaller datasets. | Common Rust—87.36%, NLB—78.32%, Blight—78.29%, Gray Leaf Spot—78.65%, Healthy—68.14% | Merits: Simple, low computation. Drawbacks: Limited on highly non-linear patterns. |
| Reward | Scenario |
|---|---|
| [+1, −1] | If the model moves to a grid where NDVI is increasing, reward +1. Otherwise, reward −1. |
| [+1, −1] | If the model moves to a grid with optimal temperature (20–30 °C), reward +1. Otherwise, reward −1. |
| [0, +1] | If the model moves to a grid with stable NDRE (low plant stress), reward +1. Otherwise, reward 0. |
| [0, −1] | If the model moves to a grid where EVI is decreasing, reward −1. Otherwise, reward 0. |
| [−1, +1] | If the model moves to a grid with high SIPI (good chlorophyll content), reward +1. Otherwise, reward −1. |
| [−1, +1] | If the model moves to a grid with low SIPI (low chlorophyll content), reward −1. Otherwise, reward +1. |
| [0, +1] | If the model moves to a grid where temperature and NDVI are both favorable, reward +1. Otherwise, reward 0. |
| Model | Accuracy (%) | Precision (%) | Recall (%) | F1-Score (%) |
|---|---|---|---|---|
| ResNet-50 | 92.54 | 93.20 | 92.20 | 92.40 |
| VGG-16 | 90.12 | 90.00 | 90.02 | 91.32 |
| EfficientNetB0 | 91.40 | 91.38 | 91.38 | 91.20 |
| DenseNet-121 | 88.77 | 90.08 | 89.18 | 89.42 |
| Hybrid Model | 93.64 | 94.35 | 92.18 | 93.14 |
| Ensemble (Soft Voting) | 91.98 | 93.80 | 90.16 | 92.36 |
| Model | Classes | Training Samples | Testing Samples | Accuracy (%) | Testing Time (s) |
|---|---|---|---|---|---|
| ResNet-50 | NLB | 4033 | 1377 | 88.34 | 14.09 |
| Blight | 2655 | 878 | 97.41 | 9.85 | |
| Common Rust | 3900 | 1310 | 100.00 | 13.10 | |
| Gray Leaf Spot | 2617 | 821 | 98.32 | 10.13 | |
| Healthy | 3997 | 1349 | 86.14 | 13.21 | |
| VGG-16 | NLB | 4033 | 1377 | 84.02 | 14.10 |
| Blight | 2655 | 878 | 92.00 | 10.10 | |
| Common Rust | 3900 | 1310 | 99.19 | 13.19 | |
| Gray Leaf Spot | 2617 | 821 | 93.10 | 10.15 | |
| Healthy | 3997 | 1349 | 83.04 | 13.28 | |
| DenseNet-121 | NLB | 4033 | 1377 | 82.00 | 14.10 |
| Blight | 2655 | 878 | 86.29 | 10.10 | |
| Common Rust | 3900 | 1310 | 97.36 | 13.19 | |
| Gray Leaf Spot | 2617 | 821 | 83.65 | 10.10 | |
| Healthy | 3997 | 1349 | 82.14 | 13.54 | |
| EfficientNetB0 | NLB | 4033 | 1377 | 85.73 | 10.15 |
| Blight | 2655 | 878 | 93.00 | 10.15 | |
| Common Rust | 3900 | 1310 | 100.00 | 13.10 | |
| Gray Leaf Spot | 2617 | 821 | 93.87 | 10.18 | |
| Healthy | 3997 | 1349 | 85.78 | 13.21 | |
| Hybrid Model | NLB | 4033 | 1377 | 88.34 | 14.09 |
| Blight | 2655 | 878 | 97.41 | 9.85 | |
| Common Rust | 3900 | 1310 | 100.00 | 13.10 | |
| Gray Leaf Spot | 2617 | 821 | 98.32 | 10.13 | |
| Healthy | 3997 | 1349 | 86.14 | 13.21 | |
| Model Ensemble (Soft Voting) | NLB | 4033 | 1377 | 85.73 | 13.21 |
| Blight | 2655 | 878 | 93.00 | 10.01 | |
| Common Rust | 3900 | 1310 | 100.00 | 13.14 | |
| Gray Leaf Spot | 2617 | 821 | 93.87 | 10.11 | |
| Healthy | 3997 | 1349 | 85.78 | 13.24 |
| Model | Class | Train Samples | Test Samples | MAPE (%) | Accuracy (%) | Testing Time (s) |
|---|---|---|---|---|---|---|
| LSTM | NLB | 4033 | 1377 | 4.21 | 76.34 | 14.50 |
| Blight | 2655 | 878 | 3.26 | 83.41 | 10.10 | |
| Common Rust | 3900 | 1310 | 2.89 | 88.90 | 13.50 | |
| Gray Leaf Spot | 2617 | 821 | 3.35 | 85.46 | 10.25 | |
| Healthy | 3997 | 1349 | 2.05 | 68.98 | 13.21 | |
| Bi-LSTM | NLB | 4033 | 1377 | 3.95 | 64.02 | 13.90 |
| Blight | 2655 | 878 | 2.98 | 84.00 | 9.45 | |
| Common Rust | 3900 | 1310 | 3.12 | 89.18 | 12.60 | |
| Gray Leaf Spot | 2617 | 821 | 3.41 | 82.56 | 9.98 | |
| Healthy | 3997 | 1349 | 1.89 | 76.04 | 8.20 | |
| SVR | NLB | 4033 | 1377 | 4.87 | 78.32 | 15.30 |
| Blight | 2655 | 878 | 3.85 | 78.29 | 11.05 | |
| Common Rust | 3900 | 1310 | 3.49 | 87.36 | 14.75 | |
| Gray Leaf Spot | 2617 | 821 | 3.78 | 78.65 | 11.42 | |
| Healthy | 3997 | 1349 | 2.25 | 68.14 | 8.80 | |
| Model Ensemble | NLB | 4033 | 1377 | 2.76 | 82.21 | 13.20 |
| Blight | 2655 | 878 | 2.12 | 88.67 | 9.78 | |
| Common Rust | 3900 | 1310 | 1.94 | 93.50 | 12.98 | |
| Gray Leaf Spot | 2617 | 821 | 2.01 | 90.42 | 10.50 | |
| Healthy | 3997 | 1349 | 1.62 | 79.23 | 7.85 |
Disclaimer/Publisher’s Note: The statements, opinions and data contained in all publications are solely those of the individual author(s) and contributor(s) and not of MDPI and/or the editor(s). MDPI and/or the editor(s) disclaim responsibility for any injury to people or property resulting from any ideas, methods, instructions or products referred to in the content. |
© 2025 by the authors. Licensee MDPI, Basel, Switzerland. This article is an open access article distributed under the terms and conditions of the Creative Commons Attribution (CC BY) license (https://creativecommons.org/licenses/by/4.0/).
Share and Cite
Gao, J.; Gujarati, K.; Hegde, M.; Arra, P.; Gupta, S.; Buch, N. Integration of UAV and Remote Sensing Data for Early Diagnosis and Severity Mapping of Diseases in Maize Crop Through Deep Learning and Reinforcement Learning. Remote Sens. 2025, 17, 3427. https://doi.org/10.3390/rs17203427
Gao J, Gujarati K, Hegde M, Arra P, Gupta S, Buch N. Integration of UAV and Remote Sensing Data for Early Diagnosis and Severity Mapping of Diseases in Maize Crop Through Deep Learning and Reinforcement Learning. Remote Sensing. 2025; 17(20):3427. https://doi.org/10.3390/rs17203427
Chicago/Turabian StyleGao, Jerry, Krinal Gujarati, Meghana Hegde, Padmini Arra, Sejal Gupta, and Neeraja Buch. 2025. "Integration of UAV and Remote Sensing Data for Early Diagnosis and Severity Mapping of Diseases in Maize Crop Through Deep Learning and Reinforcement Learning" Remote Sensing 17, no. 20: 3427. https://doi.org/10.3390/rs17203427
APA StyleGao, J., Gujarati, K., Hegde, M., Arra, P., Gupta, S., & Buch, N. (2025). Integration of UAV and Remote Sensing Data for Early Diagnosis and Severity Mapping of Diseases in Maize Crop Through Deep Learning and Reinforcement Learning. Remote Sensing, 17(20), 3427. https://doi.org/10.3390/rs17203427


