Structural Health Monitoring of Anaerobic Lagoon Floating Covers Using UAV-Based LiDAR and Photogrammetry
Abstract
Highlights
- Integrating UAV LiDAR with photogrammetry produced DEMs and orthomosaics approximately four times faster while maintaining centimetre-level accuracy.
- UAV-based monitoring of the anaerobic lagoon’s floating cover shows rapid uplift in the first two years, followed by lateral displacement and increased wrinkling associated with scum accumulation.
- This faster, accurate pipeline enables routine condition tracking and earlier interventions, improving asset reliability and safety.
- These diagnostics safeguard methane capture and odour control and provide a practical basis for digital twin and autonomous SHM at Melbourne Water’s Western Treatment Plant.
Abstract
1. Introduction
2. Methods
2.1. Overview of Workflow
2.2. UAV Data Acquisition and Flight Setup
2.3. UAV LiDAR and Photogrammetry Approach
2.3.1. Flight Surveys and Dataset
2.3.2. Photogrammetry Method
2.3.3. Integrated LiDAR and Photogrammetry Method
2.4. Geospatial Data Accuracy Assessment
2.4.1. Porthole Checkpoints
2.4.2. DEM Noise Quality
2.4.3. Visualisation Enhancement of Wrinkle Profile
2.5. Relative In-Plane and Out-of-Plane Displacements Estimation
2.5.1. Local Coordinate System Transformation
2.5.2. Tracking of Natural and Artificial Features
2.6. Theoretical and Technological Innovations
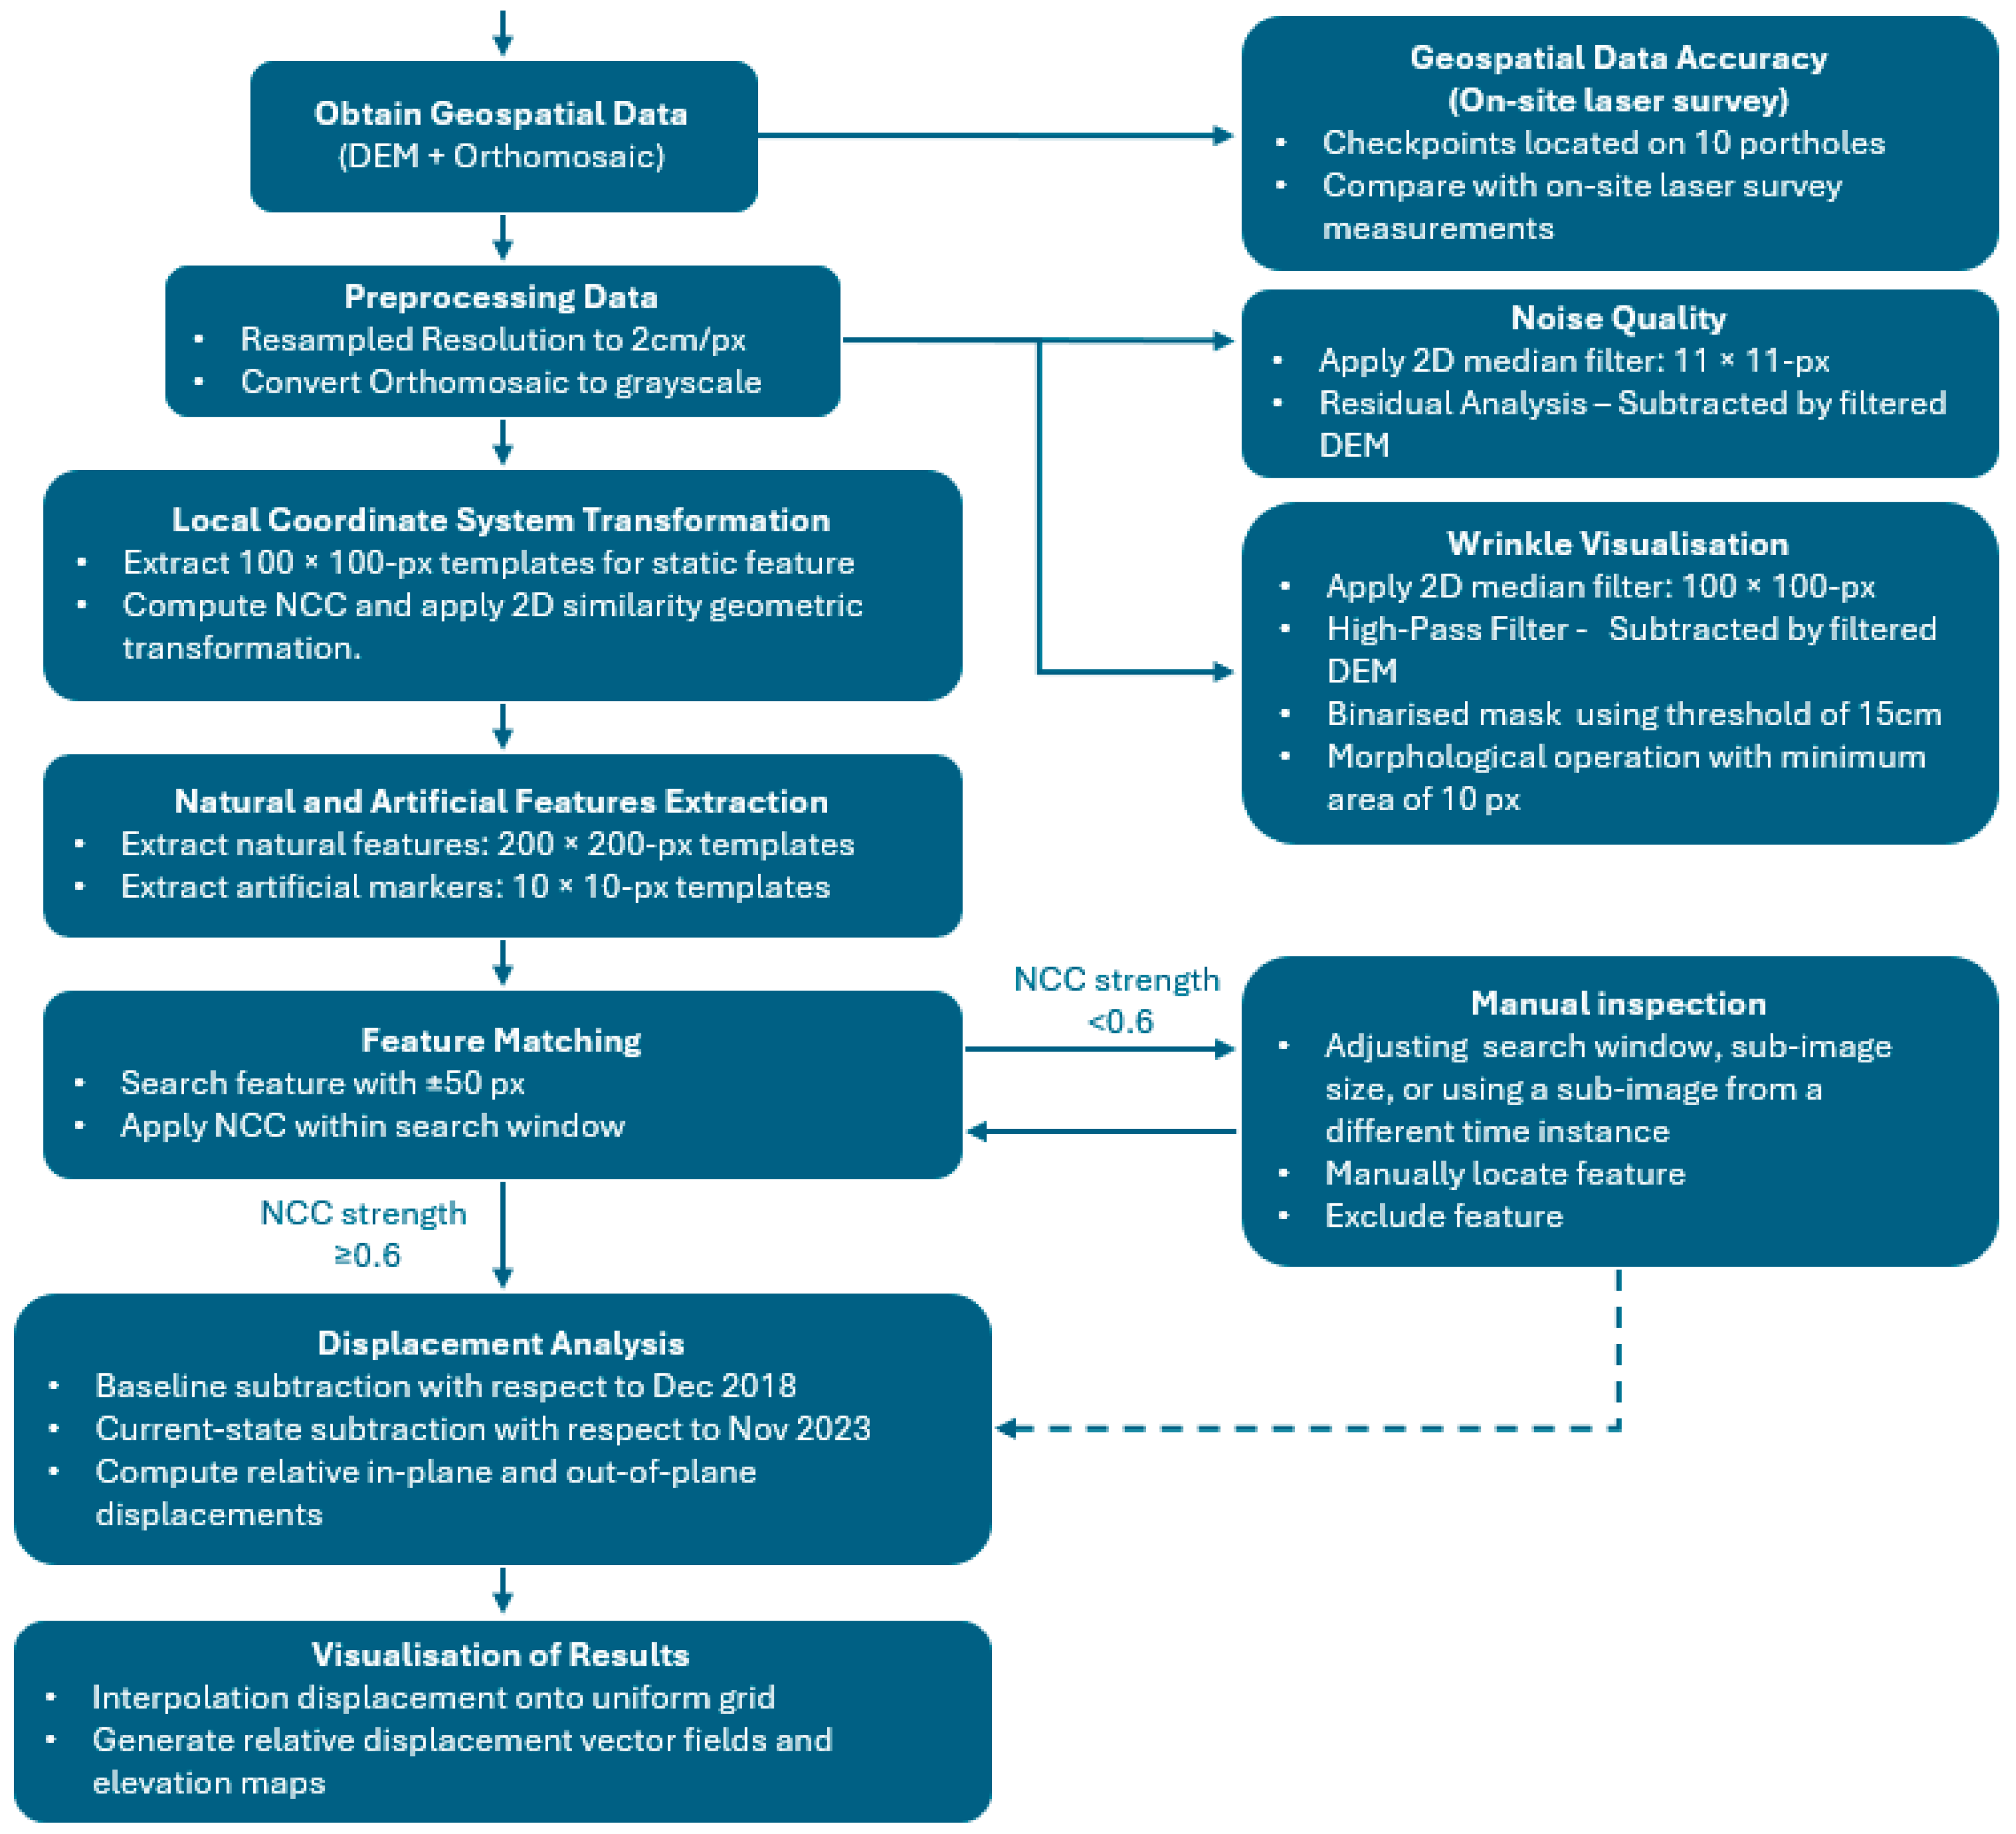
- Geometry-anchored fusion. High-resolution RGB imagery is orthorectified onto LiDAR-derived DEMs, producing a geometry-anchored orthomosaic in which LiDAR constrains out-of-plane elevation while image alignment preserves in-plane texture. This bypasses photogrammetric dense-depth reconstruction and enables unified analysis in all directions.
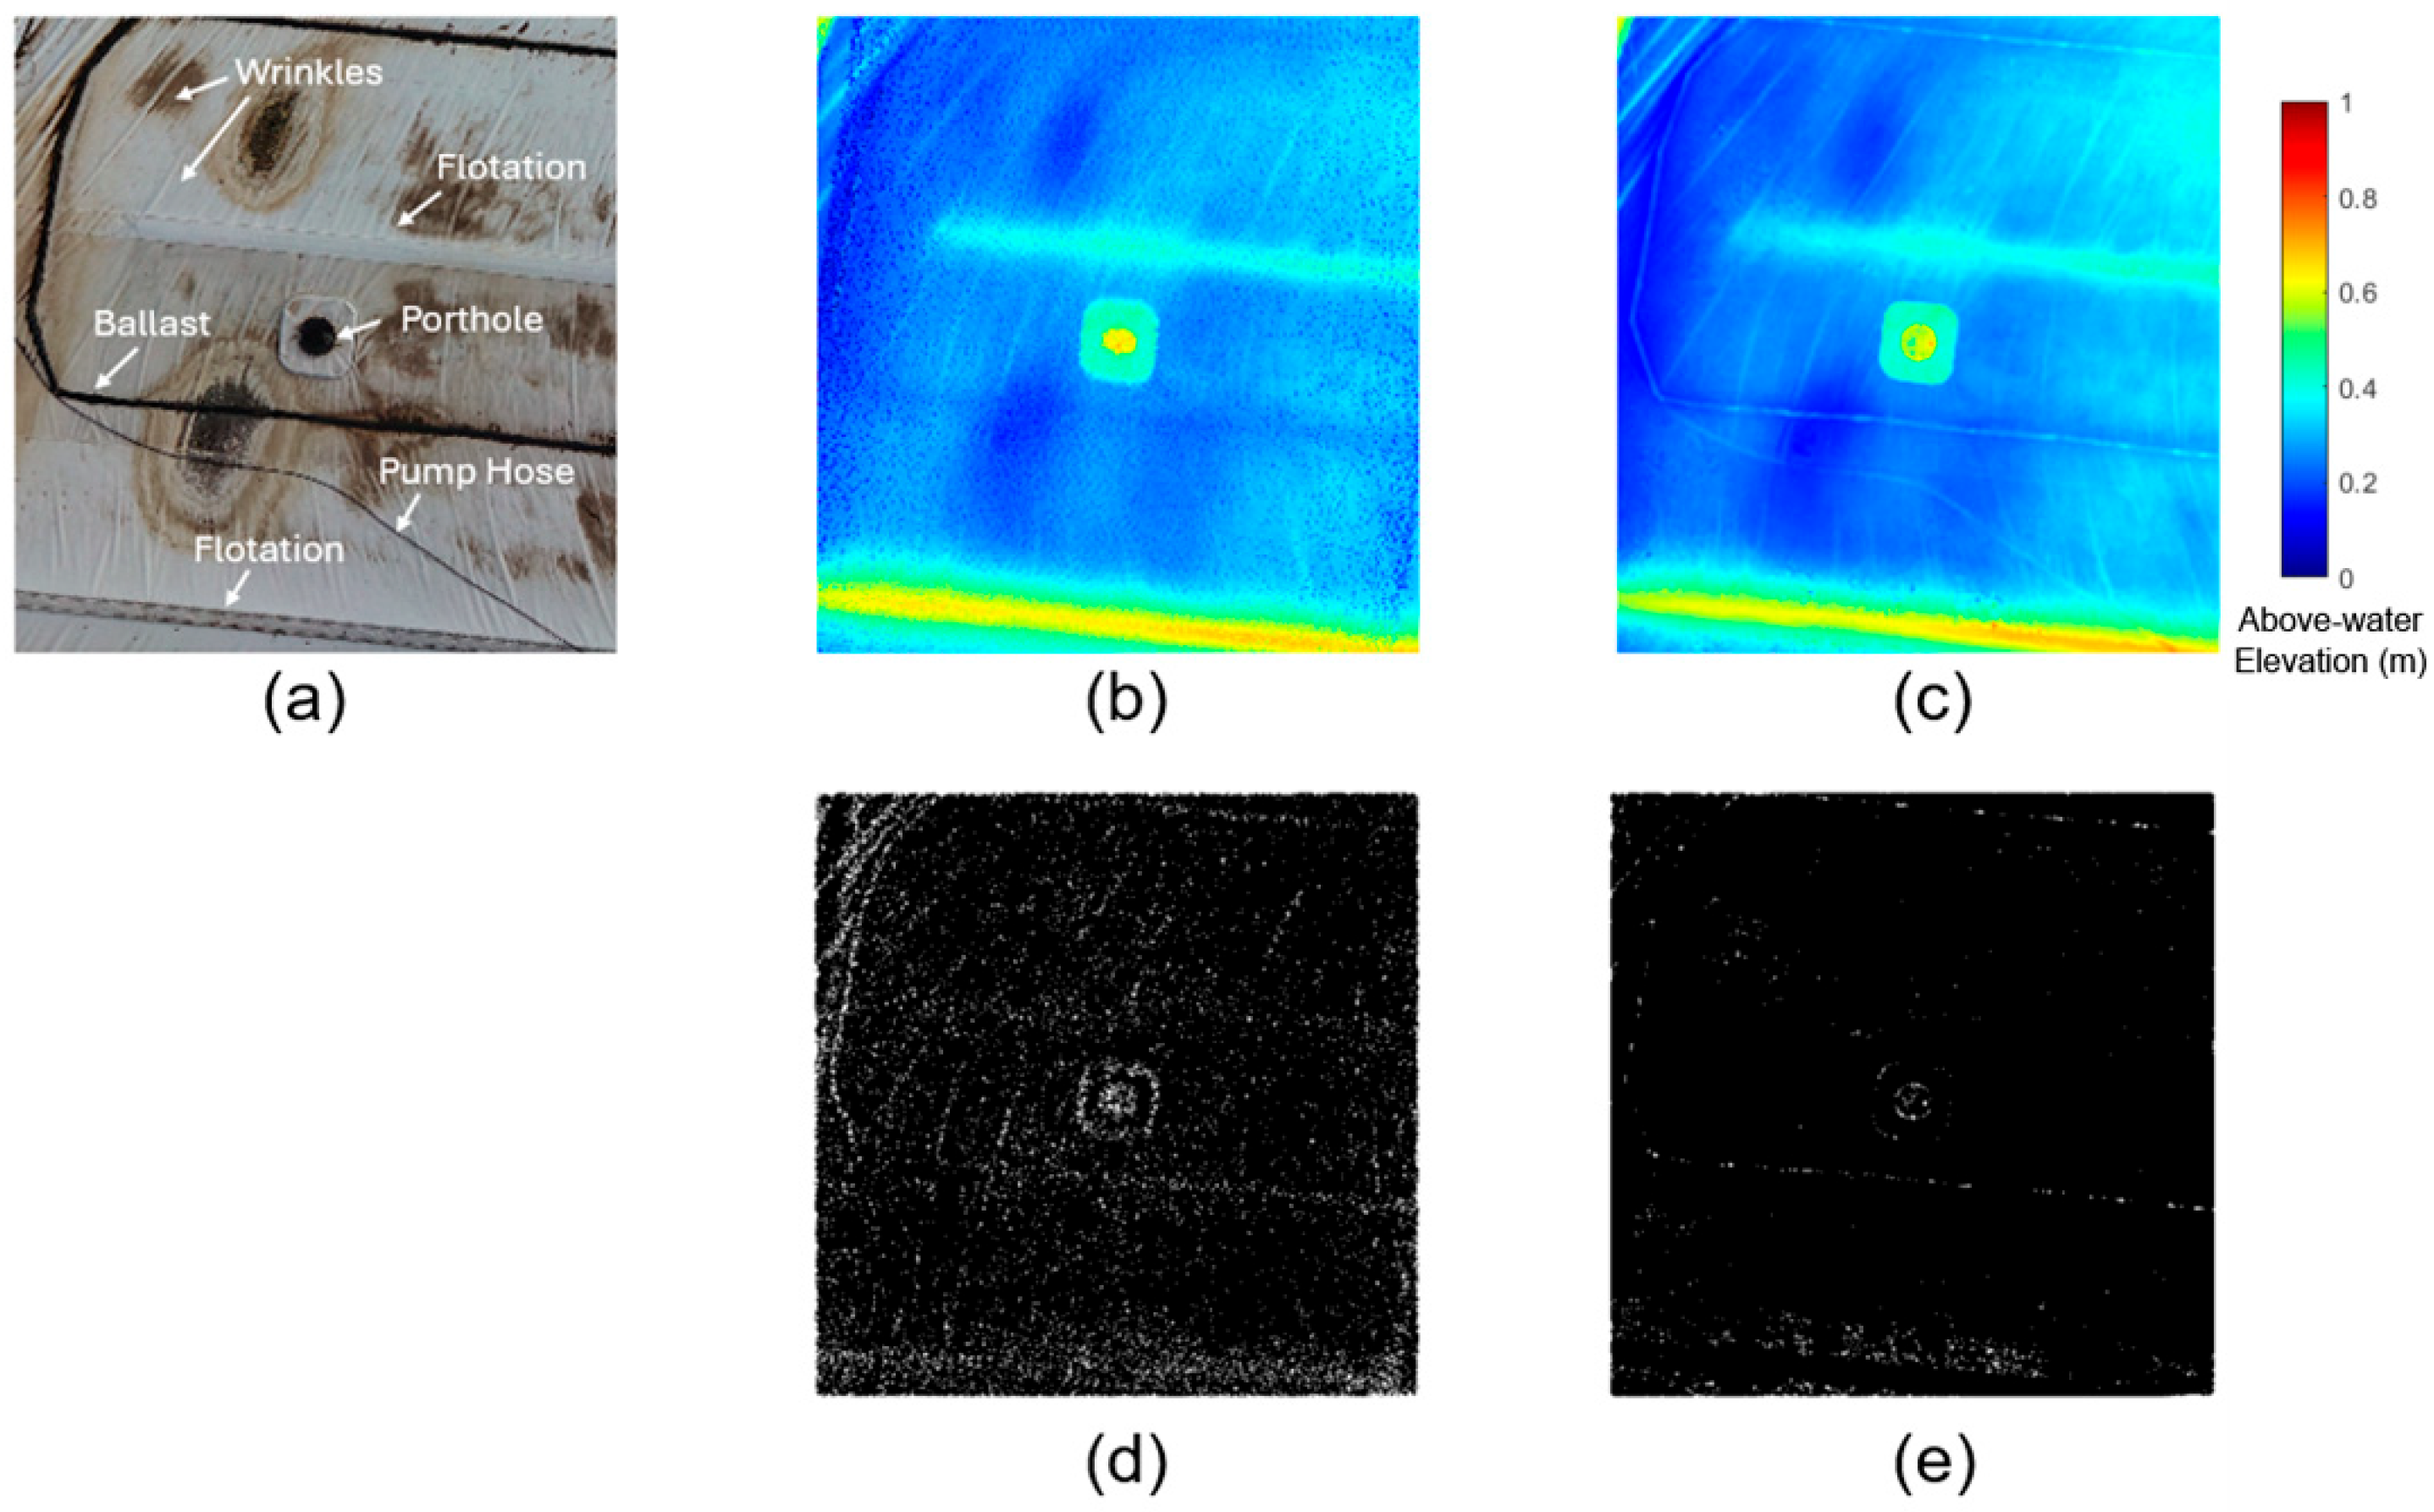
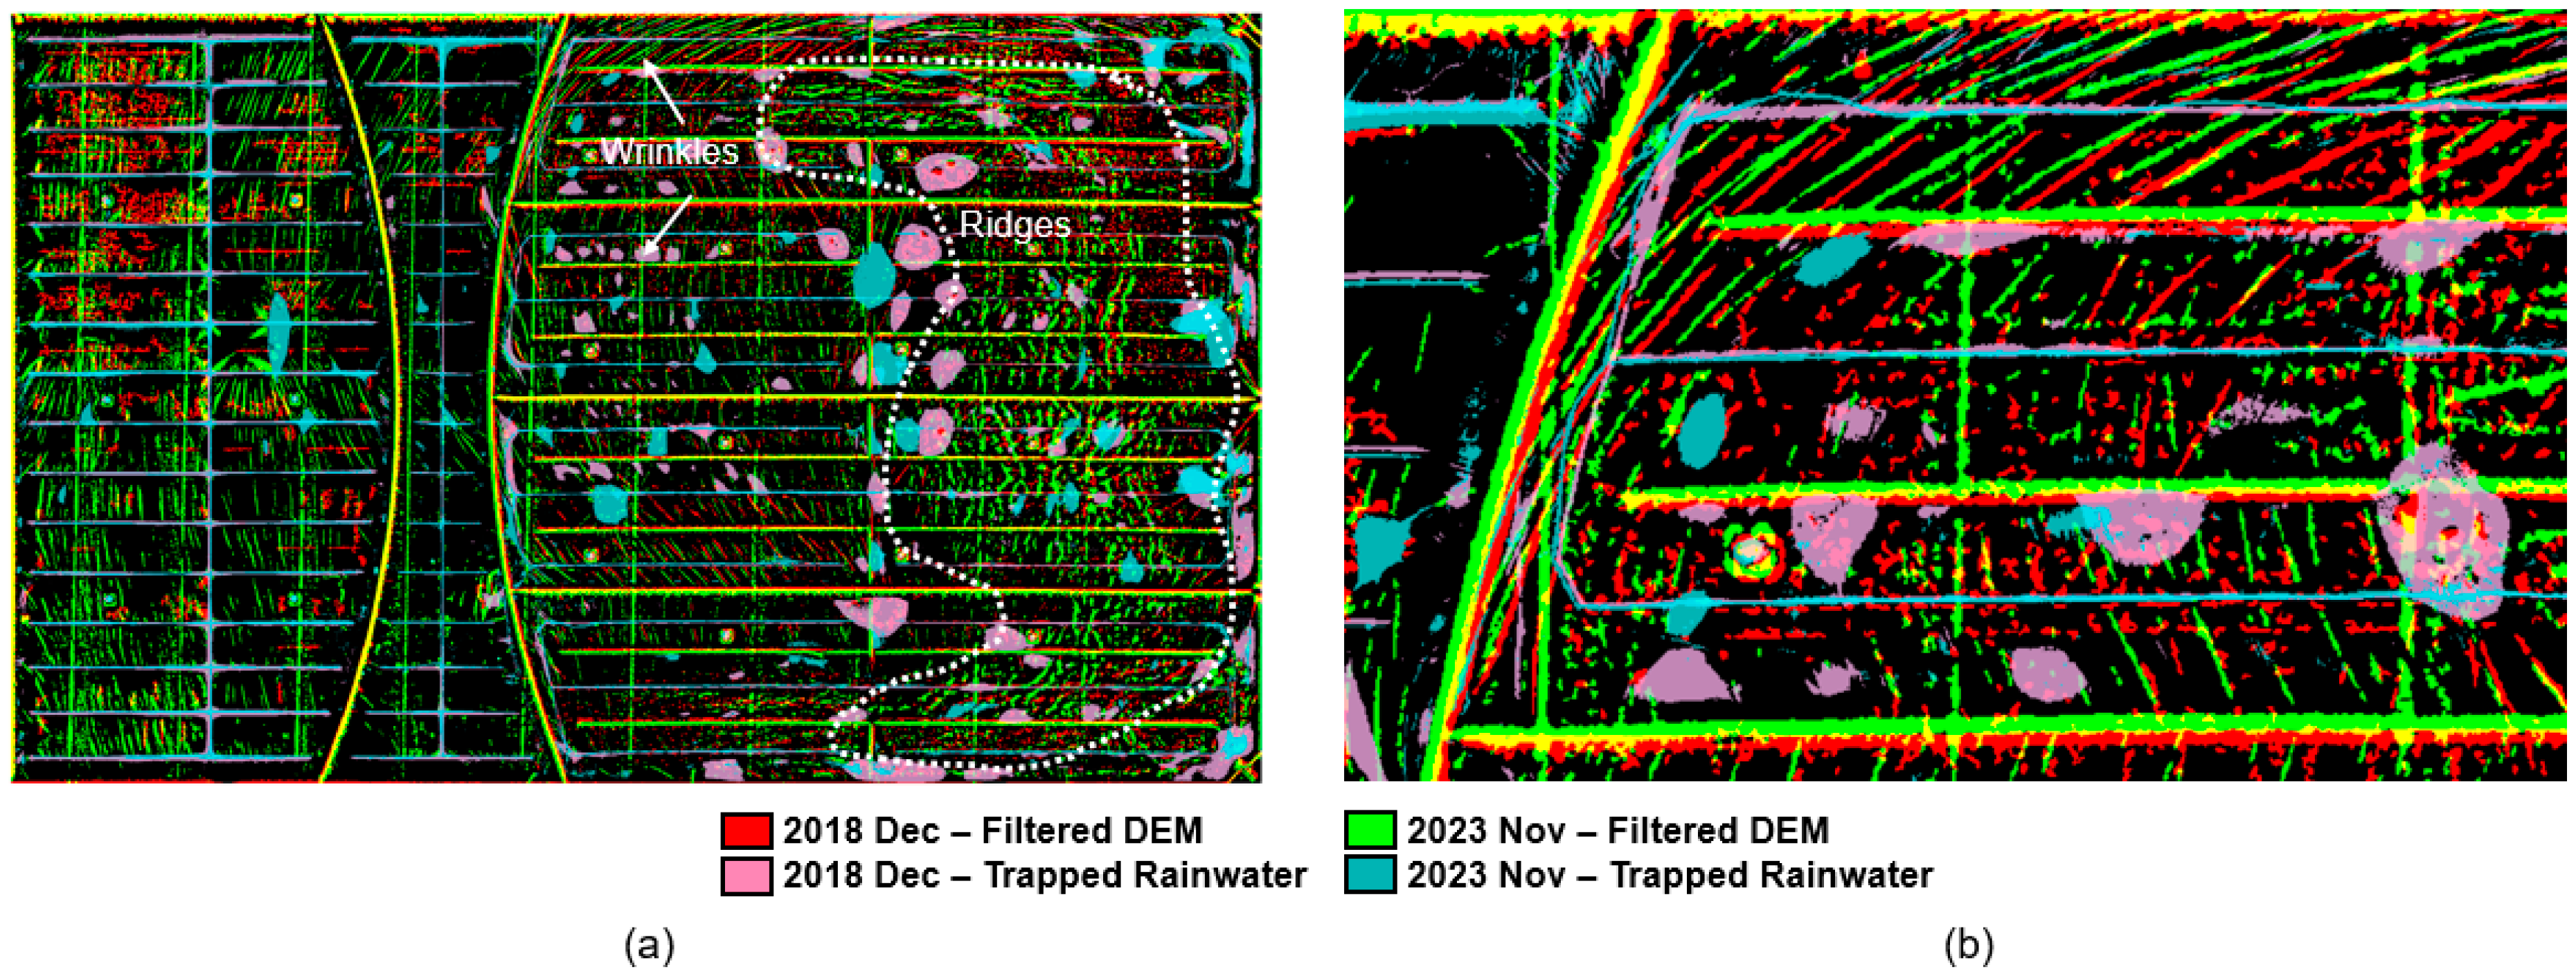
- Wrinkle mapping from high-pass DEM. A median-filter residual (high-pass DEM) isolates wrinkle features. Thresholding and morphological area opening yield a reproducible wrinkle mask that serves as a condition indicator related to local stress concentration and cover-scum behaviour.
- Cover-referenced local frame. Displacements are expressed in a local coordinate system tied to the cover, constructed by NCC matching of static features and estimation of a 2-D similarity transformation. This renders results invariant to global translation/rotation/scale across surveys and improves operational interpretability.
- Deterministic feature tracking with quality control. NCC within bounded search windows is used to track natural features and artificial markers. Ambiguous matches are flagged for manual inspection under a predefined protocol.
3. Results
3.1. Generation of Geospatial Data
3.2. Accuracy of LiDAR and Photogrammetry Geospatial Data
3.3. LiDAR and Photogrammetry-Derived DEM Noise Quality
3.4. Wrinkling and Ridges on the Floating Cover
3.5. Displacement Analysis of Floating Cover
3.5.1. Above-Water Elevation of Floating Cover
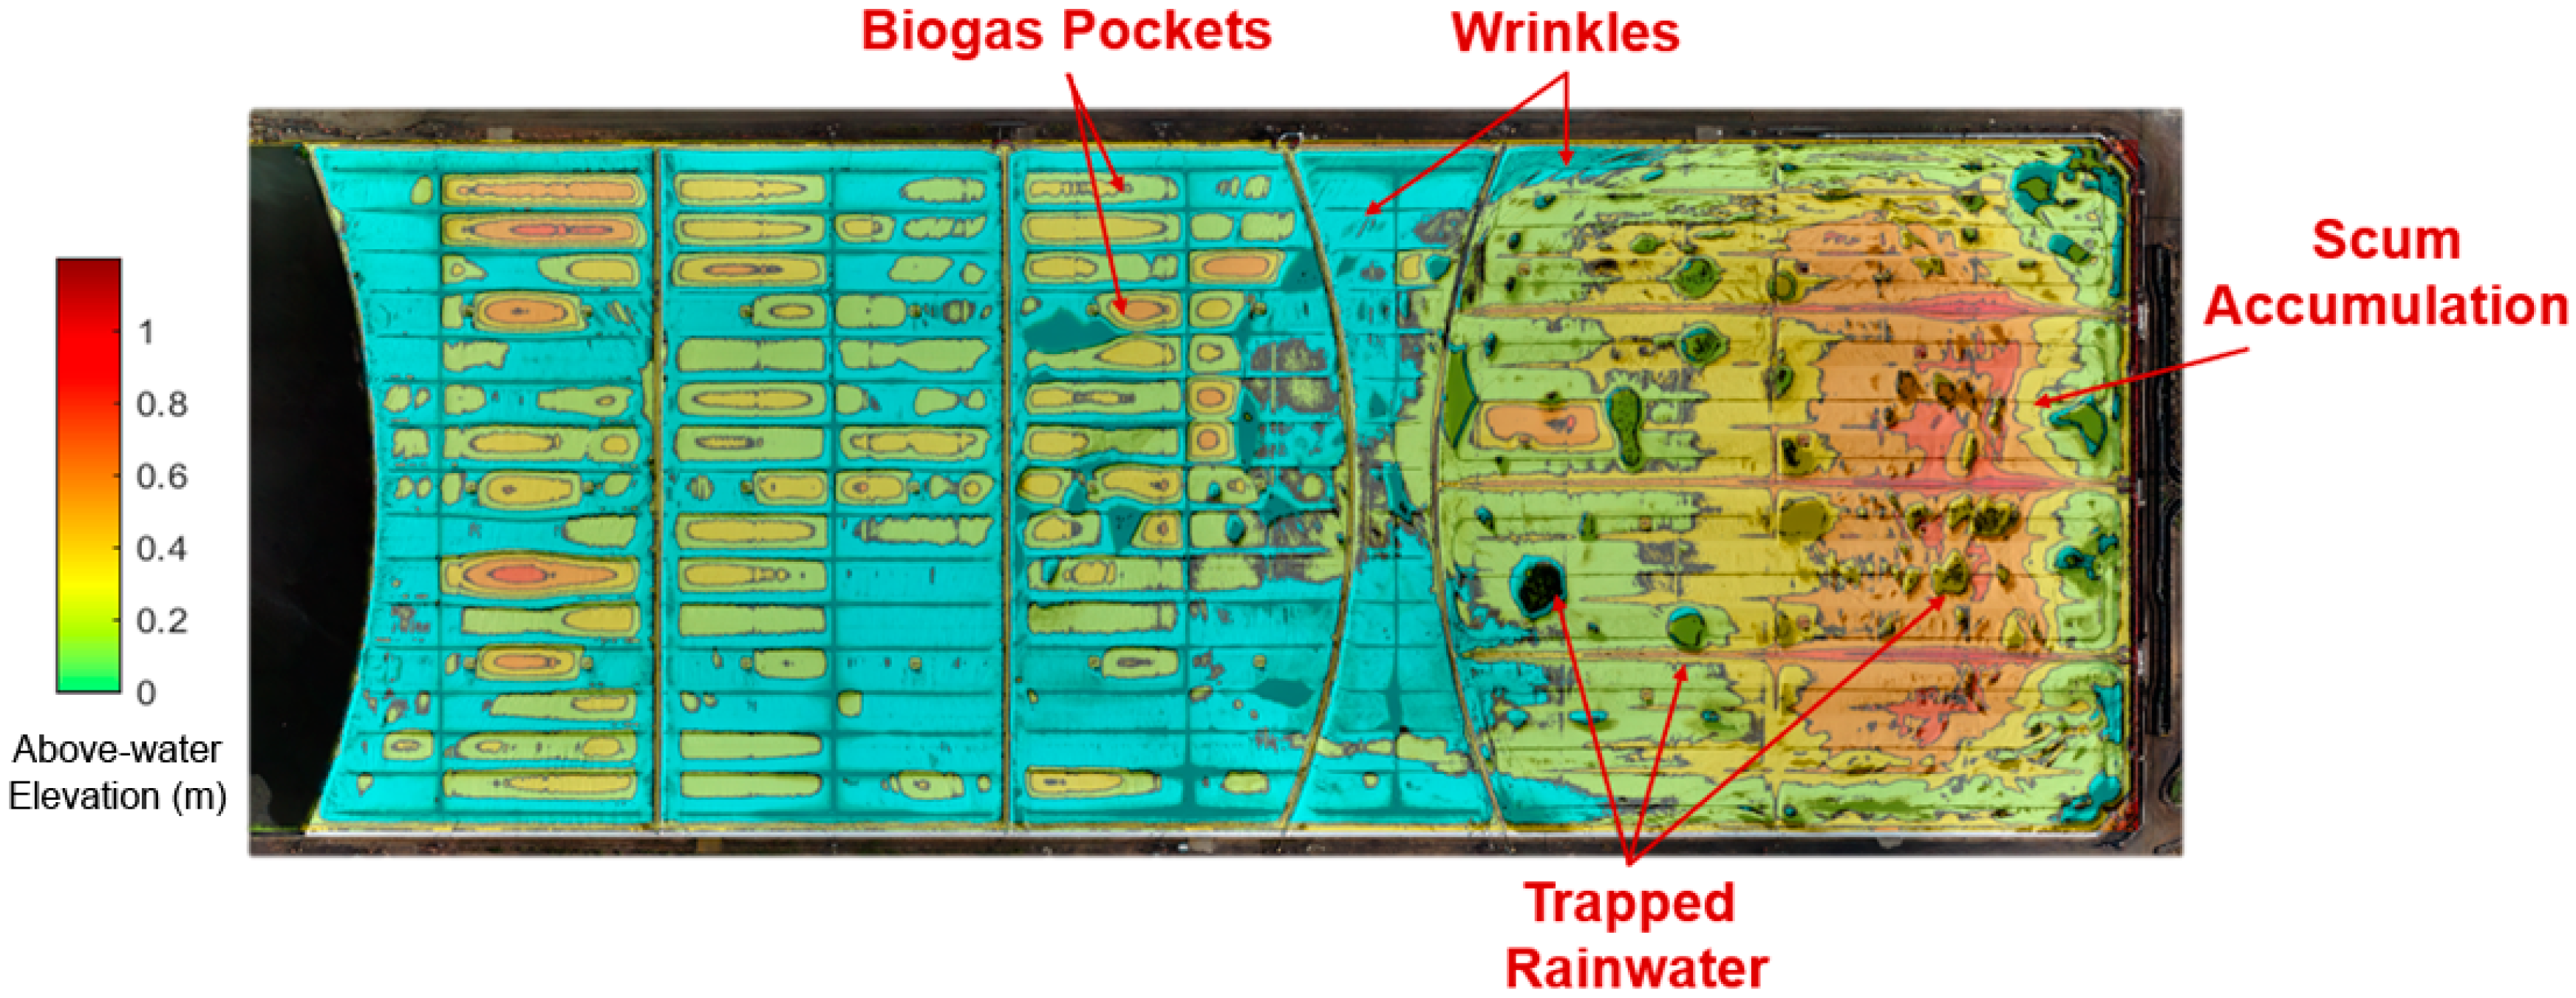
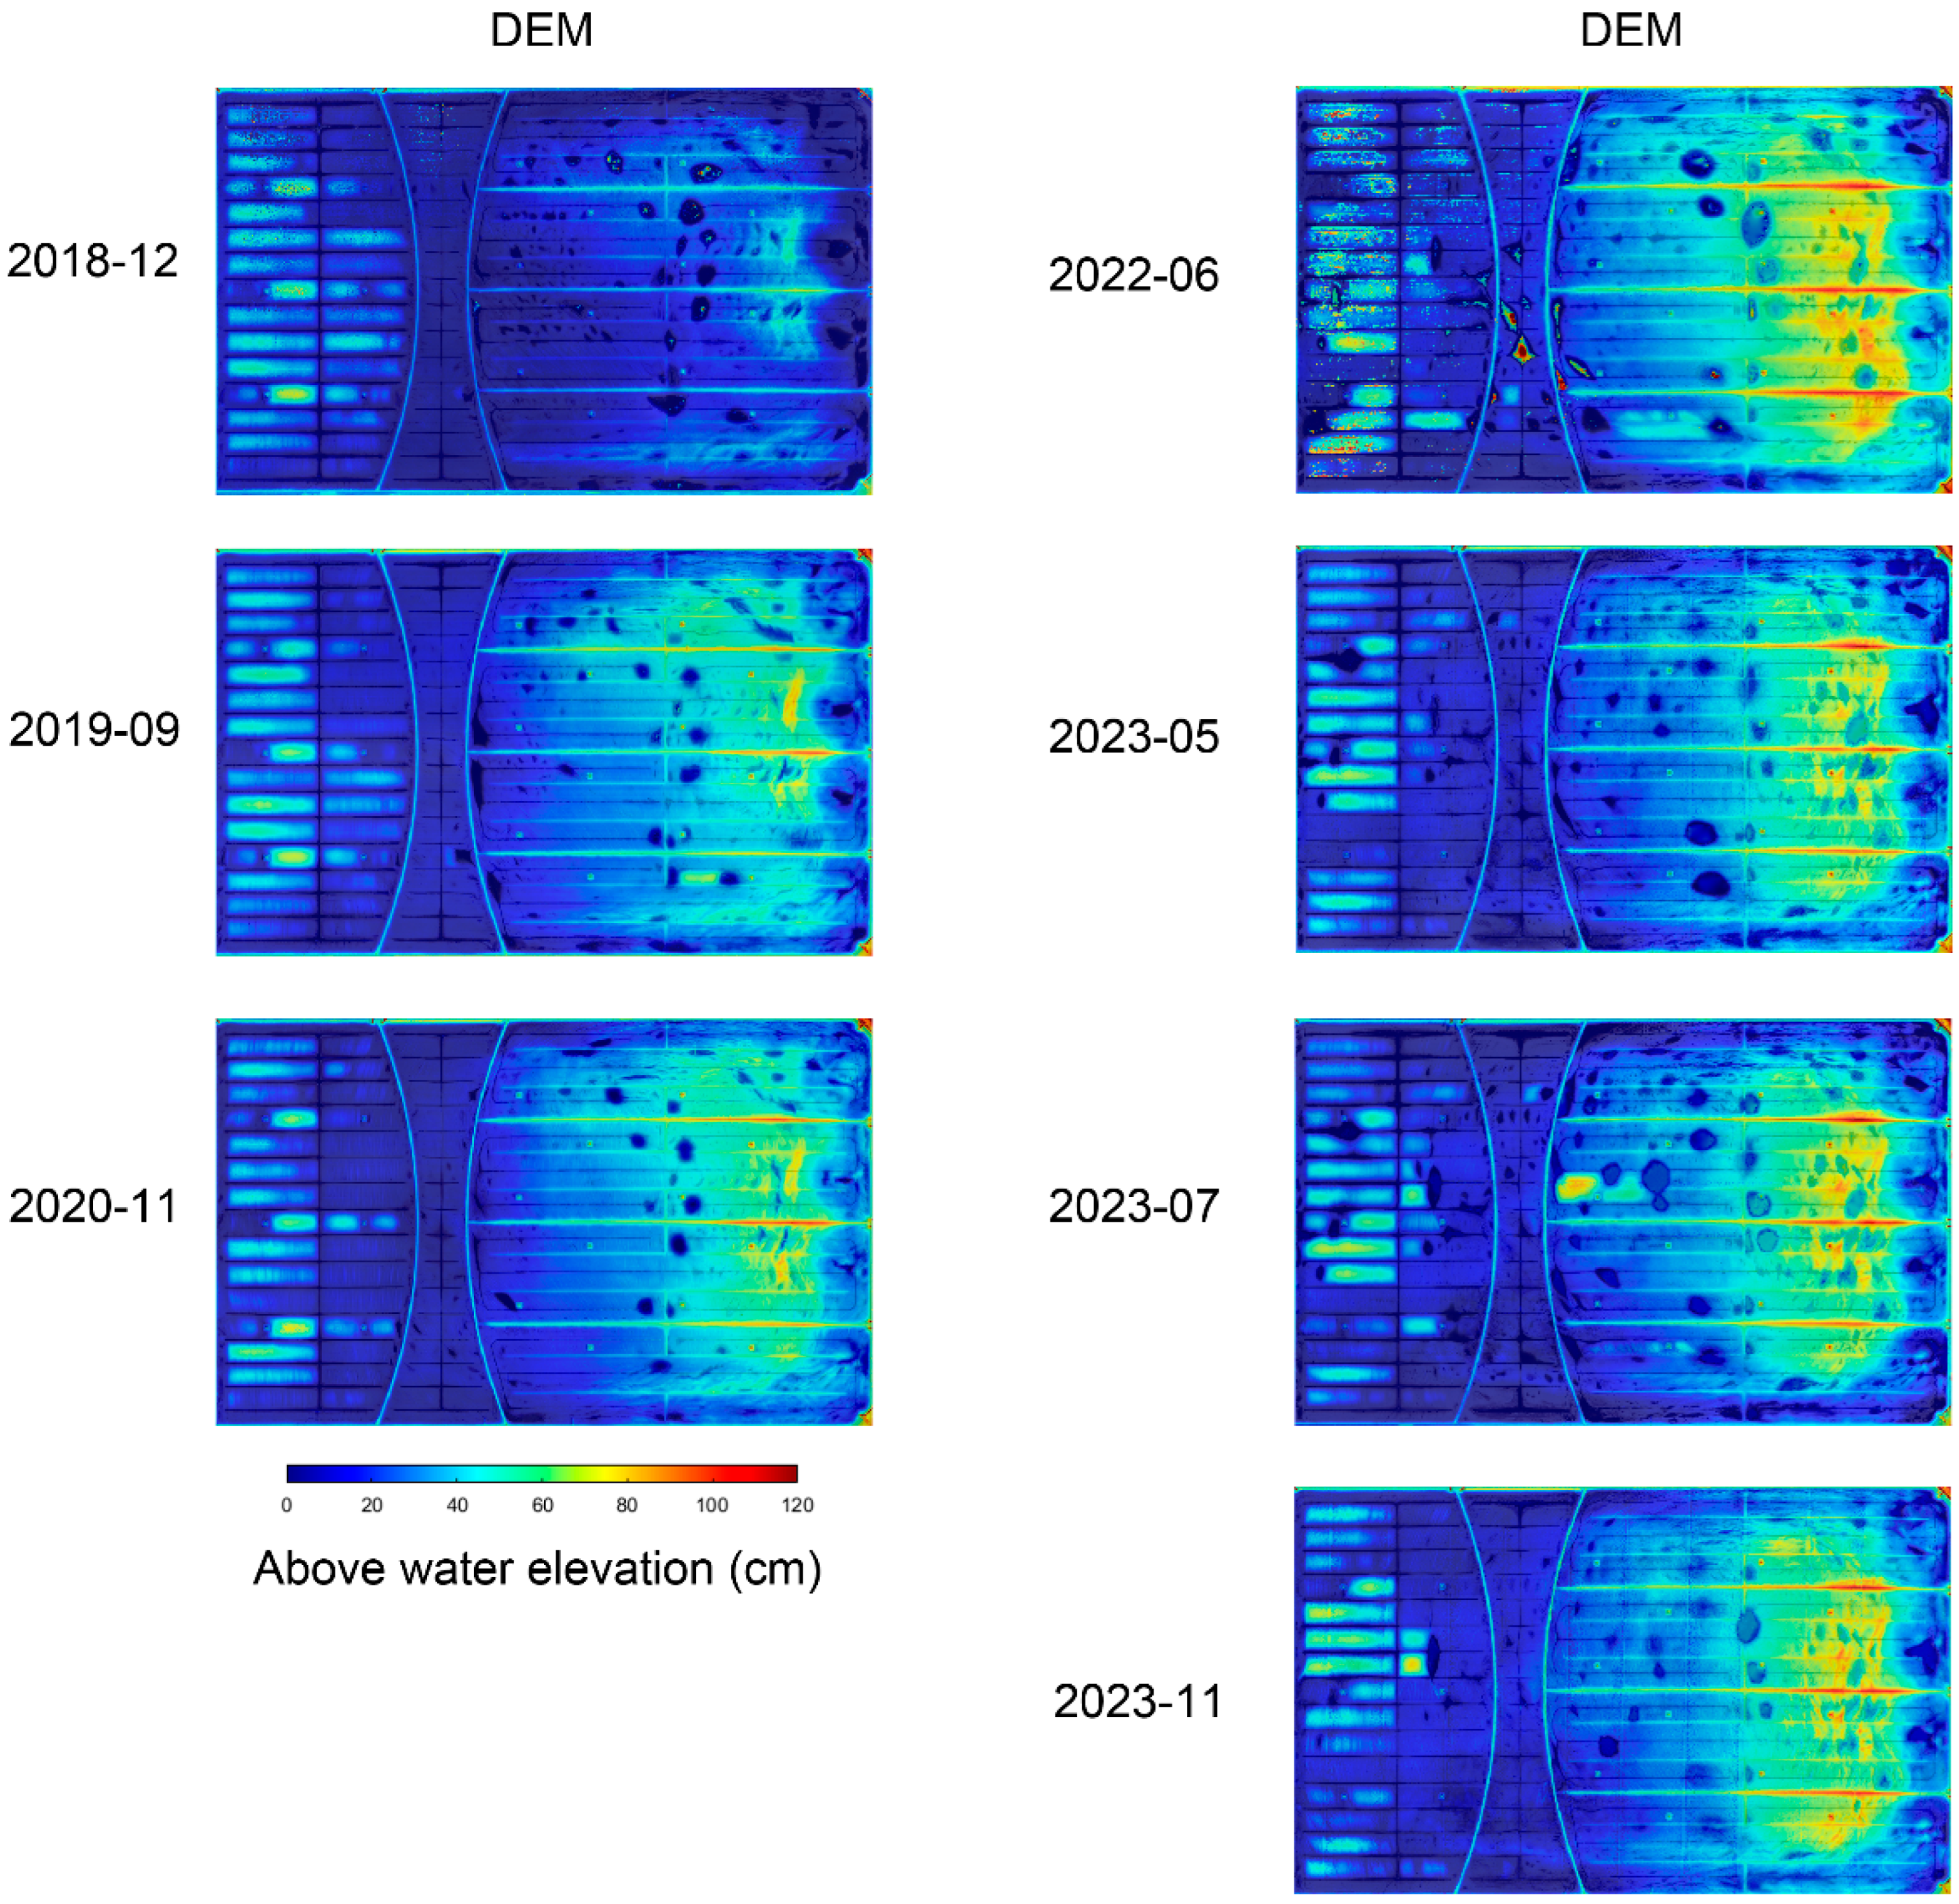
- In December 2018, there was a significant maximum elevation increase, with ES4 reaching 46.3 cm and ES1 reaching 67.5 cm.
- There was a rapid elevation increase between December 2018 and September 2019, with ES2, ES3 and ES4 increasing by 17.8 cm to 29.6 cm by September 2019. In contrast, ES1 experienced its rapid increase later, in November 2023, by 11.0 cm.
- The maximum elevations for ES1 to ES4 continued to rise over time, peaking in June 2022, followed by a slight decrease in May 2023, before increasing again in November 2023.
- ES4 consistently showed lower maximum elevations compared to the other segments but experienced the most significant elevation changes: 42.1 cm in November 2023 and 50.1 cm in June 2022 since December 2018.
- In December 2018, the top, centre, and bottom Eastern Flotations had maximum elevations of 79.1 cm, 80.7 cm, and 49.7 cm, respectively.
- By June 2022, there was significant vertical movement, with Top, Centre and Bottom Eastern Flotations reaching 118.6 cm, 109.8 cm and 119.6 cm, respectively.
- Bottom Eastern Flotation experienced the largest increase, rising by 13.4 cm to 30.4 cm between December 2018 and June 2022. It also had the most significant overall change of 58.8 cm in November 2023 and 69.9 cm in June 2022 since December 2018.
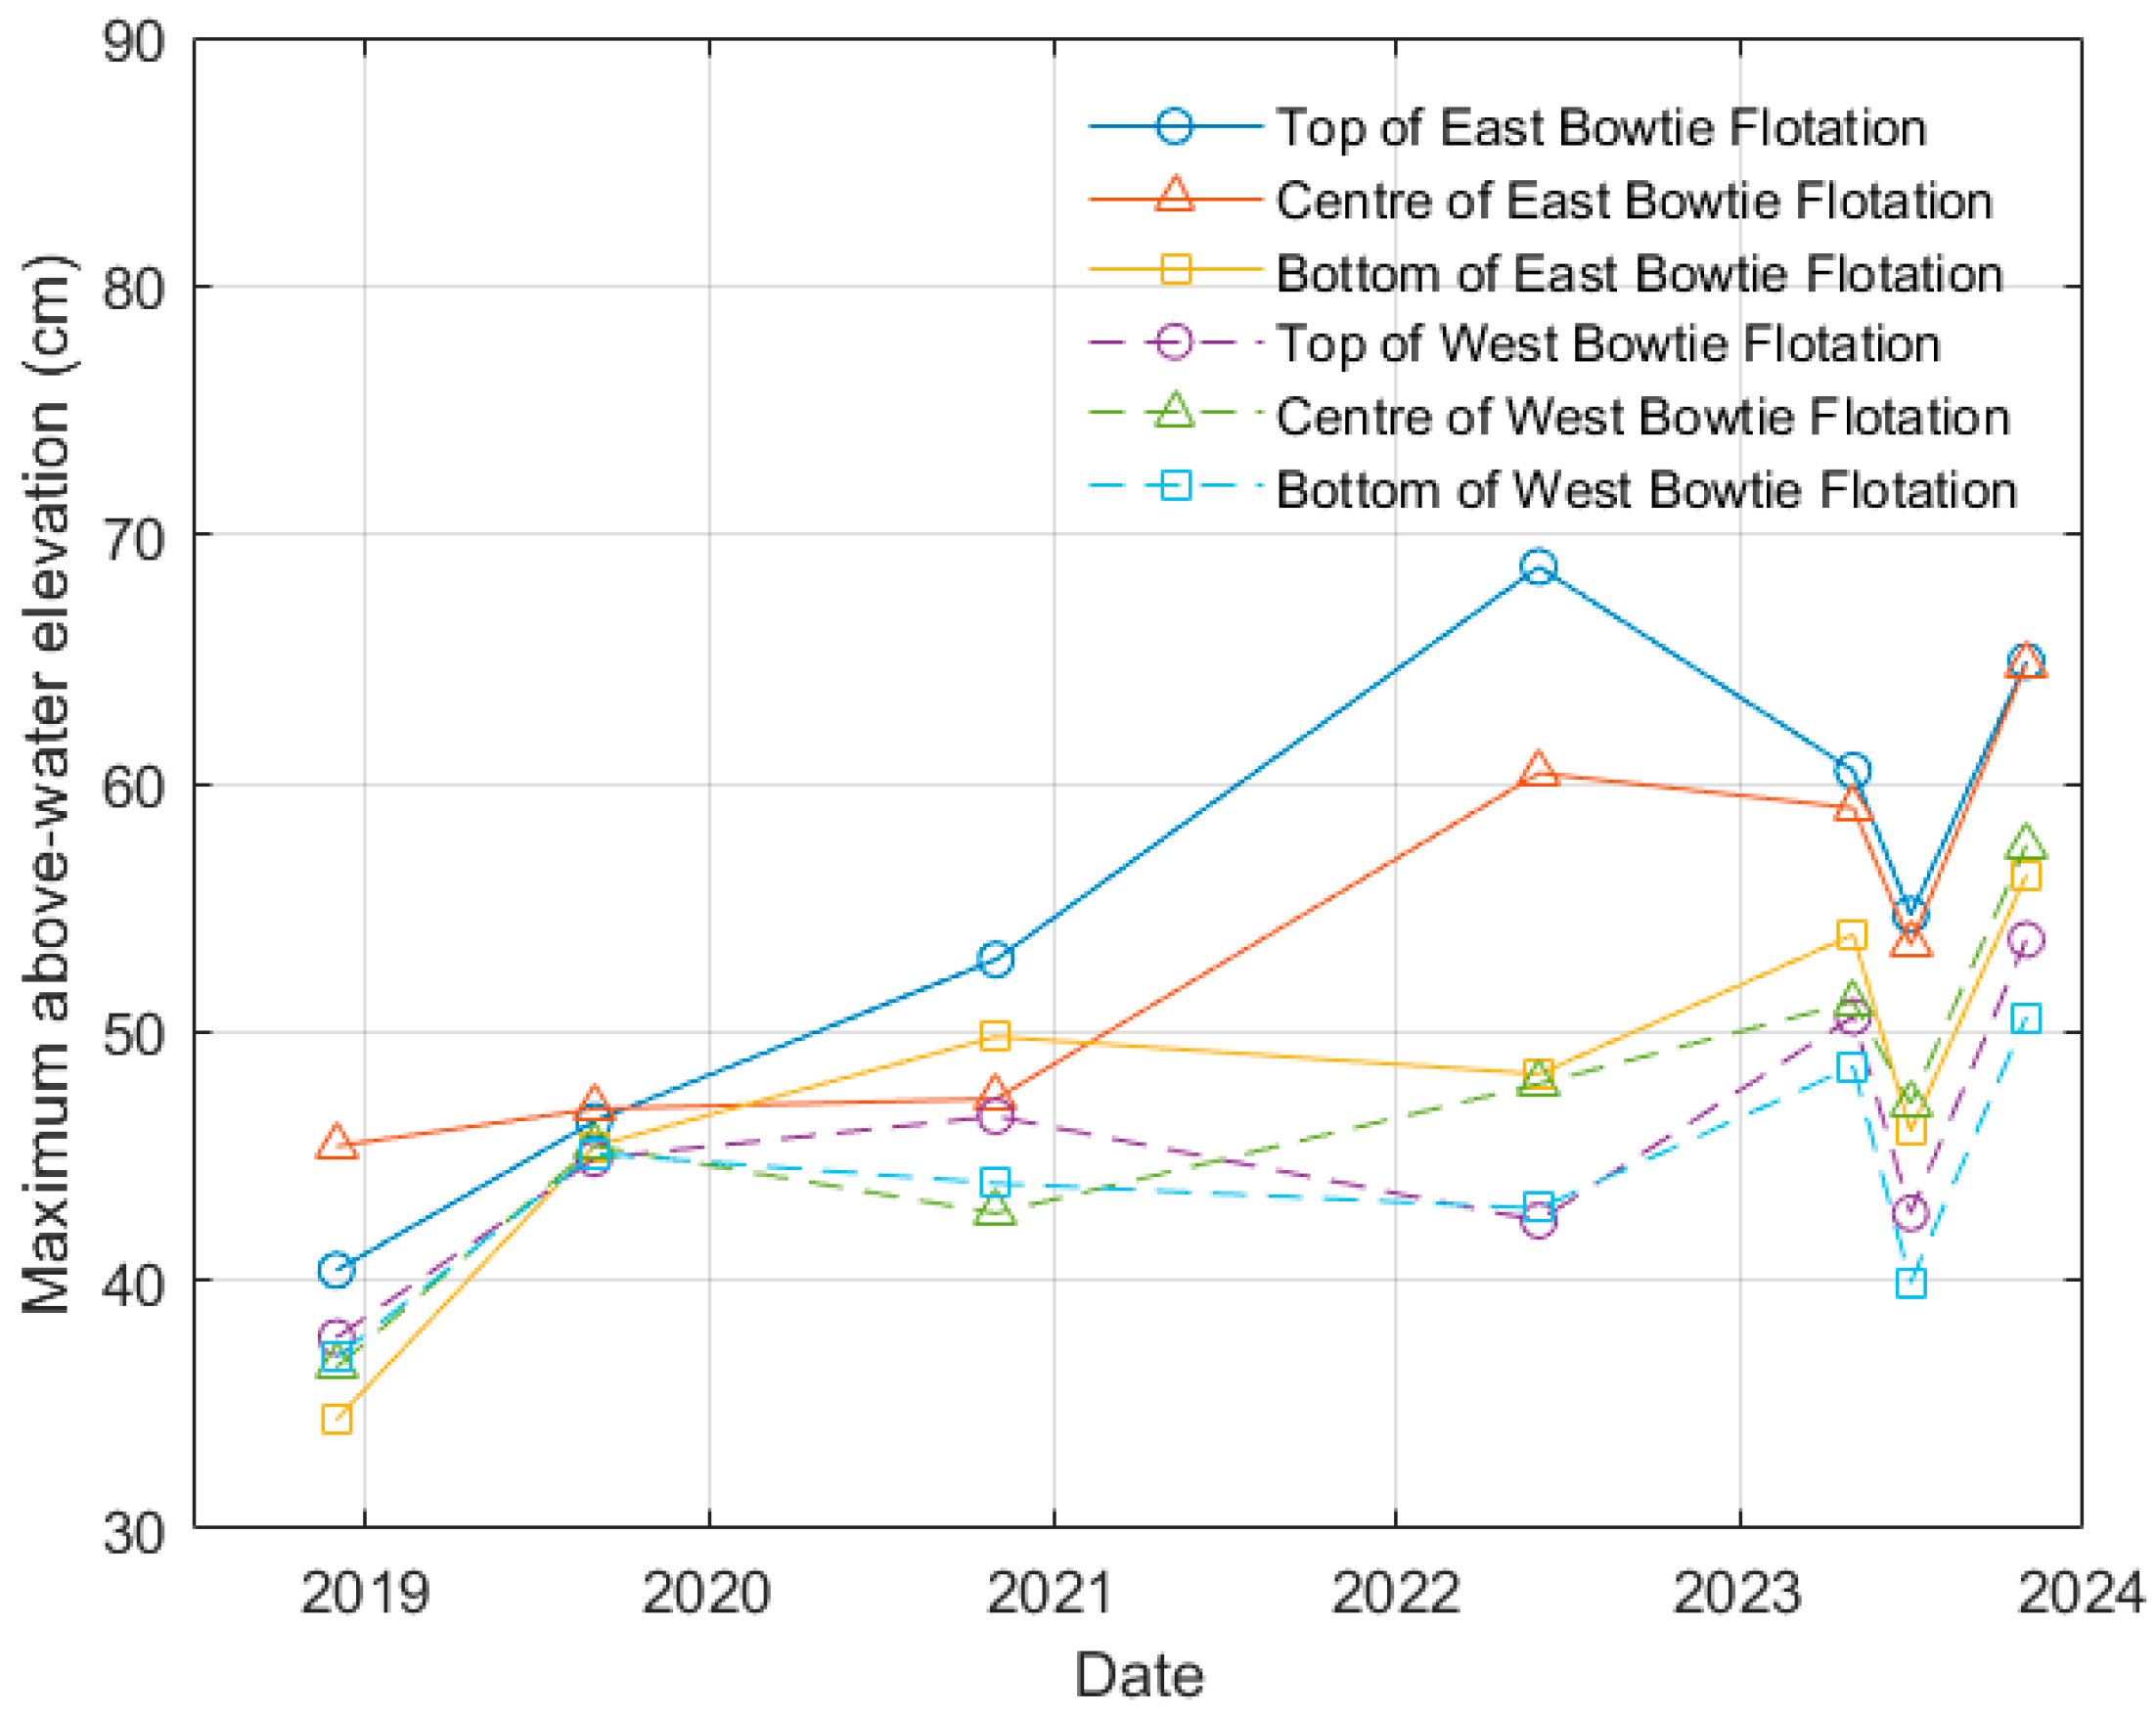
- In December 2018, the initial elevation measurements for the top, centre and bottom of East Bowtie Flotation were 40.4 cm, 45.4 cm and 34.4 cm, respectively.
- The East Bowtie Flotation showed a gradual increase in elevation, particularly between December 2018 and June 2022, where the top flotation reached a high of 68.7 cm in June 2022, representing a 28.3 cm increase since December 2018.
- There was a slight drop in flotation heights in July 2023, particularly for the top and bottom sections, where the elevation decreased to 54.7 cm and 46.0 cm, respectively. Eventually, the flotations increased again by November 2023.
- In most instances, the West Bowtie Flotation elevations were lower than those of the East Bowtie Flotation.
- By November 2023, the top, centre, and bottom flotation elevations reached 53.7 cm, 57.5 cm, and 50.6 cm, respectively, showing gradual increases.
3.5.2. Relative In-Plane and Out-of-Plane Movement of Floating Cover
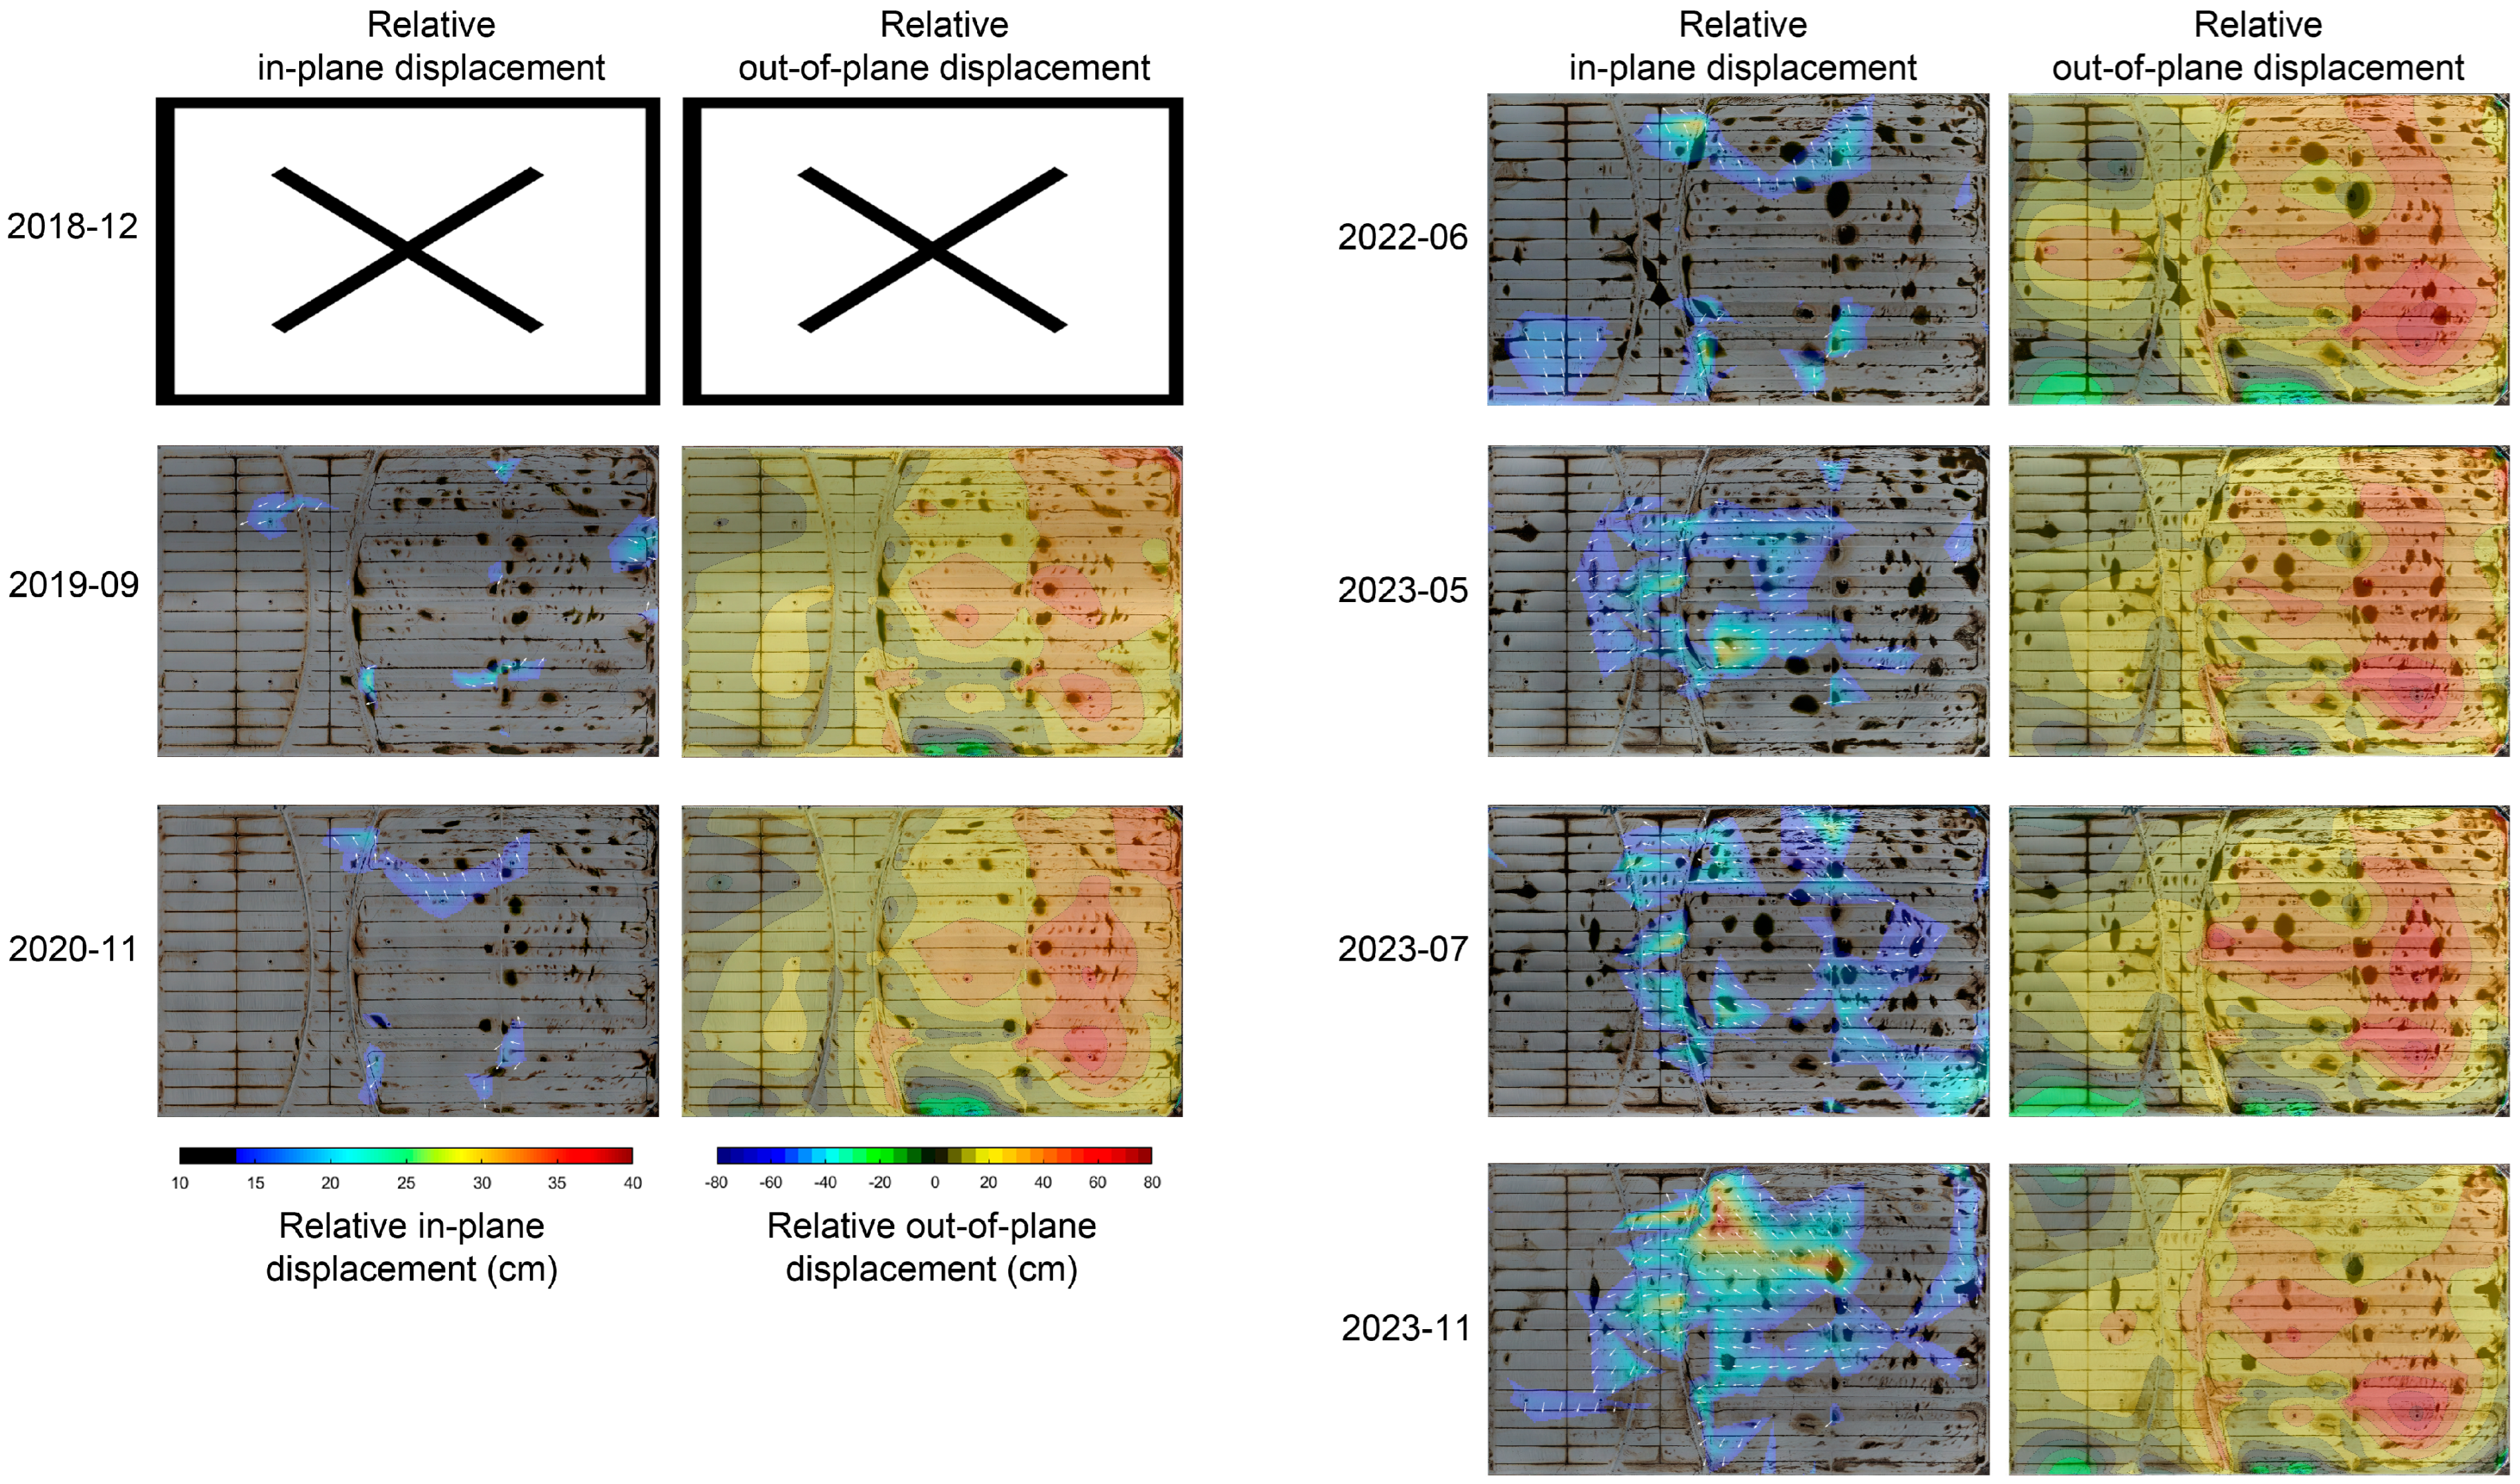
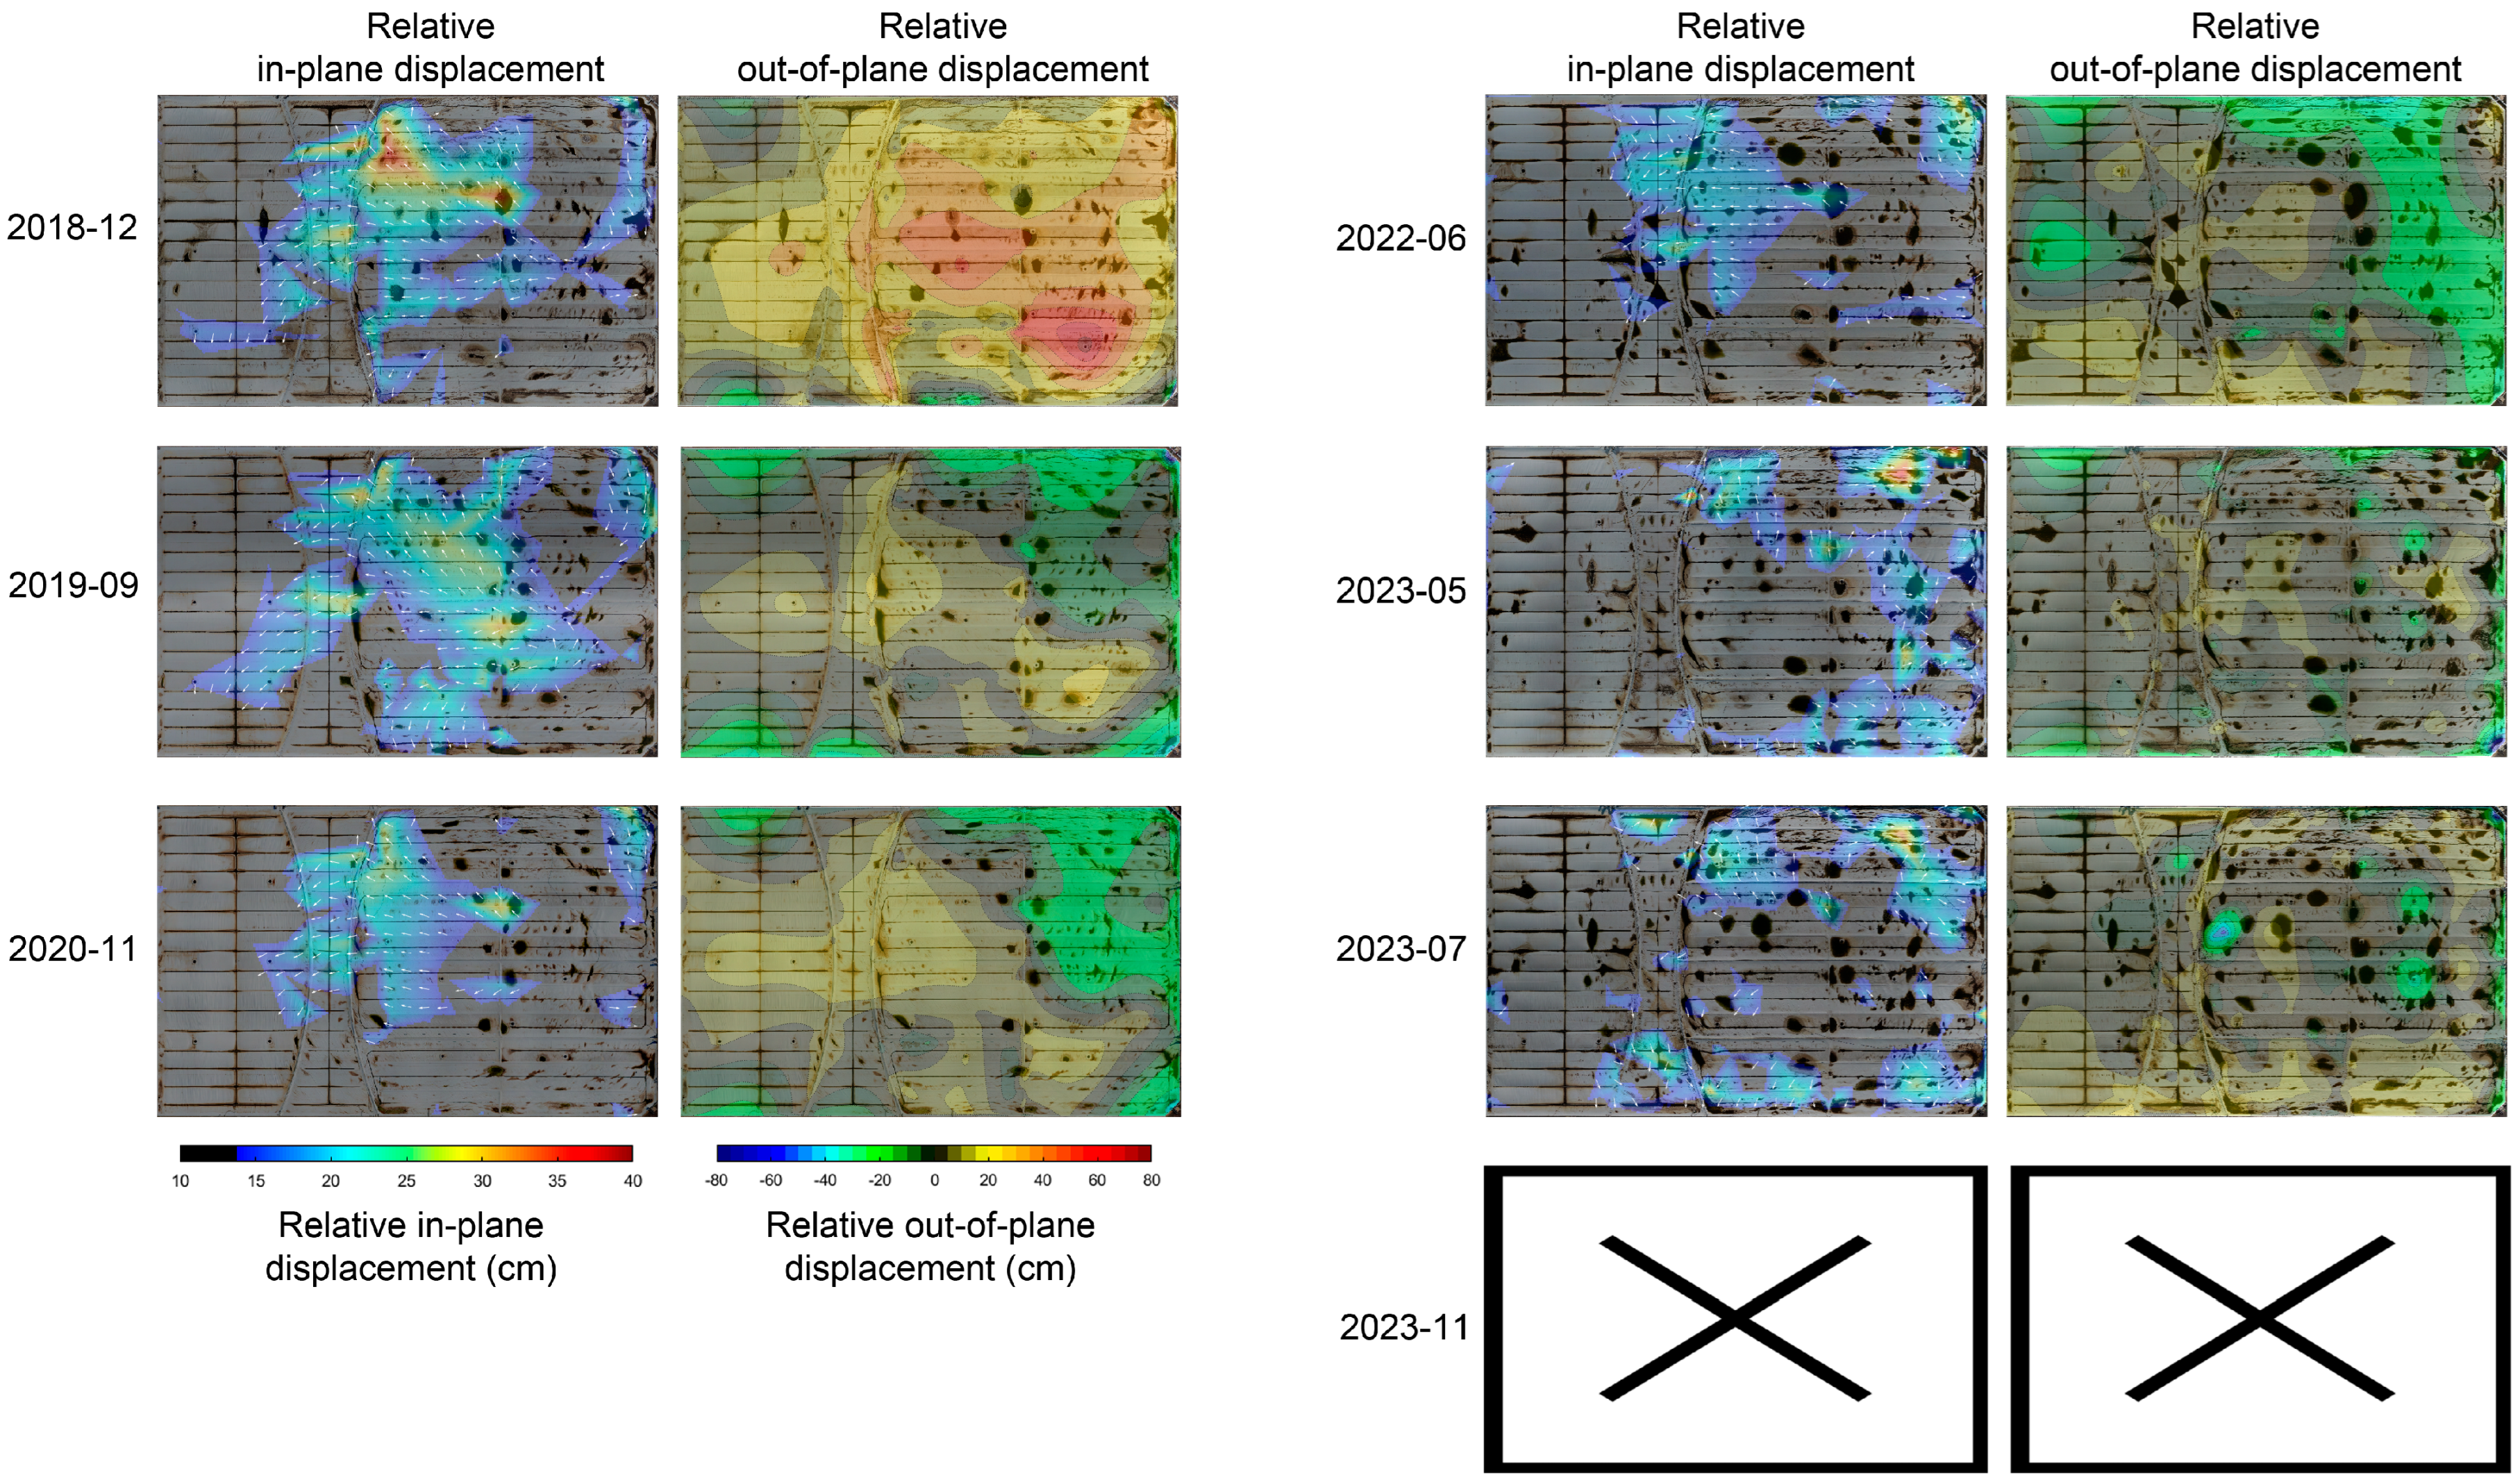
- Eastern Section: Significant increases in relative elevation were observed, with an average increase of 17.7 cm. The Eastern Section showed an average relative elevation increase of 23.6 cm, with a maximum relative elevation of 50.6 cm in ES3 and ES4.
- Bowtie Flotation: The East Bowtie Flotation increased in relative elevation by approximately 20 cm, with the bottom section increasing the most by 35.6 cm. The West Bowtie Flotation increased in relative elevation by approximately 18.0 cm. No significant relative in-plane movement was identified during this period.
- Eastern Section: The maximum relative elevation in ES3 and ES4 increased to 60.9 cm, and the Eastern Section’s average relative elevation rose to 25.3 cm. Additionally, a relative in-plane displacement of approximately 13 cm in the NW direction was observed in ES1 and ES2.
- Bowtie Flotation: A maximum relative displacement of 17.1 cm in the NW direction in the East Bowtie Flotation was observed.
- Eastern Section: A significant increase in relative elevation was observed in ES3 and ES4, reaching 87.7 cm, with the Eastern Section’s average relative elevation increasing to 32.2 cm.
- Bowtie Flotation: The top, centre, and bottom of the East Bowtie Flotation reached maximum relative elevation values of 18.1 cm, 36.7 cm, and 35.0 cm, respectively. The top and centre of the West Bowtie Flotation had relative elevation values of 15.1 cm and 19.9 cm, respectively. Relative in-plane displacements in the NW direction were observed, with the top section of the East Bowtie Flotation showing a maximum relative displacement of 37.3 cm.
- Eastern Section: The maximum relative elevation in ES3 and ES4 was 75.3 cm, and the Eastern Section’s average relative elevation was 27.5 cm. A relative easterly displacement of approximately 18 cm was observed in ES2 and ES3.
- Bowtie Flotation: The top, centre, and bottom of the East Bowtie Flotation reached maximum relative elevation values of 26.5 cm, 37.5 cm, and 37.7 cm, respectively. The top and centre of the West Bowtie Flotation had relative elevation values of 16.5 cm and 24.5 cm, respectively. The East Bowtie Flotation had a maximum relative in-plane displacement of 31.6 cm in the W direction.
- Eastern Section: The maximum relative elevation in ES4 was 68.7 cm, and the Eastern Section’s average relative elevation was 25.5 cm. A relative NW displacement of approximately 20 cm was observed in ES1 and ES3 near the East Bowtie Flotation.
- Bowtie Flotation: The top, centre, and bottom of the East Bowtie Flotation reached maximum relative elevation values of 19.1 cm, 38.5 cm, and 32.7 cm, respectively. The top and centre of the West Bowtie Flotation had relative elevation values of 16.9 cm and 25.4 cm, respectively. The East Bowtie Flotation had a maximum relative in-plane displacement of 31.4 cm in the W direction.
- Eastern and Western Sections: A significant relative elevation increase was noted in ES2, with a maximum of 75.6 cm and the Eastern Section’s average relative elevation increase of 27.2 cm. ES1 near the Bowtie showed a maximum relative in-plane displacement of 37.9 cm in the NW direction. In the lower Western Section, a maximum relative in-plane displacement of 18.0 cm was observed in the S direction. ES1 near the North Boundary showed a localised relative displacement of approximately 20 cm in the E direction, while ES1 and ES2 near the East Boundary showed movement in the S direction.
- Bowtie Flotation: The top and centre of the East Bowtie Flotation relatively displaced 34.6 cm NW and 31.9 cm W, respectively, while the top and centre of the West Bowtie Flotation relatively displaced 27.8 cm and 24.6 cm, respectively, both in the SW direction.
4. Discussion
5. Conclusions
Author Contributions
Funding
Data Availability Statement
Acknowledgments
Conflicts of Interest
References
- Sreenath, S.; Malik, H.; Husnu, N.; Kalaichelavan, K. Assessment and use of unmanned aerial vehicle for civil structural health monitoring. Procedia Comput. Sci. 2020, 170, 656–663. [Google Scholar] [CrossRef]
- Fan, J.; Dai, W.; Wang, B.; Li, J.; Yao, J.; Chen, K. UAV-Based Terrain Modeling in Low-Vegetation Areas: A Framework Based on Multiscale Elevation Variation Coefficients. Remote Sens. 2023, 15, 3569. [Google Scholar]
- Bolourian, N.; Hammad, A. LiDAR-equipped UAV path planning considering potential locations of defects for bridge inspection. Autom. Constr. 2020, 117, 103250. [Google Scholar] [CrossRef]
- Esmaeili, F.; Ebadi, H.; Saadatseresht, M.; Kalantary, F. Application of UAV Photogrammetry in Displacement Measurement of the Soil Nail Walls Using Local Features and CPDA Method. ISPRS Int. J. Geo-Inf. 2019, 8, 25. [Google Scholar] [CrossRef]
- Dominici, D.; Alicandro, M.; Massimi, V. UAV photogrammetry in the post-earthquake scenario: Case studies in L’Aquila. Geomat. Nat. Hazards Risk 2017, 8, 87–103. [Google Scholar] [CrossRef]
- Nex, F.; Remondino, F. UAV for 3D mapping applications: A review. Appl. Geomat. 2014, 6, 1–15. [Google Scholar] [CrossRef]
- Remondino, F.; Barazzetti, L.; Nex, F.; Scaioni, M.; Sarazzi, D. UAV photogrammetry for mapping and 3d modeling–current status and future perspectives. Int. Arch. Photogramm. Remote Sens. Spat. Inf. Sci. 2011, 38, C22. [Google Scholar] [CrossRef]
- Yao, H.; Qin, R.; Chen, X. Unmanned Aerial Vehicle for Remote Sensing Applications—A Review. Remote Sens. 2019, 11, 1443. [Google Scholar]
- Chevron. Going Where Few Drones Have Gone Before. 2022. Available online: https://www.chevron.com/newsroom/2022/q4/going-where-few-drones-have-gone-before (accessed on 19 August 2024).
- Chevron. Drone Technology Takes Safety to New Heights in el Segundo. Available online: https://www.chevron.com/newsroom/2022/q3/drone-technology-takes-safety-to-new-heights-in-el-segundo (accessed on 19 August 2024).
- Chiu, W.K.; Kuen, T.; Vien, B.S.; Aitken, H.; Rose, L.R.F.; Buderath, M. Advancing a Non-Contact Structural and Prognostic Health Assessment of Large Critical Structures. Sensors 2024, 24, 3297. [Google Scholar] [CrossRef]
- Adediran, A.S.A.; Darilmaz, I. Up in the Air: Getting Value from Unmanned Aerial Systems. Shell TechXplorer Dig. 2020, 22–27. [Google Scholar] [CrossRef]
- Zhao, S.; Kang, F.; Li, J.; Ma, C. Structural health monitoring and inspection of dams based on UAV photogrammetry with image 3D reconstruction. Autom. Constr. 2021, 130, 103832. [Google Scholar] [CrossRef]
- Gaspari, F.; Ioli, F.; Barbieri, F.; Belcore, E.; Pinto, L. Integration of UAV-lidar and UAV-photogrammetry for infrastructure monitoring and bridge assessment. Int. Arch. Photogramm. Remote Sens. Spat. Inf. Sci. 2022, 43, 995–1002. [Google Scholar] [CrossRef]
- Przybilla, H.J.; Bäumker, M.; Luhmann, T.; Hastedt, H.; Eilers, M. Interaction between direct georeferencing, control point configuration and camera self-calibration for rtk-based uav photogrammetry. Int. Arch. Photogramm. Remote Sens. Spat. Inf. Sci. 2020, XLIII-B1-2020, 485–492. [Google Scholar] [CrossRef]
- Congress, S.S.C.; Puppala, A.J.; Lundberg, C.L. Total system error analysis of UAV-CRP technology for monitoring transportation infrastructure assets. Eng. Geol. 2018, 247, 104–116. [Google Scholar] [CrossRef]
- Yan, Y.; Mao, Z.; Wu, J.; Padir, T.; Hajjar, J.F. Towards automated detection and quantification of concrete cracks using integrated images and lidar data from unmanned aerial vehicles. Struct. Control Health Monit. 2021, 28, e2757. [Google Scholar] [CrossRef]
- Bowman, J.; Yang, L.; Thomas, O.; Kirk, J.; Duncan, A.; Hughes, D.; Meade, S. UAS Edge Computing of Energy Infrastructure Damage Assessment. Photogramm. Eng. Remote Sens. 2023, 89, 79–87. [Google Scholar] [CrossRef]
- Lusk, R.M.; Monday, W. An Early Survey of Best Practices for the Use of Small Unmanned Aerial Systems by the Electric Utility Industry; Oak Ridge National Lab.(ORNL): Oak Ridge, TN, USA, 2017.
- Foley, E. Leveraging Gaussian Processes in Remote Sensing. Energies 2024, 17, 3895. [Google Scholar] [CrossRef]
- Sensor Research Helps Fight Wildfires. 15 August 2022. Available online: https://www.ornl.gov/news/sensor-research-helps-fight-wildfires (accessed on 19 August 2024).
- Melbourne Water. Western Treatment Plant Virtual Tour. Available online: https://www.melbournewater.com.au/water-data-and-education/learning-resources/water-and-sewage-treatment-plants/western-treatment-0 (accessed on 30 September 2020).
- Melbourne Water Corporation. Western Treatment Plant Scum Management Improvement Plan; Melbourne Water Corporation: Docklands, VIC, Australia, 2022.
- Simpson, M. WTP 55E Cover Investigation 2018, 55E Cover Movement Report; Melbourne Water Corporation: Docklands, VIC, Australia; Jacobs: Dallas, TX, USA, 2018.
- Photogrammetry Detecting Changes in Polymer Covers. 7 November 2021. Available online: https://www.melbournewater.com.au/about/what-we-do/research-and-innovation/photogrammetry-detecting-changes-polymer-covers (accessed on 19 August 2024).
- Wong, L.; Vien, B.S.; Ma, Y.; Kuen, T. Development of Scum Geometrical Monitoring Beneath Floating Covers Aided by UAV Photogrammetry. Struct. Health Monit. 2021, 18, 71. [Google Scholar]
- Wong, L.; Vien, B.S.; Ma, Y.; Kuen, T.; Courtney, F.; Kodikara, J.; Chiu, W.K. Remote Monitoring of Floating Covers Using UAV Photogrammetry. Remote Sens. 2020, 12, 1118. [Google Scholar] [CrossRef]
- Wardrop, P. 25W Pot Performance Analysis; Melbourne Water Corporation: Docklands, VIC, Australia, 2022.
- Wu, C. Critical Configurations for Radial Distortion Self-Calibration. In Proceedings of the 2014 IEEE Conference on Computer Vision and Pattern Recognition, Columbus, OH, USA, 23–28 June 2014; pp. 25–32. [Google Scholar]
- Li, Y.; Cai, Y.; Wen, D.; Yang, Y. Optimization of radial distortion self-calibration for structure from motion from uncalibrated UAV images. In Proceedings of the 2016 23rd International Conference on Pattern Recognition (ICPR), Cancun, Mexico, 4–8 December 2016; pp. 3721–3726. [Google Scholar]
- Wierzbicki, D. Multi-Camera Imaging System for UAV Photogrammetry. Sensors 2018, 18, 2433. [Google Scholar] [CrossRef] [PubMed]
- Zhang, J.; Lin, X. Advances in fusion of optical imagery and LiDAR point cloud applied to photogrammetry and remote sensing. Int. J. Image Data Fusion 2017, 8, 1–31. [Google Scholar] [CrossRef]
- Habib, A.; Ghanma, M.; Tait, M. Integration of LIDAR and photogrammetry for close range applications. Int. Arch. Photogramm. Remote Sens. Spat. Inf. Sci. 2004, 35, 1045–1050. [Google Scholar]
- Escobar Villanueva, J.R.; Iglesias Martínez, L.; Pérez Montiel, J.I. DEM Generation from Fixed-Wing UAV Imaging and LiDAR-Derived Ground Control Points for Flood Estimations. Sensors 2019, 19, 3205. [Google Scholar] [CrossRef] [PubMed]
- Elaksher, A.; Alharthy, A.; Ali, T. Integrating Satellite Images and Lidar Data for Straight-Line Mapping. In Proceedings of the SPIE Optical Engineering + Applications, San Diego, CA, USA, 5 September 2017; SPIE: Bellingham, WA, USA, 2017; Volume 10402. [Google Scholar]
- Jovanović, D.; Milovanov, S.; Ruskovski, I.; Govedarica, M.; Sladić, D.; Radulović, A.; Pajić, V. Building Virtual 3D City Model for Smart Cities Applications: A Case Study on Campus Area of the University of Novi Sad. ISPRS Int. J. Geo-Inf. 2020, 9, 476. [Google Scholar] [CrossRef]
- Liu, X.; Zhang, Z.; Peterson, J.; Chandra, S. LiDAR-Derived High Quality Ground Control Information and DEM for Image Orthorectification. GeoInformatica 2007, 11, 37–53. [Google Scholar] [CrossRef]
- Wang, S.; Liu, C.; Li, W.; Jia, S.; Yue, H. Hybrid model for estimating forest canopy heights using fused multimodal spaceborne LiDAR data and optical imagery. Int. J. Appl. Earth Obs. Geoinf. 2023, 122, 103431. [Google Scholar] [CrossRef]
- Zhang, P.; He, H.; Wang, Y.; Liu, Y.; Lin, H.; Guo, L.; Yang, W. 3D Urban Buildings Extraction Based on Airborne LiDAR and Photogrammetric Point Cloud Fusion According to U-Net Deep Learning Model Segmentation. IEEE Access 2022, 10, 20889–20897. [Google Scholar] [CrossRef]
- Yang, W.; Liu, Y.; He, H.; Lin, H.; Qiu, G.; Guo, L. Airborne LiDAR and Photogrammetric Point Cloud Fusion for Extraction of Urban Tree Metrics According to Street Network Segmentation. IEEE Access 2021, 9, 97834–97842. [Google Scholar] [CrossRef]
- Sankey, J.B.; Sankey, T.T.; Li, J.; Ravi, S.; Wang, G.; Caster, J.; Kasprak, A. Quantifying plant-soil-nutrient dynamics in rangelands: Fusion of UAV hyperspectral-LiDAR, UAV multispectral-photogrammetry, and ground-based LiDAR-digital photography in a shrub-encroached desert grassland. Remote Sens. Environ. 2021, 253, 112223. [Google Scholar] [CrossRef]
- Ong, W.H.; Chiu, W.K.; Kuen, T.; Kodikara, J. Determination of the State of Strain of Large Floating Covers Using Unmanned Aerial Vehicle (UAV) Aided Photogrammetry. Sensors 2017, 17, 1731. [Google Scholar] [CrossRef]
- Štroner, M.; Urban, R.; Línková, L. A New Method for UAV Lidar Precision Testing Used for the Evaluation of an Affordable DJI ZENMUSE L1 Scanner. Remote Sens. 2021, 13, 4811. [Google Scholar] [CrossRef]
- Diara, F.; Roggero, M. Quality Assessment of DJI Zenmuse L1 and P1 LiDAR and Photogrammetric Systems: Metric and Statistics Analysis with the Integration of Trimble SX10 Data. Geomatics 2022, 2, 254–281. [Google Scholar] [CrossRef]
- Reuter, H.I.; Hengl, T.; Gessler, P.; Soille, P. Chapter 4 Preparation of DEMs for Geomorphometric Analysis. In Developments in Soil Science; Hengl, T., Reuter, H.I., Eds.; Elsevier: Amsterdam, The Netherlands, 2009; Volume 33, pp. 87–120. [Google Scholar]
- Vien, B.S.; Kuen, T.; Rose, L.R.F.; Chiu, W.K. Image Segmentation and Filtering of Anaerobic Lagoon Floating Cover in Digital Elevation Model and Orthomosaics Using Unsupervised k-Means Clustering for Scum Association Analysis. Remote Sens. 2023, 15, 5357. [Google Scholar] [CrossRef]

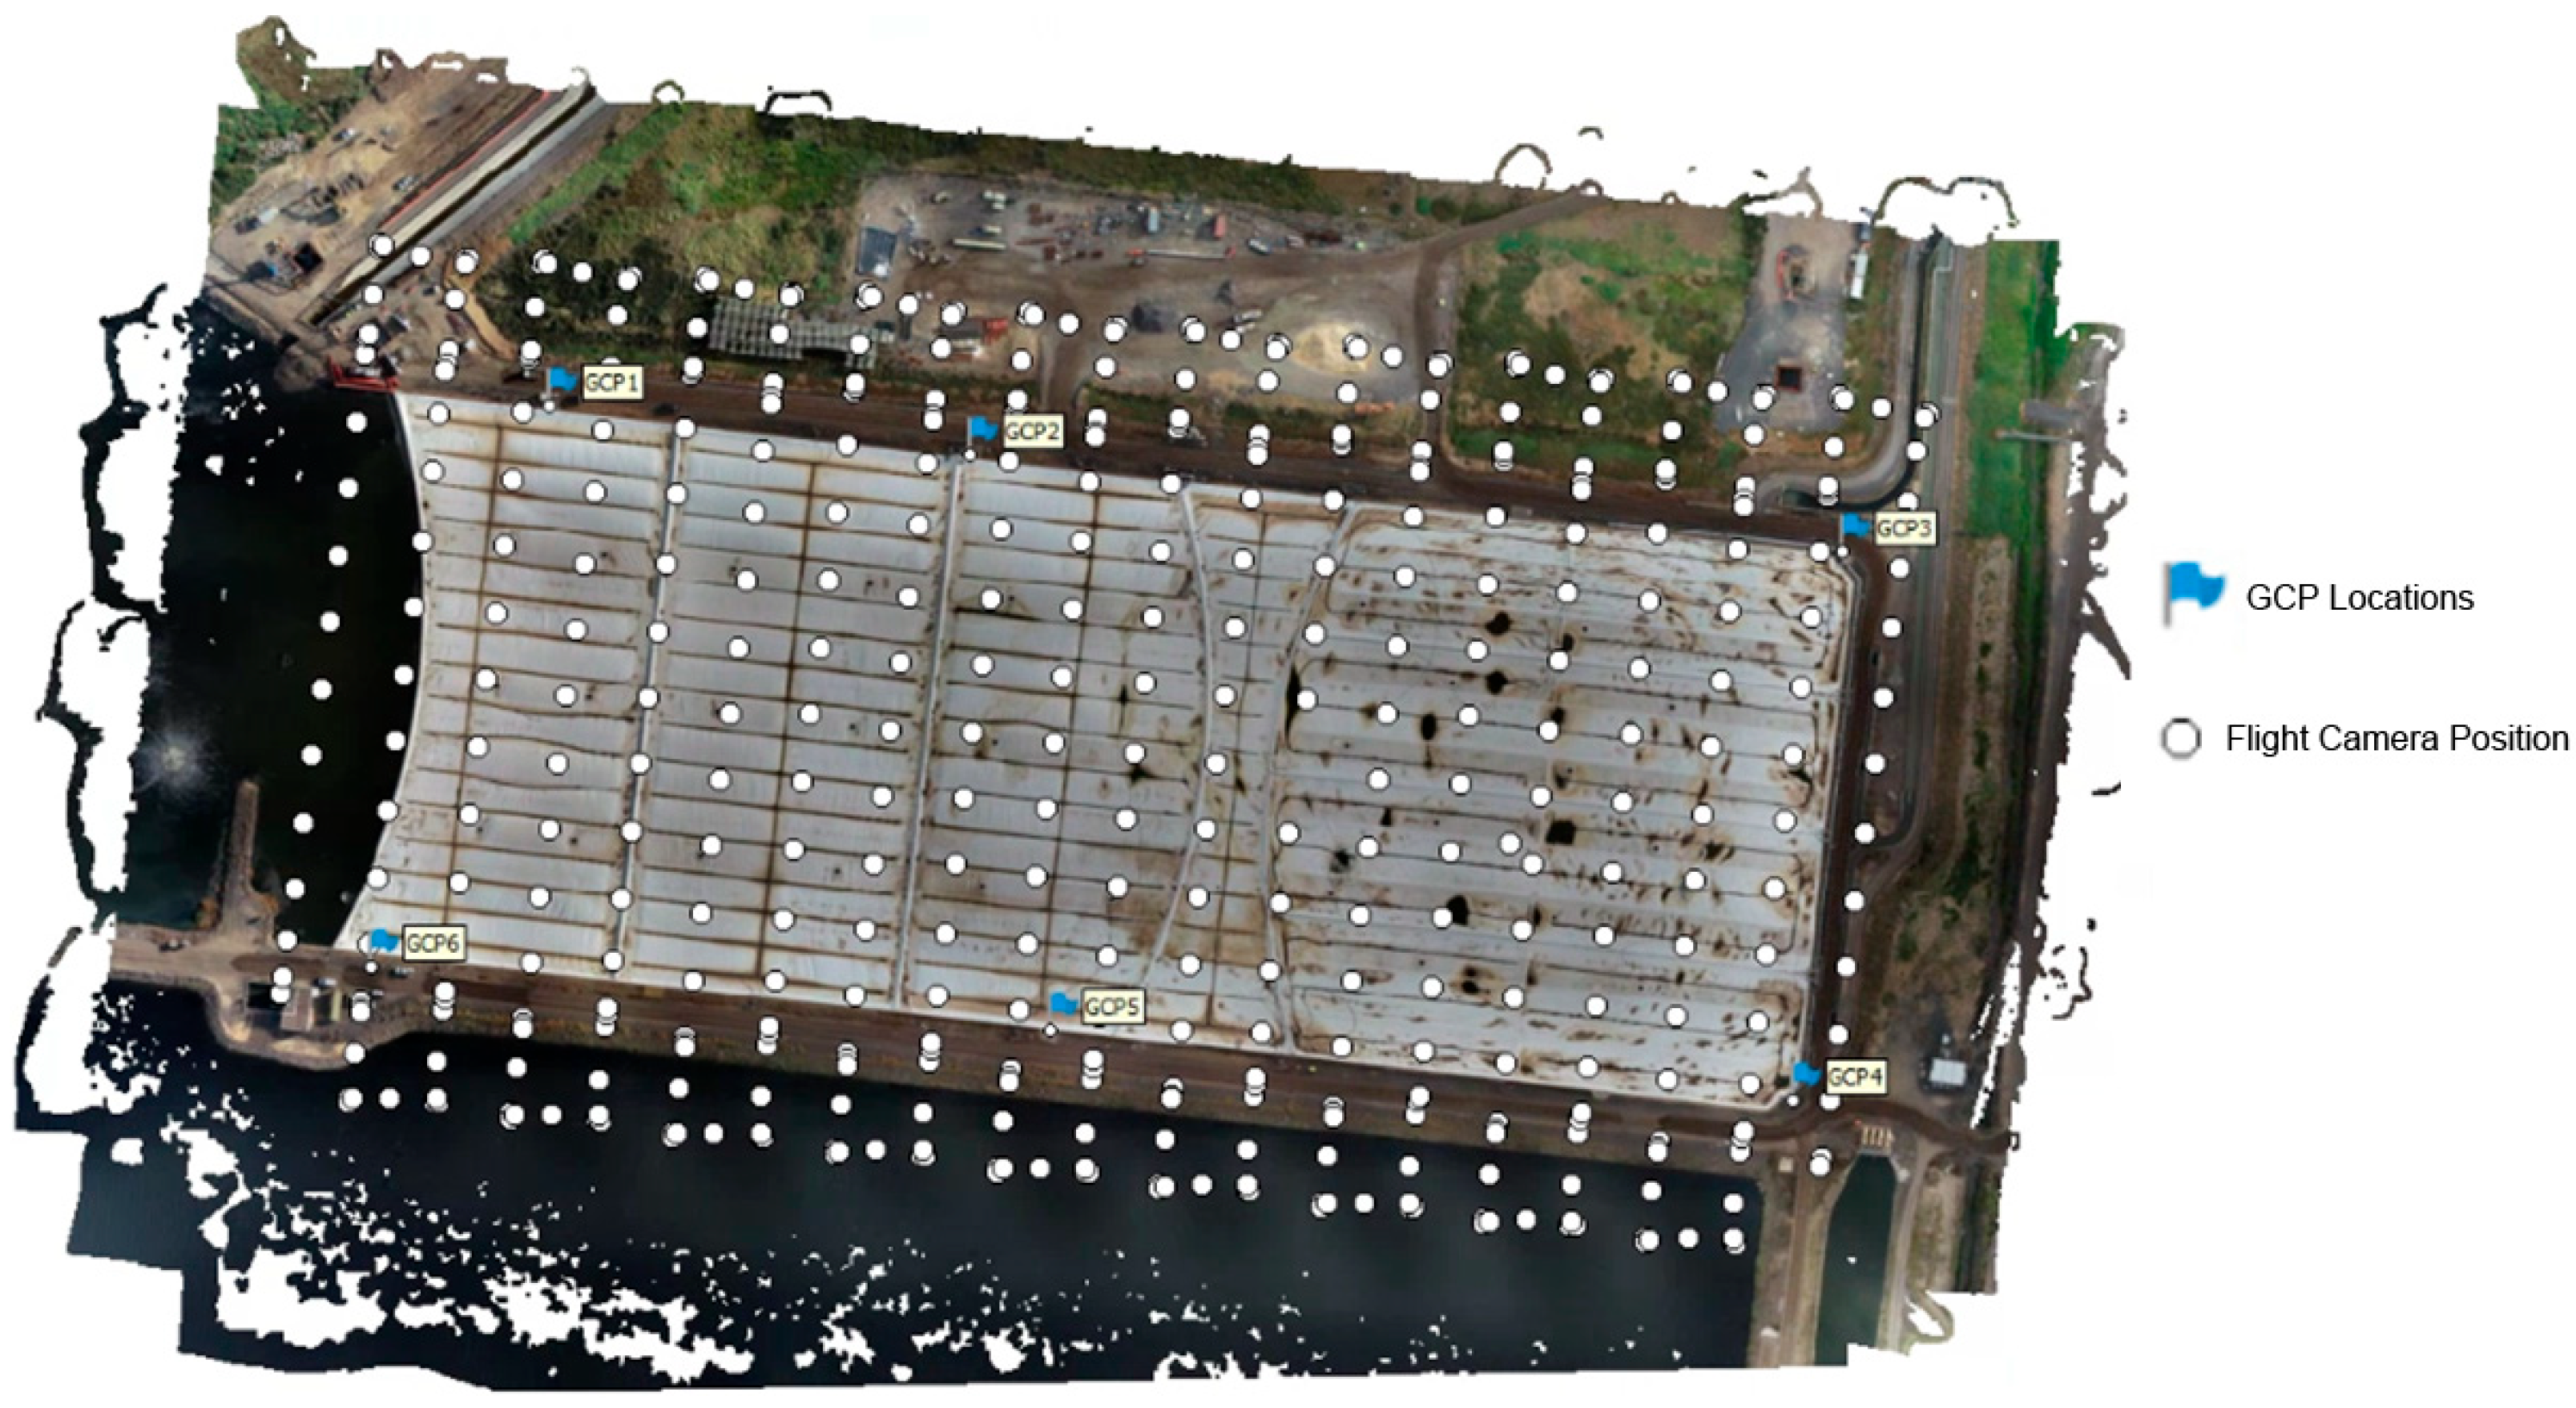


| Flight Parameters | LiDAR Specific Settings | ||
|---|---|---|---|
| Altitude | 70 metres | Return Mode | Dual |
| GSD | 1.91 cm/pixel | Sampling Rate | 240 kHz |
| Point cloud density | 748 points/m2 | Scanning Mode | Repetitive |
| Side Overlap (LiDAR) | 70% | RGB Colouring | On |
| Side Overlap (Visible) | 76% | ||
| Forward Overlap (Visible) | 70% | ||
| Flight Speed | 8.3 m/s | ||
| Feature Type | Template Window Size (Pixels) | Search Window Size (Pixels) |
|---|---|---|
| Static features | 100 × 100 | 160 × 160 |
| Natural features | 200 × 200 | 100 × 100 |
| Artificial square marker features | 10 × 10 | 100 × 100 |
| Photogrammetry Method | Integrated LiDAR-Photogrammetry Method | ||||||
|---|---|---|---|---|---|---|---|
| Processing Stage | Duration | Resolution | Duration | Resolution | Processing Stage | Duration | Resolution |
| Quality Setting | Highest | High | Quality Setting | Highest | |||
| Align Photos | 1 h | - | 1 h | - | Align Photos | 1 h | - |
| Point Cloud Processing (via DJI Terra) | <30 min | - | |||||
| Dense Clouds (Depth Maps) (Dense Point Cloud) | ~10 h (3 h) (7 h) | 506,531,251 pts | ~4 h (1 h) (3 h) | 129,383,883 pts | Dense Clouds | ~1 h | 207,484,387 pts |
| DEM | <5 min | 1.93cm/pixel | <5 min | 3.85 cm/pixel | DEM | <5 min | 2.90 cm/pixel |
| Orthomosaic | <30 min | 1.93cm/pixel | <30 min | 1.93 cm/pixel | Orthomosaic | <10 min | 2.13 cm/pixel |
| Total Duration | ~12 h | ~5 h | Total Duration | ~3 h | |||
| LP-Derived Geospatial Data Error (mm) | Photogrammetry-Derived Geospatial Data Error (mm) | |||||
|---|---|---|---|---|---|---|
| Porthole | Easting | Northing | Elevation | Easting | Northing | Elevation |
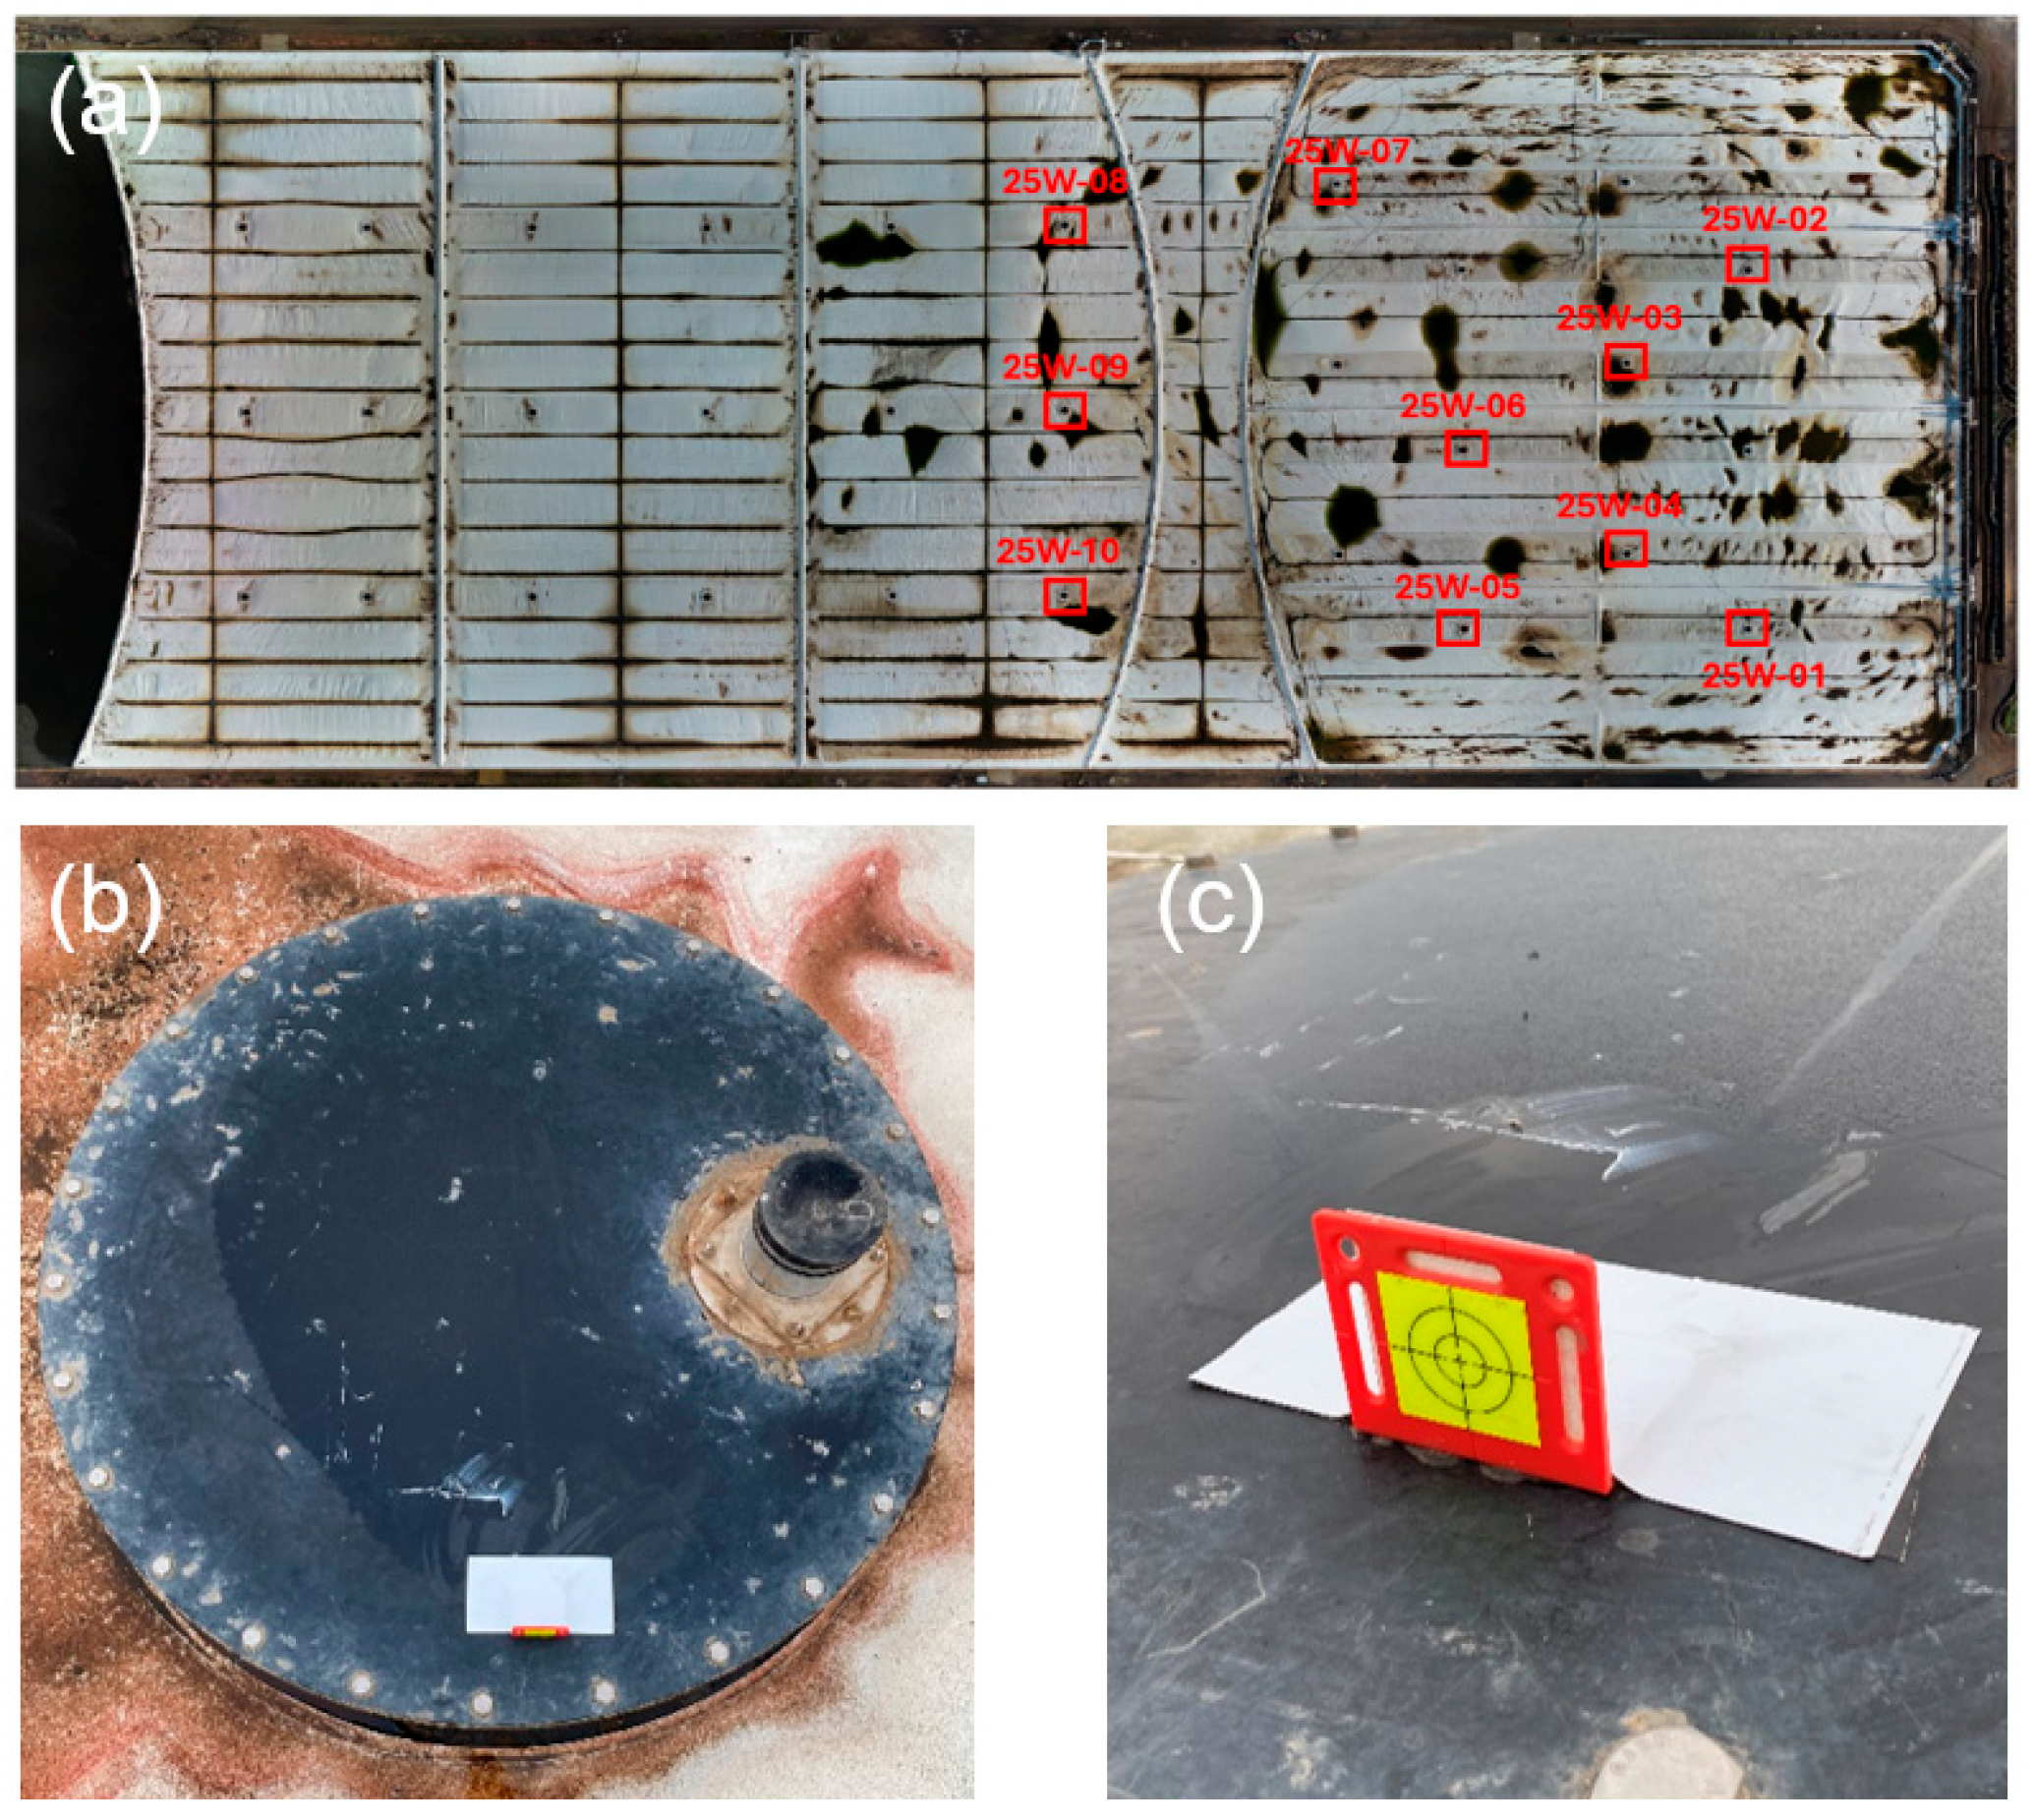
| 25W-01 | −39.2 | 110.9 | −17.1 | −25.7 | 25.0 | 33.7 |
| 25W-02 | 80.2 | 45.2 | −18.1 | 39.9 | −22.7 | 109.9 |
| 25W-03 | 48.0 | −20.7 | 20.4 | 49.6 | −20.0 | 39.9 |
| 25W-04 | 5.1 | −60.8 | 19.2 | 31.0 | 23.6 | 46.6 |
| 25W-05 | −67.3 | −61.3 | 3.1 | 24.1 | 46.4 | −29.4 |
| 25W-06 | −11.6 | −10.4 | 1.0 | 58.2 | −5.2 | −40.8 |
| 25W-07 | 11.9 | −7.4 | −158.5 | 35.6 | −18.8 | −64.9 |
| 25W-08 | −69.9 | 80.0 | 14.1 | −39.5 | 31.8 | 15.3 |
| 25W-09 | −131.1 | −97.7 | 68.5 | 4.2 | 0.9 | −87.3 |
| 25W-10 | −65.2 | −16.2 | −6.8 | 7.4 | 10.8 | −129.3 |
| RMSE | 64.4 | 62.1 | 56.1 | 35.4 | 24.0 | 69.5 |
| CV mean RMSE | 61.63 | 59.56 | 45.42 | 34.68 | 23.22 | 67.03 |
| CV σ RMSE | 18.93 | 17.44 | 32.15 | 7.39 | 5.98 | 19.42 |
| Median | Q1 | Q3 | |
|---|---|---|---|
| LiDAR-derived DEM | 7.3 mm | 2.3 mm | 14.4 mm |
| Photogrammetry-derived DEM | 2.0 mm | 0.8 mm | 3.7 mm |
Disclaimer/Publisher’s Note: The statements, opinions and data contained in all publications are solely those of the individual author(s) and contributor(s) and not of MDPI and/or the editor(s). MDPI and/or the editor(s) disclaim responsibility for any injury to people or property resulting from any ideas, methods, instructions or products referred to in the content. |
© 2025 by the authors. Licensee MDPI, Basel, Switzerland. This article is an open access article distributed under the terms and conditions of the Creative Commons Attribution (CC BY) license (https://creativecommons.org/licenses/by/4.0/).
Share and Cite
Vien, B.S.; Kuen, T.; Rose, L.R.F.; Chiu, W.K. Structural Health Monitoring of Anaerobic Lagoon Floating Covers Using UAV-Based LiDAR and Photogrammetry. Remote Sens. 2025, 17, 3401. https://doi.org/10.3390/rs17203401
Vien BS, Kuen T, Rose LRF, Chiu WK. Structural Health Monitoring of Anaerobic Lagoon Floating Covers Using UAV-Based LiDAR and Photogrammetry. Remote Sensing. 2025; 17(20):3401. https://doi.org/10.3390/rs17203401
Chicago/Turabian StyleVien, Benjamin Steven, Thomas Kuen, Louis Raymond Francis Rose, and Wing Kong Chiu. 2025. "Structural Health Monitoring of Anaerobic Lagoon Floating Covers Using UAV-Based LiDAR and Photogrammetry" Remote Sensing 17, no. 20: 3401. https://doi.org/10.3390/rs17203401
APA StyleVien, B. S., Kuen, T., Rose, L. R. F., & Chiu, W. K. (2025). Structural Health Monitoring of Anaerobic Lagoon Floating Covers Using UAV-Based LiDAR and Photogrammetry. Remote Sensing, 17(20), 3401. https://doi.org/10.3390/rs17203401


