Article

The Diurnal Variation of L-Band Polarization Index in the U.S. Corn Belt Is Related to Plant Water Stress

by
Richard Cirone
1,*,† and
Brian K. Hornbuckle
2,†
1
United States Department of Agriculture, 10300 Baltimore Ave, Beltsville, MD 20705, USA
2
Department of Agronomy, Iowa State University, Ames, IA 50011, USA
*
Author to whom correspondence should be addressed.
These authors contributed equally to this work.
Remote Sens. 2025, 17(2), 180; https://doi.org/10.3390/rs17020180
Submission received: 23 September 2024 / Revised: 21 December 2024 / Accepted: 25 December 2024 / Published: 7 January 2025
(This article belongs to the Special Issue Monitoring Ecohydrology with Remote Sensing)

Abstract

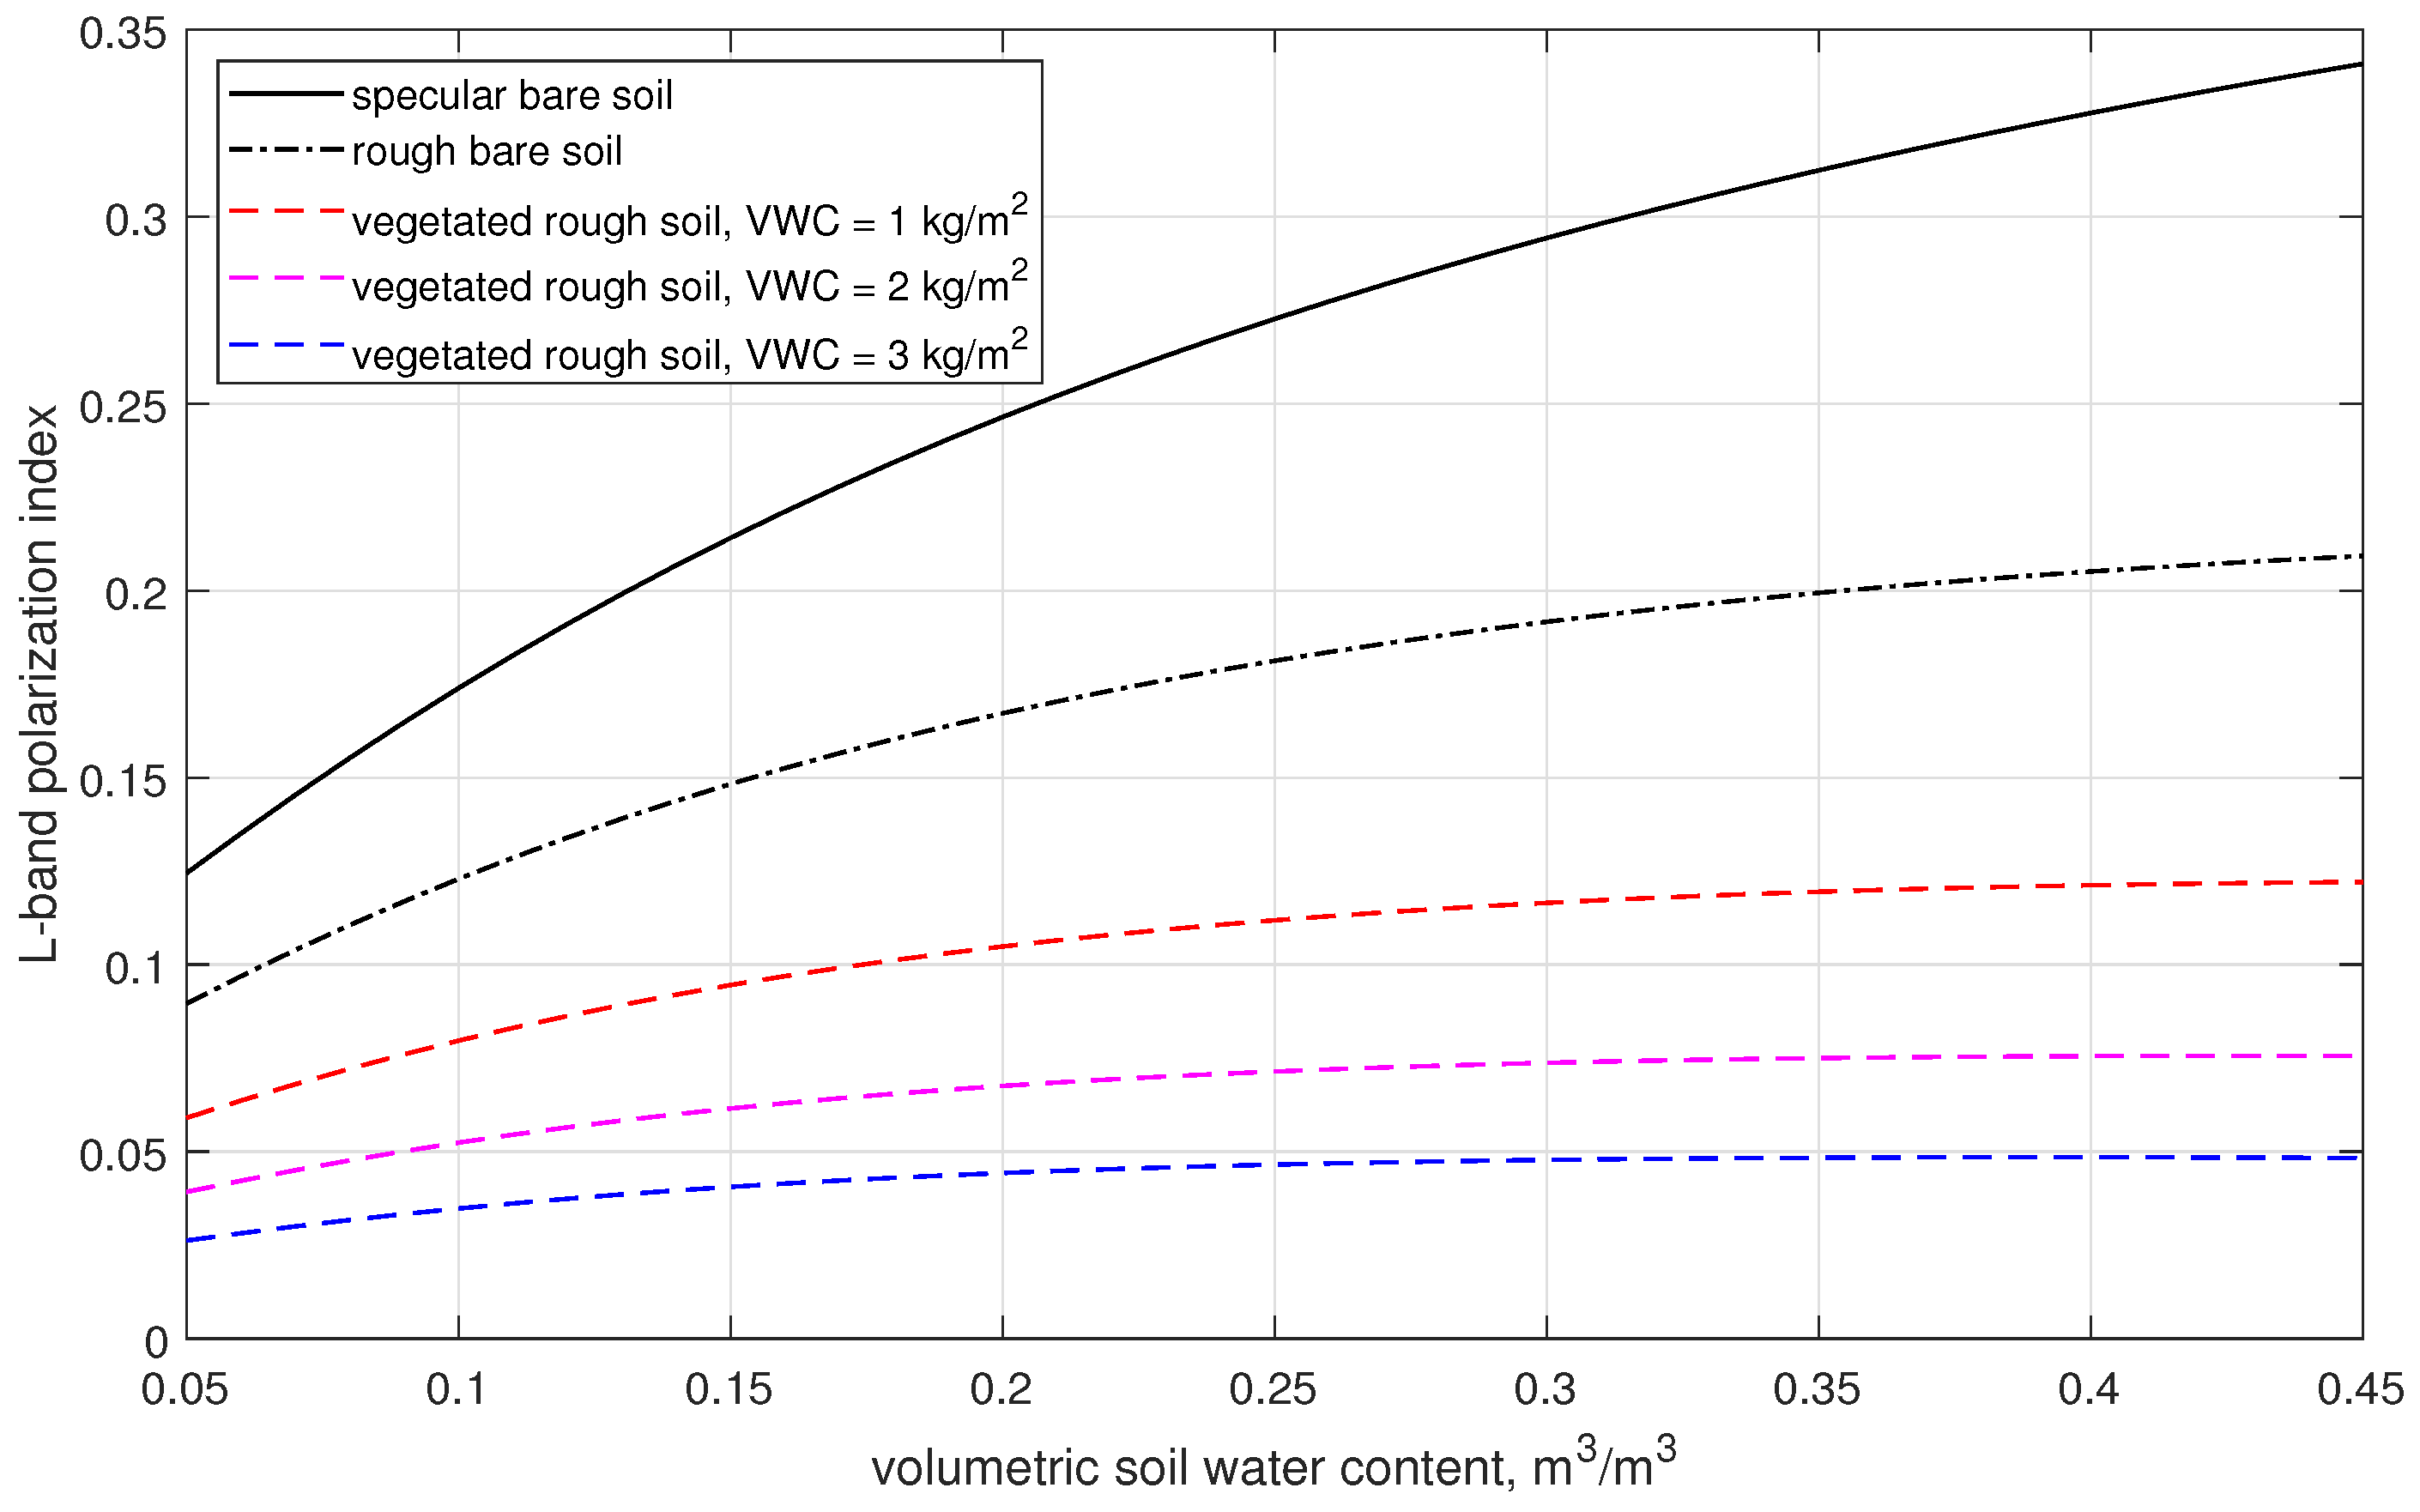
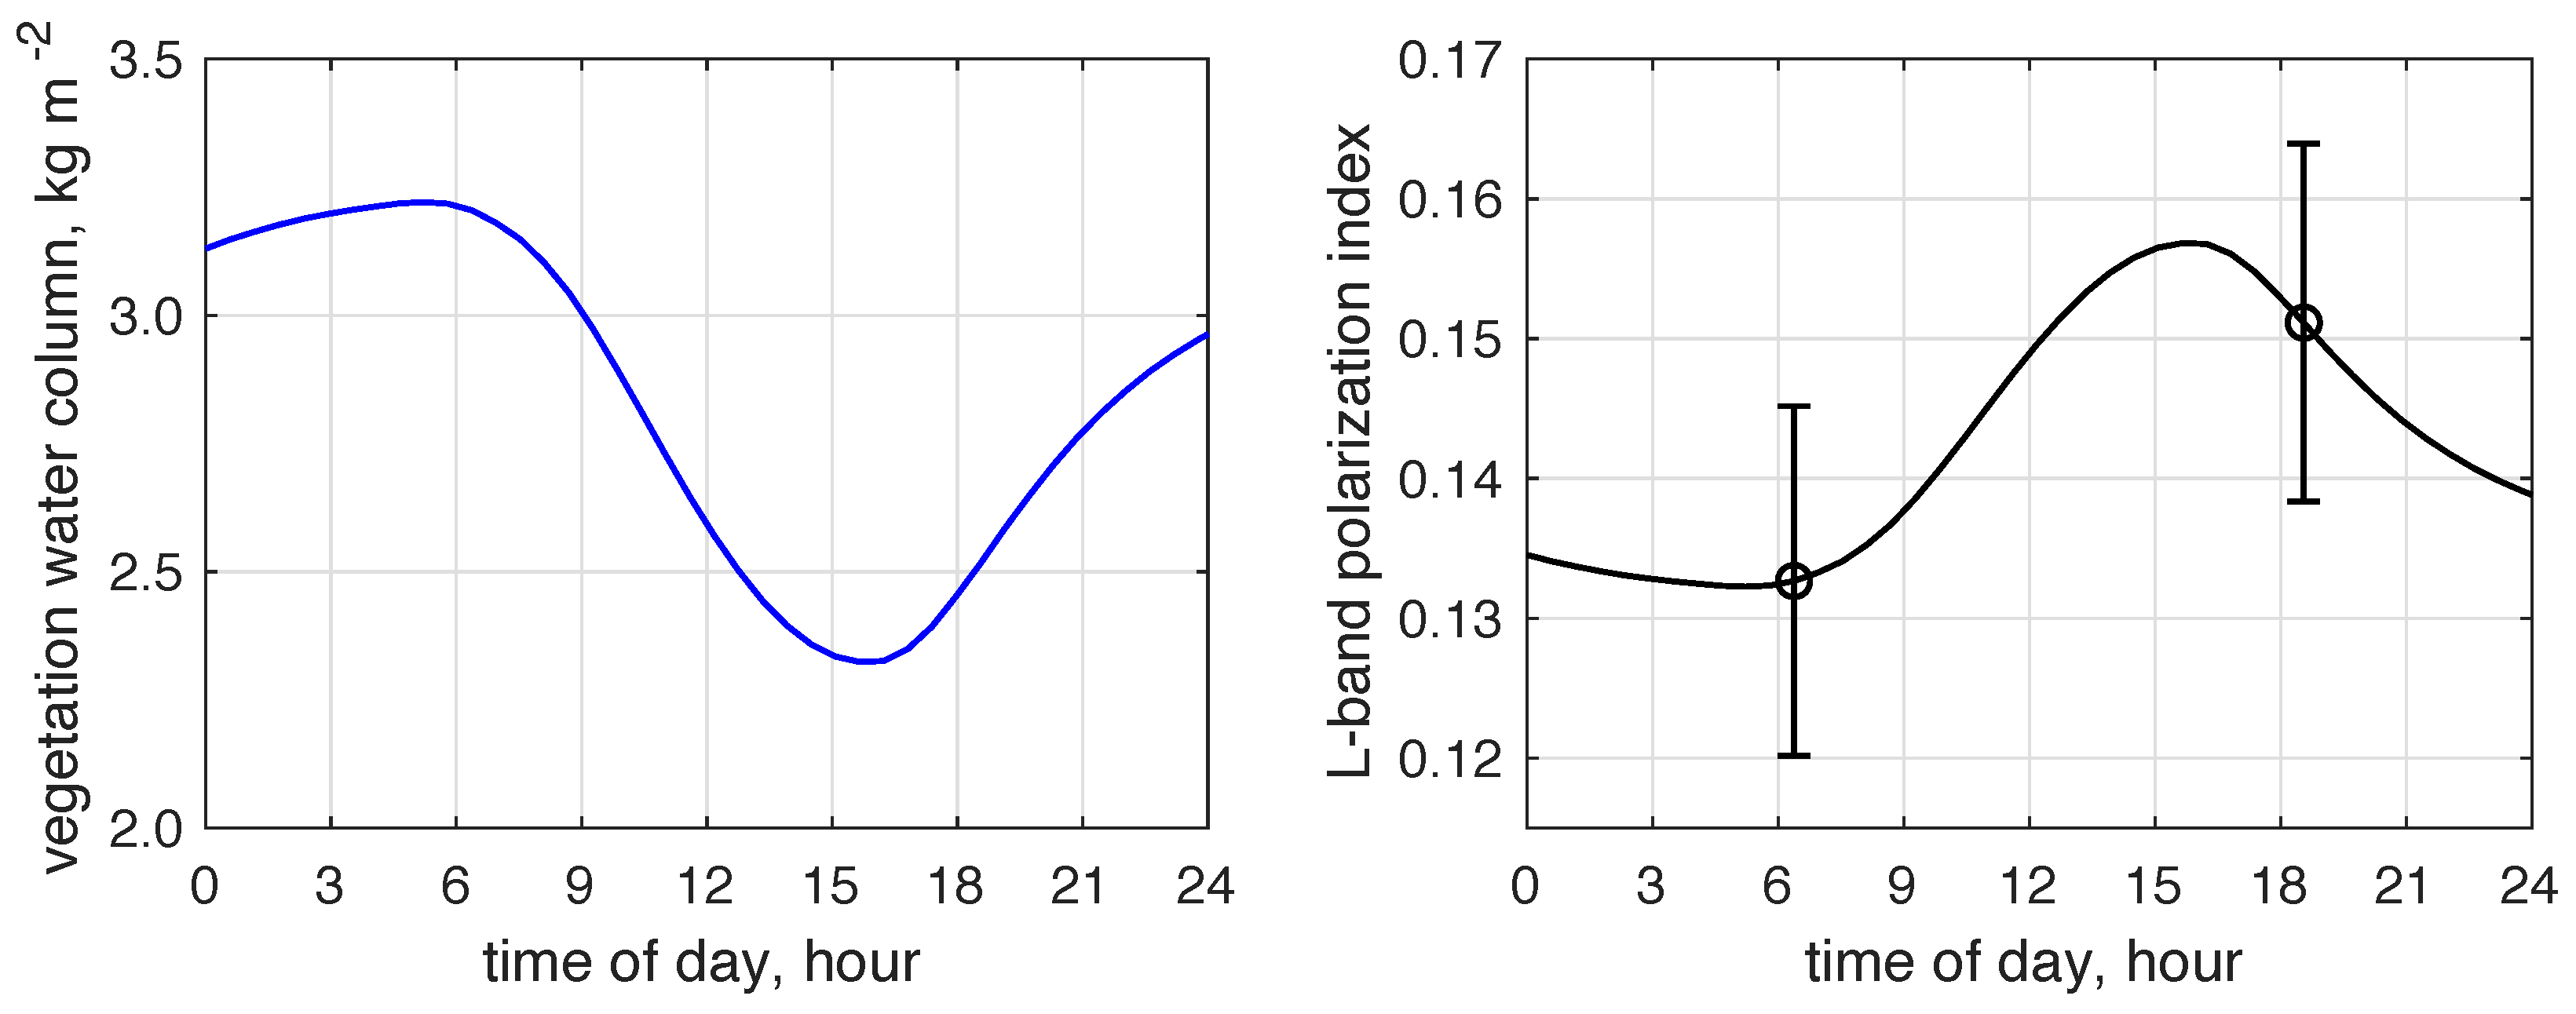
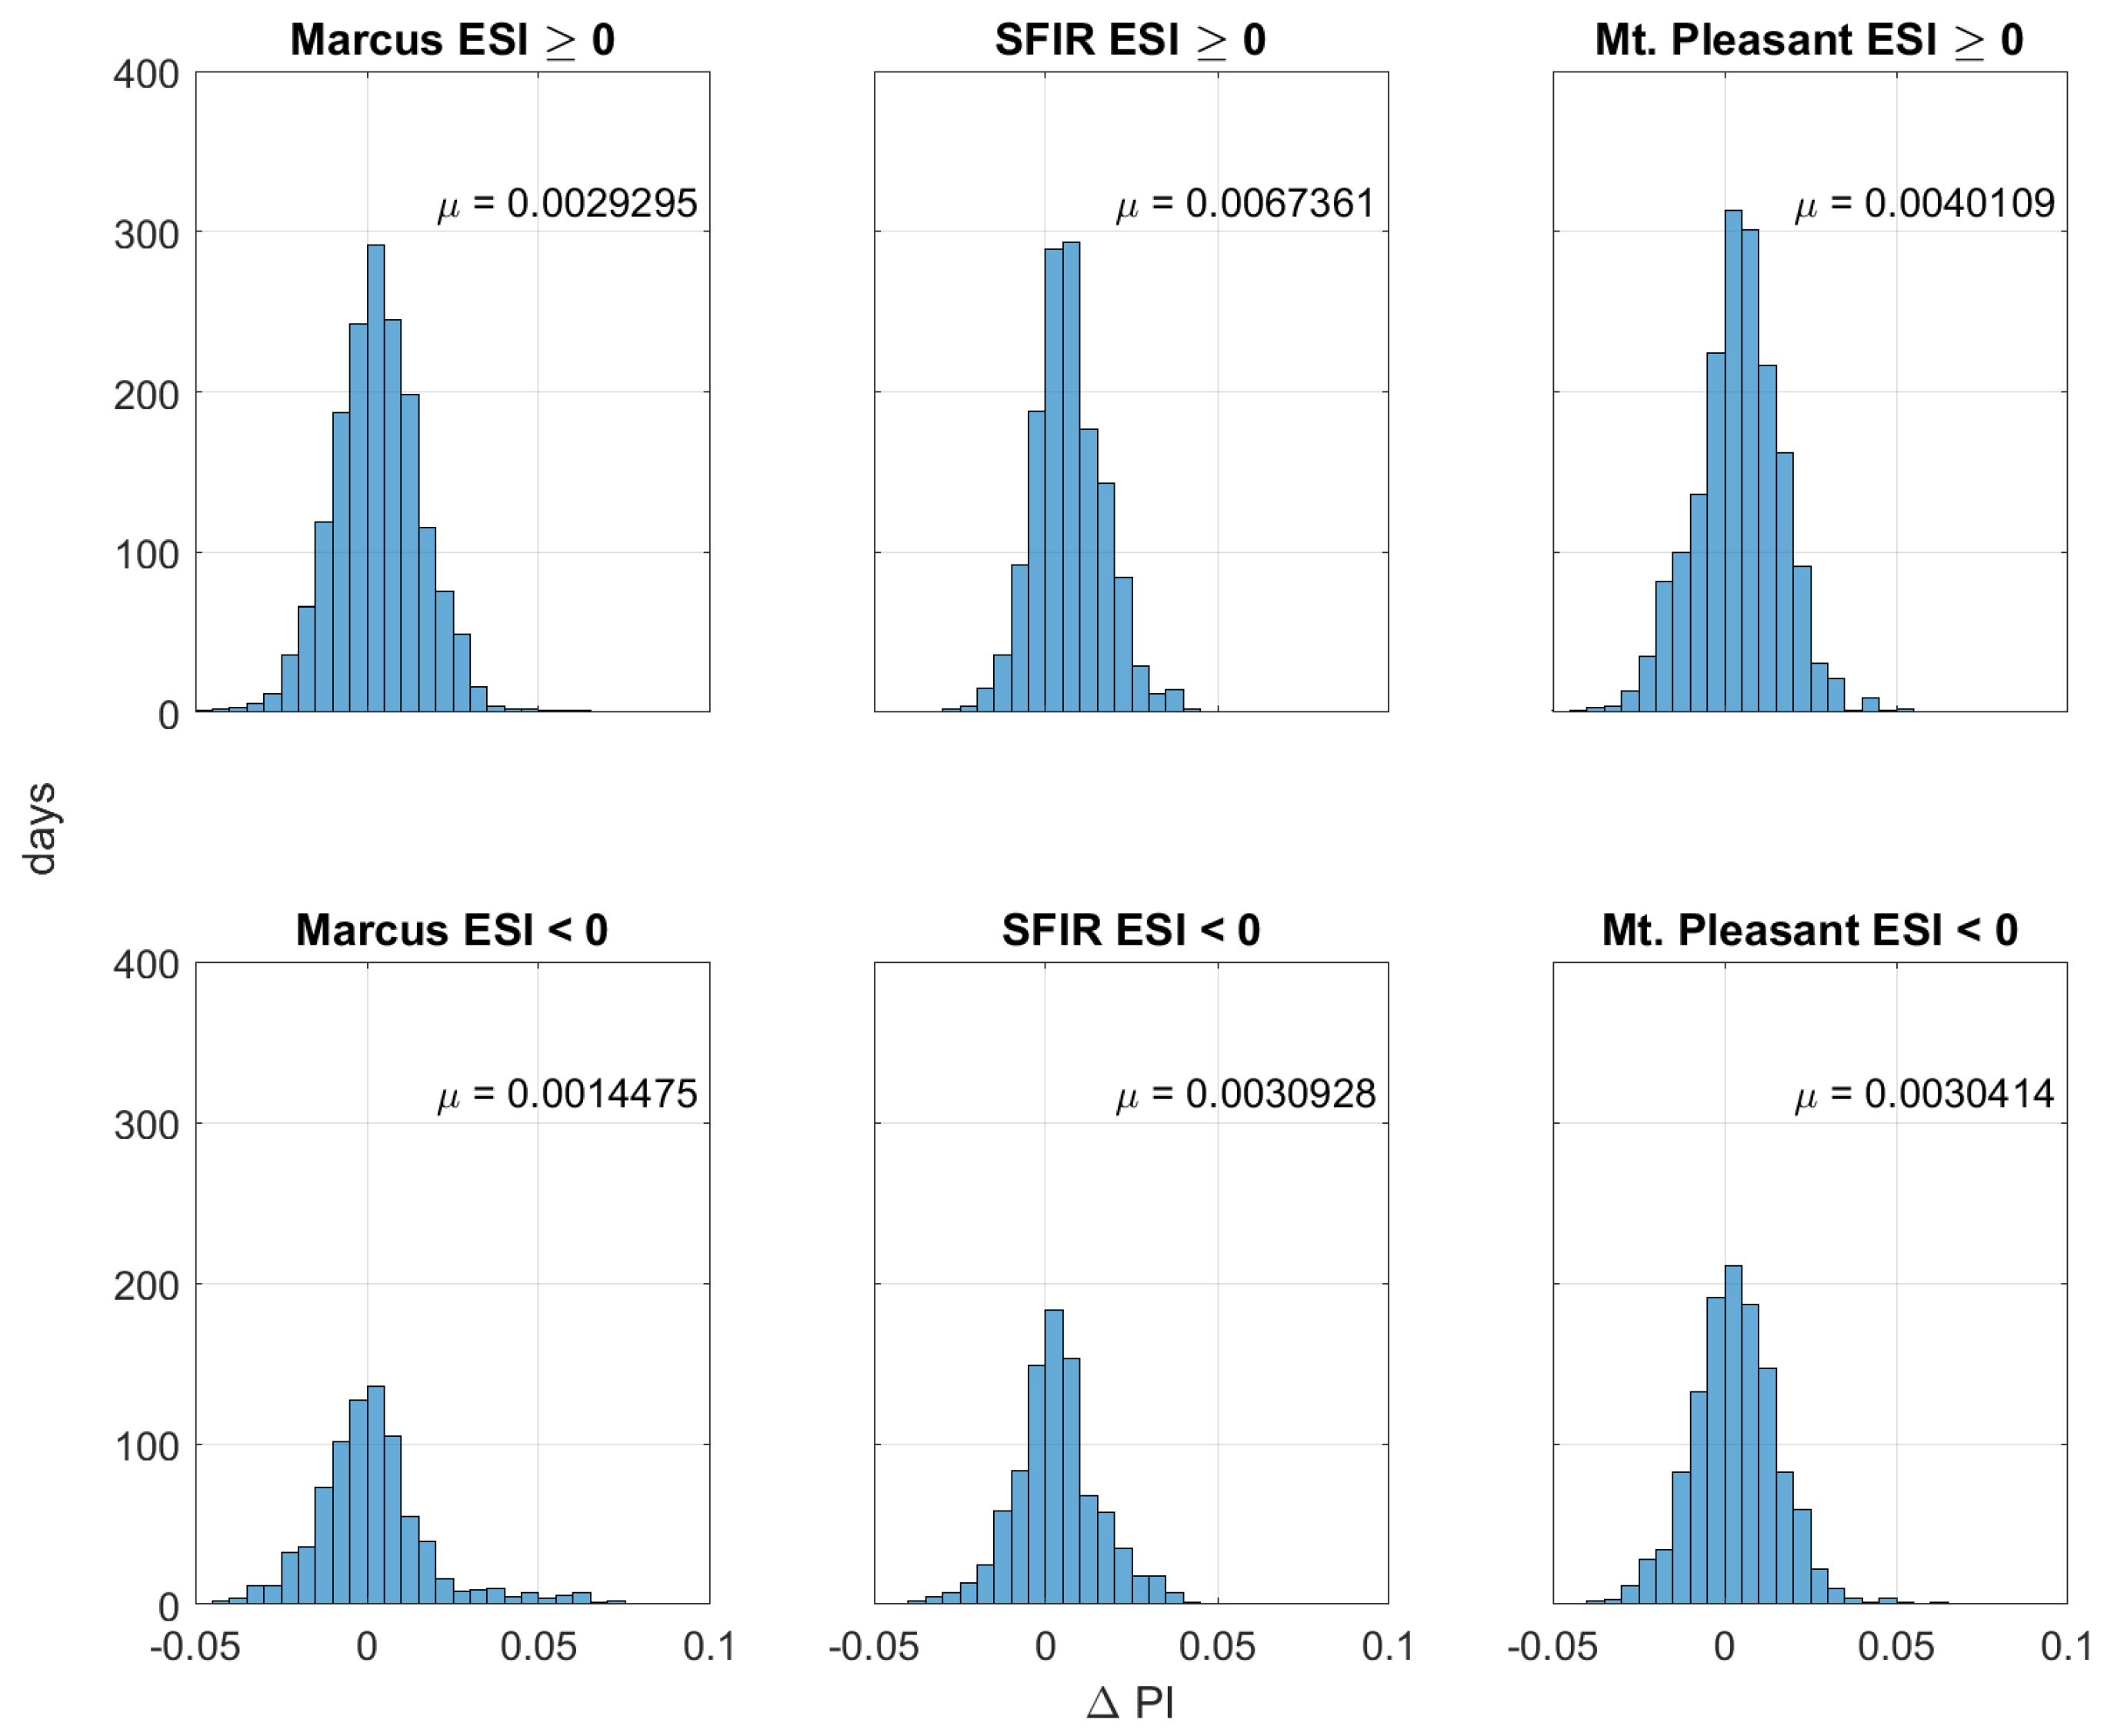
The microwave polarization index (PI), defined as the difference between vertically polarized (V-pol) and horizontally polarized (H-pol) brightness temperature divided by their average, is independent of land surface temperature. Since soil emission is stronger at V-pol than H-pol and vegetation attenuates this polarized soil signal primarily because of liquid water stored in vegetation tissue, a lower PI will be indicative of more water in vegetation if vegetation emits a mostly unpolarized signal and changes in soil moisture within the emitting depth are small (like during periods of drought) or accommodated by averaging over long periods. We hypothesize that the L-band PI will reveal diurnal changes in vegetation water related to whether plants have adequate soil water. We compare 6 a.m. and 6 p.m. L-band PI from NASA’s Soil Moisture Active Passive (SMAP) satellite to the evaporative stress index (ESI) in the U.S. Corn Belt during the growing season. When ESI<0 (there is not adequate plant-available water, also called plant water stress), the L-band PI is not significantly different at 6 a.m. vs. 6 p.m. On the other hand, when ESI0 (no plant water stress), the L-band PI is greater in the evening than in the morning. This diurnal behavior can be explained by transpiration outpacing root water uptake during daylight hours (resulting in a decrease in vegetation water from 6 a.m. to 6 p.m.) and continued root water uptake overnight (that recharges vegetation water) only when plants have adequate soil water. Consequently, it may be possible to use L-band PI to identify plant water stress in the Corn Belt.
Keywords: brightness temperature; polarization; corn; plant water stress; drought brightness temperature; polarization; corn; plant water stress; drought