Article

Comparative Analysis of Multi-Source Evapotranspiration Products in Xinjiang, China

1
Institute of Desert Meteorology, China Meteorological Administration, Urumqi 830002, China
2
Xinjiang Key Laboratory of Tree-Ring Ecology, Urumqi 830002, China
3
Field Scientific Experiment Base of Akdala Atmospheric Background, China Meteorological Administration, Akdala 836499, China
4
College of Civil Engineering, Tongji University, Shanghai 200092, China
5
Laboratory of Remote Sensing Monitoring of Grassland Ecosystems in Arid Zones, Grassland General Station, Xinjiang Uygur Autonomous Region, Urumqi 830049, China
*
Author to whom correspondence should be addressed.
Remote Sens. 2025, 17(19), 3297; https://doi.org/10.3390/rs17193297
Submission received: 9 July 2025 / Revised: 22 September 2025 / Accepted: 24 September 2025 / Published: 25 September 2025

Abstract

Highlights

What are the main findings?
  • The annual PET in Xinjiang increased significantly from 1990 to 2020, with summer and autumn PET showing significant decreases, while ET increased significantly only in autumn.
  • The multi-source ET products showed spatial heterogeneity and seasonal dependency, with better performance in northern Xinjiang and significant variability in desert regions.
What is the implication of the main finding?
  • This study provides valuable information for selecting appropriate ET products for hydrological simulation and climate change analysis in Xinjiang, enhancing the accuracy of related research.
  • This comparison could benefit the understanding of the states and advances of global multi-source ET datasets and provide scientific instruction for the development and improvement of ET models and products.

Abstract

Evapotranspiration (ET) is essential to the terrestrial water and energy cycle. Accurate evapotranspiration estimates are crucial for understanding global and regional climate change and effective water management. This research uses meteorological observations to provide insights into the spatial and temporal trend patterns of potential evapotranspiration (PET) and evapotranspiration in Xinjiang. A comparative analysis was conducted on six remote sensing-based, land surface model-based, and reanalysis-based products across multiple temporal scales (yearly, seasonally, and monthly) and point-to-point spatial dimensions and impacts of different land cover types was explored. The results show that: (1) The annual PET in Xinjiang showed a significant increasing trend, but showed a significant decreasing trend in summer and autumn. The actual evapotranspiration increased significantly in autumn. (2) The simulation of ET products in Xinjiang exhibits pronounced spatial heterogeneity and seasonal dependency. The datasets demonstrated a superior ability to simulate evapotranspiration in the northern part of Xinjiang compared to the southern part. Product performance varied extremely widely in desert areas but was stable in oasis areas. (3) Significant discrepancies exist across the multiple datasets, with the reanalysis-based products demonstrating superior comprehensive performance. This study offers critical insights for the suitable selection of evapotranspiration products and model optimization in the hydro-meteorological research of Xinjiang.

1. Introduction

Evapotranspiration (ET) is a key component of the terrestrial water cycle and surface energy balance [1,2], linking the hydrological, ecological, and climate systems, and its spatial–temporal dynamics have critical scientific implications for agricultural irrigation management, drought disaster monitoring, and climate change research [3]. In the context of climate change, the spatiotemporal evolution of potential evapotranspiration (PET) directly reflects the change in atmospheric evaporation demand. The atmosphere absorbs two-thirds of global precipitation in the form of evapotranspiration, and this percentage exceeds 90% in dryland regions [4]. Research on the intensification of climate warming and its effects on the global water cycle has highlighted the growing significance of understanding changes in evapotranspiration over time and space [5].
Currently, the direct observation of evapotranspiration remains challenging in most global regions. Meanwhile, sparsely and unevenly distributed observations make it difficult to assess the spatial distribution of evapotranspiration accurately [6]. Especially in remote areas, the representativeness of site-scale observations for large scales is limited due to the highly heterogeneous coverage of the land surface. Given this problem, the ET products with broad temporal and spatial coverage are often more useful than in situ observations. Several gridded ET datasets have been developed with the rapid advancement of monitoring and computer techniques [6,7,8]. Advanced technologies, such as machine learning, have also been applied to enhance the accuracy of evapotranspiration estimation [9,10]. Existing ET datasets are primarily generated and categorized based on remote sensing inversion, land surface model simulations, ground observations, and reanalysis. Although multi-source datasets are widely used worldwide, their reliability and applicability still face challenges. Remote sensing products are limited by cloud cover and sensor capabilities, making it challenging to capture instantaneous evapotranspiration dynamics in complex terrain or areas with dense vegetation [11]. Different assumptions regarding energy distribution and surface impedance of remote sensing inversion models result in deviations of ET estimates in the same region of more than 30% [12]. On the other hand, pronounced inter-product discrepancies and large uncertainties persist. The relative error of ET products against observations ranged from 14% to 44% [10,13], and the spread widens appreciably at the regional scale [14,15,16], and it performed poorly in dry climate conditions [17]. Land surface models systematically underestimate ET in the arid areas or irrigated farmland due to simplified parametric schemes [18]. Inter-comparison studies consistently show a systematic underestimation of ET over northwestern China [19,20], and the highest uncertainties of annual ET were observed in arid zones [12,19,21], with coefficients of variation exceeding 25% [22]. Applications of advanced methods like machine learning have increased the availability of datasets, but uncertainty remains high in the arid areas [9,23,24]. Consequently, a comparative analysis of multiple products is essential for selecting the appropriate ET dataset for water-resource or ecological studies in arid regions.
Numerous methods for estimating evapotranspiration have been developed to address the scarcity of actual ET observations. The Budyko framework is one of the most representative and widely applied approaches [25,26]. The Budyko framework clearly and accurately captures the core characteristic of precipitation-dominated evaporation in arid regions. Zhang [27,28] developed the Budyko framework by introducing a key parameter, ω . This parameter quantifies the effects of the underlying surface (particularly vegetation), which has significantly enhanced the model’s explanatory and predictive capabilities in arid regions. Subsequent research on the parameter has further improved the applicability of the Budyko framework in arid zones [29,30]. To simplify the inter-comparison of multiple product comparisons, we introduce ET estimates based on the Budyko framework as a reference. It is crucial to emphasize that the Budyko theory describes ideal conditions in natural watersheds, whereas widespread irrigation activities in Xinjiang significantly change the natural water cycle. Consequently, Budyko-based ET is neither considered as a ground truth nor used as an evaluation benchmark. All comparison results should be understood as relative differences between products and this reference.
Xinjiang spans a vast area encompassing complex and variable climate conditions and unique ecosystems. Given its arid environment, where water resources are critically limited, accurate estimation of evapotranspiration is fundamental for the understanding of regional water and energy cycles. However, achieving reliable ET estimates in this region remains highly challenging due to its heterogeneous landscapes and sparse ground observations. This paper uses long-term meteorological observations to analyze the spatiotemporal evolution of potential evapotranspiration and evapotranspiration in Xinjiang. Taking ET0 estimations based on the Budyko framework as the theoretical reference within a multi-source comparison, this study examines the divergence of six evapotranspiration products across multiple temporal scales (yearly, seasonally, and monthly) and point-to-point spatial dimensions. This finding provides referable information for selecting an appropriate ET product for hydro-meteorological analysis in Xinjiang and the development of ET models and products. This paper is organized as follows: Section 2 introduces the data and methods; Section 3 presents PET and ET spatiotemporal patterns and comparative assessments of multi-source products; Section 4 discusses key sources of uncertainty; and Section 5 summarizes the main conclusions.

2. Materials and Methods

2.1. Research Areas

Xinjiang extends from 73°E to 95°E, and from 42°N to 50°N. The area exhibits significant geomorphological diversity and shapes the marked climatic diversity. The Altai Mountains in the north, the Tianshan Mountains in the center, and the Kunlun Mountains in the south make up the three major mountain systems, between which are the two inland basins of the Junggar Basin and the Tarim Basin. The Tianshan Mountains traverse the region longitudinally, demarcating climatically divergent southern and northern Xinjiang. Characterized by a wet climate in the north and a dry climate in the south. Orographic uplift effects induce elevated precipitation in high-altitude zones of the Tianshan and Kunlun Mountains, fostering unique mountain–oasis–desert composite ecosystems. Significant annual and seasonal variations in hydrological and climatic parameters characterize this diversity. Figure 1 shows the geomorphic features, geographical position, and the spatial distribution pattern of precipitation in Xinjiang.

2.2. Datasets

2.2.1. ET Products

This paper utilized six widely recognized multi-source evapotranspiration products, including remote sensing-based, land surface model-based, and reanalysis-based products, which incorporate remote sensing observation data into their input variables. The metadata information of these evapotranspiration products is summarized in Table 1. A brief introduction of these datasets is as follows.
(1) The Global Land Evaporation Amsterdam Model (GLEAM) is a global land evaporation model that provides data on the different components of land evaporation, which is used to estimate these components. The dataset is based on satellite and reanalysis data. GLEAM 4.2a was used in this paper, which provides global terrestrial evaporation data from 1980 to 2023 with a spatial resolution of 0.1°.
(2) The Global Land Data Assimilation System (GLDAS) evapotranspiration dataset utilizes the Noah Land Surface Model to combine satellite and ground-based observations to provide high-resolution land surface state and flux data. The spatial resolution is 0.25° and the temporal resolution is month-by-month, with a time length of 2000–2020.
(3) The evapotranspiration product based on thermal infrared and microwave (TIM) data [31] was driven by the Water–heat Coupled Two-Source Energy Balance Model across China to estimate ET and a reconstruction strategy to fill the spatial gaps caused by data missing and cloud cover when applying the thermal infrared model. Combining a deep neural network and reference ET, this reconstruction framework is a two-step process for reconstructing ET. This product could accurately respond to changes in vegetation transpiration and soil evaporation caused by soil moisture stress in arid and semi-arid regions of China. This dataset has a spatial resolution of 0.01°, covering the entire China region and spanning the period from 1 January 2001, to 31 December 2020. The National Tibetan Plateau Data Center provided this dataset.
(4) The land surface component of the fifth-generation ECMWF reanalysis (ERA5) is a widely used land-based climate reanalysis dataset from the European Centre for Medium-Range Weather Forecasts. The monthly data used in this study is total evapotranspiration from the ERA5-land reanalysis dataset, with a spatial resolution of 0.1°, spanning the period from 1990 to 2020.
(5) The second Modern-Era Retrospective Analysis for Research and Applications (MERRA2) combines various observations, including satellite, ground, and aircraft observations. It fuses them through data assimilation techniques to provide more accurate meteorological information. The MERRA2 dataset provides high-quality global daily data from 1980 to the present. The data applied in the present study are aggregated to a month-by-month resolution.
(6) The China Global ReAnalysis-40 (CRA40) is the first independent atmosphere/land surface reanalysis dataset of China. It was released in 2021 by the National Meteorological Information Center of China, assimilating global conventional observations and multi-source satellite data. This dataset comprises 204 atmospheric and land surface variables, including temperature, evaporation, and runoff. Its spatial resolution is 0.28°, and its time range is from 1979 to 2020.
Currently, there are two common approaches to addressing the resolution mismatch issue encountered when using site data to evaluate grid datasets. The first approach involves an interpolation method in the station or grid data to match the two datasets to have the exact spatial resolution. However, interpolation methods have some limitations and inevitably introduce interpolation-related uncertainties [32]. Specifically, the sparsely and uneven spatial distribution of stations in Xinjiang makes the validation results less reliable. The second approach is to directly compare the station observations with the corresponding grid cell values in the dataset being validated. Although this method only provides validation results for grid cells that contain observation stations, it avoids the uncertainties introduced by interpolation and ensures the reliability of the accuracy assessment. In this study, we adopted the second approach for the validation.

2.2.2. Meteorological Observations

The main application of meteorological observed data consists of 8 elemental meteorological elements, including precipitation, near-surface air mean temperature, near-surface air maximum temperature, near-surface air minimum temperature, air relative humidity, near-surface total wind speed, sunshine duration, and air pressure. The data for calculating potential and evapotranspiration are daily, from 1961 to 2020, at 93 stations in Xinjiang. And the data were obtained from the China Meteorological Administration (https://data.cma.cn/) (accessed on 20 January 2025). These data were used in the calculation of PET and ET. Additionally, to compare the divergence in multi-source ET products across different land use types, we classified the meteorological stations into three groups using their land use metadata (Figure 1c). Mountain stations are those situated above 1500 m elevation, desert stations are defined by annual precipitation < 50 mm and natural vegetation fraction < 10 %, and the remaining sites are designated as oasis stations.

2.3. Methods

2.3.1. The Calculation of PET

In this paper, potential evapotranspiration was calculated using the Penman–Monteith formula, as recommended by the Food and Agriculture Organization of the United Nations [33]. The Penman–Monteith formula is built on physical principles. It comprehensively considers the influence of various meteorological factors, such as solar radiation, air temperature, and wind speed, on potential evapotranspiration. The method is widely used in agriculture and water resource management. The calculation formula is as follows:
P E T = 0.408 R n G + γ 900 T + 273 u 2 ( e s e a ) + γ ( 1 + 0.34 u 2 )
In this formula, is the slope of the saturation vapor pressure–temperature curve (kPa °C−1); Rn is net radiation at the canopy layer (MJ (m2 d)−1); G is the soil heat flux density (MJ·(m2 d)−1); and γ is the psychrometric constant (kPa °C−1), dependent on atmospheric pressure and temperature. T and u2 are the daily mean air temperature (°C) and wind speed (m·s−1) at 2 m height, respectively; es is Saturation vapor pressure (kPa); and ea is actual vapor pressure (kPa), derived from relative humidity.

2.3.2. The Calculation of Reference ET (ET0)

This study employs Budyko’s water–heat coupling balance theory [34] as its core framework. By using long-term meteorological observations, ET is estimated and adopted as the reference for evaluating multi-source ET products. The core principle of the Budyko framework is that the water expenditure (actual evapotranspiration, ET) of a closed watershed at the multi-year average scale is determined by both water supply (precipitation, P) and energy supply (potential evapotranspiration, PET). Given the pronounced water–heat contradiction in arid regions, the Budyko framework effectively reflects the characteristic of ET as dominated by precipitation.
The Fu–Budyko model [35] provides an analytical parameterization of the classical Budyko framework. It mathematically links long-term average ET at the watershed scale to P and PET, using parameters to quantify how the watershed’s surface cover (e.g., vegetation, topography) modulates hydro-temperature distribution. The model is as follows:
E T P = 1 + P E T P 1 + P E T P ω 1 / ω
where ET is the evapotranspiration, P is the precipitation, PET is the potential evapotranspiration, and ω is the dynamic water–energy coupling parameter. It is governed by physical factors at both local and global scales, requiring parameter calibration based on the climate and surface characteristics of the study area [28]. Considering the complex terrain and vegetation coverage in Xinjiang, the calculation of ω  refers to the empirical formula proposed by Xu [36]. This empirical formula considers latitude, altitude, terrain factor, watershed area, and vegetation factor parameters.
ω = 5.05722 0.0.9322 l a t + 0.13085 C T I + 1.31697 N D V I + 0.00003 A 0.00018 e l e v
where lat represents the absolute latitude of the basin center, CTI represents the Compound Topographic Index, NDVI represents the Normalized Difference Vegetation Index, A represents drainage area, and elev represents elevation.

2.3.3. Statistical Index

Six indices, including R2, Root Mean Squared Error (RMSE), correlation coefficient (CC), Bias Coefficient (BC), Symmetric Mean Absolute Percentage Error (SMAPE), and Corrected Root Mean Square Error (CRMSE), were used to evaluate the effectiveness and applicability of different ET products in Xinjiang. R2 is used to measure the effectiveness of model fitting; RMSE visualizes the average deviation between predicted and actual values and is sensitive to outliers. It is a good reflection of how well the model fits the extreme values. The Pearson correlation coefficient is used to identify the linear statistical association between the reference and the target datasets. And correlation is significant at the 0.05 level based on two-tailed test. SMAPE is used to assess the overall error characteristics of the datasets. It balances overestimation and underestimation deviations, which is particularly advantageous for evaluating predictive model accuracy with large differences in magnitude. The Bias Coefficient is defined as the ratio of bias to the absolute value of reference, quantitatively assessing the magnitude of bias in target datasets while preserving positive and negative error information. CRMSE is an indicator that determines the random variation in target models. It is derived from the theory of error decomposition. It removes the bias effect from the traditional root-mean-square error, reflecting the random residual mistake after removing systematic bias, thus analyzing the source of error more clearly. Given that this study involves multiple tests from 93 meteorological stations, we adopted the Benjamini–Hochberg(B–H) method [37,38] to correct the p-values of the trend tests. The significance level was set at α = 0.05. All the significant conclusions reported in this study are based on the results after B–H correction.

2.3.4. Distance Between Indices of Simulation and Observation (DISO) Index

To make the complex comparisons of multi-source ET products in Xinjiang simple, intuitive, and understandable, the new DISO index was applied in this paper. The DISO index [39] combines multiple statistical indexes and gives a single normalized result for a comprehensive judgment of simulation capability. It effectively overcomes the limitations of single indicators. The statistical index that was applied in the DISO was flexible and optimally selected according to the research needs. The calculation of the DISO index in this study is as follows:
D I S O = ( C C s C C b ) 2 + ( B C s B C b ) 2 + ( S M A P E s S M A P E b ) 2 + ( C R M S E s C R M S E b ) 2
where CCs, BCs, SMAPEs, and CRMSEs are the statistic index for the ET simulation; CCb, BCb, SMAPEb, and CRMSEb are the statistic index for reference ET0. The statistical index involved requires range normalization to eliminate the influence of dimensions before calculation. According to the definition of DISO, the simulations with the lowest DISO value among all models perform the best.

3. Results

3.1. The Temporal Variation and Spatial Trend of PET and ET in Xinjiang

3.1.1. The Temporal Variation and Spatial Trend of PET

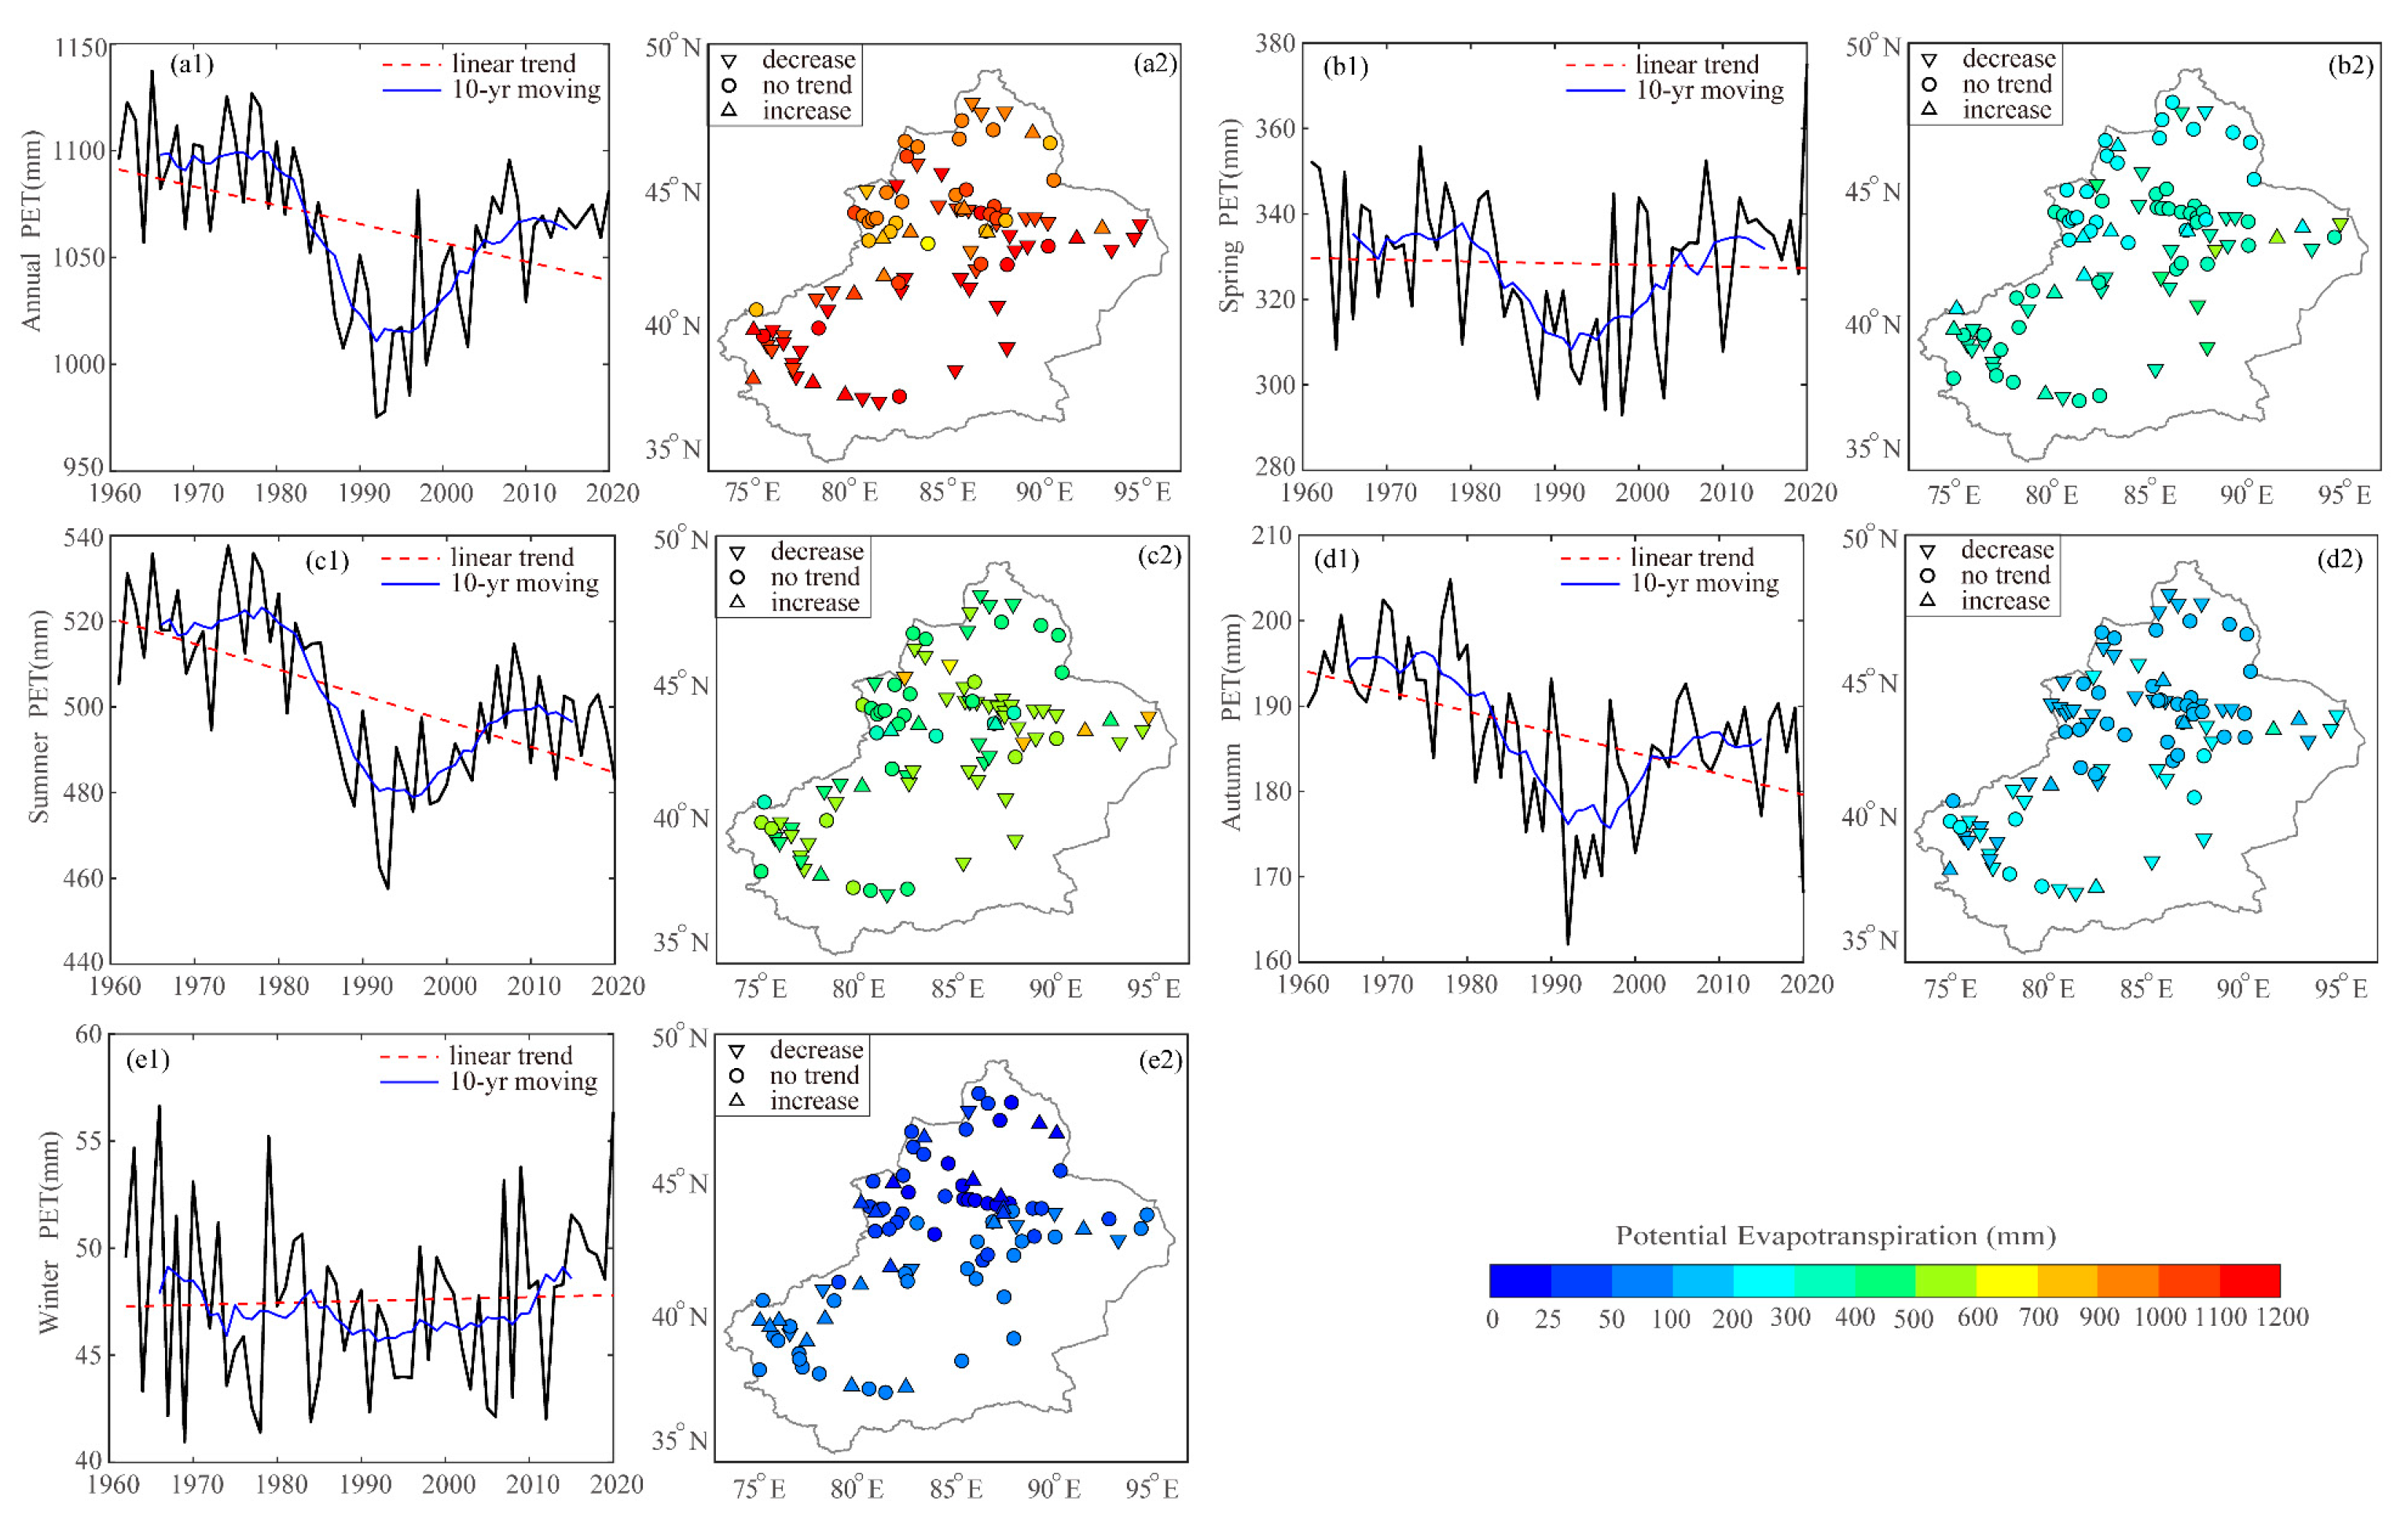
This part provides an accurate calculation of annual and seasonal potential and evapotranspiration values calculated by the Penman–Monteith formula (described by Equation (1) in Section 2.3) based on 93 meteorological observations. Trend significance was assessed with the Mann–Kendall test and further adjusted for multiple testing using the Benjamini–Hochberg method. Figure 2 illustrates the temporal and spatial variations in potential evapotranspiration across Xinjiang from 1961 to 2020. The average annual PET over this period was approximately 1065.25 mm. The long-term trend analysis revealed a statistically significant decreasing trend at a rate of −0.81 mm a−1 (p < 0.01). However, a closer examination of the PET temporal pattern shows that overall trend is not linear. The time series exhibits a distinct “V”-shaped pattern, characterized by a decreasing phase from 1979 to 1992 at a rate of −7.27 mm a−1 (p < 0.01), followed by a pronounced increasing period from 1993 to 2012 at rate of 4.30 mm a−1 (p < 0.01). The distinct “V”-shaped PET in Xinjiang highlights a critical climatic shift in the early 1990s, marking a key response to global warming.
The trend in different seasons was similar to the annual PET. The highest evapotranspiration occurred in summer at approximately 502.42 mm, accounting for nearly half of the annual total, while the lowest occurred in winter, at only 4.45% of the annual total. Furthermore, PET exhibited a robust decrease in summer and autumn, with an interannual change of −0.58 mm·a−1 and −0.22 mm a−1 (p < 0.01), respectively. The same “V”-shaped pattern was consistently observed in the spring, summer, and autumn. PET in winter shows a slight increase, which is the opposite of the other seasons. The PET in Xinjiang exhibits an increase from north to south in spatial terms and shows a discernible influence of altitude and land cover. There is a significant decreasing trend of 47.3% of stations around the Tarim Basin and Tianshan Mountain, and 9.68% of stations show a significant increase, with an ambiguous spatial distribution.
The spatial distribution of the average annual PET trends indicates that the most notable increases are located in the Tianshan and Kunlun mountainous regions. The increased range was wider in spring and winter, with the maximum PET growth rate in spring exceeding 0.4 mm a−1. Furthermore, more significant PET reduction trends were observed in summer and autumn in the north of the Tianshan Mountains. The characteristics of the spatial distribution of PET trends in summer and autumn are similar to the spatial distribution of average annual PET trends. More than 50% of the station areas showed a significant downward trend, mainly in the Tianshan Mountains and the western part of southern Xinjiang. Additionally, the increased range was wider in spring and winter, with the maximum PET growth rate exceeding 0.4 mm a−1 in spring. More stations did not show significant trends in spring and winter, with about 70% of stations in winter and 58% in spring. A total of 23% of all stations in winter show a significant increase, the highest in the four seasons.

3.1.2. The Temporal Variation and Spatial Trend of Evapotranspiration

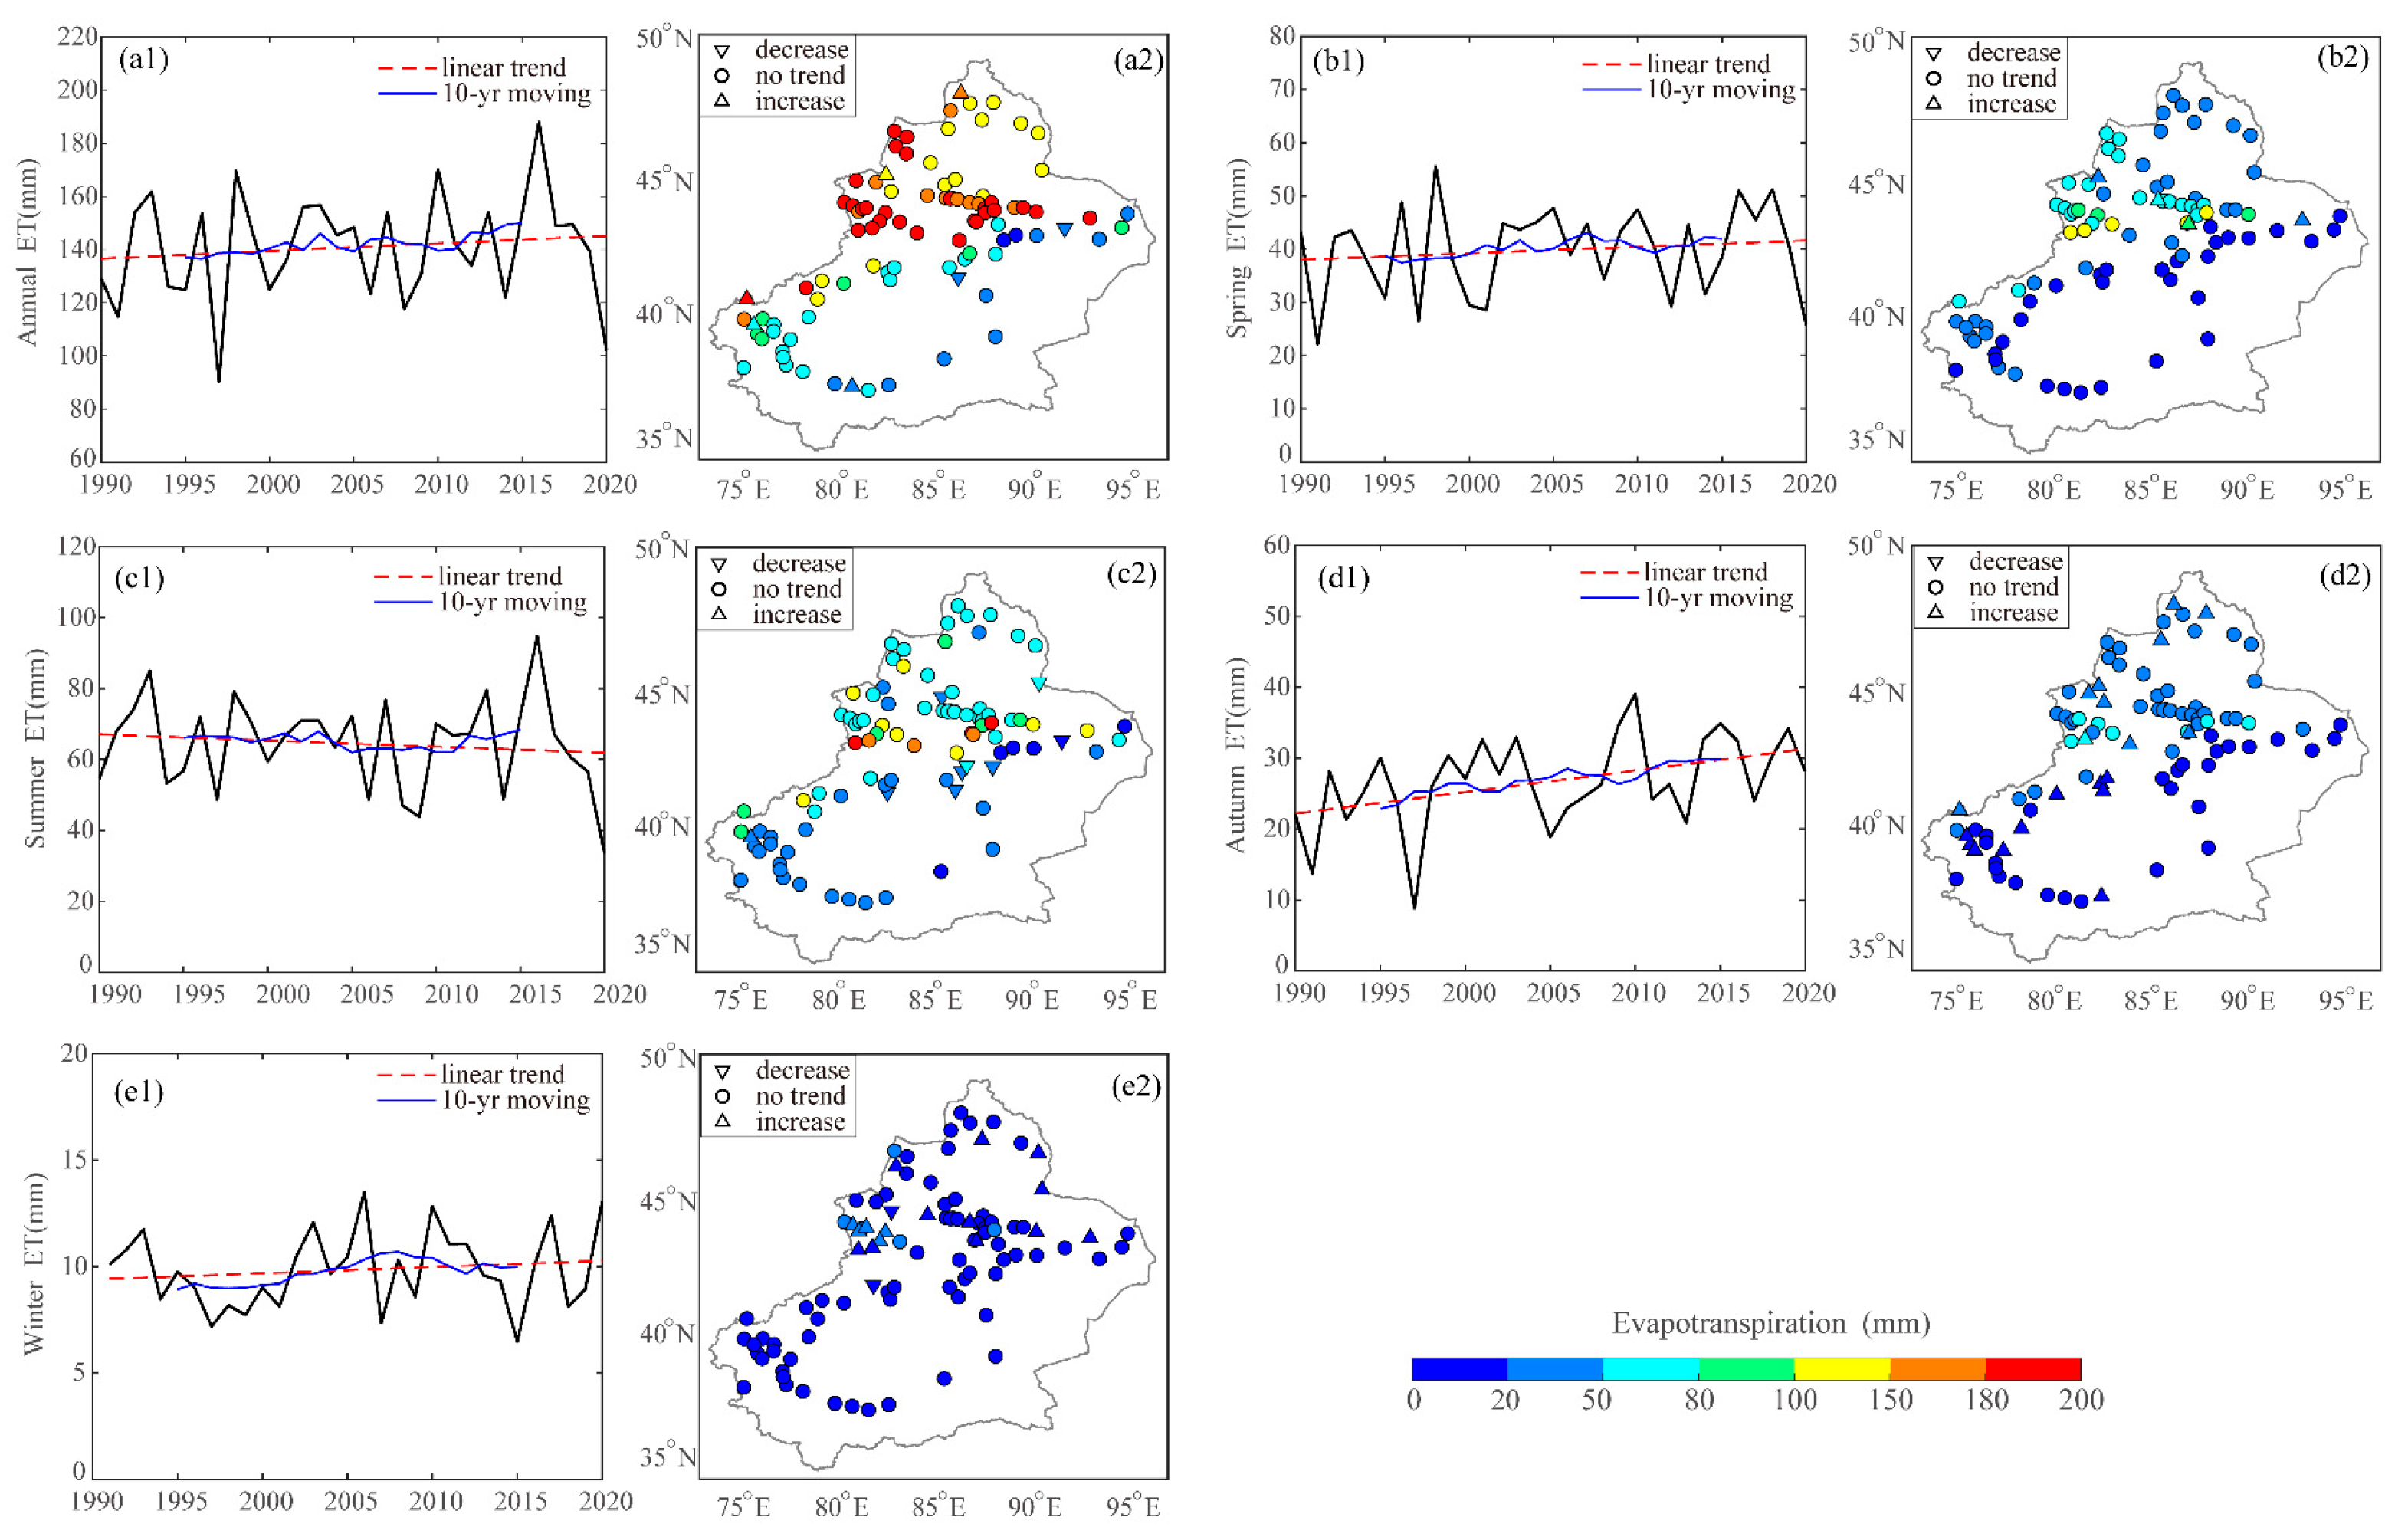
It is worth noting that the PET in Xinjiang underwent a clear transition at all scales in the 1990s, as illustrated in Figure 2. During this period, global warming had already significantly impacted evapotranspiration in Xinjiang. Meanwhile, limited by data availability for evapotranspiration calculations before the 1980s, the discussion of variability in evapotranspiration and the subsequent assessment of ET products in this study focus on the period 1990–2020. The evapotranspiration estimation methods described by Equations (2) and (3) in Section 2.3 were applied to the records from 93 meteorological stations to produce the spatiotemporal maps of ET based on the Budyko framework, as shown in Figure 3. As the figure shows, the average annual evapotranspiration in Xinjiang from 1990 to 2020 was approximately 140.90 mm, showing a slight increase but no significant trend noted. The result revealed a slight rise in evapotranspiration during spring, autumn, and winter. Meanwhile, the increase was notable in autumn with a rate of 0.26 mm a−1, surpassing the statistical test’s 95% confidence level. Conversely, a decrease in evapotranspiration was observed during the summer months (−0.2 mm a−1). The spatial distribution of evapotranspiration in the Xinjiang region was characterized by the north having more and the south having less, with the largest value in the Tianshan mountainous region and the lowest in the eastern Xinjiang region and the southern Tarim Basin. Compared to PET, there is no noticeable spatial feature in the evapotranspiration trend in Xinjiang, and most regions do not exhibit a significant trend, with the average growth rate of evapotranspiration exceeding 4 mm a−1. Only 10% of the sites increased significantly, and 5% decreased significantly.
The spatial distribution of trends at seasonal scales varied, though the majority of regions still showed no significant trend. At different seasonal scales, there was a wider distribution of substantial increases in the fall and winter, 13% and 12%, respectively. The stations with significant decreases in fall were located in the western part of the Tarim Basin, Western Tianshan, and the northern part of Northern Xinjiang. In contrast, during winter, they were more concentrated in the area north of the Tian Shan. Summer exhibited decreasing trends relative to other seasons, primarily concentrated along the central Tianshan region. Notably, there have been no stations that have shown a significant decreasing trend in spring and autumn.

3.2. The Inter-Comparison of ET Products Simulation

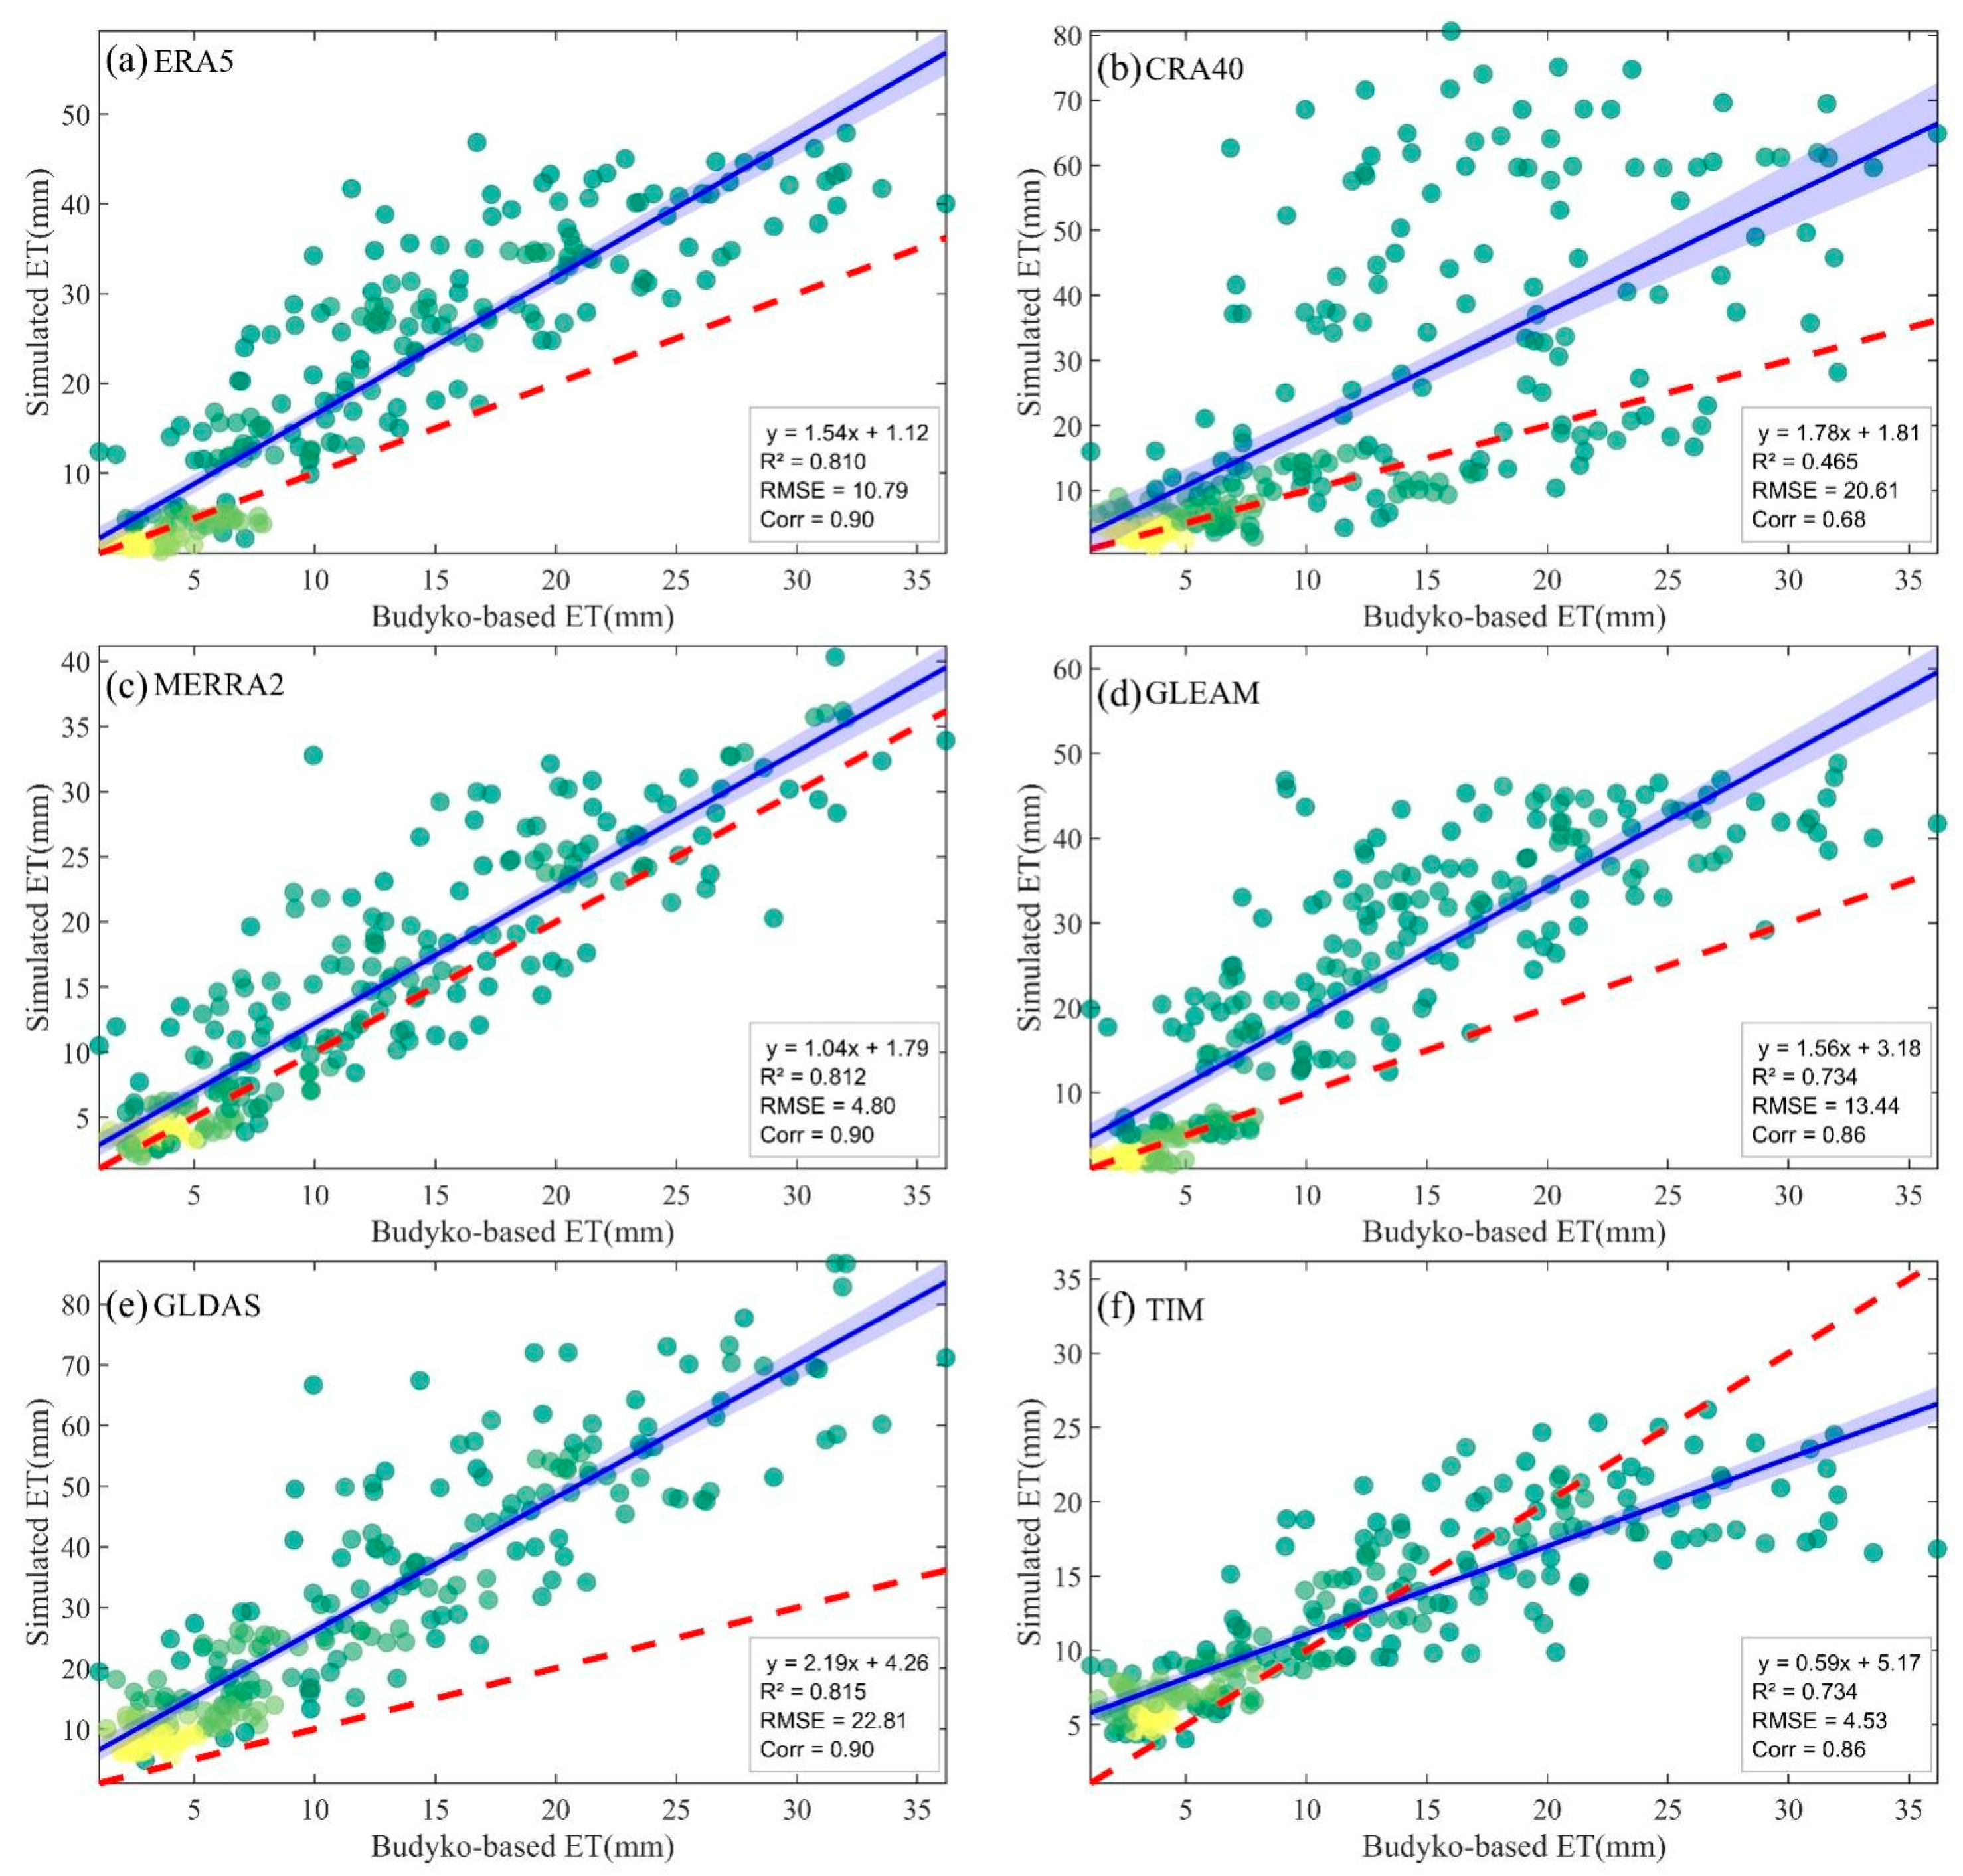
To assess the applicability of the six ET products across Xinjiang, we conducted comparative analysis of their simulation performance using Budyko-based ET0 as a theoretical reference. The reference ET0 was calculated using meteorological data from 93 observation stations and regionally aggregated by arithmetic averaging. The analysis period was consistently selected from 2001 to 2020 for all products. The scatter plot in Figure 4 presents the fitting results of monthly ET in Xinjiang by different ET datasets. The key statistical metrics are summarized in Table 2. Insights drawn from the Figure reveal that all datasets overestimate ET to varying degrees compared to ET0. Except for TIM, all datasets’ overestimation magnitude increases with increased ET values. TIM overestimates at low magnitudes but underestimates at magnitudes above 13 mm. The correlation between the ET0 and ET datasets was high, except for CRA40, with the correlation coefficient values all greater than 0.85 and R2 greater than 0.73. The MERRA2, ERA5, and GLDAS datasets exhibit the closest concordance with the ET0, with a correlation coefficient ≥0.9, while CRA40 was less than 0.7. When considering the RMSE, the MEERA2 and TIM datasets exhibited lower values of 4.8 mm and 4.53 mm, respectively, followed by the ERA5 and GLEAM. In comparison, CRA40 and GLDAS exhibited a higher RMSE of more than 20 mm. Generally, MERRA2 demonstrated the strongest overall agreement. The ERA5 and GLDAS showed a tendency for considerable systematic overestimation compared with ET0, as indicated by their notably higher RMSE values. The CRA40 dataset had the weakest performance, which makes it unsuitable for representing the evapotranspiration in this region.

3.3. Comparative Analysis of Temporal Variability and Trends

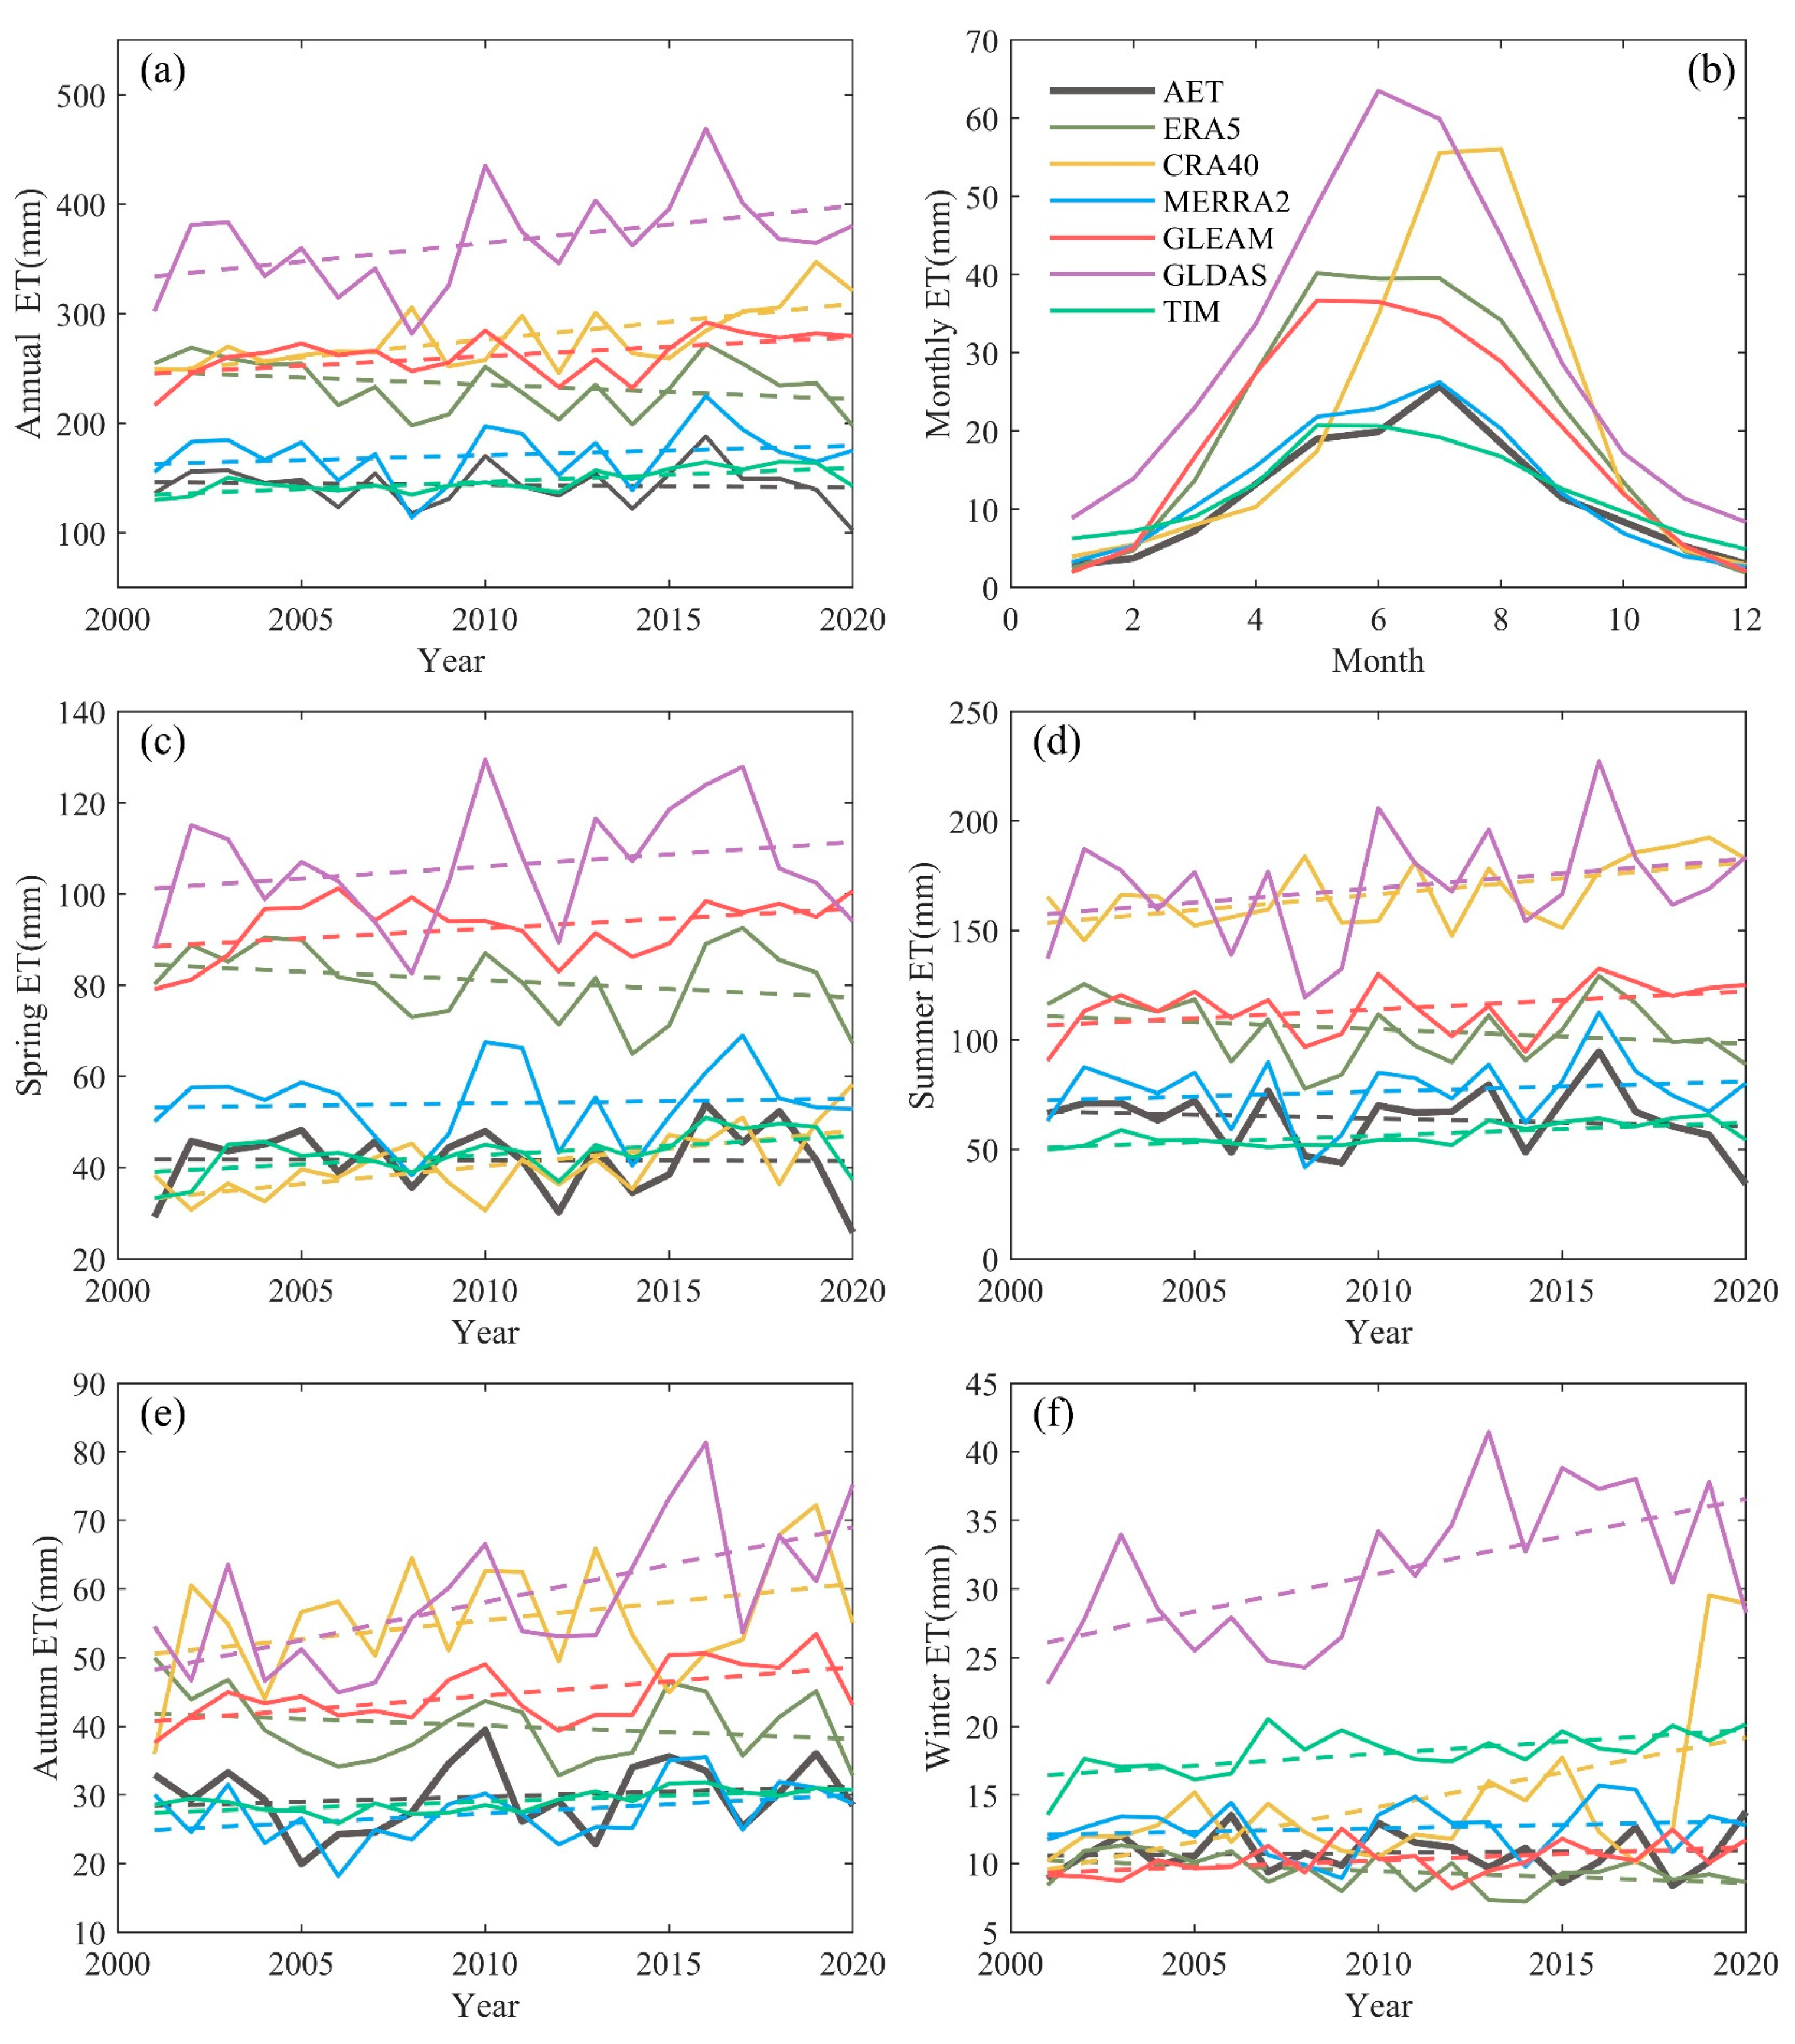
To investigate the ability of multiple datasets to express evapotranspiration from Xinjiang on time scales, we checked the variability and linear trend of different datasets. Figure 5 elucidates the temporal dynamics of ET throughout the time scales. And for a comprehensive quantitative comparison, the corresponding statistical metrics (e.g., trend, standard deviation, and coefficient of variation) for the annual and seasonal time series are provided in Table S2 of the Supplementary Materials. From a regional perspective, the annual ET of Xinjiang varies obviously among the products, ranging from approximately 143.61 mm a−1 to 366.33 mm a−1, yet they exhibit a similar inter-annual fluctuation (Figure 5a). The comparison shows that TIM and MERRA2 most closely approximate with the reference ET0, with the difference between the average value of the current product and that of ET0 less than 20%. In contrast, the GLDAS shows the largest overestimation, the mean of annual ET exceeding ET0 by 155%. The ERA5 showed a slight decreasing trend, consistent with ET0. In contrast, all other datasets exhibited increasing trends during the 2001–2020 period. Furthermore, the increasing trends observed in CRA40, GLEAM, and TIM were statistically significant (p < 0.05) with the trend slope from 1.29mm a−1 to 3.26mm a−1.
At the seasonal scale (Figure 5c–f), the analogous characteristics exhibited with the annual pattern. The TIM and MERRA2 are the closest to ET0 and the GLDAS, consistently exhibiting the highest overestimation. However, the performance of each product varies seasonally, with alternating degrees of underestimation and overestimation. The degree of standard deviation is highest in summer for the GLDAS, and lowest in winter for the ERA5 and GLEAM. The GLDAS overestimates ET across all seasons, with the deviation exceeding 100% and reaching over 200% in winter. CRA40 shows high consistency with ET0 in spring but significant positive departures in summer and autumn. The ERA5 is unique in displaying a decreasing trend opposite to other products across all seasons.
All products successfully capture the consistent intra-annual pattern of evapotranspiration, which peaks uniformly during the summer months, as shown in Figure 5b. In summer, all products except TIM overestimate ET compared to the ET0, with the most pronounced overestimation observed in the GLDAS with deviations from 104% to 277%. Conversely, TIM underestimates ET in July and August, which contrasts with its performance in other months. In winter times especially November and December, four of six products (ERA5, MERRA2, CRA40, and GLEAM) underestimate ET.

3.4. Performance Comparison of ET Products at the Meteorological Station Scale

To quantify the simulation performance of the six ET products, we calculated a station-by-station correlation coefficient, bias coefficient, SMAPE, and CRMSE (against ET0) on annual, seasonal, and monthly scales. The spatial distribution of correlation coefficients is presented in Figure 6. Significance in the figure denotes correlations passing the two-tailed test at the 0.05 level after Benjamini–Hochberg adjustment. The spatial distribution of the correlation coefficient exhibits pronounced spatial heterogeneity and seasonal variation. Overall, western regions exhibit stronger correlations than eastern regions, while southern regions show slightly stronger correlations than northern regions. The Tarim Basin, particularly its western region, keeps a relatively high correlation coefficient at inter-annual and seasonal scales. The stations passing the correlation significance test are more concentrated here. Compared with other products, the ERA5, MERRA2, and GLDAS are closer to the reference ET0 at different time scales. Especially in the western Tarim Basin, their correlation coefficients are generally higher than 0.8. The GLEAM product exhibits certain advantages in the southern part of the Tarim Basin, particularly during summer and autumn. CRA40 and TIM generally show lower correlations with ET0 and exhibit greater variability. In winter, all ET products deviate significantly from the reference values, with negative correlation coefficients observed across all datasets, particularly in the northern regions.
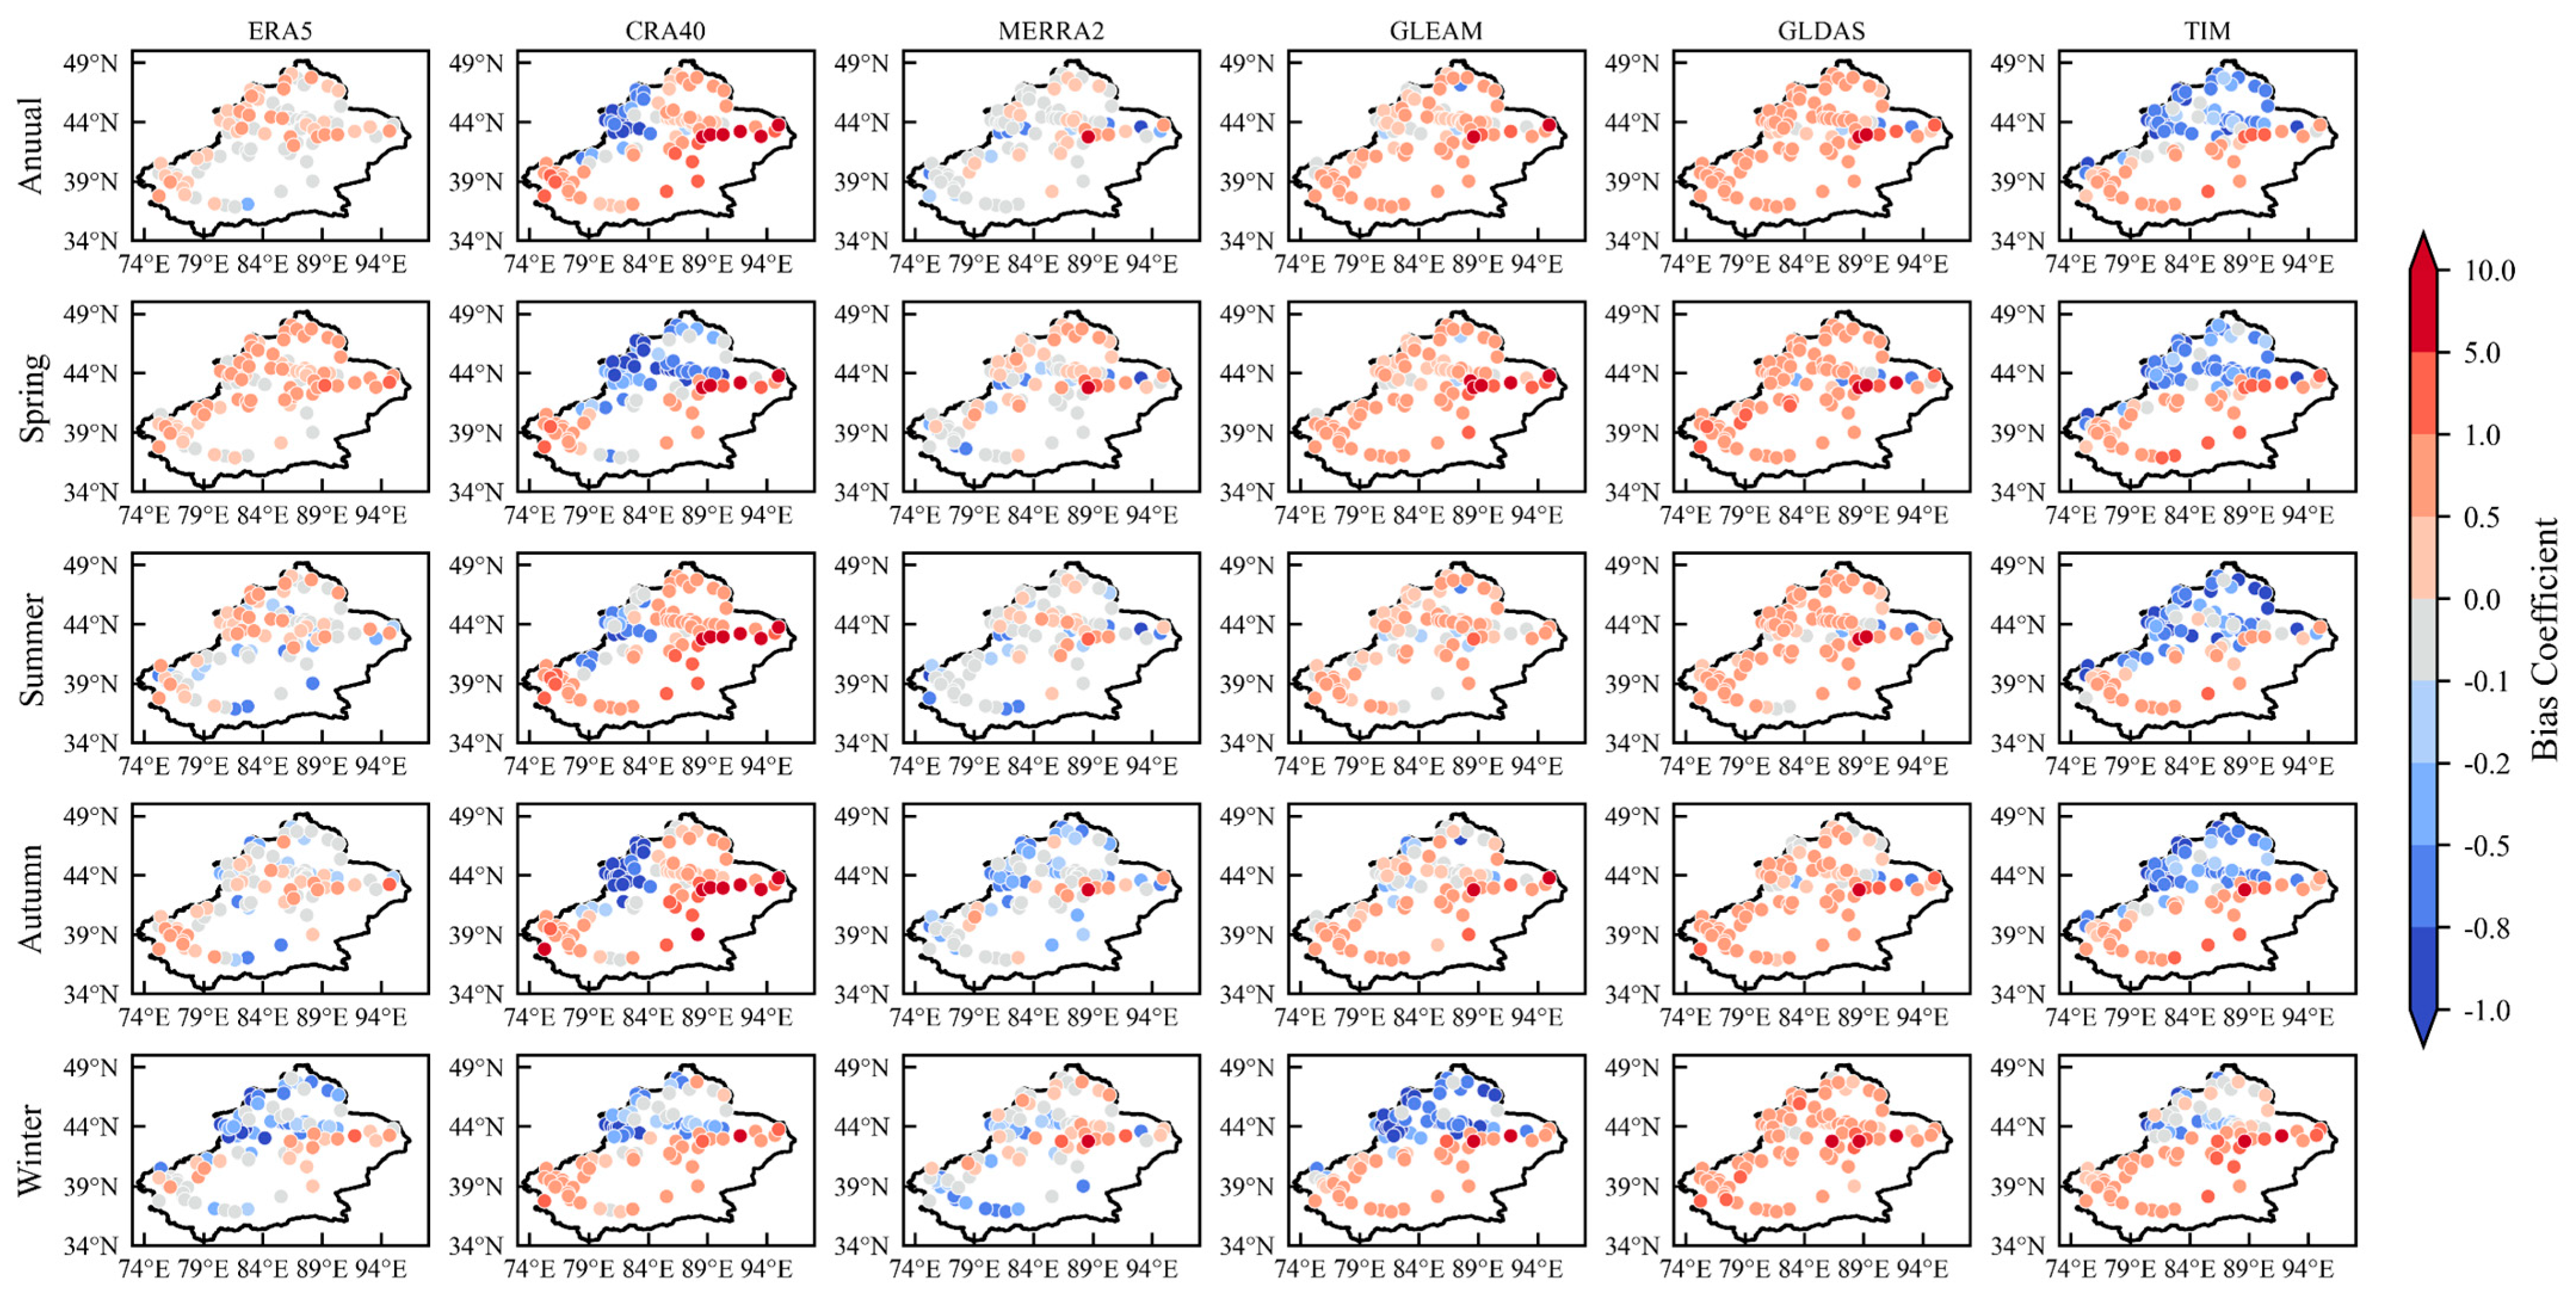
Different ET products exhibit predominantly positive bias in ET performance across Xinjiang, most prominently in the Tulufan-Hami Basin in eastern Xinjiang, while negative bias occurs in northern Xinjiang (Figure 7). The TIM dataset shows north–south differences in bias at all-time scales (positive in the south, negative in the north). Similarly, the GLDAS shows positive bias relative to reference ET0 at all scales. CRA40 exhibits persistent negative bias in northwestern Xinjiang. It is worth noting that the negative bias observed in multiple models during winter may result from the physical models in the evaporation dataset underestimating snow-related processes. But at the same time, due to limitations in the theoretical framework, the reference Budyko-based ET0’s overestimation of snow surface evapotranspiration amplifies the negative bias.
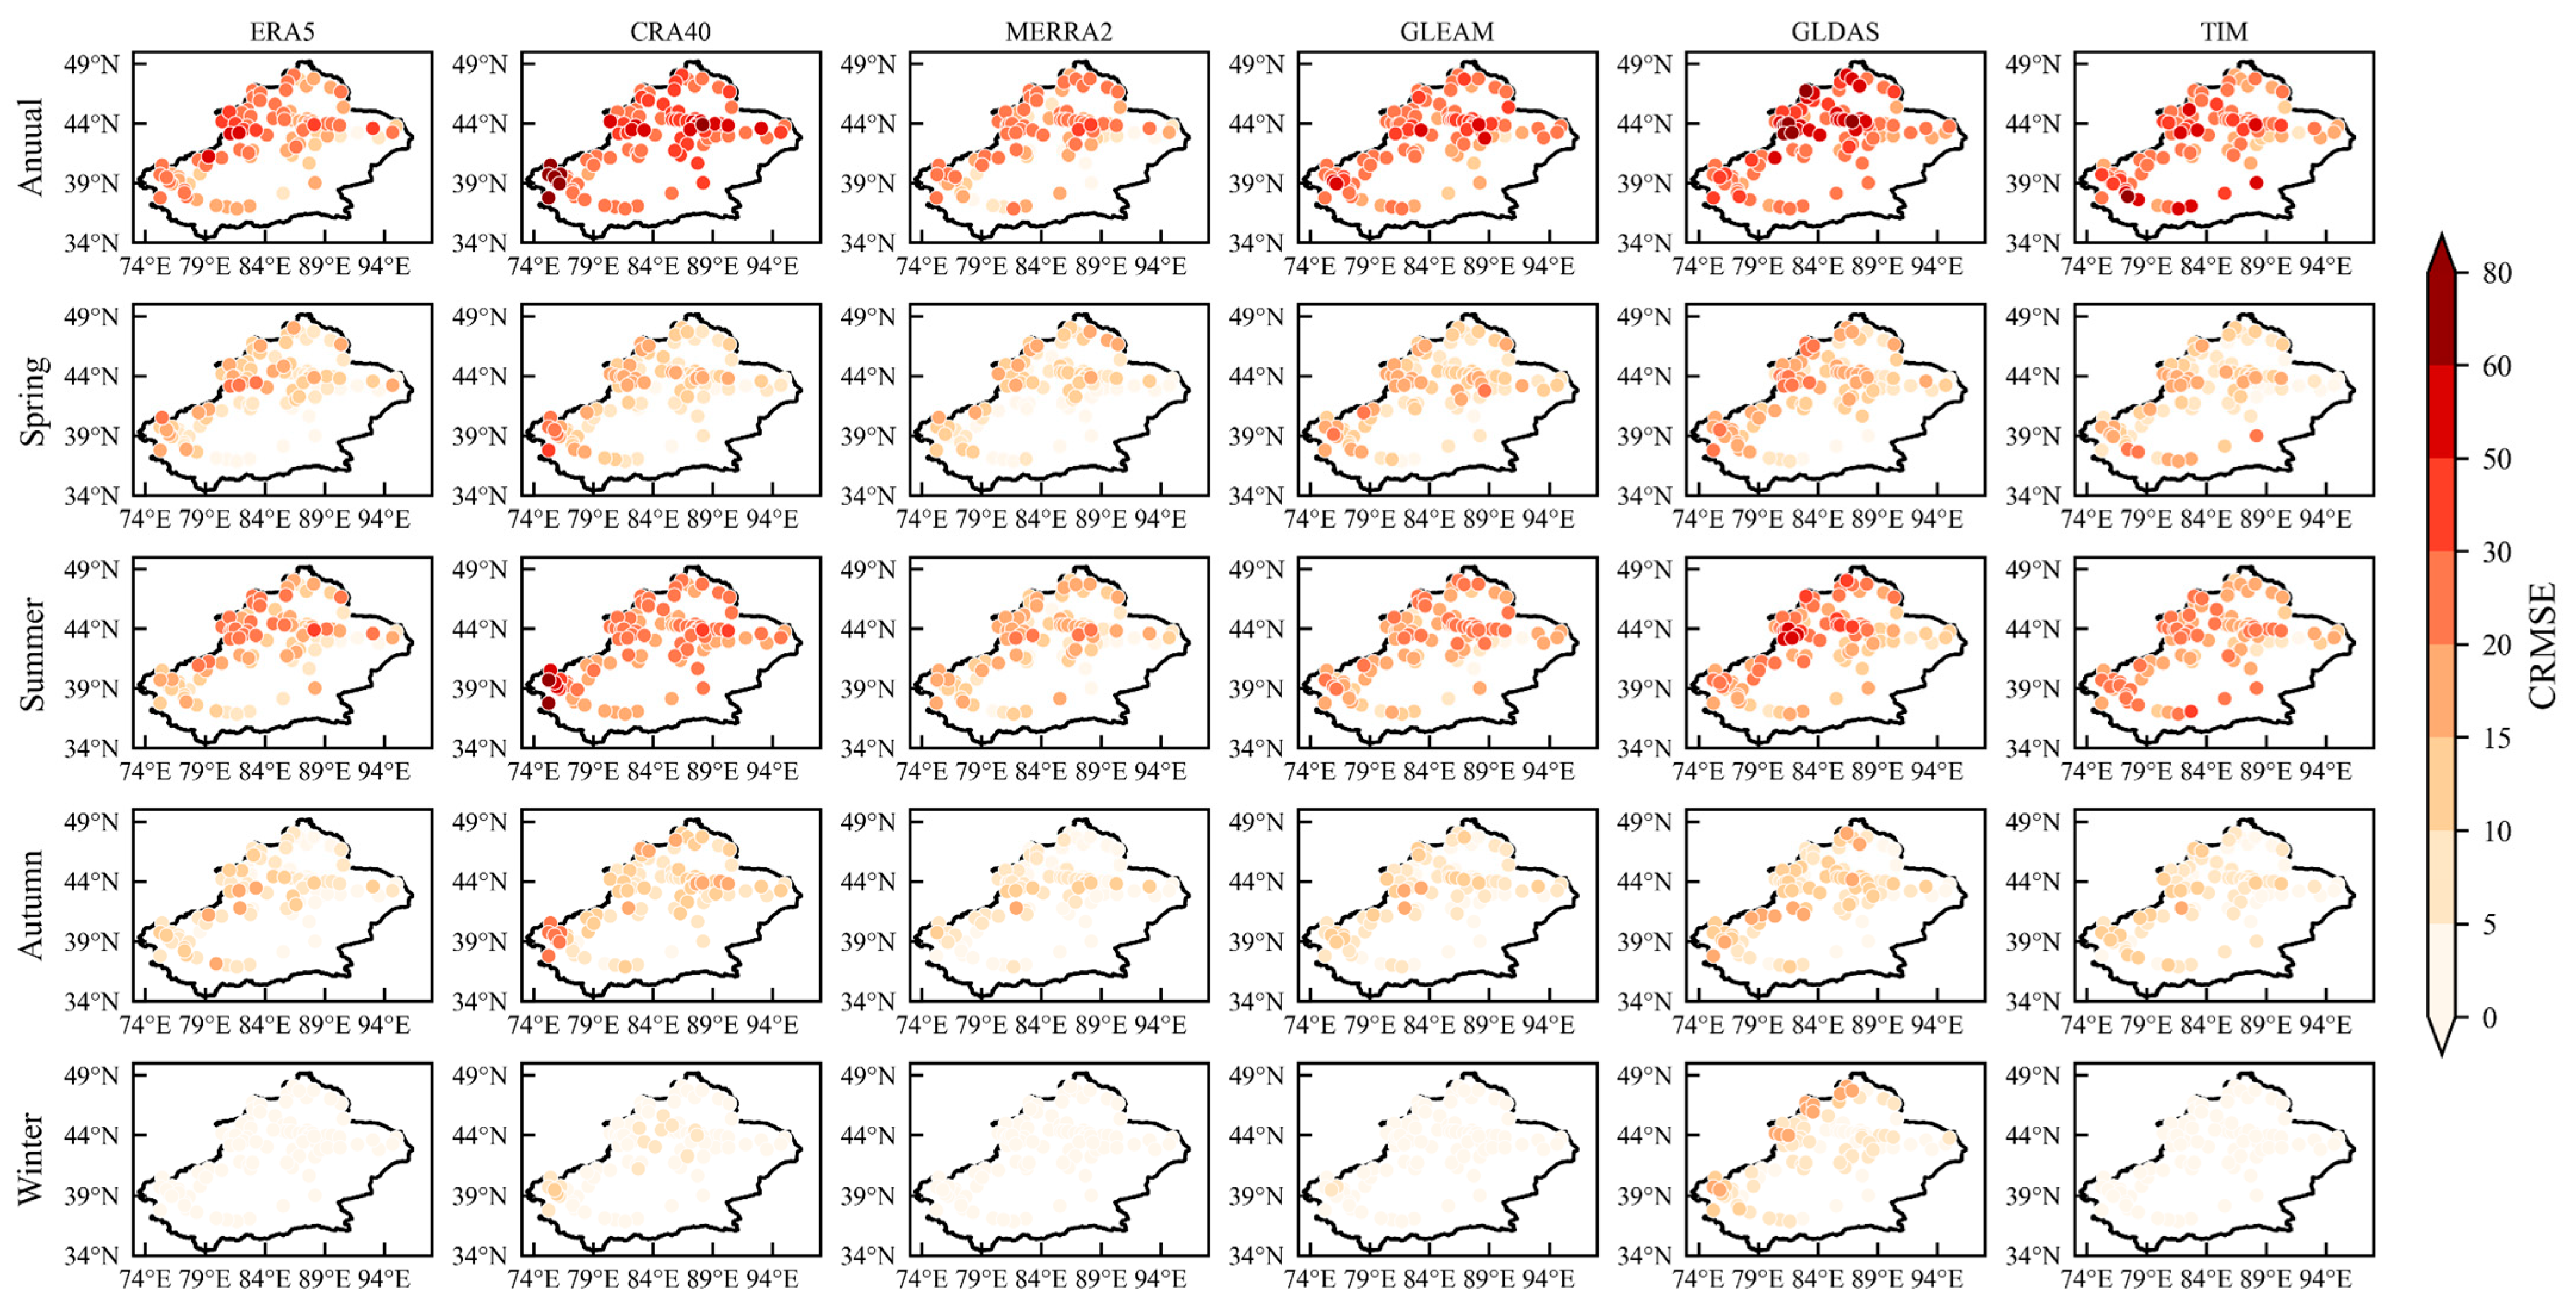
The accuracy of each dataset was checked by SMAPE (Figure 8) and CRMSE (Figure 9). Spatially, the SMAPE exhibits a distinct north–south contrast, with significantly lower values in the humid regions north of the Tianshan Mountains compared to the arid south. SMAPE values in the basin regions exceeded 100%, particularly surpassing 150% in the Turpan and Hami basins. Compared to the six ET products, MERRA2 exhibited the smallest error, outperforming other datasets. TIM demonstrates superior applicability for ET simulations in northern Xinjiang across all temporal scales. At the seasonal scale, no apparent discrepancy was observed in the distribution of SMAPE.
In contrast, CRMSE distribution is strongly influenced by topography, with mountainous areas showing higher values and greater seasonal variability (Figure 9). Winter errors are generally lower across all datasets, while summer CRMSE values are pronounced elevated, particularly in the Tianshan Mountains and western southern Xinjiang. Combining the characteristics of CRMSE and SMAPE, the errors of ET products in Xinjiang exhibit significant spatial heterogeneity. The SMAPE is higher in basin regions and lower in mountainous areas, while the CRMSE shows an inverse pattern Basin regions are characterized by higher errors, whereas mountainous areas display greater random variability.
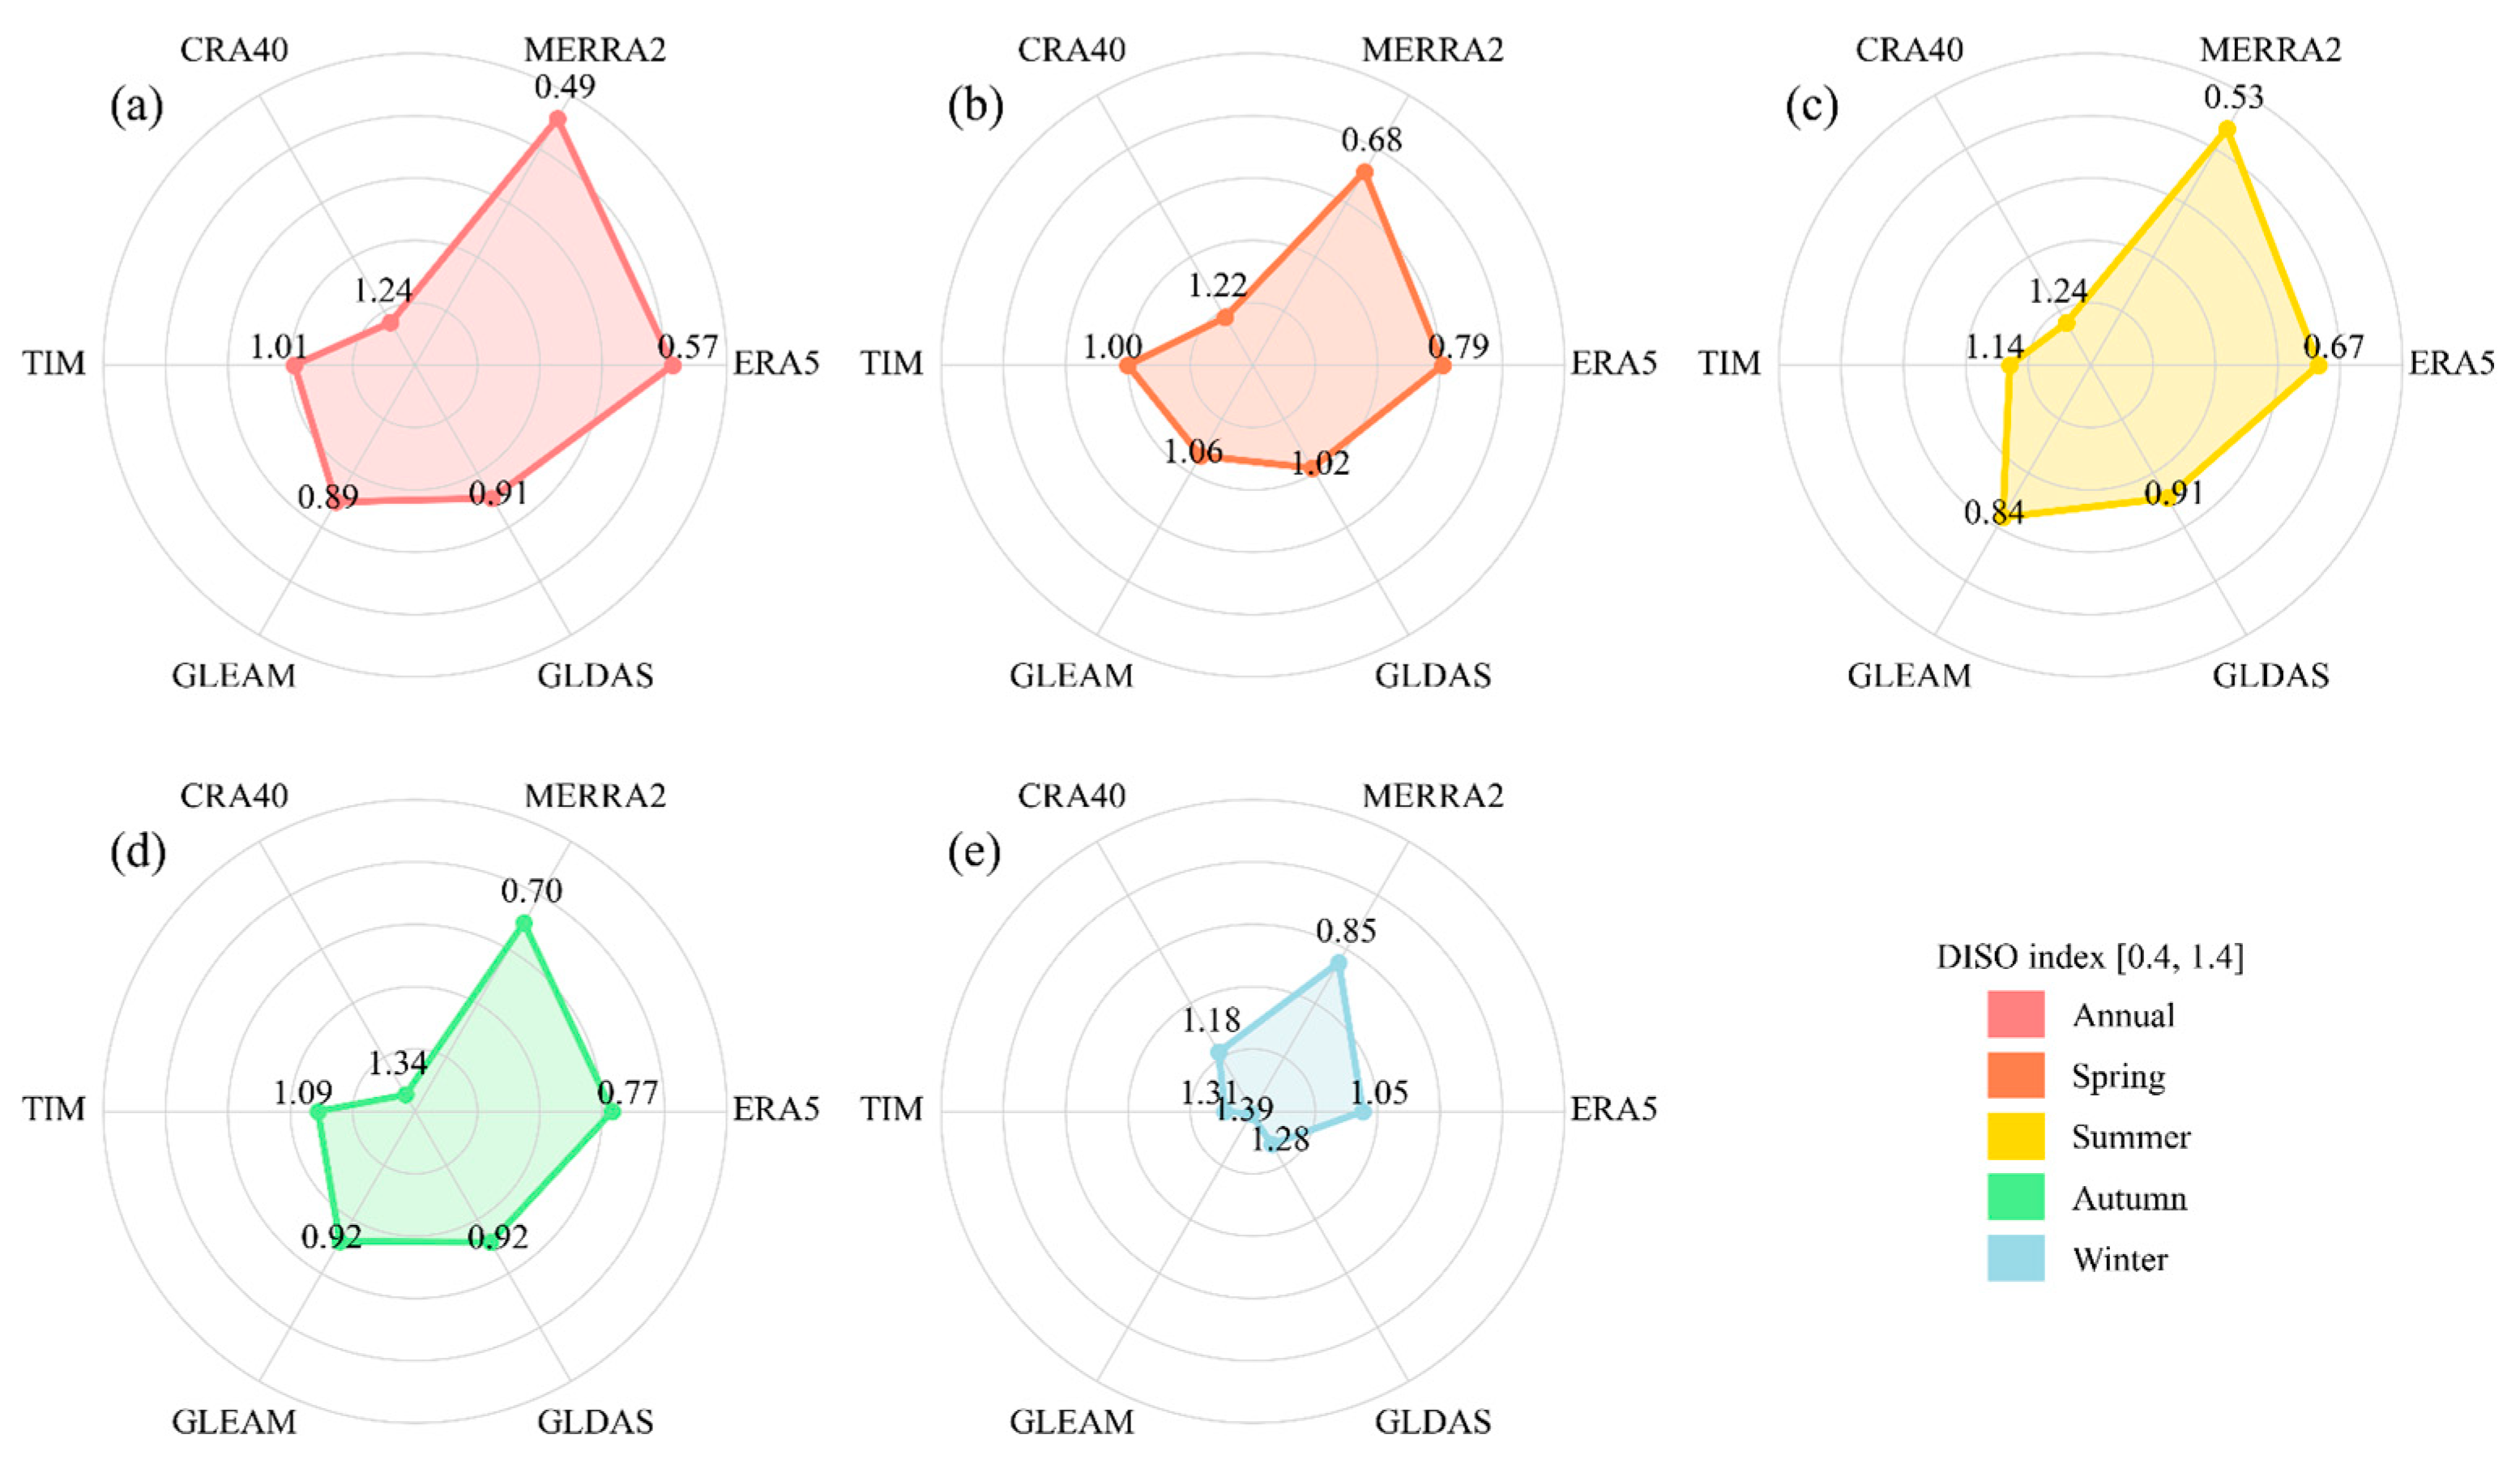
We utilized the DISO index to compare the performance capabilities of six multi-source evaporation datasets visually. Note that a smaller DISO value indicates superior dataset performance. The radar chart coordinates in Figure 10 have been inverted for easier understanding, with values decreasing from the outer to the inner regions. As shown in Figure 10, the reanalysis-based datasets emerge as the top-performing models. MERRA2 demonstrates the best performance across all timescales. The ERA5 exhibits balanced error performance, while it has a notable positive bias in the Tarim Basin, necessitating calibration. CRA40 exhibits the poorest ability to characterize evapotranspiration in Xinjiang, except during winter. The persistent negative bias of CRA40 and the high error in the western part of southern Xinjiang limit its applicability. On seasonal scales, all datasets perform better in summer and significantly worse in winter. Overall, the selection of ET products should be optimized based on regional and seasonal characteristics, integrating bias correction and multi-source validation to address localized discrepancies and seasonal variability.

3.5. Performance Comparison of ET Products at Different Land Cover Types

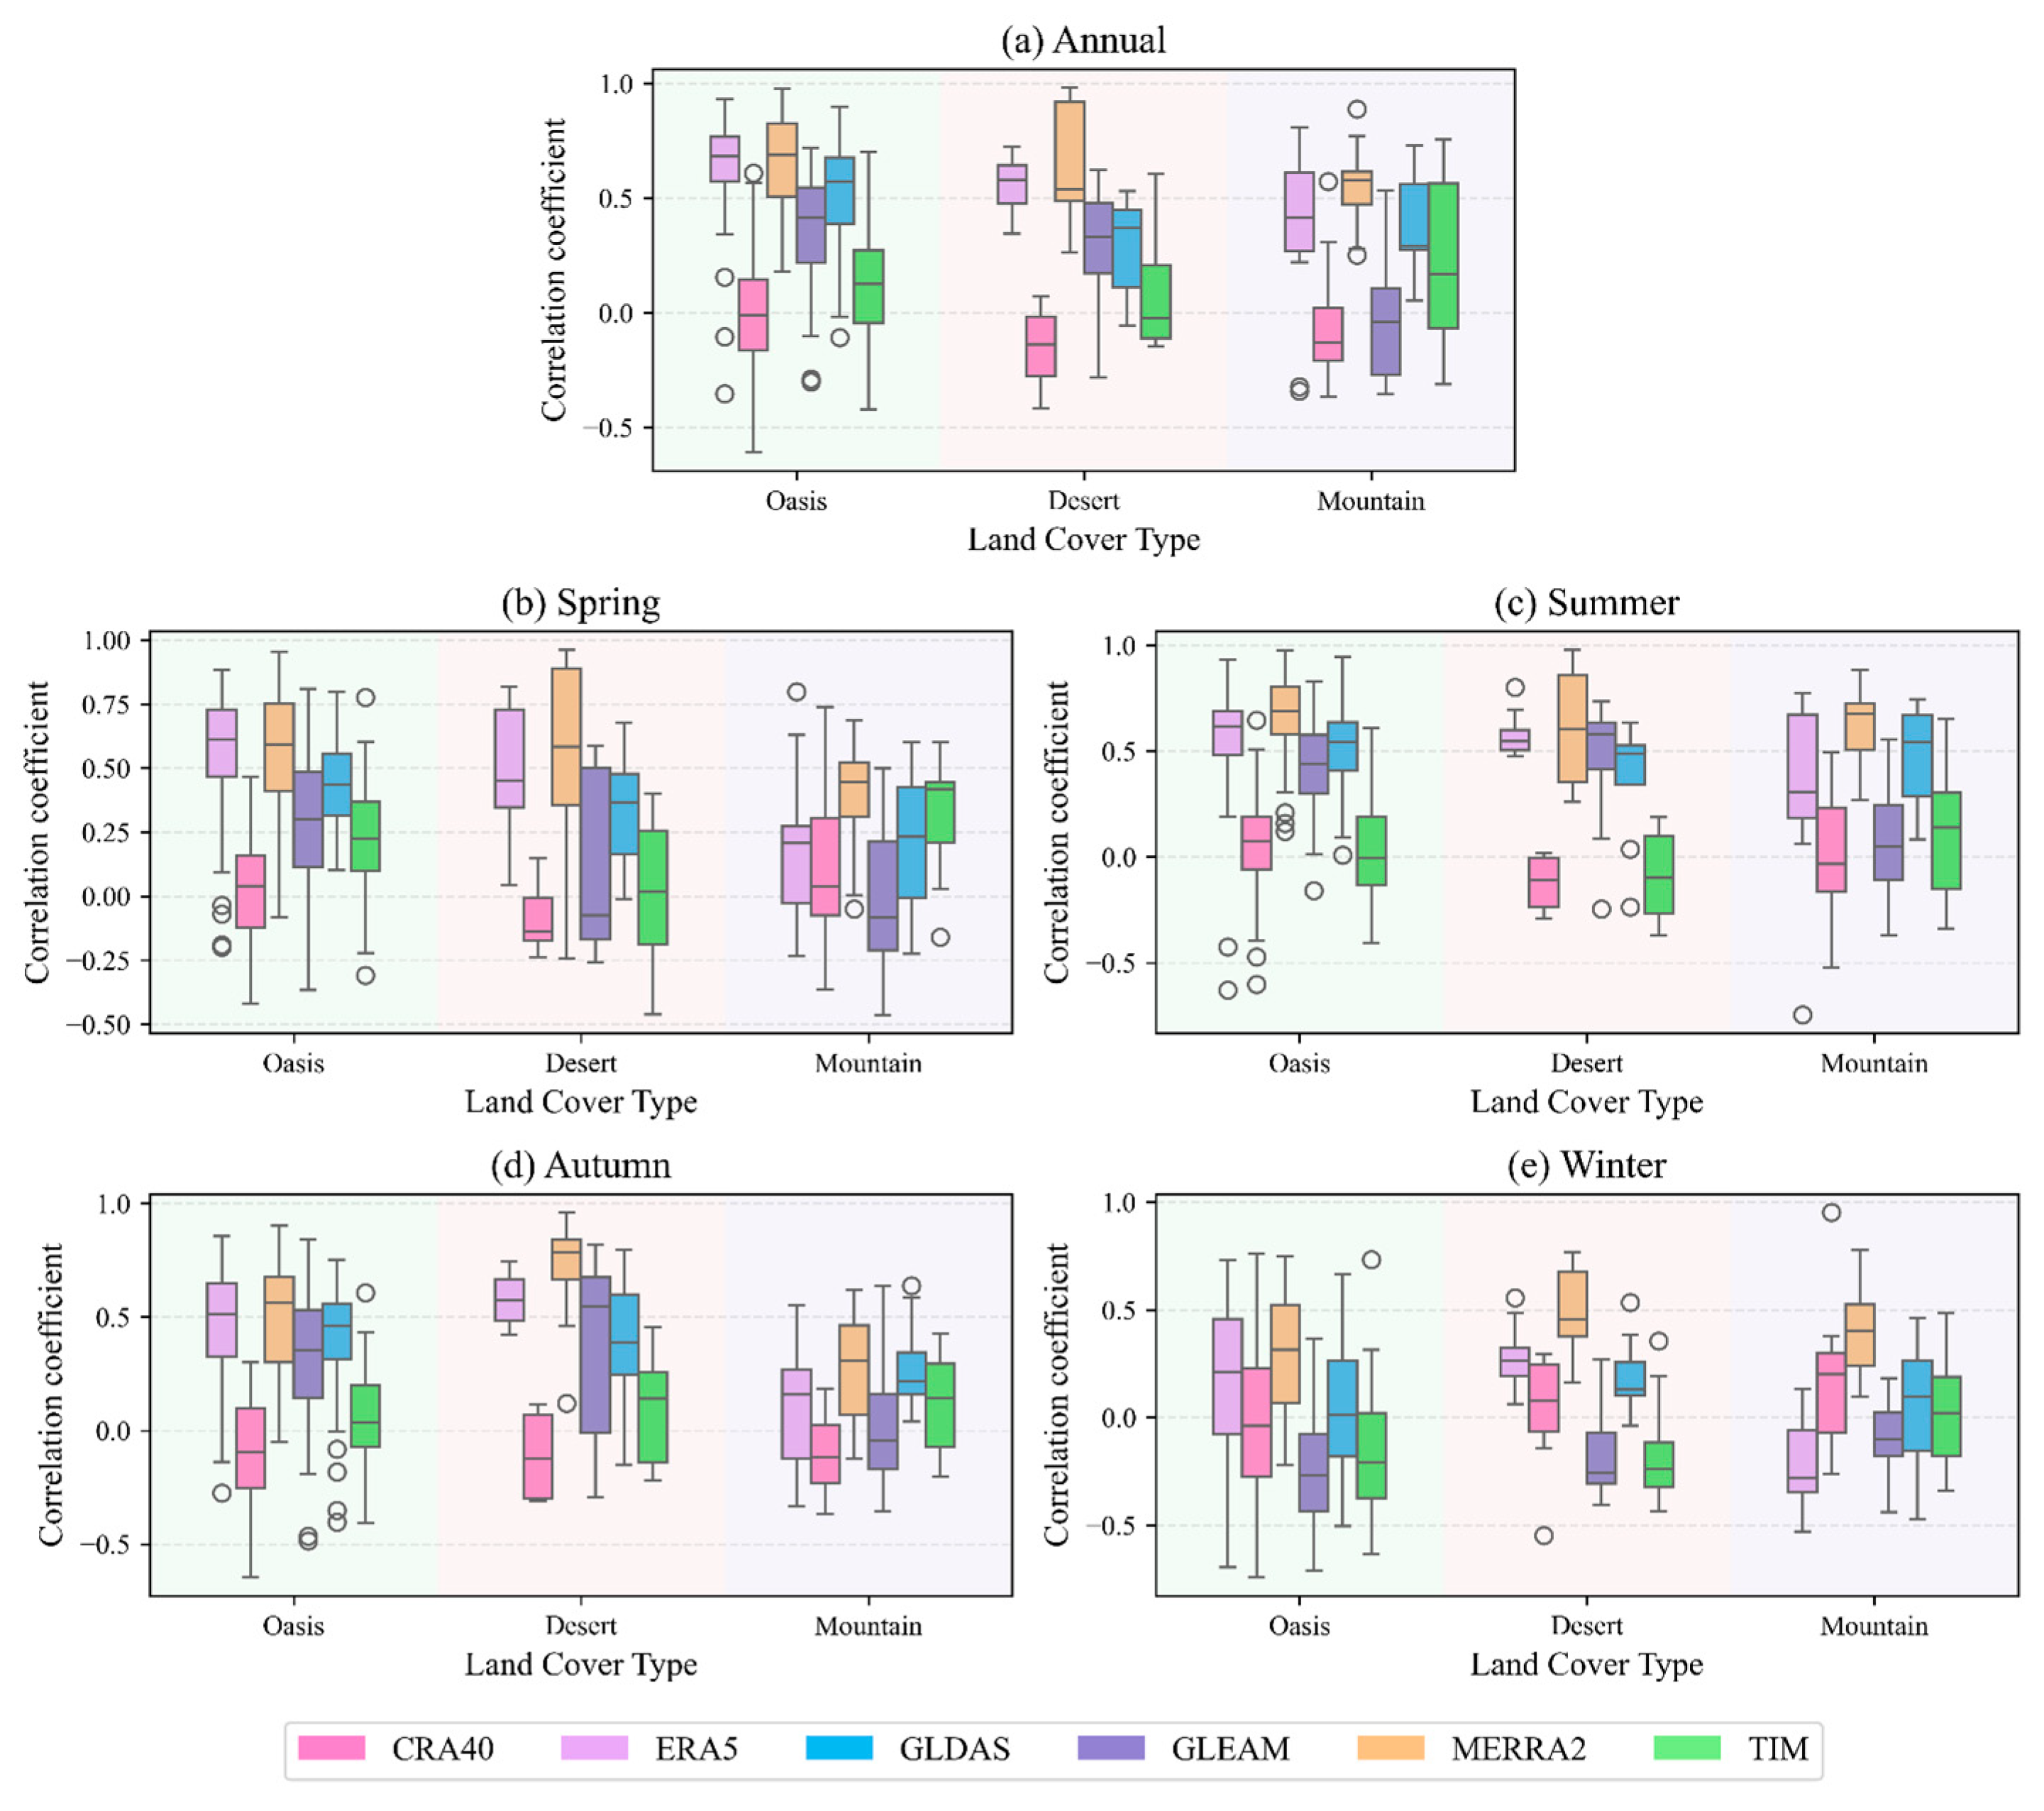
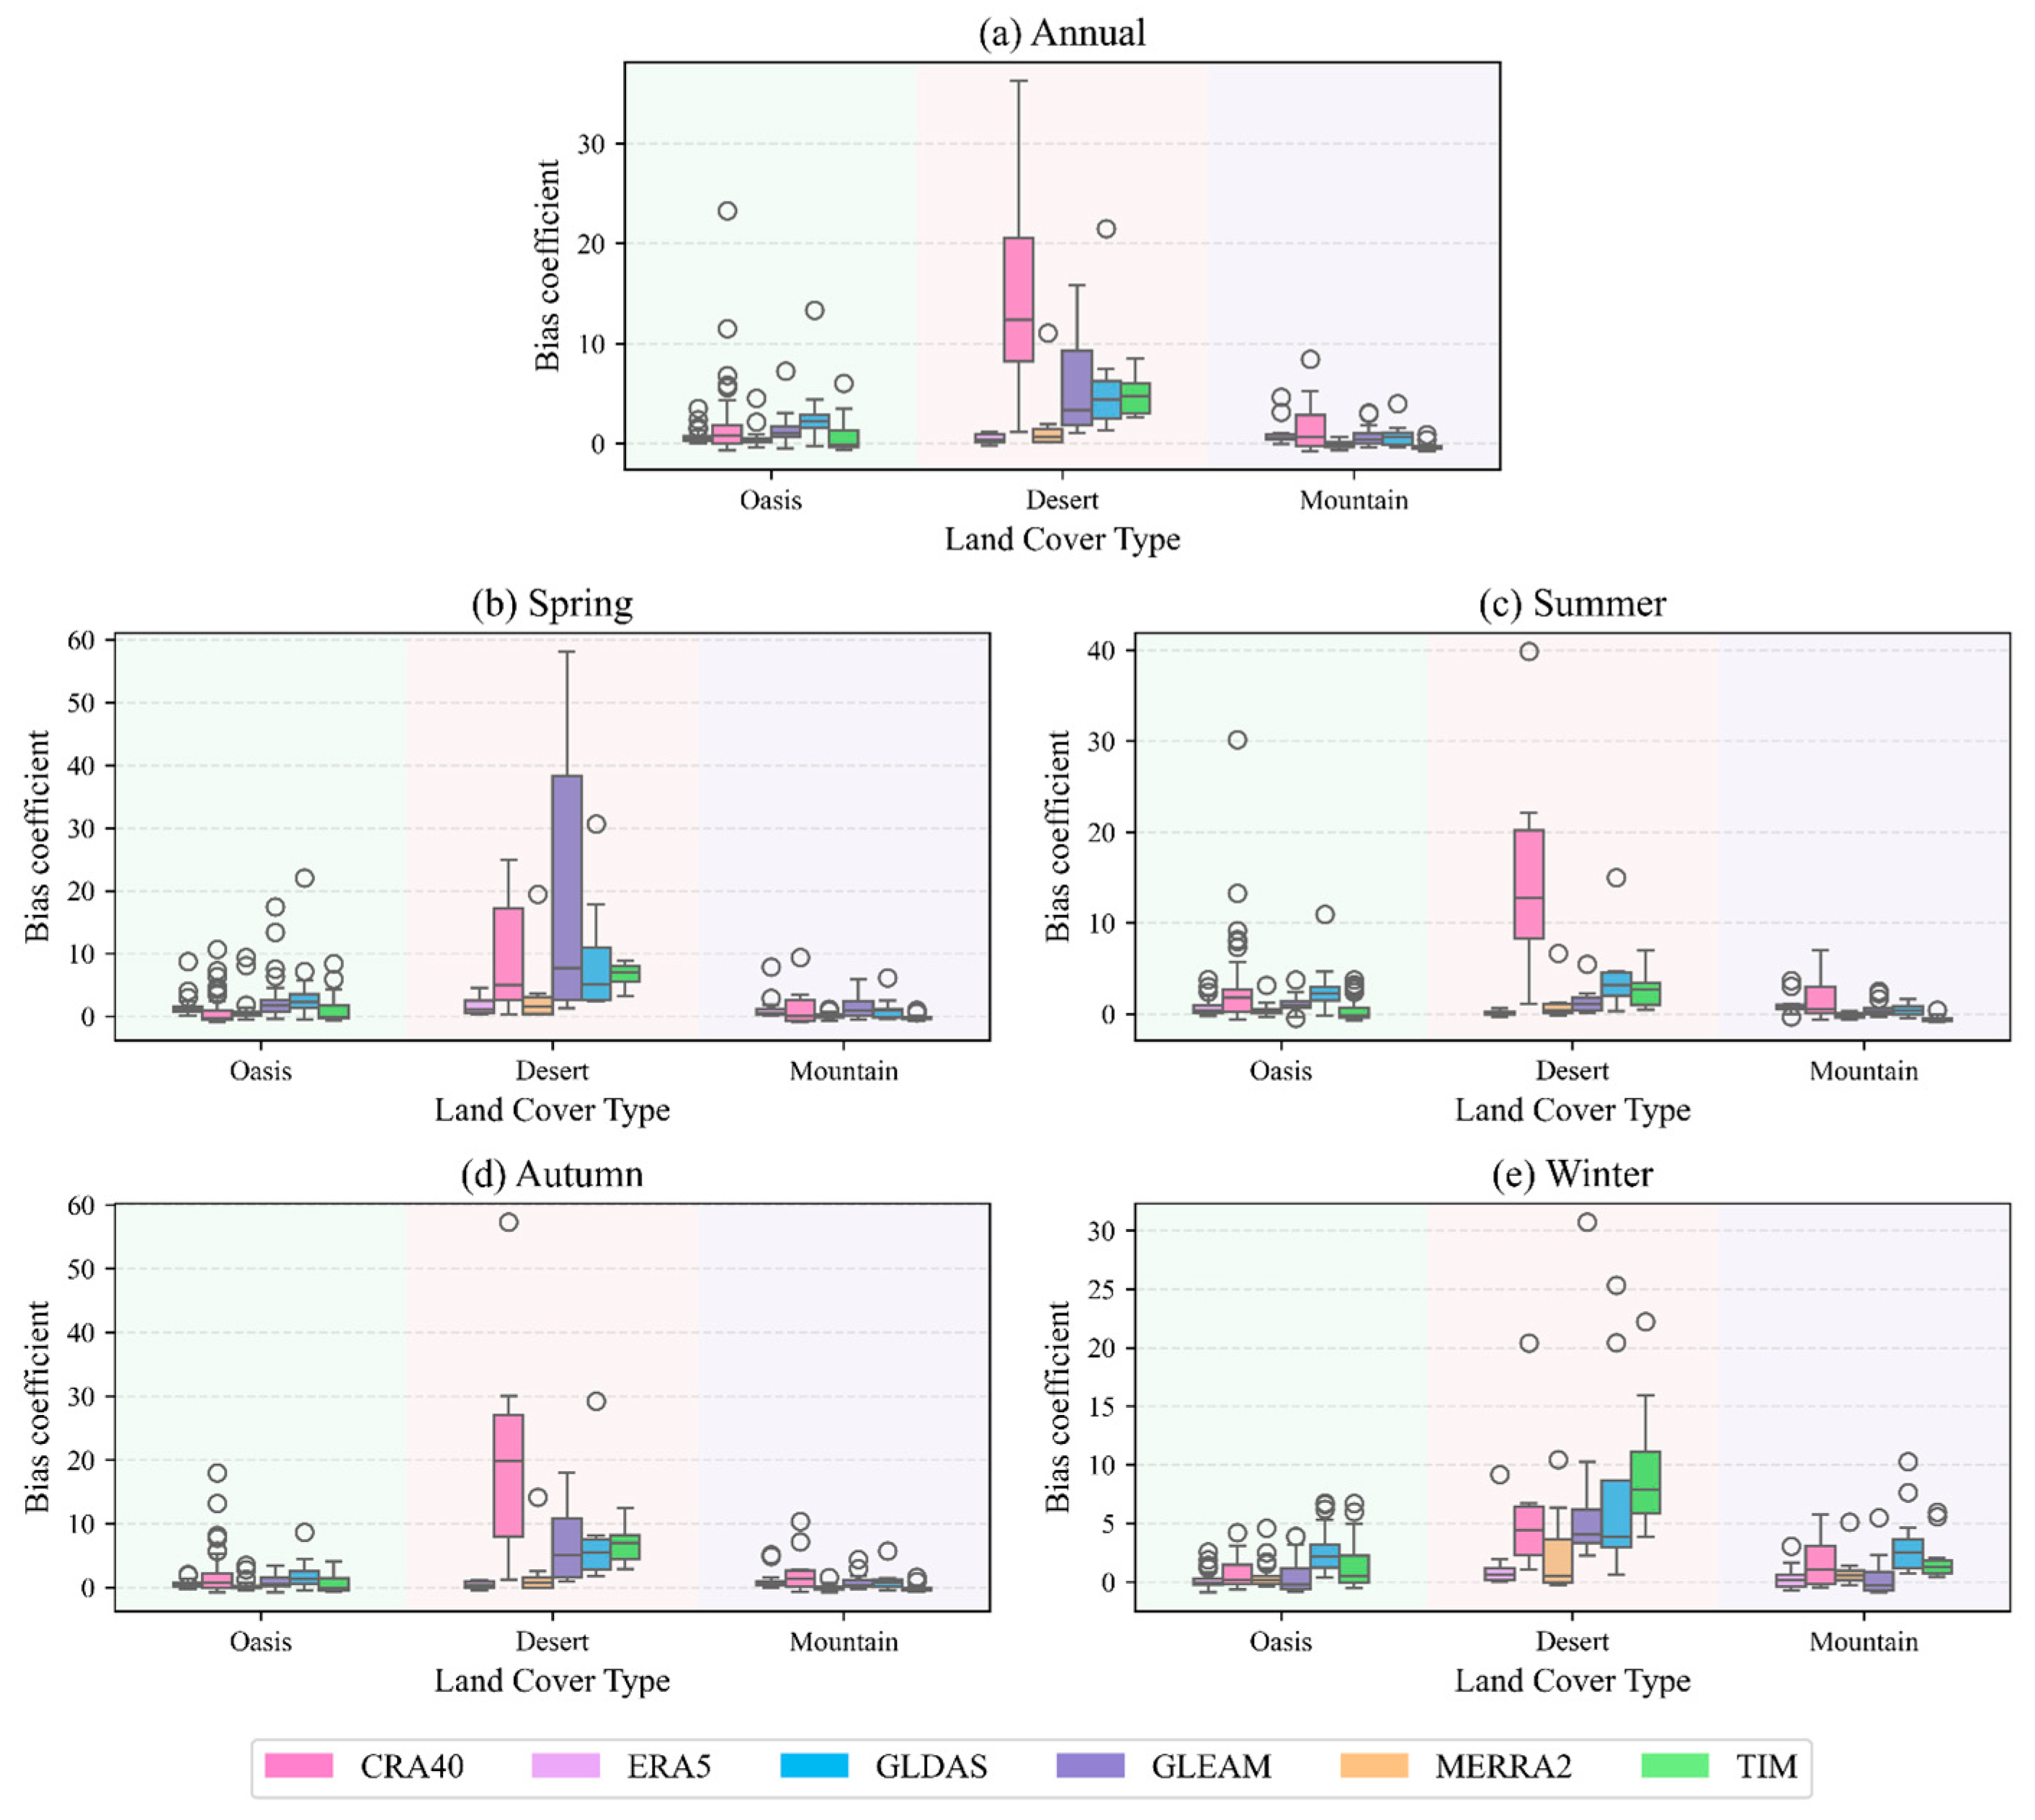
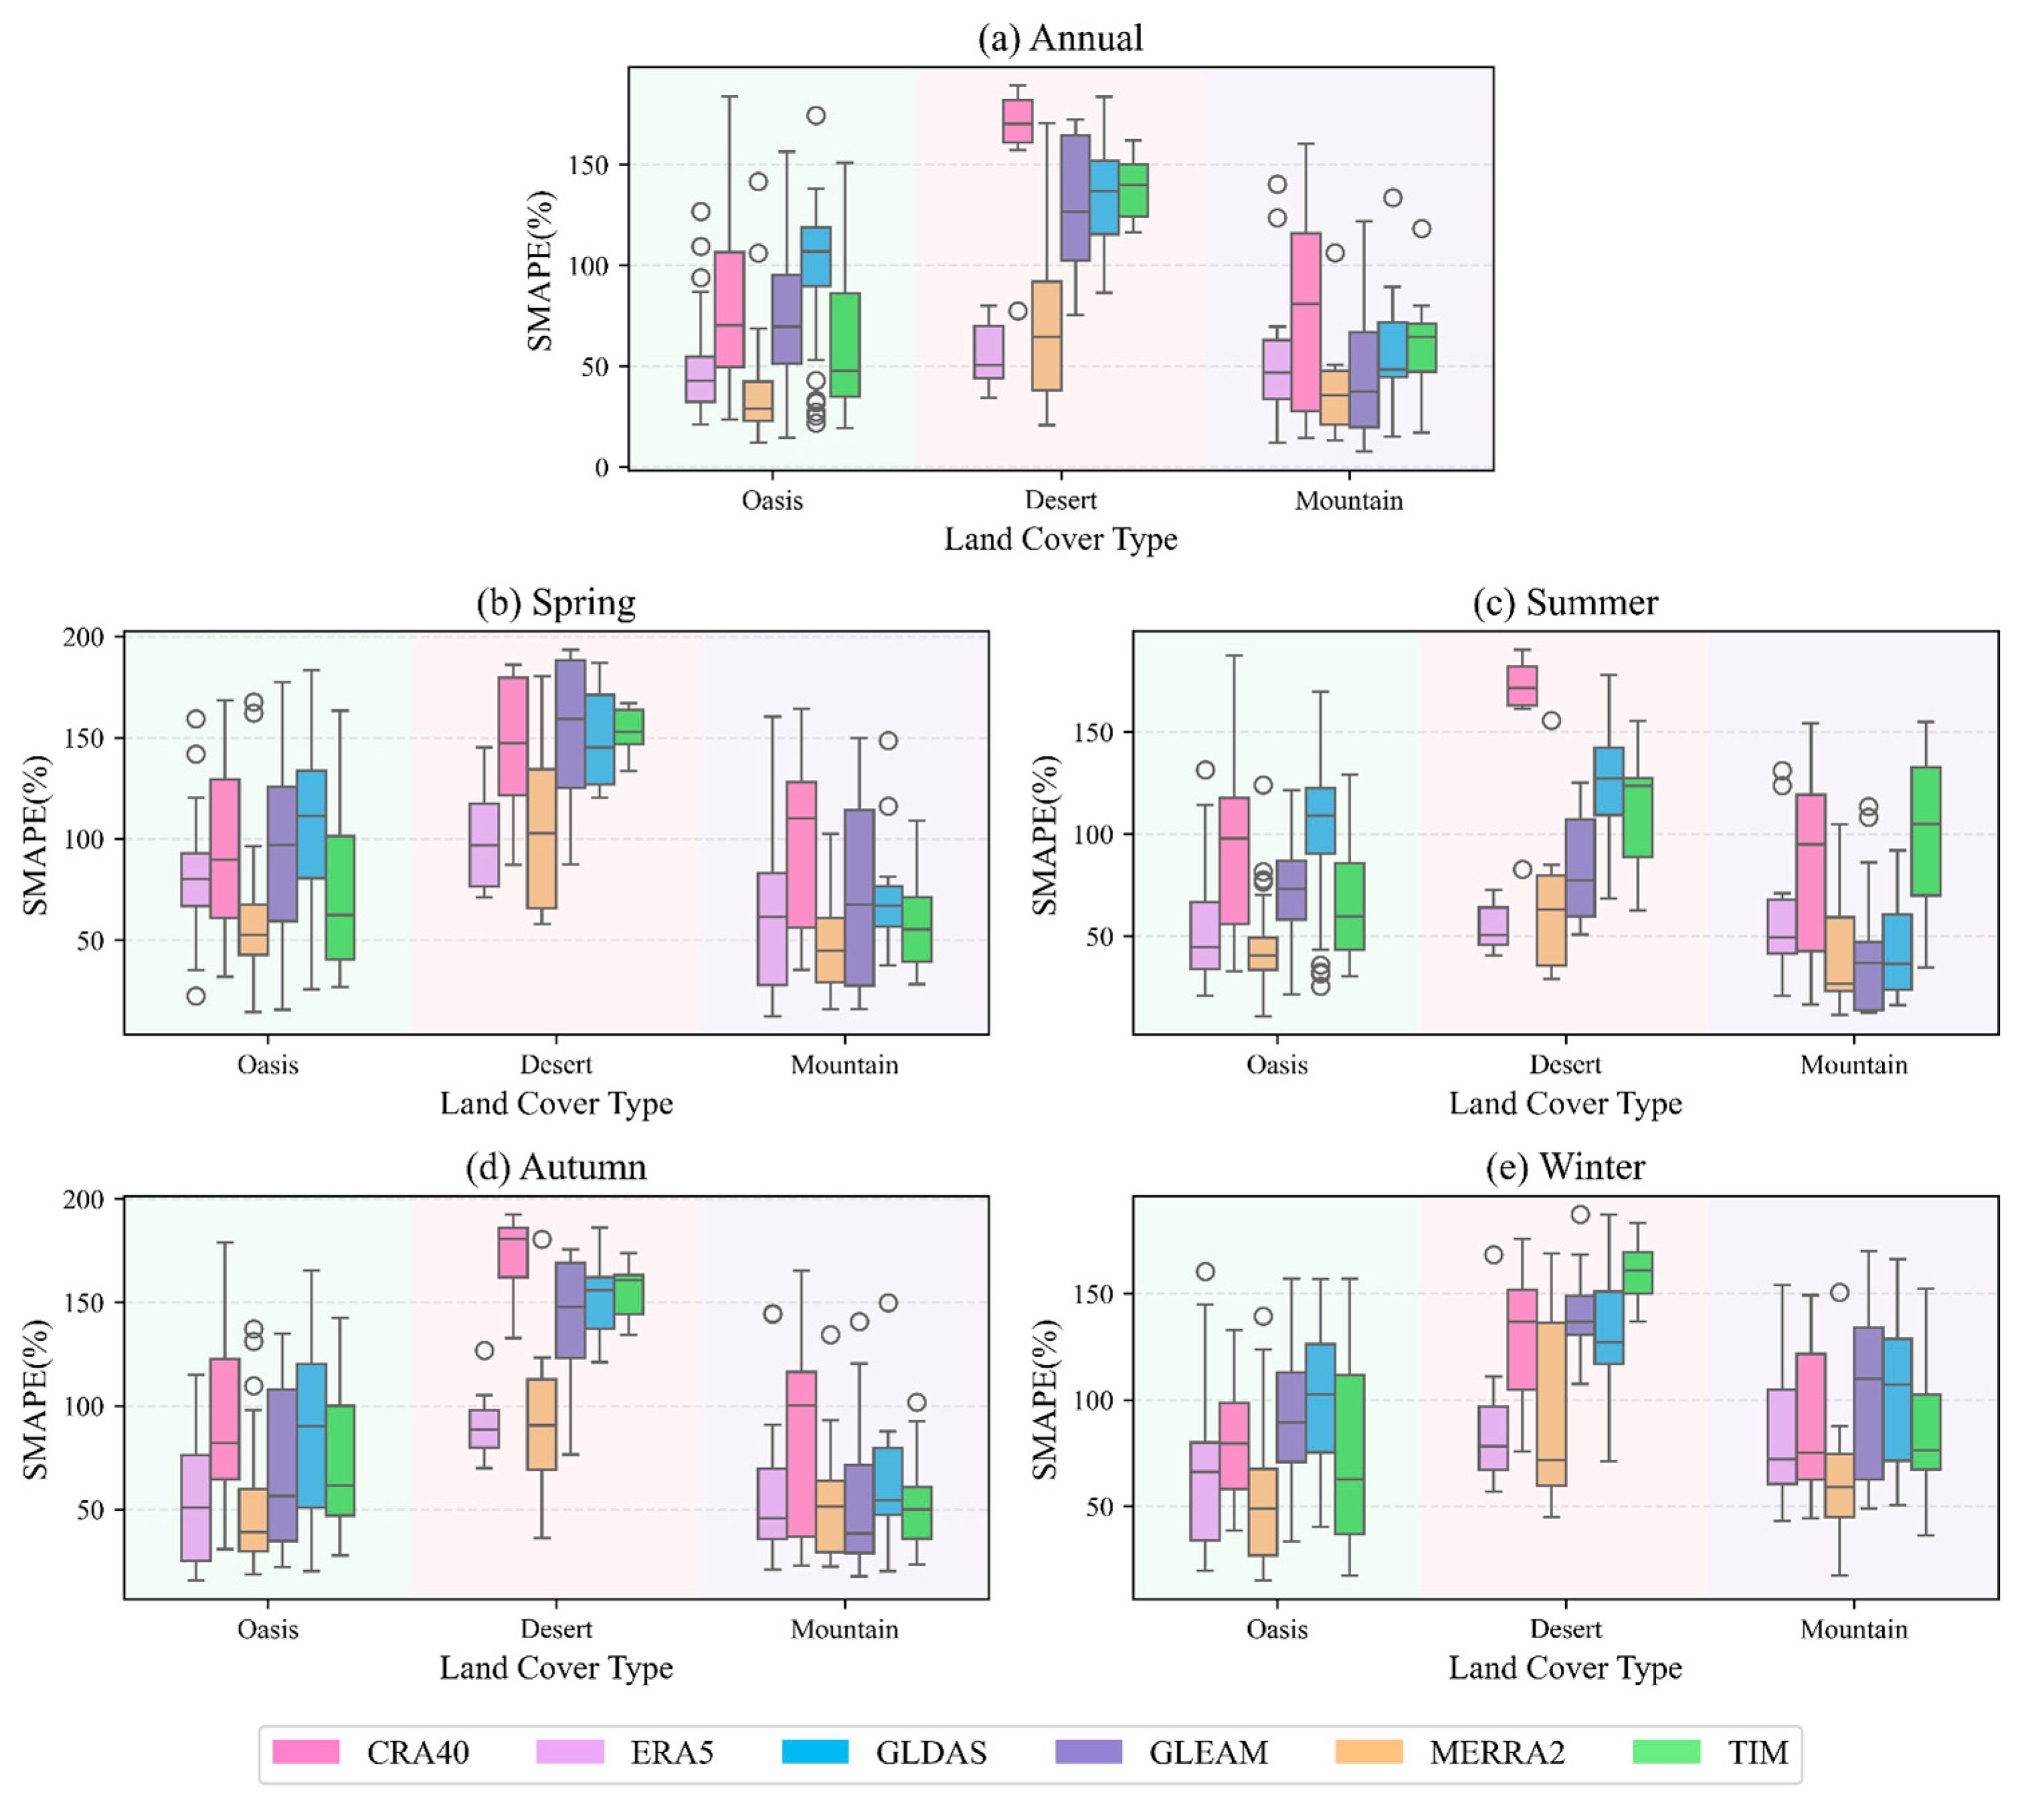
To clarify the impact of land use types on the performance of multi-source ET products in Xinjiang, we categorized the 93 stations into three groups based on their land cover types: oases, deserts, and mountainous areas. Figure 11, Figure 12, Figure 13 and Figure 14 display the distributions of correlation coefficient, bias ratio, SMAPE, and CRMSE for each land-cover type. Results are shown separately for annual, spring, summer, autumn, and winter periods. It can be observed that the distribution of correlation coefficients is weakly affected by land use type, but bias and error (SMAPE and CRMSE) are closely related. Moreover, desert regions exhibit exceptionally large scatter among multiple sources of ET products in correlation, bias, and error. The bias dispersion within the model is also greater than in mountain and oasis regions. Across most indicators and seasons, the datasets show the most consistent and stable performance in oasis regions, though they exhibit significant variability and outliers. The mountainous areas exhibit high CRMSE but low SMAPE, consistent with previous results. SMAPE and bias coefficients are both high in desert regions. But that is because evaporation in desert areas is extremely low, so even small values lead to significant errors.

3.6. The Spatial Distribution and Trend of ET in Xinjiang by Representative Product

In this section, we utilize the MERRA2 product to depict the continuous spatial distribution and change trend of evapotranspiration in Xinjiang. Figure 15 displays the spatial distribution of annual and seasonal ET trends in Xinjiang from 1990 to 2020. Over the past 31 years, the annual mean ET spatial distribution in Xinjiang exhibits distinct spatial heterogeneity (Figure 15a). ET in northern Xinjiang is significantly higher than in the south, and the regions with high evaporation are mainly distributed in the Tianshan Mountains and the Altai Mountains in the north. The spatial distribution patterns of evaporation in all four seasons are consistent with the annual scale, which agrees with previous studies’ findings [40]. The annual average ET in Xinjiang is approximately 169.90 mm, with most regions showing an increasing trend spatially. The regions north of the Tianshan Mountains and the central part of the Tarim Basin exhibit a significant upward trend. At the same time, ET in eastern Xinjiang shows a significant downward trend.

4. Discussion

This study conducted a comprehensive inter-comparison of six multi-source ET products (encompassing remote sensing-based, land surface model-based, and reanalysis-based products) over the Xinjiang region. Although some valuable results have been obtained, several issues are still worth discussing.
Some research findings suggest that the efficacy of products derived from remote sensing is superior to that of alternative products [17,19,41,42,43]. In contrast, the results in this paper show that the reanalysis-based products (MERRA2 and ERA5) demonstrate superior comprehensive performance in Xinjiang. This discrepancy primarily results from the fact that reanalysis products assimilate multi-source meteorological observations to produce consistent and continuous atmospheric parameter fields, which are particularly crucial for sparsely observed regions like Xinjiang. Furthermore, the physical models that couple soil–vegetation–atmosphere processes can simulate energy allocation more accurately, which improves the reliability of evaporation estimates [6]. Conversely, remote sensing-based ET products primarily depend on land surface temperature (LST) and the Normalized Difference Vegetation Index. In arid regions like Xinjiang, high surface temperatures coupled with atmospheric dust can lead to signal attenuation in the thermal infrared band, increasing errors in LST measurements [44]. This introduces significant errors into the final ET estimates.
Nevertheless, it is important to note that reanalysis-based and land surface model-based products tend to apparently overestimate evapotranspiration in Xinjiang, a finding consistent with previous studies [7,19,22]. The positive bias of ET datasets may stem from the model’s overestimating plant transpiration in the arid region [45], and their performance varies with aridity and vegetation greenness [46]. The oversimplified soil water stress parameterization of ET products is also a reason for the significant overestimation of evaporation in arid regions. The GLDAS-Noah land surface temperature overestimated the heat flux and soil moisture in the Taklamakan Desert [47].
All models exhibit consistent large deviations during winter, primarily due to the complex mechanisms of snow sublimation and frozen soil evaporation in northern Xinjiang. Reanalysis-based and land surface model-based products show significant inadequacies in parameterizing these processes, while remote sensing is insensitive to the surface beneath snow cover. Additionally, the Budyko theoretical framework fails to account for changes in snow storage, leading to overestimation of reference ET0 in winter and amplifying the negative bias.
The inter-product variations revealed in this study are a combination of their respective uncertainties. For these selected ET products in this paper, the primary sources of uncertainty are the following aspects. (1) The different meteorological forcing data they employ [48]. For precipitation, the GLDAS used the GPCP dataset; the GLEAM used the MSWEP dataset; TIM used the MERRA2 dataset; the ERA5, MERRA2, and CRA40 used data derived from multiple independent sources. Previous studies have suggested that precipitation variability dominantly controls ET in the dry climates [49,50]. The overestimated precipitation of all of these datasets in Xinjiang [51,52,53,54] results in ET being overestimated. Moreover, the largest deviations in simulated precipitation, which usually occur in mountainous areas, are transmitted to the ET calculations [22,53]. Other misestimates of climate factors, such as temperature [50] and solar radiation [25], also play essential roles. (2) Differences in land surface parameters also lead to variations in evaporation estimates across different datasets. In climate warming, leaf area index (LAI) changes strongly affect land ET, especially in water-limited regions [55,56] Static vegetation parameters can introduce significant systematic errors. (3) The difference in model algorithms also affects the ET estimation [57]; the largest disparity among the different PET models can be up to 2.5 fold [58]. The radiation-based model (Priestley–Taylor formula) was employed in the GLEAM and TIM, while the ERA5, MERRA2, and GLDAS are based on temperature-based models (Penman–Monteith method). However, the numerous simplifications and semi-empirical parameterization of physical processes in the PT-based approaches may lower their accuracy [59]. A summary of the key factors causing differences and biases among the products is provided in Table S1 (Supplementary Materials). (4) We take Budyko-based ET0 as a theoretical reference due to the lack of observations. This introduces a fundamental and difficult-to-quantify systematic uncertainty into all comparisons in this study. (5) The spatial scale mismatch between the grid-scale ET products and point-scale station observations introduces uncertainty, particularly in areas with heterogeneous surfaces like oasis-desert transition zones. It may lead to overestimates or underestimates of the product’s local performance. Additionally, the inherent differences in spatial resolution among the various ET products themselves contribute to the discrepancies in their estimates. The coarse-resolution products tend to average out spatial details within a pixel, resulting in a systematic deviation in statistical values.
In this study, the Budyko framework serves as a theoretical reference, offering a unique perspective for interpreting systematic differences among various products. However, using Budyko-based ET0 as reference brings some limitations on the results. On the one hand, there are a large number of irrigated agricultural activities in the arid zone, and the irrigation water use breaks the natural water–heat balance, making the estimated Budyko-based ET0 lower than the actual ET [60], even though the evaporation datasets selected in this study also do not explicitly account for irrigation. On the other hand, the Budyko framework relies on the refined characterization of the subsurface parameters, which brings uncertainty to the misidentified estimation of the complex subsurface in Xinjiang [29]. Furthermore, as mentioned previously, the limitations of the Budyko framework led to overestimation of theoretical evaporation values during winter, amplifying differences in winter evaporation across various datasets. Therefore, the conclusions of this study should be understood as consistency and divergence revealed among multi-source datasets, instead of a definitive evaluation on the accuracy of any single product.
Xinjiang has a complex terrain with interlaced mountainous areas, basins, and oases. Topographic complexity further amplifies simulation challenges, as seen in high CRMSE values along the Tianshan Mountains and strong positive biases in the Tarim Basin, necessitating region-specific dataset selection. Regarding the findings of this study, MERRA2 provides the most optimal performance overall. Despite its relatively lower spatial resolution, it is recommended as the preferred dataset for large-scale and long-term trend analysis; the ERA5 offers balanced performance and accessibility with high spatiotemporal resolution, making it recommended for land surface process modeling and regional water–heat balance studies; the GLEAM effectively captures evapotranspiration signals during the growing season, making it suitable for research sensitive to vegetation dynamics such as eco-hydrological processes and agricultural water management. TIM offers the highest spatial resolution and demonstrates good applicability in northern Xinjiang. It is recommended for mechanism-based studies such as high-resolution watershed hydrological modeling and mountainous heterogeneity analysis. Future research needs to optimize parameterization scheme of the ET datasets for complex terrain areas. By adopting a multi-dataset fusion strategy, uncertainties should be reduced to improve the accuracy and reliability of evaporation simulation. In addition, human irrigation activities were explicitly incorporated into the model for consideration. Developing or introducing a land surface model that couples human water usage processes will significantly improve the accuracy of ET simulation in arid regions.

5. Conclusions

By analyzing potential and evapotranspiration from 1990 to 2020, this research provides insights into the spatial and temporal patterns observed in evapotranspiration in Xinjiang. A comparative analysis was conducted on remote sensing-based, land surface model-based and reanalysis-based products across annual, seasonal, and monthly time scales, and the analysis explores the impacts of different land cover types. The main conclusions are summarized as follows:
(1) The annual PET in Xinjiang showed a significant increase and decrease in summer and fall. In terms of spatial distribution, PET exhibited a general increase from north to south, indicating the strong influence of topography and land cover. In contrast, the ET increased slightly, with only a significant trend was found in autumn. However, there was no obvious spatial characteristic of the trend of ET change in Xinjiang.
(2) Evaporation simulations across multiple datasets in Xinjiang exhibit pronounced spatial heterogeneity and seasonal dependency. SMAPE exhibits regional differences between north and south, while CRMSE is driven by topography. Basin areas show high errors, and mountains exhibit high random errors. Overall, the datasets demonstrated a superior ability to simulate evapotranspiration in the northern part of Xinjiang than in the southern.
(3) Performance variations among the multi-source ET products were significant, with the reanalysis-based products showing the most comprehensive performance. Specifically, MERRA2 and ERA5 are recommended for most scenarios due to their balanced performance.
In conclusion, the selection of ET products in Xinjiang requires differential selection depending on regional topography, seasonal climate patterns, and land cover types. It is recommended to adopt the use of reanalysis datasets, applying corrections for local biases, while incorporating multi-source validation to enhance ET simulation accuracy and application reliability.

Supplementary Materials

The following supporting information can be downloaded at: https://www.mdpi.com/article/10.3390/rs17193297/s1, Table S1: The summary of inputs and sources of uncertainty for 6 multi-source datasets; Table S2: Summary statistics for the six ET products at annual and seasonal scales over Xinjiang

Author Contributions

J.C.: Analysis and writing—original draft preparation; C.M.: Data curation; J.Y.: Conceptualization and methodology; W.M.: Supervision; G.L. and J.P.: Secured funding for this research. All authors have read and agreed to the published version of the manuscript.

Funding

This research was funded by the Key Laboratory Opening Foundation of Xinjiang Uygur Autonomous Region (2023D04048); the Shanghai Cooperation Organization (SCO) Science and Technology Partnership and International S&T Cooperation Program (2023E01022); the Grassland Ecological Restoration and Management Technology Support Project (XJCYZZXZ202401); the Basic Research Fund of CAMS (2023Z004); and the S&T Development Fund of CAMS (2021KJ034).

Data Availability Statement

The original data presented in the study are publicly available. The GLEAM data are accessible at https://www.gleam.eu/ (accessed on 6 February 2025). The GLDAS data are accessible at https://disc.gsfc.nasa.gov/datasets/GLDAS_NOAH025_M_2.1 (accessed on 7 February 2025). The TIM data are accessible at http://data.tpdc.ac.cn (accessed on 11 January 2025). The ERA5 data are accessible at https://cds.climate.copernicus.eu/datasets (accessed on 10 July 2024). The MERRA2 data are accessible at https://gmao.gsfc.nasa.gov/reanalysis/MERRA-2 (accessed on 12 May 2025). The CRA40 data are accessible at http://data.cma.cn/CRA (accessed on 9 July 2024). The meteorological stations’ data are accessible at https://data.cma.cn/data/detail/dataCode/A.0012.0001.html (accessed on 9 July 2025).

Conflicts of Interest

The authors declare no conflicts of interest.

References

  1. Oki, T.; Kanae, S. Global Hydrological Cycles and World Water Resources. Science 2006, 313, 1068–1072. [Google Scholar] [CrossRef] [PubMed]
  2. Dickinson, R.E.; Henderson-Sellers, A.; Rosenzweig, C.; Sellers, P.J. Evapotranspiration Models with Canopy Resistance for Use in Climate Models, a Review. Agric. For. Meteorol. 1991, 54, 373–388. [Google Scholar] [CrossRef]
  3. Fisher, J.B.; Melton, F.; Middleton, E.; Hain, C.; Anderson, M.; Allen, R.; McCabe, M.F.; Hook, S.; Baldocchi, D.; Townsend, P.A.; et al. The Future of Evapotranspiration: Global Requirements for Ecosystem Functioning, Carbon and Climate Feedbacks, Agricultural Management, and Water Resources. Water Resour. Res. 2017, 53, 2618–2626. [Google Scholar] [CrossRef]
  4. Orth, R.; Destouni, G. Drought Reduces Blue-Water Fluxes More Strongly than Green-Water Fluxes in Europe. Nat. Commun. 2018, 9, 3602. [Google Scholar] [CrossRef]
  5. Lu, C.; Zhang, Q.; Woolway, R.I.; Ma, L.; Liu, T.; Wang, G.; Sun, D.; Singh, V.P.; Bai, Y.; Sun, B.; et al. Global Warming Will Increase the Risk of Water Shortage in Northwest China. Earth’s Future 2025, 13, e2025EF006199. [Google Scholar] [CrossRef]
  6. Zheng, C.; Jia, L.; Hu, G. Global Land Surface Evapotranspiration Monitoring by ETMonitor Model Driven by Multi-Source Satellite Earth Observations. J. Hydrol. 2022, 613, 128444. [Google Scholar] [CrossRef]
  7. Muñoz-Sabater, J.; Dutra, E.; Agustí-Panareda, A.; Albergel, C.; Arduini, G.; Balsamo, G.; Boussetta, S.; Choulga, M.; Harrigan, S.; Hersbach, H.; et al. ERA5-Land: A State-of-the-Art Global Reanalysis Dataset for Land Applications. Earth Syst. Sci. Data 2021, 13, 4349–4383. [Google Scholar] [CrossRef]
  8. Miralles, D.G.; Holmes, T.R.H.; De Jeu, R.A.M.; Gash, J.H.; Meesters, A.G.C.A.; Dolman, A.J. Global Land-Surface Evaporation Estimated from Satellite-Based Observations. Hydrol. Earth Syst. Sci. 2011, 15, 453–469. [Google Scholar] [CrossRef]
  9. Yin, L.; Tao, F.; Chen, Y.; Liu, F.; Hu, J. Improving Terrestrial Evapotranspiration Estimation across China during 2000–2018 with Machine Learning Methods. J. Hydrol. 2021, 600, 126538. [Google Scholar] [CrossRef]
  10. Xu, T.; Guo, Z.; Liu, S.; He, X.; Meng, Y.; Xu, Z.; Xia, Y.; Xiao, J.; Zhang, Y.; Ma, Y.; et al. Evaluating Different Machine Learning Methods for Upscaling Evapotranspiration from Flux Towers to the Regional Scale. J. Geophys. Res. Atmos. 2018, 123, 8674–8690. [Google Scholar] [CrossRef]
  11. Tran, B.N.; van der Kwast, J.; Seyoum, S.; Uijlenhoet, R.; Jewitt, G.; Mul, M. Uncertainty Assessment of Satellite Remote-Sensing-Based Evapotranspiration Estimates: A Systematic Review of Methods and Gaps. Hydrol. Earth Syst. Sci. 2023, 27, 4505–4528. [Google Scholar] [CrossRef]
  12. Mueller, B.; Hirschi, M.; Jimenez, C.; Ciais, P.; Dirmeyer, P.A.; Dolman, A.J.; Fisher, J.B.; Jung, M.; Ludwig, F.; Maignan, F.; et al. Benchmark Products for Land Evapotranspiration: LandFlux-EVAL Multi-Data Set Synthesis. Hydrol. Earth Syst. Sci. 2013, 17, 3707–3720. [Google Scholar] [CrossRef]
  13. Long, D.; Longuevergne, L.; Scanlon, B.R. Uncertainty in Evapotranspiration from Land Surface Modeling, Remote Sensing, and GRACE Satellites. Water Resour. Res. 2014, 50, 1131–1151. [Google Scholar] [CrossRef]
  14. Fang, B.; Lei, H.; Zhang, Y.; Quan, Q.; Yang, D. Spatio-Temporal Patterns of Evapotranspiration Based on Upscaling Eddy Covariance Measurements in the Dryland of the North China Plain. Agric. For. Meteorol. 2020, 281, 107844. [Google Scholar] [CrossRef]
  15. Pang, X.; Lei, H.; Cong, Z.; Yang, H.; Duan, L.; Yang, D. Long Term Variation of Evapotranspiration and Water Balance Based on Upscaling Eddy Covariance Observations over the Temperate Semi-Arid Grassland of China. Agric. For. Meteorol. 2021, 308–309, 108566. [Google Scholar] [CrossRef]
  16. Yin, L.; Wang, X.; Feng, X.; Fu, B.; Chen, Y. A Comparison of SSEBop-Model-Based Evapotranspiration with Eight Evapotranspiration Products in the Yellow River Basin, China. Remote Sens. 2020, 12, 2528. [Google Scholar] [CrossRef]
  17. Michel, D.; Jiménez, C.; Miralles, D.G.; Jung, M.; Hirschi, M.; Ershadi, A.; Martens, B.; McCabe, M.F.; Fisher, J.B.; Mu, Q.; et al. The WACMOS-ET Project &ndash; Part 1: Tower-Scale Evaluation of Four Remote-Sensing-Based Evapotranspiration Algorithms. Hydrol. Earth Syst. Sci. 2016, 20, 803–822. [Google Scholar] [CrossRef]
  18. Derardja, B.; Khadra, R.; Abdelmoneim, A.A.A.; El-Shirbeny, M.A.; Valsamidis, T.; De Pasquale, V.; Deflorio, A.M.; Volden, E. Advancements in Remote Sensing for Evapotranspiration Estimation: A Comprehensive Review of Temperature-Based Models. Remote Sens. 2024, 16, 1927. [Google Scholar] [CrossRef]
  19. Wang, D.; Wang, D.; Liu, S.; Huang, Y.; Yang, Q.; Ma, X.; Lin, Z. Comprehensive Evaluation of Nine Evapotranspiration Products from Remote Sensing, Gauge Upscaling and Land Surface Model over China. PLoS ONE 2024, 19, e0313762. [Google Scholar] [CrossRef] [PubMed]
  20. Wang, D.; Wang, D.; Mei, Y.; Yang, Q.; Ji, M.; Li, Y.; Liu, S.; Li, B.; Huang, Y.; Mo, C. Estimates of the Land Surface Hydrology from the Community Land Model Version 5 (CLM5) with Three Meteorological Forcing Datasets over China. Remote Sens. 2024, 16, 550. [Google Scholar] [CrossRef]
  21. Guo, L.; Wu, Y.; Zheng, H.; Zhang, B.; Fan, L.; Chi, H.; Yan, B.; Wang, X. Consistency and Uncertainty of Gridded Terrestrial Evapotranspiration Estimations over China. J. Hydrol. 2022, 612, 128245. [Google Scholar] [CrossRef]
  22. Bai, J.; Wu, G.; Mao, Y. Significant Disparity in Spatiotemporal Changes of Terrestrial Evapotranspiration across Reanalysis Datasets in China from 1982 to 2020. Remote Sens. 2023, 15, 4522. [Google Scholar] [CrossRef]
  23. Li, C.; Liu, Z.; Yang, W.; Tu, Z.; Han, J.; Li, S.; Yang, H. CAMELE: Collocation-Analyzed Multi-Source Ensembled Land Evapotranspiration Data. Earth Syst. Sci. Data 2024, 16, 1811–1846. [Google Scholar] [CrossRef]
  24. Ochege, F.U.; Shi, H.; Li, C.; Ma, X.; Igboeli, E.E.; Luo, G. Assessing Satellite, Land Surface Model and Reanalysis Evapotranspiration Products in the Absence of In-Situ in Central Asia. Remote Sens. 2021, 13, 5148. [Google Scholar] [CrossRef]
  25. Li, S.; Wang, G.; Zhu, C.; Lu, J.; Ullah, W.; Hagan, D.F.T.; Kattel, G.; Peng, J. Attribution of Global Evapotranspiration Trends Based on the Budyko Framework. Hydrol. Earth Syst. Sci. 2022, 26, 3691–3707. [Google Scholar] [CrossRef]
  26. Bai, P.; Cai, C. Calibrating a Remote Sensing Evapotranspiration Model Using the Budyko Framework. Agric. For. Meteorol. 2023, 342, 109757. [Google Scholar] [CrossRef]
  27. Zhang, L.; Dawes, W.R.; Walker, G.R. Response of Mean Annual Evapotranspiration to Vegetation Changes at Catchment Scale. Water Resour. Res. 2001, 37, 701–708. [Google Scholar] [CrossRef]
  28. Zhang, L.; Hickel, K.; Dawes, W.R.; Chiew, F.H.S.; Western, A.W.; Briggs, P.R. A Rational Function Approach for Estimating Mean Annual Evapotranspiration. Water Resour. Res. 2004, 40, 89–97. [Google Scholar] [CrossRef]
  29. Ning, T.; Zhou, S.; Chang, F.; Shen, H.; Li, Z.; Liu, W. Interaction of Vegetation, Climate and Topography on Evapotranspiration Modelling at Different Time Scales within the Budyko Framework. Agric. For. Meteorol. 2019, 275, 59–68. [Google Scholar] [CrossRef]
  30. Xu, X.; Li, X.; He, C.; Tia, W.; Tian, J. Development of a Simple Budyko-Based Framework for the Simulation and Attribution of ET Variability in Dry Regions. J. Hydrol. 2022, 610, 127955. [Google Scholar] [CrossRef]
  31. Song, L.; Ding, Z.; Kustas, W.P.; Xu, Y.; Zhao, G.; Liu, S.; Ma, M.; Xue, K.; Bai, Y.; Xu, Z. Applications of a Thermal-Based Two-Source Energy Balance Model Coupled to Surface Soil Moisture. Remote Sens. Environ. 2022, 271, 112923. [Google Scholar] [CrossRef]
  32. McMillan, H.K.; Westerberg, I.K.; Krueger, T. Hydrological Data Uncertainty and Its Implications. WIREs Water 2018, 5, e1319. [Google Scholar] [CrossRef]
  33. Sabziparvar, A.A.; Mousavi, R.; Marofi, S.; Ebrahimipak, N.A.; Heidari, M. An Improved Estimation of the Angstrom–Prescott Radiation Coefficients for the FAO56 Penman–Monteith Evapotranspiration Method. Water Resour. Manag. 2013, 27, 2839–2854. [Google Scholar] [CrossRef]
  34. Budyko, M.I. Climate and Life; Academic Press: New York, NY, USA, 1974. [Google Scholar]
  35. Fu, B. On the Calculation of the Evaporation from Land Surface. Sci. Atmos. Sin. 1981, 5, 23–31. [Google Scholar]
  36. Xu, X.; Liu, W.; Scanlon, B.R.; Zhang, L.; Pan, M. Local and Global Factors Controlling Water—Energy Balances within the Budyko Framework. Geophys. Res. Lett. 2013, 40, 6123–6129. [Google Scholar] [CrossRef]
  37. Benjamini, Y.; Hochberg, Y. Controlling the False Discovery Rate: A Practical and Powerful Approach to Multiple Testing. J. R. Stat. Soc. Ser. B Methodol. 1995, 57, 289–300. [Google Scholar] [CrossRef]
  38. Benjamini, Y.; Yekutieli, D. The Control of the False Discovery Rate in Multiple Testing under Dependency. Ann. Stat. 2001, 29, 1165–1188. [Google Scholar] [CrossRef]
  39. Hu, Z.; Chen, X.; Zhou, Q.; Chen, D.; Li, J. DISO: A Rethink of Taylor Diagram. Int. J. Climatol. 2019, 39, 2825–2832. [Google Scholar] [CrossRef]
  40. Ochege, F.U.; Yuan, X.; Ezekwe, I.C.; Ling, Q.; Nzabarinda, V.; Kayiranga, A.; Xie, M.; Shi, H.; Luo, G. Reconstructing Monthly 0.25° Terrestrial Evapotranspiration Data in a Remote Arid Region Using Bayesian-Driven Ensemble Learning Method. J. Hydrol. 2024, 634, 131115. [Google Scholar] [CrossRef]
  41. Zhu, W.; Tian, S.; Wei, J.; Jia, S.; Song, Z. Multi-Scale Evaluation of Global Evapotranspiration Products Derived from Remote Sensing Images: Accuracy and Uncertainty. J. Hydrol. 2022, 611, 127982. [Google Scholar] [CrossRef]
  42. Yao, T.; Lu, H.; Yu, Q.; Feng, S.; Xue, Y.; Feng, W. Uncertainties of Three High-Resolution Actual Evapotranspiration Products across China: Comparisons and Applications. Atmos. Res. 2023, 286, 106682. [Google Scholar] [CrossRef]
  43. Han, X.; Chen, Y.; Fang, G.; Li, Z.; Li, Y.; Di, Y. Spatiotemporal Variations and Driving Factors of Water Availability in the Arid and Semiarid Regions of Northern China. Remote Sens. 2024, 16, 4318. [Google Scholar] [CrossRef]
  44. Li, Z.-L.; Tang, B.-H.; Wu, H.; Ren, H.; Yan, G.; Wan, Z.; Trigo, I.F.; Sobrino, J.A. Satellite-Derived Land Surface Temperature: Current Status and Perspectives. Remote Sens. Environ. 2013, 131, 14–37. [Google Scholar] [CrossRef]
  45. Smith, W.K.; Geller, G.N. Plant Transpiration at High Elevations: Theory, Field Measurements, and Comparisons with Desert Plants. Oecologia 1979, 41, 109–122. [Google Scholar] [CrossRef]
  46. Niu, Z.; He, H.; Zhu, G.; Ren, X.; Zhang, L.; Zhang, K.; Yu, G.; Ge, R.; Li, P.; Zeng, N.; et al. An Increasing Trend in the Ratio of Transpiration to Total Terrestrial Evapotranspiration in China from 1982 to 2015 Caused by Greening and Warming. Agric. For. Meteorol. 2019, 279, 107701. [Google Scholar] [CrossRef]
  47. Li, H.; Mamtimin, A.; Ju, C. Simulation and Analysis of Land-Surface Processes in the Taklimakan Desert Based on Noah LSM. Adv. Meteorol. 2019, 2019, 1750102. [Google Scholar] [CrossRef]
  48. Etchanchu, J.; Demarty, J.; Dezetter, A.; Farhani, N.; Thiam, P.B.; Allies, A.; Bodian, A.; Boulet, G.; Chahinian, N.; Diop, L.; et al. Multiscale Analysis of Existing Actual Evapotranspiration Products over Agropastoral Sahel. J. Hydrol. 2025, 651, 132585. [Google Scholar] [CrossRef]
  49. Xing, W.; Wang, W.; Shao, Q.; Yong, B.; Liu, C.; Feng, X.; Dong, Q. Estimating Monthly Evapotranspiration by Assimilating Remotely Sensed Water Storage Data into the Extended Budyko Framework across Different Climatic Regions. J. Hydrol. 2018, 567, 684–695. [Google Scholar] [CrossRef]
  50. Jaafar, H.H.; Sujud, L.H. High-Resolution Satellite Imagery Reveals a Recent Accelerating Rate of Increase in Land Evapotranspiration. Remote Sens. Environ. 2024, 315, 114489. [Google Scholar] [CrossRef]
  51. Hu, Z.; Hu, Q.; Zhang, C.; Chen, X.; Li, Q. Evaluation of Reanalysis, Spatially Interpolated and Satellite Remotely Sensed Precipitation Data Sets in Central Asia. J. Geophys. Res. Atmos. 2016, 121, 5648–5663. [Google Scholar] [CrossRef]
  52. Jiang, J.; Zhou, T.; Zhang, W. Evaluation of Satellite and Reanalysis Precipitable Water Vapor Data Sets Against Radiosonde Observations in Central Asia. Earth Space Sci. 2019, 6, 1129–1148. [Google Scholar] [CrossRef]
  53. Sun, Q.; Miao, C.; Duan, Q.; Ashouri, H.; Sorooshian, S.; Hsu, K.L. A Review of Global Precipitation Data Sets: Data Sources, Estimation, and Intercomparisons. Rev. Geophys. 2018, 56, 79–107. [Google Scholar] [CrossRef]
  54. Zhou, Z.; Chen, S.; Li, Z.; Luo, Y. An Evaluation of CRA40 and ERA5 Precipitation Products over China. Remote Sens. 2023, 15, 5300. [Google Scholar] [CrossRef]
  55. Lu, J.; Wang, G.; Li, S.; Feng, A.; Zhan, M.; Jiang, T.; Su, B.; Wang, Y. Projected Land Evaporation and Its Response to Vegetation Greening Over China Under Multiple Scenarios in the CMIP6 Models. J. Geophys. Res. Biogeosci. 2021, 126, e2021JG006327. [Google Scholar] [CrossRef]
  56. Chen, H.; Zhu, G.; Zhang, K.; Bi, J.; Jia, X.; Ding, B.; Zhang, Y.; Shang, S.; Zhao, N.; Qin, W. Evaluation of Evapotranspiration Models Using Different LAI and Meteorological Forcing Data from 1982 to 2017. Remote Sens. 2020, 12, 2473. [Google Scholar] [CrossRef]
  57. Pimentel, R.; Arheimer, B.; Crochemore, L.; Andersson, J.C.M.; Pechlivanidis, I.G.; Gustafsson, D. Which Potential Evapotranspiration Formula to Use in Hydrological Modeling World-Wide? Water Resour. Res. 2023, 59, e2022WR033447. [Google Scholar] [CrossRef]
  58. Zhou, J.; Wang, Y.; Su, B.; Wang, A.; Tao, H.; Zhai, J.; Kundzewicz, Z.W.; Jiang, T. Choice of Potential Evapotranspiration Formulas Influences Drought Assessment: A Case Study in China. Atmos. Res. 2020, 242, 104979. [Google Scholar] [CrossRef]
  59. Shirmohammadi-Aliakbarkhani, Z.; Saberali, S.F. Evaluating of Eight Evapotranspiration Estimation Methods in Arid Regions of Iran. Agric. Water Manag. 2020, 239, 106243. [Google Scholar] [CrossRef]
  60. Hao, X.; Fan, X.; Zhao, Z.; Zhang, J. Spatiotemporal Patterns of Evapotranspiration in Central Asia from 2000 to 2020. Remote Sens. 2023, 15, 1150. [Google Scholar] [CrossRef]
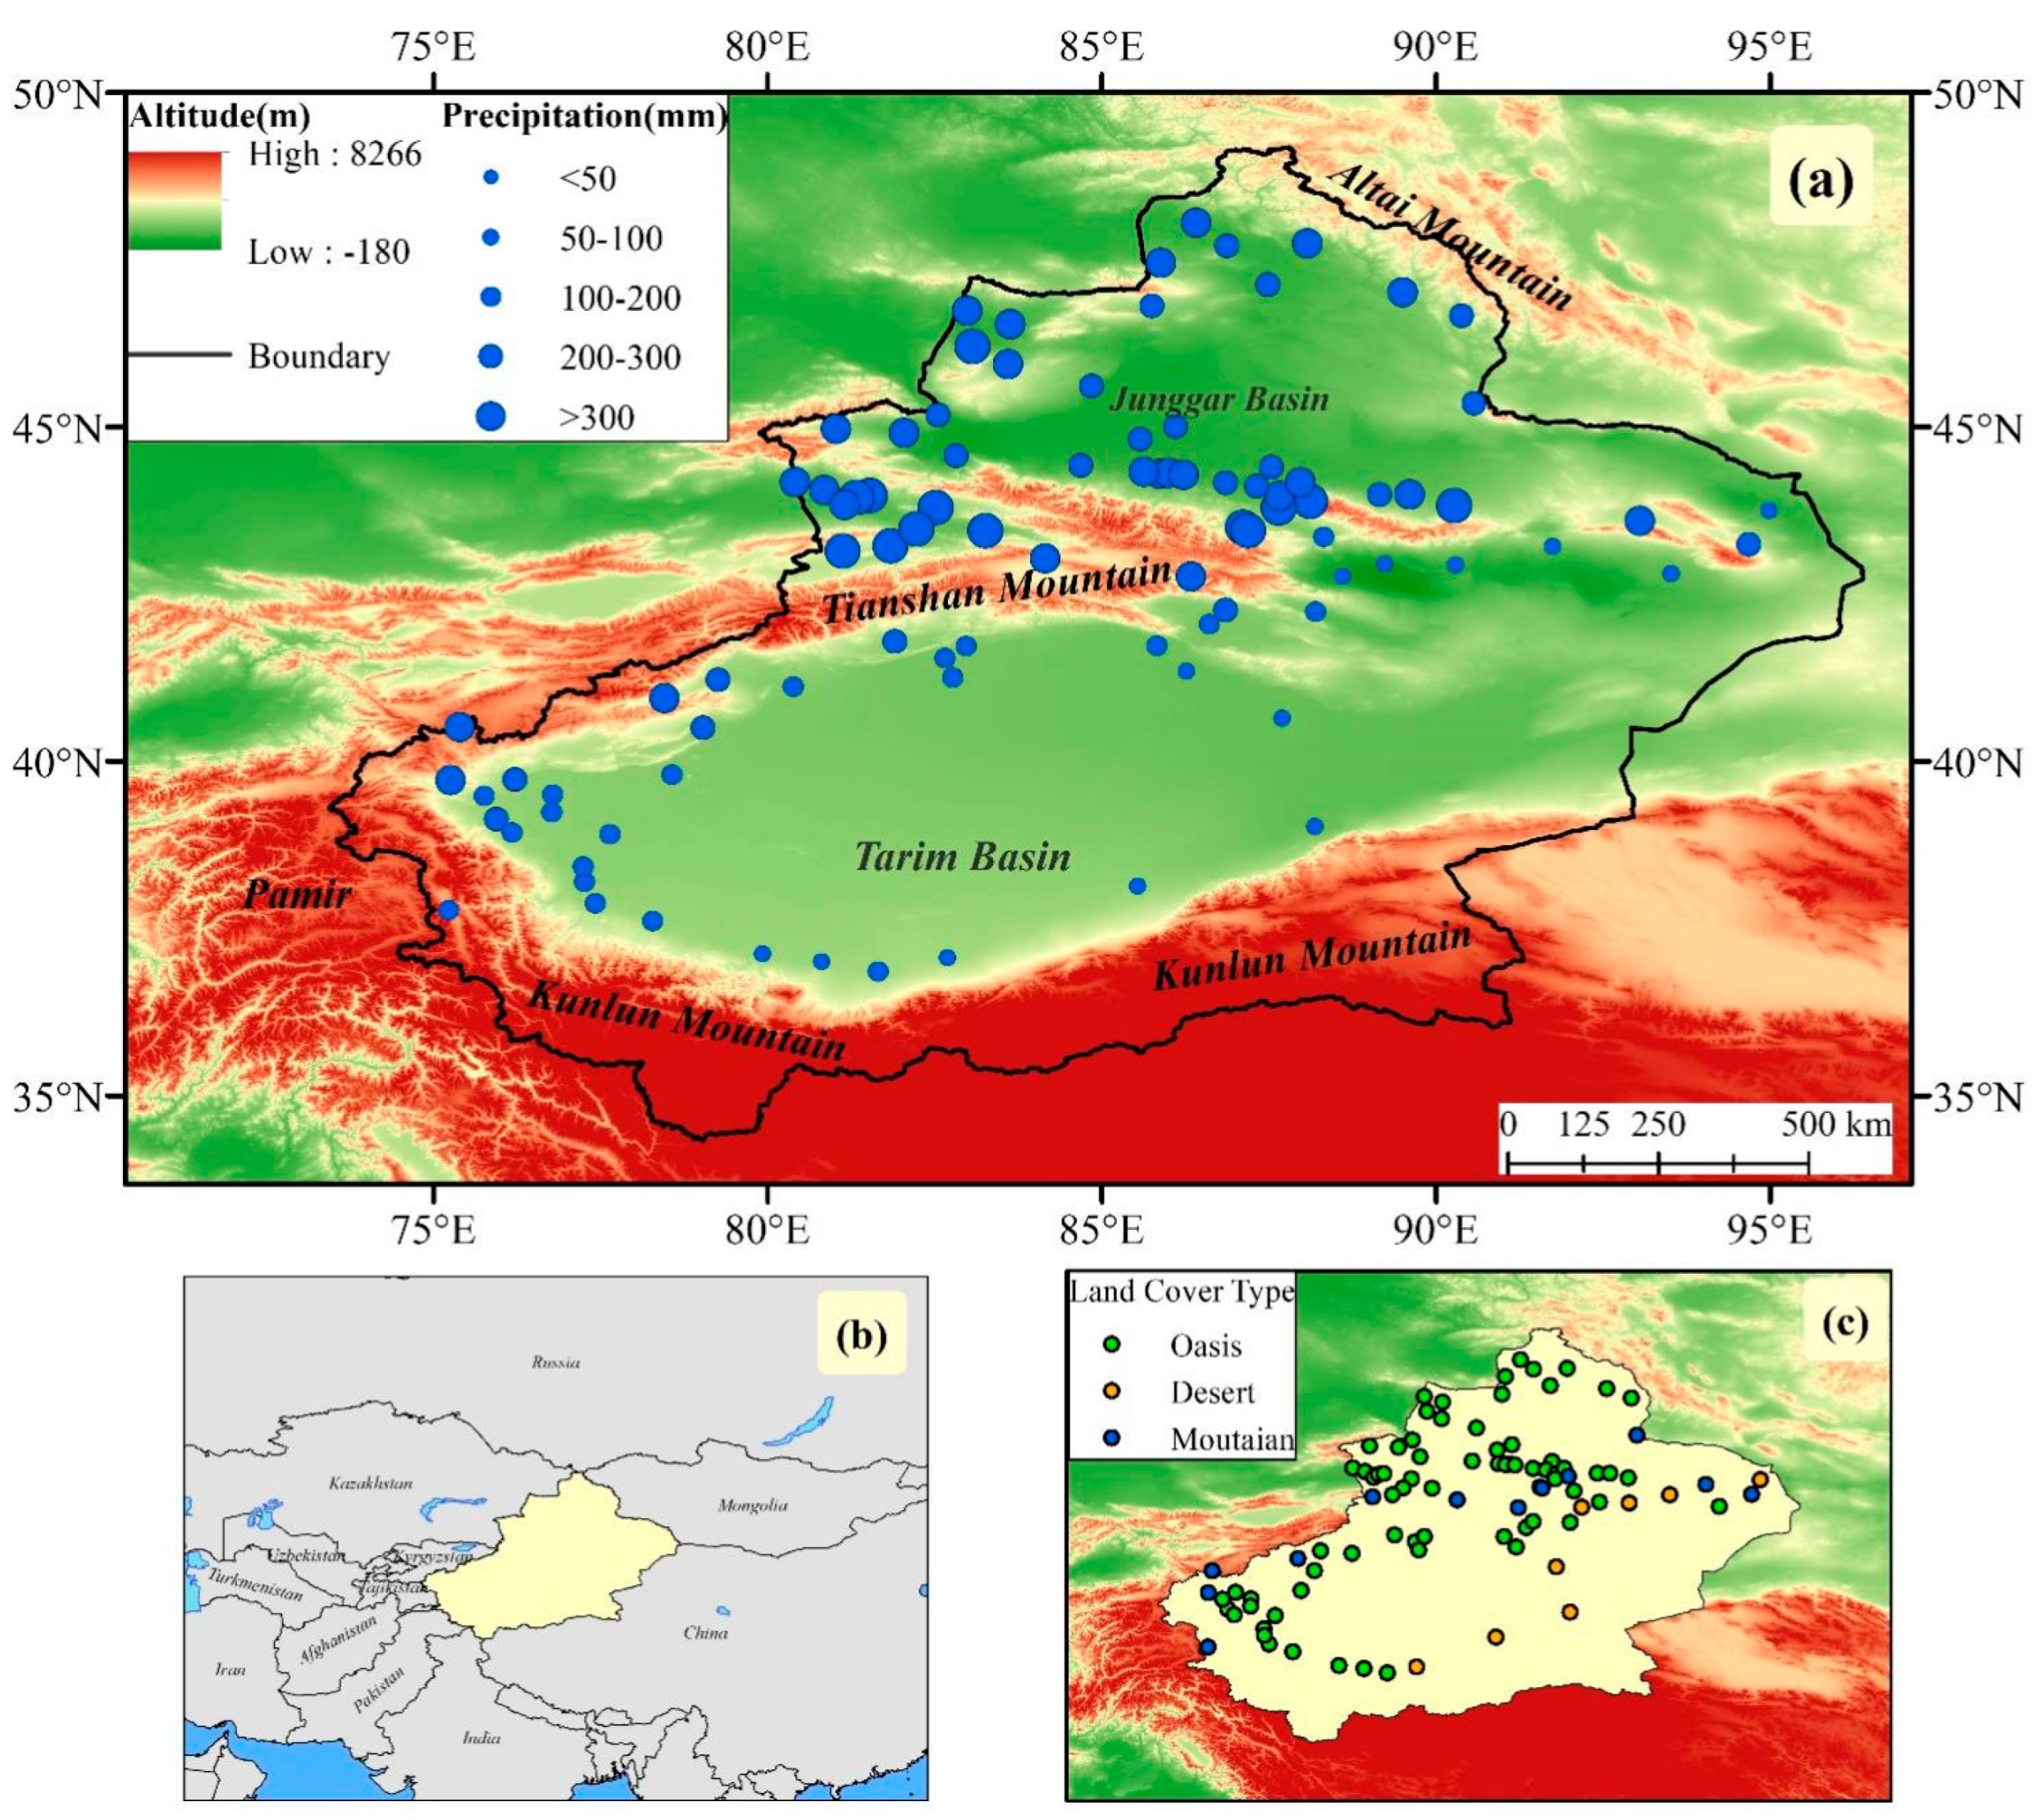
Figure 1. Geographical information of Xinjiang (a) geomorphic features and annual precipitation spatial distribution pattern; (b) geographical location; (c) land cover type of meteorological stations.
Remotesensing 17 03297 g001
Figure 2. The temporal trends (series 1 (a1e1)) and spatial distribution of trends (series 2 (a2e2)) of PET in Xinjiang (1961–2020) for annual (a), spring (b), summer (c), autumn (d), and winter (e) scales. In spatial maps, colors represent the magnitude of PET. Upward and downward triangles signify significant increasing and decreasing trends (p < 0.05, Mann-Kendall test with B-H correction), respectively; circles denote non-significant trends.
Remotesensing 17 03297 g002
Figure 3. The temporal trends (series 1 (a1e1)) and spatial distribution of trends (series 2 (a2e2)) of reference evapotranspiration derived from Budyko framework in Xinjiang (1961–2020) for annual (a), spring (b), summer (c), autumn (d), and winter (e) scales. In spatial maps, colors represent the magnitude of PET. Upward and downward triangles signify significant increasing and decreasing trends (p < 0.05, Mann-Kendall test with B-H correction), respectively; circles denote non-significant trends.
Remotesensing 17 03297 g003
Figure 4. Scatter plot of comparison of six ET products and ET0 over Xinjiang (blue line: fitting line with 95% confidence interval; red line: 1:1 reference line).
Remotesensing 17 03297 g004
Figure 5. The temporal variation and the changing trend of different ET products in annual (a), monthly (b), and seasonal scales (cf) during the given periods (the black line for ET0).
Remotesensing 17 03297 g005
Figure 6. The spatial distribution of the correlation coefficient in annual and seasonal scales between the ET products and ET0 at the station scale (symbol ‘x’ mark correlations significant at the 0.05 level (two-tailed, Benjamini-Hochberg adjusted).
Remotesensing 17 03297 g006
Figure 7. The spatial distribution of the bias coefficient in annual and seasonal scales between the ET products and ET0 at the station scale.
Remotesensing 17 03297 g007
Figure 8. Spatial distribution of annual and seasonal SMAPE between each ET product and ET0 for station scale.
Remotesensing 17 03297 g008
Figure 9. Spatial distribution of annual and seasonal CRMSE between each ET product and ET0 for station scale.
Remotesensing 17 03297 g009
Figure 10. The DISO index of six multi-source ET products in annual (a) and seasonal scales (be).
Remotesensing 17 03297 g010
Figure 11. The boxplot of the correlation coefficient for different land cover types during various time scales.
Remotesensing 17 03297 g011
Figure 12. The boxplot of the bias coefficient for different land cover types during various time scales.
Remotesensing 17 03297 g012
Figure 13. The boxplot of SMAPE for different land cover types during various time scales.
Remotesensing 17 03297 g013
Figure 14. The boxplot of CRMSE for different land cover types during various time scales.
Remotesensing 17 03297 g014
Figure 15. The spatial distribution and trend of ET used MERRA2 in Xinjiang (a) annual mean ET, (b) annual trend; (cf) seasonal trend, points denoted where the trend is significant at the 0.05 level (t-test, Benjamini–Hochberg adjusted).
Remotesensing 17 03297 g015
Table 1. The metadata information on 6 ET products.
NumberNameGeneral CategoriesInput
Variables
Spatial ResolutionSelected
Period
1GLEAMRemote sensing-basedsatellite and reanalysis0.1°1990–2020
2GLDASLand surface model-basedsatellite and ground observations0.25°2000–2020
3TIM Land surface model-basedsatellite0.01°2001–2020
4ERA5Reanalysis-basedreanalysis0.1°1990–2020
5MERRA2Reanalysis-basedsatellite, ground, and aircraft observations0.5° (lat) × 0.625° (lon)1990–2020
6CRA40Reanalysis-basedground observations and satellite0.28°1990–2020
Table 2. Statistical summary of comparison on six ET products.
MetricsERA5CRA40MERRA2GLEAMGLDASTIM
R20.8100.4650.8120.7340.8150.734
RMSE (mm)10.7920.614.8013.4422.814.53
Correction0.900.680.900.860.900.86
Disclaimer/Publisher’s Note: The statements, opinions and data contained in all publications are solely those of the individual author(s) and contributor(s) and not of MDPI and/or the editor(s). MDPI and/or the editor(s) disclaim responsibility for any injury to people or property resulting from any ideas, methods, instructions or products referred to in the content.