Article

Integrating Sentinel-1/2 Imagery and Climate Reanalysis for Monthly Bare Soil Mapping and Wind Erosion Modeling in Shandong Province, China

1
College of Geography and Environment, Shandong Normal University, Jinan 250014, China
2
Key Laboratory of Comprehensive Observation of Polar Environment (Sun Yat-sen University), Ministry of Education, Zhuhai 519082, China
*
Author to whom correspondence should be addressed.
Remote Sens. 2025, 17(19), 3298; https://doi.org/10.3390/rs17193298
Submission received: 5 August 2025 / Revised: 14 September 2025 / Accepted: 23 September 2025 / Published: 25 September 2025
(This article belongs to the Section Environmental Remote Sensing)

Abstract

Highlights

What are the main findings?
  • Produced monthly 10 m bare soil maps (2017–2024) for Shandong Province using an ensemble model integrating Sentinel-1/2 and topographic features.
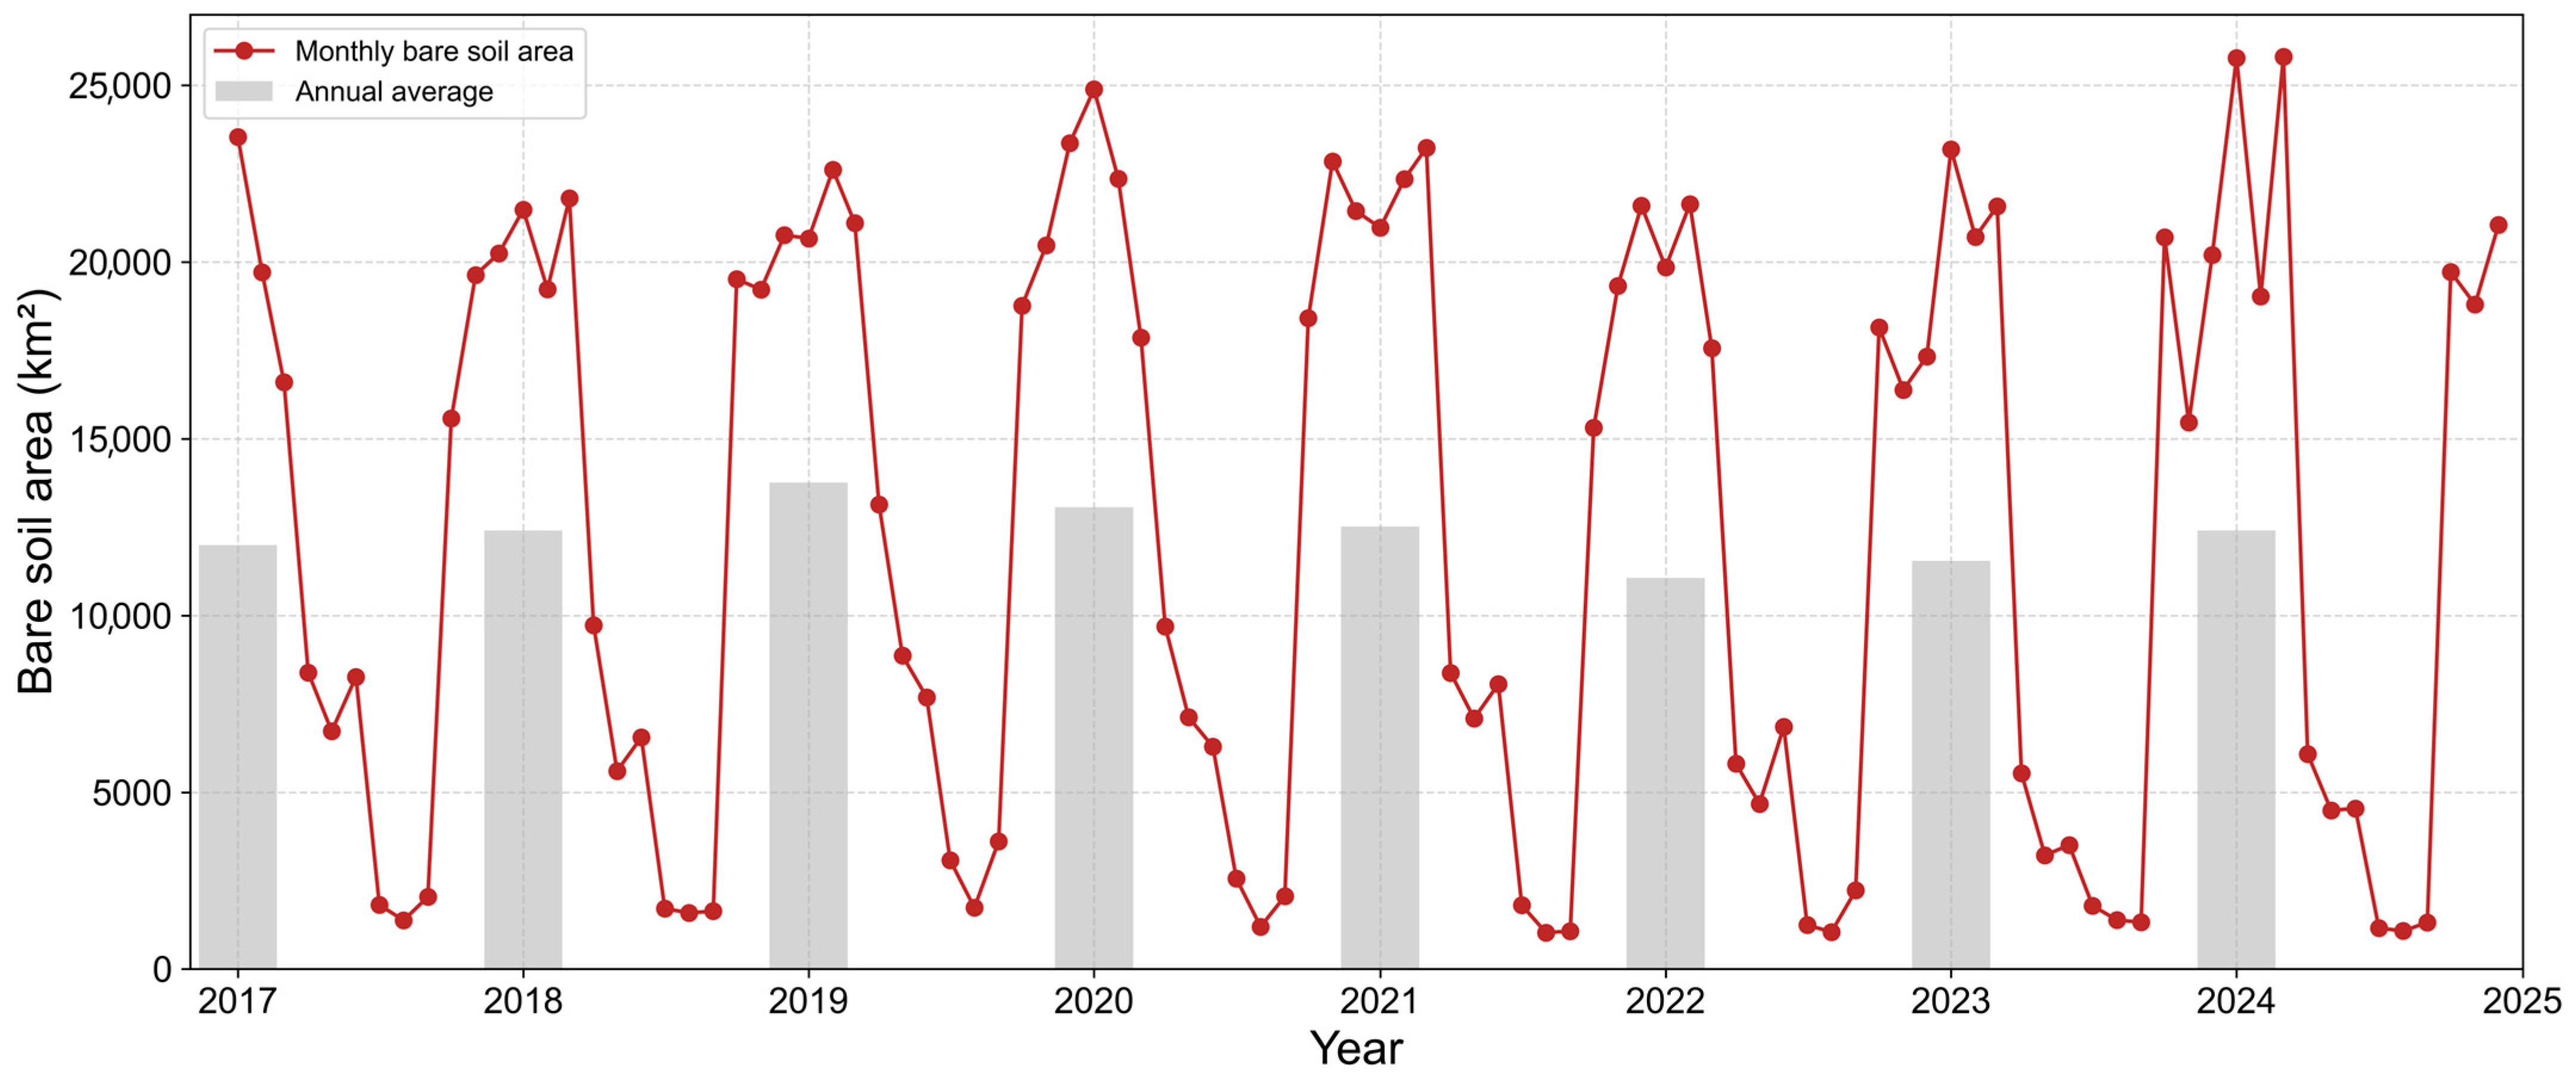
  • Revealed strong seasonal variability, with bare soil exceeding 25,000 km2 in winter–spring, far higher than static land cover estimates.
What is the implication of the main finding?
  • Process-based modeling with CLM5.0 estimated annual PM10 emissions of (2.72 ± 1.09) × 105 tons, with more than 80% emitted in winter and spring.
  • Provides a robust framework for dust source identification and supports targeted mitigation strategies in agricultural regions.

Abstract

Accurate identification of bare soil exposure and quantification of associated dust emissions are essential for understanding land degradation and air quality risks in intensively farmed regions. This study develops a monthly monitoring and modeling framework to quantify bare soil dynamics and wind erosion-induced particulate matter (PM) emissions across Shandong Province from 2017 to 2024. By integrating Sentinel-1/2 imagery, climate reanalysis, terrain and soil data, and employing a stacking ensemble classification model, we mapped bare soil areas at 10 m resolution with an overall accuracy of 93.1%. The results show distinct seasonal variation, with bare soil area peaking in winter and early spring, exceeding 25,000 km2 or 15% of the total area, which is far above the 6.4% estimated by land cover products. Simulations using the CLM5.0 dust module indicate that annual PM10 emissions from bare soil averaged (2.72 ± 1.09) × 105 tons across 2017–2024. Emissions were highest in March and lowest in summer months, with over 80% of the total emitted during winter and spring. A notable increase in emissions was observed after 2022, likely due to more frequent extreme wind events. Spatially, emissions were concentrated in coastal lowlands such as the Yellow River Delta and surrounding saline–alkali lands. Our approach explicitly advances traditional methods by generating monthly 10 m bare soil maps and linking satellite-derived dynamics with process-based dust emission modeling, providing a robust basis for targeted dust control and land management strategies.

1. Introduction

Atmospheric particulate matter (PM) pollution has significant implications for ambient air quality and public health [1,2,3]. Among its primary sources, wind erosion of exposed soil contributes substantially to particulate pollution in both urban and rural areas [4,5,6,7], while also removing nutrients and organic matter from topsoil, reducing fertility and threatening agricultural productivity [8,9]. While many source apportionment studies emphasize emissions from road-generated dust and construction activities, the role of soil fugitive dust emissions has received relatively limited attention [10,11]. Unlike discrete anthropogenic sources, dust emissions from exposed bare soil are spatially extensive and temporally variable, influenced by dynamic interactions among climate conditions, land surface properties, and land management practices [12,13]. These characteristics make dust emission quantification difficult and compromise inventory accuracy.
Developing reliable wind erosion dust emission inventories is useful for modeling regional PM concentrations and supporting effective mitigation strategies [14]. These inventories generally rely on two key components: identification of erodible source areas and quantification of emission strength based on environmental conditions. In practice, mapping when and where bare soil becomes exposed is often the most critical step, as the availability of exposed surfaces largely governs the potential for wind-driven dust emissions. Remote sensing has become an effective approach for wind erosion research, particularly in capturing key surface properties such as soil moisture, vegetation cover, and surface roughness that influence erosion risk [12]. Satellite missions like Sentinel-2 and Landsat-8 allow large-scale tracking of bare soil changes driven by agricultural activities, vegetation loss, and surface disturbance [15,16].
Despite these technical capabilities, many dust emission studies and air quality emission inventories still rely on static or low-frequency land use and land cover (LULC) datasets to define dust source areas [17,18,19]. LULC products such as MODIS MCD12Q1 [20], ESA CCI Land Cover [21], and GLC_FCS30D [22] are typically produced on an annual basis, making them inadequate for capturing the marked seasonal variability in surface exposure across many regions. This is especially problematic in areas with strong phenological cycles, where bare soil extent can vary by one to two orders of magnitude between growing and dormant seasons [14,23]. In addition, most LULC classification algorithms are designed to maximize overall accuracy across land types [21], which often leads to reduced performance for bare soil. Spectral confusion with urban impervious surfaces, construction sites, and sparsely vegetated land further reduces classification reliability [13]. Consequently, the accuracy of the bare soil class in many LULC products often falls below 80% [20,21,22], limiting their utility for wind erosion assessments.
As summarized in a recent review [13], a wide range of approaches have been developed for bare soil mapping using satellite remote sensing, including threshold masking [24], classification algorithms [16], and soil line methods [25]. Among them, NDVI-based masking remains one of the most commonly used techniques, particularly in agricultural regions [24]. However, these methods often rely on empirically defined thresholds, which may not transfer well across regions. Machine learning methods offer more flexibility in feature use, but many models are trained on limited temporal samples or small spatial extents, resulting in poor generalization beyond the original training area [13]. These limitations are particularly evident in intensively cultivated regions, where the timing and frequency of bare soil exposure can vary sharply within and between years [16]. Improving the robustness of classification approaches remains essential for producing reliable bare soil maps to support downstream applications such as dust emission modeling [23].
On the modeling side, dust emission estimates are still commonly derived from empirical approaches such as the Wind Erosion Equation (WEQ) [26], the Revised Wind Erosion Equation (RWEQ) [27], and other simplified variants [28]. While computationally straightforward, these models are based on fixed parameters, such as static surface roughness factors and averaged soil erodibility values, and therefore may be oversimplified. They were originally developed for arid and semi-arid environments with relatively stable surface dynamics, and do not account for the rapid shifts in surface exposure and soil moisture seen in regions with strong seasonal variability. Therefore, these models tend to yield unreliable estimates in regions with strong seasonal variability in vegetation, precipitation, and wind, where erosion potential changes quickly with surface conditions [23]. In China, the Ministry of Ecology and Environment recommends WEQ-based methods in its national technical guidelines for the compilation of fugitive dust emission inventories, reflecting the continued reliance on simplified frameworks despite their known limitations [28,29,30,31].
In this study, we develop an integrated framework to monitor monthly bare land dynamics and simulate associated wind erosion dust emissions in Shandong Province, a temperate monsoon region with intensive agriculture and strong seasonal variability. Bare soil classification is based on an advanced ensemble learning framework that combines spectral, polarimetric, textural, and topographic features derived from multi-source remote sensing data, including Sentinel-1, Sentinel-2, and elevation products. Compared with previous studies, our approach is distinguished by its integration of multi-source predictors, the production of monthly maps at 10 m resolution, and its application at the provincial scale, allowing more consistent detection of short-term soil exposure. The generated monthly maps for 2017–2024 are combined with meteorological variables and soil datasets to drive the dust emission module of a well-established physically based land surface model. By coupling satellite-derived bare soil dynamics with process-based dust emission modeling, our approach captures dust emission potential with high spatiotemporal detail, providing a robust basis for data-informed particulate pollution control.

2. Materials and Methods

2.1. Study Area

Shandong Province is located on the eastern coast of China (34.4–38.4°N, 114.8–122.7°E), bordered by the Bohai Sea and the Yellow Sea. It covers an area of approximately 155,800 km2 and is home to over 100 million residents, making it one of the most densely populated and agriculturally productive regions in the country. The province is characterized by a temperate monsoon climate, with distinct seasons and strong seasonal variation in precipitation and vegetation cover. Shandong has a mean annual temperature of 12–15 °C and receives 550–950 mm of precipitation annually, most of which falls between July and September [32].
The terrain of Shandong is generally flat in the north and west, while the central and southeastern areas feature low hills and isolated mountains. Elevation ranges from near sea level along the coast to over 1500 m in the inland highlands [33]. Due to its fertile soils and favorable climate, the province supports extensive agricultural activity, primarily focused on wheat, maize, and cotton cultivation, often involving multiple cropping and fallow cycles throughout the year [34].
As shown in Figure 1, cropland accounts for over 60% of the land area, while built-up areas, forest cover, grasslands, and water bodies occupy smaller proportions. The dominance of cropland and the seasonal nature of land management practices result in large fluctuations in surface exposure, particularly during post-harvest and pre-sowing periods. However, most existing LULC products treat agricultural land as a static class, without distinguishing between vegetated and exposed states across different phenological stages. Consequently, the seasonal bare soil exposure within cropland is often underestimated, limiting the accuracy of emission source delineation in wind erosion assessments.

2.2. Data

This study integrates multi-source datasets from radar, optical, topographic, meteorological, and soil domains to support monthly bare soil mapping and wind erosion modeling across Shandong Province from 2017 to 2024. All data were processed in the Google Earth Engine (GEE) cloud platform.
Sentinel-1 provides C-band Synthetic Aperture Radar data, which are unaffected by cloud cover and capable of capturing surface roughness and dielectric properties, and its integration with Sentinel-2 optical data improves robustness against cloud contamination. We used the Ground Range Detected (GRD) product in Interferometric Wide (IW) swath mode (GEE asset: COPERNICUS/S1_GRD), which provides dual-polarized (VV and VH) backscatter data at 10 m spatial resolution and a revisit frequency of 6–12 days, depending on orbit overlap. Standard preprocessing steps in GEE include thermal noise removal, radiometric calibration, terrain correction, and normalization to decibel (dB) scale. We extracted VV, VH, and VH/VV ratio as predictors to characterize surface conditions relevant to bare soil exposure.
Sentinel-2 offers high-resolution multispectral imagery through its Multi-Spectral Instrument, with 13 spectral bands spanning visible, near-infrared, red-edge, and shortwave infrared regions. We used the harmonized Level-2A surface reflectance product (GEE asset: COPERNICUS/S2_SR_HARMONIZED) with 10–20 m resolution and a revisit time of 5 days. When data were unavailable, the Level-1C top-of-atmosphere reflectance product (GEE asset: COPERNICUS/S2_HARMONIZED) was used as a substitute. Cloud and cirrus pixels were masked using the QA60 band, and key spectral features were extracted to capture seasonal transitions in surface exposure. For months or regions with missing observations, gaps were filled using the nearest available cloud-free Sentinel-2 image to maintain temporal continuity.
Topographic variables were derived from the AW3D30 Digital Surface Model produced by Japan Aerospace Exploration Agency, which offers 30 m resolution global coverage and has been shown to perform well in East Asian regions [33]. Elevation, slope, and aspect were derived to represent terrain constraints and enhance classification accuracy for bare soil.
Meteorological variables were extracted from the ERA5-Land dataset [36], a physically consistent global reanalysis whose continuous temporal coverage and dynamic constraints make it suitable for process-based modeling. ERA5-Land provides hourly meteorological fields at ~9 km resolution. We calculated monthly averages for 10 m wind speed, 2 m air temperature, total precipitation, and volumetric soil moisture, which were used to drive the dust emission model and represent environmental controls on wind erosion.
Soil properties were derived from the China dataset of soil properties for land surface modeling version 2 (CSDLv2) [37], which provides nationwide gridded maps of soil physical and chemical variables. In this study, we used the version with a spatial resolution of 1 km. We used measurements of bulk density and sand/silt/clay fractions of the topsoil layer (0–5 cm), which are key parameters for determining threshold friction velocity and surface erodibility in the dust emission scheme.

2.3. Method

2.3.1. Integrated Framework Overview

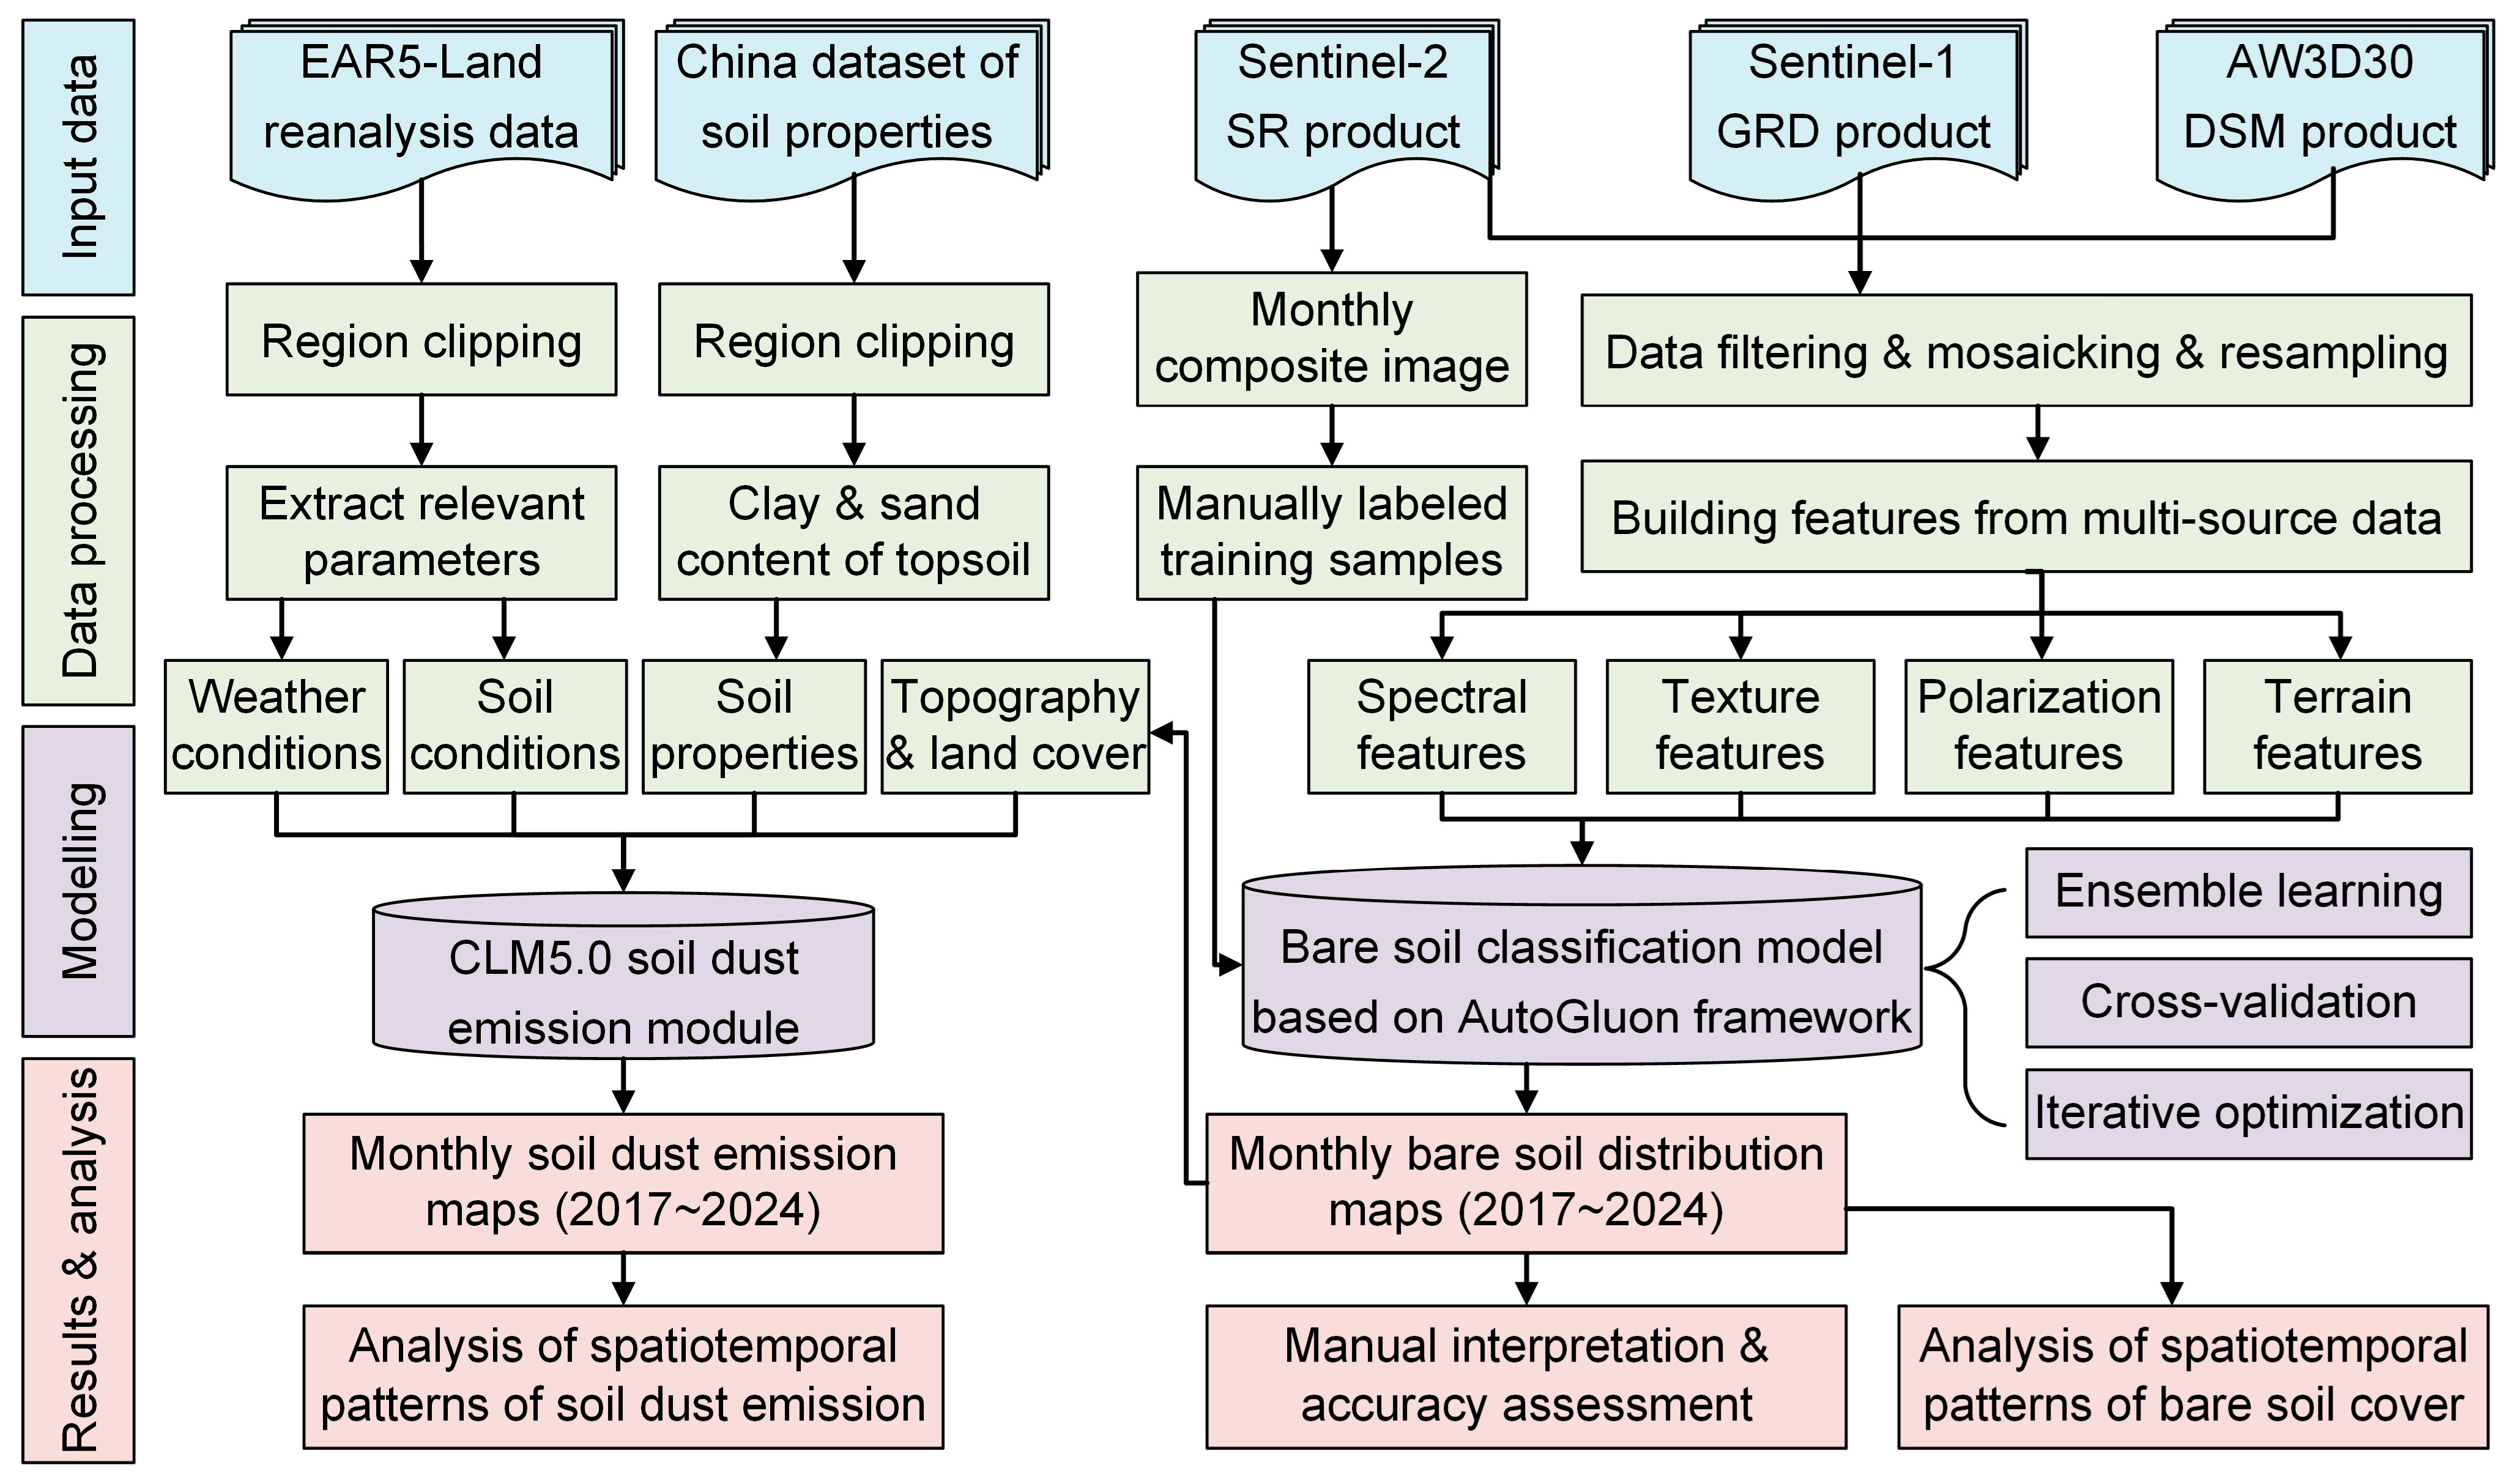
This study developed an integrated remote sensing–modeling framework to monitor monthly bare soil dynamics and simulate associated wind erosion dust emissions in Shandong Province from 2017 to 2024 (Figure 2). The first component involves generating monthly 10 m bare soil maps for 2017–2024 by fusing multi-source remote sensing inputs. Specifically, Sentinel-1 SAR and Sentinel-2 optical imagery were processed to extract spectral, polarization, and texture features, and were further complemented by topographic attributes derived from the AW3D30 digital surface model. These features were resampled to the 10 m grid using bilinear interpolation, and the harmonized predictors were then input to the ensemble model to generate temporally consistent 10 m bare-soil maps. The resulting dataset provides high-resolution information on the spatial distribution of exposed soils, supporting fine-scale dust emission assessment and control efforts.
In the second component, the spatially explicit bare soil maps were integrated with ERA5-Land meteorological reanalysis and soil physical property data from CSDLv2 to drive a process-based dust emission model embedded within CLM5.0 [38]. To accommodate the typical resolution requirements of air quality models, all input variables were resampled to a 1 km grid using bilinear interpolation. The model simulates threshold exceedance, emission flux, and particle transport using mechanistic formulations, enabling a physically grounded estimation of soil dust emissions across diverse surface and atmospheric conditions. Our estimates refer specifically to wind erosion dust emissions from bare soils. Other sources such as biomass burning and transported aerosols are not included here, as they represent different processes.

2.3.2. Bare Soil Classification Using Ensemble Learning

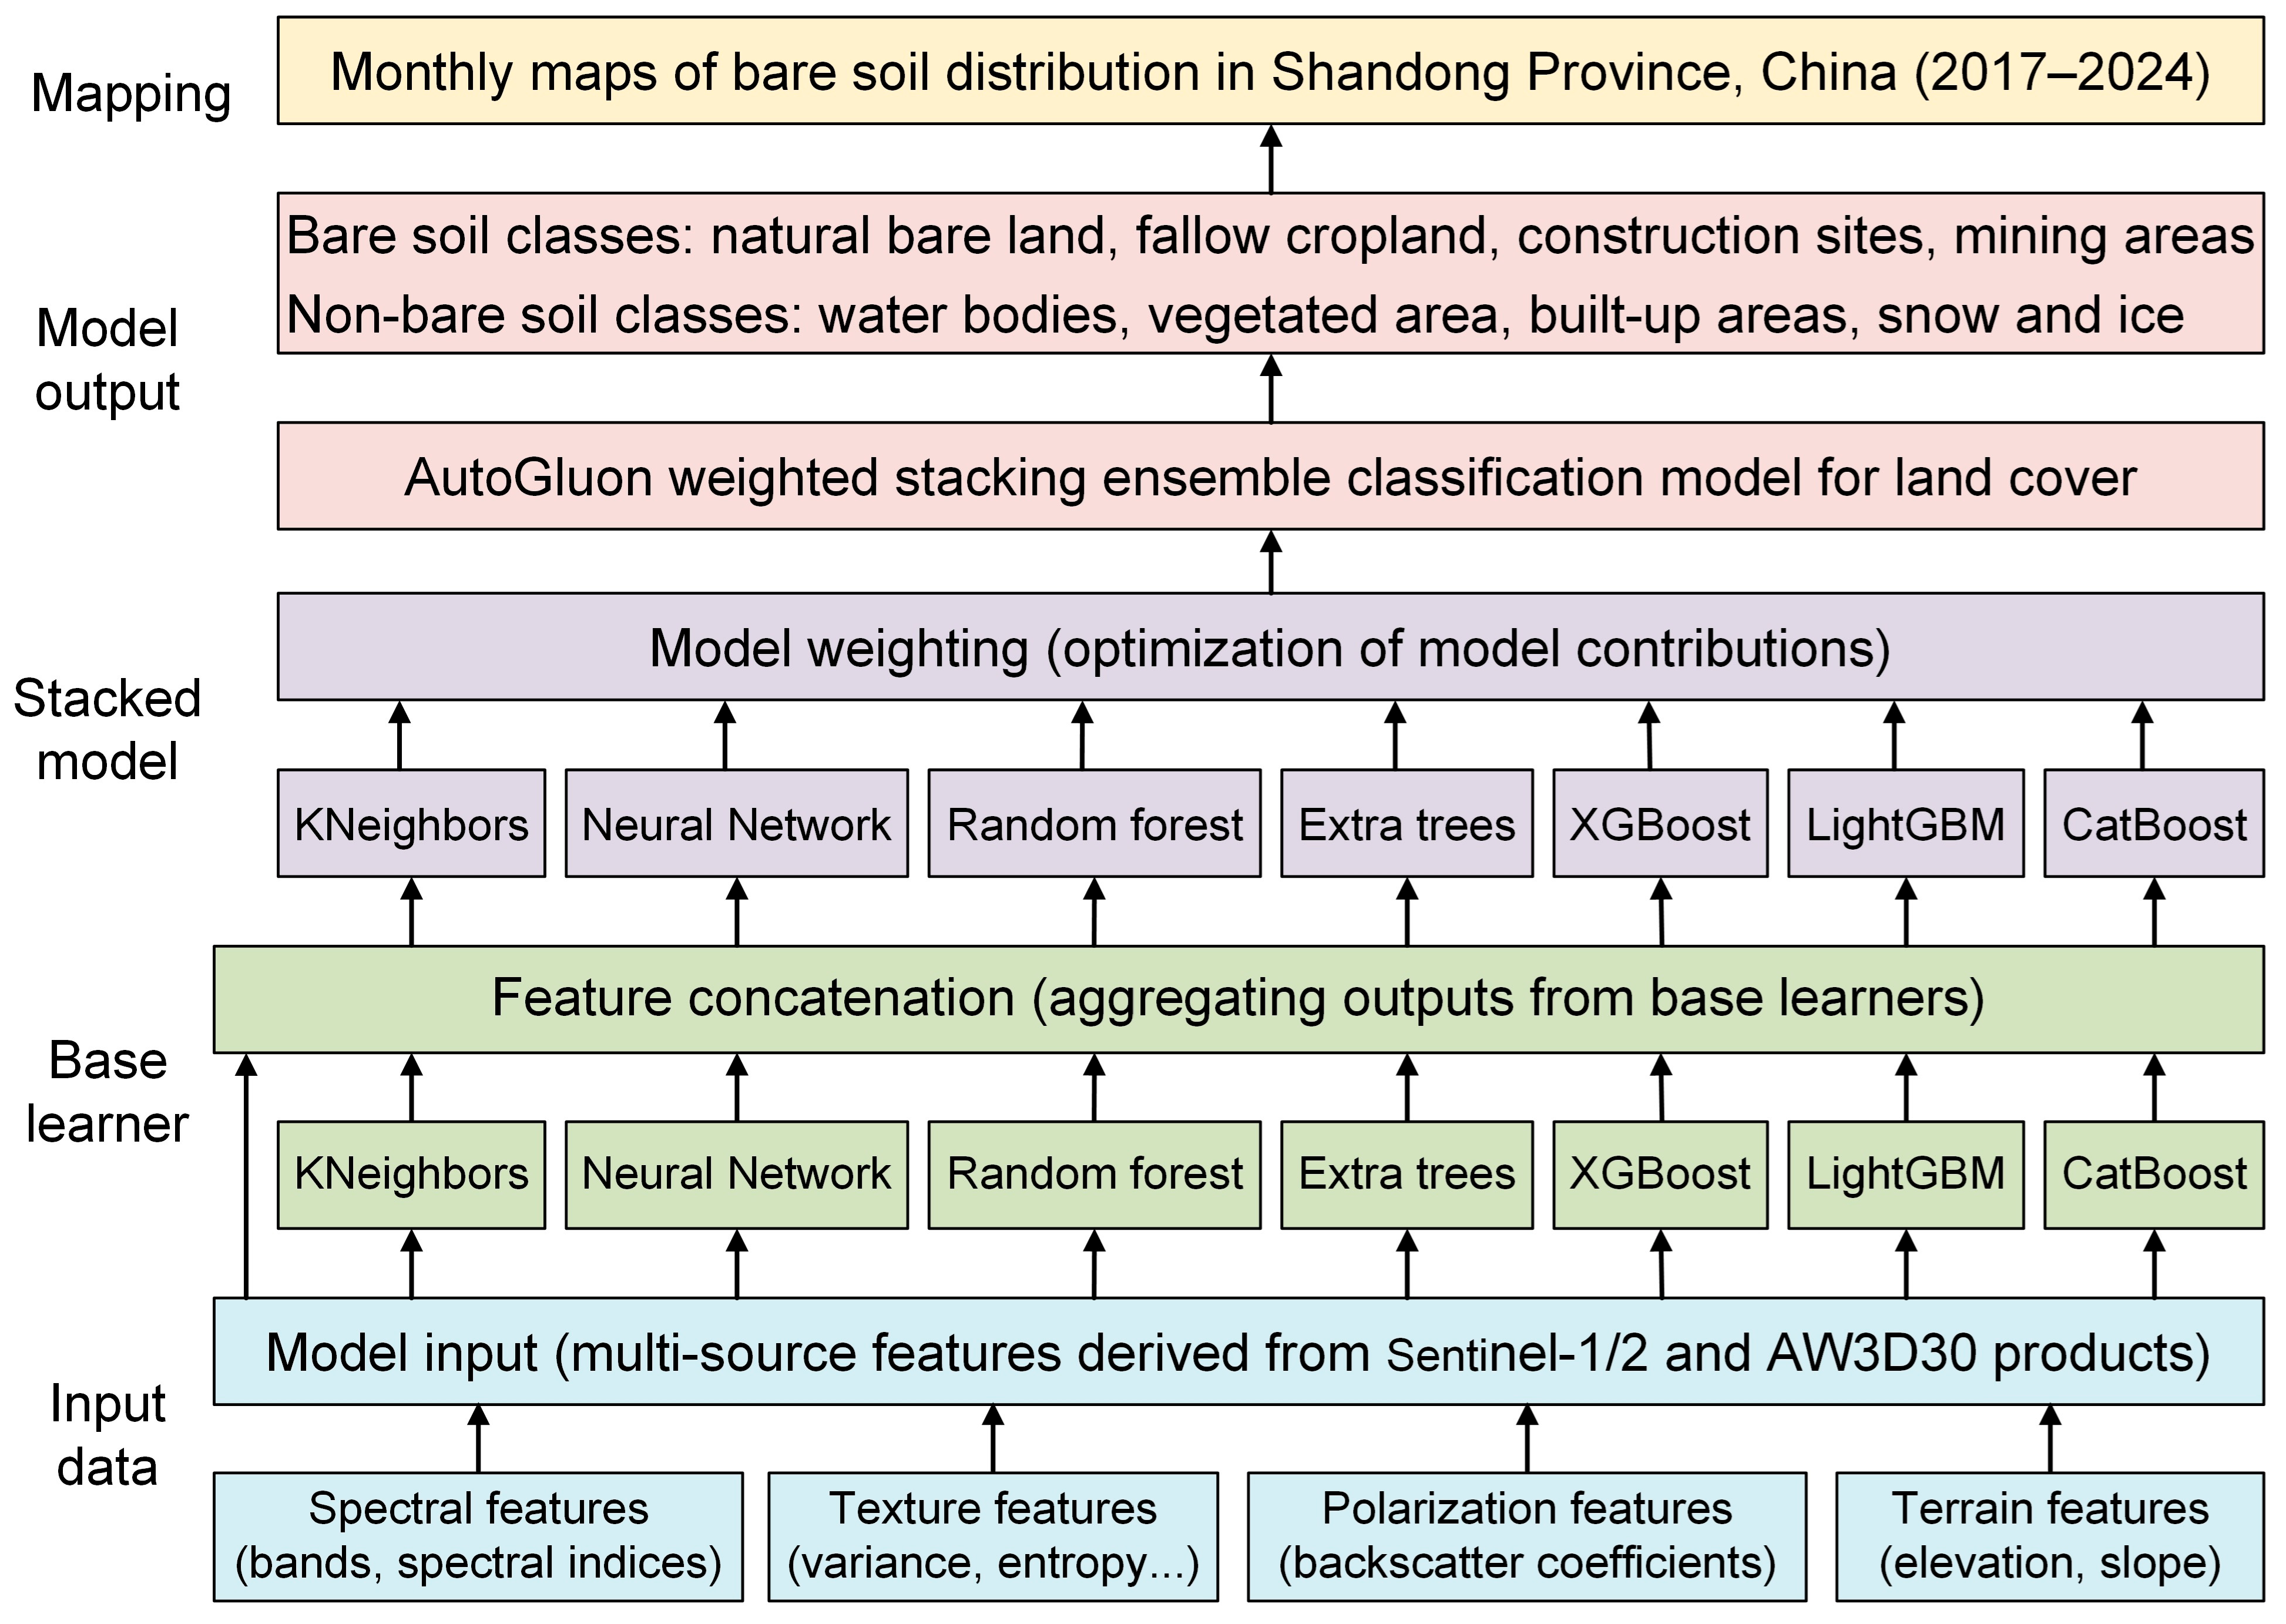
Unlike threshold-based indices or single-model classifiers commonly used in earlier work [23,29], our approach adopts an ensemble learning framework to improve generalization across heterogeneous surfaces and reduce instability. To generate monthly bare soil maps, we employed a supervised classification strategy using a stacking ensemble model built with the AutoGluon framework [39] (Figure 3). AutoGluon was selected because it offers a mature and automated framework for stacked ensemble learning, combining diverse built-in base learners with minimal manual tuning. The model integrates outputs from several base learners, including k-nearest neighbors, random forests [40], extremely randomized trees [41], neural networks [42], and three gradient boosting algorithms (XGBoost [43], LightGBM [44], and CatBoost [45]). These base learners are AutoGluon’s standard built-in models and were chosen as a robust default baseline. The stacked ensemble framework implemented in AutoGluon has been shown to efficiently handle heterogeneous input features and automatically optimize model configurations, yielding strong performance in remote sensing applications [46,47].
Input features were constructed from 35 remote sensing indicators derived from Sentinel-1/2 imagery and AW3D30 topographic data. Spectral features were derived from Sentinel-2 imagery, including reflectance values from all bands and multiple spectral indices, such as NDVI, Tasseled Cap indices [48], and red-edge-based vegetation indices [49]. To enhance discrimination between bare soil and urban surfaces, we included indices known for their sensitivity to built-up and disturbed areas, including the Normalized Difference Built-up Index (NDBI) [50], Built-up Index (BUI) [51], Normalized Difference Tillage Index (NDTI) [52], Bare Soil Index (BSI) [53], Enhanced Bare Soil Index (EBSI) [29], and the Normalized Difference Bare Soil Index (NDBSI) [54]. Texture metrics (entropy, energy, contrast, and correlation) were extracted from the NDBSI using a 3 × 3 gray-level co-occurrence matrix, as preliminary tests showed NDBSI to be the most effective index for distinguishing bare soil. Polarization features were derived from Sentinel-1 backscatter coefficients (VV, VH, and VH/VV ratio), while terrain variables included elevation, slope, and aspect extracted from the AW3D30 product.
Bare soil in this study refers to any land surface without vegetation cover, including both natural bare land and croplands temporarily exposed after harvest or before planting. Both types are treated as direct sources of wind erosion dust emissions, as they provide exposed surfaces vulnerable to deflation. To train the bare soil classification model, we manually labeled representative land surface samples covering typical land cover types. For each class, 500–1000 samples were selected to ensure sufficient spatial representation and intra-class variability. Bare soil samples included natural bare land, fallow croplands, construction sites, and mining areas, whereas non-bare samples comprised vegetated surfaces, built-up areas, water bodies, and snow or ice. Although all bare soil types belong to the same thematic class, they may exhibit notable differences in spectral and contextual features. To address this, individual bare soil subtypes were initially treated as separate classes during model training. This strategy enabled the model to learn subtype-specific patterns and reduce confusion. Subsequently, all subtypes were reclassified into a binary scheme (bare soil versus non-bare soil) to simplify prediction and reduce misclassification caused by within-class heterogeneity. Figure 4 presents examples of typical bare soil subtypes in Sentinel-2 imagery alongside their corresponding classification outputs. The dataset was randomly partitioned into training and validation subsets using an 80:20 split, resulting in approximately 4800 training samples and 1200 validation samples, with bare soil and non-bare soil accounting for about 3:5 of the total. This ensured that the validation set maintained a reasonably balanced sample composition. Accuracy was assessed using an independent validation set based on manual interpretation of Sentinel-2 imagery. Classification performance was further evaluated using overall accuracy (OA), Cohen’s kappa coefficient, precision, recall, and F1-score.
We constructed seven base learners and a meta-level stacking ensemble classifier using the AutoGluon framework (Figure 3). We utilized AutoGluon’s built-in optimization pipeline to automate hyperparameter tuning, allowing for efficient model training without manual intervention [55]. The training mode was set to “best_quality” to ensure optimal configuration. Five-fold cross-bagging (num_bag_folds = 5) was applied, with 80% of data used for model training and 20% for internal validation. The maximum training duration was limited to 3600 s. Multi-layer stacking was enabled (auto_stack = True), and the number of stacking layers was adjusted dynamically during the optimization process. After training, the model underwent iterative refinement to improve generalization and reduce redundancy. Feature importance was evaluated using AutoGluon’s internal ranking method, and multicollinearity was assessed using the variance inflation factor [56]. Features with low predictive power or high redundancy were excluded in successive iterations. This pruning and retraining cycle continued until convergence was reached, resulting in a stable, high-performing model with robust predictive capability for bare soil mapping. Final outputs were monthly maps of bare soil distribution at 10 m resolution for the study period.

2.3.3. Dust Emission Modeling with CLM5.0

Dust emissions were simulated using the wind erosion module embedded within the Community Land Model version 5.0 (CLM5.0) [38], developed by the National Center for Atmospheric Research as part of the Community Earth System Model. CLM5.0 is a process-based land surface model that formalizes the core concepts of eco-climatology and quantifies the coupled dynamics of energy, water, carbon, and aerosols across a range of spatial and temporal scales. Among its 28 component processes and submodules, the dust module describes the detachment, saltation, and vertical uplift of soil particles under near-surface wind stress, contributing to atmospheric mineral dust loading.
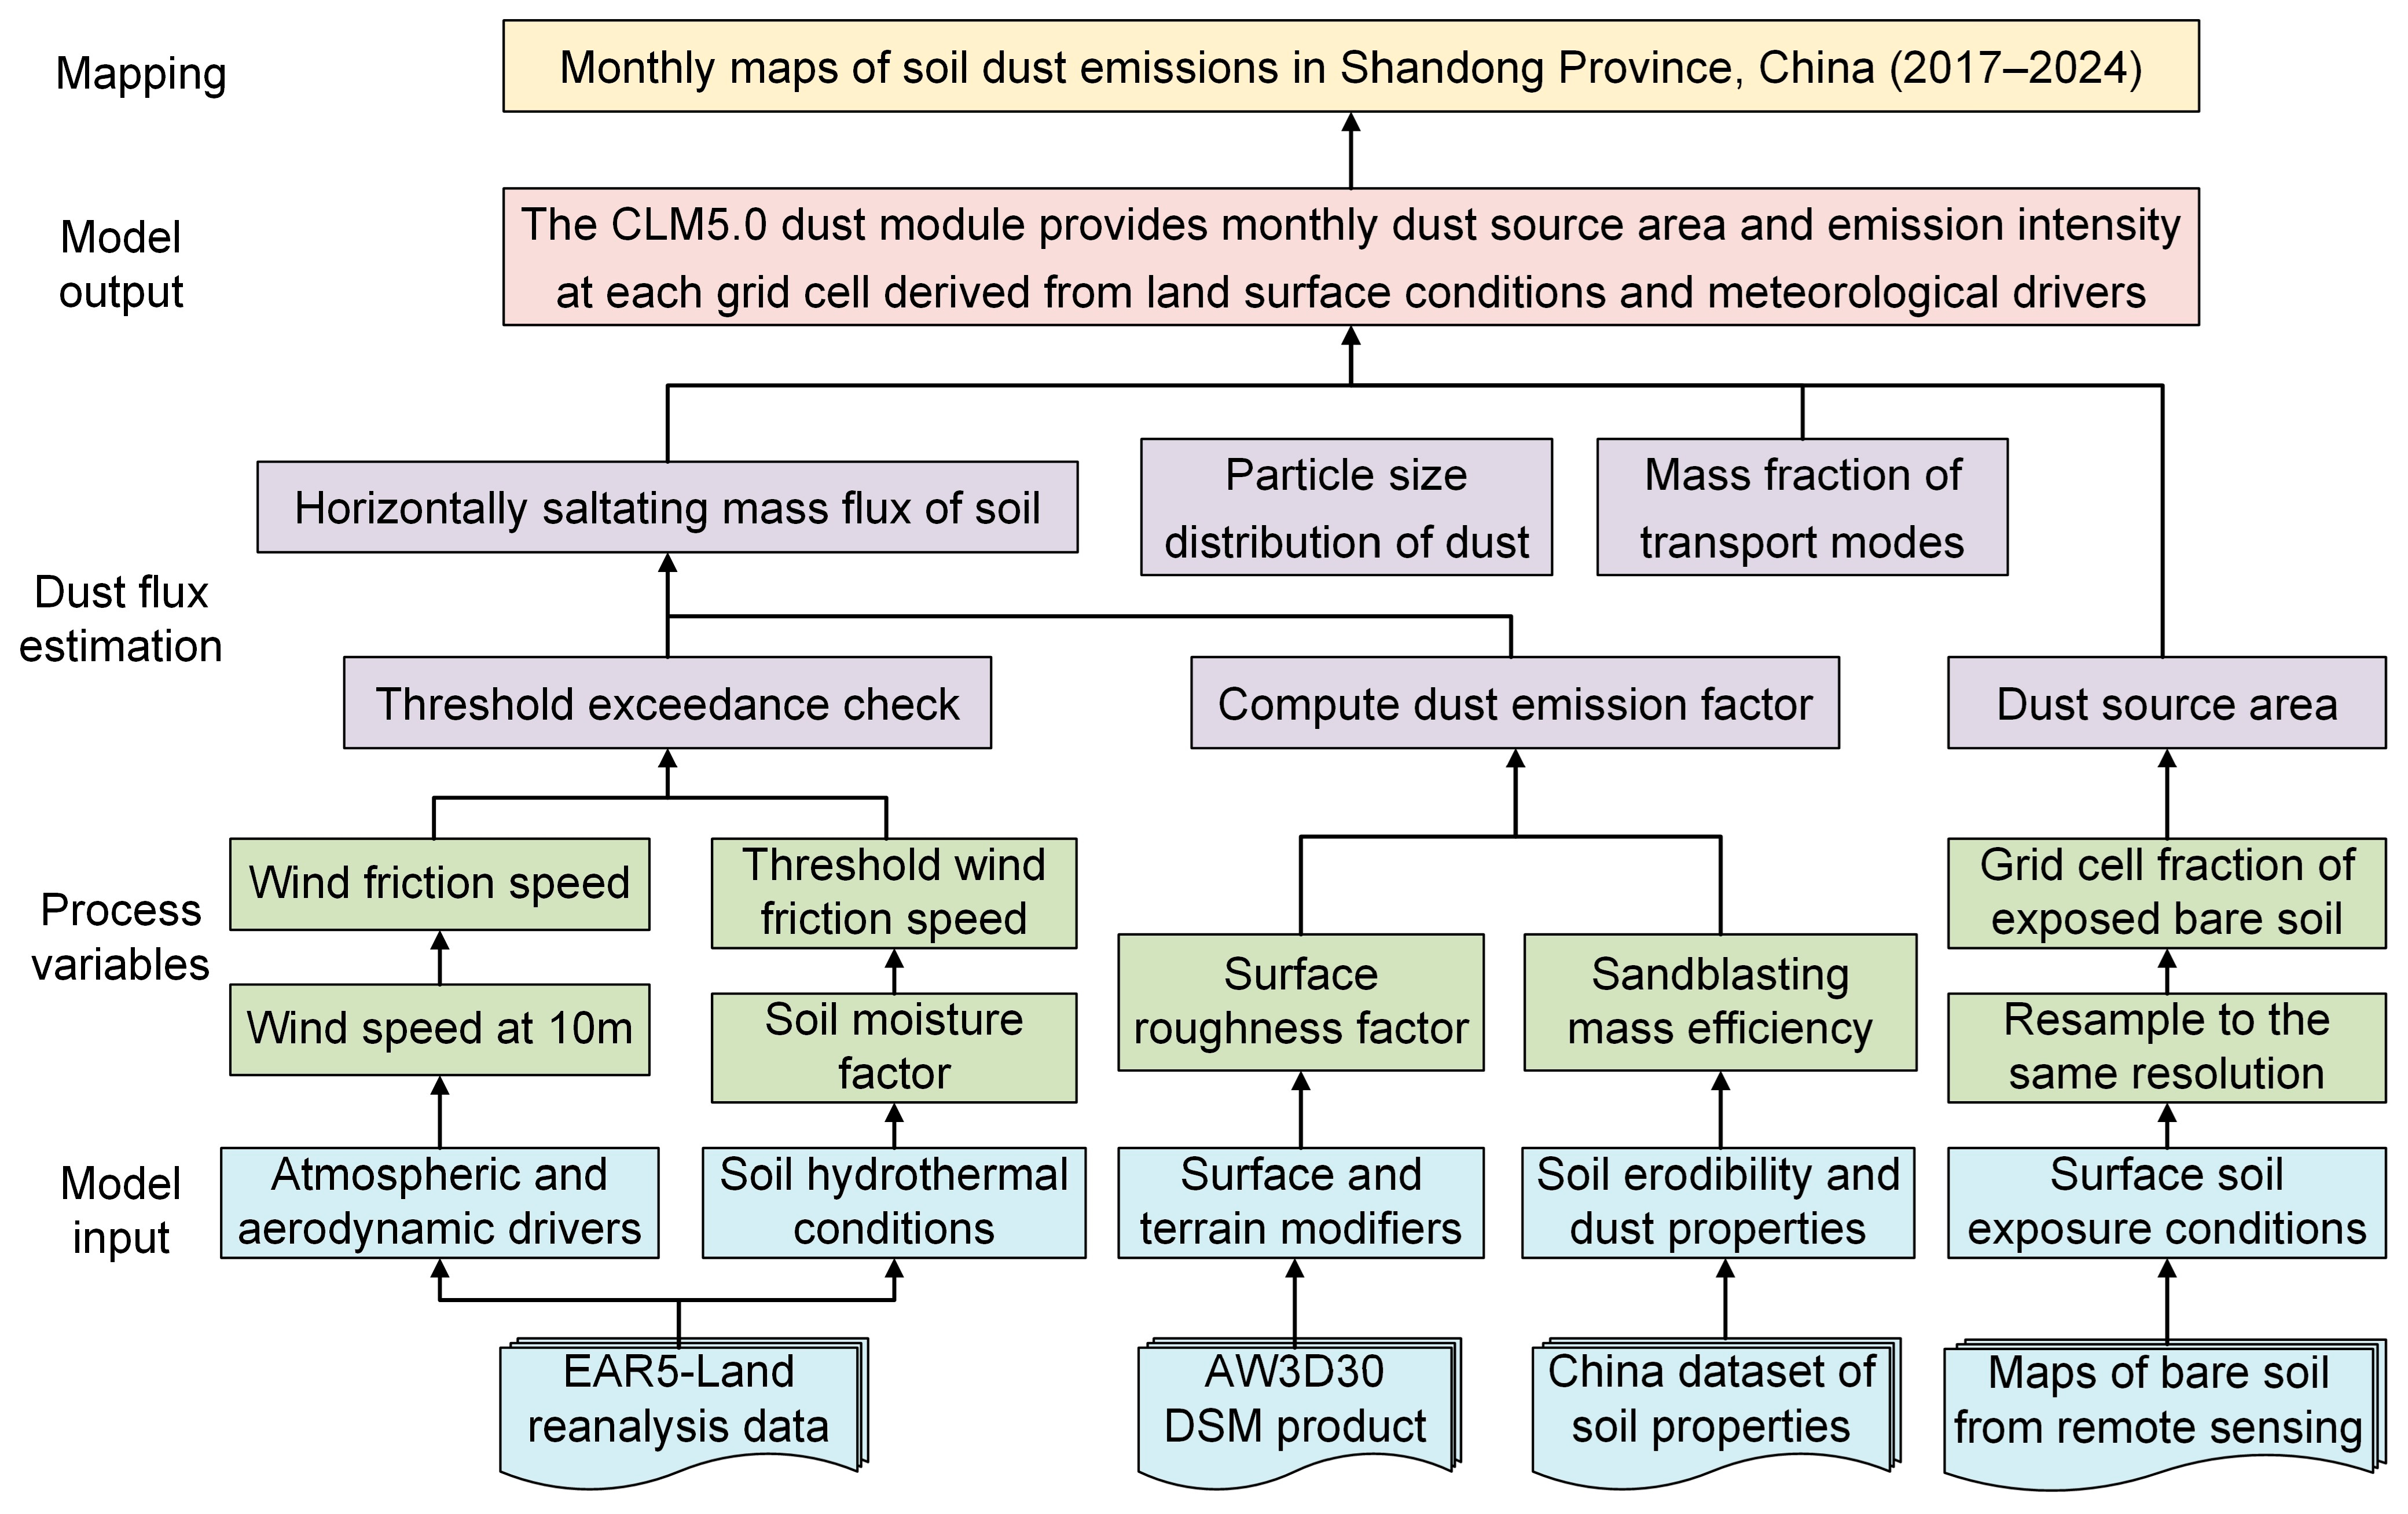
The dust module in CLM5.0 is adapted from the Dust Entrainment and Deposition model [57], which calculates horizontal saltation flux and vertical dust emission as functions of wind speed, soil moisture, surface roughness, and erodibility [58]. These drivers were derived from multiple sources: 10 m wind speed and soil moisture from ERA5-Land, surface roughness from the AW3D30 DSM, and soil texture and bulk density from the CSDLv2 dataset. The fraction of bare soil in each 1 km grid cell, obtained from our monthly classification maps, was used to define the spatial extent of potential dust source areas (Figure 5).
Dust fluxes were computed based on whether friction velocity exceeded a soil-specific threshold, which is dynamically adjusted for surface wetness. The model incorporates parameterizations of sandblasting efficiency and particle size distribution to estimate both the magnitude and granulometry of emitted dust. All equations and physical assumptions followed the CLM5.0 technical documentation, which outlines the full diagnostic framework for dust emission and deposition processes (see CLM5.0 Technical Note [59]). Previous studies have demonstrated the model’s effectiveness across diverse environments [60,61,62]. By coupling satellite-derived bare soil data with high-resolution climate and terrain inputs, this physically grounded modeling framework enables mechanistic attribution of dust emissions under varying environmental and land use conditions, supporting spatially explicit assessment of source strength and seasonal dynamics.

3. Results

3.1. Accuracy Evaluation and Feature Importance for Bare Soil Classification

The classification results based on validation samples from all years (2017–2024) indicate clear performance differences across algorithms, with overall accuracy ranging from 0.81 to 0.93 and Cohen’s kappa values from 0.62 to 0.86 (Table 1). The ensemble model achieved the highest performance (OA = 0.93, kappa = 0.86), slightly surpassing the best base learner CatBoost (OA = 0.92, kappa = 0.85), followed closely by XGBoost (OA = 0.92) and LightGBM (OA = 0.91). Neural networks, random forests, and extremely randomized trees performed slightly worse, with OA between 0.89 and 0.90. The KNN classifier had the weakest performance (OA = 0.81, kappa = 0.62), confirming its limited capability in high-dimensional classification tasks involving spectrally mixed classes. This weakness is further explained by the spectral similarity between bare soil and impervious surfaces, which reduces the separability of classes when using instance-based approaches like KNN. The ensemble model’s slight advantage in accuracy was accompanied by lower misclassification, supporting its effectiveness in handling heterogeneous inputs [55].
Despite the generally high overall accuracy, all models exhibited higher precision than recall (Table 1), indicating a tendency to underdetect bare soil (i.e., bare soil pixels were more likely to be misclassified as non-bare soil than the reverse). This asymmetry reflects the spectral complexity of certain bare surfaces and suggests that omission errors were more frequent than commission errors. Such omission errors may cause slight underestimation of bare soil extent, which has implications for dust emission modeling and land degradation assessment.
In comparison with earlier approaches that used threshold-based classification on remote sensing indices or relied on a single machine learning model [23,29,52], our method achieves significantly higher accuracy and greater classification stability. For example, Liu et al. [23] applied a decision tree classifier using EBSI and reported an overall accuracy of 0.86 and a kappa of 0.71. Ettehadi et al. [52] used a support vector machine model for land cover mapping, where the bare land category achieved a producer’s accuracy ranging from 21.13% to 92.90% and a user’s accuracy from 22.73% to 92.11%. By comparison, our stacking ensemble reached an overall accuracy of 0.93 and a kappa of 0.86, underscoring the advantage of combining multiple learners with diverse predictors. The improvements here stem from two aspects: first, the stacking ensemble effectively integrates diverse base learners and leverages their individual strengths; second, the model benefits from a carefully selected combination of predictors capturing key spectral, polarimetric, textural, and topographic features relevant to bare soil identification.
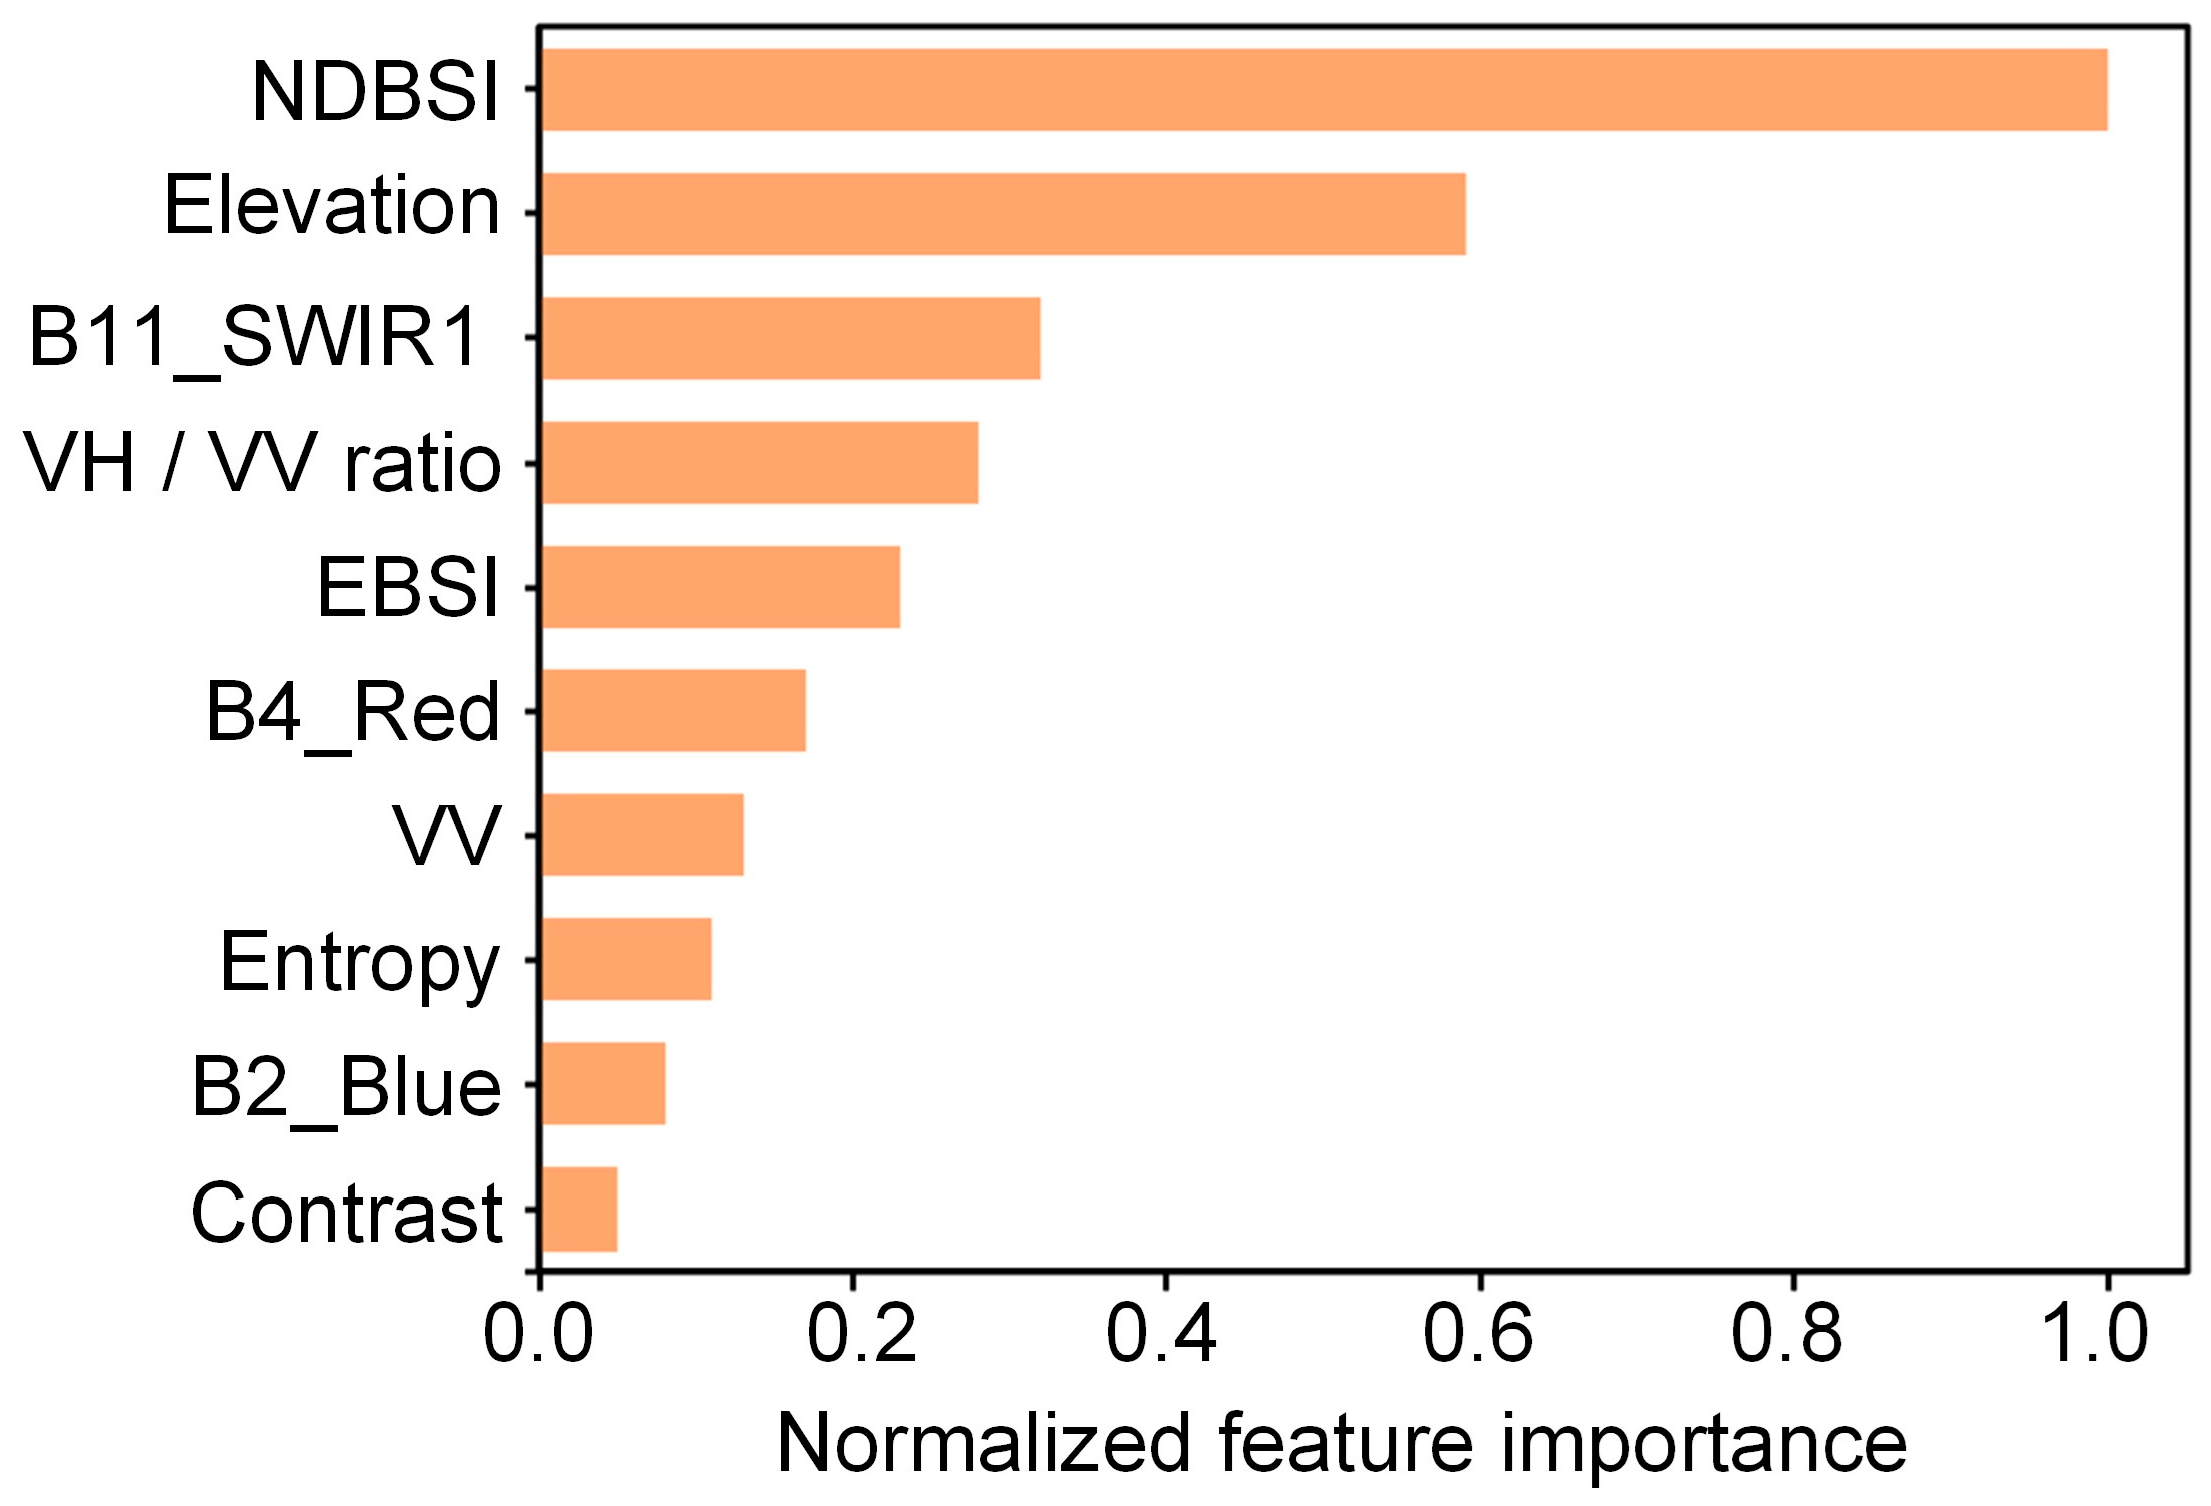
Among all input variables, NDBSI ranked highest in importance (Figure 6), confirming its effectiveness as a robust spectral indicator of exposed soil surfaces. This is because NDBSI minimizes confusion with vegetation and impervious surfaces, making it especially suitable for intensively cultivated landscapes where seasonal transitions are frequent [54]. Elevation ranked second in importance, which reflects the fact that bare soil in Shandong is concentrated in low-lying riverine and coastal plains such as the Yellow River Delta, where both hydrological processes and soil salinity constrain vegetation growth. The SWIR band (B11) was also highly important because of its sensitivity to soil moisture, a key control on surface reflectance and erodibility. Polarimetric ratios from Sentinel-1 (VH/VV) and VV backscatter contributed by capturing dielectric contrasts between moist vegetated surfaces and drier bare soils. EBSI and the red band (B4) helped distinguish disturbed soils and sparsely vegetated land, while texture features from NDBSI (entropy and contrast) quantified spatial heterogeneity that often accompanies fragmented bare patches in cropland and coastal zones. The inclusion of these complementary indicators enhanced classification robustness and reduced misclassification, demonstrating the value of ensemble learning and multi-source feature integration for high-resolution bare soil mapping.

3.2. Spatiotemporal Patterns of Bare Soil Exposure in Shandong Province

Based on the monthly classification results produced by our optimized ensemble model, we quantified the spatiotemporal dynamics of bare soil exposure across Shandong Province from 2017 to 2024. The time series clearly exhibits strong seasonal fluctuations in bare soil area (Figure 7), with consistent peaks in winter and early spring (December to March), and pronounced troughs in summer (July and August). The seasonal pattern of bare soil exposure aligns with the prevailing agricultural calendar in Shandong Province, which is dominated by a winter wheat–summer maize rotation [63]. Winter wheat is generally sown in October and harvested in early June, followed by the planting of summer maize in mid-June and its harvest around early October. As a result, large areas of cropland are left bare from late autumn through early spring, particularly during early stages of winter crop growth or when fields are temporarily fallow.
Overall, annual mean bare soil area remained relatively stable over the eight-year period, with no evident long-term increasing or decreasing trend. During peak months, bare soil area can exceed 25,000 km2, accounting for over 15% of the provincial territory. This proportion is substantially higher than the 6.4% bare land fraction reported by the ESA WorldCover dataset (Figure 1), which reflects the limitations of static land cover products in capturing seasonal soil exposure. This discrepancy underscores the need for high-temporal-resolution monitoring to support accurate dust source identification and surface process modeling. In addition, compared with MODIS bare soil products, our classification maps provide much finer spatial resolution (10 m vs. 1000 m), further highlighting the advantage of the proposed mapping approach.
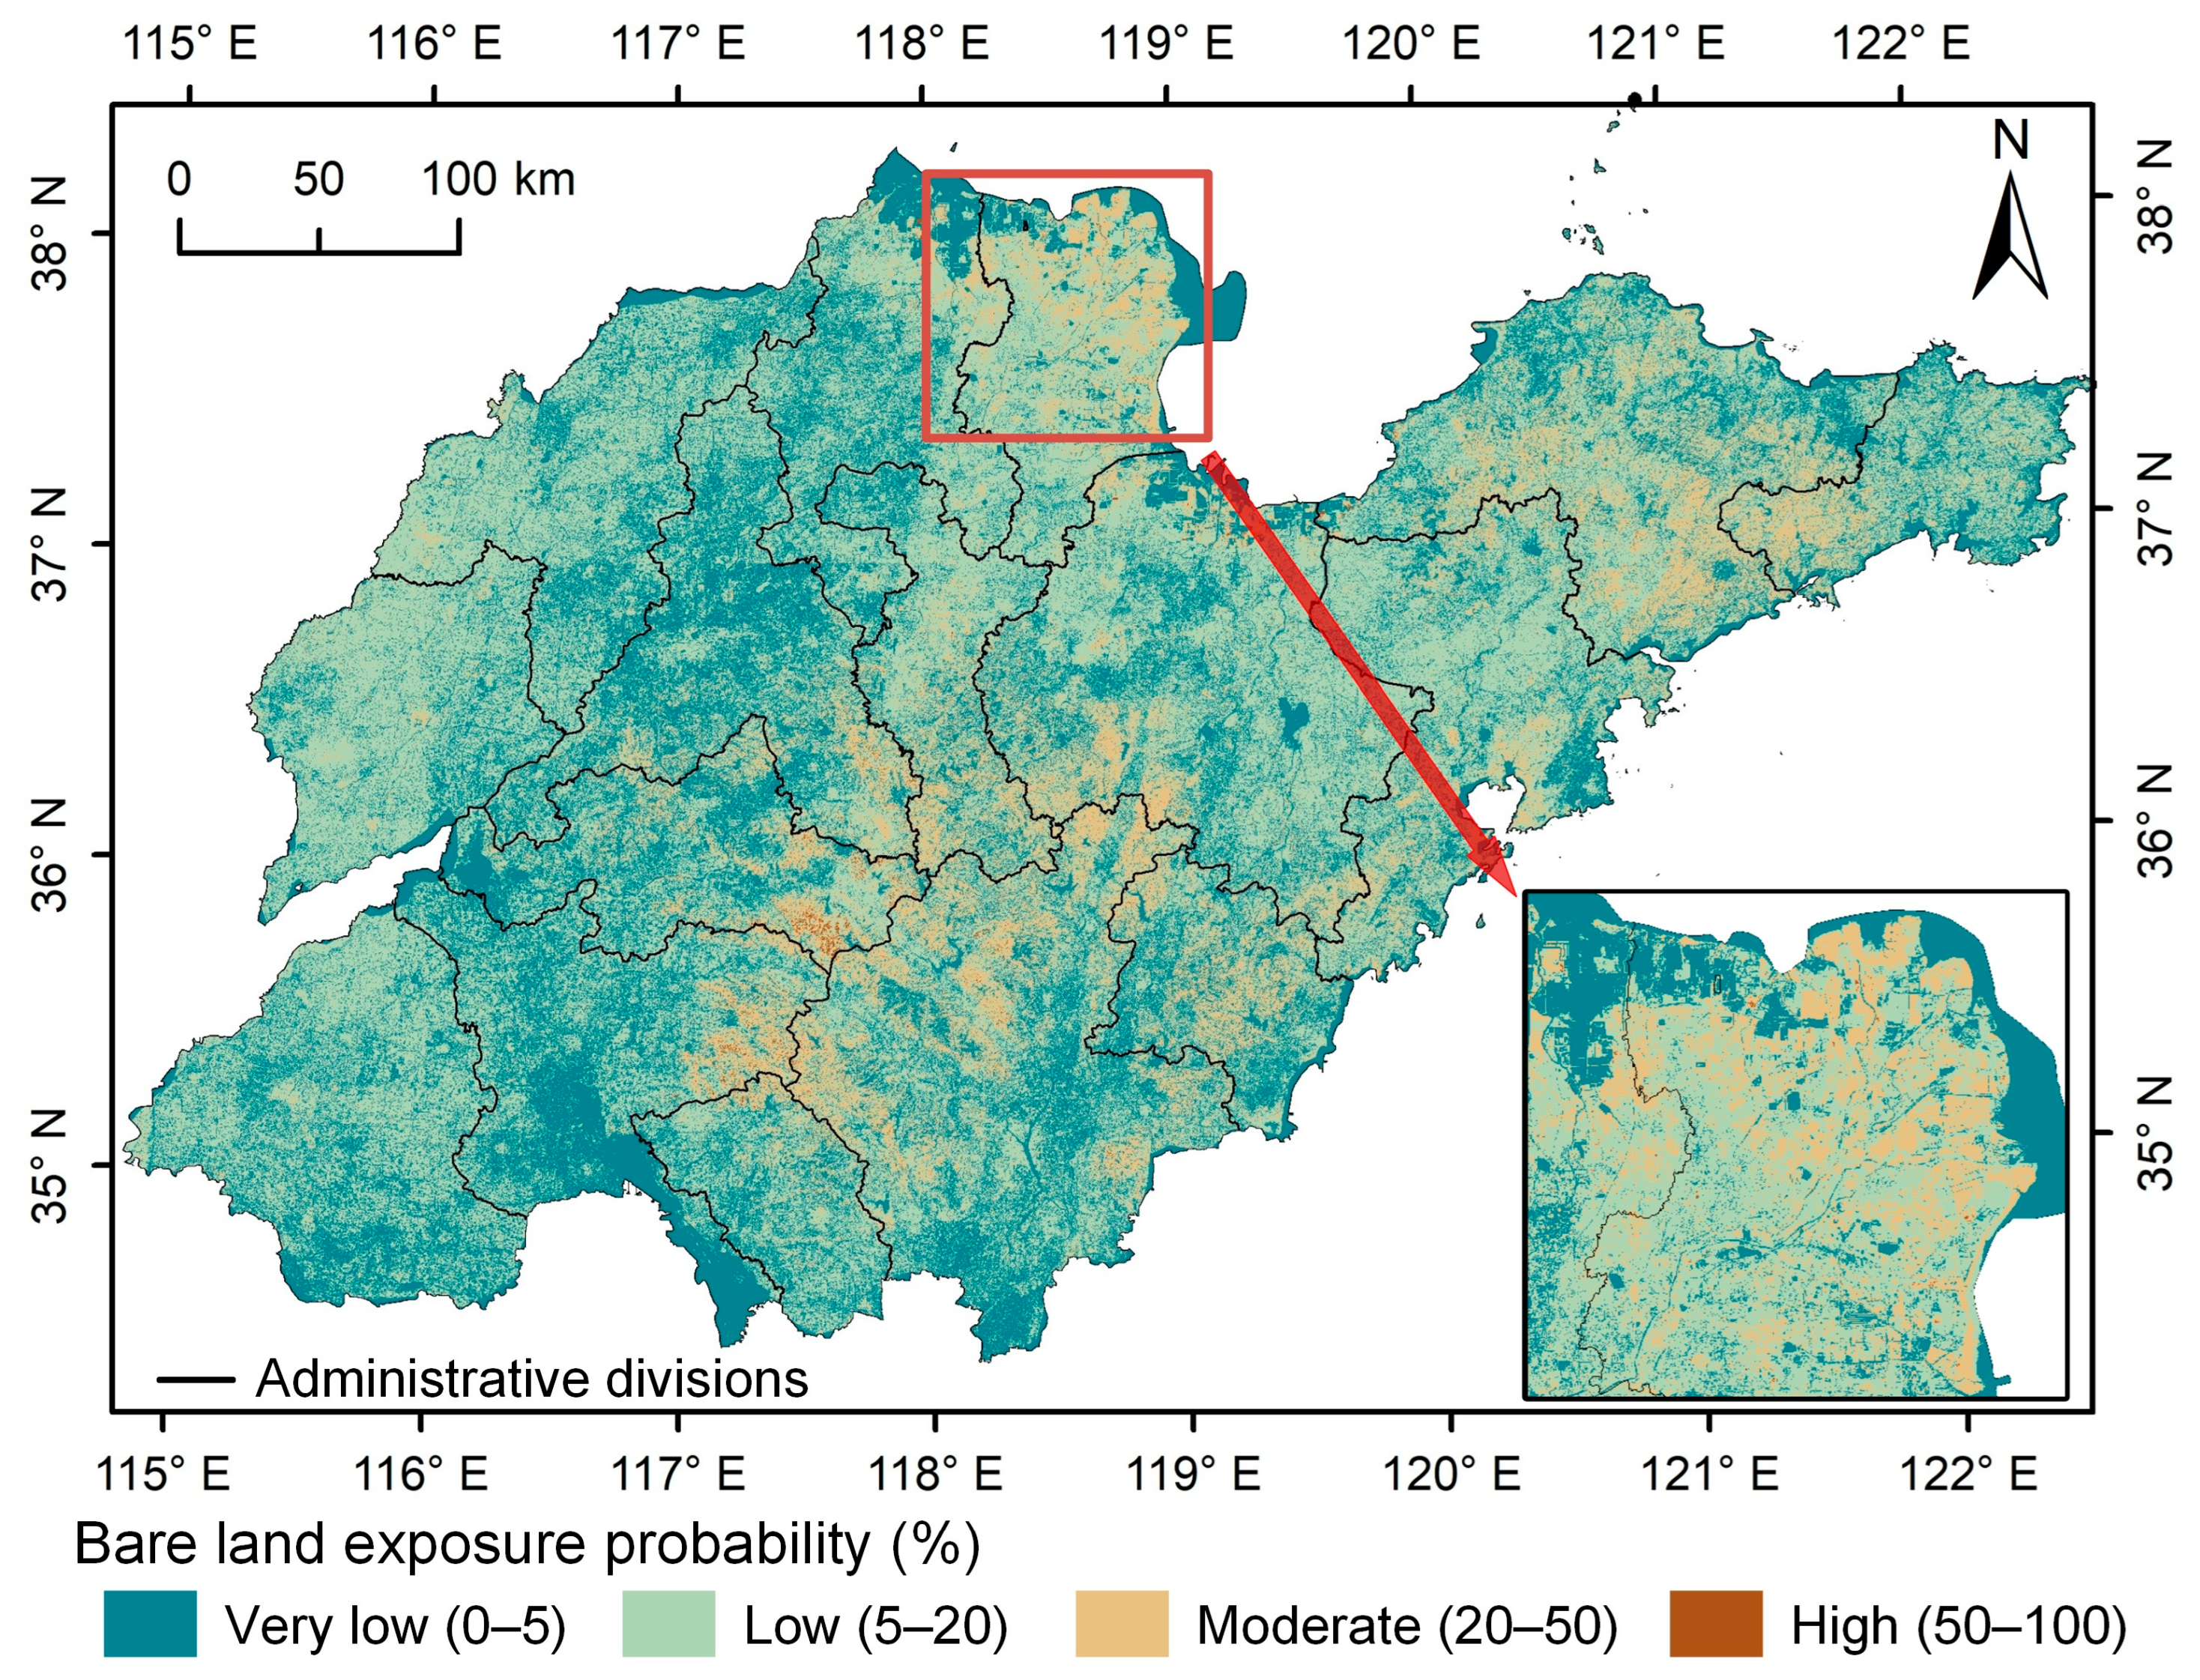
The spatial distribution of bare soil occurrence probability demonstrates marked regional heterogeneity across Shandong Province (Figure 8). Relatively high exposure frequencies (>20%) are most prominent in several distinct areas. In the Yellow River Delta and the adjacent northern coastal plains, seasonal exposure is widespread, likely influenced by active hydrological processes and the extensive presence of floodplain landscapes. In addition to hydrological activity, the saline–alkaline soils common in these coastal zones may further suppress vegetation growth [64], resulting in persistent bare surfaces. In central Shandong, elevated terrains such as the Tai-Yi mountain region exhibit frequent seasonal exposure on terraced agricultural slopes, particularly during non-growing periods. The eastern coastal areas of the Jiaodong Peninsula also show moderate exposure, possibly driven by coastal farming practices and fragmented vegetation cover.
Figure 9 illustrates the monthly variation in bare soil area alongside three key climatic variables: wind speed, precipitation, and temperature. A correlation analysis showed that bare soil area is significantly and negatively correlated with temperature (R = −0.90, p < 0.05) and precipitation (R = −0.65, p < 0.05), with highest exposure during the coldest and driest months when vegetation growth is minimal. Precipitation exhibits strong seasonality, with peak rainfall during the summer monsoon and minimal precipitation in winter, contributing to drier soil conditions during high-exposure periods. No significant correlation was found with monthly mean wind speed, which remains relatively stable throughout the year; rather, wind contributes directly to dust emissions through the erosion equations when bare surfaces are exposed. These findings confirm that the patterns visible in the plotted data reflect the ecological controls of vegetation growth cycles on soil exposure, while wind acts mainly as a driver of emission intensity.
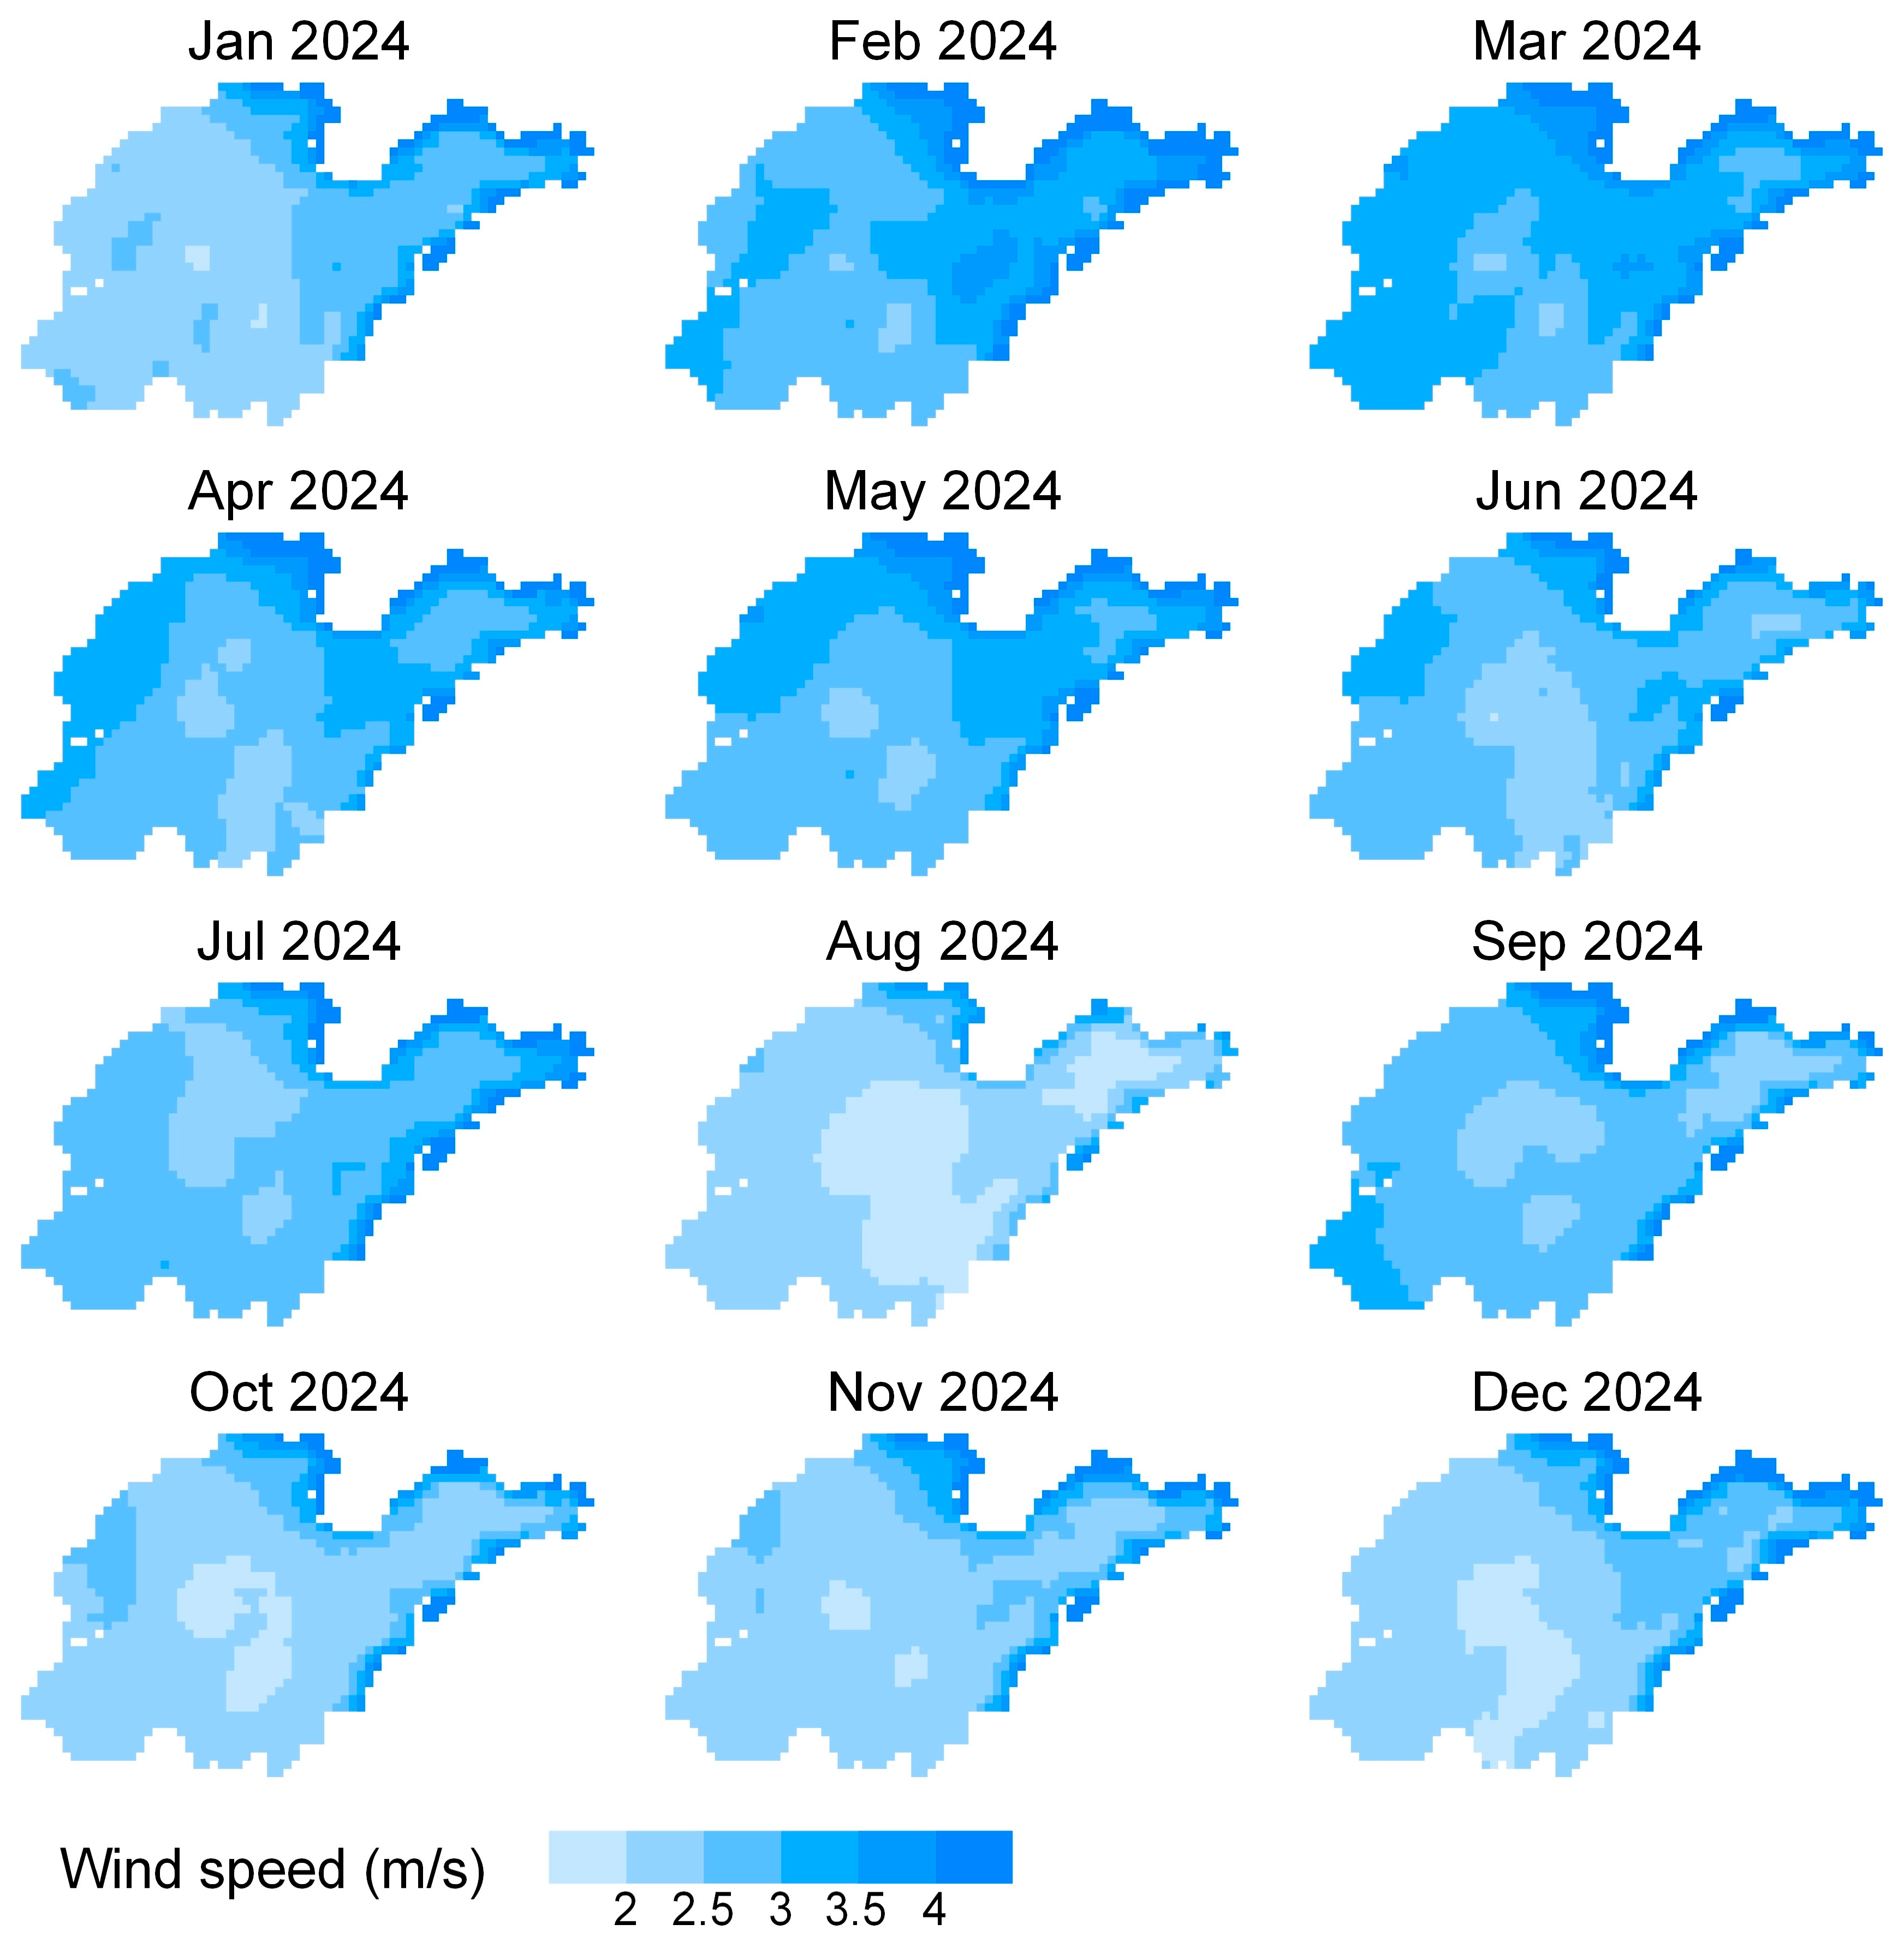
While seasonal variation in monthly mean wind speed is limited (Figure 9), the spatial distribution of wind conditions in Figure 10 reveals clear heterogeneity across the province. Coastal regions, particularly those bordering the Bohai Sea and northern Shandong, consistently experience stronger winds throughout the year. In contrast, inland areas in southwestern and central Shandong are characterized by comparatively low wind speeds. When combined with the spatial distribution of bare soil exposure, this wind pattern highlights specific regions such as the Yellow River Delta and the Jiaodong coastal zone as key areas prone to wind erosion. These zones combine high exposure probability with persistent wind activity, increasing their susceptibility to aeolian dust emissions and highlighting the need for regionally targeted dust mitigation efforts.

3.3. Spatiotemporal Patterns of Wind Erosion-Induced PM10 Emissions in Shandong Province

Using the CLM5.0 dust emission module, we estimated monthly PM10 emissions from wind erosion across Shandong Province for the period 2017–2024. The model was driven by our monthly bare soil classification results, combined with climate reanalysis, terrain, and soil property data to account for key environmental controls on erosion potential. Emissions of PM2.5 and total suspended particulate matter are not explicitly presented here, as they follow fixed mass ratios relative to PM10 based on source-specific particle size distributions [59]. This section focuses on the spatiotemporal characteristics of PM10 emissions, which are typically regarded as a primary indicator of dust-related air quality impacts.
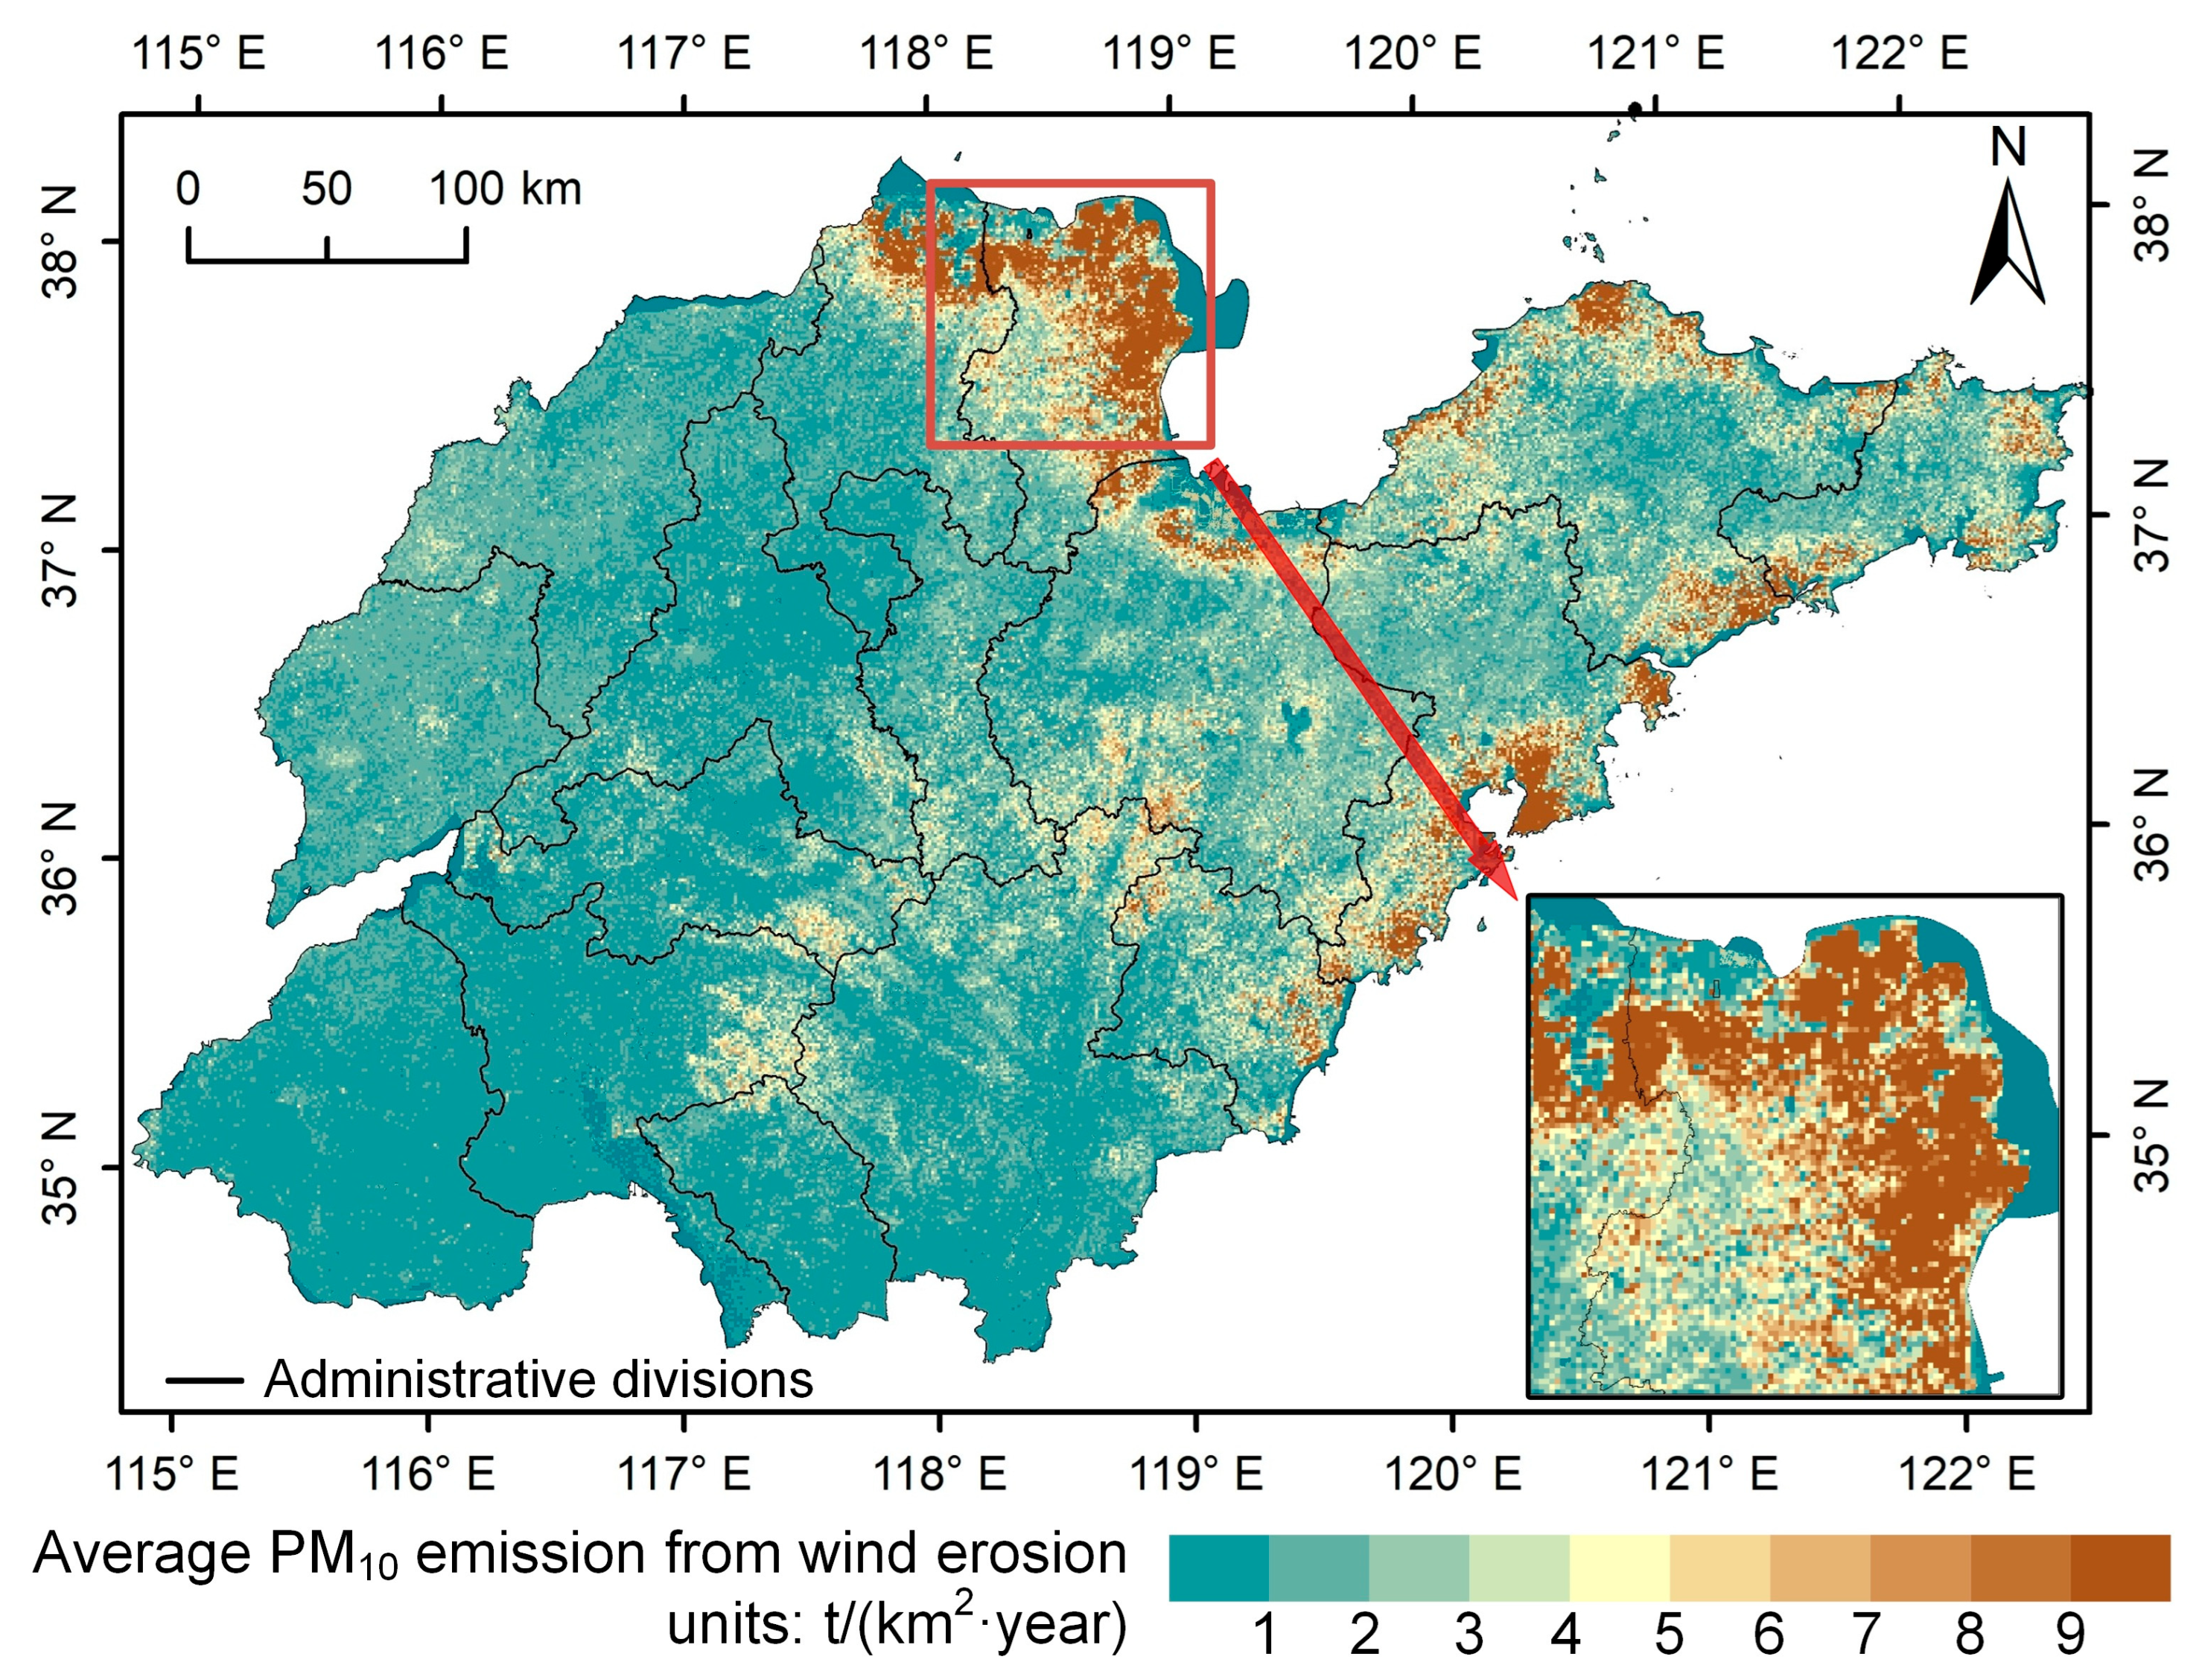
Figure 11 presents the spatial distribution of average PM10 emissions from wind erosion across Shandong Province during 2017–2024. While certain inland mountainous regions exhibit relatively high frequencies of bare soil exposure (as shown in Figure 8), their overall wind erosion intensity remains moderate. This is mainly attributed to lower prevailing wind speeds and the buffering effects of complex topography, which reduce near-surface wind stress and limit dust mobilization. In contrast, coastal regions such as the Yellow River Delta and adjacent saline–alkali lands, where poor soil structure and limited vegetation cover amplify surface erodibility, show substantially higher levels of PM10 emissions. The combination of extensive bare soil coverage, persistent strong winds, flat terrain, and loose surface materials makes these regions the important contributors to wind-driven dust emissions in Shandong Province.
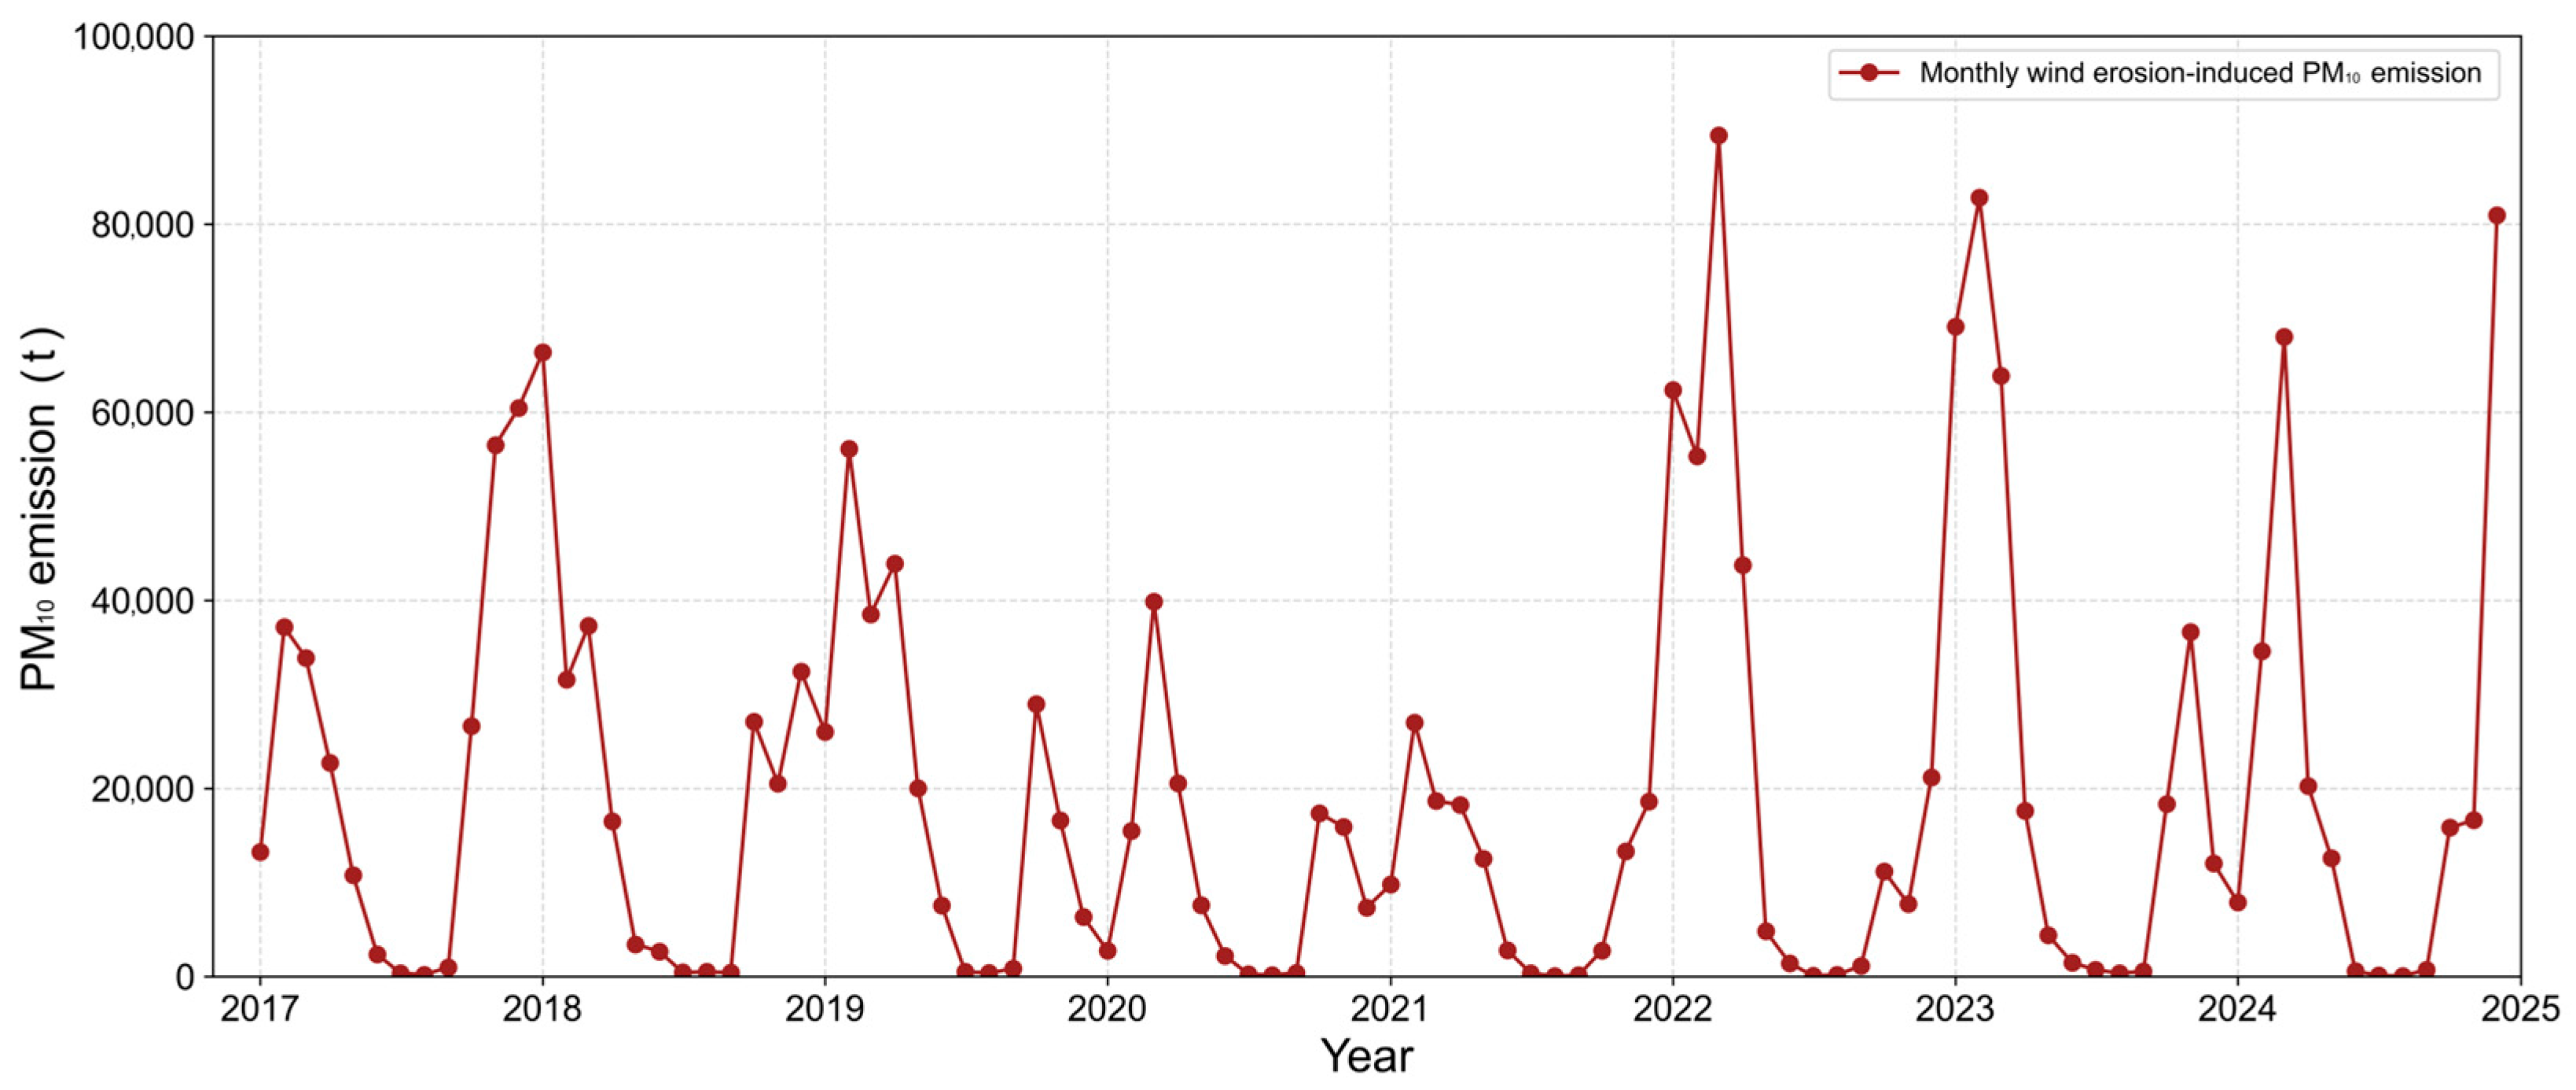
The temporal variation in monthly PM10 emissions across Shandong Province from 2017 to 2024 (Figure 12) shows significant intra-annual and inter-annual fluctuations. Compared with the relatively consistent seasonal pattern of bare soil area (Figure 7), wind erosion-induced emissions exhibit much greater variability. This difference reflects the episodic nature of wind erosion, where emissions are highly sensitive to short-term wind extremes. A correlation analysis between monthly mean wind speed and monthly dust emissions did not yield a statistically significant relationship (p > 0.05). This likely reflects the effect of temporal and spatial averaging, since both variables were aggregated to monthly means at the provincial scale, which tends to obscure short-lived high-wind events that drive most emission pulses. Importantly, the dependence of wind erosion dust emissions on wind speed is already explicitly incorporated in the CLM5.0 formulation [59], where emissions are parameterized as increasing approximately with the cube of near-surface wind speed, consistent with previous wind erosion models such as WEQ [26]. From 2017 to 2024, the annual emissions ranged from a low of 1.24 × 10⁵ tons in 2021 to a peak of 4.60 × 10⁵ tons in 2023. The mean value across the eight-year period was approximately 2.72 × 10⁵ tons, with a standard deviation of 1.09 × 10⁵ tons. Since 2022, monthly PM10 emissions have shown a clear increase compared to the levels observed during 2017–2021. This increase was likely driven by changes in climatic conditions, particularly the rising frequency of strong winds during the period of bare soil exposure, as indicated by ERA5-Land daily wind speed data, which show an increasing tendency in coastal areas during recent winters and springs. These results suggest that climate variability is intensifying the risk of wind erosion, underscoring the need to strengthen dust control efforts in key source regions.
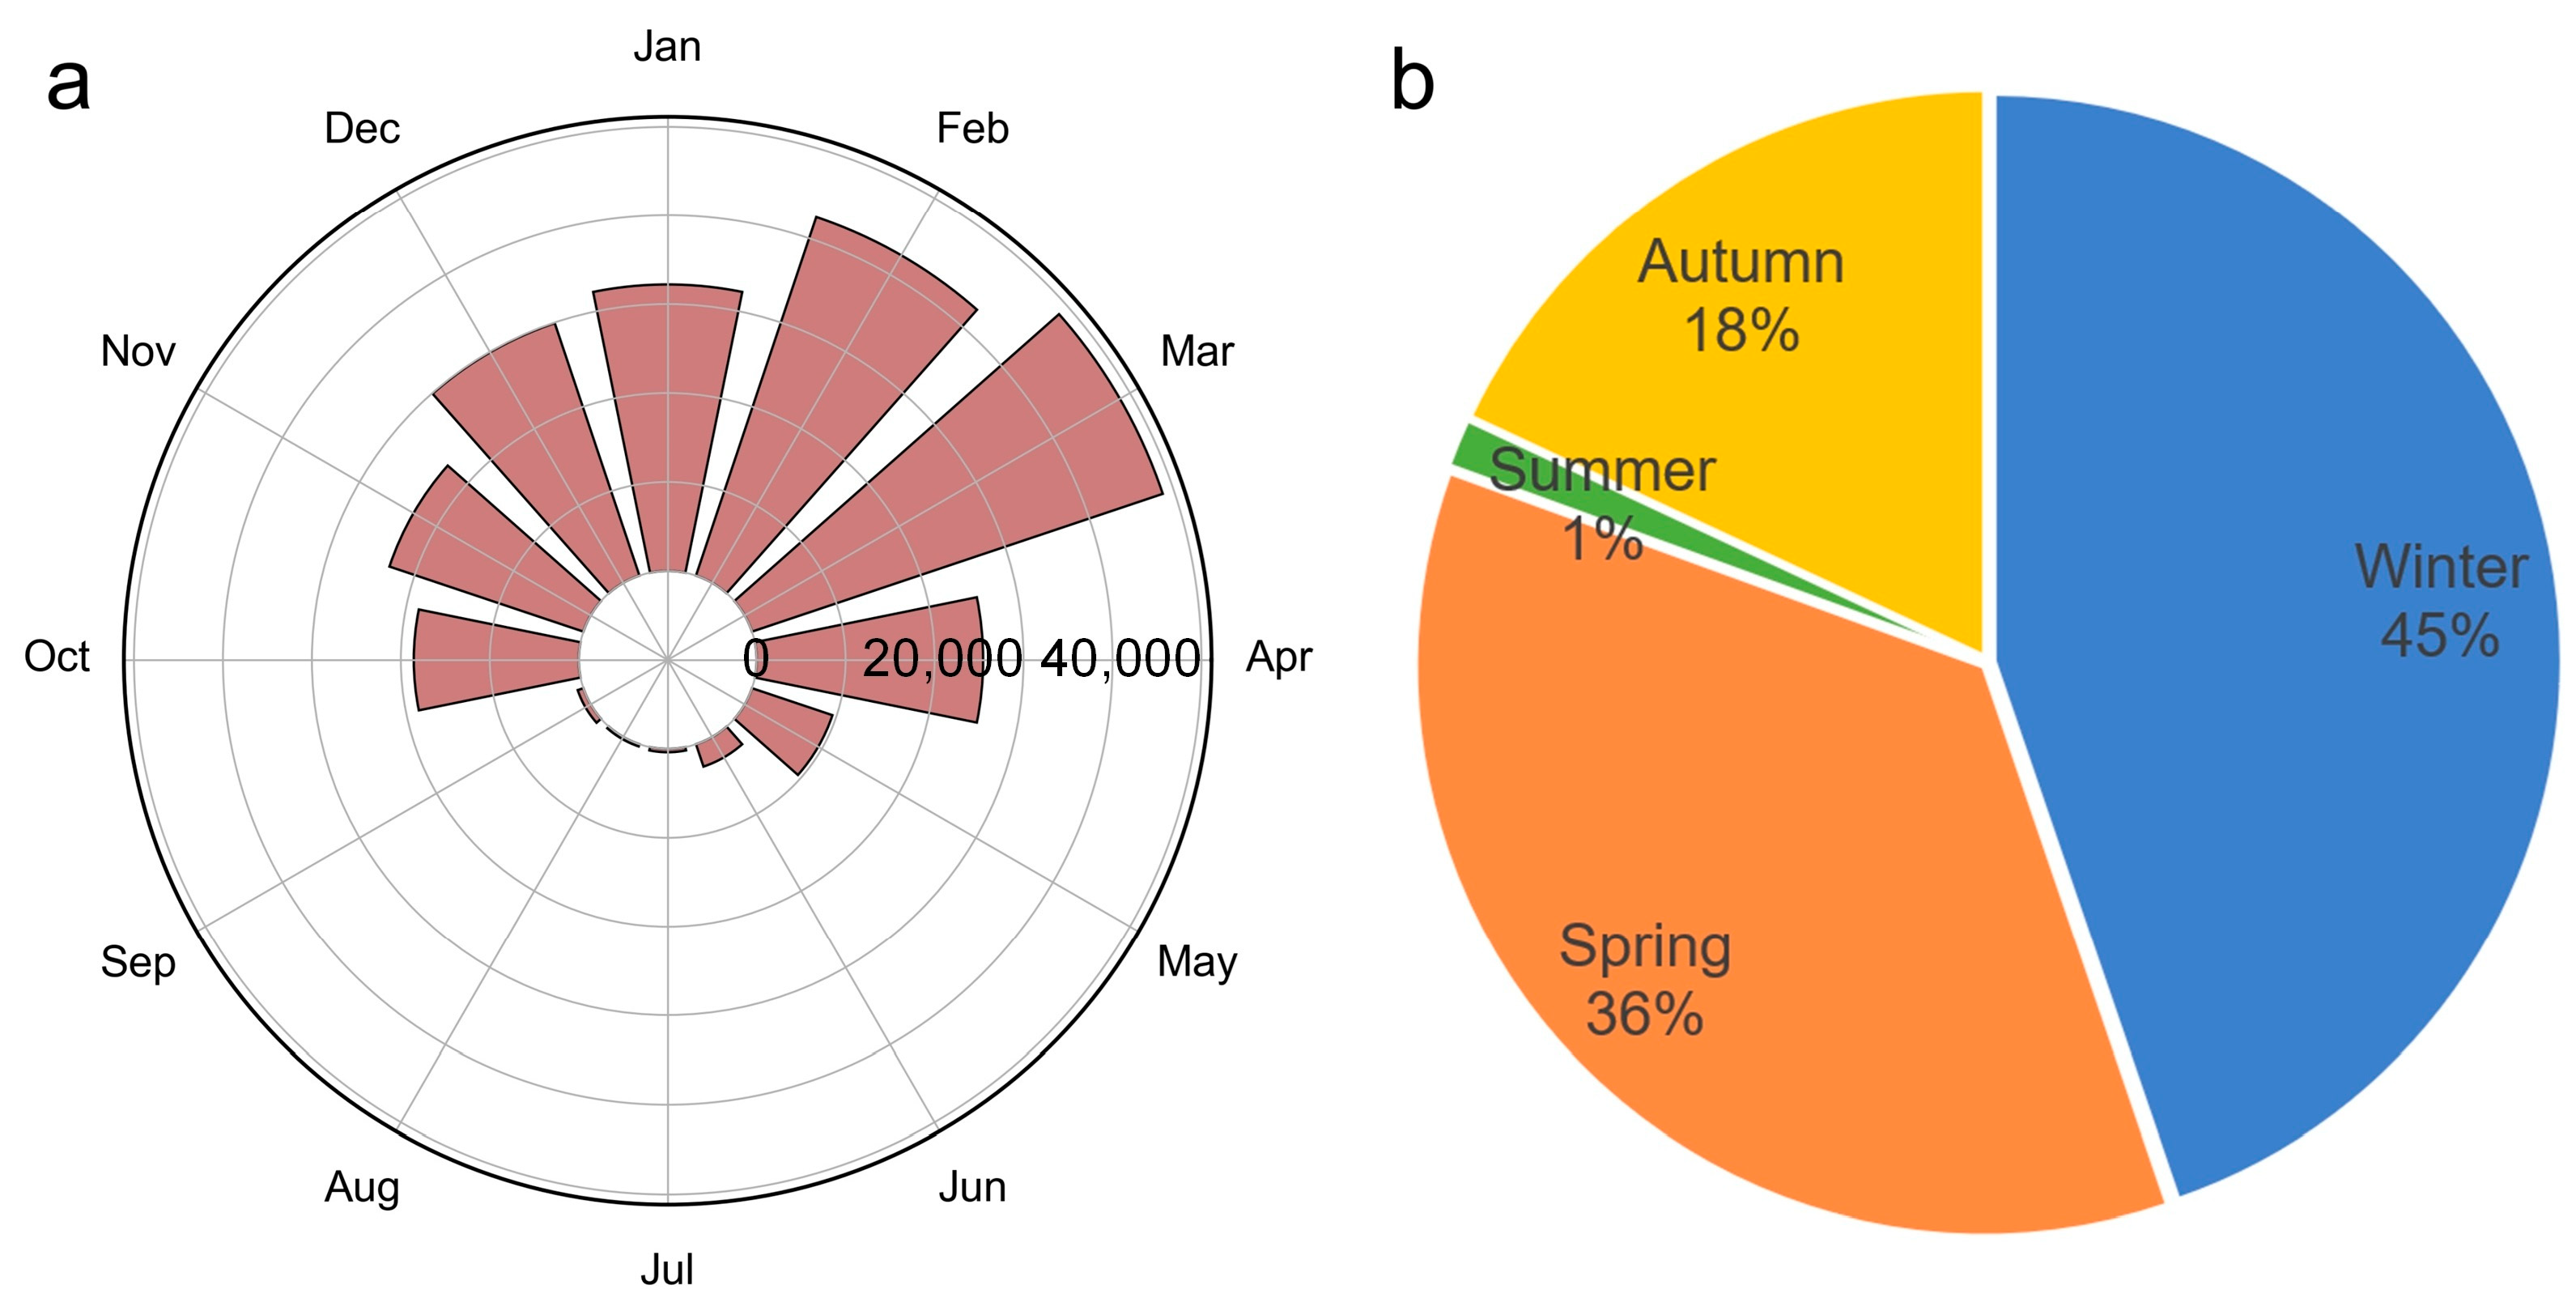
Figure 13 further highlights the strong seasonal variability in PM10 emissions across Shandong Province. Emissions peak in March, followed by February and January, confirming that winter and early spring are the dominant periods of wind-driven dust emissions. This temporal pattern reflects the combined influence of widespread bare soil exposure, low vegetation cover, dry surface conditions, and frequent wind activity during these months. Although most of these dust events may not escalate into dust storms, they can substantially elevate regional PM10 concentrations. These conditions also coincide with frequent haze episodes in northern China, complicating efforts to distinguish between natural and anthropogenic sources and hindering effective air quality management during this period.
Seasonal averages show that winter and spring account for approximately 45% and 36% of total annual emissions, respectively, together contributing over 80%. In contrast, summer contributes less than 1%, due to suppressed erosion under dense vegetation, higher soil moisture, and weaker winds. A similar seasonal dominance of winter–spring dust emissions has been reported in previous studies from northern China [14,23], lending support to our findings. By incorporating monthly variations in bare soil area and climate conditions, our modeling approach provides more realistic estimates of wind-driven emissions than conventional methods based on static land cover and annual climate averages. This fine temporal resolution is crucial for accurate representation of short-term but high-intensity dust events, which are often underestimated in coarser models.

4. Discussion

Beyond achieving high classification accuracy, the proposed framework also advances bare soil mapping methodology by better accommodating cloud-induced data gaps through SAR–optical integration, ensuring both spatial and temporal consistency, and demonstrating applicability to intensively cultivated landscapes. Despite the robust classification accuracy achieved by the ensemble learning model, several important caveats remain that warrant further examination. Omission errors were more prevalent than commission errors, likely due to insufficient representation of certain bare soil types in the training dataset. Because supervised classification methods heavily rely on high-quality and diverse reference samples, failure to include rare or transitional bare land conditions may lead the model to misclassify these regions as vegetated. This highlights the need to develop more generalized, transferable classification models or to establish comprehensive, spatially representative training datasets.
Cloud-induced data gaps also present a key source of uncertainty, especially in months with persistent overcast conditions. These gaps can lead to systematic underestimation of bare soil extent. Although multi-temporal compositing and the use of Level-1C imagery alleviate part of this issue, several months still lack sufficient valid observations. Moreover, since wind erosion is episodic and may occur over short time spans, monthly compositing may obscure high-intensity events. To address this, future work could incorporate higher-frequency satellite products such as MODIS or develop hybrid fusion approaches to reconstruct daily surface conditions and improve the temporal resolution of dust emission simulations.
The simulation of PM10 emissions using CLM5.0 is also constrained by the relatively coarse spatial resolution of key input datasets. In this study, both climate drivers and soil parameters were resampled to a 1 km grid through bilinear interpolation, which may obscure fine-scale variability critical to wind erosion processes. Near-surface wind speed and soil surface conditions exhibit high spatial heterogeneity in transitional zones such as coastal wetlands and floodplains. Therefore, enhancing the spatial resolution of climate and soil data through downscaling or site-specific validation will be necessary to reduce localized uncertainties in simulated dust fluxes. In particular, variations in soil properties (e.g., bulk density, sand/silt/clay fractions) remain a critical source of uncertainty, and future studies should assess sensitivity to these parameters.
Recent projections from Earth system models suggest that surface wind speeds may increase in parts of East China over the coming decades [65]. This potential shift in wind regime, likely driven by changes in circulation patterns and land–atmosphere interactions, could intensify wind erosion risks in regions already characterized by high bare soil exposure. This highlights the need for strengthened monitoring and mitigation efforts, especially in ecologically vulnerable regions. Given the episodic nature of wind erosion, exploring daily or sub-daily simulations could also help capture short-lived but high-impact events that are obscured in monthly analyses.
Finally, the environmental implications of bare soil wind erosion extend beyond PM10 emissions. Wind-driven loss of topsoil also entails the removal of nutrient-rich fine particles, including organic matter and soluble salts, thereby reducing soil fertility and accelerating land degradation [66]. In saline–alkaline areas such as northern Shandong, this process may further destabilize the fragile agroecosystem. Although the current model estimates total dust flux, it does not resolve specific nutrient or carbon losses, suggesting a need to couple physical erosion models with biogeochemical modules in future work. From an applied perspective, our results can inform China’s ongoing dust storm mitigation initiatives and ecological compensation schemes in North China, highlighting the policy relevance of improved bare soil monitoring and emission estimates.

5. Conclusions

This study quantified the spatial and temporal dynamics of bare soil exposure and wind erosion dust emissions in Shandong Province from 2017 to 2024, based on monthly remote sensing classification and process-based modeling. The main conclusions are as follows:
(1)
Using an ensemble learning approach that integrates multiple classifiers and multi-source data, we achieved high classification performance for monthly bare soil mapping. The stacking ensemble model reached an overall accuracy of 93.1% and a kappa coefficient of 0.862, outperforming all individual models.
(2)
Monthly bare soil area exhibited clear seasonal variation, peaking above 25,000 km2 (over 15% of the total study area) in winter and early spring and dropping sharply in summer. High exposure was mainly concentrated in the Yellow River Delta, central mountains, and the Jiaodong Peninsula. Compared to the 6.4% bare land estimate from ESA WorldCover, our results reveal that conventional static products significantly underestimate seasonal bare soil dynamics.
(3)
Simulations based on monthly bare soil and climate data estimated an average annual PM10 emission of 2.72 × 10⁵ tons between 2017 and 2024, with a standard deviation of 1.09 × 10⁵ tons. Emissions reached their lowest levels in 2021, and peaked in 2023 at over 4.60 × 10⁵ tons. Seasonally, emissions were highest in March, February, and January, with winter and spring together contributing more than 80% of the annual total (45% and 36%, respectively), while summer contributed less than 1%.

Author Contributions

Conceptualization, A.L. and Y.C.; methodology, A.L.; software, A.L.; validation, A.L.; formal analysis, A.L. and Y.C.; data curation, A.L.; writing—original draft preparation, A.L.; writing—review and editing, A.L. and Y.C.; visualization, A.L.; supervision, Y.C.; project administration, Y.C.; funding acquisition, A.L. and Y.C. All authors have read and agreed to the published version of the manuscript.

Funding

This research was funded by the Natural Science Foundation of Shandong Province, China (Grant No. ZR2024QD110 and ZR2023QD022), the Young Talent of Lifting Engineering for Science and Technology in Shandong, China (NO. SDAST2024QTA064), and the Young Taishan Scholars Program of Shandong Province (Grant No. tsqn202408142).

Data Availability Statement

The datasets used in this study include Sentinel-2 surface reflectance, Sentinel-1 ground range detected backscatter, AW3D30 digital elevation model, and ERA5-Land reanalysis data, all accessed via the Google Earth Engine platform (accessed on 1 August 2025; https://developers.google.com/earth-engine/datasets/). Soil property data were obtained from the National Tibetan Plateau/Third Pole Environment Data Center (accessed on 1 August 2025; https://data.tpdc.ac.cn/en/data/46ddd893-3b2b-4bb3-b9e6-b043f3c5c3a2).

Acknowledgments

We would like to express our gratitude to the teams behind the Google Earth Engine platform for providing access to essential remote sensing datasets.

Conflicts of Interest

The authors declare no conflicts of interest.

References

  1. Fuzzi, S.; Baltensperger, U.; Carslaw, K.; Decesari, S.; Denier van der Gon, H.; Facchini, M.C.; Fowler, D.; Koren, I.; Langford, B.; Lohmann, U.; et al. Particulate Matter, Air Quality and Climate: Lessons Learned and Future Needs. Atmos. Chem. Phys. 2015, 15, 8217–8299. [Google Scholar] [CrossRef]
  2. Pryor, J.T.; Cowley, L.O.; Simonds, S.E. The Physiological Effects of Air Pollution: Particulate Matter, Physiology and Disease. Front. Public Health 2022, 10, 882569. [Google Scholar] [CrossRef] [PubMed]
  3. Sokhi, R.S.; Moussiopoulos, N.; Baklanov, A.; Bartzis, J.; Coll, I.; Finardi, S.; Friedrich, R.; Geels, C.; Grönholm, T.; Halenka, T.; et al. Advances in Air Quality Research—Current and Emerging Challenges. Atmos. Chem. Phys. 2022, 22, 4615–4703. [Google Scholar] [CrossRef]
  4. Ahmadi-Molaverdi, M.; Jabbari, I.; Fathnia, A. Relationship Between Land Use Changes and the Production of Dust Sources in Kermanshah Province, Iran. Chin. Geogr. Sci. 2021, 31, 1057–1069. [Google Scholar] [CrossRef]
  5. Wang, P.; Chen, M.; An, W.; Liu, Y.; Pan, F. Research on the Fugitive Soil Dust Emission Inventory in Western China Based on Wind Erosion Equation Parameter Optimization. Front. Environ. Sci. 2023, 11, 1301934. [Google Scholar] [CrossRef]
  6. Tian, M.; Gao, J.; Zhang, L.; Zhang, H.; Feng, C.; Jia, X. Effects of Dust Emissions from Wind Erosion of Soil on Ambient Air Quality. Atmos. Pollut. Res. 2021, 12, 101108. [Google Scholar] [CrossRef]
  7. Öztürk, Y.; Yulu, A.; Turgay, O. Remote Sensing Supported Analysis of the Effect of Wind Erosion on Local Air Pollution in Arid Regions: A Case Study from Iğdır Province in Eastern Türkiye. Environ. Syst. Res. 2023, 12, 13. [Google Scholar] [CrossRef]
  8. Jiang, F.; Xue, X.; Zhang, L.; Zuo, Y.; Zhang, H.; Zheng, W.; Bian, L.; Hu, L.; Hao, C.; Du, J.; et al. Soil Wind Erosion, Nutrients, and Crop Yield Response to Conservation Tillage in North China: A Field Study in a Semi-Arid and Wind Erosion Region after 9 Years. Field Crops Res. 2024, 316, 109508. [Google Scholar] [CrossRef]
  9. Alzahrani, A.J.; Alghamdi, A.G.; Ibrahim, H.M. Assessment of Soil Loss Due to Wind Erosion and Dust Deposition: Implications for Sustainable Management in Arid Regions. Appl. Sci. 2024, 14, 10822. [Google Scholar] [CrossRef]
  10. Coelho, S.; Ferreira, J.; Lopes, M. Source Apportionment of Air Pollution in Urban Areas: A Review of the Most Suitable Source-Oriented Models. Air Qual. Atmos. Health 2023, 16, 1185–1194. [Google Scholar] [CrossRef]
  11. Hopke, P.K.; Feng, Y.; Dai, Q. Source Apportionment of Particle Number Concentrations: A Global Review. Sci. Total Environ. 2022, 819, 153104. [Google Scholar] [CrossRef]
  12. Lackoóvá, L.; Lieskovský, J.; Nikseresht, F.; Halabuk, A.; Hilbert, H.; Halászová, K.; Bahreini, F. Unlocking the Potential of Remote Sensing in Wind Erosion Studies: A Review and Outlook for Future Directions. Remote Sens. 2023, 15, 3316. [Google Scholar] [CrossRef]
  13. Delaney, B.; Tansey, K.; Whelan, M. Satellite Remote Sensing Techniques and Limitations for Identifying Bare Soil. Remote Sens. 2025, 17, 630. [Google Scholar] [CrossRef]
  14. Liu, Q.; Liu, Y.; Liu, S.; Zhao, J.; Zhao, B.; Zhou, F.; Zhu, D.; Wang, D.; Yu, L.; Yi, L.; et al. Emission Inventory of Soil Fugitive Dust Sources with High Spatiotemporal Resolution: A Case Study of Daxing District, Beijing, China. Land 2024, 13, 1991. [Google Scholar] [CrossRef]
  15. Mzid, N.; Pignatti, S.; Huang, W.; Casa, R. An Analysis of Bare Soil Occurrence in Arable Croplands for Remote Sensing Topsoil Applications. Remote Sens. 2021, 13, 474. [Google Scholar] [CrossRef]
  16. Rukhovich, D.I.; Koroleva, P.V.; Rukhovich, D.D.; Rukhovich, A.D. Recognition of the Bare Soil Using Deep Machine Learning Methods to Create Maps of Arable Soil Degradation Based on the Analysis of Multi-Temporal Remote Sensing Data. Remote Sens. 2022, 14, 2224. [Google Scholar] [CrossRef]
  17. Wang, W.; Samat, A.; Abuduwaili, J.; Ge, Y.; Maeyer, P.D.; de Voorde, T.V. A Novel Hybrid Sand and Dust Storm Detection Method Using MODIS Data on GEE Platform. Eur. J. Remote Sens. 2022, 55, 420–428. [Google Scholar] [CrossRef]
  18. Kandakji, T.; Gill, T.E.; Lee, J.A. Drought and Land Use/Land Cover Impact on Dust Sources in Southern Great Plains and Chihuahuan Desert of the U.S.: Inferring Anthropogenic Effect. Sci. Total Environ. 2021, 755, 142461. [Google Scholar] [CrossRef] [PubMed]
  19. Wu, C.; Lin, Z.; Shao, Y.; Liu, X.; Li, Y. Drivers of Recent Decline in Dust Activity over East Asia. Nat. Commun. 2022, 13, 7105. [Google Scholar] [CrossRef]
  20. Sulla-Menashe, D.; Friedl, M.A. User Guide to Collection 6 MODIS Land Cover (MCD12Q1 and MCD12C1) Product. Usgs Reston Va Usa 2018, 1, 18. [Google Scholar]
  21. Li, W.; MacBean, N.; Ciais, P.; Defourny, P.; Lamarche, C.; Bontemps, S.; Houghton, R.A.; Peng, S. Gross and Net Land Cover Changes in the Main Plant Functional Types Derived from the Annual ESA CCI Land Cover Maps (1992–2015). Earth Syst. Sci. Data 2018, 10, 219–234. [Google Scholar] [CrossRef]
  22. Zhang, X.; Zhao, T.; Xu, H.; Liu, W.; Wang, J.; Chen, X.; Liu, L. GLC_FCS30D: The First Global 30&thinsp;m Land-Cover Dynamics Monitoring Product with a Fine Classification System for the Period from 1985 to 2022 Generated Using Dense-Time-Series Landsat Imagery and the Continuous Change-Detection Method. Earth Syst. Sci. Data 2024, 16, 1353–1381. [Google Scholar] [CrossRef]
  23. Liu, A.; Wu, Q.; Cheng, X. Using the Google Earth Engine to Estimate a 10 m Resolution Monthly Inventory of Soil Fugitive Dust Emissions in Beijing, China. Sci. Total Environ. 2020, 735, 139174. [Google Scholar] [CrossRef]
  24. Zepp, S.; Jilge, M.; Metz-Marconcini, A.; Heiden, U. The Influence of Vegetation Index Thresholding on EO-Based Assessments of Exposed Soil Masks in Germany between 1984 and 2019. ISPRS J. Photogramm. Remote Sens. 2021, 178, 366–381. [Google Scholar] [CrossRef]
  25. Yoshino, K.; Philpot, W.D. Temporal Stability and Spatial Dependency of Pixel-Specific Red-NIR Soil Lines from Multi-Temporal Satellite Remote Sensing Imagery. Int. J. Remote Sens. 2023, 44, 1308–1327. [Google Scholar] [CrossRef]
  26. Woodruff, N.P.; Siddoway, F.H. A Wind Erosion Equation. Soil Sci. Soc. Am. J. 1965, 29, 602–608. [Google Scholar] [CrossRef]
  27. Fryrear, D.W.; Chen, W.; Lester, C. Revised Wind Erosion Equation. Ann. Arid Zone 2001, 40, 265–280. [Google Scholar]
  28. Li, T.; Dong, W.; Dai, Q.; Feng, Y.; Bi, X.; Zhang, Y.; Wu, J. Application and Validation of the Fugitive Dust Source Emission Inventory Compilation Method in Xiong’an New Area, China. Sci. Total Environ. 2021, 798, 149114. [Google Scholar] [CrossRef] [PubMed]
  29. Liu, A.; Wu, Q.; Chen, Y.; Zhao, T.; Cheng, X. Estimation of Dust Emissions from Bare Soil Erosion over Beijing Plain Area. China Environ. Sci. 2018, 2, 471–477. [Google Scholar]
  30. Li, T.; Bi, X.; Dai, Q.; Wu, J.; Zhang, Y.; Feng, Y. Optimized Approach for Developing Soil Fugitive Dust Emission Inventory in “2+26” Chinese Cities. Environ. Pollut. 2021, 285, 117521. [Google Scholar] [CrossRef]
  31. Li, Y.; Wu, Q.; Cheng, H.; Sun, Y.; He, J.; Li, J. The Soil Fugitive Dust Emission Assessment Using Satellite Data: A Case Study in Beijing-Tianjin-Hebei and Its Surrounding Areas (BTHSA). Atmos. Pollut. Res. 2025, 16, 102482. [Google Scholar] [CrossRef]
  32. Liu, J.; Li, B.; Ma, M. Spatiotemporal Variation and Causes of Typical Extreme Precipitation Events in Shandong Province over the Last 50 Years. Remote Sens. 2024, 16, 1283. [Google Scholar] [CrossRef]
  33. Takaku, J.; Tadono, T.; Doutsu, M.; Ohgushi, F.; Kai, H. Updates of ‘AW3D30’ALOS Global Digital Surface Model in Antarctica with Other Open Access Datasets. Int. Arch. Photogramm. Remote Sens. Spat. Inf. Sci. 2021, 43, 401–408. [Google Scholar] [CrossRef]
  34. Su, Y.; Wei, X.; Wang, Z.; Gao, L.; Zhang, Z. Cotton Production in the Yellow River Basin of China: Reforming Cropping Systems for Ecological, Economic Stability and Sustainable Production. Front. Sustain. Food Syst. 2025, 9, 1615566. [Google Scholar] [CrossRef]
  35. Zanaga, D.; Van De Kerchove, R.; Daems, D.; De Keersmaecker, W.; Brockmann, C.; Kirches, G.; Wevers, J.; Cartus, O.; Santoro, M.; Fritz, S. ESA WorldCover 10 m 2021 V200. 2022. Available online: https://pure.iiasa.ac.at/id/eprint/18478/ (accessed on 1 August 2025).
  36. Muñoz-Sabater, J.; Dutra, E.; Agustí-Panareda, A.; Albergel, C.; Arduini, G.; Balsamo, G.; Boussetta, S.; Choulga, M.; Harrigan, S.; Hersbach, H. ERA5-Land: A State-of-the-Art Global Reanalysis Dataset for Land Applications. Earth Syst. Sci. Data 2021, 13, 4349–4383. [Google Scholar] [CrossRef]
  37. Shi, G.; Sun, W.; Shangguan, W.; Wei, Z.; Yuan, H.; Li, L.; Sun, X.; Zhang, Y.; Liang, H.; Li, D.; et al. A China Dataset of Soil Properties for Land Surface Modelling (Version 2, CSDLv2). Earth Syst. Sci. Data 2025, 17, 517–543. [Google Scholar] [CrossRef]
  38. Lawrence, D.M.; Fisher, R.A.; Koven, C.D.; Oleson, K.W.; Swenson, S.C.; Bonan, G.; Collier, N.; Ghimire, B.; Van Kampenhout, L.; Kennedy, D. The Community Land Model Version 5: Description of New Features, Benchmarking, and Impact of Forcing Uncertainty. J. Adv. Model. Earth Syst. 2019, 11, 4245–4287. [Google Scholar] [CrossRef]
  39. Erickson, N.; Mueller, J.; Shirkov, A.; Zhang, H.; Larroy, P.; Li, M.; Smola, A. AutoGluon-Tabular: Robust and Accurate AutoML for Structured Data. Available online: https://arxiv.org/abs/2003.06505v1 (accessed on 7 September 2024).
  40. Breiman, L. Random Forests. Mach. Learn. 2001, 45, 5–32. [Google Scholar] [CrossRef]
  41. Geurts, P.; Ernst, D.; Wehenkel, L. Extremely Randomized Trees. Mach. Learn. 2006, 63, 3–42. [Google Scholar] [CrossRef]
  42. Abdi, H.; Valentin, D.; Edelman, B. Neural Networks; SAGE Publications: Thousand Oaks, CA, USA, 1999; ISBN 978-0-7619-1440-2. [Google Scholar]
  43. Chen, T.; Guestrin, C. XGBoost: A Scalable Tree Boosting System. In Proceedings of the 22nd ACM SIGKDD International Conference on Knowledge Discovery and Data Mining, San Francisco, CA, USA, 13–17 August 2016; Association for Computing Machinery: New York, NY, USA, 2016; pp. 785–794. [Google Scholar]
  44. Ke, G.; Meng, Q.; Finley, T.; Wang, T.; Chen, W.; Ma, W.; Ye, Q.; Liu, T.-Y. LightGBM: A Highly Efficient Gradient Boosting Decision Tree. In Proceedings of the Advances in Neural Information Processing Systems, Long Beach, CA, USA, 4–9 December 2017; Curran Associates, Inc.: Red Hook, NY, USA, 2017; Volume 30. [Google Scholar]
  45. Prokhorenkova, L.; Gusev, G.; Vorobev, A.; Dorogush, A.V.; Gulin, A. CatBoost: Unbiased Boosting with Categorical Features. In Proceedings of the Advances in Neural Information Processing Systems, Montreal, QC, Canada, 3–8 December 2018; Curran Associates, Inc.: Red Hook, NY, USA, 2018; Volume 31. [Google Scholar]
  46. Liu, A.; Chen, Y.; Cheng, X. Evaluating ICESat-2 and GEDI with Integrated Landsat-8 and PALSAR-2 for Mapping Tropical Forest Canopy Height. Remote Sens. 2024, 16, 3798. [Google Scholar] [CrossRef]
  47. Liu, A.; Chen, Y.; Cheng, X. Improving Tropical Forest Canopy Height Mapping by Fusion of Sentinel-1/2 and Bias-Corrected ICESat-2–GEDI Data. Remote Sens. 2025, 17, 1968. [Google Scholar] [CrossRef]
  48. Shi, T.; Xu, H. Derivation of Tasseled Cap Transformation Coefficients for Sentinel-2 MSI At-Sensor Reflectance Data. IEEE J. Sel. Top. Appl. Earth Obs. Remote Sens. 2019, 12, 4038–4048. [Google Scholar] [CrossRef]
  49. Sun, Y.; Qin, Q.; Ren, H.; Zhang, T.; Chen, S. Red-Edge Band Vegetation Indices for Leaf Area Index Estimation From Sentinel-2/MSI Imagery. IEEE Trans. Geosci. Remote Sens. 2020, 58, 826–840. [Google Scholar] [CrossRef]
  50. Zha, Y.; Gao, J.; Ni, S. Use of Normalized Difference Built-up Index in Automatically Mapping Urban Areas from TM Imagery. Int. J. Remote Sens. 2003, 24, 583–594. [Google Scholar] [CrossRef]
  51. He, C.; Shi, P.; Xie, D.; Zhao, Y. Improving the Normalized Difference Built-up Index to Map Urban Built-up Areas Using a Semiautomatic Segmentation Approach. Remote Sens. Lett. 2010, 1, 213–221. [Google Scholar] [CrossRef]
  52. Ettehadi Osgouei, P.; Kaya, S.; Sertel, E.; Alganci, U. Separating Built-Up Areas from Bare Land in Mediterranean Cities Using Sentinel-2A Imagery. Remote Sens. 2019, 11, 345. [Google Scholar] [CrossRef]
  53. Rasul, A.; Balzter, H.; Ibrahim, G.R.F.; Hameed, H.M.; Wheeler, J.; Adamu, B.; Ibrahim, S.; Najmaddin, P.M. Applying Built-Up and Bare-Soil Indices from Landsat 8 to Cities in Dry Climates. Land 2018, 7, 81. [Google Scholar] [CrossRef]
  54. Liu, Y.; Meng, Q.; Zhang, L.; Wu, C. NDBSI: A Normalized Difference Bare Soil Index for Remote Sensing to Improve Bare Soil Mapping Accuracy in Urban and Rural Areas. CATENA 2022, 214, 106265. [Google Scholar] [CrossRef]
  55. Mueller, J.; Shi, X.; Smola, A. Faster, Simpler, More Accurate: Practical Automated Machine Learning with Tabular, Text, and Image Data. In Proceedings of the 26th ACM SIGKDD International Conference on Knowledge Discovery & Data Mining, Virtual Event, CA, USA, 23–27 August 2020; Association for Computing Machinery: New York, NY, USA, 2020; pp. 3509–3510. [Google Scholar]
  56. Chen, Y.; Cheng, X.; Liu, A.; Chen, Q.; Wang, C. Tracking Lake Drainage Events and Drained Lake Basin Vegetation Dynamics across the Arctic. Nat. Commun. 2023, 14, 7359. [Google Scholar] [CrossRef]
  57. Zender, C.S.; Bian, H.; Newman, D. Mineral Dust Entrainment and Deposition (DEAD) Model: Description and 1990s Dust Climatology. J. Geophys. Res. Atmos. 2003, 108, 4416. [Google Scholar] [CrossRef]
  58. Mahowald, N.M.; Muhs, D.R.; Levis, S.; Rasch, P.J.; Yoshioka, M.; Zender, C.S.; Luo, C. Change in Atmospheric Mineral Aerosols in Response to Climate: Last Glacial Period, Preindustrial, Modern, and Doubled Carbon Dioxide Climates. J. Geophys. Res. Atmos. 2006, 111, D10202. [Google Scholar] [CrossRef]
  59. 2.31. Dust Model—Ctsm Release-Clm5.0 Documentation. Available online: https://escomp.github.io/CTSM/release-clm5.0/tech_note/Dust/CLM50_Tech_Note_Dust.html (accessed on 2 August 2025).
  60. Anisimov, A.; Tao, W.; Stenchikov, G.; Kalenderski, S.; Prakash, P.J.; Yang, Z.-L.; Shi, M. Quantifying Local-Scale Dust Emission from the Arabian Red Sea Coastal Plain. Atmos. Chem. Phys. 2017, 17, 993–1015. [Google Scholar]
  61. Shi, M.; Yang, Z.-L.; Stenchikov, G.L.; Parajuli, S.P.; Tao, W.; Kalenderski, S. Quantifying the Impacts of Landscape Heterogeneity and Model Resolution on Dust Emissions in the Arabian Peninsula. Environ. Model. Softw. 2016, 78, 106–119. [Google Scholar] [CrossRef]
  62. Wu, C.; Lin, Z.; He, J.; Zhang, M.; Liu, X.; Zhang, R.; Brown, H. A Process-oriented Evaluation of Dust Emission Parameterizations in CESM: Simulation of a Typical Severe Dust Storm in East Asia. J. Adv. Model. Earth Syst. 2016, 8, 1432–1452. [Google Scholar] [CrossRef]
  63. Liu, Z.; Liu, Y.; Dong, J.; Baig, M.H.A.; Chi, W.; Peng, L.; Wang, J. Patterns and Causes of Winter Wheat and Summer Maize Rotation Area Change over the North China Plain. Environ. Res. Lett. 2022, 17, 044056. [Google Scholar] [CrossRef]
  64. Xiao, Y.; Zhao, G.; Li, T.; Zhou, X.; Li, J. Soil Salinization of Cultivated Land in Shandong Province, China—Dynamics during the Past 40 Years. Land Degrad. Dev. 2019, 30, 426–436. [Google Scholar] [CrossRef]
  65. Tao, J.-N.; Hua, W.; Ma, W.-T.; Lu, Q.-F. Evaluation and Projection of Wind Energy Density in China Based on Multi-Model Ensemble CMIP6 Simulations. Theor. Appl. Climatol. 2025, 156, 300. [Google Scholar] [CrossRef]
  66. Wu, Y.; Lin, S.; Tian, H.; Zhang, K.; Wang, Y.; Sun, B.; Liu, X.; Liu, K.; Xue, Y.; Hao, J.; et al. A Quantitative Assessment of Atmospheric Emissions and Spatial Distribution of Trace Elements from Natural Sources in China. Environ. Pollut. 2020, 259, 113918. [Google Scholar] [CrossRef]
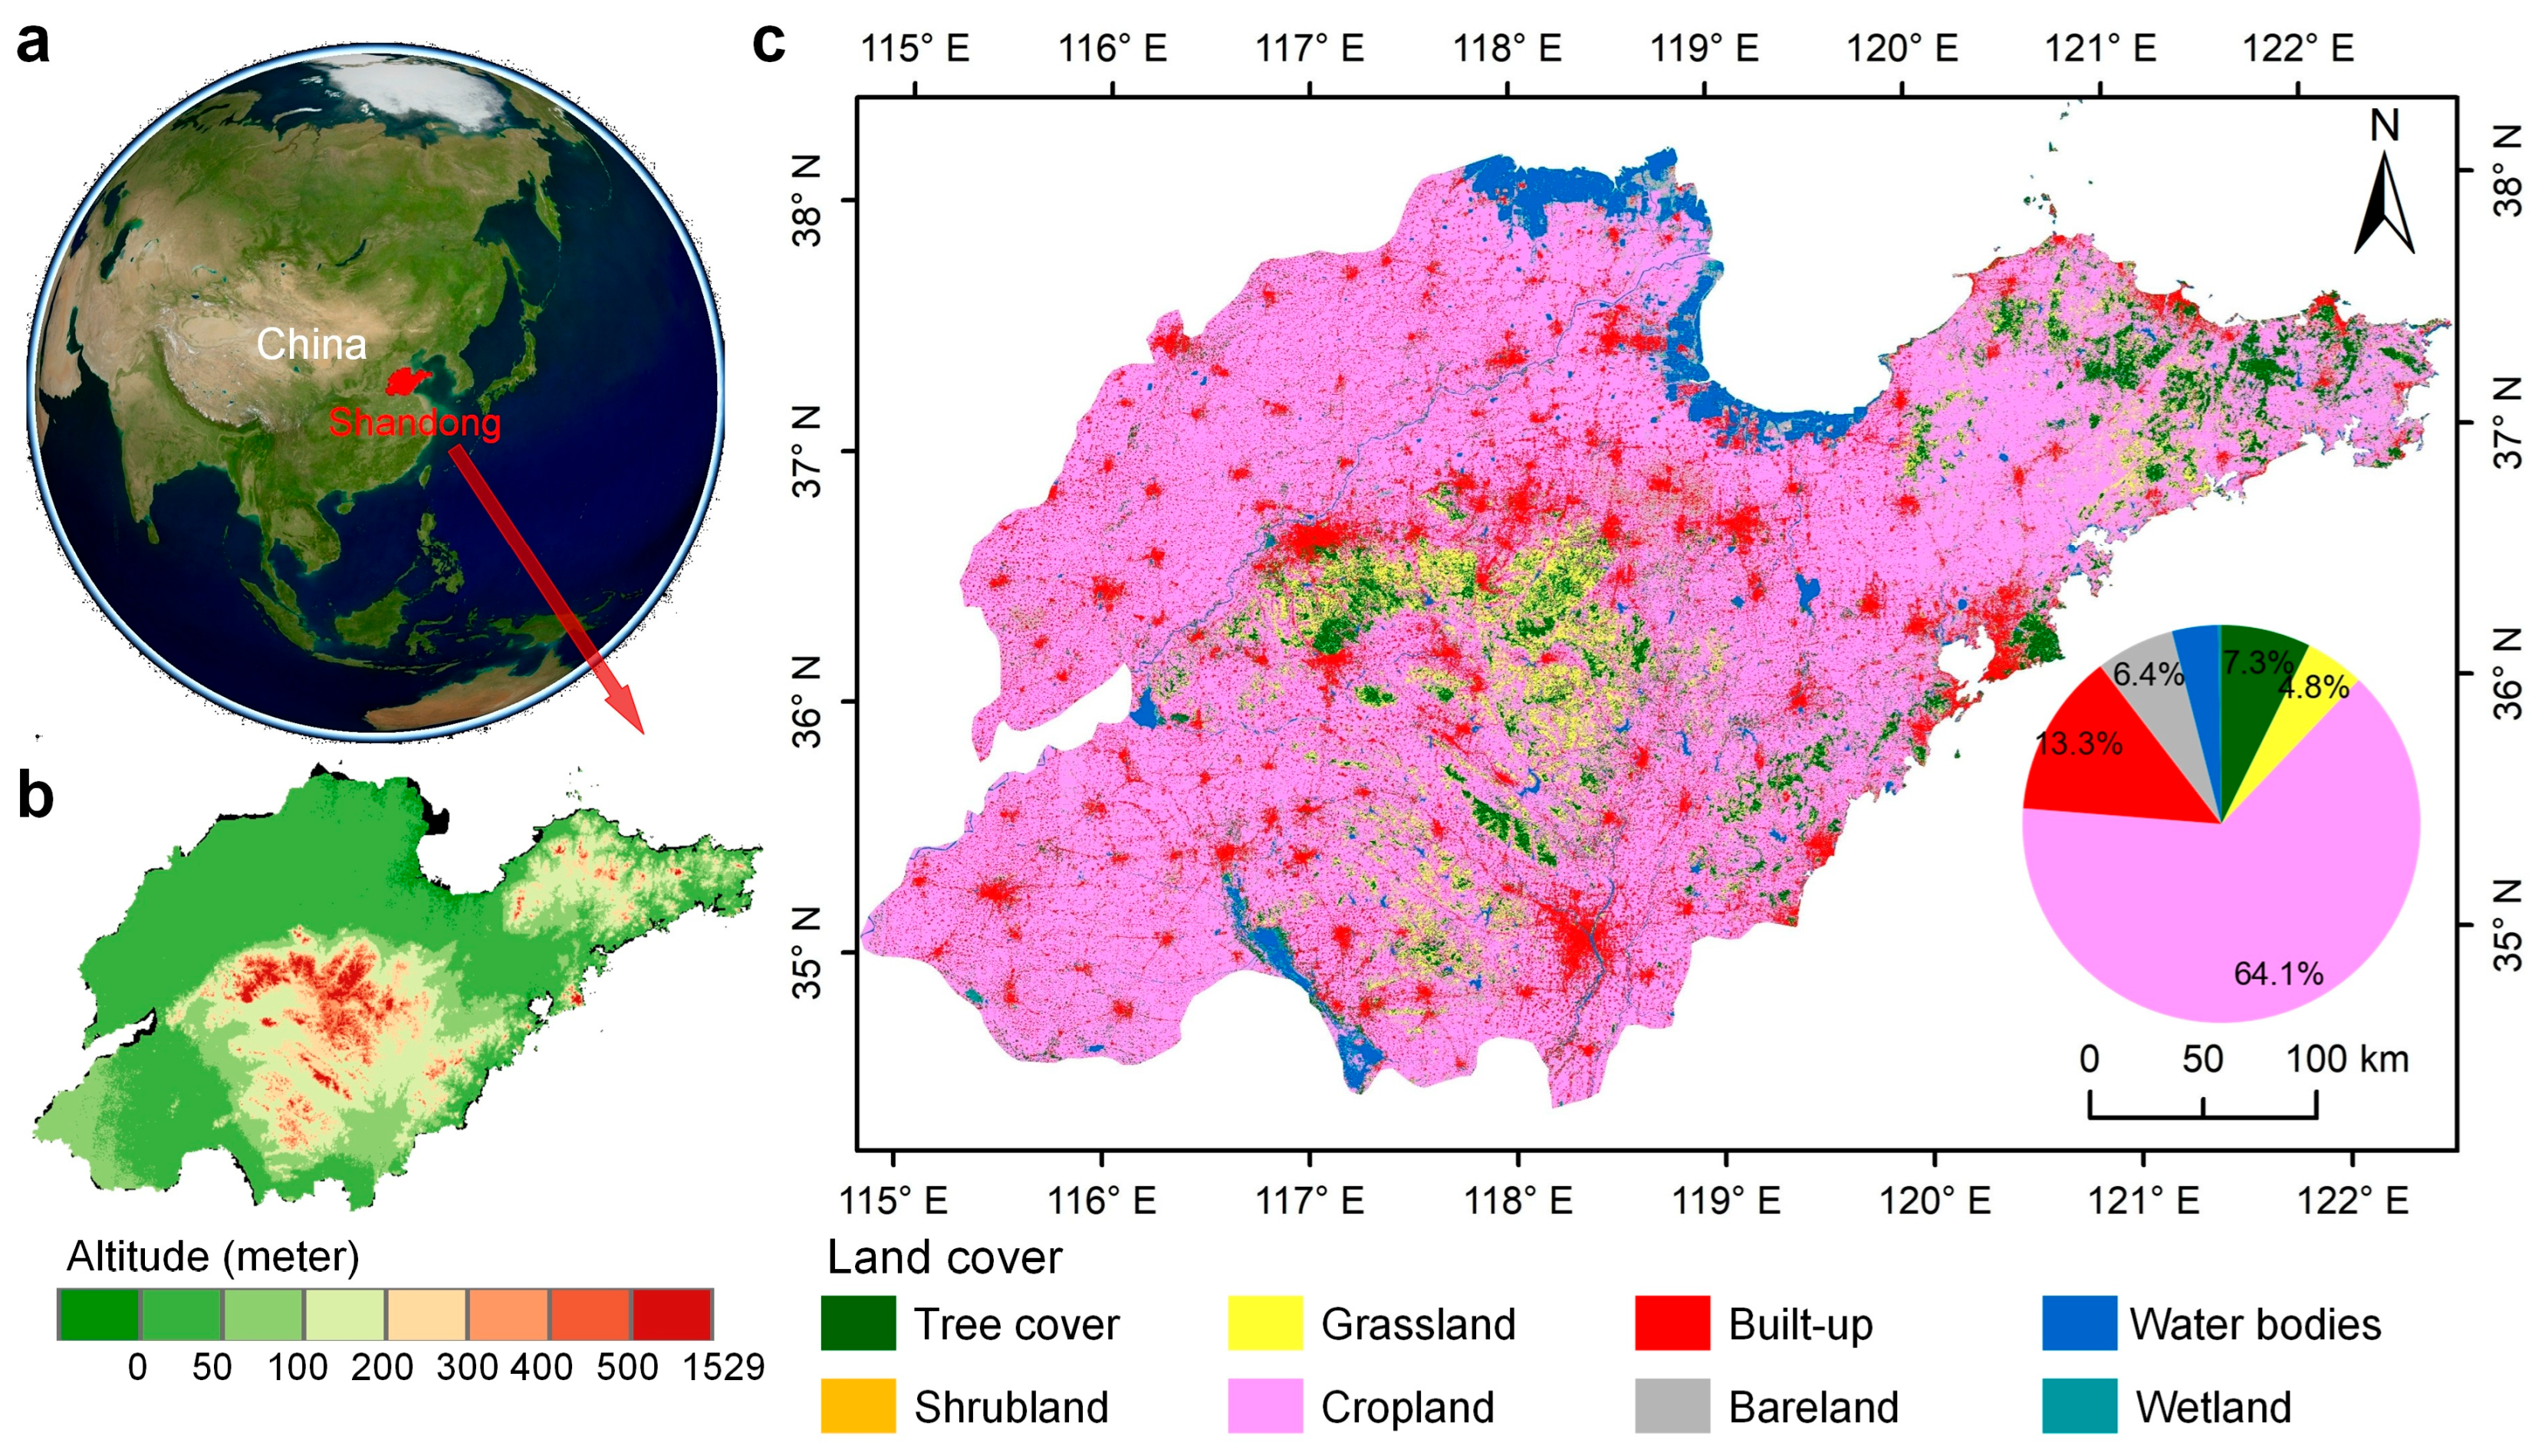
Figure 1. Study area and land cover of Shandong Province, China. (a) Location of Shandong within China and East Asia. (b) Topography derived from the AW3D30 digital surface model [33]. (c) Land cover map based on the ESA WorldCover 10 m product [35], with the proportion of each land type illustrated in the accompanying pie chart.
Remotesensing 17 03298 g001
Figure 2. Overview of the integrated framework for remote sensing bare soil mapping and wind erosion dust emission modeling.
Remotesensing 17 03298 g002
Figure 3. Structure of the AutoGluon-based ensemble classification model for bare soil mapping.
Remotesensing 17 03298 g003
Figure 4. Examples of bare soil subtypes in Sentinel-2 imagery and classification results.
Remotesensing 17 03298 g004
Figure 5. Process-based modeling framework of the CLM5.0 soil dust emission module.
Remotesensing 17 03298 g005
Figure 6. Normalized importance of the top 10 features used in bare soil classification.
Remotesensing 17 03298 g006
Figure 7. Monthly and annual average bare soil area in Shandong Province from 2017 to 2024.
Remotesensing 17 03298 g007
Figure 8. Spatial pattern of bare land exposure probability (2017–2024) and enlarged view of the Yellow River Delta.
Remotesensing 17 03298 g008
Figure 9. Monthly variation in bare soil area and climate parameters in Shandong Province (multi-year averages for 2017–2024).
Remotesensing 17 03298 g009
Figure 10. Monthly spatial distribution of wind speed across Shandong Province in 2024.
Remotesensing 17 03298 g010
Figure 11. Spatial distribution of multi-year average PM10 emissions from wind erosion across Shandong Province during 2017–2024.
Remotesensing 17 03298 g011
Figure 12. Monthly PM10 emissions from wind erosion over bare surfaces in Shandong Province from 2017 to 2024.
Remotesensing 17 03298 g012
Figure 13. (a) Monthly average PM10 emissions from wind erosion during 2017–2024, highlighting peak values in winter and early spring. (b) Seasonal contribution to total PM10 emissions, showing winter and spring jointly account for over 80% of the annual total.
Remotesensing 17 03298 g013
Table 1. Accuracy comparison of base learners and the AutoGluon stacking ensemble model for bare soil classification.
ModelsOAKappaPrecisionRecallF1-Score
AutoGluon stacking ensemble0.930.860.940.920.93
CatBoost0.920.850.930.920.92
XGBoost0.920.840.930.910.92
LightGBM0.910.830.930.890.91
Neural networks0.900.790.920.870.89
Extremely randomized trees0.900.790.910.880.89
Random forests0.890.780.910.860.89
K-nearest neighbors0.810.620.820.790.81
Disclaimer/Publisher’s Note: The statements, opinions and data contained in all publications are solely those of the individual author(s) and contributor(s) and not of MDPI and/or the editor(s). MDPI and/or the editor(s) disclaim responsibility for any injury to people or property resulting from any ideas, methods, instructions or products referred to in the content.