Highlights
What are the main findings?
- Cubic-spline fitting combined with an elevation frequency histogram enables coarse extraction of UAV LiDAR ground points in densely vegetated areas.
- A multi-feature GMM with the elevation residual, GLI, and intensity effectively distinguishes low vegetation that is adjacent to the ground surface.
What is the implication of the main finding?
- A two-stage ground filtering method shows significant potential for applications in densely vegetated areas, especially areas covered with low-growing vegetation.
Abstract
Unmanned aerial vehicle (UAV)-based light detection and ranging (LiDAR) technology enables the acquisition of high-precision three-dimensional point clouds of the Earth’s surface. These data serve as a fundamental input for applications such as digital terrain model (DTM) construction and terrain analysis. Nevertheless, accurately extracting ground points in densely vegetated areas remains challenging. This study proposes a point cloud filtering method for the separation of ground points by integrating elevation frequency histograms and a multi-feature Gaussian mixture model (GMM). Firstly, local elevation frequency histograms are employed to estimate the elevation range for the coarse identification of ground points. Then, GMM is applied to refine the ground segmentation by integrating geometric features, intensity, and spectral information represented by the green leaf index (GLI). Finally, Mahalanobis distance is introduced to optimize the segmentation result, thereby improving the overall stability and robustness of the method in complex terrain and vegetated environments. The proposed method was validated on three study areas with different vegetation cover and terrain conditions, achieving an average of 94.14%, of 88.45%, of 88.35%, and F1-score of 93.85%. Compared to existing ground filtering algorithms (e.g., CSF, SBF, and PMF), the proposed method performs well in all study areas, highlighting its robustness and effectiveness in complex environments, especially in areas densely covered by low vegetation.
1. Introduction
The integration of unmanned aerial vehicle (UAV) platforms and light detection and ranging (LiDAR) technology has emerged as a powerful means of acquiring high-resolution 3D surface data, enabling a wide range of applications such as terrain modeling, environmental monitoring, and urban analysis [1,2]. Raw UAV LiDAR point clouds typically contain a mixture of features such as buildings, vegetation, and bare ground. Ground filtering aims to extract ground points from these mixed datasets. This provides essential input for digital terrain model (DTM) construction and subsequent terrain analysis. However, in practical applications, ground and non-ground points may exhibit high geometric similarity, which is often caused by factors such as abrupt slope changes in mountainous areas, dense vegetation in forests, and complex and diverse surface cover in urban fringe regions [3,4,5]. This makes it difficult for traditional filtering methods to distinguish between ground and non-ground points, resulting in frequent misclassifications or omissions [6,7]. The widespread use of high-density scanning platforms such as UAV LiDAR and mobile laser scanning (MLS) has further increased demands on filtering algorithms in terms of accuracy, efficiency, and adaptability [8,9,10,11].
Many algorithms have been proposed for ground filtering of LiDAR point clouds, which can be generally categorized into slope-based, morphology-based, surface-fitting, segmentation-based, and machine learning methods [12,13]. Slope-based filtering (SBF) methods are based on the assumption that ground points exhibit gradual elevation changes in local spatial neighborhoods, and that abrupt elevation differences are more likely to correspond to non-ground objects. Based on this assumption, Vosselman proposed a slope-constrained strategy that defines a maximum slope threshold within a local neighborhood, iteratively removing points exceeding it as outliers to extract ground points [14]. To improve the adaptability of slope-based filtering methods in complex terrains, Susaki extracted local elevation differences to define dynamic slope thresholds, thereby enhancing the method’s responsiveness to terrain variations [15]. In addition, Kang proposed a triangular grid filtering method based on the slope filter, which improves ground point extraction in complex urban and vegetated areas through a combination of slope-based initialization, spatial clustering, and angle-based refinement [16]. However, slope-based methods are highly sensitive to parameter selection and tend to misclassify low vegetation in densely vegetated areas, where the local slope of vegetation closely matches the ground surface.
Morphology-based filtering methods typically assume that the ground surface is smooth and continuous. Since vegetation and buildings often exhibit abrupt elevation changes, they are treated as outliers. These outliers can be removed or filled through morphological operations such as erosion, dilation, and opening and closing, performed with appropriate structuring elements (SE), thereby restoring a continuous ground surface. The progressive morphological filter (PMF) proposed by Zhang et al. is one of the earliest and most representative algorithms of this method. It removes non-ground points of varying scales by continuously increasing the size of the SE [17]. To enhance adaptability in complex terrains, Pingel et al. proposed the simple morphological filter (SMRF), which uses a linearly increasing structuring element and introduces a slope-dependent elevation threshold to improve classification accuracy [18]; similarly, Liu et al. introduced a voxel-based multi-scale morphological filter to further enhance the accuracy of digital elevation models, particularly in forested regions [19]. In this context, Meng et al. proposed the multilevel adaptive filter (MAF), which combines morphological reconstruction and thin plate spline (TPS) interpolation with a slope-compensated residual threshold [20]. Despite these advancements, morphology-based methods often fail to distinguish dense vegetation understory from the ground, as they are not sensitive enough to subtle elevation variations.
Surface-fitting-based filtering methods first determine a reference terrain surface from initial seed points. Then, they classify ground points based on the geometric relationship between the candidate points and the fitted surface [21]. The progressive tin densification (PTD) algorithm, proposed by Axelsson, is a classic representative of this category. The algorithm initializes a triangulated irregular network (TIN) using locally lowest points and progressively refines the surface based on elevation and angle thresholds [22]. To further improve the accuracy of the reference surface, Evans et al. proposed the multi-scale curvature classification (MCC) method, which significantly enhances ground point classification in forested areas through multiscale fitting of curvature features [23]. Following the PTD, Zhang and Lin integrated a region-based segmentation mechanism into the PTD framework to better preserve terrain discontinuities and enhance boundary representation [24]. Subsequently, Zhang et al. introduced the cloth simulation filter (CSF), a widely used method for estimating terrain surfaces, which utilizes a gravity-driven cloth simulation over the inverted point cloud to eliminate the need for seed points [25]. Nevertheless, these methods still face difficulties in maintaining classification stability in areas with abrupt terrain changes.
Segmentation-based point cloud filtering methods first divide the point cloud into spatially coherent segments. These segments are then classified as ground or non-ground based on their segment-level features [26]. This approach is applied in areas with clear boundaries or significant elevation differences between objects. For example, Chen et al. proposed a multi-scale hierarchical segmentation and classification model that integrates information from different segmentation scales to improve classification accuracy in urban fringe areas [27]. Liu et al. introduced a voxel-based multi-scale morphological filtering method, which leverages structured voxel segmentation to better distinguish low-elevation vegetation from ground surfaces [19]. Yang et al. proposed a two-step ground and breakline extraction method, which refines terrain structure representation through initial extraction followed by boundary line identification [28]. Recently, Fan et al. presented a supervoxel-based filtering algorithm using ground saliency estimation, which achieves accurate ground classification by exploiting local geometric consistency within supervoxel segments [29]. However, segmentation-based methods heavily depend on boundary features, making them less robust in areas with smooth terrain gradients or poorly defined object edges (e.g., densely vegetated areas).
Machine learning and deep learning-based methods typically formulate ground point extraction as a classification task. These methods leverage various features to distinguish ground from non-ground points. Traditional machine learning methods include support vector machines (SVM) and random forests (RF). These methods primarily rely on basic point cloud features such as elevation, density, and intensity for classification [30,31]. With deep learning gaining widespread attention, an increasing number of researchers have explored the use of deep learning for separating ground and non-ground points in LiDAR point clouds [32,33]. For example, Rizaldy et al. proposed a multi-scale fully convolutional network (MS-FCN) that converts point cloud data into 2D raster images to segment ground and non-ground classes [34]; Zhang et al. proposed a terrain-aware graph convolutional network (GCN) that captures spatial relationships between ground and non-ground points, which significantly improves ground point extraction in densely vegetated areas [35]; and Chen et al. proposed the semantic-consistency convolutional neural network (SC-CNN), which integrates slope-constrained sampling and a copula-based correlation enhancement mechanism to improve classification robustness in complex terrains [36]. Nevertheless, deep learning requires large amounts of training data and often exhibits limited generalization.
It is widely acknowledged that most filtering methods perform well in relatively simple environments, yet their accuracy deteriorates significantly in complex terrains featuring steep slopes and dense vegetation. This performance gap largely stems from their reliance on geometric features. With the advancement of sensing technologies, point cloud data can now include a wider range of attributes, such as RGB and intensity, which extends the potential of point cloud processing. To exploit these attributes, we propose a hybrid filtering method by integrating elevation frequency histogram and multi-feature Gaussian mixture model (GMM). The elevation frequency histogram describes the vertical distribution of points within localized spatial units (e.g., 5 m × 5 m grids), where ground points are typically found at lower elevations and tend to exhibit higher spatial density. Based on this, the high-frequency, low-elevation regions in the histogram can be regarded as the coarse extraction range of ground points. These coarsely extracted ground points are then processed by a GMM that utilizes multiple statistical features, including RGB and intensity values, for refined ground extraction. The proposed method not only effectively suppresses noise and outliers during modeling but also improves the overall accuracy and adaptability of ground point extraction. Compared with traditional filtering methods, this work has the following main contributions:
- (i)
- Applying cubic spline fitting to the elevation frequency histogram to construct a smoother pseudo-waveform of UAV LiDAR data, enabling more reliable separation of ground and non-ground points and providing robust support for subsequent modeling.
- (ii)
- Integrating geometric, intensity, and spectral features of point clouds into the GMM filtering process effectively exploits the differences among targets and significantly improves ground point extraction accuracy in complex areas where low vegetation is adjacent to ground surfaces.
2. Methodology
In this study, each LiDAR point is georeferenced and contains 3D spatial coordinates (X, Y, Z), an intensity value, return number, and RGB color information from simultaneously captured multispectral imagery. Figure 1 illustrates the workflow of the proposed method, which includes three stages: (1) data preprocessing; (2) coarse extraction of ground points using the elevation frequency histogram, for the subsequent feature calculation; (3) refining the ground extraction result based on a multi-feature GMM.
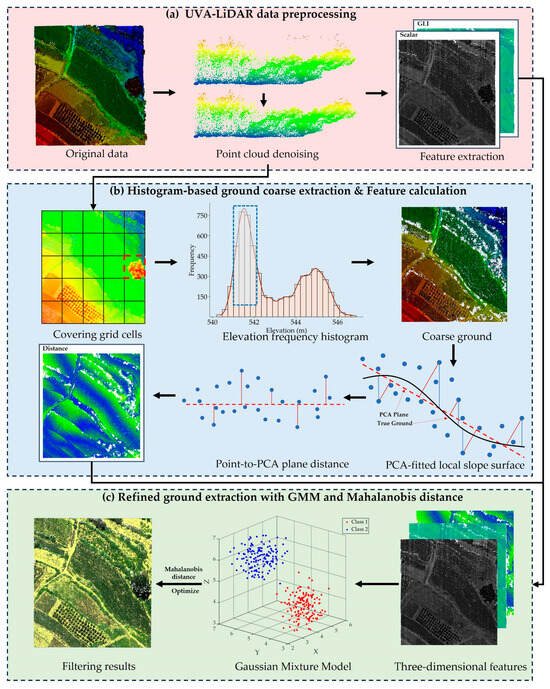
Figure 1.
Flowchart of the proposed method.
2.1. Preprocessing of LiDAR Point Cloud
The LiDAR point cloud preprocessing consisted of two main steps: (1) radius-based denoising and (2) feature extraction from point attributes [37,38].
(1) Point Cloud Denoising: Due to sensor errors and variations in surface reflectance, some points may deviate from their true positions, which may interfere with subsequent processing [39]. To address this, we adopted a radius-based denoising algorithm during preprocessing. The algorithm analyzed point density within user-defined radii and removes as outliers any point whose local neighborhood density falls below a statistical threshold.
(2) Feature Extraction: Two features were extracted from the raw LiDAR data: intensity and the green leaf index (GLI) calculated from the RGB bands. To enhance data reliability, the intensity values were corrected and the RGB data were processed to compute the GLI. The specific steps are as follows:
(a) Intensity-Based Feature: Intensity reflects an object’s surface reflectivity. Ground points generally show higher intensities due to their compact and smooth surfaces. In contrast, non-ground targets such as vegetation tend to return lower intensities due to their sparse structures and multiple scattering effects [40]. Therefore, intensity offers an advantage in distinguishing low-lying vegetation near the surface from true ground and can serve as a complementary feature providing additional discriminative information. [41] Additionally, raw intensity measurements are affected by external factors such as flight altitude, scan angle, and atmospheric conditions. Therefore, to ensure comparability across different regions and flights, raw intensity values were first corrected using an empirical model [42,43]:
where is the corrected intensity value, is the raw intensity, is the actual range, is a reference range (e.g., average flight altitude), and is the laser incidence angle.
(b) RGB-Based Feature: RGB values for each point are obtained by projecting orthophoto imagery onto the raw point cloud. These values effectively reflect differences between ground surfaces and vegetation. Thus, applying this feature is particularly valuable in densely vegetated areas [44]. The GLI is calculated as follows [45]:
As an RGB-based greenness index, GLI contributes complementary spectral information that strengthens vegetation–non-vegetation discrimination when geometry alone is insufficient [46].
2.2. Ground Point Coarse Extraction Based on Frequency Histogram
Extracting ground points from LiDAR data is particularly challenging due to the uneven distribution and complex structure of the data, especially in densely vegetated areas. To address this, elevation frequency histograms are used to statistically characterize vertical distributions within local regions, aiding the identification of dominant terrain surfaces [47]. As shown in Figure 2, different surface covers exhibit distinct elevation frequency histograms: areas with tall vegetation show a bimodal distribution, shrub-covered regions show a broader unimodal distribution, and ground surfaces present a narrower unimodal shape.
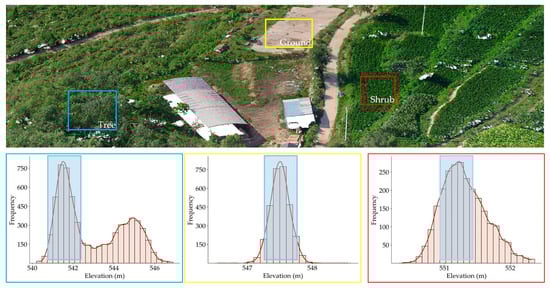
Figure 2.
Histogram fitting and coarse ground extraction under three types of vegetation cover (tree, ground, shrub). Light blue shaded regions indicate the ground-point buffer zones.
Elevation peaks were detected using the histogram method, which helped determine the ground point range while filtering out outliers, yielding cleaner samples for classification. In the first step, the point cloud was divided into uniform grid cells. Then a sliding window with a horizontal overlap of 80% was applied to reduce edge effects, thereby improving classification stability in densely vegetated areas [48]. Subsequently, the elevation values of all points within each grid were statistically analyzed to generate local histograms, with a bin width of 0.05 m selected to provide sufficient vertical resolution for UAV LiDAR data processing [49]. Finally, to achieve stable peak detection, each histogram was smoothed using cubic spline functions. The expression for each spline curve segment is as follows [50]:
where represents the center of the -th bin, and , , , are the coefficients of the cubic polynomial within the corresponding interval.
Then, local maxima were extracted from the elevation histogram, with the first local maximum corresponding to the main ground peak. Finally, an elevation buffer was applied around this peak, and all points within this interval were extracted as coarse ground points.
2.3. Extraction of Elevation Residual Feature Using PCA
For the coarse ground points obtained above, we introduced the local elevation residual as an additional feature to improve the adaptability of the GMM, following the use of intensity and GLI. PCA was first applied within each local region to fit a plane [51,52,53], with the perpendicular distance from each point to the fitted plane calculated as its geometric residual. Since elevation variation is limited in small areas, the local terrain can be approximated as planar. This approximation enhances the robustness of PCA fitting and the stability of the resulting residuals [54,55]. Generally, ground points remain close to the fitted surface, whereas non-ground points exhibit more significant deviations. The residual calculation process is illustrated in Figure 3.
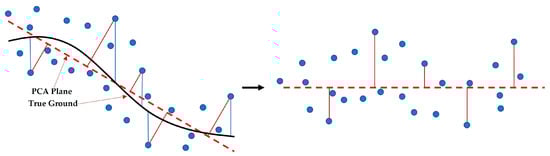
Figure 3.
Schematic diagram of the local elevation fitting residuals. The red solid lines represent the perpendicular distance from points to the PCA plane, and the blue solid lines represent the vertical distance from points to the true ground.
Three statistical features were used to describe the differences between ground points and non-ground points from multiple perspectives. As these features differ in numerical range, all of them were standardized using the Z-score method to prevent weight imbalance, while preserving their original distribution structure. The standardized calculation method is as follows:
where is the original feature value, is the mean, is the standard deviation, and is the standardized feature.
2.4. Separation of Ground and Non-Ground Points with Multi-Feature GMM
After the coarse extraction of ground points, further fine separation is necessary. GMM distinguishes itself from other machine learning models by offering an unsupervised probabilistic framework with soft clustering and covariance modeling, which significantly enhances its robustness in situations where feature distributions overlap [56]. Unlike traditional unsupervised models such as DBSCAN, which are sensitive to point cloud density and perform poorly when the density distribution is uneven [57,58]. Furthermore, supervised learning and deep learning models generally depend on large quantities of labeled data and may exhibit limited generalization capability [59]. In contrast, GMM does not rely on labeled data and classifies based on input features and their correlation. It has better applicability and generalization ability and can effectively handle point-cloud classification tasks with complex ground features. In this study, we first combine the three statistical features obtained above, namely, elevation residual, intensity, and GLI, into a three-dimensional feature vector:
This feature vector provides a consistent input representation for subsequent modeling. In the GMM, these vectors are modeled as a weighted combination of several multivariate Gaussian distributions:
Specifically, the mean vector represents the centroid of the -th cluster in the three-dimensional feature space, while the covariance matrix describes the correlations among features. Through such joint modeling, the three features are transformed from independent 1-D descriptors into an integrated probabilistic representation, achieving feature fusion and allowing the model to draw on complementary features when one is weak, thereby enhancing class separability. GMM classifies the original data into a fixed number of categories based on the input features, thereby facilitating the distinction between ground and non-ground points in airborne LiDAR data [60]. The core of GMM comprises two main stages: parameter initialization and final parameter estimation.
(1) Parameter Initialization: GMM parameter initialization is typically performed using two methods: random initialization and K-means initialization. Compared to random initialization, K-means provides parameter estimates that are closer to the final values, thereby reducing the number of iterations and improving efficiency. As illustrated in Figure 4, the coarse filtering stage removed most outliers and high-elevation vegetation points, but the intensity feature still exhibited a right-skewed distribution with substantial class overlap. With uneven feature distributions, random initialization may lead to initial parameters deviating from the true cluster centers. In contrast, K-means more effectively captures the latent clustering structure, significantly accelerating the convergence of the GMM.
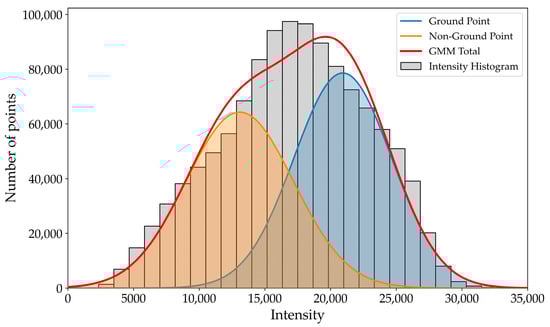
Figure 4.
GMM-Based Analysis of Intensity Distribution in Near-Surface LiDAR Point Clouds.
The goal of K-means clustering is to iteratively minimize the sum of squared Euclidean distances between each data point and the centroid of its assigned cluster. This process can be formally expressed as the minimization of the following objective function:
where is the set of samples assigned to the -th cluster, is the centroid of the -th cluster, which is determined by the mean of all feature vectors in , is the -th data sample in the dataset, and is the number of clusters.
The Euclidean distance between a sample and its corresponding cluster centroid is defined as:
where is the value of the -th sample in the -th feature dimensionality, is the value of the centroid of the -th cluster in the -th feature dimensionality, and is the number of features at each point (here, = 3).
By iteratively updating cluster centers and reassigning points until convergence, the algorithm yields the final centroids (means), within-cluster covariances, and cluster weights, as shown in Equation (9). These per-cluster quantities serve as the GMM’s initial parameters, as defined in Equation (10).
(2) Final Parameter Estimation: After the initial parameters are determined, the final parameters of the GMM were estimated using the EM algorithm. The EM algorithm consists of two core steps: the Expectation step (E-step) and the Maximization step (M-step), which are performed alternately until the model parameters converge. The definitions of these steps are as follows:
(a) E-step: In this step, the algorithm uses the current GMM parameter set to calculate the posterior probability that each data point belongs to each Gaussian component:
where is the Gaussian probability density function, which calculates the probability density of the data point under the j-th Gaussian distribution. The definition of the probability density function is:
(b) M-step: In this step, the model parameters within the GMM set are updated using the posterior probabilities computed during the E-step. Specifically, the mixture weight , mean vector , and covariance matrix of the th component are updated as follows:
where is the total number of points, and is the number of samples in -th cluster.
(c) Model Convergence Conditions: Let and represent the parameter sets obtained from the h and th iterations, respectively. The model convergence condition is defined as:
where is the convergence threshold set to 10−3, and is the maximum number of iterations set to 100. These values follow the default configuration of scikit-learn’s GMM and achieve a balance between convergence stability and computational efficiency [61].
Upon convergence of the model parameters, the probability of each point belonging to each GMM component can be derived. A point is classified as ground if its probability of belonging to the ground component exceeds that of the non-ground component. Figure 5 illustrates the clustering process during EM iterations, showing how the GMM progressively separates overlapping clusters.
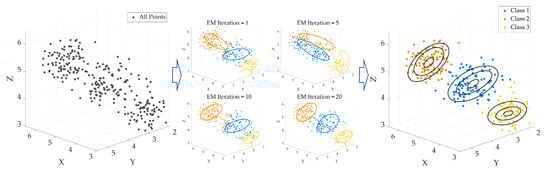
Figure 5.
Clustering Process of 3D Point Clouds Using GMM with EM Iterations.
The overall implementation process of the GMM-based classification is summarized in Figure 6.
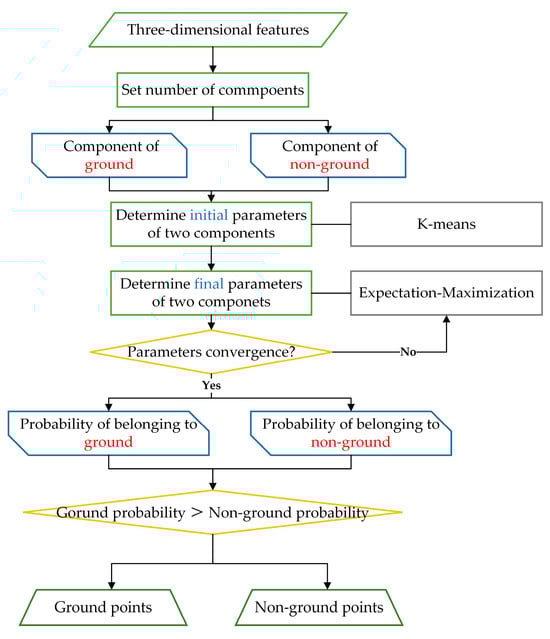
Figure 6.
Flowchart of GMM algorithm.
2.5. Ground Point Optimization Based on Mahalanobis Distance
The Mahalanobis distance is used to improve the classification results by measuring the degree to which each point deviates from the ground cluster based on the correlation between multiple features. As shown in Figure 7, unlike the Euclidean distance which treats each feature independently, the Mahalanobis distance includes the covariance structure between features, making it more robust in detecting outliers [62].
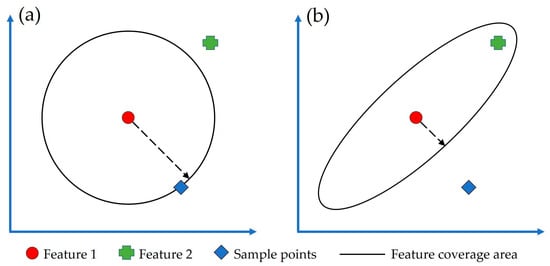
Figure 7.
Comparison of Euclidean (a) and Mahalanobis distances (b) in a two-dimensional feature space. The arrows indicate the feature coverage range along the given direction.
The calculation and decision rules are defined as follows:
Due to the high point density of airborne LiDAR data, there may be some adjacent points with high feature similarity that have not been completely removed. In the case of three-dimensional features, data within the range correspond to approximately 99% of the data. Therefore, we set as the distance threshold. Points exceeding this threshold are reclassified as non-ground points. The decision law is defined as follows:
3. Experiment and Results
3.1. Study Aea
The study area is located in the Yima Mining Area of Henan Province, China (spanning Luoyang and Sanmenxia, with geographic coordinates ranging from 112.14°E to 112.51°E and 34.53°N to 34.83°N). The undulating and densely vegetated terrain in this area presents a representative yet challenging environment for UAV LiDAR ground point extraction.
To acquire high-quality point cloud data, we conducted UAV LiDAR surveys over an 11.36 km2 mining area in July 2024. The survey utilized a CHCNAV BB4 Pro UAV platform integrated with an AU20 laser scanning system (detailed parameters in Table 1), operating at 120 m with a flight speed of 6 m/s and swath spacing of 71 m. The acquired data encompassed terrain elevations between 400 and 612 m, yielding an average point density of 665 pts/m2.

Table 1.
System parameters of the laser scanning system.
As shown in Figure 8, three representative plots with varying terrain and land cover conditions were selected to evaluate the proposed filtering algorithm. From Plot 1 to Plot 3, vegetation density increases progressively, and the complexity of ground point extraction rises accordingly. Plot 1 features a multi-layered vertical vegetation structure composed of trees and shrubs. Plot 2 consists of dense, low-height crops closely attached to the ground, leading to overlapping near-ground point clouds with blurred boundaries. Plot 3 contains irregular, low, and densely distributed natural vegetation with minimal height variation and indistinct contours, making ground point extraction the most difficult.
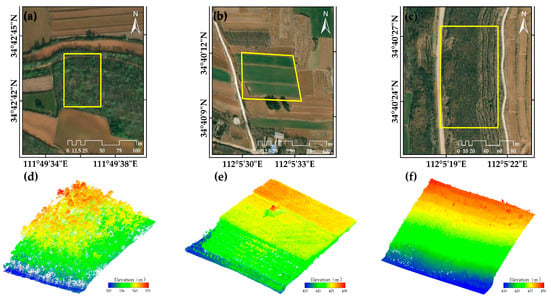
Figure 8.
Overview of the study area showing the locations of Plot 1, Plot 2, and Plot 3. (a–c) Orthophotos of the three plots; (d–f) corresponding point clouds colored by elevation.
To generate high-quality reference data, we use a semi-automatic annotation workflow consisting of two main stages: (1) initial point cloud filtering using CloudCompare (v2.13) software; (2) manual editing to correct classification errors. Table 2 provides an overview of the study plots with representative metrics, and Figure 9 illustrates the DEM generated from the manually validated ground points.
Table 2.
Overview of the Study Plots.
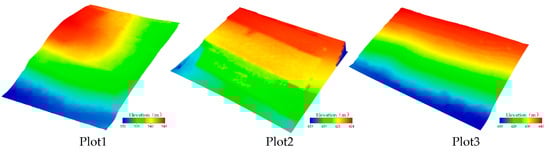
Figure 9.
Reference DEMs of the three plots.
3.2. Comparative Experiment Parameter Settings
To ensure a fair comparison with the proposed method, parameter optimization was conducted for each method across the three study areas. The optimal parameters were determined through iterative trial-and-error under the criterion of maximizing overall accuracy. For RandLA-Net, we followed common practice and used an 80% training/20% testing split. Table 3 summarizes the optimal parameter settings of the three methods across the different plots.
Table 3.
Optimized parameters of all the filtering methods on the four plots.
3.3. Accuracy Assessment
We adopted four accuracy metrics to quantitatively evaluate the performance of the algorithm: overall accuracy (), intersection over union for ground points ), intersection over union for non-ground points (), and F1-score. These metrics are defined as follows [63]:
where is the number of points correctly classified as ground, is the number of points correctly classified as non-ground, is the number of non-ground points incorrectly classified as ground, and is the number of ground points incorrectly classified as non-ground.
3.4. Qualitative Results
Figure 10, Figure 11 and Figure 12 illustrate the Type I errors (in red) and Type II errors (in blue) of all filtering methods across the three study areas. In Plot 1, CSF and SBF perform poorly in regions with gradual slope transitions, whereas PMF and the proposed method show more stable performance with better terrain preservation. Specifically, CSF produces significant Type I errors at the slope base, as seen in the elliptical region (Figure 10a), leading to the omission of many ground points. SBF shows poor performance in areas with densely distributed low vegetation that includes the elliptical region (Figure 10b), where it fails to distinguish between ground and non-ground points. This may be attributed to its use of a fixed slope threshold, which limits its adaptability in such complex environments. As shown in Figure 10d, RandLA-Net still shows deficiencies in removing low vegetation, where a number of non-ground points are misclassified as ground. This limitation mainly arises from the lack of large-scale annotated training data, which restricts the model’s generalization in complex vegetation-covered terrains. In contrast, PMF and the proposed method exhibit more stable performance, with sparser error distributions and better preservation of terrain structure. However, in areas with densely distributed low vegetation, the proposed method appears to reduce Type I errors more effectively (Figure 10c,e).
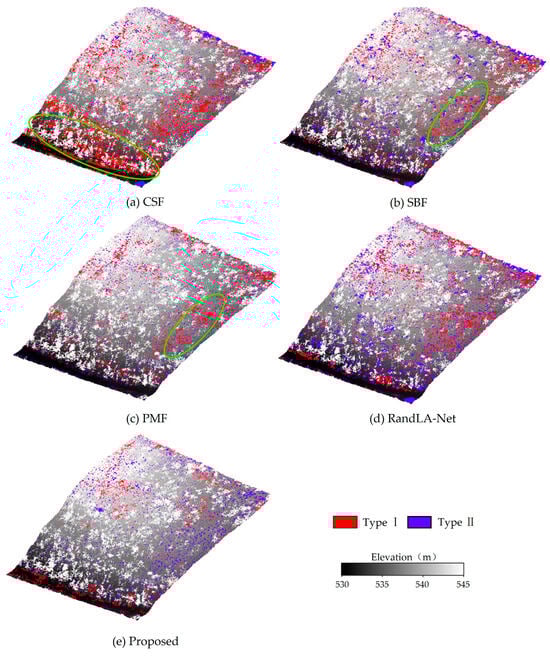
Figure 10.
Type I and Type II Errors of All Filtering Methods in Plot 1.
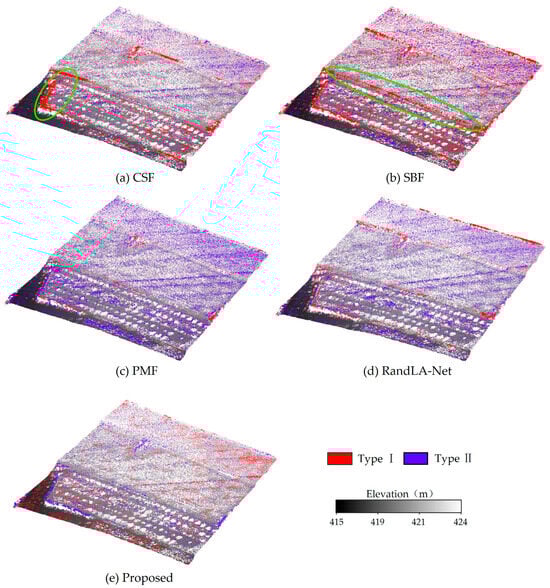
Figure 11.
Type I and Type II Errors of All Filtering Methods in Plot 2.
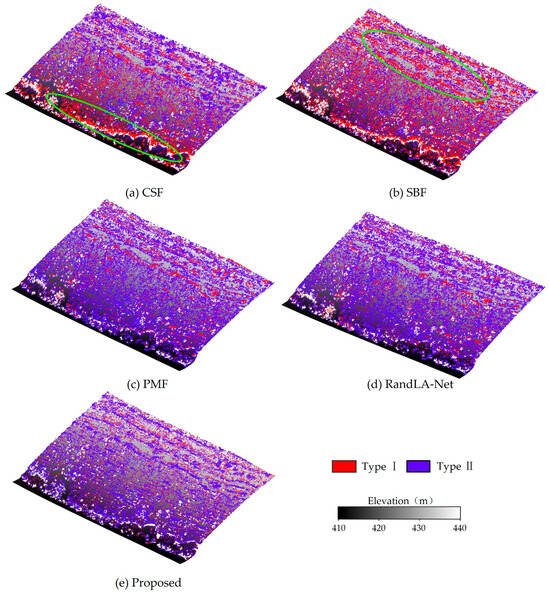
Figure 12.
Type I and Type II Errors of All Filtering Methods in Plot 3.
Plot 2 is characterized by a terraced structure covered with densely planted crops. The minimal elevation difference between the crop base and the ground makes ground point classification more challenging in this area. SBF and CSF still produce a large number of Type I errors, particularly along field boundaries and gentle slopes (Figure 11a,b). PMF, on the other hand, struggles to capture the subtle elevation variations at the base of dense crops due to the limited sensitivity of its morphological operations, resulting in a significant increase in Type II errors (Figure 11c). RandLA-Net, as a supervised model, performs relatively well in areas with slope variations and shows better control of Type I errors; however, as shown in Figure 11d, it still produces more Type II errors compared to CSF, SBF, and the proposed method. In contrast, the proposed method integrates multiple features and maintains better performance in filtering out non-ground points in such complex regions (Figure 11e).
Finally, as the vegetation cover shifts from regularly arranged and densely planted crops to a more irregular and structurally diverse natural mountainous environment, the difficulty of ground point filtering in Plot 3 increases substantially. Overall, the classification accuracy of all five methods shows a slight decline. As shown in the elliptical regions (Figure 12a,b), CSF and SBF frequently produce Type I errors in areas with abrupt terrain changes, reflecting the same limitations discussed in previous plots. PMF continues to suppress Type I errors effectively, but still fails to distinguish dense low vegetation from the ground, resulting in a large number of Type II errors (Figure 12c). As shown in Figure 12d, RandLA-Net produces more Type II errors in Plot 3 compared with the other two plots, particularly in densely vegetated regions, although it performs relatively well in slope variation areas. This suggests that in dense low vegetation where features are highly similar, the model may still encounter classification confusions. In contrast, although the proposed method produces some Type II errors, it results in fewer Type I errors than CSF and SBF and fewer Type II errors than RandLA-Net and PMF (Figure 12e). Overall, the proposed approach appears more accurate than other filtering methods, and it can fully exploit the input features without relying on training samples, thereby maintaining a low Type I error rate while effectively reducing Type II errors.
Overall, as the complexity of vegetation cover increases across the study areas, traditional rule-based filtering methods gradually fail to maintain both filtering accuracy and structural integrity. By comparison, the proposed method consistently exhibits strong adaptability in all regions. Particularly in Plot 3, the proposed method maintains effective suppression of Type II errors while further reducing Type I errors, thereby achieving a better balance between the two types of errors. Deep learning-based RandLA-Net also demonstrates competitive performance, especially in slope variation areas; however, due to the lack of sufficient annotated training samples in this study, it produces more Type II errors in densely vegetated regions. These results indicate that the proposed filtering method has relatively good performance and stability under different vegetation complexity conditions, while its unsupervised nature avoids the dependence on large-scale training data.
3.5. Quantitative Results
Table 4 presents the filtering accuracy of all methods across the three study areas. In terms of , the proposed method achieves the highest accuracy in both Plot 2 and Plot 3, with respective values of 95.50% and 89.67%, outperforming all other competing methods. In Plot 1, although PMF yields the highest , it differs from the proposed method by only 0.08%. Moreover, the proposed method still outperforms CSF, SBF, and RandLA-Net (96.45%). By contrast, CSF and SBF demonstrate unstable performance in all three areas. Their accuracy drops significantly in complex terrain, which indicates that these methods lack sufficient flexibility when dealing with densely vegetated or dramatically varying landscapes. On average, the proposed method achieves an of 94.14%, which is approximately 2.38%, 2.36%, and 1.73% higher than those of CSF (91.76%), SBF (91.78%), and PMF (92.41%), and 0.82% higher than RandLA-Net (93.32%). These results highlight its robustness and filtering stability in densely vegetated areas.
Table 4.
Quantitative results of five algorithms (%).
For evaluation, the proposed method maintains strong performance in challenging regions, achieving 89.16% in Plot 2 and 84.60% in Plot 3. These results demonstrate its capability to accurately extract ground points under varying vegetation conditions. Although PMF achieves a higher of 91.78% in Plot 1, its performance degrades in more densely vegetated areas. In contrast, CSF and SBF exhibit limited adaptability in complex environments, as evidenced by their low in Plot 3. This limitation likely stems from their reliance on predefined filtering rules, which often fail to preserve fine ground details in complex scenarios. Additionally, RandLA-Net achieves values of 89.35%, 84.16%, and 80.98% in Plot 1, Plot 2, and Plot 3, respectively, with an average of 84.83%; it is reasonably competitive in Plot 1 but degrades in the more densely vegetated plots (Plot 2–3). In conclusion, the proposed method attains an average of 88.45% across all test plots, demonstrating robust and reliable ground point extraction across diverse environments.
In terms of non-ground point discrimination, the proposed method exhibits robust performance across all three plots, with of 96.08%, 92.86% and 76.11%, respectively. CSF and SBF both exhibit relatively low values in complex environments, particularly in Plot 3, where their performance drops to 71.82% and 74.63%, respectively. This decline highlights their limitation in distinguishing non-ground points under dense vegetation and irregular surface structures. Although PMF achieves the highest in Plot 1 (96.19%), this advantage does not hold in complex environments, suggesting limited adaptability. RandLA-Net is weaker in Plots 1–2 but achieves the highest in Plot 3 (81.34%), indicating better non-ground extraction in complex environments. Throughout all plots, although RandLA-Net attains the highest average of 89.08%, it differs from the proposed method by only 0.73%. Moreover, the difference between and for the proposed method is only 0.10%, considerably smaller than that of CSF (1.68%), SBF (2.22%), and PMF (0.75%) as well as RandLA-Net (4.25%), reflecting its capacity to simultaneously preserve ground details and suppress non-ground noise.
Among all the evaluation metrics, the F1-score further confirms the robustness of the proposed method, reaching 95.62%, 94.27%, and 91.66% in the three regions, respectively. On average, the proposed method achieves the highest F1-score of 93.85%, outperforming CSF (90.81%), SBF (90.69%), PMF (92.25%), and RandLA-Net (91.76%). The above results collectively indicate that as the complexity of the environment increases, traditional methods tend to lose stability, while the proposed method has stronger robustness and adaptability.
4. Discussion
4.1. Parameter Sensitivity Analysis with Different Terrains
The proposed algorithm involves three main parameters: the grid size for coarse extraction (), the elevation threshold for coarse extraction (), and the grid size for fine extraction (). The settings of these parameters were based on experience or derived from data analysis. For , the grid size must be larger than the shortest edge of the largest object in the study area; otherwise, histogram misfitting may occur and object points could be misclassified as ground, while an excessively large grid size would smooth out terrain details. The follows a similar approach to CSF but still requires experimental validation, and likewise needs to be empirically and experimental determined.
Plot 1 is a slope with segmented undulations, where the gradient varies noticeably across different sections. Plot 2 is a terraced surface with distinct elevation differences. Plot 3 is a continuous slope, which is steeper and more uniform compared to the segmented terrain of Plot 1. By analyzing the performance of different parameter settings in these plots, the stability of parameter settings under different terrain conditions can be revealed. The results are shown in Figure 13.
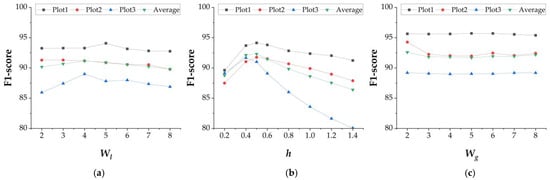
Figure 13.
Parameter-Based Sensitivity Analysis. (a) grid size for coarse extraction; (b) elevation threshold for coarse extraction; (c) grid size for GMM.
Figure 13a illustrates the effect of varying the coarse extraction grid size . As increases from 2 m to 8 m, the F1-score shows a gradual rise followed by a slow decline, with the best performance observed around 5 m. In addition, different plots exhibit varying responses to . For example, Plot 2 shows a general decline in F1-score as increases, whereas Plot 3 displays a rising-then-falling trend. This divergence is likely attributable to differences in terrain characteristics and vegetation density across the plots. From the analysis of different terrains, Plot1 with its relatively balanced elevation distribution shows smaller performance fluctuations under varying grid sizes; Plot 2, characterized by a terraced structure, exhibits a gradual decline in performance as increases, reflecting the influence of step-like topography; and Plot 3 with its steep slope shows stronger sensitivity to grid size. Overall, follows a broadly consistent trend. It becomes more sensitive in complex topography, so terrain-aware adjustment is recommended to ensure robustness and adaptability. the parameters demonstrate a certain degree of universality across terrains, but targeted adjustments are still necessary in complex areas to ensure robustness and adaptability.
Figure 13b illustrates the sensitivity of classification accuracy to the elevation threshold , presenting a clear trend of initial increase followed by a gradual decrease. The optimal performance appears around 0.4–0.5 m, where the threshold effectively removes low vegetation and clutter while preserving subtle terrain variations. Specifically, a threshold set too low may lead to Type I errors, while an overly high threshold tends to retain tree trunks, distorting slope fitting in PCA and thereby resulting in Type II errors. This phenomenon becomes more pronounced with increasing vegetation density. In summary, exhibits high stability across different terrains, with its optimal value consistently concentrated around ≈0.5 m. Setting to a fixed default of about 0.5 m suffices for cross-terrain applications; only in areas of exceptionally dense vegetation should small, conservative adjustments around this default be made to maintain robustness.
Figure 13c shows the effect of the GMM window grid size on classification performance. Notably, the F1-score of Plot 2 drops clearly between 2 m and 3 m. This trend can be attributed to the regular planting pattern of croplands, where vegetation is arranged in uniformly spaced rows. Specifically, a smaller grid can span multiple crop rows, preserving local structural integrity while enhancing the retention of ground surface details. In contrast, larger windows, although offering greater statistical stability, tend to smooth out local variations, resulting in slightly reduced classification accuracy but more stable overall performance. Overall, demonstrates relatively stable performance across diverse terrains, highlighting the robustness and reliability of the proposed method.
The parameter sensitivity analysis across different terrain conditions indicates that all parameters generally exhibit good stability. However, in areas with higher vegetation density or more pronounced terrain relief, parameter settings still need to be considered in conjunction with specific vegetation cover and topographic characteristics to ensure the robustness and adaptability of the method. For practical applications, it is advisable to set and to values smaller than 5 m, while fixing the elevation threshold at approximately 0.5 m to balance classification accuracy and computational efficiency.
4.2. Comparative Analysis of Single-Feature and Multi-Feature GMM
To evaluate the impact of each feature on ground point extraction, we conducted experiments using each individual feature and compared the results with those from a multi-feature configuration. The results for Plot 1, Plot 2, and Plot 3 are presented in Table 5.
Table 5.
Comparison of F1-scores (%) of the proposed method using single- and multi-feature inputs.
In general, the multi-feature model achieved the highest overall F1-score (93.90); this result highlights the advantage of combining geometrical, radiometric, and spectral features. Among the individual features, intensity showed the poorest results (average F1-score 75.23%). This is mainly because it is sensitive to surface reflectance, laser incidence angle, and canopy occlusion. Compared to intensity, GLI showed better performance, with an average F1-score of 89.01%. In Plot 1, its result was close to the multi-feature model, likely because sparse low shrubs allowed the vegetation index to distinguish ground points effectively. However, its effectiveness declined as vegetation cover increased. Comparatively, elevation residual was the only feature that demonstrated overall stability, with an average F1-score of 93.32%. This suggests that, even under varying complex environments, elevation residual as a geometric descriptor can effectively distinguish ground points from non-ground points.
To further illustrate the differences in classification performance, Figure 14 shows the spatial distribution of misclassified points under three single-feature configurations in Plot 2. As shown in Figure 14a, the single feature result based on intensity has a large number of Type I errors in the entire area. In contrast, the performance of GLI (Figure 14b) is significantly better than intensity in regular crop areas. However, GLI still cannot effectively filter non-ground points in areas where shrubs and crops are mixed (such as circular areas). Compared with the above features, the elevation residual feature performs better in identifying ground points. However, its reliance on only local elevation variation limits the ability to capture fine terrain details. As shown in the elliptical region in Figure 14c, using elevation residuals as a single feature leads to misclassifications that are more widely spread across the area. Although the use of the multi-feature method (Figure 11d) may result in slightly increased misclassifications in certain localized areas, it better preserves terrain details across most regions and achieves smaller overall errors.
Figure 14.
Type I and Type II errors of the proposed method using individual features on Plot 2: (a) Intensity, (b) GLI, and (c) Elevation Residual.
The above results show that individual features may perform well under specific conditions. However, combining multiple features within the GMM framework provides greater robustness and consistency across varied terrains and vegetation types.
4.3. Feature Ablation Experiments
To further assess the effectiveness of the three features, Figure 15, Figure 16 and Figure 17 present a comparison of classification results with and without each feature. The results show that incorporating the elevation residual consistently improves classification performance in all regions. On average, the introduction of elevation residual led to improvements of 13%, 7%, and 6% in , , and , respectively; the inclusion of GLI resulted in improvements of 7%, 5%, and 3% for these metrics; and the addition of intensity led to increases of 2%, 2%, and 1%. Specifically, as the density of low vegetation increases, the contribution of the elevation residual as a geometric feature becomes more prominent, while GLI and intensity, as spectral and reflectance features, tend to act in a complementary manner to the elevation residual. In farmland areas (Plot2) and natural vegetation-covered regions (Plot3), when the discriminative power of the elevation residual reaches saturation, these two features provide additional information that further improves overall classification performance. As shown in Table 5, the F1-score of the elevation residual is the highest, followed by GLI and then intensity, indicating that the model is primarily driven by the elevation residual, with GLI and intensity playing a complementary role in enhancing classification stability and accuracy under complex conditions.
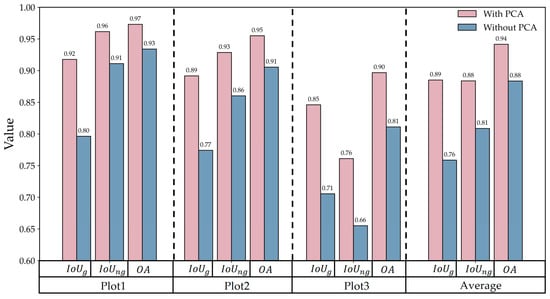
Figure 15.
Effect of the PCA-derived elevation residual on extraction performance.
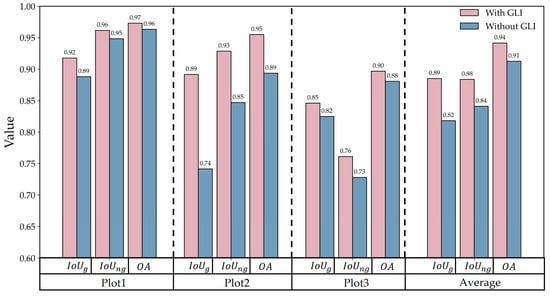
Figure 16.
Effect of the GLI on extraction performance.
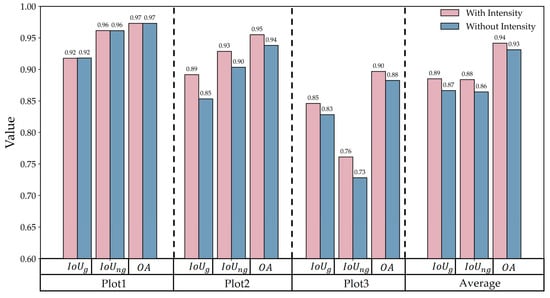
Figure 17.
Effect of the Intensity on extraction performance.
4.4. Analysis of Runtime and Algorithmic Efficiency
In terms of runtime performance, the spatial complexity of different study areas had a significant impact on overall efficiency, with the histogram-based coarse extraction stage taking considerably more time than the GMM stage. Specifically, Plot 1 contained a large number of trees and some low shrubs, resulting in a relatively simple point cloud distribution; Plot 2 represented farmland, where spatial complexity was primarily reflected in the extremely dense distribution of crops; and Plot 3 corresponded to a sloped terrain with extensive low vegetation coverage and a larger overall area than the other two plots. As shown in Figure 18, runtime increased substantially with vegetation density, with the main computational cost concentrated in the histogram-based coarse extraction stage. This stage requires calculating the elevation of all points within each grid and fitting a pseudo-waveform of ground elevation, and its efficiency is therefore jointly constrained by both point cloud density and grid size. Table 2 and Table 3 further illustrate this: although Plot 2 contained fewer points than Plot 1, its histogram computation time was higher due to the use of smaller grid divisions. This indicates that the efficiency of the histogram stage is not solely determined by the total number of points but is strongly influenced by the combined effects of point cloud scale and grid resolution. In contrast, once the coarse extraction is completed and only low vegetation and ground points remain, the runtime of the GMM stage is more dependent on the overall size of the study area and less affected by vegetation density. Overall, these findings reveal that the computational bottleneck of the proposed method under complex surface conditions lies mainly in the histogram construction stage, whereas the GMM stage remains relatively stable. Future improvements should therefore prioritize the optimization of computational efficiency in the histogram stage to enhance the scalability of the method for larger and more complex datasets.
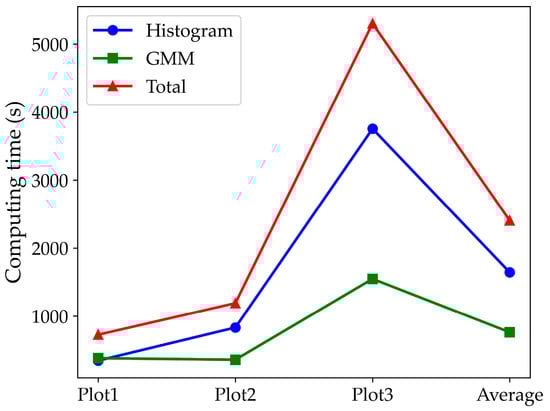
Figure 18.
Runtime efficiency of the proposed algorithm under different plots.
5. Conclusions
To accurately extract ground points from LiDAR point clouds in areas covered by dense vegetation, this paper proposes a two-stage filtering framework that integrates elevation frequency histograms and a multi-feature GMM. In the first stage, the elevation frequency histogram is used to rapidly identify potential ground points and remove a large number of non-ground points. In the second stage, three features, namely, elevation residuals, laser intensity, and GLI, are fed into the GMM, which can improve ground extraction accuracy and stability. The main conclusions are as follows:
- (1)
- The proposed method achieves 94.14% , 88.45% , 88.35% , and 93.85% F1-score across the three representative study areas. Compared with CSF, SBF, and PMF, and are increased by 2.73–5.35% and 3.03–3.48%, respectively, while and F1-score are improved by 1.73–2.38% and 1.60–3.16%. The experimental results demonstrate that the proposed method performs well in complex environments, especially in areas densely covered by low vegetation.
- (2)
- The multi-feature GMM shows higher classification accuracy and stronger robustness across different types of vegetation cover. Among the three features that are fed into the GMM, the elevation residual, as a geometric feature, demonstrates the greatest stability and discriminative ability in areas where ground boundaries are blurred due to dense vegetation cover.
Although the proposed method demonstrates its effectiveness in the study areas, it still relies on a few manually defined parameters, which may limit its adaptability in large-scale or highly variable environments. In addition, the parameter tuning process is often time-consuming and subjective, especially under complex terrain conditions. Future research will aim to improve the robustness and automation of the proposed method in more complex scenarios.
Author Contributions
Conceptualization, C.L. and H.W.; methodology, C.L., J.C. and H.W.; software, C.W.; validation, C.L., B.F. and X.L.; formal analysis, H.W. and B.F.; investigation, C.L.; resources, X.L.; data curation, B.F.; writing—original draft preparation, C.L.; writing—review and editing, H.W., B.F. and X.L.; visualization, C.L.; supervision, C.W.; project administration, B.F.; funding acquisition, H.W. and C.W. All authors have read and agreed to the published version of the manuscript.
Funding
This research was funded by the State Key Project of National Natural Science Foundation of China–Key projects of joint fund for regional innovation and development [Grant No. U22A20566], the Fundamental Re-search Funds for the Universities of Henan Province [Grant No. NSFRF220203], and Surveying and mapping Science and Technology “double first-class” project (Grant No. SYSB202503, XJBS202505).
Data Availability Statement
Data are available upon request.
Conflicts of Interest
The authors declare no conflicts of interest.
References
- Kraus, K.; Pfeifer, N. Determination of terrain models in wooded areas with airborne laser scanner data. ISPRS J. Photogramm. Remote Sens. 1998, 53, 193–203. [Google Scholar] [CrossRef]
- Chen, Z.; Gao, B.; Devereux, B. State-of-the-art: DTM generation using airborne LIDAR data. Sensors 2017, 17, 150. [Google Scholar] [CrossRef]
- Hui, Z.; Jin, S.; Xia, Y.; Nie, Y.; Xie, X.; Li, N. A mean shift segmentation morphological filter for airborne LiDAR DTM extraction under forest canopy. Opt. Laser Technol. 2021, 136, 106728–106743. [Google Scholar] [CrossRef]
- Bigdeli, B.; Amirkolaee, H.A.; Pahlavani, P. DTM extraction under forest canopy using LiDAR data and a modified invasive weed optimization algorithm. Remote Sens. Environ. 2018, 216, 289–300. [Google Scholar] [CrossRef]
- Hui, Z.; Cheng, P.; Ziggah, Y.; Nie, Y. A threshold-free filtering algorithm for Airborne LiDAR point clouds based on expectation-maximization. Int. Arch. Photogramm. Remote Sens. Spat. Inf. Sci. 2018, 42, 607–610. [Google Scholar] [CrossRef]
- Chen, C.; Guo, J.; Wu, H.; Li, Y.; Shi, B. Performance comparison of filtering algorithms for high-density airborne LiDAR point clouds over complex LandScapes. Remote Sens. 2021, 13, 2663. [Google Scholar] [CrossRef]
- Chen, C.; Xu, L.; Hao, J.; Li, Y.; Chen, D. Efficient interpolation-based and terrain-adaptive hierarchical filter for ultra-large-scale point cloud over complex landscapes. Opt. Laser Technol. 2025, 187, 112860–112875. [Google Scholar] [CrossRef]
- Tarolli, P. High-resolution topography for understanding Earth surface processes: Opportunities and challenges. Geomorphology 2014, 216, 295–312. [Google Scholar] [CrossRef]
- Sithole, G.; Vosselman, G. Experimental comparison of filter algorithms for bare-Earth extraction from airborne laser scanning point clouds. ISPRS J. Photogramm. Remote Sens. 2004, 59, 85–101. [Google Scholar] [CrossRef]
- Wallace, L.; Lucieer, A.; Watson, C.; Turner, D. Development of a UAV-LiDAR system with application to forest inventory. Remote Sens. 2012, 4, 1519–1543. [Google Scholar] [CrossRef]
- Serifoglu, C.; Gungor, O.; Yilmaz, V. Performance evaluation of different ground filtering algorithms for uav-based point clouds. Int. Arch. Photogramm. Remote Sens. Spat. Inf. Sci. 2016, 41, 245–251. [Google Scholar] [CrossRef]
- Meng, X.; Currit, N.; Zhao, K. Ground filtering algorithms for airborne LiDAR data: A review of critical issues. Remote Sens. 2010, 2, 833–860. [Google Scholar] [CrossRef]
- Zhao, X.; Su, Y.; Li, W.; Hu, T.; Liu, J.; Guo, Q. A comparison of LiDAR filtering algorithms in vegetated mountain areas. Can. J. Remote Sens. 2018, 44, 287–298. [Google Scholar] [CrossRef]
- Vosselman, G. Slope based filtering of laser altimetry data. Int. Arch. Photogramm. Remote Sens. 2000, 33, 935–942. [Google Scholar]
- Susaki, J. Adaptive slope filtering of airborne LiDAR data in urban areas for digital terrain model (DTM) generation. Remote Sens. 2012, 4, 1804–1819. [Google Scholar] [CrossRef]
- Kang, C.; Lin, Z.; Wu, S.; Lan, Y.; Geng, C.; Zhang, S. A triangular grid filter method based on the slope filter. Remote Sens. 2023, 15, 2930. [Google Scholar] [CrossRef]
- Zhang, K.; Chen, S.C.; Whitman, D.; Shyu, M.L.; Yan, J.; Zhang, C. A progressive morphological filter for removing nonground measurements from airborne LIDAR data. IEEE Trans. Geosci. Remote Sens. 2003, 41, 872–882. [Google Scholar] [CrossRef]
- Pingel, T.J.; Clarke, K.C.; McBride, W.A. An improved simple morphological filter for the terrain classification of airborne LIDAR data. ISPRS J. Photogramm. Remote Sens. 2013, 77, 21–30. [Google Scholar] [CrossRef]
- Liu, L.; Lim, S. A voxel-based multiscale morphological airborne lidar filtering algorithm for digital elevation models for forest regions. Measurement 2018, 123, 135–144. [Google Scholar] [CrossRef]
- Meng, X.; Lin, Y.; Yan, L.; Gao, X.; Yao, Y.; Wang, C.; Luo, S. Airborne LiDAR point cloud filtering by a multilevel adaptive filter based on morphological reconstruction and thin plate spline interpolation. Electronics 2019, 8, 1153. [Google Scholar] [CrossRef]
- Chen, C.; Chang, B.; Li, Y.; Shi, B. Filtering airborne LiDAR point clouds based on a scale-irrelevant and terrain-adaptive approach. Measurement 2021, 171, 108756. [Google Scholar] [CrossRef]
- Axelsson, P. DEM generation from laser scanner data using adaptive TIN models. Int. Arch. Photogramm. Remote Sens. 2000, 33, 110–117. [Google Scholar]
- Evans, J.S.; Hudak, A.T. A Multiscale Curvature Algorithm for Classifying Discrete Return LiDAR in Forested Environments. IEEE Trans. Geosci. Remote Sens. 2007, 45, 1029–1038. [Google Scholar] [CrossRef]
- Zhang, J.; Lin, X. Filtering airborne LiDAR data by embedding smoothness-constrained segmentation in progressive TIN densification. ISPRS J. Photogramm. Remote Sens. 2013, 81, 44–59. [Google Scholar] [CrossRef]
- Zhang, W.; Qi, J.; Wan, P.; Wang, H.; Xie, D.; Wang, X.; Yan, G. An easy-to-use airborne LiDAR data filtering method based on cloth simulation. Remote Sens. 2016, 8, 501. [Google Scholar] [CrossRef]
- Chen, C.; Guo, J.; Li, Y.; Xu, L. Segmentation-based hierarchical interpolation filter using both geometric and radiometric features for LiDAR point clouds over complex scenarios. Measurement 2023, 211, 112668. [Google Scholar] [CrossRef]
- Chen, C.; Li, Y.; Yan, C.; Dai, H.; Liu, G.; Guo, J. An improved multi-resolution hierarchical classification method based on robust segmentation for filtering ALS point clouds. Int. J. Remote Sens. 2016, 37, 950–968. [Google Scholar] [CrossRef]
- Yang, B.; Huang, R.; Dong, Z.; Zang, Y.; Li, J. Two-step adaptive extraction method for ground points and breaklines from lidar point clouds. ISPRS J. Photogramm. Remote Sens. 2016, 119, 373–389. [Google Scholar] [CrossRef]
- Fan, W.; Liu, X.; Zhang, Y.; Yue, D.; Wang, S.; Zhong, J. Airborne LiDAR Point Cloud Filtering Algorithm Based on Supervoxel Ground Saliency. ISPRS Ann. Photogramm. Remote Sens. Spat. Inf. Sci. 2024, 10, 73–79. [Google Scholar] [CrossRef]
- Ayazi, S.M.; Saadat Seresht, M. Comparison of traditional and machine learning base methods for ground point cloud labeling. Int. Arch. Photogramm. Remote Sens. Spat. Inf. Sci. 2019, 42, 141–145. [Google Scholar] [CrossRef]
- Bailey, G.; Li, Y.; McKinney, N.; Yoder, D.; Wright, W.; Herrero, H. Comparison of ground point filtering algorithms for high-density point clouds collected by terrestrial LiDAR. Remote Sens. 2022, 14, 4776. [Google Scholar] [CrossRef]
- Li, Y.; Ma, L.; Zhong, Z.; Liu, F.; Chapman, M.A.; Cao, D.; Li, J. Deep learning for lidar point clouds in autonomous driving: A review. IEEE Trans. Neural Netw. Learn. Syst. 2020, 32, 3412–3432. [Google Scholar] [CrossRef]
- Wang, B.; Wang, H.; Song, D. A filtering method for LiDAR point cloud based on multi-scale CNN with attention mechanism. Remote Sens. 2022, 14, 6170. [Google Scholar] [CrossRef]
- Rizaldy, A.; Persello, C.; Gevaert, C.; Oude Elberink, S.; Vosselman, G. Ground and multi-class classification of airborne laser scanner point clouds using fully convolutional networks. Remote Sens. 2018, 10, 1723. [Google Scholar] [CrossRef]
- Zhang, J.; Hu, X.; Dai, H.; Qu, S. DEM extraction from ALS point clouds in forest areas via graph convolution network. Remote Sens. 2020, 12, 178. [Google Scholar] [CrossRef]
- Chen, R.; Wu, J.; Zhao, X.; Luo, Y.; Xu, G. SC-CNN: LiDAR point cloud filtering CNN under slope and copula correlation constraint. ISPRS J. Photogramm. Remote Sens. 2024, 212, 381–395. [Google Scholar] [CrossRef]
- Duan, Y.; Yang, C.; Li, H. Low-complexity adaptive radius outlier removal filter based on PCA for lidar point cloud denoising. Appl. Opt. 2021, 60, E1–E7. [Google Scholar] [CrossRef] [PubMed]
- Liu, Z.; Xiao, X.; Zhong, S.; Wang, W.; Li, Y.; Zhang, L.; Xie, Z. A feature-preserving framework for point cloud denoising. Comput. Aided Des. 2020, 127, 102857. [Google Scholar] [CrossRef]
- Chen, Q.; Baldocchi, D.; Gong, P.; Kelly, M. Isolating individual trees in a savanna woodland using small footprint lidar data. Photogramm. Eng. Remote Sens. 2006, 72, 923–932. [Google Scholar] [CrossRef]
- Yan, W.Y.; Shaker, A.; Habib, A.; Kersting, A.P. Improving classification accuracy of airborne LiDAR intensity data by geometric calibration and radiometric correction. ISPRS J. Photogramm. Remote Sens. 2012, 67, 35–44. [Google Scholar] [CrossRef]
- Simoniello, T.; Coluzzi, R.; Guariglia, A.; Imbrenda, V.; Lanfredi, M.; Samela, C. Automatic filtering and classification of low-density airborne laser scanner clouds in shrubland environments. Remote Sens. 2022, 14, 5127. [Google Scholar] [CrossRef]
- Coren, F.; Sterzai, P. Radiometric correction in laser scanning. Int. J. Remote Sens. 2006, 27, 3097–3104. [Google Scholar] [CrossRef]
- Jutzi, B.; Gross, H. Investigations on surface reflection models for intensity normalization in airborne laser scanning (ALS) data. Photogramm. Eng. Remote Sens. 2010, 76, 1051–1060. [Google Scholar] [CrossRef]
- Zhang, X.; Gu, J.; Azam, B.; Zhang, W.; Lin, M.; Li, C.; Jing, W.; Akhtar, N. RSVMamba for Tree Species Classification Using UAV RGB Remote Sensing Images. IEEE Trans. Geosci. Remote Sens. 2025, 63, 5607716. [Google Scholar] [CrossRef]
- Eng, L.S.; Ismail, R.; Hashim, W.; Baharum, A. The use of VARI, GLI, and VIgreen formulas in detecting vegetation in aerial images. Int. J. Technol. 2019, 10, 1385–1394. [Google Scholar] [CrossRef]
- Štroner, M.; Urban, R.; Suk, T. Filtering green vegetation out from colored point clouds of Rocky terrains based on various vegetation indices: Comparison of simple statistical methods, support vector machine, and neural network. Remote Sens. 2023, 15, 3254. [Google Scholar] [CrossRef]
- Zhu, X.; Nie, S.; Wang, C.; Xi, X.; Hu, Z. A ground elevation and vegetation height retrieval algorithm using micro-pulse photon-counting lidar data. Remote Sens. 2018, 10, 1962–1984. [Google Scholar] [CrossRef]
- Buján, S.; Cordero, M.; Miranda, D. Hybrid overlap filter for LiDAR point clouds using free software. Remote Sens. 2020, 12, 1051. [Google Scholar] [CrossRef]
- Chen, N.; Wang, N.; He, Y.; Ding, X.; Kong, J. An improved progressive triangular irregular network densification filtering algorithm for airborne LiDAR data. Front. Earth Sci. 2023, 10, 1015153. [Google Scholar] [CrossRef]
- Wolberg, G.; Alfy, I. An energy-minimization framework for monotonic cubic spline interpolation. J. Comput. Appl. Math. 2002, 143, 145–188. [Google Scholar] [CrossRef]
- Lim, H.; Hwang, S.; Myung, H. ERASOR: Egocentric ratio of pseudo occupancy-based dynamic object removal for static 3D point cloud map building. IEEE Robot. Autom. Lett. 2021, 6, 2272–2279. [Google Scholar] [CrossRef]
- Lim, H.; Oh, M.; Myung, H. Patchwork: Concentric zone-based region-wise ground segmentation with ground likelihood estimation using a 3D LiDAR sensor. IEEE Robot. Autom. Lett. 2021, 6, 6458–6465. [Google Scholar] [CrossRef]
- Gomes, T.; Matias, D.; Campos, A.; Cunha, L.; Roriz, R. A survey on ground segmentation methods for automotive LiDAR sensors. Sensors 2023, 23, 601. [Google Scholar] [CrossRef]
- Nurunnabi, A.; Belton, D.; West, G. Diagnostic-robust statistical analysis for local surface fitting in 3D point cloud data. ISPRS Ann. Photogramm. Remote Sens. Spat. Inf. Sci. 2012, 1, 269–274. [Google Scholar] [CrossRef]
- Greenacre, M.; Groenen, P.J.; Hastie, T.; d’Enza, A.I.; Markos, A.; Tuzhilina, E. Principal component analysis. Nat. Rev. Methods Primers 2022, 2, 100. [Google Scholar] [CrossRef]
- Chassagnol, B.; Bichat, A.; Boudjeniba, C.; Wuillemin, P.-H.; Guedj, M.; Gohel, D.; Nuel, G.; Becht, E. Gaussian Mixture Models in R. R J. 2023, 15, 56–76. [Google Scholar] [CrossRef]
- Ng, H.T.; Ibrahim, H.; Rajendran, P. Statistical-based methods to improve precision of DBSCAN clustering algorithm for obstacle detection application in autonomous vehicles. Multimed. Tools Appl. 2025. [Google Scholar] [CrossRef]
- Morsy, S.; Shaker, A. Evaluation of LiDAR-derived features relevance and training data minimization for 3D point cloud classification. Remote Sens. 2022, 14, 5934. [Google Scholar] [CrossRef]
- Özdemir, E.; Remondino, F.; Golkar, A. An efficient and general framework for aerial point cloud classification in urban scenarios. Remote Sens. 2021, 13, 1985. [Google Scholar] [CrossRef]
- Ye, L.; Zhang, K.; Xiao, W.; Sheng, Y.; Su, D.; Wang, P.; Zhang, S.; Zhao, N.; Chen, H. Gaussian mixture model of ground filtering based on hierarchical curvature constraints for airborne lidar point clouds. Photogramm. Eng. Remote Sens. 2021, 87, 615–630. [Google Scholar] [CrossRef]
- Pedregosa, F.; Varoquaux, G.; Gramfort, A.; Michel, V.; Thirion, B.; Grisel, O.; Blondel, M.; Prettenhofer, P.; Weiss, R.; Dubourg, V. Scikit-learn: Machine learning in Python. E J. Mach. Learn. Res. 2011, 12, 2825–2830. [Google Scholar]
- Chen, S.; Nie, S.; Xi, X.; Xia, S.; Zhu, F.; Wang, C.; Zhu, X. A Novel Multi-Dimensional Statistics Denoising Algorithm Based on Gaussian Mixture Model for Photon-counting LiDAR Data. IEEE J. Sel. Top. Appl. Earth Obs. Remote Sens. 2024, 17, 13308–13323. [Google Scholar] [CrossRef]
- Qin, N.; Tan, W.; Ma, L.; Zhang, D.; Guan, H.; Li, J. Deep learning for filtering the ground from ALS point clouds: A dataset, evaluations and issues. ISPRS J. Photogramm. Remote Sens. 2023, 202, 246–261. [Google Scholar] [CrossRef]
Disclaimer/Publisher’s Note: The statements, opinions and data contained in all publications are solely those of the individual author(s) and contributor(s) and not of MDPI and/or the editor(s). MDPI and/or the editor(s) disclaim responsibility for any injury to people or property resulting from any ideas, methods, instructions or products referred to in the content. |
© 2025 by the authors. Licensee MDPI, Basel, Switzerland. This article is an open access article distributed under the terms and conditions of the Creative Commons Attribution (CC BY) license (https://creativecommons.org/licenses/by/4.0/).