1. Introduction
The NASA Clouds and the Earth’s Radiant Energy System (CERES) project [
1] provides data products for the climate community. The CERES Energy Balanced and Filled (EBAF) product monitors the Earth’s energy imbalance and is used for climate model validation [
2]. This product relies on the stability of the CERES instrument calibration on the Terra, Aqua, NPP, and NOAA20 platforms. The associated Moderate Resolution Imaging Spectroradiometer (MODIS) or Visible Infrared Imaging Radiometer Suite (VIIRS) imager retrieve cloud properties that are used to identify the scene type needed to select the appropriate angular directional model (ADM) to convert the CERES observed radiances into fluxes [
3]. Shortwave (SW) diurnal models are used to convert the instantaneous CERES fluxes into 24 h SW flux means. The SW diurnal models are based on the geostationary imager (GEO)-derived regional SW diurnal asymmetry factor computed from the hourly GEO narrowband- to broadband-derived fluxes. The diurnal asymmetry factor captures persistent diurnal cloud features such as maritime stratus and land afternoon convection observed by neither the 10:30 AM Terra or 1:30 PM Aqua, NPP, and NOAA20 orbits. Consistent MODIS, VIIRS, and GEO retrieved clouds, as well as harmonized GEO-derived broadband fluxes, are required to maintain the climate quality of the EBAF product [
4].
Both NASA and NOAA independent VIIRS calibration teams provide calibrated Level-1b reflectance products that rely on the same sensor onboard calibration systems. If a major VIIRS calibration anomaly occurs, the NASA dataset is reprocessed from the beginning of the record under a new collection number. For NOAA, VIIRS calibration improvements prompted by calibration anomalies are implemented in the forward processing stream, which might cause L1b reflectance discontinuities over the record. The NOAA calibration team monitors the VIIRS stability utilizing the solar diffuser, lunar looks, desert targets, deep convective clouds (DCC), and simultaneous nadir overpass (SNO) intercomparisons and fuses the various monitoring method results by utilizing a Kalman filter [
5]. The NASA VIIRS Characterization Support Team (VCST) mostly relies on onboard solar diffuser and lunar calibration systems and monitors the resulting L1b reflectances using Libya-4 desert, Dome C, and DCC, as well as SNOs [
6,
7]. The NOAA VIIRS calibration team also uses DCC to determine the individual detector stabilities, especially the detectors on the edge of the focal plane, as well as to validate the resulting Kalman filter-based L1b reflectances [
8]. Similarly, the VCST utilizes DCC to determine individual detector temporal drifts [
9]. VCST also monitors the versus scan angle response utilizing DCC [
10]. The CERES project utilizes the NASA-based MODIS and VIIRS L1b calibrated radiance products.
DCC targets are bright, tropical, nearly spectrally flat Lambertian solar diffusers over the visible (VIS) to near-infrared (NIR) spectrum for wavelengths less than 1 µm. DCC are located at the top of the atmosphere, mitigating the impact of atmospheric gaseous absorption and aerosol scattering. Unlike ground targets, DCC targets are not spatially or temporally fixed in location; however, DCC are easily identifiable utilizing an infrared (IR) window channel brightness temperature (BT) threshold. The DCC microphysics are a function of updraft speed and stage of its lifecycle [
11]. Therefore, the DCC reflectance is spatially, seasonally, and diurnally varying [
12]. However, the interannual DCC reflectance fluctuations remain small [
13]. The potential for using cloud targets to calibrate Advanced Very High Resolution Radiometer (AVHRR) with aircraft under flight was explored by Abel in 1991 [
14]. Vermote and Kaufman, in 1995 [
15], used DCC targets to intercalibrate the AVHRR 0.65 µm and 0.86 µm channels, since DCC are spectrally neutral and not impacted by water vapor absorption and were identified using a cold BT threshold. They noted that the DCC reflectivity increased with decreasing BT. Le Marshall et al., in 1999 [
16], used DCC targets to inter-calibrate AVHRR and GMS-5 visible radiances to minimize the impact of disparate band spectral response functions. POLDER channels were also intercalibrated using DCC [
17,
18]. The potential of calibrating satellite sensors against DCC simulated radiances was demonstrated using MODIS [
19] and geostationary imagers [
20].
The methodology of analyzing the DCC pixel radiances as a collective ensemble was first used to monitor the stability of the Tropical Rainfall Measuring Mission (TRMM)-CERES shortwave channel broadband radiances using a BT threshold of 205 K. This was accomplished by analyzing the individual footprint DCC radiances as a collective ensemble and through the use of a DCC Bidirectional Reflectance Distribution Function (BRDF) to account for the small angular reflectance dependencies [
21]. The large ensemble footprint radiances were histogrammed monthly and the probability density function (PDF) mode or peak frequency radiance was tracked over time to monitor the instrument stability. The PDF was skewed towards lower radiances, but the PDF-mode captured the brightest footprint radiances regardless of the low radiance histogram contribution. Afterwards, the CERES Imager and Geostationary Calibration Group (IGCG) incorporated the DCC invariant target (DCC-IT) methodology to determine the stability of the Terra-MODIS and Aqua-MODIS reflective solar band (RSB) channels [
22]. The CERES IGCG applied the DCC-IT methodology to track GEO imager stability and to radiometrically scale the GEO imagers to the Aqua-MODIS reference calibration [
4]. The CERES IGCG promoted the DCC-IT methodology within the Global Space-based Inter-Calibration System (GSICS) international community that pursues calibration best practices amongst the sensor calibration agencies [
23]. Sensitivity studies during this time optimized the DCC pixel identification thresholds, which required IR BT to be less than 205 K, the VIS and IR pixel homogeneity to be within 3% and 1 K, respectively, and the solar and view angle to be limited to less than 40°. The Hu BRDF model [
21] was utilized for mitigating the small DCC anisotropic reflectance features for VIS and NIR bands. However, radiative transfer model BRDFs were also used [
24].
For shortwave infrared (SWIR) bands, the DCC reflectivity is wavelength-dependent and is conditional on the cloud ice particle microphysics and atmospheric water vapor absorption. The Hu BRDF was found to be ineffective for resolving the anisotropic reflectance characteristics in the SWIR band radiances. The collective monthly mean radiance without BRDF adjustment was used to track the SWIR band stability. The SWIR band DCC radiance distribution was found to be Gaussian in shape [
25]. To improve the SWIR band methodology, the SWIR band radiances were characterized by angle, month, and band to produce empirical BRDFs based on 5 years of NPP-VIIRS DCC-IT observations. The empirical seasonal BRDFs reduced the SWIR band DCC response temporal variability by up to 50% [
25]. The success of the SWIR band empirical seasonal BRDFs prompted both NOAA and NASA VIIRS calibration teams to adopt empirical SWIR band DCC BRDFs as part of their operational monitoring [
7,
8]. The collaboration amongst instrument calibration teams in incorporating, developing, and improving the DCC-IT method has provided a more stable L1b calibrated radiance product for the remote sensing community.
It is well known that the DCC microphysics differs between land and ocean convection. Over land, DCC convection is stronger, forming taller and narrow cores with larger ice crystals that generate more intense precipitation during the dissipation phase. Over ocean, DCC convection is weaker and forms broader cores and anvils, with abundant water vapor where dissipation is achieved through cloud edge entrainment [
26]. Land DCCs exhibit a more efficient conversion of Convective Available Potential Energy to kinetic energy (vertical velocity), leading to stronger convection. Ocean DCCs have lower lifting condensation levels, translating to wider cores more prone to entrainment that weaken updrafts and lower the convective intensity [
27]. Ocean DCCs have more intense updrafts during the nighttime than during the day, whereas the land DCCs have more consistent diurnal convection intensities [
28]. The SWIR band DCC land reflectances are 3.2% to 6.9% brighter when compared to the ocean. Yet 70% of the DCC are found over ocean [
29]. The MODIS visible 0.65 µm band reflectance was also found to be brighter over land [
22]. By generating separate land and ocean monthly empirical BRDFs and adjusting the land DCC reflectances to the ocean reflectance reference, the SWIR band trend uncertainty was reduced by an additional 13% to 26% over the monthly empirical BRDF. It was noted that further spatial DCC radiance variations were observed within land and ocean domains, where the lowest DCC radiances were found over the Tropical Western Pacific (TWP) [
29]. It was suggested that, with adequate sampling, additional regional stratification could further reduce the SWIR band trend uncertainty.
The CERES IGCG continues improving the DCC-IT methodology in preparation for the CERES Edition 5 products, which will be based on the newly reprocessed MODIS Collection 7 (C7) and existing VIIRS Collection 2.1 datasets. The CERES IGCG provides independent MODIS and VIIRS stability assessments and mitigates any long-term drifts during CERES reprocessing efforts. DCC-IT improvements will increase the ability to detect smaller MODIS, VIIRS, or GEO calibration drifts with confidence. Once the imager calibration drifts have been corrected, the CERES IGCG will radiometrically scale the MODIS, VIIRS, and GEO imagers to the Aqua-MODIS C7 calibration reference.
The paper is outlined as follows.
Section 2 describes the DCC-IT methodology, which includes DCC pixel identification, BRDF anisotropic adjustments, aggregating the monthly DCC pixel radiances into PDFs, and tracking the VIIRS stability utilizing the mean, mode, and inflection point PDF statistics. This section performs BRDF and PDF statistic sensitivity studies to further reduce the DCC-IT linear trend standard errors. The DCC-IT methodology is applied to MODIS as well.
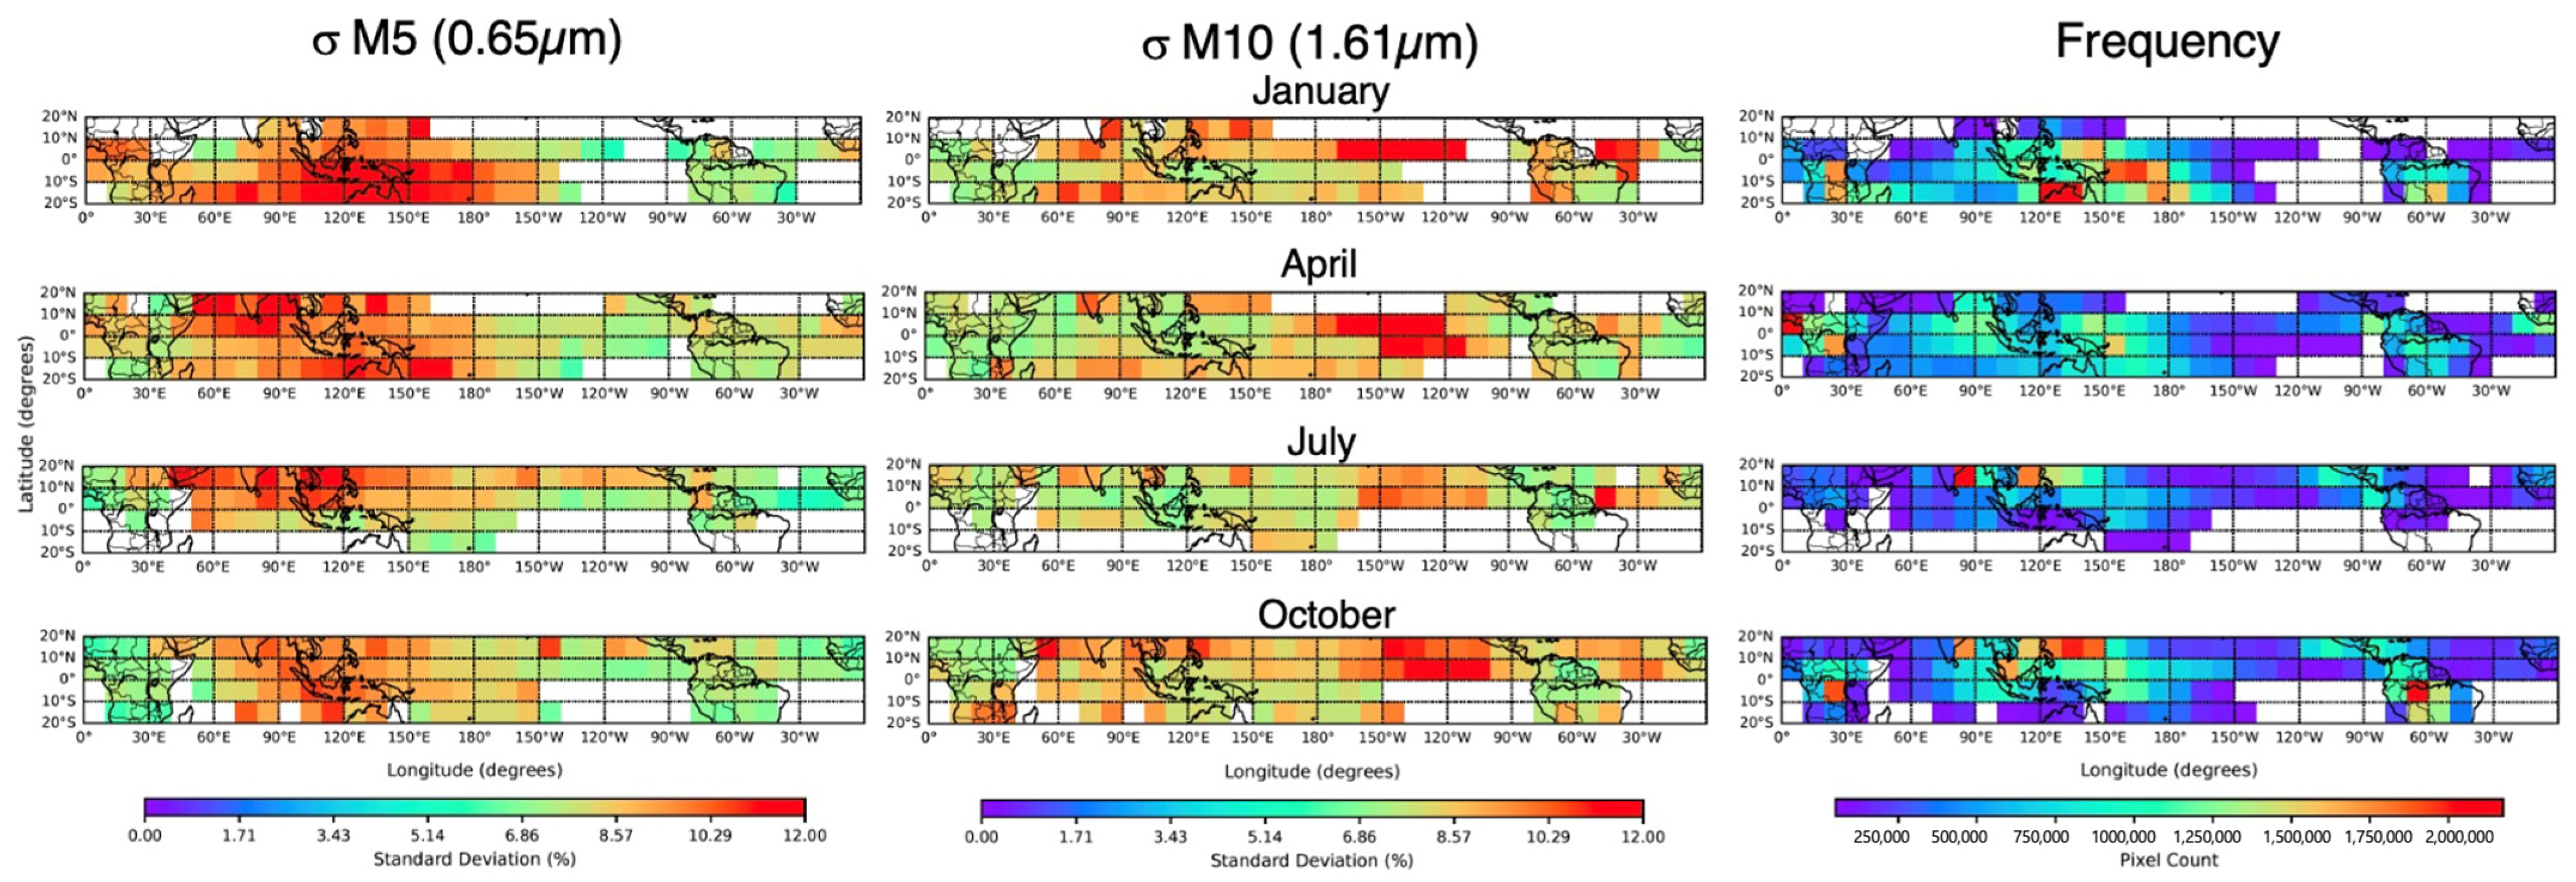
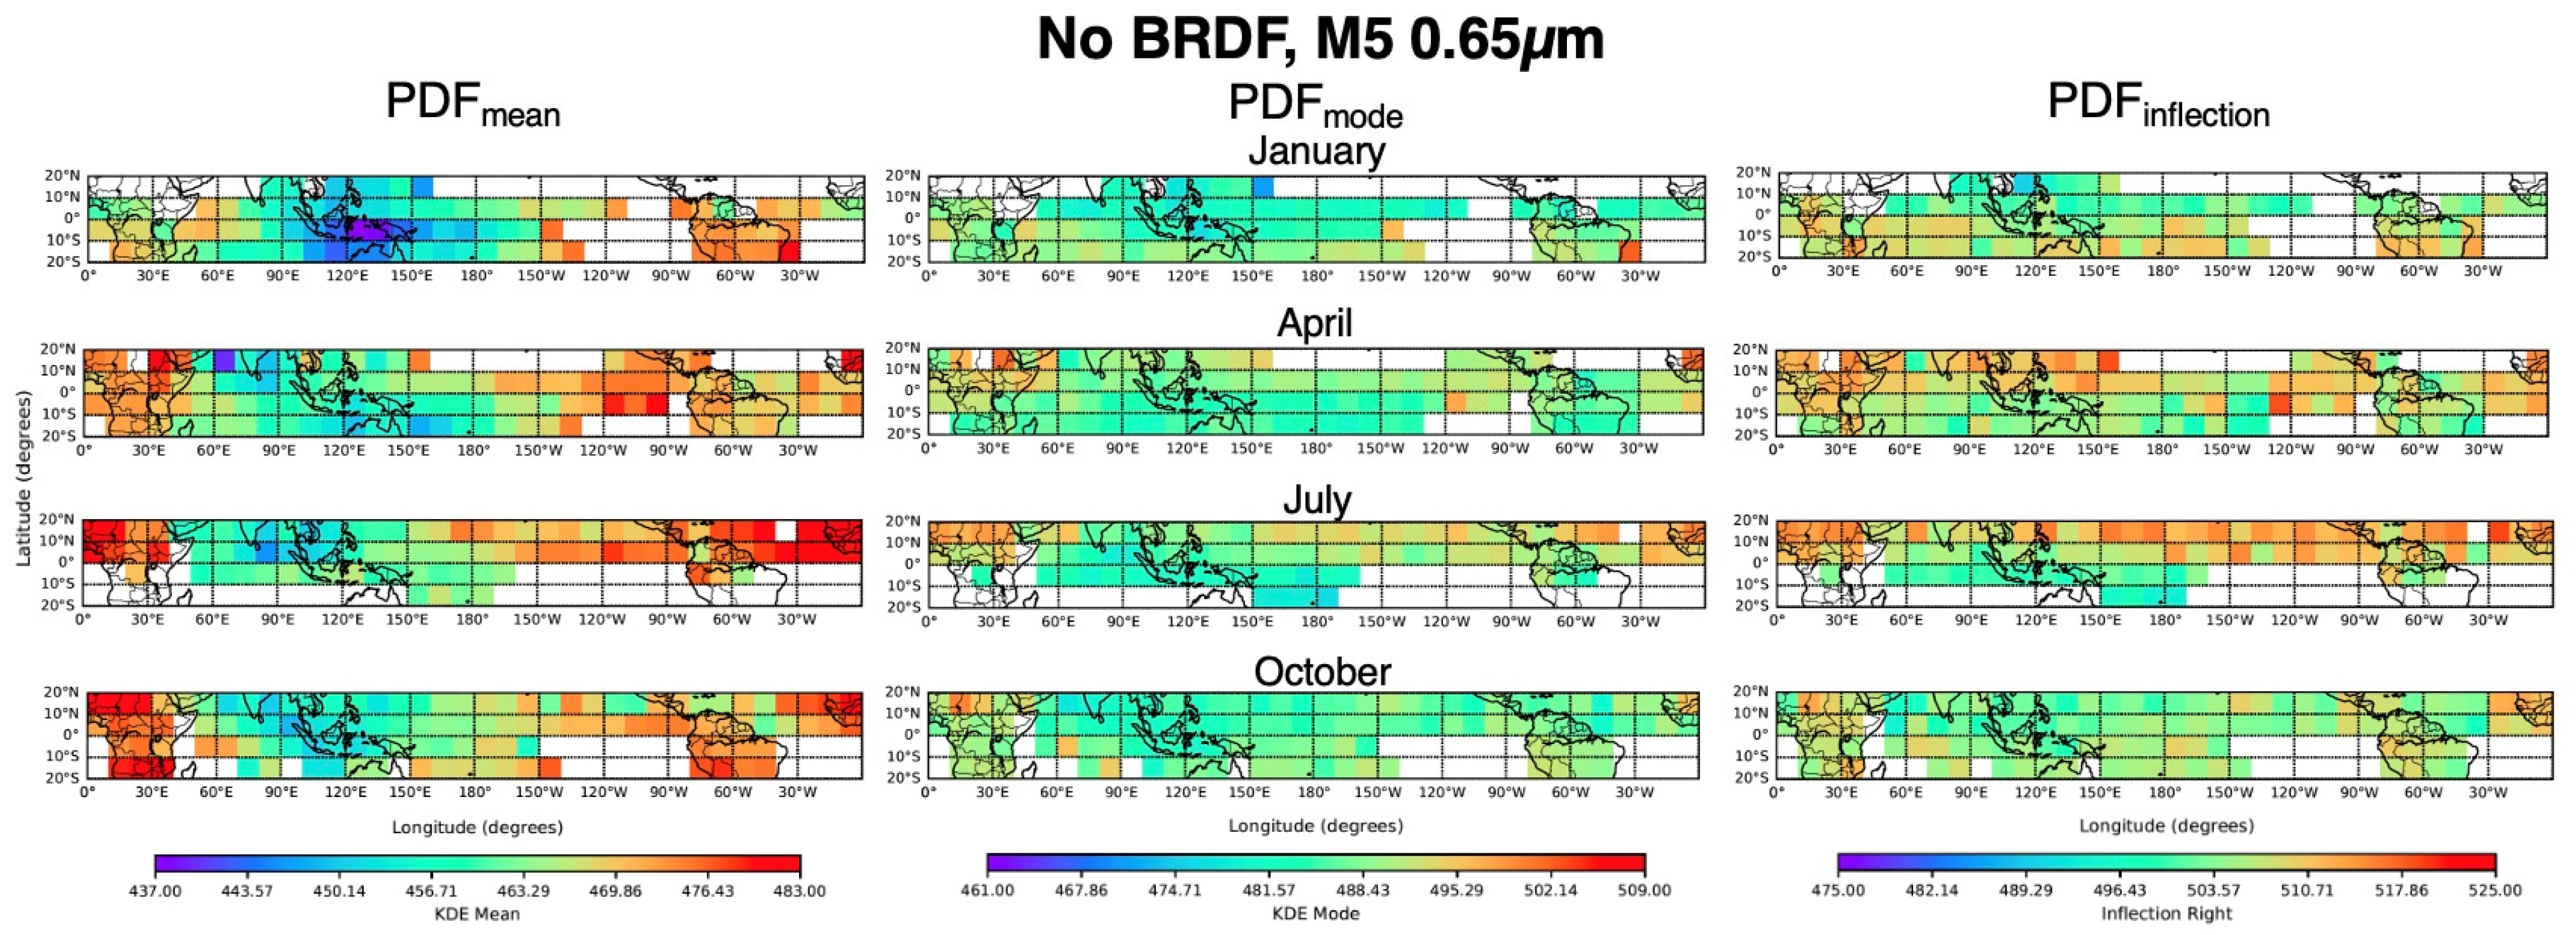
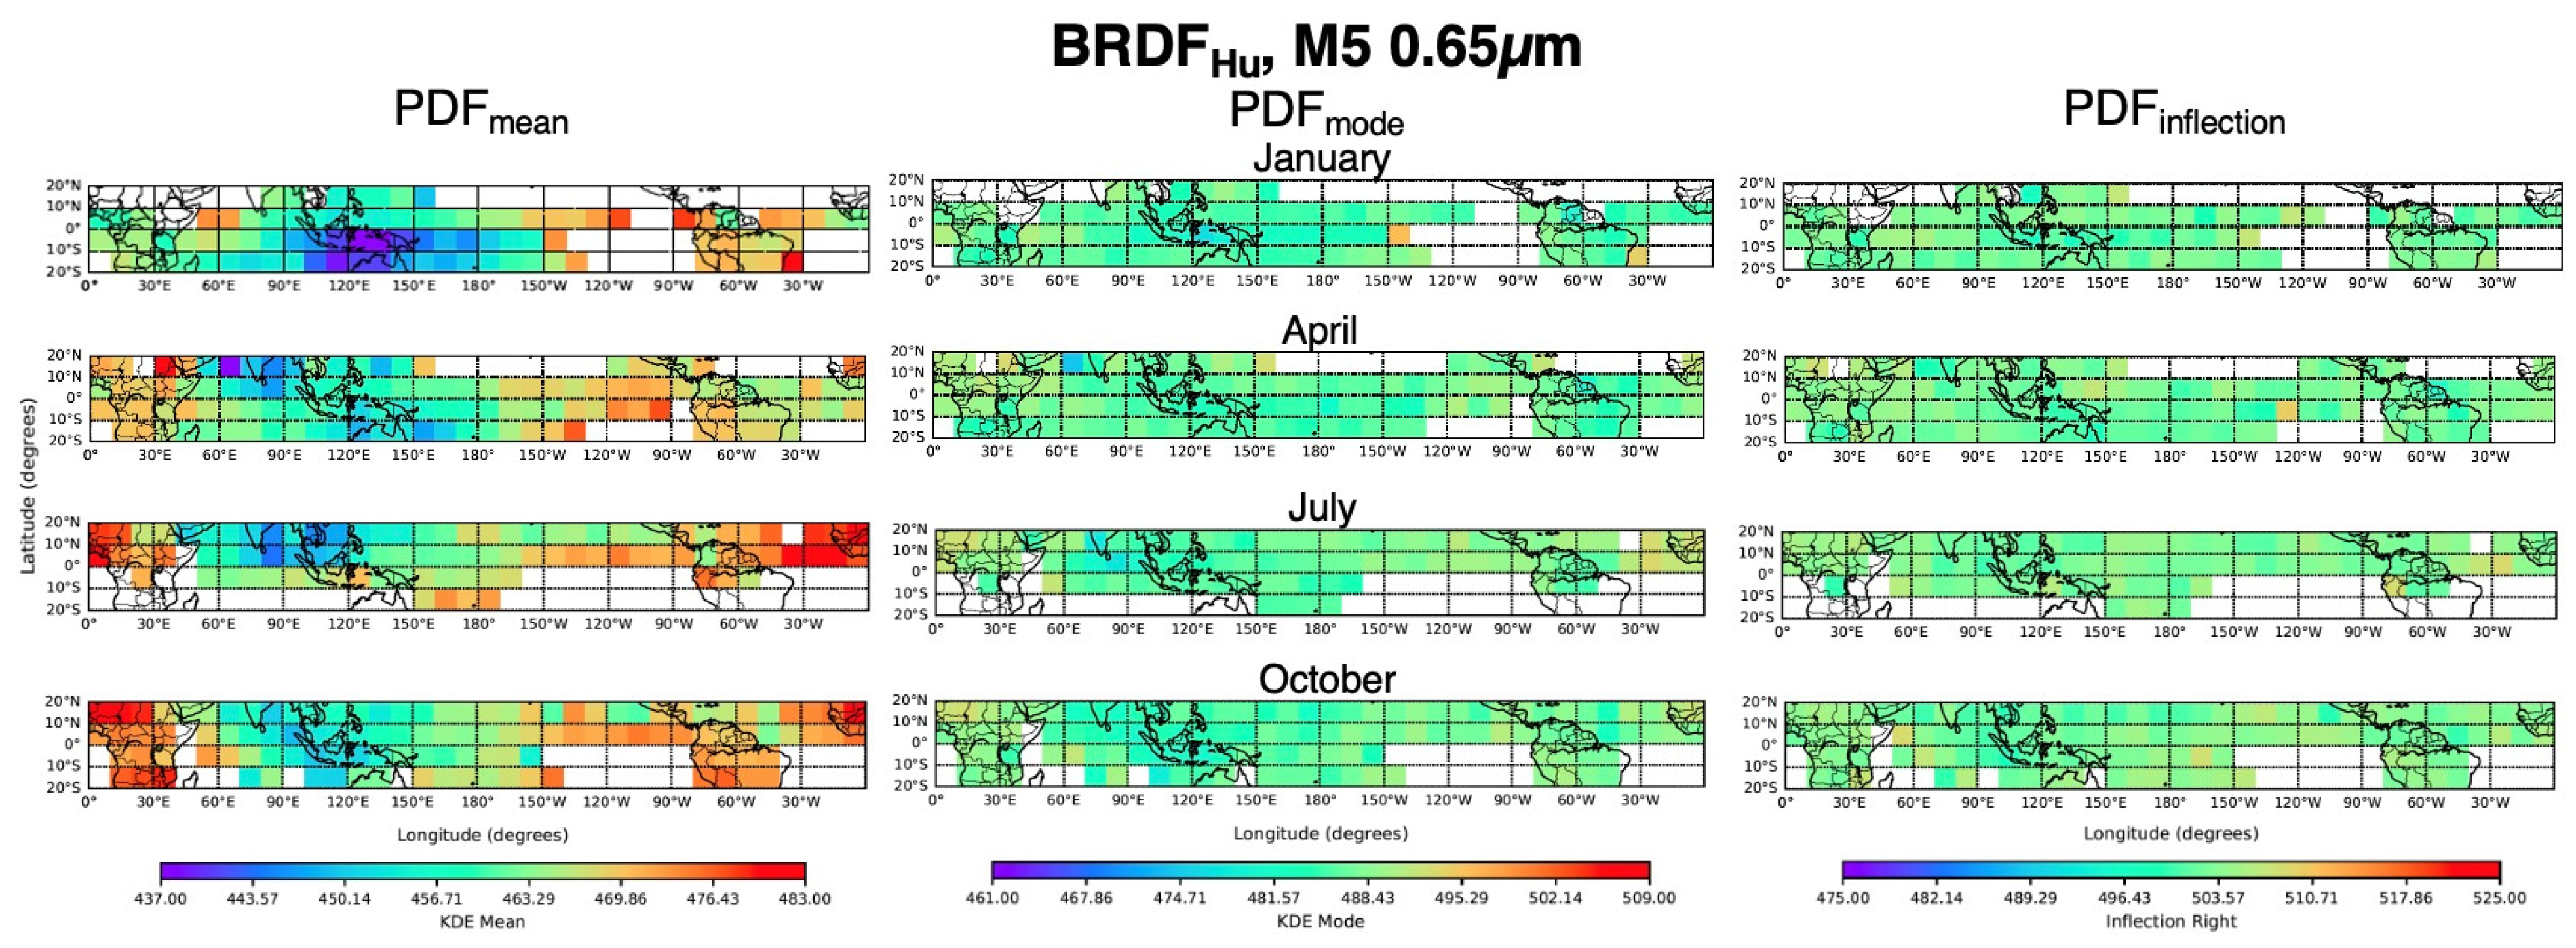
Section 3 validates the various DCC BRDFs and PDF statistics by comparing their regional monthly mean DCC radiance consistencies.
Section 4 compares the DCC-IT Terra-MODIS, Aqua-MODIS, NPP-VIIRS, and NOAA20-VIIRS visible and SWIR band trend standard errors. The lowest standard errors should provide an upper bound of the DCC-IT methodology uncertainty. Lastly,
Section 5 summarizes the findings.
2. Data and Methodology
2.1. Data
The Terra-MODIS and Aqua-MODIS Collection 6.1 and the NPP and NOAA20-VIIRS V2.1 L1b datasets were generated by the NASA Land Science Investigator-led Processing System. MODIS bands 1 (B1) and B2 have a spatial resolution of 250 m, whereas B3, B4, B5, B6, and B7 have a 500 m resolution, and the remaining channels are at 1 km resolution. For this study, the 250 m and 500 m pixel radiances were aggregated to the 1 km resolution. VIIRS has both imager (I) and moderate (M) resolution bands, with nominal pixel resolution of 375 m and 750 m, respectively. To maintain the pixel resolution across the scan swath, VIIRS uses internal pixel aggregation. In this study, the I channel pixel radiances were aggregated to match the 750 m pixel resolution of M bands. The MODIS and VIIRS L1b pixels were subsequently subsampled by utilizing every other line and pixel.
2.2. DCC-IT Identification
The DCC identification criteria for this study include locating pixels with MODIS B31 or VIIRS M15 11 µm BT less than 205 K. The 3 × 3 pixel spatial homogeneity filter was used to isolate the most spatially uniform convective cores that are least impacted by three-dimensional cloud structures and core edges. The B1/M5 0.65 µm and B31/M15 11 µm IR BT spatial homogeneity thresholds less than 3% and 1 K, respectively, were used to identify DCC pixels. The observed pixel solar zenith and view zenith angle were limited to 40° to capture the more Lambertian part of the DCC reflectance. The DCC identified pixels were confined to a ±20° latitude zone.
2.3. DCC-IT BRDFs
In this study, the MODIS and VIIRS Level-1b (L1b) pixel radiances were utilized. While both MODIS and VIIRS provide reflectance-based measurements, where the Earth observed radiance is normalized against the incoming solar diffuser irradiance and denoted as a scaled reflectance, the analysis here was conducted on the derived radiances based on the observed reflectance and a reference solar spectra. The scaled reflectance (
) is defined as the true reflectance (
) multiplied by the observed cosine of the solar zenith angle cos(
)
where
is the VIIRS L1b radiance,
is the square of the normalized Earth–Sun distance, and
is the band-specific solar incoming irradiance (see product user guide [
30]). The
is corrected to overhead sun conditions (i.e.,
= 0°), assuming a Lambertian reflectance at 1 astronomical unit (AU) utilizing Equation (2),
where
is the nadir corrected radiance which is equivalent to
multiplied by the
(i.e.,
).
To account for DCC anisotropy effects,
is adjusted by the BRDF in Equation (3),
where
is the Hu BRDF model factor based on the observed solar zenith angle (
), view zenith angle (
), and relative azimuth angle (
) normalized to the reference solar zenith, view zenith, and relative azimuth angles of 22.5°, 32.5°, and 145°, respectively, and
is the
-adjusted radiance. The reference angles correspond to the NPP-VIIRS angular bin with the greatest frequency [
25].
The empirical monthly BRDF (
) [
29] is constructed using NPP-VIIRS DCC pixel
observations sampled between 2012 to 2023. The
-adjusted radiance (
), is band-dependent and is computed by Equation (4)
Note that the temporal dimension of comprises of 13 bins, each corresponding to a month with an additional bin representing the 12-month mean denoted as the annual average. To construct , the DCC pixel radiances were stratified into 5° SZA, 5° VZA, and 10° RAA angular bins.
In order to align the brighter land with the darker ocean DCC-IT radiances, the land DCC-IT radiances were scaled to the ocean DCC-IT mean radiance. This was accomplished by utilizing a separate land BRDF (
) and ocean BRDF (
). The ocean and land pixels were identified by the VIIRS L1bland-water mask. The deep ocean and deep inland continental pixels were parsed as ocean and land, respectively. NPP-VIIRS DCC-IT pixel
ocean observations (
) were adjusted by the
to obtain the anisotropic adjusted ocean radiance (
) using Equation (5). Similarly, the
land observations (
) were adjusted by the
but normalized to the
reference angles by applying Equation (6).
Note that the land identified DCC radiances were scaled to the
reference angles to align the land DCC-IT radiance distribution with the ocean DCC radiances. This adjustment avoids potential dual land and ocean DCC-IT radiance peaks in the monthly DCC-IT radiance distribution. The land and ocean anisotropic adjusted DCC-IT radiances (
) are combined using Equation (7).
The combined
and
is referred to as
in this paper. However, it is well known that the DCC reflectivity is not uniform across the tropical zone and varies as a function of wavelength [
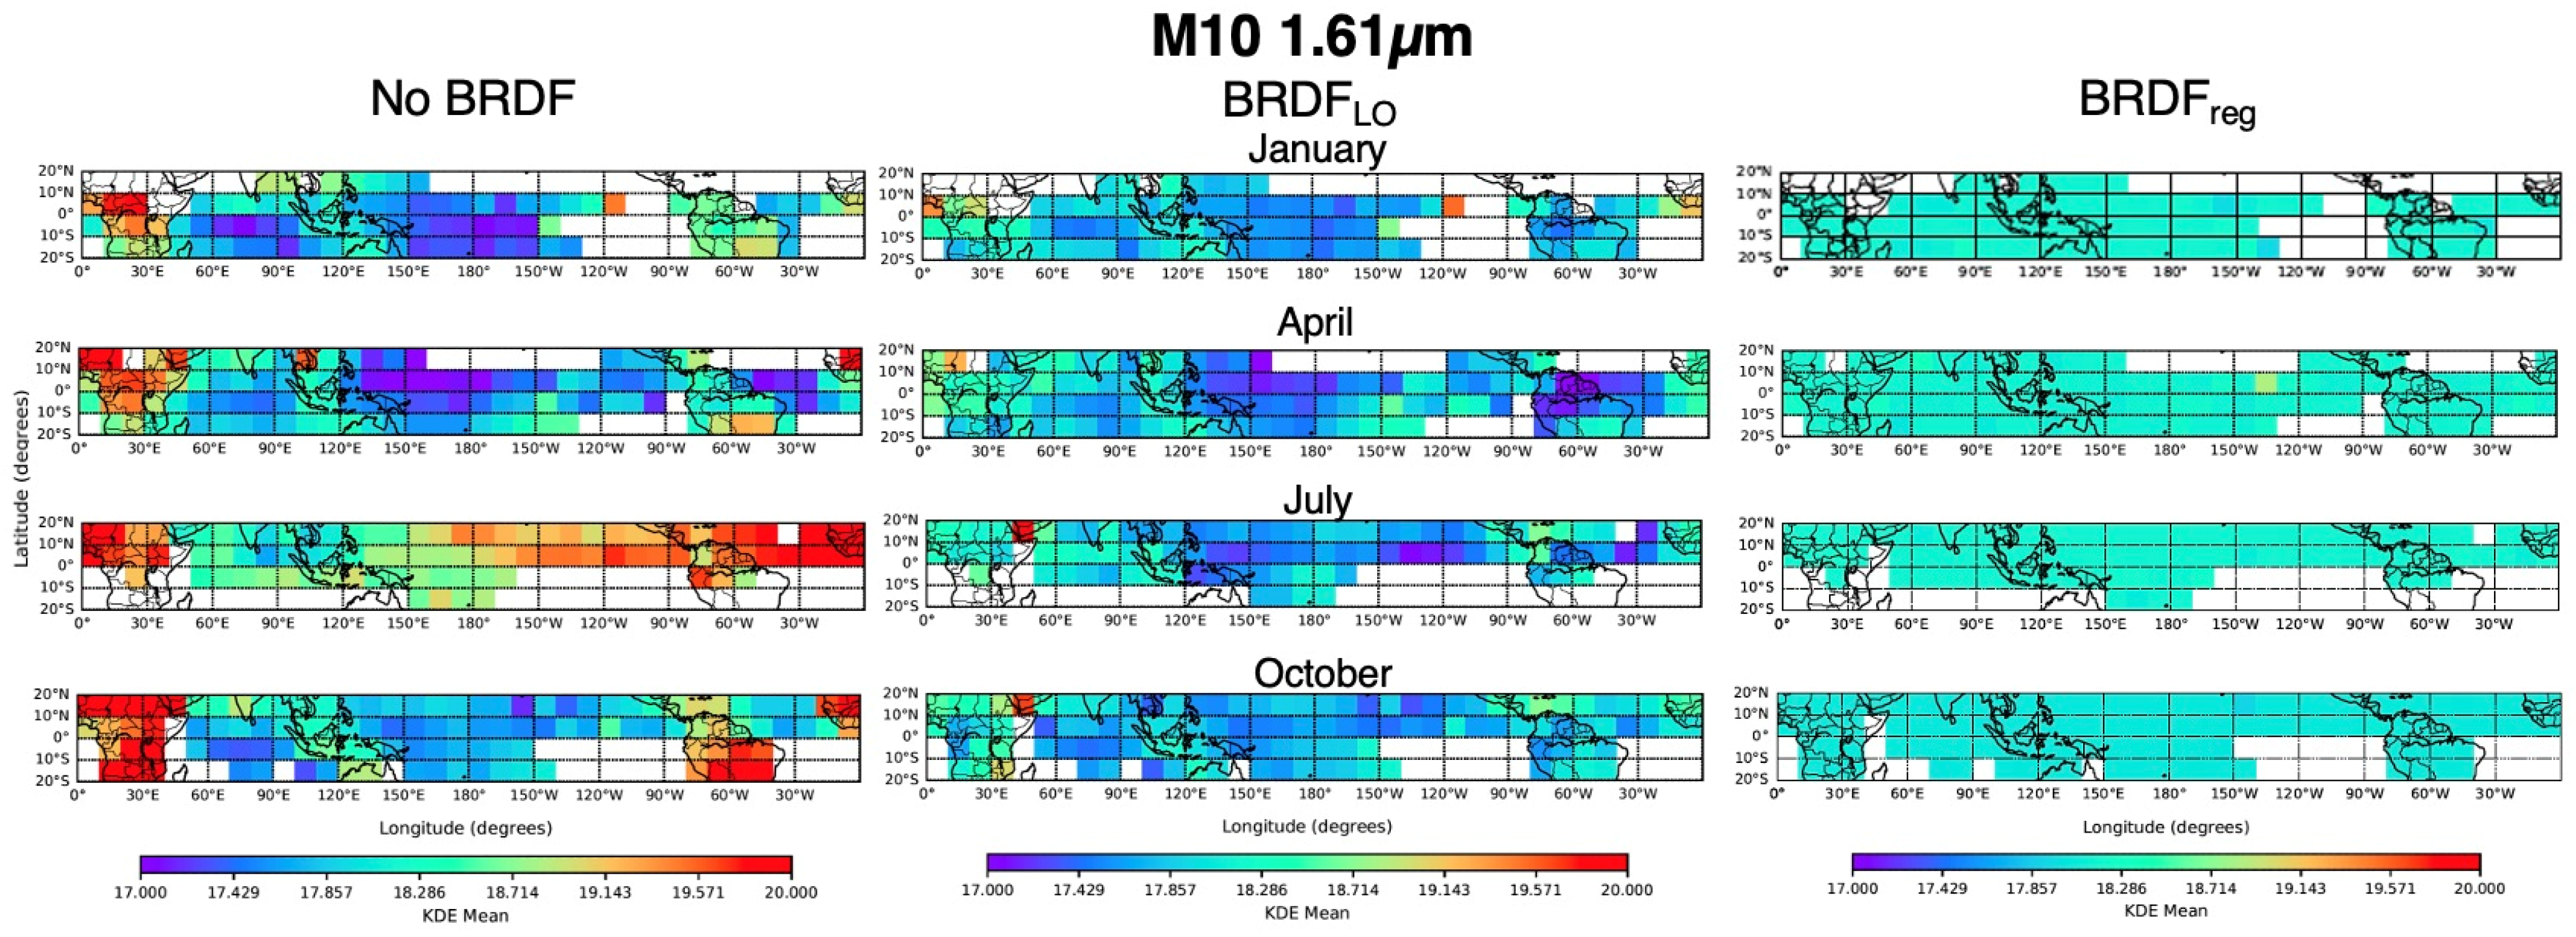
22]; compare their Figure 5 and 6. To better capture this spatial heterogeneity, an empirical monthly regional BRDF (
) was constructed utilizing NPP-VIIRS DCC pixel
observed during the 2012 to 2023 record. The
employs the same angular and monthly bin structure as
but includes an additional spatial dimension by dividing observations into four 10° latitude bins located between ±20° latitude and thirty-six 10° longitude bins positioned between 0° to 360°. The regional anisotropic adjusted DCC-IT radiances (
) are computed using Equation (8):
Analogous to the , where the land DCC-IT radiances were scaled to the reference angles, the individual 10° gridded DCC-IT pixel radiances were scaled to the reference angles. This enabled regional alignment of the DCC-IT pixel radiances so that their distributions were centered to a common reference, avoiding a noisy ensemble PDF distribution which decreased the resulting trend uncertainty.
2.4. DCC-IT PDFs
The DCC-IT BRDF-adjusted radiances were aggregated monthly and analyzed as a large ensemble by employing a probability density function (PDF). The PDF can either be computed by histogramming (HIST) the DCC pixel radiances or by utilizing a kernel density estimation (KDE) function. The HIST radiance bin resolution or interval is dependent on the monthly DCC-IT pixel occurrence. Greater DCC pixel sampling allows for smaller HIST intervals, thus increasing the radiance resolution and the ability to detect smaller trends using the mode of the PDF, where the bin interval radiance is the minimum detectable trend. To overcome the HIST discretization impact, a KDE function was implemented, which is a function of the dampening factor or smoothing bandwidth parameter dependent on the sampling frequency and assumed distribution. The Gaussian function from the SciPy Python module (SciPy 1.6.1, Python 3.7.0) [
31] was implemented where the bandwidth parameter is based on Scott’s Rule [
32], assuming a Gaussian distribution. The KDE offers a less noisy PDF, thereby increasing the probability of finding a single distinct peak or mode frequency. Lamquin et al., in 2020, introduced the KDE function to mitigate the impact of sparse sampling of the Ocean and Land Colour Instruments (OLCI) aboard the Sentinel- 3A and Sentinel-3B satellites for DCC-IT identified pixels [
33].
Figure 1 shows the monthly NPP-VIIRS L1b DCC radiances utilizing the KDE function. The monthly KDEs are color-coded by month. The green lines represent each May and the red lines represent each September during the NPP 2012 to 2024 record. The green lines have comparable PDF shapes, and the red lines also show similar profiles; however, the green and red line shapes differ from each other. This suggests that the DCC-IT radiance interannual variability is small compared to the more pronounced seasonal variability. The seasonal variability is due to the spatial migration of the DCCs with the sun and the residual anisotropic effects that are not fully resolved by the BRDF derived from the seasonally dependent observed angular geometry. The visible bands exhibit negatively skewed PDFs, characterized by a longer tail of low radiances, whereas the SWIR bands have a more Gaussian-like PDF distribution. For visible bands, the application of the
improves the uniformity of the monthly KDEs, as well as sharpening the peak of the distribution (
Figure 1b), compared to the results with no BRDF application (
Figure 1a). The impact of the
adjustment on the DCC-IT SWIR band radiances is even more pronounced than that of the visible bands, as seen when comparing
Figure 1d with
Figure 1c.
2.5. DCC-IT PDF Statistics
The monthly KDE-based PDFs were monitored over time to track instrument stability. Four PDF statistics were evaluated by examining the reduction in the associated linear trend standard error (trend
SE). The trend
SE is a combination of the natural variability of the collective DCC-IT reflectance and the imager calibration noise and drifts. The PDF statistic that introduces the lowest DCC-IT methodology noise is most suited to track the instrument stability. The PDF
mean is the average of all DCC-IT pixel radiances over the month. The PDF
mean is a misnomer, since the PDF itself is not required to compute this statistic, although the name is kept for convenience. The PDF
mode is the mode or peak frequency radiance of the PDF. These two DCC-IT PDF statistics were evaluated by Doelling et al. 2013 [
22], who concluded that for visible bands, the PDF
mode provided the lower trend
SE, whereas the PDF
mean was more suited for SWIR bands. The PDF
median is the radiance value that divides the pixels such that half of the values are below and half are above it. This requires ranking the pixel radiances in ascending order and finding the midpoint pixel radiance value. The PDF
median was found to be a better statistic for bi-modal distributions [
34]. Recently, the PDF inflection point statistic was used to track the trend
SE for DCC-IT datasets with limited sampling [
33]. The PDF inflection point is the radiance where the curvature changes sign, i.e., where the 2nd order derivative sign changes. The PDF inflection point for a Gaussian distribution is usually the radiance at the half-width half-maximum of the PDF. For a given PDF distribution there are two inflection points based on their position from the PDF
mode. The right inflection point lies at a greater radiance than the PDF
mode, whereas the left inflection point lies at a lower radiance. For visible wavelengths, the right inflection point provides more stable trend
SE because the monthly PDF distributions are most aligned across the right inflection point (see
Figure 1b). The left inflection point is adversely impacted by the tail of the negatively skewed PDF. Since only the right inflection point is used in our analysis, the term PDF
inflection refers exclusively to the right inflection point for the remainder of the text.
2.6. DCC-IT Stability Analysis
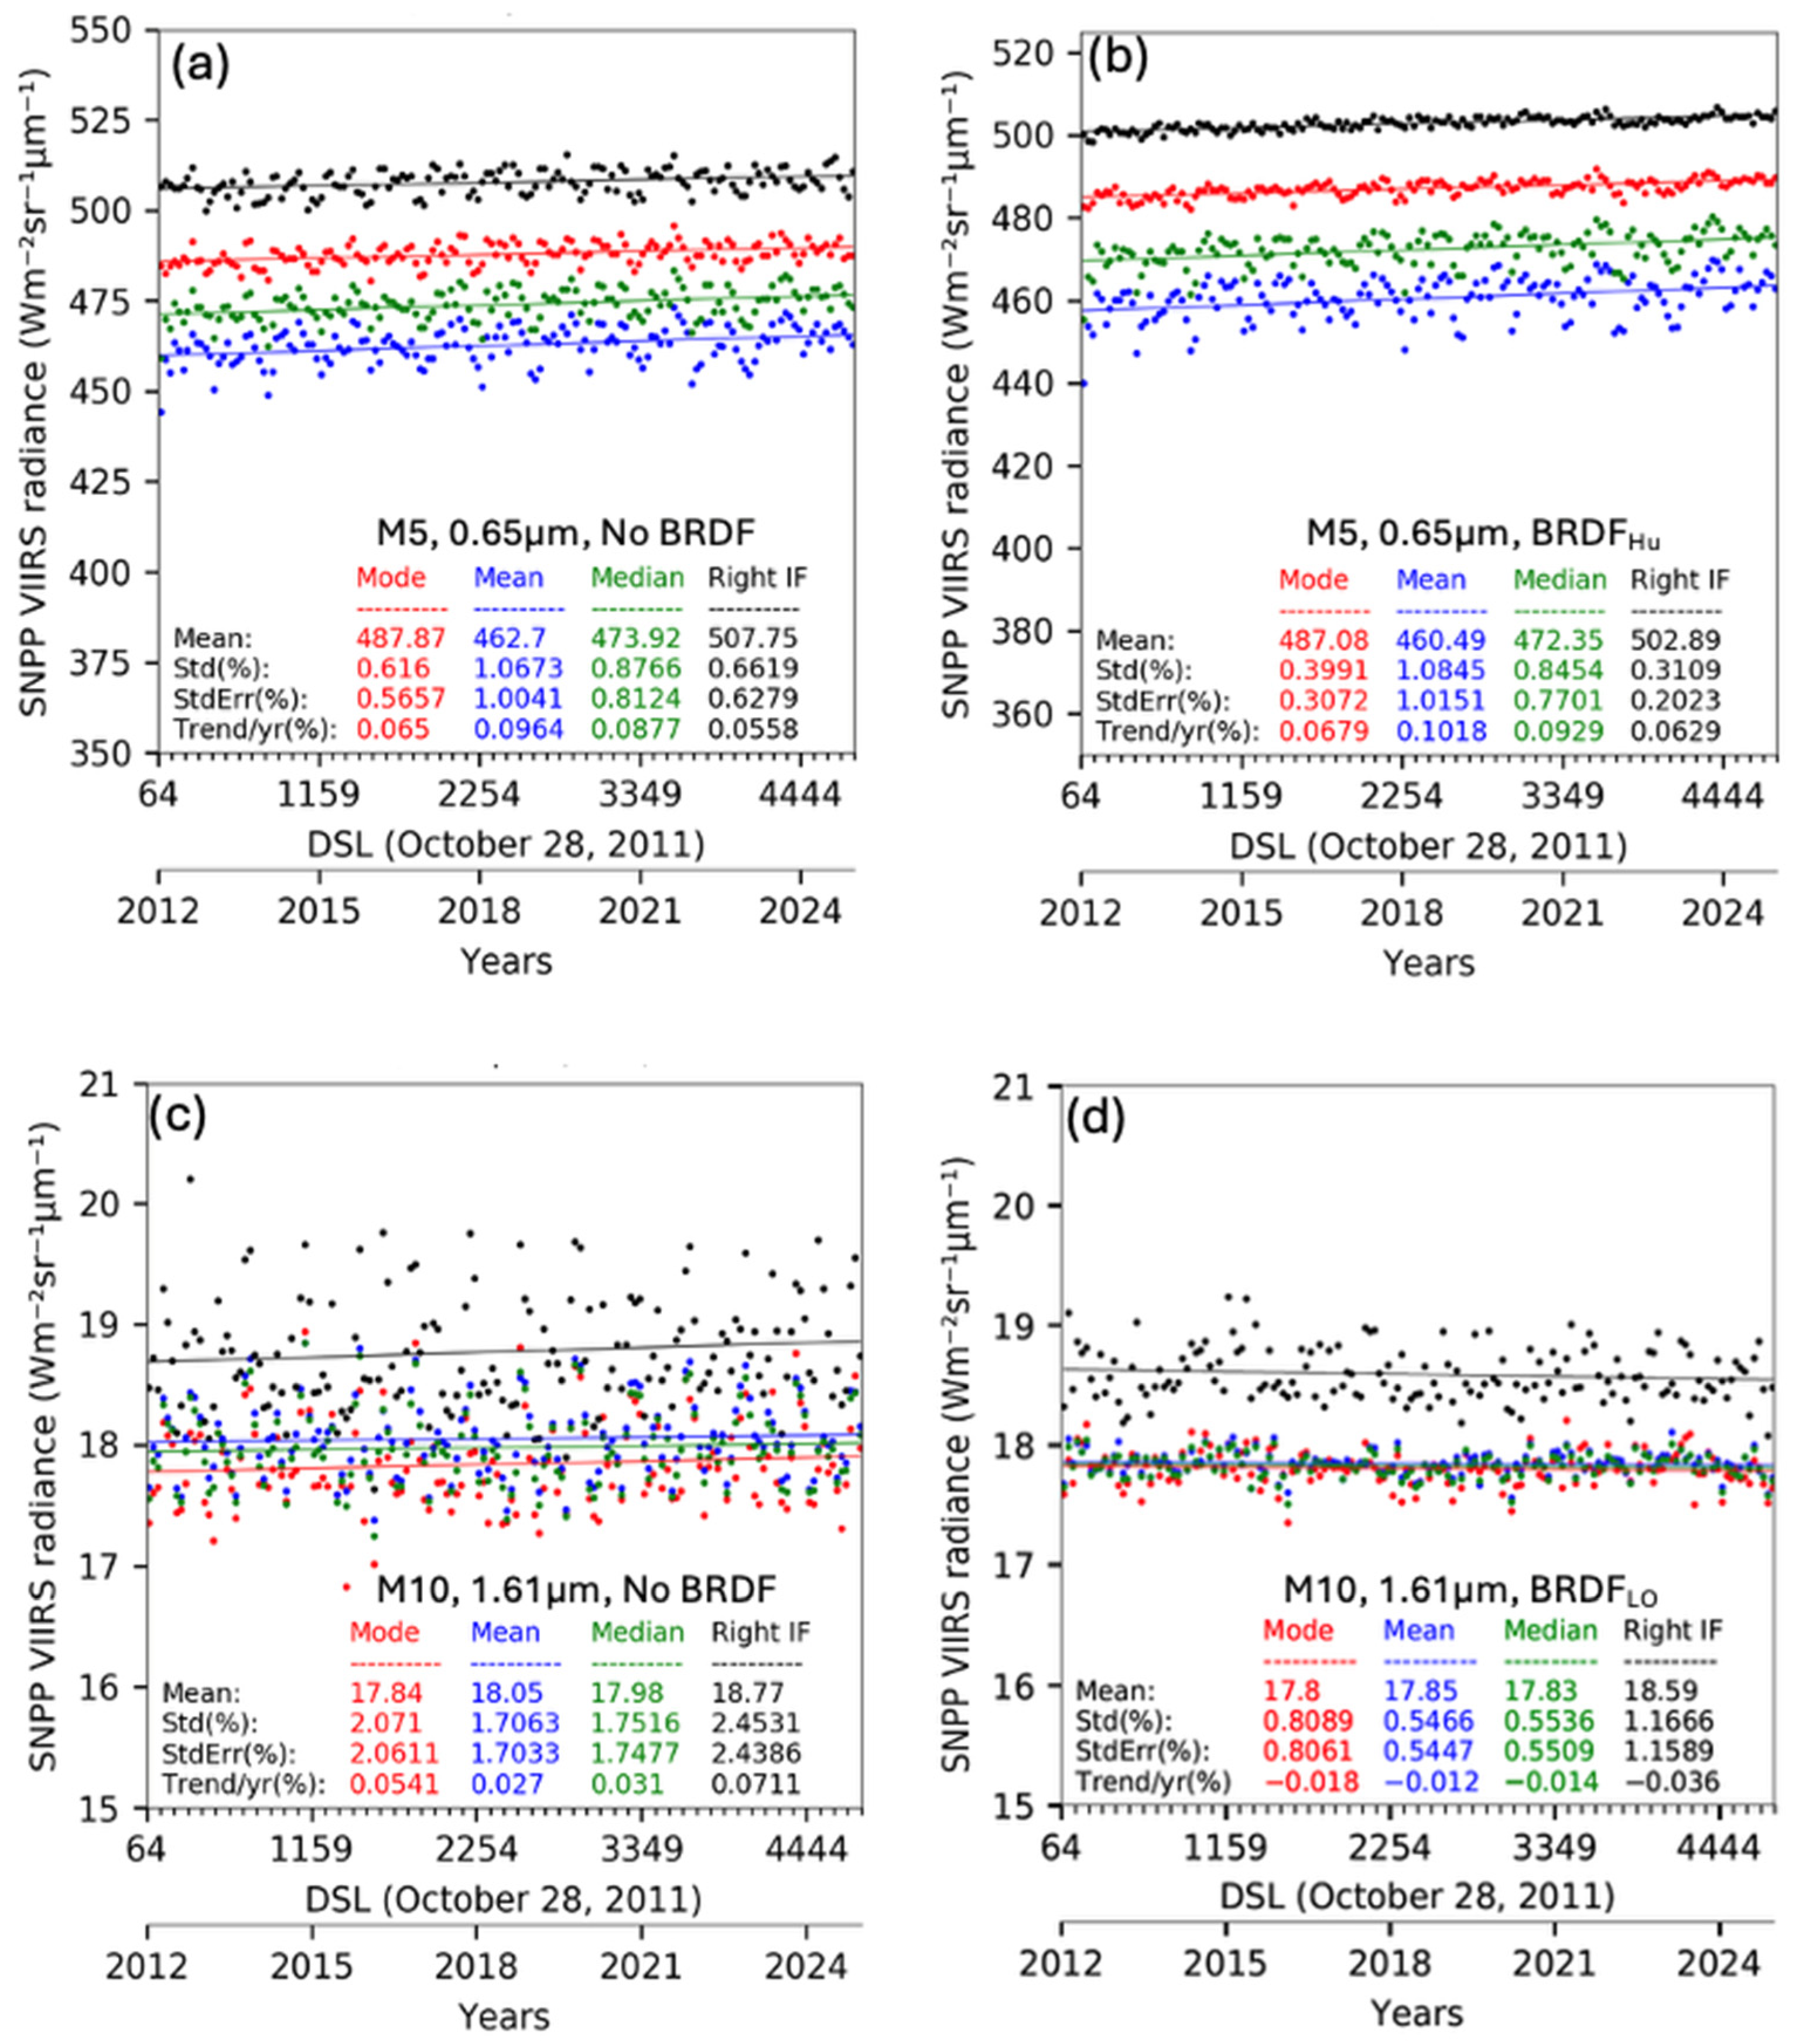
Figure 2 illustrates the ability of the PDF statistics to reduce the month-to-month variability of collective DCC-IT radiance relative to the linear trend line, both without and with BRDF adjustment. For the M5 0.65 µm channel without BRDF adjustment, the PDF
mode statistic revealed the lowest trend
SE of 0.57%, whereas the
-adjusted PDF
inflection offered a trend
SE of 0.20%. Also, the
reduced the PDF
mode and PDF
inflection trend
SE by 40% and 60%, respectively (compare
Figure 2a with
Figure 2b). Note that for the PDF
mean and PDF
median, the
had little impact on the trend
SE. This is also manifested when comparing
Figure 1a with
Figure 1b, where the
adjustment increased the month-to-month consistency and heightened the peak frequency for radiances brighter than 450 Wm
−2sr
−1µm
−1; however, for darker radiances, there was little impact. The
adjustment best resolved the anisotropic behavior for the brightest DCC pixel radiances, which are tracked by the PDF
inflection statistic. The darker identified DCC-IT pixel radiances are likely misidentified and may represent anvils and cirrus clouds that surround the DCC cell as well as developing and dissipating DCCs.
For the M10 1.61 µm SWIR band, the PDFmean and PDFmedian statistics provided the lowest trendSE, regardless of BRDF adjustment. The adjustment reduced the PDFmean statistic trendSE by 68%. The empirically based represents the collective DCC-IT pixel radiance average, and the PDFmean best tracks this monthly average, unlike the PDFmode and PDFinflection statistics that track the brighter pixel radiances. It is not understood why the visible band radiances are skewed towards darker radiances, whereas the corresponding SWIR band radiances have more of a Gaussian shape, despite using the same DCC-IT identification criteria. Due to the SWIR band Gaussian-shaped PDFs, the PDFmean, PDFmedian, and PDFmode have similar monthly radiance values.
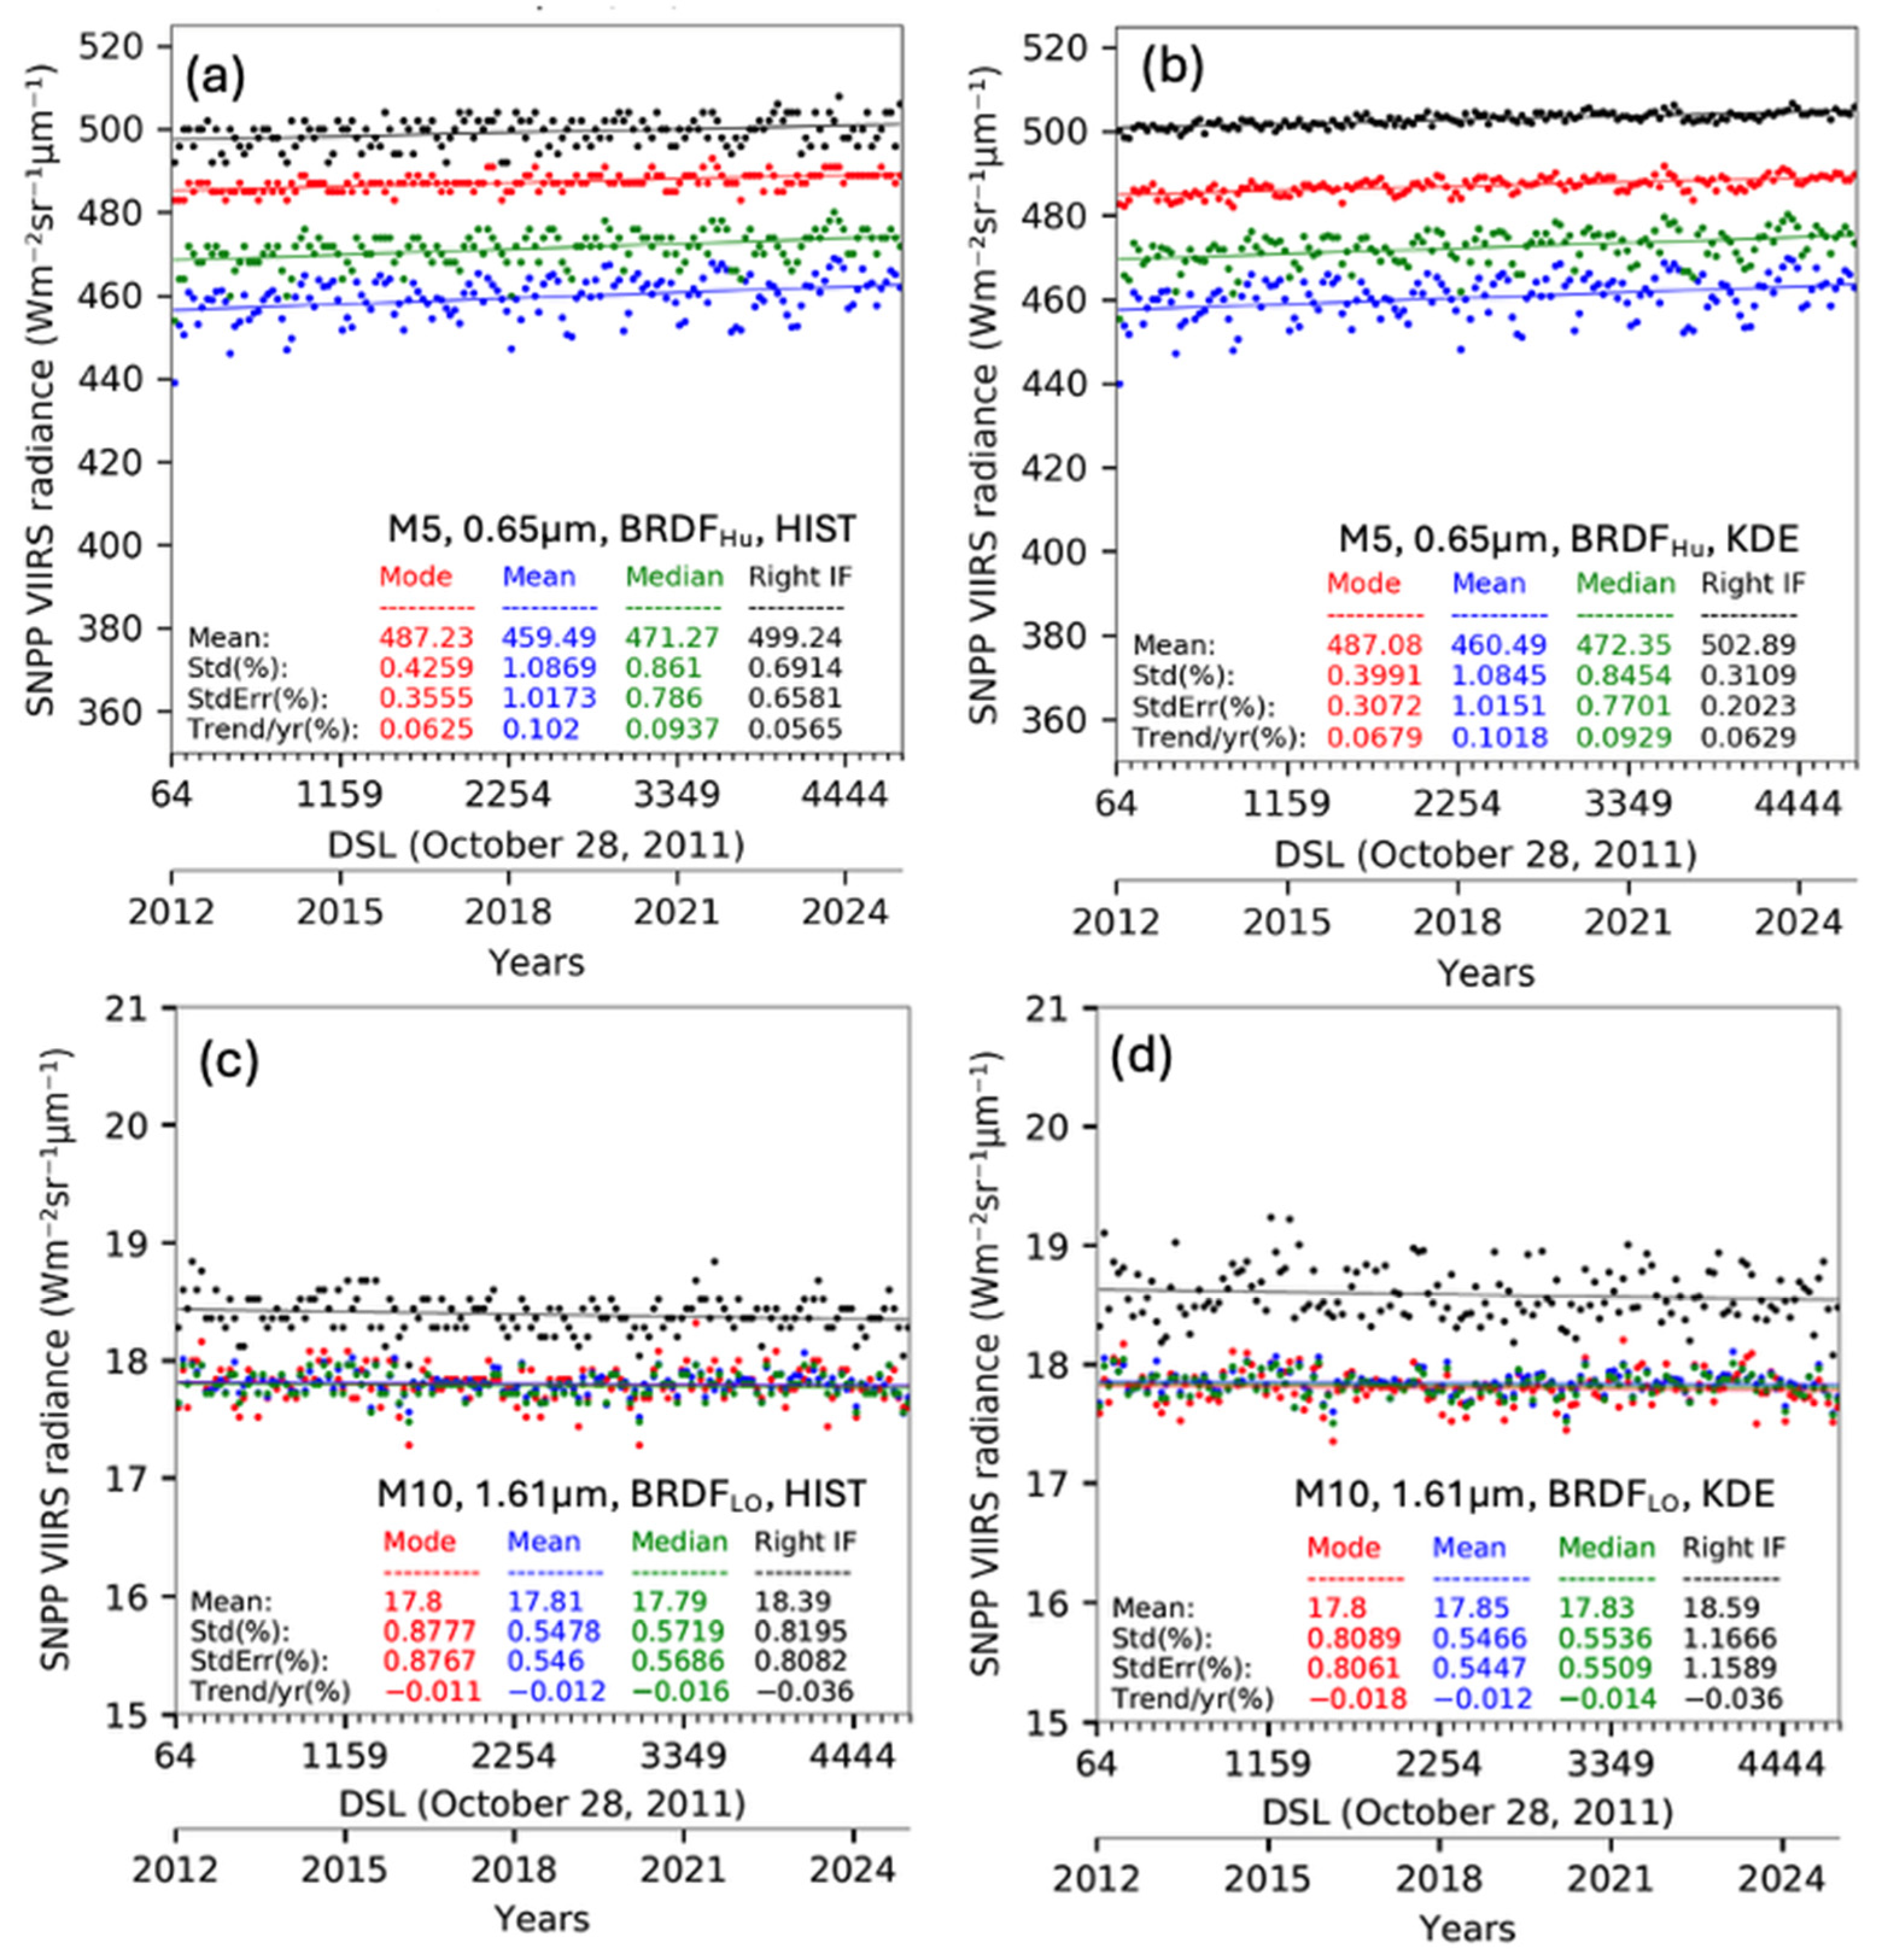
Figure 3 illustrates the reduction in the trend
SE when employing the KDE function instead of the HIST function. The M5 0.65 µm and M10 1.61 µm HIST bin interval was 2 Wm
−2sr
−1µm
−1 and 0.08 Wm
−2sr
−1µm
−1, respectively. The PDF
mean and PDF
median do not require PDF analysis and are simply computed from the monthly DCC pixel radiances and thus have nearly identical trend
SE values regardless of whether the HIST or KDE algorithms is used. For the M5 0.65 µm band, the KDE-based PDF
mode and PDF
inflection provide 10% and 70% lower trend
SE, respectively, compared to the HIST function. The HIST discretization noise mostly impacts the PDF
inflection due to the steep frequency reduction over a small radiance interval for radiances greater than the PDF
mode (see
Figure 1b). The effectiveness of the PDF
inflection statistic is due to the KDE. For the HIST approach to effectively utilize the PDF
inflection statistic, there must be ample sampling to allow for very fine histogram intervals. The PDF
mode is the optimal statistic when utilizing the HIST approach. For the M10 1.61 µm channel, the KDE decreased the PDF
mode-based trend
SE by 8% and increased the PDF
inflection trend
SE by 30%. For the SWIR channels, the small radiance range reduces the discretization impact by facilitating finer radiance intervals when compared to visible channels. Perhaps the KDE kernel smoothing factors could be further optimized for SWIR channels. The PDF statistics are based on the KDE function from this point forward in the text.
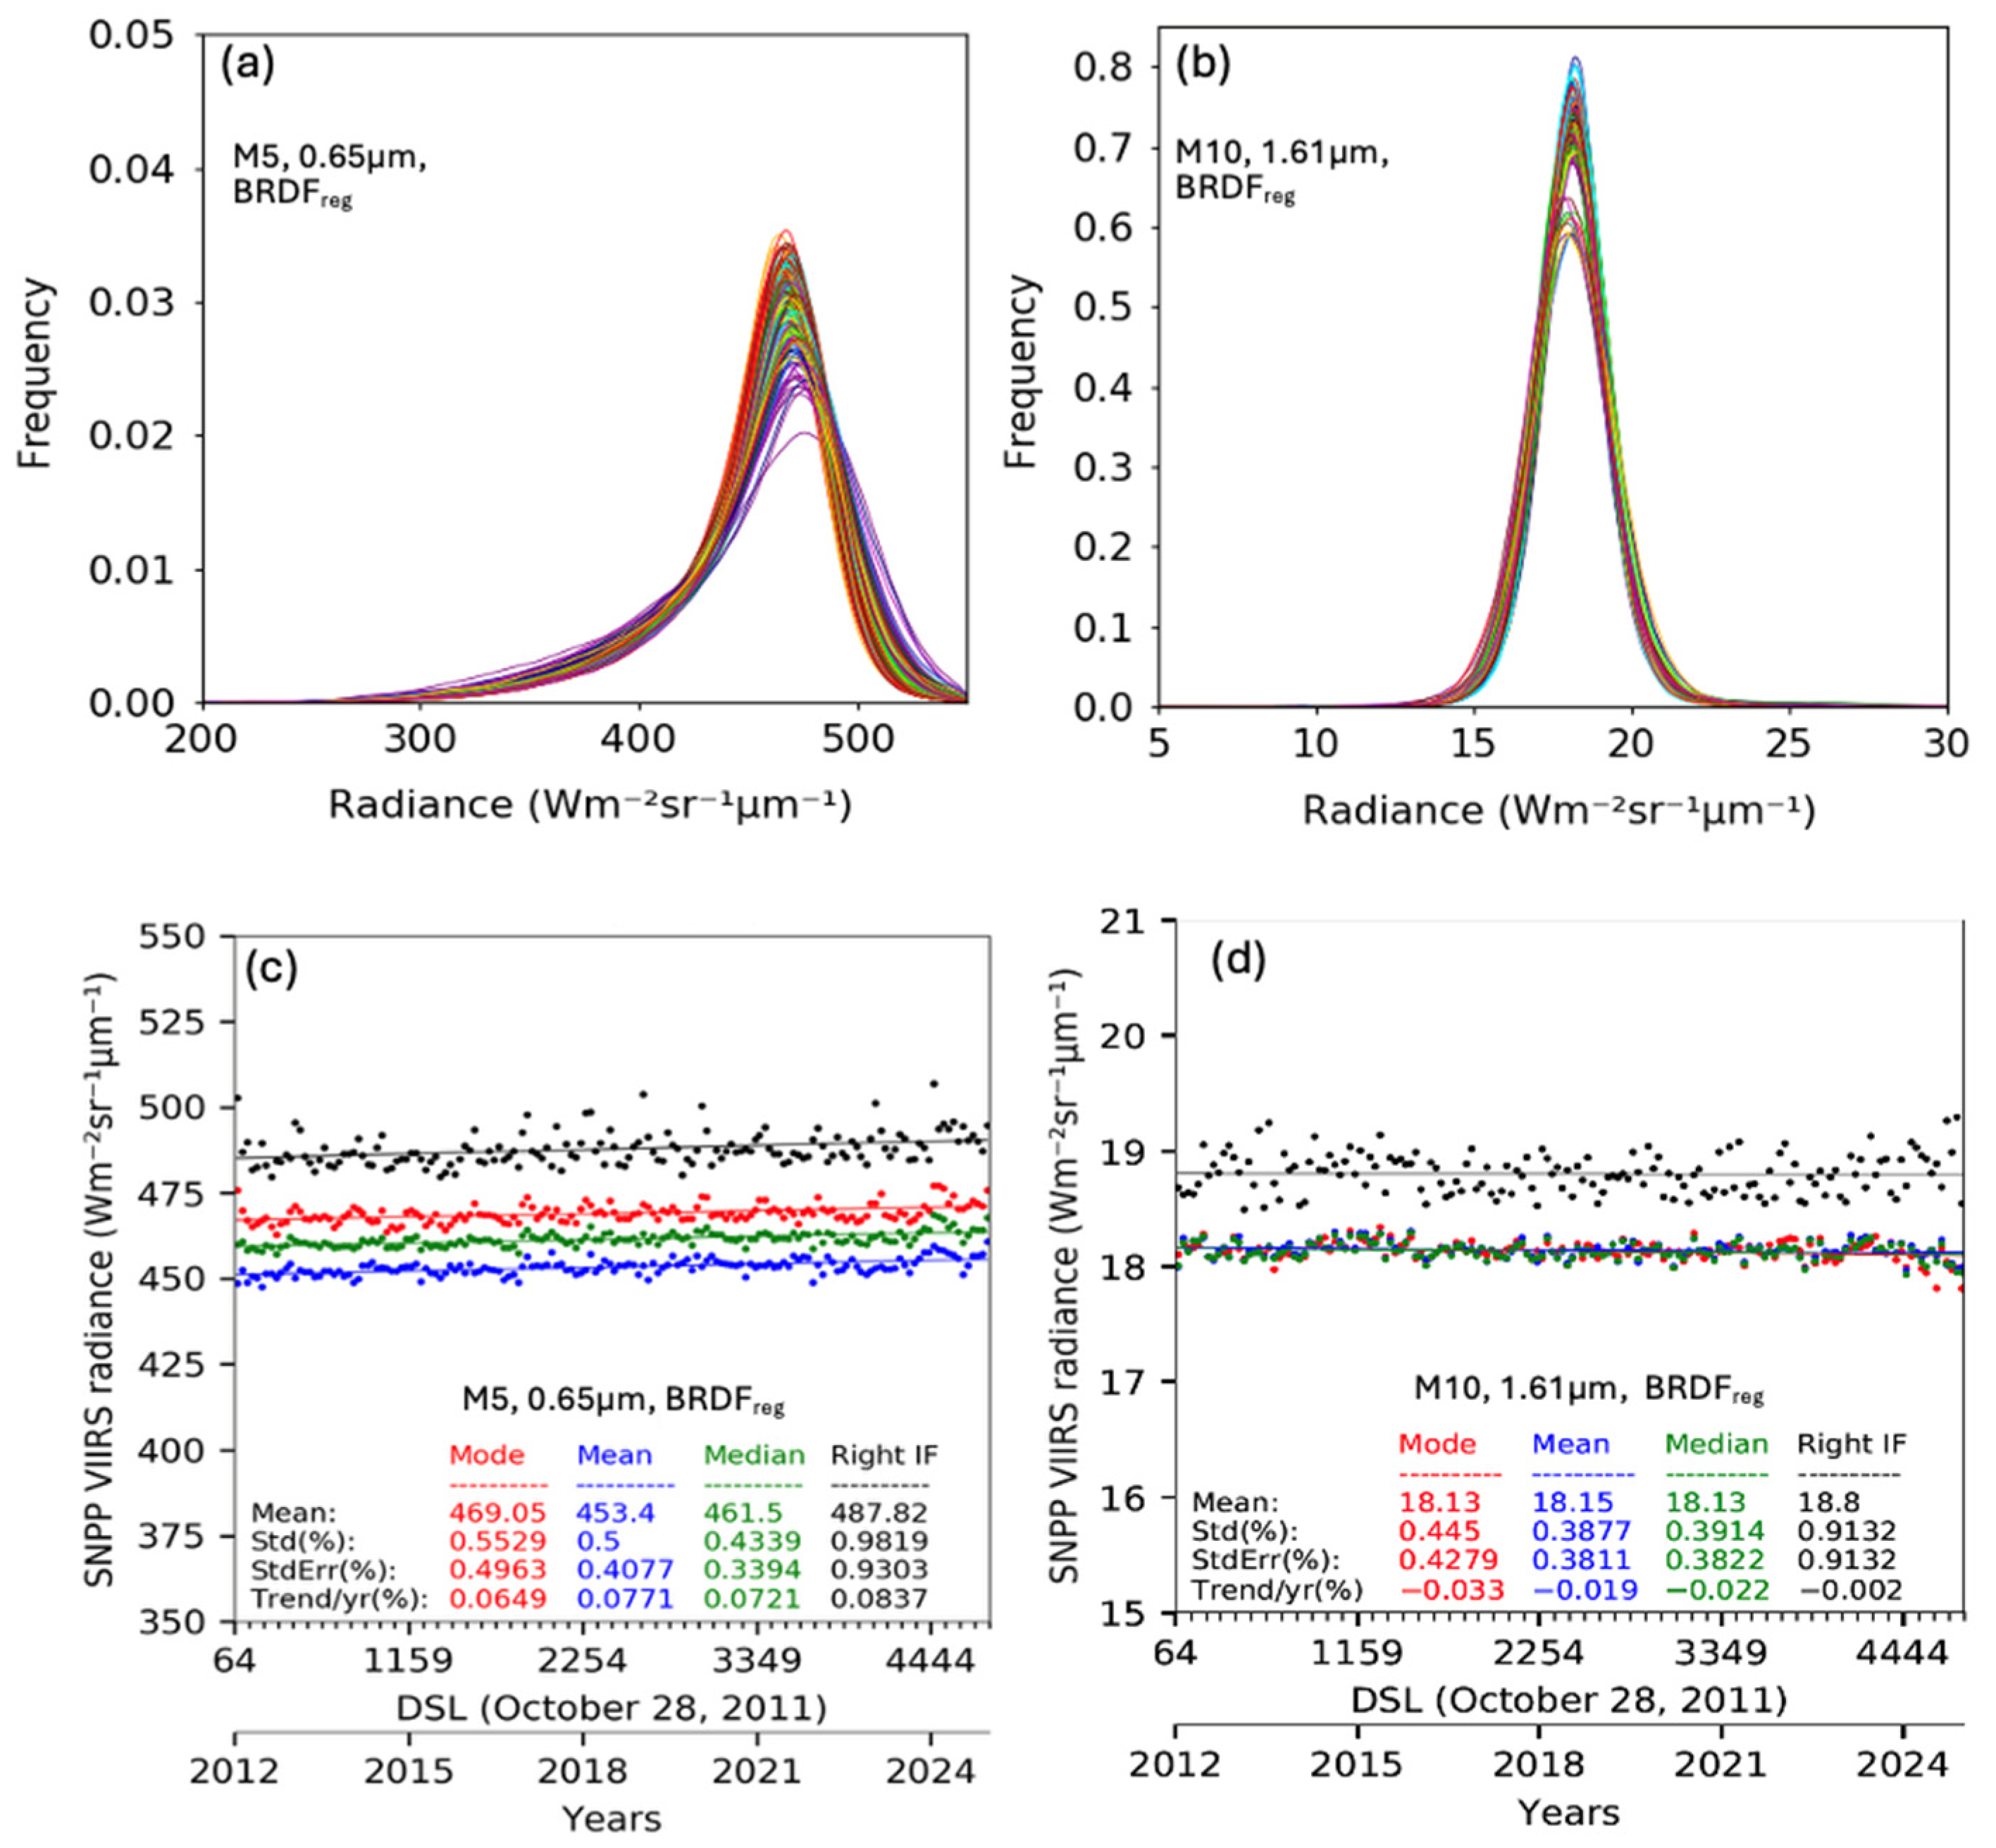
Here, we determine the effectiveness of the
against the
and
-adjusted visible and SWIR band radiances, respectively. This is accomplished by comparing both the consistency of the monthly PDF distributions as well as the reduction in the trend
SE, which is shown in
Figure 4. By comparing the M5 0.65 µm band monthly PDF distribution consistency between
Figure 4a with
Figure 1b, it is evident that the
adjustment is more effective for darker DCC pixel radiances (<420 Wm
−2sr
−1) than the
. This is manifested by a ~60% reduction in trend
SE for the PDF
mean and PDF
median statistics (compare
Figure 4c and
Figure 3b). However, for the brighter DCC pixel radiances (>420 Wm
−2sr
−1) the
adjustment is better suited. The PDF
median statistic offers the lowest
-adjusted trend
SE of 0.34% (
Figure 4c); however, the
-adjusted PDF
inflection statistic provides the lowest trend
SE of 0.20% (
Figure 2b).
For the 1.61 µm band, the
-adjusted monthly PDF distributions (
Figure 4b) have become even more uniform and exhibit a more pronounced peak frequency compared to the
-adjusted monthly PDFs in
Figure 1d. The
adjustment has reduced the PDF statistic trend
SE by 20% to 45% compared to the
adjustment. This suggests that the
more accurately accounts for the spatial DCC-IT pixel radiance variability than the
. Akin to all SWIR band empirical BRDFs, the
-adjusted PDF
mean or PDF
median statistic provides the lowest trend
SE amongst all the PDF statistics.
2.7. NPP-VIIRS DCC-IT RSB Stability
To evaluate NPP-VIIRS DCC-IT stability, the NPP-VIIRS reflective solar bands (RSB) were grouped based on their DCC characteristics to assign the appropriate BRDF model and PDF statistic. Except for the 1.38 µm channel, all VIIRS RSB channels were within wavelengths having relatively little gaseous absorption. VIIRS channels with wavelengths less than 1.38 µm are mainly impacted by ice particle scattering, where the DCC reflectance is mostly sensitive to optical depth. The VIIRS 1.61 µm and 2.25 µm channels are impacted by ice particle scattering and absorption, where the DCC reflectance is sensitive to both optical depth and particle size. The 1.24 µm channel is used to determine the cloud optical depth over snow surface, where the snow reflectance is smaller than the ice cloud reflectance. The 1.38 µm channel is very useful for detecting thin cirrus and DCC because of the strong water vapor absorption that masks low level clouds. The surface and low cloud reflectance is nearly absorbed by atmospheric water vapor in the 1.38 µm channel. The 1.38 µm cirrus detection channel was recommended for future RSB imagers by studies based on Airborne Imaging Spectrometer (AVIRIS) hyperspectral sensor data [
35]. The 1.61 µm and 2.25 µm channels are used to retrieve ice particle size. Due to strong ice particle absorption within the 1.6 µm band, this channel is used to discriminate between ice and water clouds, where liquid clouds are brighter than ice clouds. Due to the greater reflectance of ice clouds in the 2.1 µm channel, it is used to determine the particle size of daytime thin ice clouds. The RSB channels were stratified in two groups depending on which BRDF model is most effective. For the VIS/NIR channels, where the DCC reflectance is mainly due to ice particle scattering, the
model was most effective. For wavelengths greater than 1 µm, the channel specific empirical BRDFs were most beneficial since ice particle and water vapor absorption is a function of wavelength. The
model was analyzed for both groups.
Here, we compared the NPP-VIIRS RSB DCC-IT trend
SE by BRDF adjustment and PDF statistic across all visible channels.
Table 1 and
Table A1 shows the trend
SE and associated trends for monthly 2012 to 2024 NPP-VIIRS L1b KDE-based DCC-IT radiances for each VIS/NIR channel. If no BRDF is applied, the PDF
mode provides the lowest trend
SE of 0.60%. With the application of
, the PDF
inflection offers the smallest trend
SE within 0.26% amongst the PDF statistics. The PDF
mode and PDF
inflection trend
SE are significantly reduced with the
adjustment, whereas the PDF
mean and PDF
median trend
SE remain mostly unchanged, verifying that the
is optimized for the brightest DCC radiances. In contrast, the
based PDF
mean and PDF
median has the lowest trend
SE, which is expected since the empirical
characterizes the mean DCC-IT radiance. Among all, the
-based PDF
median shows the lowest trend
SE within 0.37% across all PDF statistics. Overall for VIS/NIR bands, the
PDF
inflection approach provides the lowest trend
SE within 0.26% across all channels.
Table 2 and
Table A2 shows the trend
SE and associated trends for monthly 2012 to 2024 NPP-VIIRS L1b KDE-based DCC-IT radiances for the SWIR channels. Interestingly, for the M8 1.24 µm channel, the PDF
mode trend
SE without BRDF resembles the VIS/NIR channel trend
SE. For all other SWIR channels, the PDF
mean and PDF
median produce the lowest trend
SE within 1.71% without BRDF application, except for the M9 channel. The
anisotropic adjustment reduces the PDF
mean and PDF
median trend
SE by 50% and provides trend
SE within 0.6%. The
offers the lowest SWIR band trend
SE within 0.4%, which is ~25% lower than what is achieved with the
. These results indicate that the SWIR band empirical BRDFs characterizes the mean DCC pixel radiance conditions, and the fact that the DCC pixel radiances follow a Gaussian distribution enables the PDF
mean and PDF
median to produce the lowest trend
SE.
2.8. MODIS DCC-IT RSB Stability
In this section, the same DCC-IT algorithm was applied to the Terra and Aqua-MODIS RSB channel DCC pixel radiances. This study utilized the MODIS collection 6.1 L1b radiances. The MODIS project collection 7 processing is underway but not yet complete. Unlike VIIRS, the DCC radiances saturate over the MODIS RSB land channels, thus precluding DCC targets from being used for stability monitoring of band 2 (0.86 µm). There are still some Terra-MODIS and Aqua-MODIS residual calibration anomalies present in the C6.1 record, which are described in detail by Bhatt et al. 2020 [
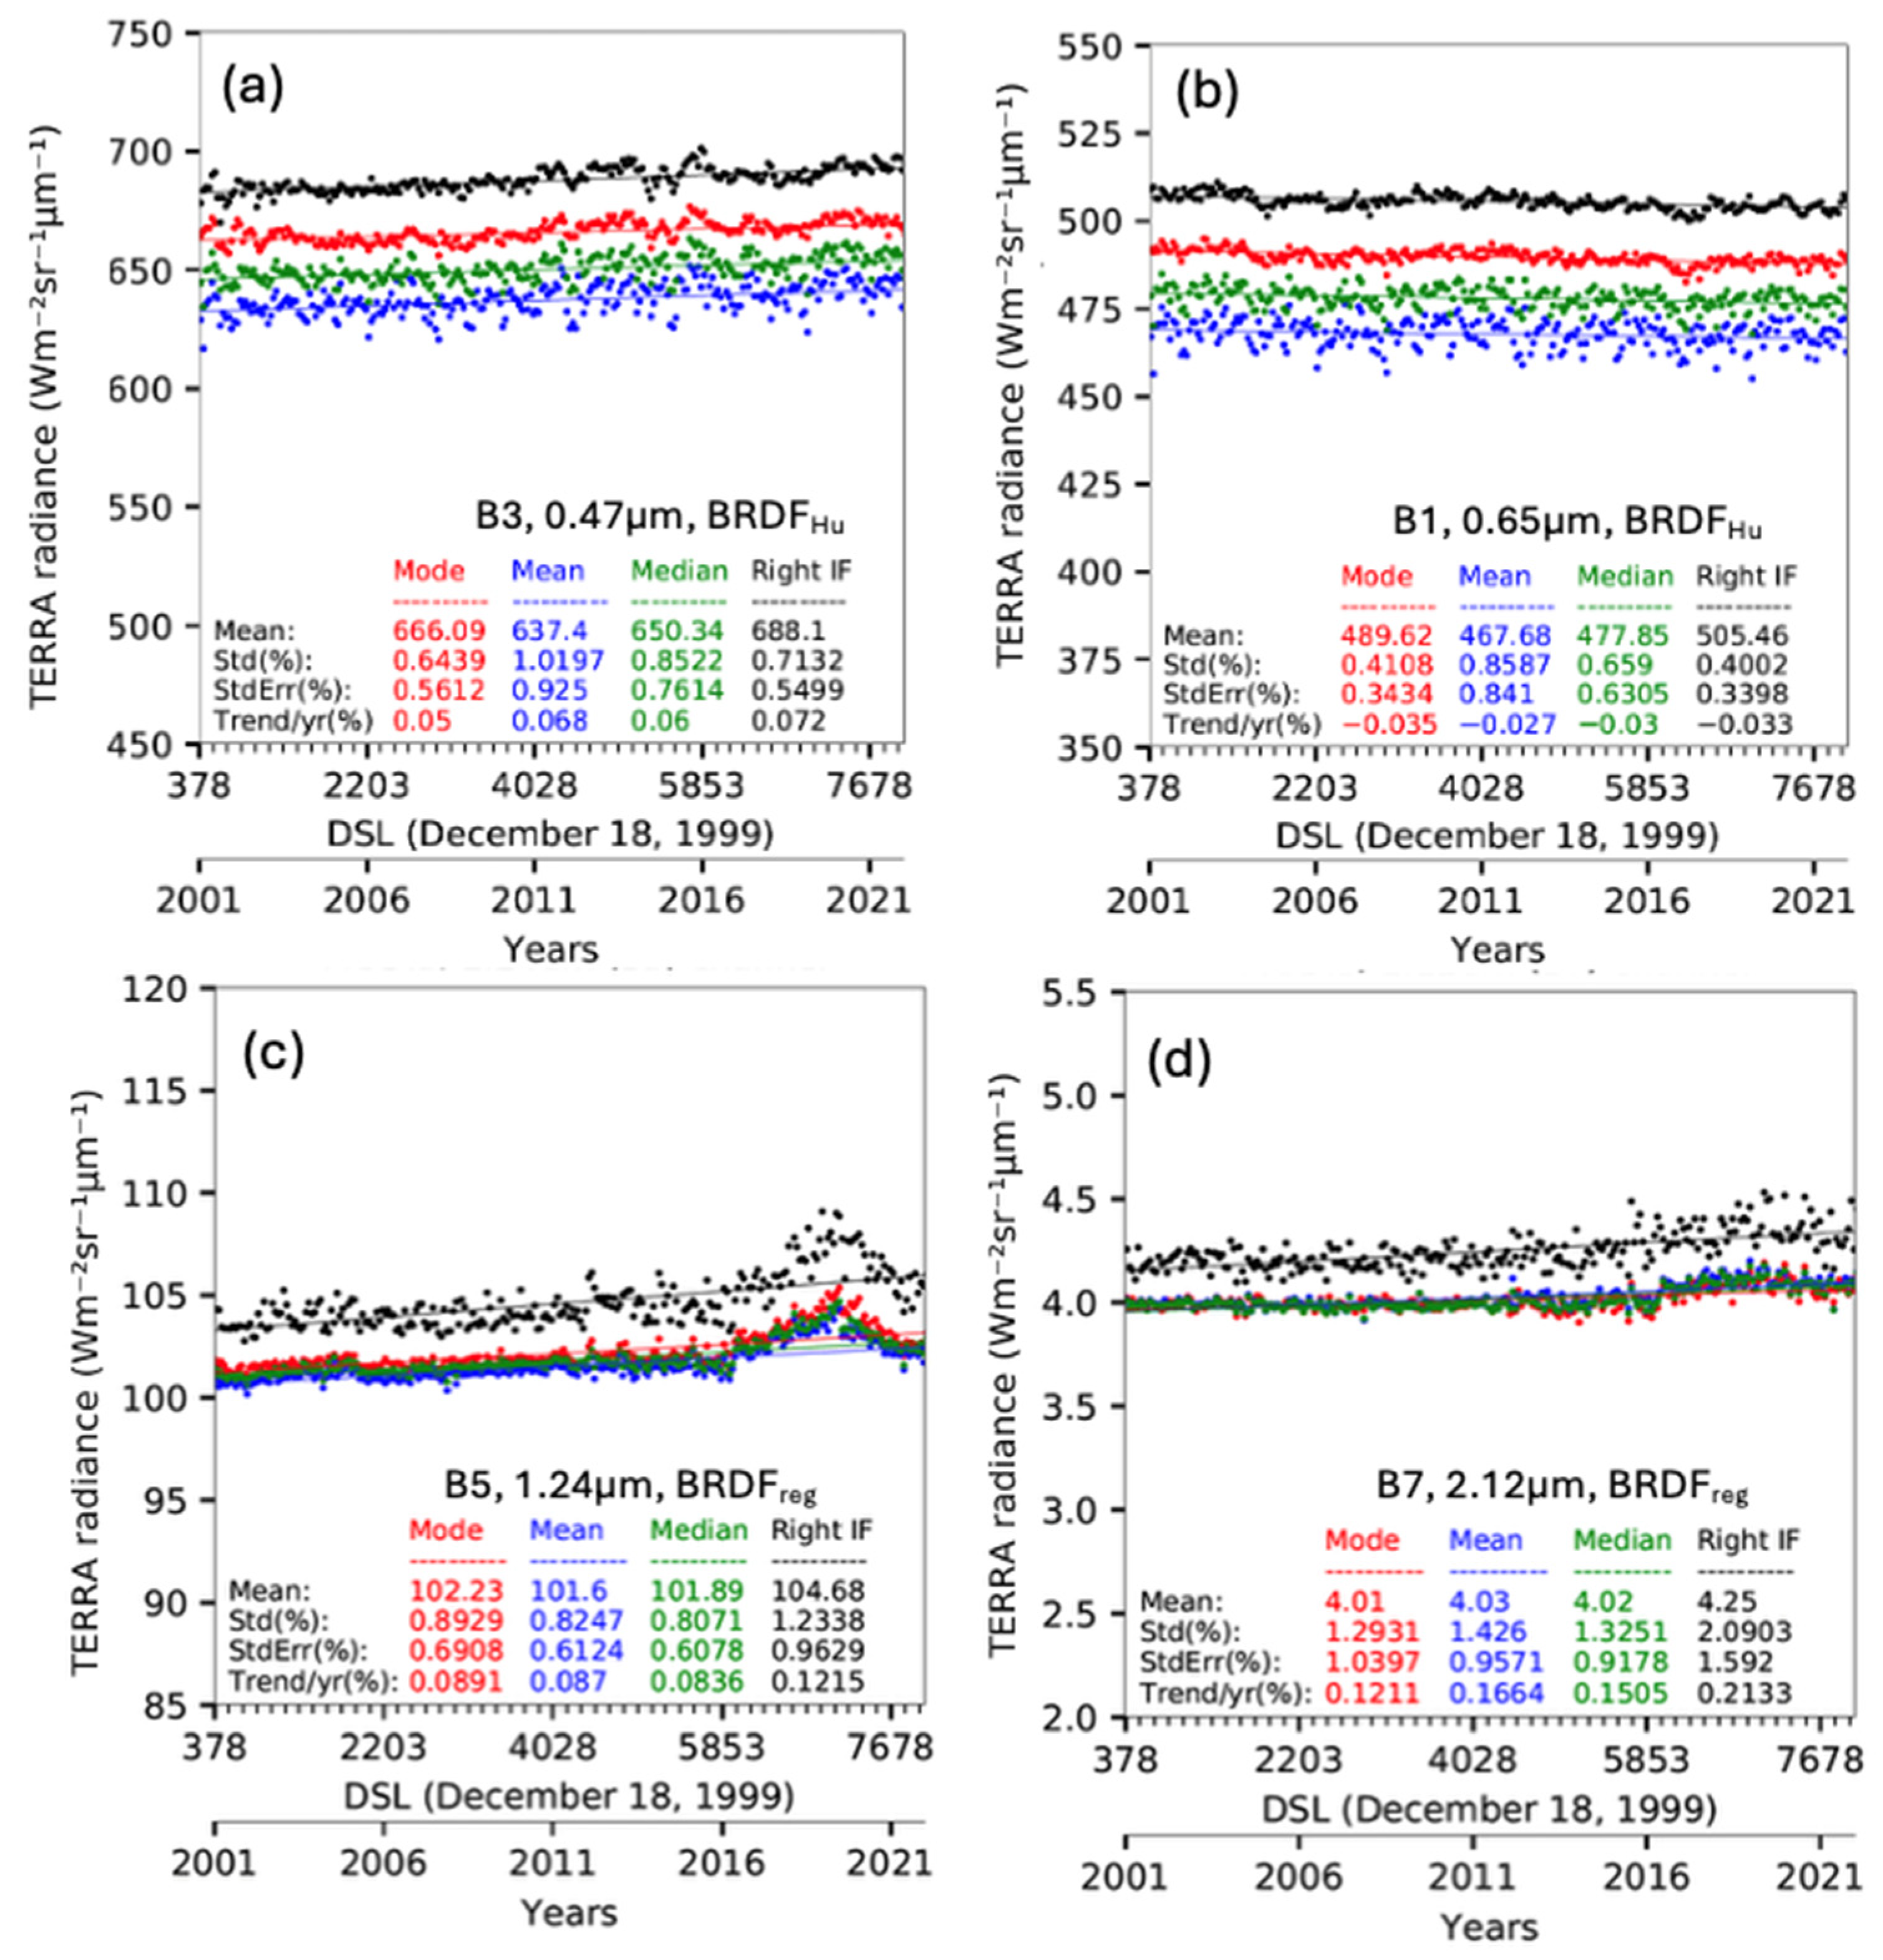
36]. For Terra-MODIS, there are lingering polarization issues in B3 (0.48 µm). This can be observed in
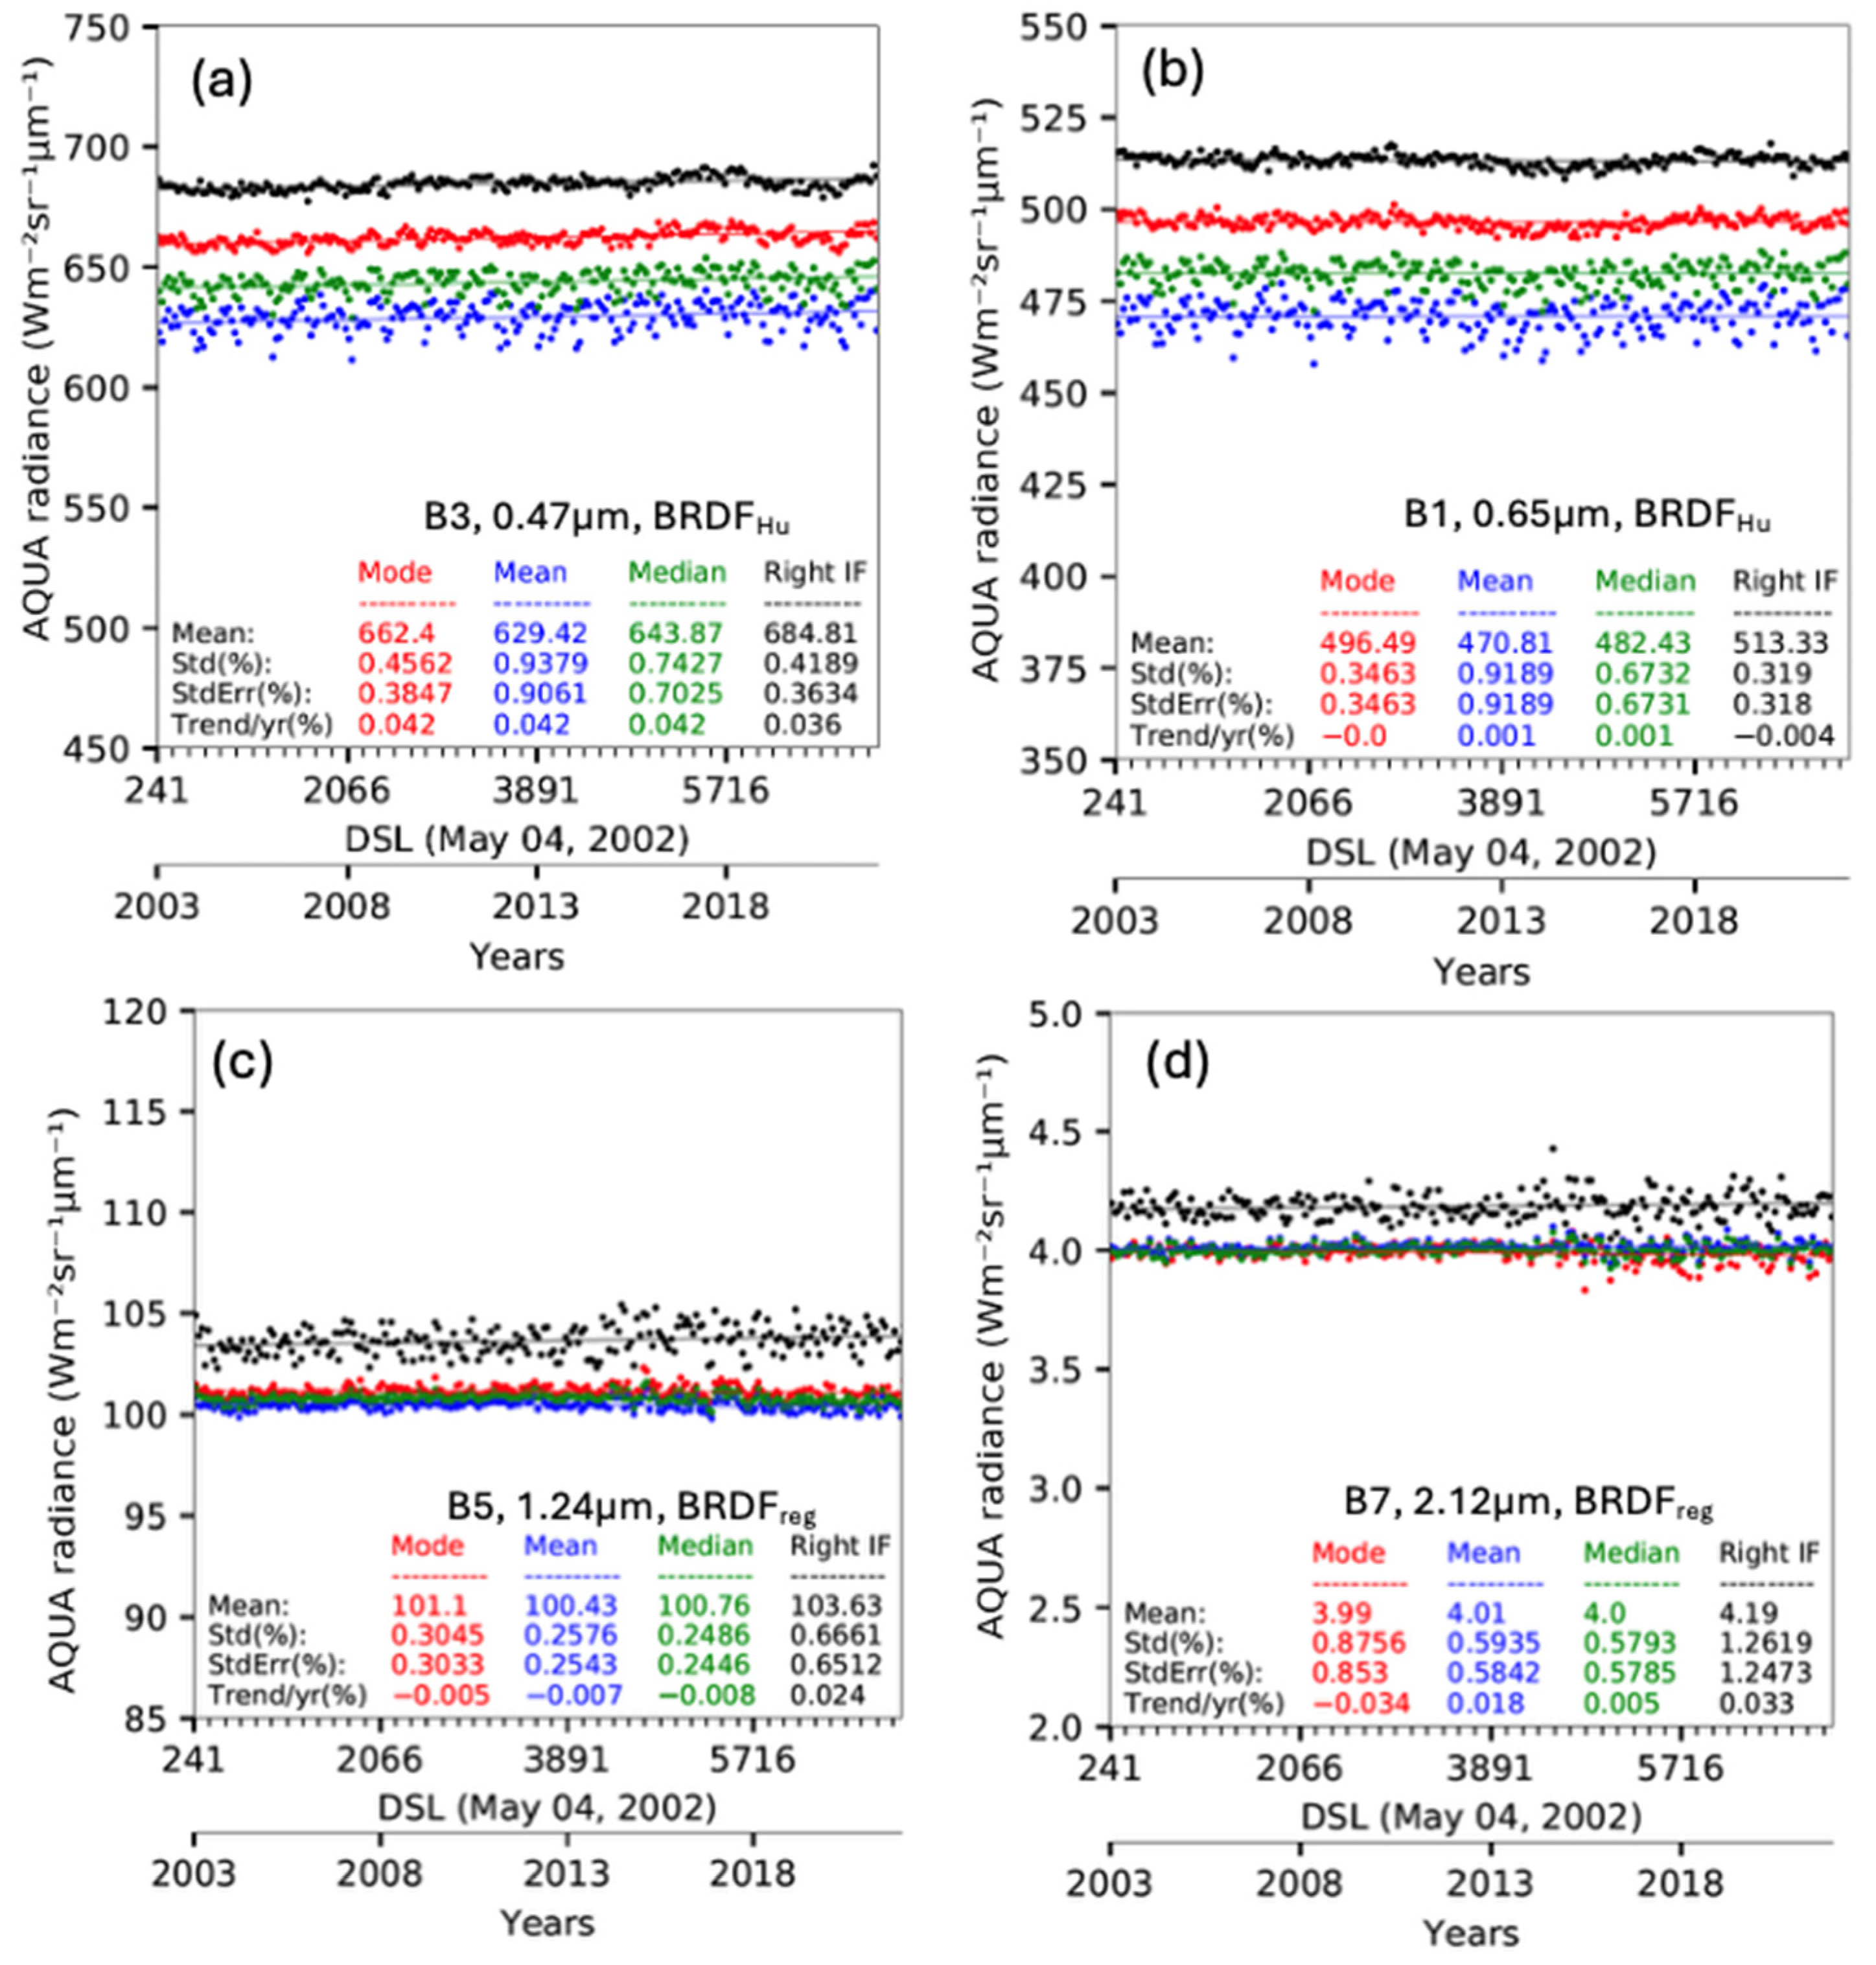
Figure 5a, where the monthly PDF statistic noise increases between 2010 and 2016. The MODIS time-dependent response versus scan (RVS) angle has been characterized utilizing DCC for bands 1 through 7 and band 26. For Terra-MODIS bands 3, 4, 5, and 7, the RVS variation can exceed 2%. The impact of the February 2016 Terra safe-mode incident on MODIS bands 5, 6, and 7 is apparent in
Figure 5c. Beginning in February 2016, the Terra-MODIS B5 1.24 µm trend increases, followed by a decrease in 2020. For Aqua-MODIS, the time-dependent RVS shows smaller overall temporal trends (
Figure 6) than Terra-MODIS (
Figure 5). For this study, the Terra-MODIS DCC-IT record begins in 2001 due to poor data quality in earlier years [
37]. These calibration anomalies contribute to higher trend
SE compared to the well-calibrated NPP-VIIRS imager.
The Terra-MODIS and Aqua-MODIS DCC-IT trend
SE record ended in 2022 when their orbits started to drift. The empirical DCC BRDFs used in this study were obtained while the satellites were maintained in the 1:30 PM synchronous orbit and are not applicable to drifting orbits. It is possible to develop empirical BRDFs for increasing SZAs and the changing local time while the orbits drift; however, the drift time period will be too short to build robust BRDFs. For visible bands, the
adjustments cover all angular conditions. However, the accuracy of the MODIS time-dependent RVS corrections is questionable, since they are based on Earth invariant targets characterized with 1:30 PM observations. It would be difficult to unravel the
and the MODIS time-dependent RVS inadequacies [
37]. It is anticipated that future MODIS C7 trend
SE will improve, since the C6.1 calibration anomalies will be mitigated. The DCC-IT methodology will be an excellent approach to assess the calibration improvements between MODIS C6.1 and C7.
2.9. NOAA20 DCC-IT SWIR Band Stability by NPP-Based BRDF
In this section, we examine whether NPP- or NOAA20-derived empirical SWIR band BRDFs are interchangeable. Since both the NPP and NOAA20 satellites are in the same 1:30 PM sun-synchronous 16-day repeat orbit, the NPP-VIIRS and NOAA20-VIIRS empirical BRDFs should be similar since they capture the same DCCs. The benefit of applying an existing VIIRS empirical BRDF to a future VIIRS imager is that the future VIIRS imager onboard calibration stability can be evaluated within a few months after launch. The success of the DCC-IT method is based on the assumption that the DCC radiances are similar inter-annually. However, the empirical BRDFs may still be impacted by short term ENSO events, which can alter the typical DCC spatial distribution and their accompanying microphysics and angular sampling. To investigate this, the NPP record was partitioned into two 6-year time periods, 2012 to 2017 and 2018 to 2023. The latter period coincides with the NOAA20 record. The NOAA20-VIIRS DCC-IT SWIR band radiances are adjusted by both 6-year record NPP-based empirical BRDFs and compared with the NOAA20-based empirical BRDF. Comparing the NOAA20 BRDF with 2018–2023 record NPP empirical BRDFs will help determine whether the two BRDFs are interchangeable. In contrast, the comparison with the 2012 to 2017 and 2018 to 2023 record NPP BRDFs will determine if the DCC stability is impacted by short term ENSO events.
Table 3 reveals that the individual SWIR band NOAA20-VIIRS DCC-IT
-adjusted PDF
median statistic trend
SE (ranging from 0.14% to 0.34%) are 20% lower than the corresponding NPP
-adjusted PDF
median trend
SE (0.18% to 0.41%) shown in
Table 2. This more stable NOAA20 trend
SE can also be attributed to the shorter NOAA20 record, since optimal sensor performance is experienced at the beginning of the record. As the sensor ages, the probability of onboard calibration system anomalies increase. Also, as subsequent VIIRS imagers are built, slight improvements are made to correct design and manufacturing flaws. For example, NPP-VIIRS had an anomalous NIR degradation due to the tungsten dust residue on the mirrors [
38], which was not the case for NOAA20-VIIRS.
Now, we compare the NOAA20-VIIRS DCC-IT SWIR band record as a function BRDF adjustment, as shown in
Table 3. The corresponding trends are given in
Table A3. As expected, the NOAA20
-adjusted PDF
median provided the lowest trend
SE. The 2018 to 2023 and 2012 to 2017 record NPP-based
trend
SE are greater by ~30% and ~40%, respectively; however, the
trend
SE are only slightly greater by ~10% and ~20%, respectively. Remarkably, the
and
PDF
median show similar trend
SE when utilizing the NPP-based BRDFs during the 2012 to 2017 record. This suggests that the empirical DCC BRDF models derived from different time periods of the same sensor are more consistent than those derived from various sensors operating in the same orbit. This implies that the DCC-IT SWIR band reflectance is similar interannually, with only slight fluctuations due to ENSO and other long term tropical synoptic patterns.
To understand why the model varies between NPP 5-year record periods as well as the NOAA20 record, the 2018 to 2023 NPP and NOAA20 model bin reflectance pairs across SZA, VZA, RAZ, latitude, longitude, and month are plotted (not shown). Likewise, the corresponding model bin reflectance pairs are plotted for comparison. The model bin reflectance pair scatter is greater than bin reflectance pairs. This is more than likely due to increased sampling required to construct the model, since it includes additional dimensions of latitude and longitude (Equation (8)). This makes it more susceptible to undersampling over a 5-year period. However, the similarity between models implies that the BRDF binning has robust sampling over a 5-year record. To select the best NOAA20 SWIR band BRDF approach to predict the future NOAA22 VIIRS sensor calibration stability shortly after launch, either the or model can be employed, since there is no significant difference in trendSE between the two.
It may be possible to combine the NPP and NOAA20-VIIRS DCC-IT observations to build a well-sampled
model. However, the individual satellite VIIRS L1b radiances are tied to their respective onboard calibration systems based on ground characterization, not to a common calibration reference. Lyapustin et al. 2023 [
39], in their
Table 4, list the NPP and NOAA20-VIIRS band calibration biases reported by the NASA MAIAC, VCST, and CERES-IGCG calibration teams. For the VIIRS visible bands, these biases range from 2% to 6%, with the NPP-VIIRS radiances appearing brighter than the NOAA20-VIIRS radiances. The ratio of the NOAA20 and NPP monthly mean DCC-IT BRDF-adjusted radiances can be used to radiometrically scale the NPP-VIIRS L1b radiances to match the NOAA20 L1b radiances. However, the VIIRS sensor inter-calibration should be resolved using DCC inter-calibration methods to effectively build the DCC-IT BRDF models.
4. Discussion
In this section, the DCC-IT methodology is applied to the Terra-MODIS, Aqua-MODIS, NPP-VIIRS, and NOAA20-VIIRS records. The trend
SE and associated trends are computed utilizing the
adjustment for visible channels and the
adjustment for SWIR channels as a function of PDF statistic and summarized in
Table 4 and
Table A4. The bands are listed in ascending order of wavelength. The PDF
median is excluded from the table, as its trend
SE are typically similar to the PDF
mean. The bold text indicates the PDF statistic with the lowest trend
SE for each band. For the MODIS and VIIRS visible bands, the PDF
inflection statistic generally results in the lowest trend
SE, except for MODIS B4 and Terra-MODIS B1. For visible bands, the PDF
inflection reduces the trend
SE by ~20% when compared to the traditional PDF
mode statistic across both VIIRS records, except for the M7 band. Unlike for VIIRS, the MODIS PDF
mode and PDF
inflection statistics provide comparable trend
SE. The trend
SE are a combination of the DCC-IT natural variability, sensor stability, and methodology noise. For the visible bands, the NPP-VIIRS imager has the lowest trend
SE, ranging from 0.20% to 0.26%, followed by NOAA20-VIIRS with trend
SE of 0.24% to 0.36%, Aqua-MODIS with trend
SE between 0.30% to 0.35%, and lastly Terra-MODIS provides the largest trend
SE between 0.33% to 0.55%. The NPP-VIIRS L1b record provides the upper limit of the DCC-IT methodology noise, as reflected in the trend
SE.
For the SWIR bands, the PDF
mean produces the lowest individual band trend
SE across the MODIS and VIIRS imager records, where the 1.24 µm band has the lowest trend
SE amongst all SWIR bands. For VIIRS SWIR channels, the 1.38 µm band contains the largest trend
SE. However, for MODIS SWIR channels, the 2.1 µm band has the largest trend
SE. Note that the MODIS 2.15 µm channel has more ice particle absorption than the VIIRS 2.25 µm channel. VIIRS also has a broader M10 1.61 µm spectral channel covering shorter wavelengths relative to the corresponding MODIS band 6. The spectral response differences between MODIS and VIIRS analogous band 1.61 µm and 2.2 µm may have resulted in disparate trend
SE, even with application of band-specific empirical BRDFs. Notably, half of the Aqua B6 detectors were inoperable, resulting in larger Aqua-MODIS B6 trend
SE compared to Terra-MODIS [
40]. The larger Terra-MODIS B5 trend
SE is due to the Terra spacecraft anomaly event that began in 2016 (see
Figure 5c). Remarkably, the Terra-MODIS B7 has slightly lower trend
SE than Aqua-MODIS for both PDF
median and PDF
mean statistics (see
Figure 5), although a radiance has an apparent trend in latter part of Terra-MODIS B7 record. Among all, NOAA20-VIIRS provides the lowest SWIR band trend
SE that range from 0.15% to 0.38%, followed by the NPP-VIIRS trend
SE that are within 0.22% to 0.46%, and Terra-MODIS and Aqua-MODIS have the largest trend
SE.
In summary, for wavelengths less than 1 µm, the DCC-IT methodology using anisotropic adjusted KDE PDFinflection statistic provides trendSE within 0.26%, based on the NPP-VIIRS imager. For wavelengths greater than 1 µm, the anisotropic adjusted PDFmean statistic yields the lowest trendSE, within 0.38%, based on NOAA20-VIIRS.
We have used trend standard error as a metric to optimize the PDF statistics and BRDF models. However, the combinations of PDF statistics and BRDF models do not significantly alter the linear trends for a given band imager. This indicates that the DCC methodology is robust, since the trends are not highly dependent on the PDF statistic and BRDF model, as shown in the
Appendix Tables.
Table 4.
The 2001 to 2024 Terra-MODIS, 2002 to 2024 Aqua-MODIS, 2012 to 2024 NPP-VIIRS, and 2018 to 2024 NOAA20-VIIRS L1b KDE DCC-IT trendSE in percent as a function of the PDFmode, PDFmean, and PDFinflection statistics. For the visible bands, the model is applied, whereas for the SWIR bands, the model is applied. The VIIRS M3 0.48 µm, M4 0.56 µm, I1 0.64 µm, M5 0.67 µm, M7 0.87 µm, M8 1.24 µm, M9 1.38 µm, I03 1.61 µm, M10 1.61 µm, and M11 2.25 µm channels and the MODIS B3 0.47 µm, B4 0.56 µm, B1 0.66 µm, B5 1.24 µm, B26 1.38 µm, B6 1.64 µm, and 2.13 µm B7 are organized by ascending wavelength. The MODIS B2 0.86 µm band saturates over DCC and thus is not shown. The PDFmedian has similar trendSE to the PDFmean and is not shown to keep the table succinct. The bold text highlights the lowest trendSE by PDF statistic and by sensor.
| BRDF Model | MODIS/VIIRS | Linear Trend Standard Error (%) |
|---|
| Band | Terra-MODIS | Aqua-MODIS | NPP-VIIRS | NOAA20-VIIRS |
|---|
| | Mode | Mean | Inflect | Mode | Mean | Inflect | Mode | Mean | Inflect | Mode | Mean | Inflect |
|---|
| BRDFHu | B3/M3 | 0.56 | 0.92 | 0.55 | 0.38 | 0.91 | 0.36 | 0.35 | 1.01 | 0.26 | 0.42 | 1.00 | 0.31 |
| B4/M4 | 0.45 | 0.84 | 0.49 | 0.34 | 0.84 | 0.36 | 0.34 | 0.98 | 0.26 | 0.42 | 0.99 | 0.36 |
| I01 | | | | | | | 0.31 | 0.99 | 0.23 | 0.39 | 1.00 | 0.33 |
| B1/M5 | 0.34 | 0.84 | 0.34 | 0.35 | 0.92 | 0.32 | 0.31 | 1.02 | 0.20 | 0.35 | 1.00 | 0.24 |
| M7 | | | | | | | 0.25 | 0.95 | 0.23 | 0.25 | 0.93 | 0.24 |
| BRDFreg | B5/M8 | 0.69 | 0.61 | 0.96 | 0.30 | 0.25 | 0.65 | 0.22 | 0.22 | 0.58 | 0.19 | 0.15 | 0.59 |
| B26/M9 | 0.88 | 0.58 | 1.71 | 0.78 | 0.50 | 1.37 | 0.62 | 0.46 | 1.38 | 0.67 | 0.38 | 1.50 |
| I03 | | | | | | | 0.46 | 0.38 | 1.00 | 0.35 | 0.31 | 0.79 |
| B6/M10 | 0.66 | 0.58 | 1.01 | 0.55 | 0.50 | 1.01 | 0.43 | 0.38 | 0.91 | 0.34 | 0.31 | 0.91 |
| B7/M11 | 1.04 | 0.96 | 1.59 | 0.85 | 0.58 | 1.25 | 0.42 | 0.30 | 0.82 | 0.33 | 0.26 | 0.62 |
5. Conclusions
The NASA CERES project will reassess the MODIS and VIIRS imager RSB calibration stability in preparation for Edition 5. Since Edition 4, the DCC-IT methodology has made significant progress for both visible and SWIR bands. These improvements result from the validation of previously established DCC-IT approaches, further refinement of empirical BRDF models for SWIR bands, PDF statistic monitoring enhancements, monthly regional DCC-IT consistency validation efforts, and continued collaboration with the GSICS community. The DCC-IT methodology advancements could not have been accomplished without the well-calibrated VIIRS L1b pixel radiances on which the results are based.
For visible bands, the Hu BRDF was found to be most effective in correcting the anisotropic DCC reflectance over empirical models. The DCC-IT identified pixel radiance distribution was negatively skewed, likely due to the misidentified darker radiances. The anisotropic adjustment was most effective for the brightest DCC-IT pixel radiances. Unlike the PDFmean or PDFmedian, the PDFinflection and PDFmode statistics were not impacted by the darker radiances and greatly benefited from Hu BRDF adjustments. The PDFinflection statistic was designed to track even brighter DCC-IT pixel radiances than the PDFmode statistic. The success of PDFinflection lies in the use of the KDE to describe the PDF shape that mitigates the histogram bin increment discretization and avoids noisy PDFs due to sparse sampling. The regional consistency of the -adjusted DCC-IT radiances across 10° bins further validated the effectiveness of using PDFinflection or PDFmode statistics. The -adjusted PDFinflection provided the lowest trendSE, which were within 0.26% for NPP-VIIRS and within 0.36% for NOAA20-VIIRS and Aqua-MODIS imagers.
For SWIR bands, the DCC microphysics determines the DCC reflectance variability and is dependent on the ice particle scattering and absorption, which differs spatially, diurnally, seasonally, and by wavelength over the tropics, especially between land and ocean. However, the inter-annual DCC reflectance variability is much smaller. The DCC-IT identified pixel radiance distribution reveals a Gaussian PDF shape, enabling the use of empirical BRDF models based on the mean DCC-IT radiance. Multi-year-based empirical BRDFs were most effective to characterize the band-specific SWIR anisotropic behavior. The PDFmean and PDFmedian are best suited to track the collective DCC-IT radiance mean. Due to the radiance differences between in SWIR bands, separate land and ocean empirical BRDFs were incorporated, where the land radiance was normalized to the ocean radiances to align their distributions. Similarly, for the empirical regional BRDF, each of the 10° gridded DCC-IT radiances was normalized to the tropical mean radiance. The DCC-IT -adjusted PDFmean provided the lowest trendSE, which were within 0.38% for NOAA20-VIIRS, within 0.46% for NPP-VIIRS, and within 1% for MODIS.

