Article

Analysis of GNSS Precipitable Water Vapor and Its Gradients During a Rainstorm in North China in July 2023

1
Guangxi Zhuang Autonomous Region Meteorological Technology Equipment Center, Nanning 530022, China
2
Meteorological Observation Center, China Meteorological Administration, Beijing 100081, China
3
Guizhou Meteorological Data Center, Guiyang 550002, China
4
School of Electronic Information Engineering, Beihang University, Beijing 100191, China
*
Author to whom correspondence should be addressed.
These authors contributed equally to this work and should be considered co-first authors.
Remote Sens. 2025, 17(18), 3247; https://doi.org/10.3390/rs17183247
Submission received: 7 August 2025 / Revised: 31 August 2025 / Accepted: 16 September 2025 / Published: 19 September 2025
(This article belongs to the Special Issue Recent Progress in Monitoring the Troposphere with GNSS Techniques)

Abstract

Highlights

What are the main findings?
  • Water vapor gradient (WVG) retrieval based on GNSS tropospheric parameters can effectively reflect the non-uniformity of water vapor per unit area at the station.
  • When PWV is high (>60 mm) and WVG convergence is observed, radar reflectivity is significantly strong, and the precipitation occurs at the frontline of the big gradients and the convergence region.
  • In case of a large PWV accompanied by plummeting WVG (down to 0.1–0.4 mm/km), large or persistent precipitation occurs.
What is the implication of the main finding?
  • GNSS PWV and WVG can be key indicators for short-range weather forecasting of extreme rainstorm events.

Abstract

This study presents a water vapor gradient (WVG) retrieval method based on Global Navigation Satellite System (GNSS) tropospheric parameter estimation. A case study examined the method’s applicability to the extreme rainstorm event in North China in July 2023. Precipitable water vapor (PWV) and WVG data from 332 GNSS sites in this area were retrieved. Radar and precipitation data were combined to perform a spatiotemporal comparison study. The results show that GNSS PWV and WVG of this weather process were highly consistent with radar reflectivity and precipitation. When a high PWV (>60 mm) was accompanied by WVG convergence, radar reflectivity was significantly strong and precipitation occurred at the leading edge of large gradients and the convergence region. Based on the edge of big WVGs, observed by multiple GNSS stations, the location and movement of rainfall could be identified. In case of large amounts of PWV accompanied by plummeting WVG (down to 0.1–0.4 mm/km), high or persistent precipitation occurs. During the event, compared to the northern plateau, the plain region demonstrated higher PWV, lesser WVG variation, and more intense precipitation, likely caused by the topographic dynamic effect. GNSS PWV and WVG can be key indicators for short-range weather forecasting of extreme rainstorm events.

Graphical Abstract

1. Introduction

From 29 July to 2 August 2023, a historically rare extreme rainstorm occurred in North China (“23·7” North China Rainstorm). The principal causes included the following: (1) abundant water vapor, (2) a blocking pattern induced by high-pressure systems, and (3) orographic lift provided by the terrain. The maximum accumulated precipitation reached 1003.4 mm. Regions including Beijing, Hebei, and Tianjin were severely impacted by secondary disasters such as floods, landslides, and urban waterlogging. The disaster resulted in 107 people reported dead or missing, the destruction of approximately 104,000 houses, and damage to 416,100 hectares of crops. Additionally, the rainstorm severely damaged regional infrastructure, including electricity, communications, transportation, and water conservancy projects, causing direct economic losses estimated at CNY 165.79 billion [1].
The formation and development of rainstorms depend on abundant and continuous supply of water vapor [2]. Precipitable water vapor (PWV)—a representation of water vapor content in the atmosphere—significantly affects the occurrence and scale of rainfall [3]. Water vapor gradients (WVGs) can reflect the local asymmetry of water vapor in the atmosphere and are used to capture rainfall development trends. Therefore, a nuanced analysis of the relationship between heavy rainfall occurrence and both PWV and WVG is crucial for short-range forecasts and early warnings of heavy rain.
The existing water vapor observation technology mainly includes radiosonde, microwave radiometers, and remote sensing techniques. Radiosonde is a traditional observation method that provides reliable water vapor information [4]. However, it is not conducive to water vapor observation during heavy rainfall and is limited by its low temporal resolution, with twice daily observations (i.e., 00 UTC and 12 UTC). Microwave radiometers and satellite infrared radiometers can only provide water vapor information under clear-sky conditions, while clouds and rain often accompany extreme weather. Therefore, the application of these water vapor observation methods in rainstorm research remains limited [5]. Global Navigation Satellite Systems (GNSSs, including GPS, BDS, GLONASS, Galileo, etc.) can accurately retrieve PWV of the station via the zenith tropospheric delay (ZTD) estimation. GNSSs are characterized by high precision, high temporal resolution, and all-weather operation [6]. With a temporal resolution that can reach minutes or even seconds and an accuracy of 1–2 mm, this method effectively overcomes the limitations of traditional monitoring approaches [7,8]. GNSS observation has been taken as the priority observation by the World Meteorological Organization (WMO) GCOS Reference Upper-Air Network (GRUAN) [9]. It is noteworthy that the assimilation of PWV into the Weather Research and Forecasting Model (WRF) can significantly improve the model’s forecast capability for rainstorm events [10].
In addition to retrieving the PWV, GNSS can estimate the horizontal tropospheric gradient (HTG) [11]. HTG represents the asymmetric characteristics of troposphere delay, comprising north–south and east–west gradient delays (i.e., G n s and G e w ). Strong spatiotemporal variation in tropospheric water vapor usually occurs with severe weather conditions, resulting in a large HTG [12]. Tu et al. (2021) studied the variation in HTG during a typhoon and identified that HTG values at stations near the typhoon were larger and oriented toward the typhoon center [13]. Nykiel et al. (2019) examined a rainstorm process and identified high consistency between HTG and radar reflectivity [14]. Zus et al. (2018) assimilated the GNSS HTG and improved the 24 h forecast generated by the Global Forecast System (GFS) model [15]. Therefore, to ascertain the weather variations induced by water vapor changes, it is essential to consider tropospheric gradient information.
The HTG only represents the integrated delay resulting from atmospheric asymmetry in the north–south and east–west directions, without defining a specific spatial range. Alternatively, it remains vague what proportion of north–south and east–west gradient information is generated within a 1 km distance. The HTG cannot adequately characterize meteorological features for accurate application in extreme weather events. This study proposes a method for retrieving the WVG (unit: mm/km) based on the GNSS HTG, enabling the assessment of water vapor gradient asymmetry within unit distances around GNSS stations. Combined with the “23·7” North China rainstorm event, the relevant application of PWV and the WVG is analyzed. It provides a high spatiotemporal resolution monitoring method and scientific data support for short-range forecasts of extreme rainfall.
The rest of this article is organized as follows: Section 2 introduces the background of the “23·7” North China rainstorm. Section 3 discusses in detail all datasets and calculation algorithms for both PWV and the WVG. Section 4 verifies the accuracy of GNSS PWV and the WVG using ERA5 data, followed by an analysis of GNSS PWV and the WVG during the “23·7” North China rainstorm with radar and precipitation data. The conclusions are presented in Section 5.

2. Background

The northwest of North China is more elevated than the southeast. In the west are the Taihang Mountains with elevations ranging from 700 m to 3000 m. In the north are the Yanshan Mountains with altitudes between 500 m and 1500 m. The eastern part of North China gradually transitions into a plain. To gain a deeper understanding of the evolution and dissipation of the “23·7” North China rainstorm, this study focuses on the region of longitude 111–122.5°E and latitude 35–44°N (Figure 1), during the period 29 July–2 August 2023. The study area includes Beijing, Tianjin, Hebei, Henan, Shandong, Shanxi, Inner Mongolia, and Liaoning.
This rainstorm was characterized by high intensity, prolonged duration, and extreme precipitation accumulation. The rainfall intensity in Beijing surpassed the records of the August 1996 rainstorm (“96·8” rainstorm), July 2012 rainstorm (“12·7” rainstorm), and July 2016 rainstorm (“16·7” rainstorm) (Table 1).
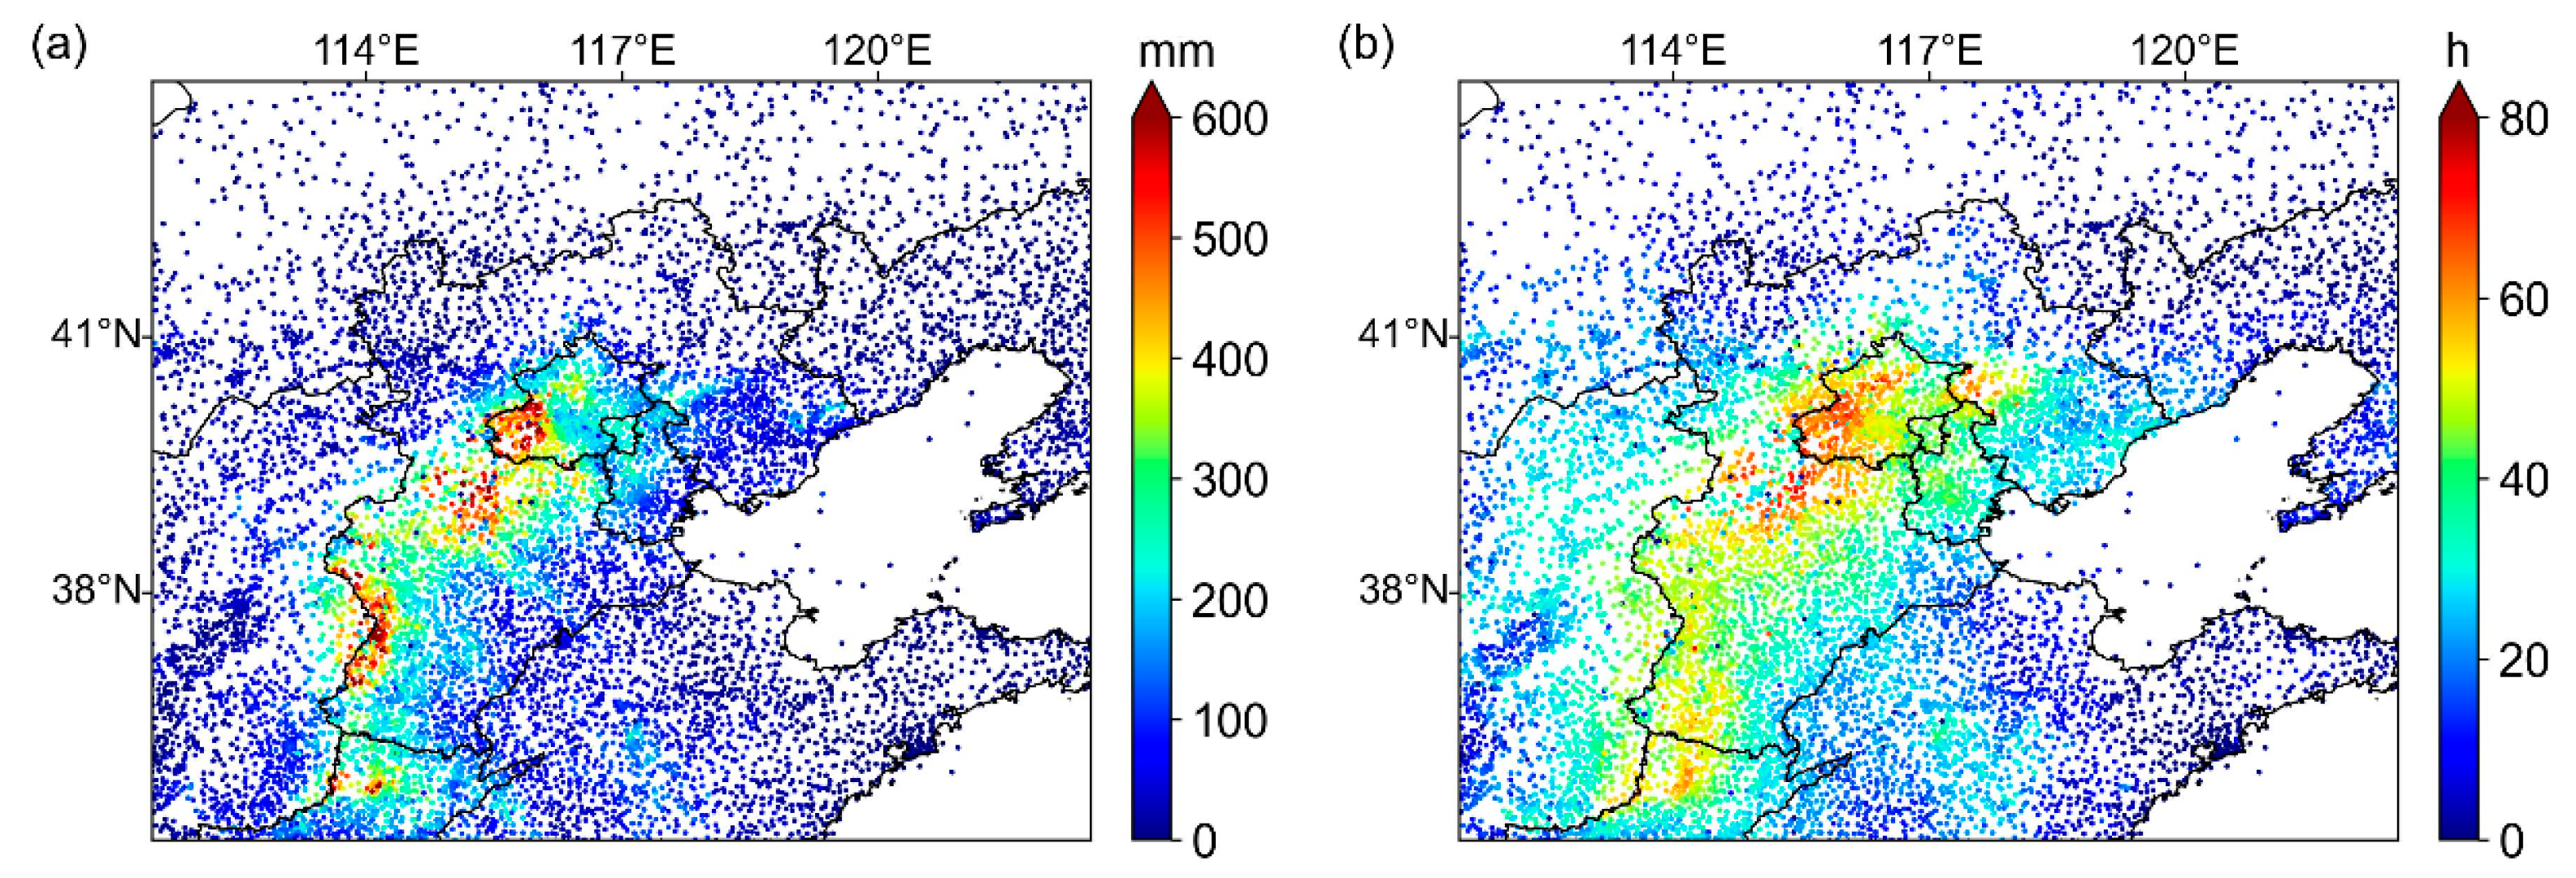
Figure 2 displays the observed precipitation data from 9759 automatic meteorological stations in North China. From 00 UTC on 29 July to 00 UTC on 2 August, the cumulative rainfall in southwestern Beijing and central and southwestern Hebei reached 300–600 mm, with locally exceeding 700–800 mm. The maximum cumulative rainfall was 1003.4 mm. The area receiving more than 100 mm of rainfall covered approximately 170,000 km2. The maximum hourly precipitation (PRE) ranged from 50 to 80 mm/h at the edge of Hebei’s southwestern mountainous area and parts of central/southwestern Beijing. The maximum value (PRE = 111.8 mm/h) was observed in Fengtai, Beijing. The precipitation lasted over 70 h in southwestern Beijing and central Hebei.
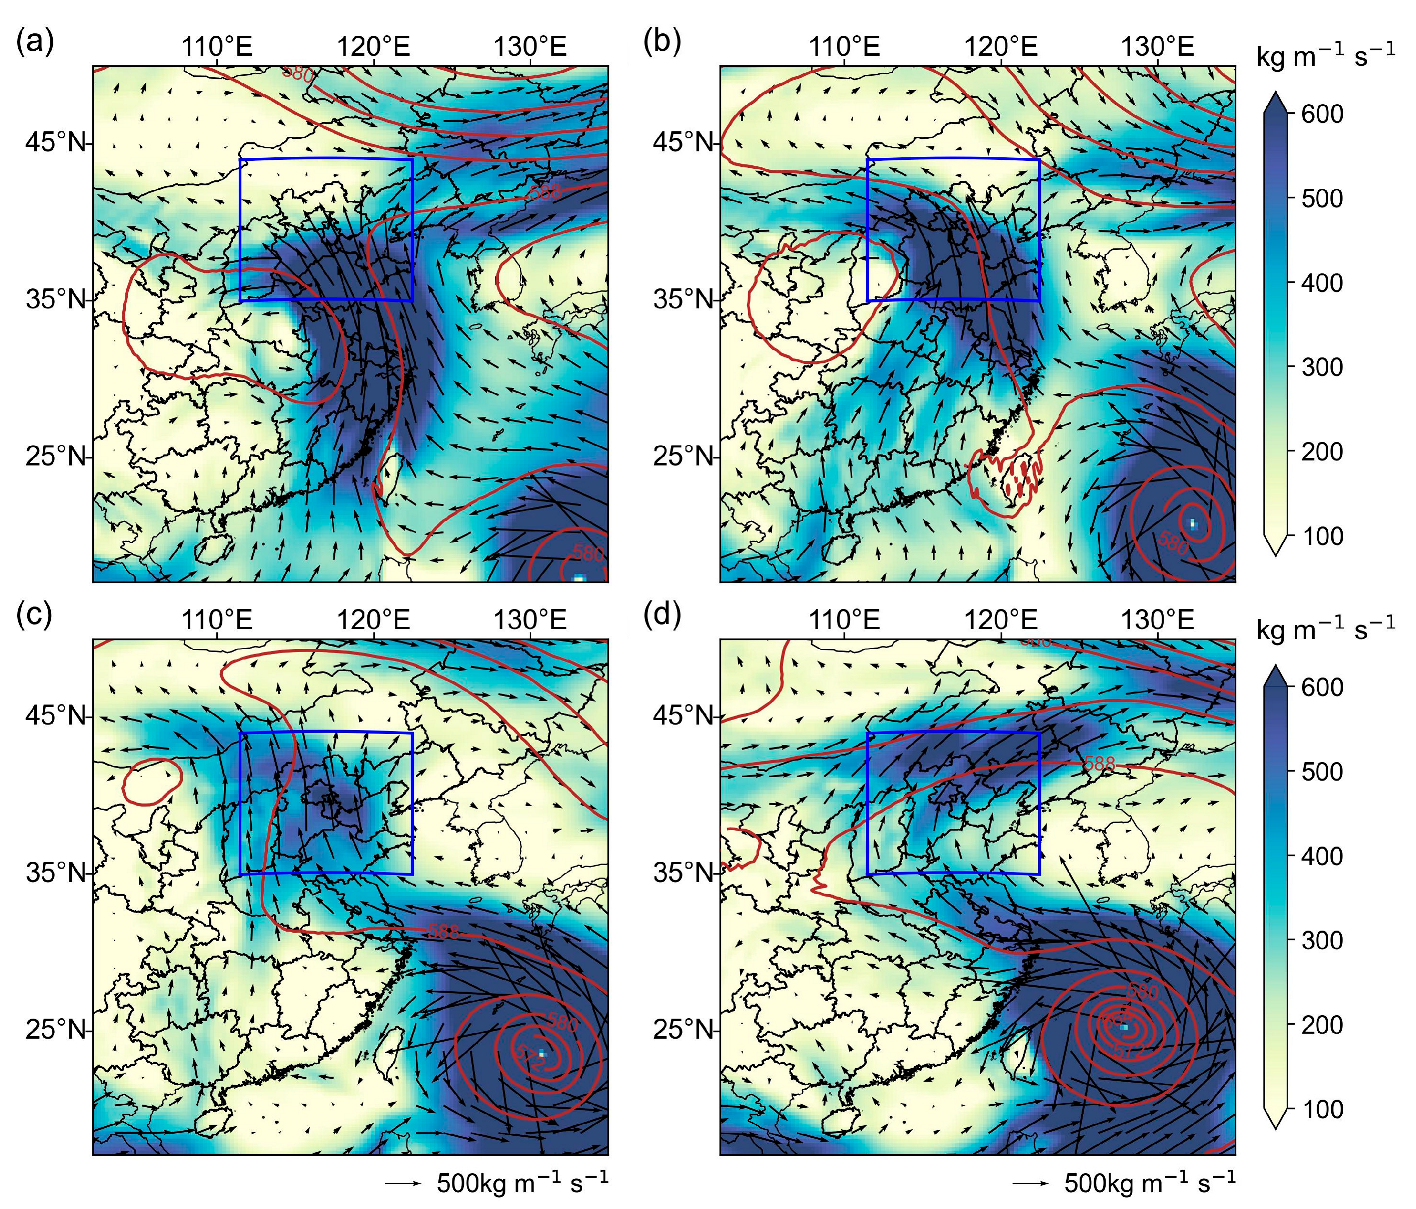
Abundant water vapor is among the main reasons for this extreme precipitation [1,16]. The water vapor transport distribution of ERA5 from 29 July to 1 August is depicted in Figure 3. After the weakening of Typhoon No. 5 Doksuri, its low-pressure circulation carried abundant water vapor and converged with the southeasterly flow at the periphery of the subtropical high. Typhoon No. 6 Khanun transported substantial water vapor over long distances, with its water vapor advancing into the North China Plain along a southeast–northwest trajectory. Additionally, the blocking effect of the high-pressure system decelerated the typhoon circulation movement (contour lines in Figure 3). Combined with orographic lifting mechanisms, these factors collectively contributed to the extreme precipitation characteristics of high intensity and prolonged duration [17,18].

3. Data and Methods

Four types of data were used: (1) PWV and WVG data retrieved from GNSS; (2) ERA5 data, to verify the accuracy of PWV and WVG of the GNSS retrieval; (3) hourly precipitation data (PRE), from automatic meteorological stations and the Chinese Meteorological Administration Multi-source Merged Precipitation Analysis System (CMPAS); and (4) composite reflectivity products from weather radar networks, along with reflectivity factor and radial velocity products provided by millimeter wave cloud radar.

3.1. Data

By 2023, the observation stations of the China Meteorological Administration GNSS-based network (CMAGN) had increased to 1126, with 332 stations in North China. Despite Precise Point Positioning (PPP) being widely applied for data processing [19,20], the double-differenced network solution was adopted for GNSS data processing to optimize the results by eliminating common errors for a specific region [21]. In this context, the GAMIT/GLOBK software (Release 10.7) package was used to process the original GNSS observations by means of the double-difference scheme for all stations [22]. The PWV is computed every half hour, and the HTG is computed every hour during operation. The distribution of sites is depicted in Figure 1 (black dots). In the study area, there are many stations in the south and relatively few stations in the north. The altitude of stations ranges from 3.2 m to 2210.1 m, distributed in both mountainous and plain areas.
ERA5 is the fifth-generation ECMWF atmospheric reanalysis of the global climate model covering the period from 1940 to present. ERA5 combines substantial numerical forecast, ground observation, satellite data, etc., for global estimates using advanced modelling and data assimilation systems. The GNSS Meteorological Ensemble Tools (GMET, https://gmet.users.sgg.whu.edu.cn, accessed on 15 September 2025) developed by Wuhan University can output ERA5 PWV, hydrostatic gradients, and wet horizontal gradient data referring to time, longitude, and latitude [23]. Compared to VMF3 and GRAD (6 h update rate), GMET applies a more accurate discrete mapping function and gradient model with higher temporal (hourly) resolution [24]. In this study, hourly ERA5 PWV and gradient data were extracted using GMET to validate the accuracy of GNSS PWV and gradients.
The CMPAS hourly precipitation real-time product integrates automatic meteorological station precipitation observations, radar quantitative precipitation estimates, and satellite retrieval of precipitation data. It is developed based on the technology of deviation correction and fusion analysis. The spatial resolution is 0.05° × 0.05°, updated hourly. The accuracy in China exceeds that of comparable international products [25]. This study used CMPAS hourly precipitation products to analyze the relationship between PWV, WVG, and the spatial variation in rainfall. Additionally, the temporal evolution of GNSS PWV and the WVG were analyzed using rainfall observation from collocated automatic meteorological stations.
The composite reflectivity factor product is obtained from the new-generation weather radar operating in the C-band and S-band, with a time resolution of 6 min. The space coverage is good across China, especially in eastern and northern regions [26]. In this study, PWV and the WVG were compared with the spatial distribution of radar combined reflectance, using hourly data for analysis. Additionally, millimeter wave cloud radar can penetrate cloud particles to obtain an explicit vertical structure [27]. Two cloud radar observation sites (Figure 1, red triangles) were selected, where GNSS receivers and automatic meteorological stations were installed within 100 m to maintain spatial consistency of multi-source data. The vertical structures were analyzed using time-series data from cloud radar reflectivity and radial velocity products.
The GNSS observations and radar and precipitation data are available from the China Meteorological Data Service Center upon official request (https://data.cma.cn/, accessed on 15 September 2025).

3.2. Methods

The propagation of GNSS electromagnetic wave signals through the atmosphere causes inevitable delay and bending, producing tropospheric slant total delay (STD), which can be written as follows:
S T D = M h ε Z H D + M w ε Z W D       i s o t r o p i c   p a r t   +   M g ε G n s cos α + G e w sin α a n i s o t r o p i c   p a r t
where ε and α denote the satellite elevation angle and azimuth angle, respectively, at the observation station. Z H D denotes the zenith hydrostatic delay; Z W D denotes the zenith wet delay. G n s and G e w are the horizontal tropospheric gradient in the north–south and east–west directions, respectively. Hydrostatic mapping functions M h and wet mapping functions M w are meshed VMF1 mapping functions [28]. The gradient mapping function M g was set according to Chen et al. (1997) [29].
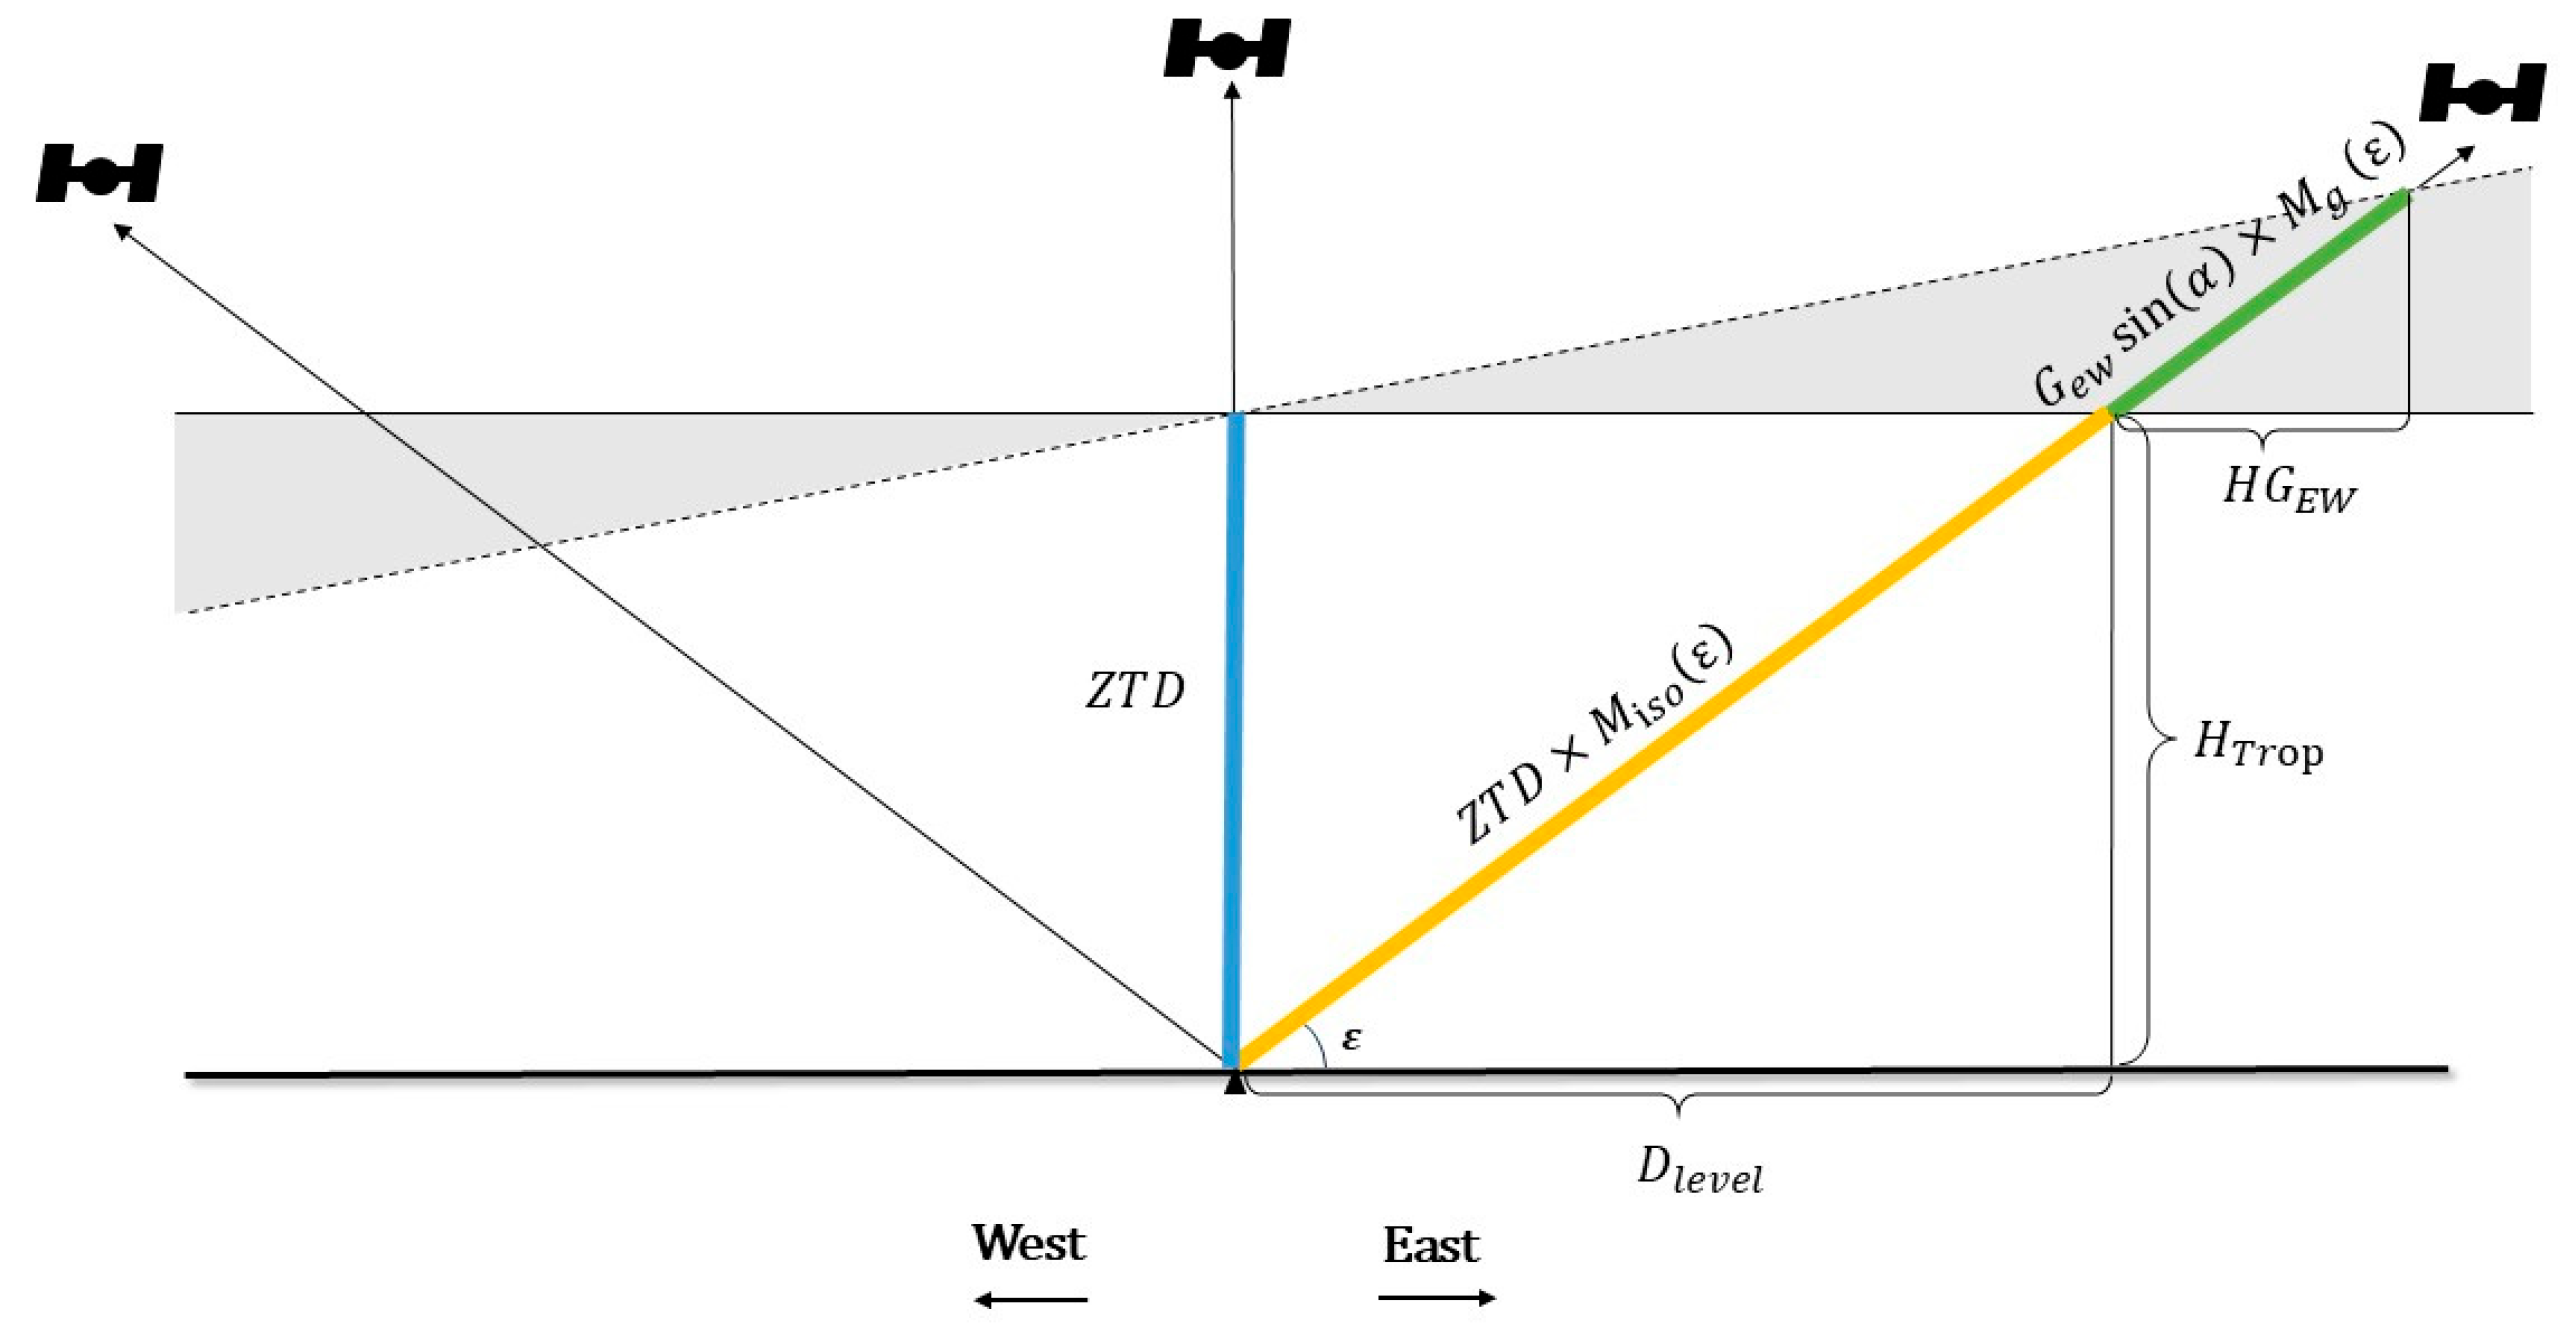
Tropospheric delay can be divided into isotropic and anisotropic delays according to the azimuthal variation characteristics. For most applications, the isotropic part provides enough accuracy. However, in case of extreme terrain variations and adverse weather conditions, the asymmetrical tropospheric delay (anisotropic) part can be considered [30]. To illustrate the description, Figure 4 presents a schematic diagram in the east–west direction. A signal passing the atmosphere from the east traverses a thicker atmospheric layer than a signal from the west.

3.2.1. Precipitable Water Vapor

Z T D consists of two components: Z H D and Z W D . Z H D is estimated using the Saastamonien model [31], which can achieve millimeter-level accuracy.
Z H D =   [ 2.2779 ± 0.0024 / ( 1 0.00266 × cos 2 φ 0.00028 h ) ] × P s
where P s is the ground pressure at the station (unit: hPa). h is the height of the station (unit: km). φ is the latitude of the station.
Z W D is a delay caused by water vapor in the atmosphere and can be separated after subtracting Z H D from Z T D . Z W D can be expressed as follows:
Z W D = Z T D Z H D
By multiplying Z W D by the water vapor conversion parameter ( ), PWV can be obtained:
P W V = × Z W D
= 10 6 / ρ w R v ( k 3 T m + k 2 )
where T m is the weighted mean temperature (unit: K) and ρ w is the density of liquid water (1000 k g / m 3 ).   R v is universal gas constant for wet air (461.518 J / k g · K ). k 2 and k 3 represent coefficients of atmospheric refractivity, which are 17 ± 10 K / h P a and 3.776 ± 0.004 × 10⁵ K 2 / h P a , respectively.

3.2.2. Water Vapor Gradients

Similarly, asymmetrical tropospheric delay includes hydrostatic gradient delay and wet gradient delay. As the hydrostatic gradient delay is considerably smaller than the wet gradient delay, the effect of the hydrostatic gradient is ignored in this study. The asymmetrical tropospheric delay is approximated by the wet gradient delay [32].
As the gradient parameters G n s and G e w exhibit small and non-intuitive values near the zenith, GAMIT rescales them to represent the difference between the north–east and south–west delays at a 10° elevation angle (i.e., ε = 10 ° ) [33]. The north–south slant gradient delay ( S G n s = G n s cos α × M g ε ) and east–west slant gradient delay ( S G e w = G e w sin α × M g ε ) data from the parsing file are extracted. By multiplying these values by the water vapor conversion factor, they can be converted into the slant water vapor increments ( S W N , S W E ) caused by the water vapor gradient.
S W N S = · S G n s S W E W = · S G e w
The slant water vapor increments in the north–south and east–west directions are projected onto the horizontal plane according to the elevation angle ( ε ). The north–south and east–west water vapor gradients in the horizontal direction were obtained according to (7):
H G N S = S W N S · c o s ( ε ) H G E W = S W E W · c o s ( ε )
where H G N S represents the north–south water vapor gradient in the horizontal direction, and H G E W represents the east–west water vapor gradient in the horizontal direction (Figure 4).
The tropopause height was determined according to Liu et al. (2014) [34]. The projection distance of the GNSS site in the horizontal direction was obtained based on the elevation angle and tropopause height.
D l e v e l = H t r o p / t a n ( ε )
D l e v e l represents the projection distance of GNSS site in the horizontal direction, while H t r o p represents tropopause height. Finally, the water vapor gradient per unit distance in the north–south and east–west directions ( W V G N S , W V G E W ) is calculated as follows:
W V G N S = H G N S / D l e v e l W V G E W = H G E W / D l e v e l
The magnitude and direction of the water vapor gradient (units: mm/km) can be expressed as follows:
W V G = W V G N S 2 + W V G E W 2
θ = a t a n ( W V G N S / W V G E W )
θ represents the direction of the water vapor gradient.

4. Results and Discussion

4.1. Data Validation

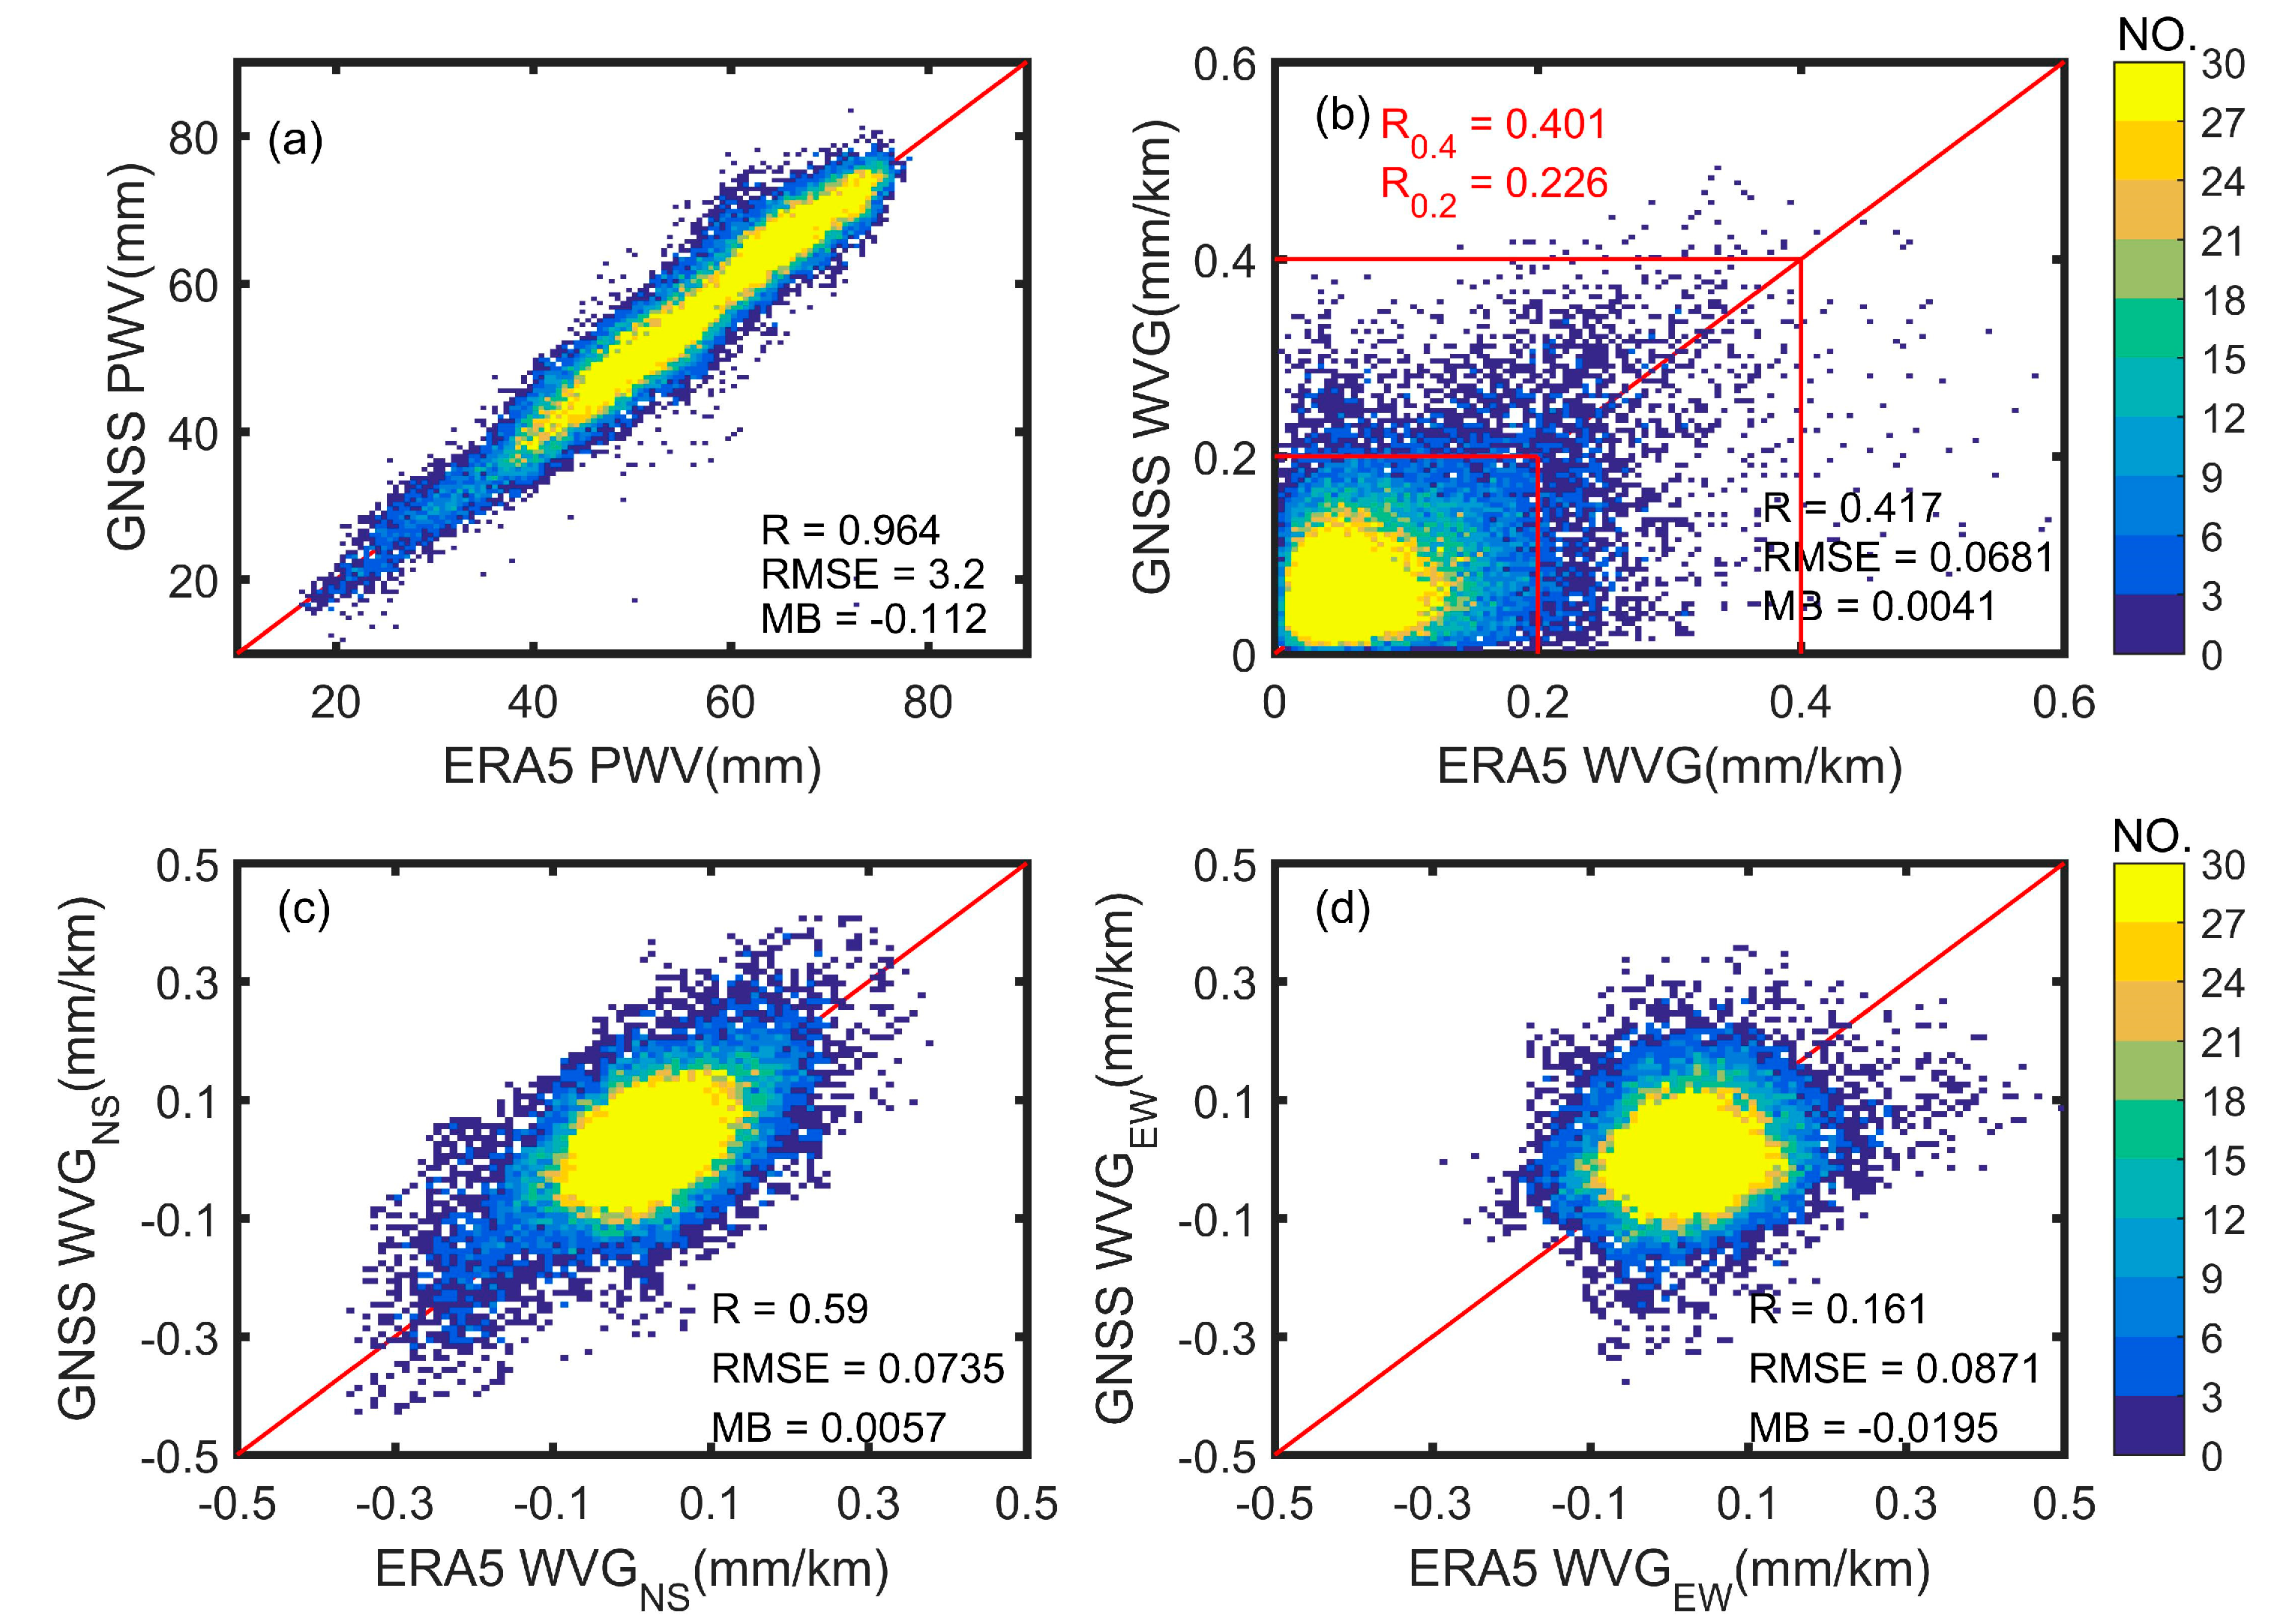
ERA5 data were used to conduct a comparative analysis of GNSS PWV and the WVG from 28 July to 2 August. The hourly ERA5 PWV and horizontal tropospheric gradient data corresponding to 332 GNSS stations were extracted using GMET. The WVG was then calculated based on the horizontal tropospheric gradients (Section 3.2.2). Figure 5 demonstrates good agreement between GNSS and ERA5 PWV, showing a correlation coefficient (R) of 0.964, root mean square error (RMSE) of 3.2 mm, and mean bias (MB) of −0.11 mm. These accuracy metrics are comparable to those reported in previous studies [34,35]. There exists a certain correlation trend between GNSS and ERA5 WVG (R = 0.417). Specifically, when WVG < 0.2 mm/km, R is 0.226, while it increases to 0.401 for WVG < 0.4 mm/km. The correlation tends to become stronger as the gradient magnitude increases. According to Figure 5c,d, the R between GNSS and ERA5 W V G N S is 0.590. This correlation level aligns with the findings of Li et al. (2015) [36] and Graffigna et al. (2019) [30] regarding the HTG. The correlation for W V G N S is significantly higher than that for W V G E W (R = 0.161), which may be related to the predominant south-to-north water vapor transport during this event (Figure 3). The W V G N S values (approximately −0.3 to 0.4 mm/km) were generally greater than the W V G E W values (approximately −0.2 to 0.3 mm/km). The consistency between GNSS and ERA5 is higher under conditions of strong WVG. Conversely, when the water vapor is stable with reduced spatial variability, the correlation between GNSS and ERA5 tends to decrease.
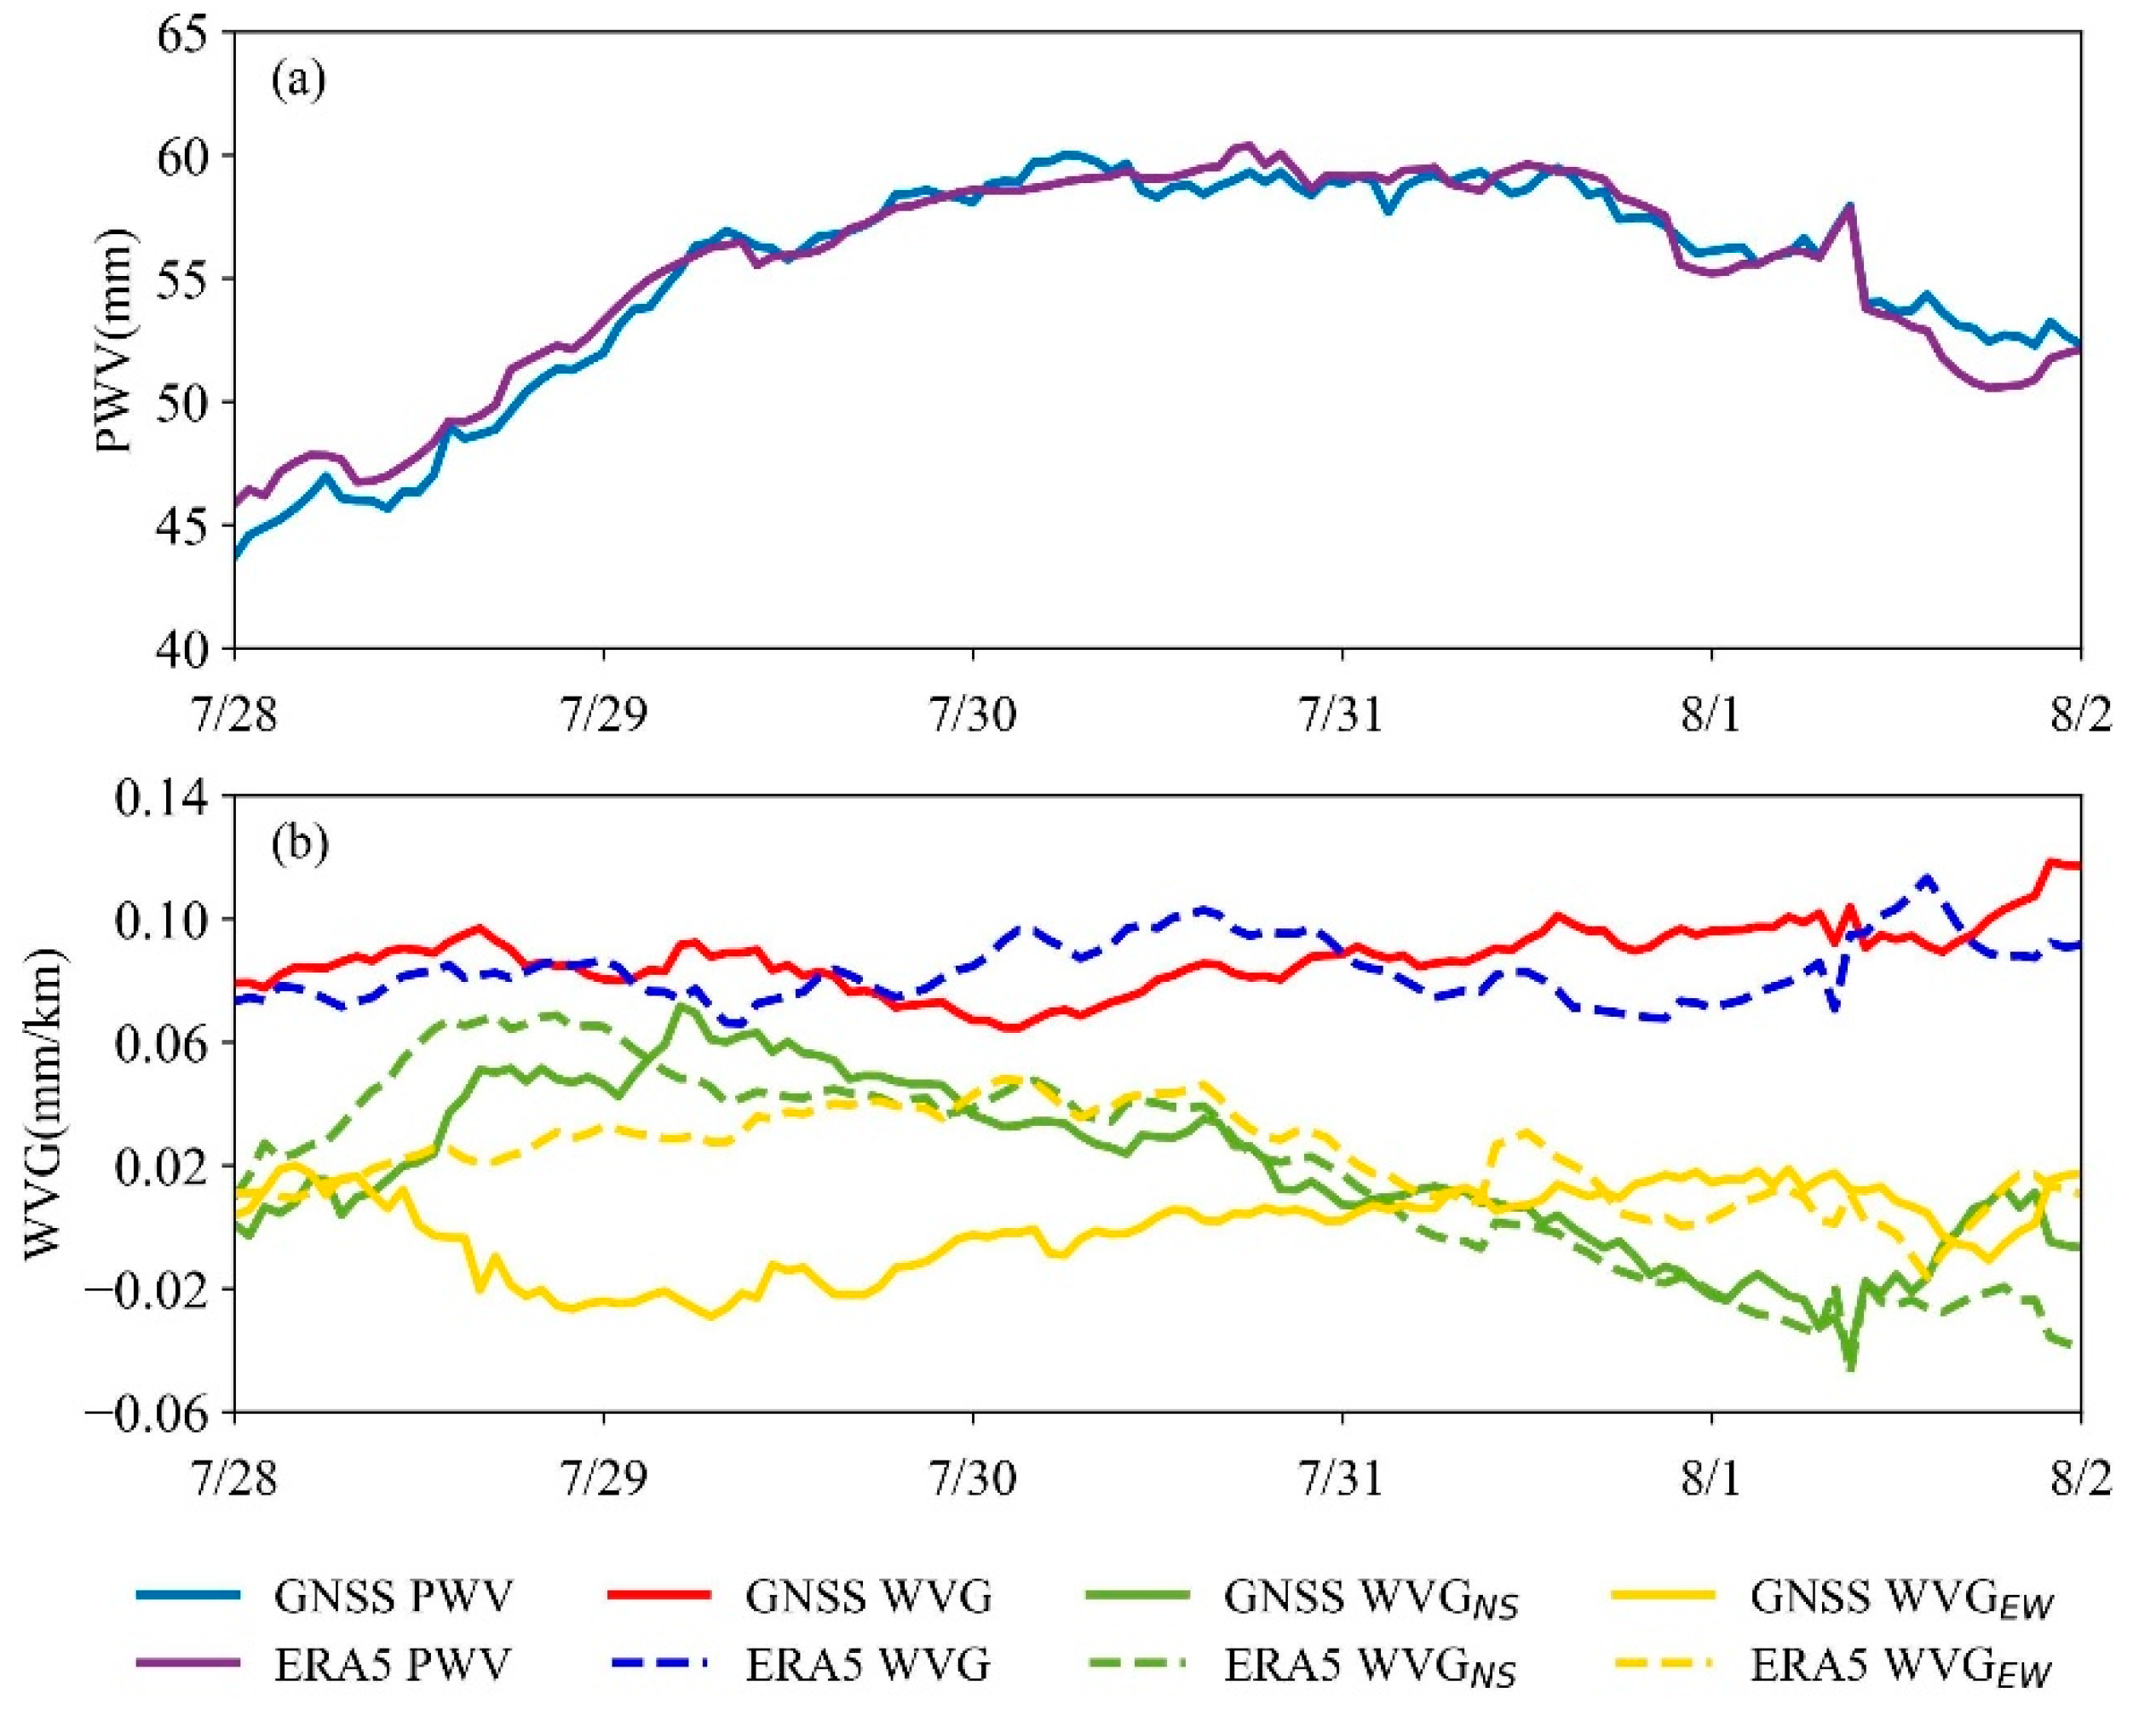
Figure 6 depicts the time series of regionally averaged PWV and WVG calculated from GNSS stations and collocated ERA5 data in North China. The GNSS PWV exhibits strong consistency with the ERA5 PWV. The PWV gradually increased from 28 to 30 July. From 30 July to 1 August, PWV remained consistently high at approximately 60 mm. After 1 August, the water vapor gradually decreased. The range of GNSS and ERA5 WVG is mostly between 0.06 and 0.1 mm/km. The larger differences between the two datasets arose from 30 July to 1 August. During this period, large-scale precipitation occurs with high PWV conditions, where even minor variations in water vapor distribution resulted in significant WVG fluctuations.
The trends in GNSS and ERA5 W V G N S are basically the same. The gradient increased from 28 to 29 July and gradually decreased from 29 July to 1 August. After 10 UTC on 1 August, there was an increasing trend. In contrast, the difference in W V G E W between GNSS and ERA5 is more significant. Especially before 31 July, GNSS WVGs are mostly higher in the east and lower in the west, while the ERA5 gradients show the opposite directional characteristics.
In summary, GNSS PWV shows a strong correlation with ERA5 data, while W V G N S also demonstrates significant correlation. The relatively weaker correlation of W V G E W can be attributed to several factors: (1) the retrieval of GNSS WVG is influenced by multipath, uncertainty of receiver antenna-phase center variations, and a lower signal-to-noise ratio [37]. (2) ERA5 provides data on a 25 km grid, whereas GNSS sensing covers an inverted cone with a radius of approximately 20 km centered on the station, leading to differences in spatial representation. (3) GNSS provides near-instantaneous values representative of the station location, whereas ERA5 hourly data represent temporal averages. Additionally, as water vapor transport primarily occurs along the north–south direction, the magnitude of W V G E W is relatively small, with a reduced correlation between GNSS and ERA5 W V G E W data. Nevertheless, during this extreme precipitation event, the variation trends of WVG from both GNSS and ERA5 demonstrate reasonable consistency, supporting the potential use of GNSS WVG in the analysis and prediction of severe precipitation weather.

4.2. Spatial Distribution Analysis

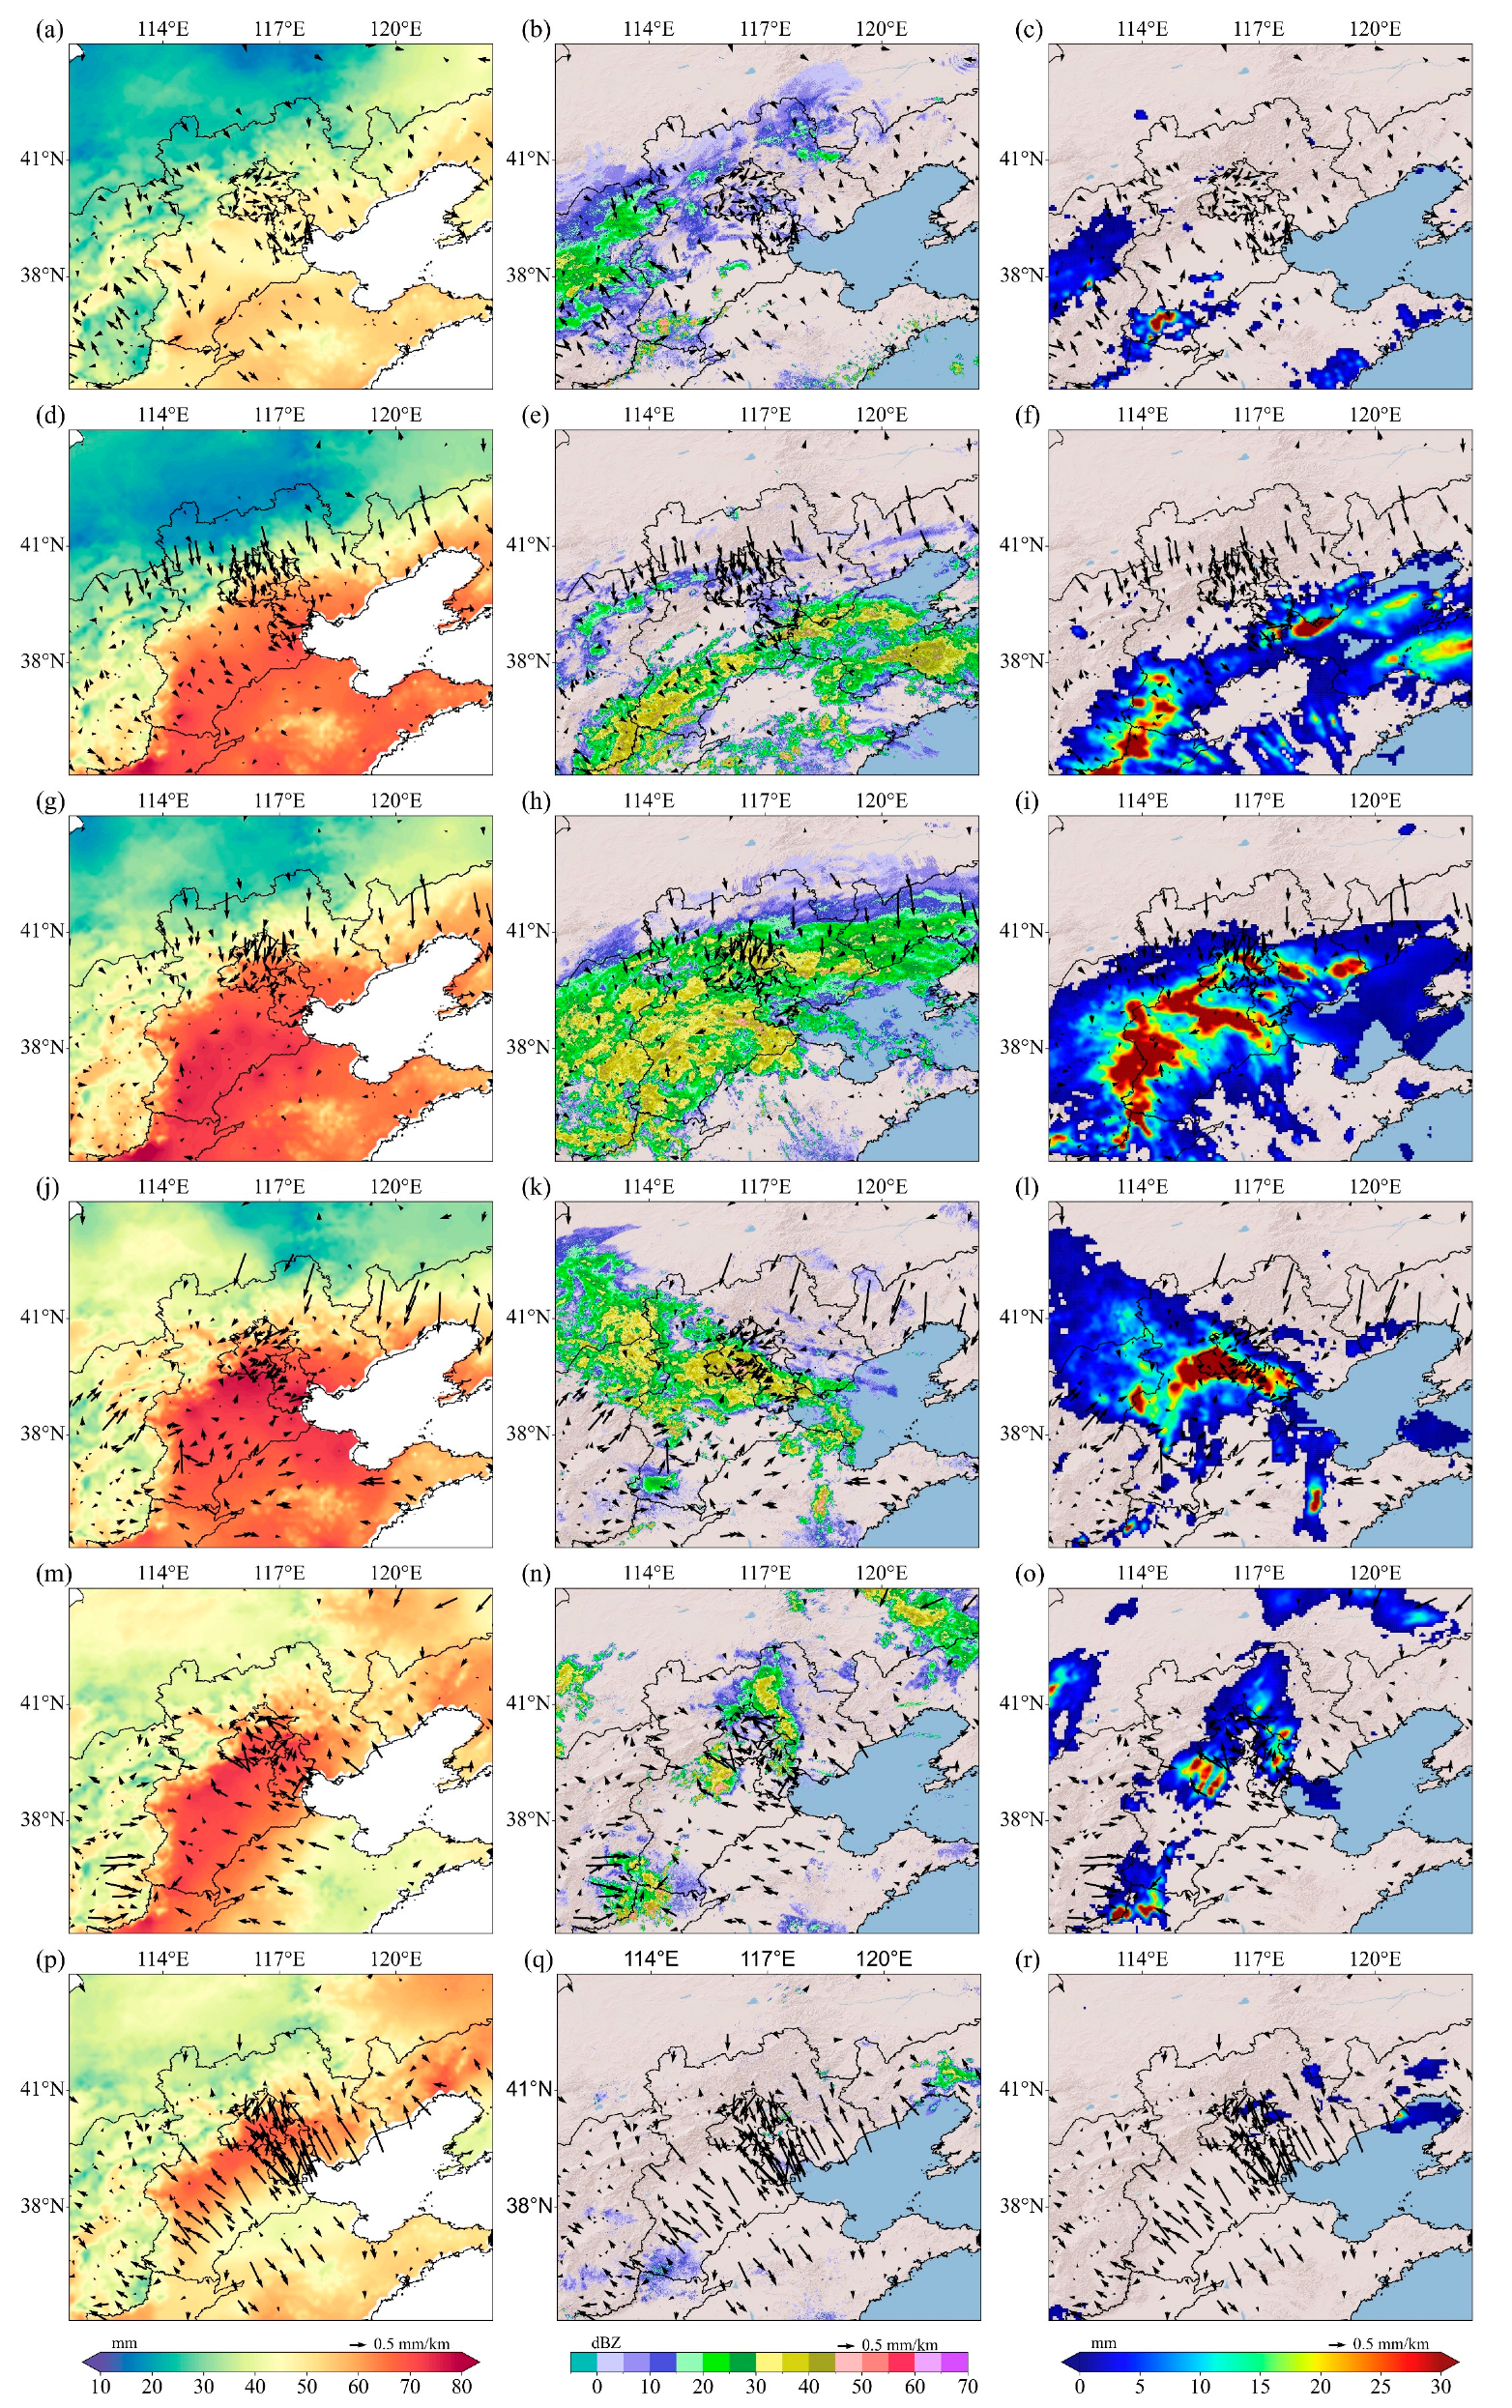
Kriging interpolation [38] was applied to obtain GNSS PWV on a spatial grid, a method that has been verified to achieve high accuracy [39]. Previous studies have shown that atmospheric water is composed of water vapor and hydrometeors, both of which are key elements in precipitation formation [40]. Combined with composite reflectivity and precipitation data, Figure 7 illustrates the spatial distribution of PWV interpolation grid (first column), WVG (black arrows), combined reflectance (second column), and 3 h cumulative precipitation (i.e., the cumulative precipitation at 00, 01, 02 UTC, third column) from 28 July to 2 August at 00 UTC. These data are used to further explore the relationship between water vapor, hydrometeors, and precipitation.
On 28 July at 00 UTC (Figure 7a–c), affected by the water vapor remnants of Typhoon Doksuri and topographic factors, the PWV in the study area was high in the southeast (40–50 mm) and low in the northwest (20–40 mm), with a small WVG (<0.5 mm/km). Radar reflectivity was primarily concentrated in the southwest with light precipitation occurring in localized areas of Shanxi and southern Hebei. On 29 July at 00 UTC, water vapor content had increased significantly in the southeastern part of the study area, influenced by long-range transport from Typhoon Khanun to the southeast. The PWV in the southeast region was significantly higher than that in the northwest (Figure 7d). Large WVGs were observed over northern Shanxi, northern Hebei, and western Liaoning, with WVG > 0.4 mm/km. Combined with radar echoes (Figure 7e), the abundant water vapor favored the merging and development of convective cells in the southeast region, where the composite reflectivity of the echo center reaches 35–50 dBZ. The larger WVGs were located at the leading edge of the echo systems, while the WVGs on the inside were relatively small. This pattern corresponded to precipitation in southern Hebei, Tianjin, and other places, where 3 h cumulative precipitation exceeds 20 mm.
On 30 July, the typhoon continued to transport water vapor to North China. The water vapor content in the southeast of the study area maintained high at 00 UTC, with PWV > 70 mm in Shandong, southern Hebei, Beijing, and Tianjin (Figure 7g). Relative to 00 UTC on 29 July, the precipitation system continued to move northward, while convective cells began intensifying over the Beijing–Tianjin–Hebei region. Owing to the blocking of the subtropical high and the northern continental high ridge, a strong east–west oriented echo band developed across North China. The composite reflectivity of the Beijing–Tianjin–Hebei region reached 45–55 dBZ (Figure 7h). A large WVG persisted at the radar echo boundary. Compared to 00 UTC on 29 July (Figure 7e), the WVG in the western part showed some reduction. This reduction may be attributed to the fact that a few stations are located within the system, while a large gradient (>0.68 mm/km) remains at the northern system boundary. At this time, extensive rainfall occurred across North China. Influenced by topography, the 3 h cumulative rainfall reached 25–50 mm east of the Taihang Mountains and south of the Yanshan Mountains.
At 00 UTC on 31 July (Figure 7j–l), the water vapor content in the southern part of the study area decreased (approximately 5 mm). Meanwhile, the PWV in the northwestern part increased (approximately 10 mm) and the PWV in the Beijing-Tianjin-Hebei area exceeded 80 mm. The corresponding southern radar echo weakened, while the northwestern echo formed. Pronounced WVG emerged in the southwest region, oriented from southwest to northeast. Concurrently, significant WVG in the northeast region, oriented from northeast to southwest, collectively delineated the echo periphery. Precipitation occurred within the echo, with the largest precipitation located in the south of Beijing.
As the circulation field shifted to the northeast, water vapor content increased in the northeastern region but decreased in the southeast by 00 UTC on 1 August (Figure 7m). PWV in Southern Hebei, Beijing, and Tianjin was over 60 mm. The large-scale system began to decompose, with radar echoes in the southwest, central, and northeast regions. The water vapor gradients of the stations around the echoes exhibit a certain convergence trend, especially in the strong echo areas of southern Hebei, northern Henan, and central Hebei. The 3 h cumulative precipitation in the convergence zones reached 20–30 mm (Figure 7o). At 00 UTC on 2 August, PWV decreased in North China and large WVG (0.5–0.7 mm/km) appeared in the south, indicating that the process had moved from southeast to north. Weak radar echoes were received over Beijing, Tianjin, and Liaoning, corresponding with precipitation in those areas.
In brief, the precipitation process was mainly generated in the south of Shanxi, Shandong, and Henan, and gradually moved northward. Blocked by the subtropical high and the northern continental high ridge, along with continuous transport of water vapor, the large-scale system maintained stably over North China for more than 48 h. Prior to the large-scale precipitation (28 July), PWV spiked. During the continuous precipitation period (29–31 July), the PWV remained high (PWV > 60 mm). As it began to decline (1–2 August), the precipitation process weakened; this aligns with findings from previous studies [41].
It can be noted that the WVG can better reflect the large-scale process boundary and precipitation region. For example, during 29–30 July, pronounced water vapor gradients were observed by multiple GNSS stations at the boundary of the large-scale precipitation system, while the WVG inside the system was relatively small. In the case of small convective cells (Figure 7k,n), precipitation often occurs in the convergence area of water vapor gradients. On 2 August, the large southeast to northwest gradient indicated that the process had moved northward, with these stations located near the bottom boundary of the system.
Therefore, a PWV spike accompanied by WVG decline serves as a key indicator for predicting heavy precipitation events. Additionally, spatial analysis of the multi-station WVG clarifies boundary and movement direction of the precipitation system.

4.3. Temporal Distribution Analysis

To ascertain the temporal variation characteristics of the “23·7” North China rainstorm based on collocated GNSS, millimeter-wave cloud radar, and automated meteorological station observations, Station 54511 (longitude: 116.47°E, latitude: 39.81°N, altitude: 36.6 m) and Station 54421 (longitude: 117.11°E, latitude: 40.66°N, altitude: 292.9 m) were analyzed on a time scale (red triangles in Figure 1). Station 54511 is in the urban area of Beijing, which effectively reflects the impact of the process on the urban area. Station 54421, located near Yanshan Mountain, was used to compare the effect of topography on precipitation.
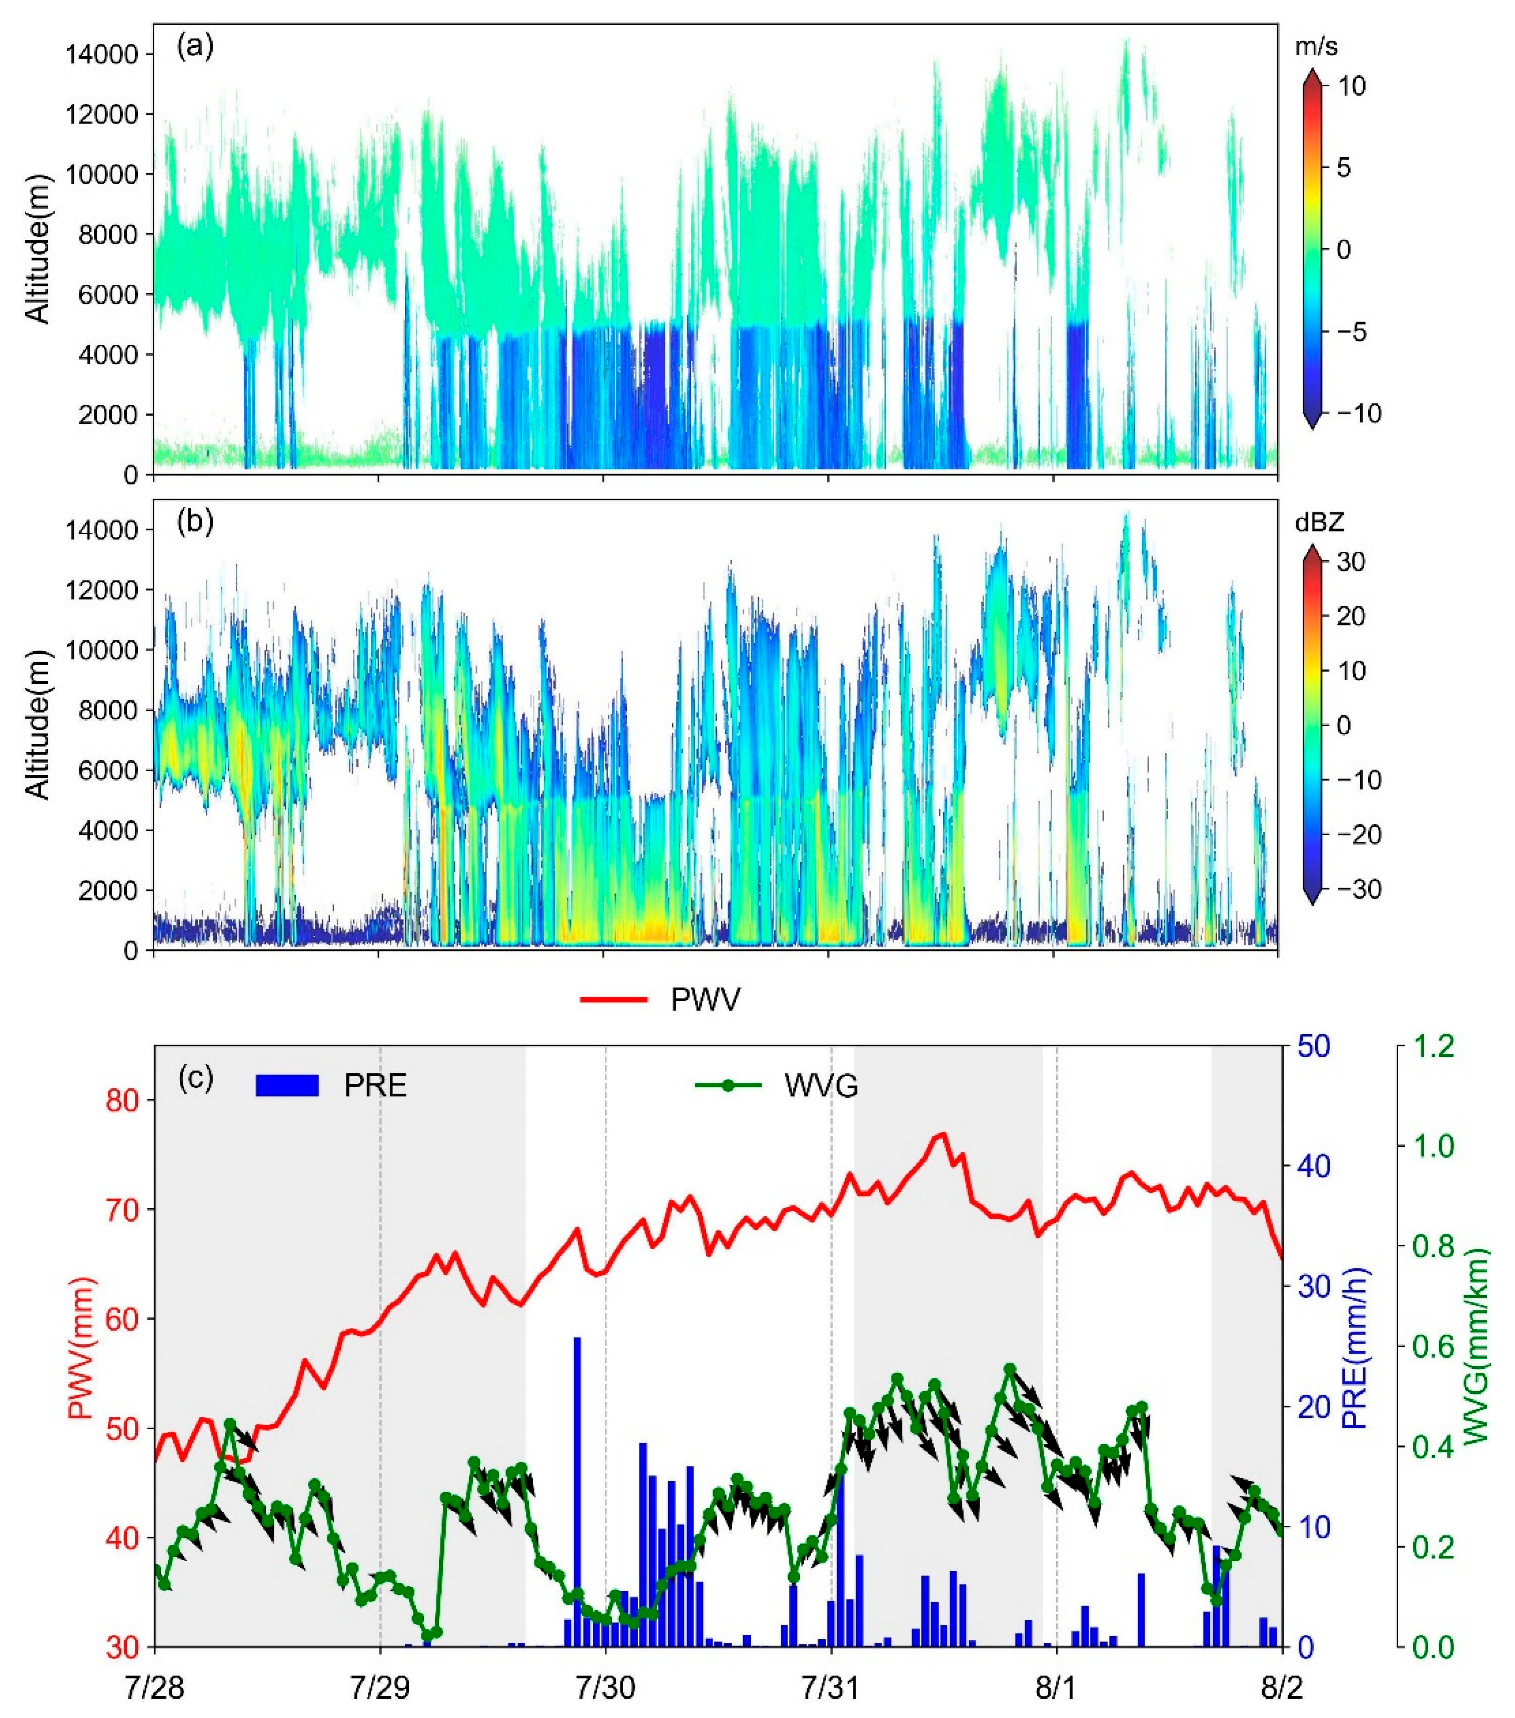
Figure 8 illustrates the time series of cloud radar radial velocity, reflectance factor, GNSS PWV and WVG, and automatic meteorological station PRE data from Station 54511. From 00 UTC on 28 July to 00 UTC on 2 August, the cumulative precipitation of the station was 239.1 mm. Persistent rainfall occurred over a 36 h period from 19 UTC on 29 July to 06 UTC on 31 July, reaching a maximum intensity of 25.7 mm/h.
The weather process can be divided into five time periods according to the direction of WVG: 28 July, 00 UTC—29 July, 16 UTC; 29 July, 17 UTC—31 July, 02 UTC; 31 July, 03 UTC—31 July, 22 UTC; 31 July, 23 UTC—1 August, 16 UTC; and 1 August, 17 UTC—2 August, 00 UTC (Figure 8c white and grey background color interval). In the first period, PWV spiked from 47.05 mm to a maximum of 65.96 mm. The WVG tends toward the southeast direction, indicating higher water vapor content in the southeast of the station. During this period, there were multiple instances where WVG first declined and then increased. Combined with cloud radar analysis (Figure 8a,b), the echoes were connected to the ground at the corresponding time, with radial velocity increases from 0 m/s to approximately −4 m/s at 4000 m altitude. The absence of precipitation or occurrence of only light precipitation was mainly attributable to water vapor content that was insufficient to support heavy rainfall development.
In the second period, the PWV still showed an increasing trend. Solid precipitation particles gradually transitioned to liquid phase near the 5000 m altitude. The particle size decreased, density increased, and the radial velocity was approximately −5 to −8 m/s. Strong echoes were observed near the surface (>15 dBZ), and the cloud top height decreased. The WVG changed from southeast to south, and maintained a low value during the continuous precipitation period. Similar to the spatial distribution conclusion in Figure 7, the precipitation process in this period moved from south to north. The PWV in the south of the station is high. Enhanced WVGs occurred when stations were located at the weather system boundary, whereas reduced gradients were observed within the system interior.
In the third period, the PWV reached a maximum value of 76.86 mm. The WVG pointed to the southeast direction, and the gradient value fluctuated remarkably, which may have been due to decomposition of the large-scale system and the influence of multiple cells on the gradient. PRE exceeded 5 mm when the WVG decreased and then subsequently increased. Compared to the second period, the precipitation intensity decreased and the near-surface reflectance factor became >10 dBZ. In the fourth period, the PWV decreased, the WVG pointed to the south, and the echo connected to the ground when the WVG was low. At 5000 m altitude, the radial velocity increased and there was precipitation. It is noteworthy that in the fifth period, the WVG changed from the south to the northwest direction, exhibiting gradient intensification concurrent with PWV reduction. This indicates that the station is already located near the bottom boundary of the process, as evidenced in Figure 7p–r.
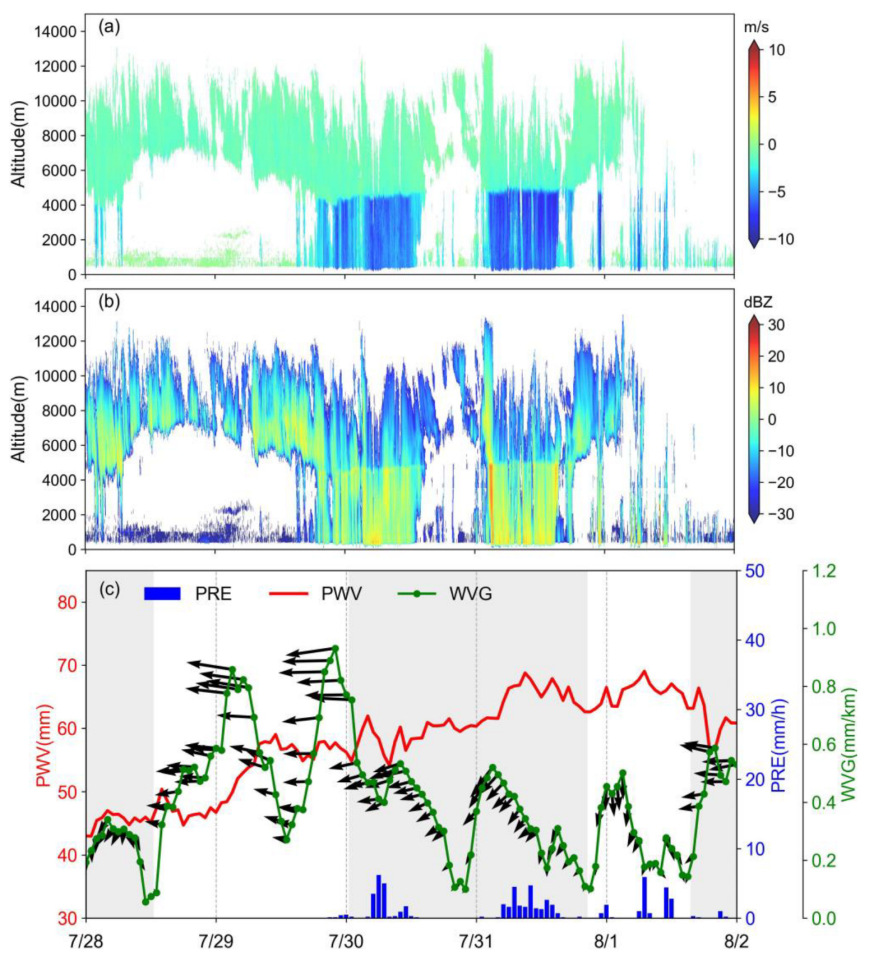
Figure 9 illustrates the time series of cloud radar radial velocity, reflectance factor, GNSS PWV and WVG, and automatic meteorological station PRE data from Station 54421. From 00 UTC on 28 July to 00 UTC on 2 August, the cumulative precipitation of the station was 63.5 mm, and the maximum precipitation was 6.2 mm/h occurring at 06 UTC on 30 July. According to the direction of the WVG, the process is also divided into five time periods. The first period is 00 UTC on 28 July to 13 UTC on 28 July, the second period is 14 UTC on 28 July to 00 UTC on 30 July, the third period is 01 UTC on 30 July to 21 UTC on 31 July, the fourth period is 22 UTC on 31 July to 15 UTC on 1 August, and the fifth period is 16 UTC on 1 August to 00 UTC on 2 August.
In the first period, the water vapor remained relatively stable (42.97–46.39 mm). Short-term ground echoes were observed, characterized by weak reflectivity and minimal radial velocity, which were likely associated with fog or drizzle. PWV increased in the second period, and the WVG shifted from south to west. As the station was at the boundary of the large-scale process during the first and second periods, the water vapor of the station was highly unstable, with the highest WVG being 0.93 mm/km and the lowest WVG being 0.05 mm/km. The WVG fluctuated notably, but no precipitation was observed.
In the third period, the PWV continued to increase to a maximum value of 69.04 mm, while the WVG tended towards the southwest. Two continuous precipitations occurred from 04 to 13 UTC on the 30th and 04 to 16 UTC on the 31st, respectively. At the corresponding time, the reflectance factor was relatively low at a vertical height above 4000 m, while it was large below 4000 m, and the radial velocity was greater than −5 m/s. The WVG decreased during the period of continuous precipitation; the lowest value appeared at 20–22 UTC on the 30th. The rebound of the WVG after its decline may be because the two continuous rainfalls were caused by different convective cells, which happened to be in the transition stage of the two cells from 20 to 22 UTC on the 30th.
In the fourth period, the water vapor value is maintained at a high level, while the water vapor gradient was oriented southward. When PRE > 5 mm, the WVG was relatively low. Similar to Station 54511, the WVG shifted from south to northwest during the fifth period, with increasing magnitude accompanied by decreasing PWV. This indicates that the process moved to the northwest, and the station was at the bottom boundary of the system.
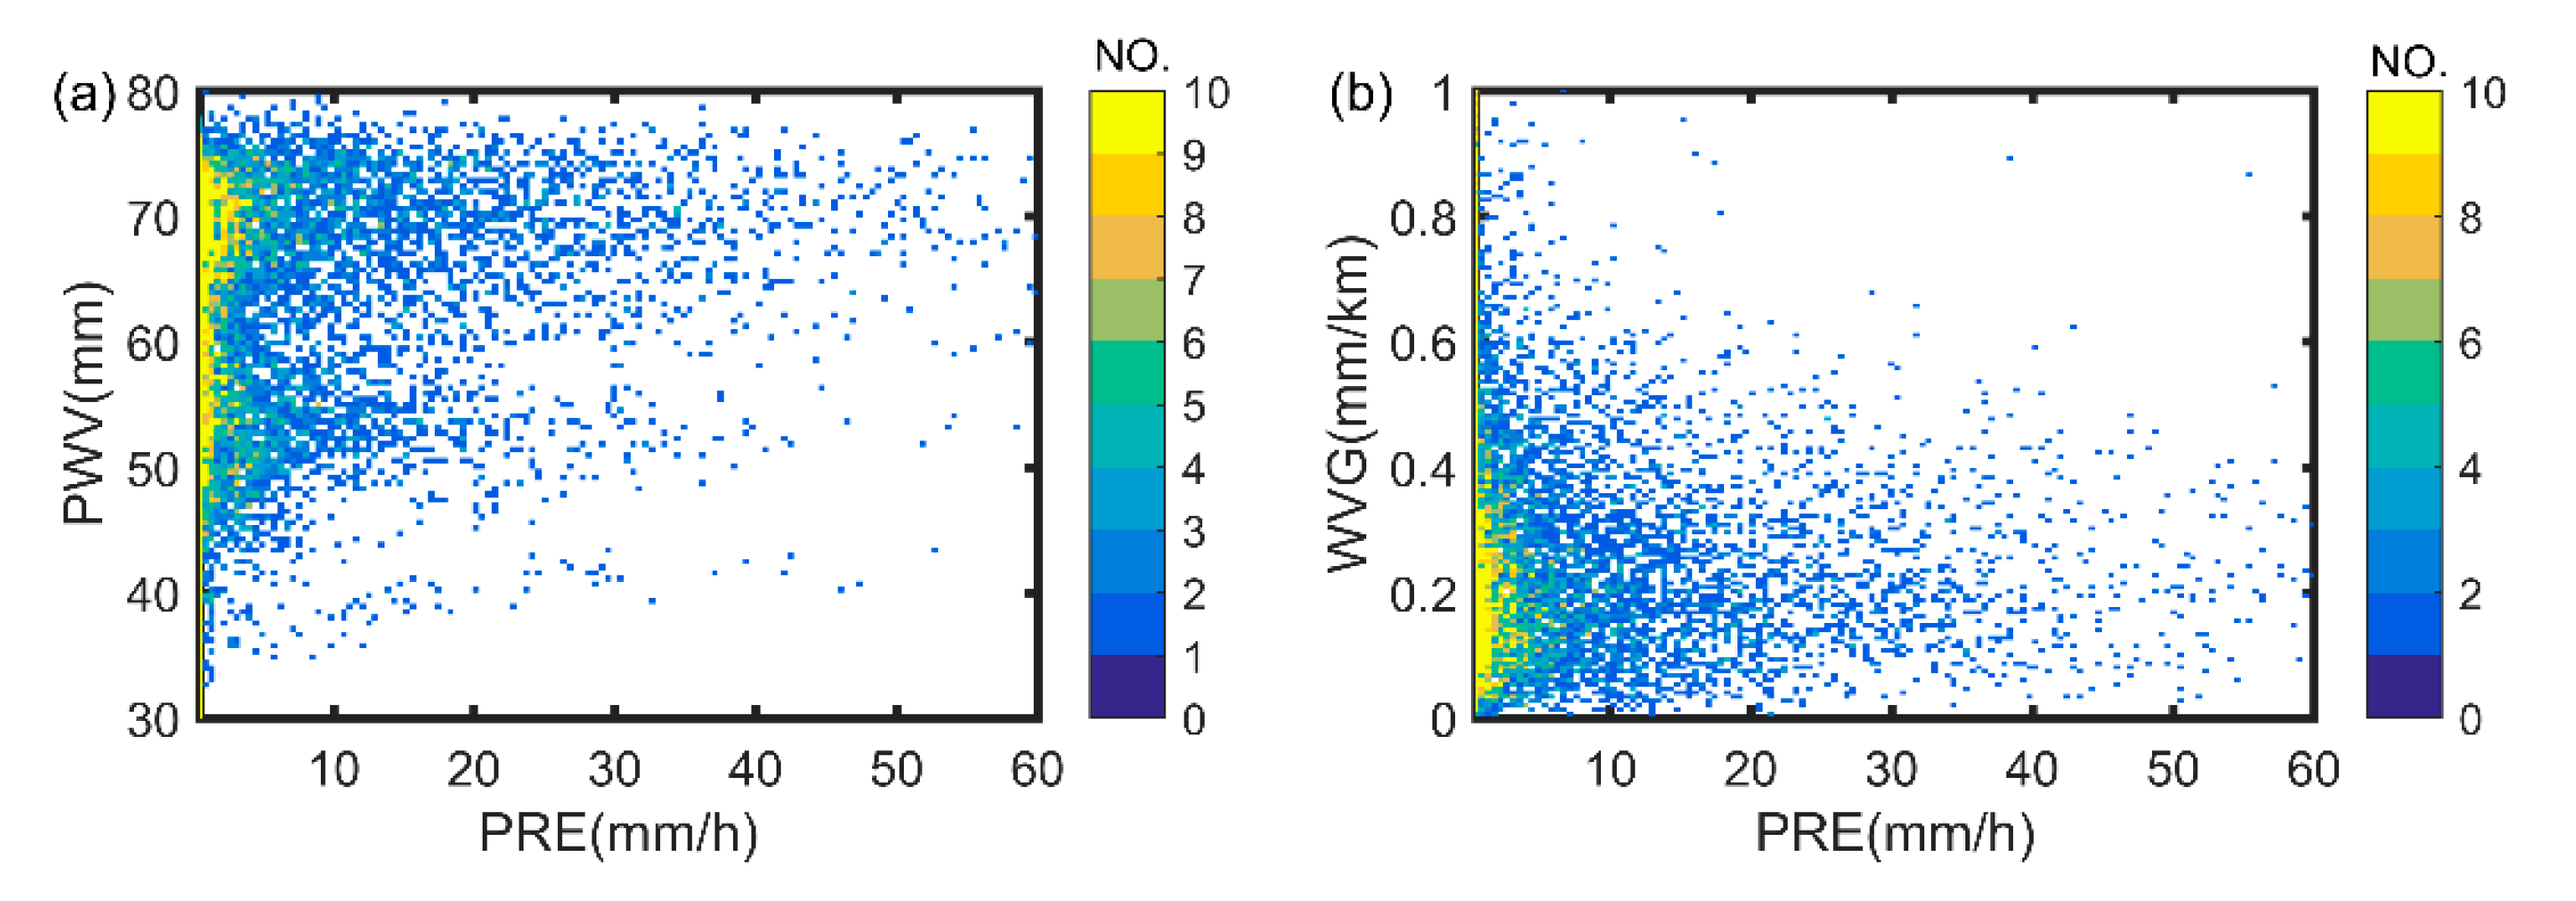
To further analyze the relationship between PWV, WVG, and PRE, GNSS and meteorological stations data were spatiotemporally matched during the study period. The relationship between precipitation (PRE > 0.1 mm/h) and PWV and WVG is illustrated in Figure 10. When the PWV is in the range of 53–58 mm and 63–75 mm, heavier precipitation occurs (PRE > 20 mm/h). Specifically, when PWV is approximately 70 mm, the maximum precipitation exceeds 50 mm/h. Regarding water vapor gradients, heavy precipitation tends to occur when the WVG is in the 0.1–0.4 mm/km range. In contrast, while the value is larger (WVG > 0.6 mm/km), precipitation is small.
The above time series analysis conclusively indicates that in periods of increasing PWV (PWV > 60 mm) and concurrent plummeting of the WVG (down to 0.1–0.4 mm/km), heavy or persistent precipitation may occur. Good correspondence with the radial velocity and reflectance factors observed by cloud radar can be noted. Additionally, the movement direction of the process can be identified based on the water vapor gradient, offering key inputs for precipitation forecasts. Compared to Station 54421, Station 54511 exhibited a higher PWV, less WVG fluctuation, greater accumulated precipitation, and greater precipitation intensity. This may be attributed to Station 54511 being located in the east of the Taihang Mountain and south of the Yanshan Mountain. Water vapor accumulates in front of the mountain because of topographic dynamic lift, resulting in higher PWV.

5. Conclusions

This study proposes a method for retrieving the water vapor gradient from GNSS tropospheric parameters, which effectively represents the water vapor heterogeneity within a unit area of a station. A comparative analysis of GNSS PWV and the WVG was performed using ERA5 data. Taking the “23·7” North China rainstorm event as a case study, the relationships among GNSS PWV, WVG, and the spatial–temporal variations in reflectivity and precipitation were thoroughly examined.
The PWV retrieval from GNSS showed good consistency with the PWV calculated by ERA5, with R as 0.964 and RMSE as 3.2 mm. The R between GNSS and ERA5 WVG was 0.417. A stronger correlation between GNSS and ERA5 WVG was observed under larger gradient conditions. During this rainstorm event, substantial water vapor was transported from south to north. The values of W V G N S were mostly greater than W V G E W , and W V G N S also showed a higher correlation with ERA5 compared to W V G E W .
The spatial change analysis indicated a PWV spike (40–65 mm) before large-scale precipitation. Pronounced WVGs were observed at the upper boundary of the precipitation system, with gradient vectors oriented toward its interior. When precipitation occurred, PWV remained high (70–80 mm). The WVG was smaller inside the precipitation system and larger at the border. Precipitation occurred primarily in the convergence area where the water vapor gradients were larger. Following the passage of the precipitation system, stations with larger WVGs were usually at the lower boundary of the system, with gradient vectors similar to the system’s movement direction.
For the temporal analysis, compared to the mountain station (Station 54421), the plain station (Station 54511) exhibited a higher PWV, less fluctuation in the WVG, greater accumulated precipitation, and greater precipitation intensity. These differences may be related to terrain conditions. Additionally, the process was segmented according to the direction change in the water vapor gradient, which can help identify the influence of different convective cells on the station. When PWV was high (>60 mm) and the WVG was plummeting (down to 0.1–0.4 mm/km), heavy or persistent precipitation was likely to occur. These conditions corresponded well with cloud radar echoes that reached the surface and increasing radial velocity.
In this study, PWV and the WVG were applied to the analysis of extreme rainstorm events, and good results were obtained. The variations in PWV and WVG values, as well as the direction of the WVG, can be used as indicators for identifying weather change. Further work will extend the application of the water vapor gradient to unstable weather phenomena, such as typhoon cyclone tracks, air mass fronts, atmospheric river boundaries, etc. Furthermore, it will consider the influence of hydrostatic gradient delay and terrain differences on WVG to improve the accuracy of GNSS-based retrieval.

Author Contributions

Conceptualization, Y.C. and H.S.; methodology, Y.W.; software, H.S. and Y.W.; formal analysis, Y.W., H.L. and L.Z.; investigation, Y.W. and Y.C.; resources, H.L. and Y.C.; wiring—original draft preparation, Y.W.; writing—review and editing, Y.C.; visualization, Z.M. and L.Z.; supervision, H.S. and Y.C.; project administration, Y.C.; funding acquisition, H.S. and Y.C. All authors have read and agreed to the published version of the manuscript.

Funding

The research presented in this paper is a contribution to projects supported by the National Natural Science Foundation of China (U2442214, 42174027) and Observational Experiment Project of Meteorological Observation (GCSYJH24-21, BEIGAWEX2023to2028).

Data Availability Statement

The GNSS observations and radar and precipitation data used in this study are accessed from the China Meteorological Administration (CMA) at https://data.cma.cn/ (accessed on 15 September 2025). The reanalysis data, ERA5, are released by ECMWF at https://cds.climate.copernicus.eu/ (accessed on 15 September 2025). ERA5 gradient values are obtained from GMET calculation, https://gmet.users.sgg.whu.edu.cn (accessed on 15 September 2025).

Acknowledgments

We acknowledge CMA for providing GNSS, radar, and precipitation data; ECMWF for providing ERA5 data; and Wuhan University for providing the GMET tool.

Conflicts of Interest

The authors declare no conflicts of interest.

References

  1. Yan, Z.; Wang, Z.; Peng, M. Impacts of climate trends on the heavy precipitation event associated with Typhoon Doksuri in Northern China. Atmospheric Res. 2025, 314, 107816. [Google Scholar] [CrossRef]
  2. Chen, S.; Kuo, Y.; Wang, W.; Tao, Z.; Cui, B. A Modeling Case Study of Heavy Rainstorms along the Mei-Yu Front. Mon. Weather. Rev. 1998, 126, 2330–2351. [Google Scholar] [CrossRef]
  3. Duan, J.; Bevis, M.; Fang, P.; Bock, Y.; Chiswell, S.; Businger, S.; Rocken, C.; Solheim, F.; van Hove, T.; Ware, R.; et al. Gps Meteorology: Direct Estimation of the Absolute Value of Precipitable Water. J. Appl. Meteorol. 1996, 35, 830–838. [Google Scholar] [CrossRef]
  4. Brettle, M.; Galvin, J. Back to Basics: Radiosondes: Part 1–The Instrument. Weather 2003, 58, 336–341. [Google Scholar] [CrossRef]
  5. Kaufman, Y.; Gao, B. Remote Sensing of Water Vapor in the near Ir from Eos/Modis. IEEE Trans Geosci. Remote Sens. 1992, 30, 871–884. [Google Scholar] [CrossRef]
  6. Zhou, L.; Fan, L.; Zhang, W.; Shi, C. Long-term correlation analysis between monthly precipitable water vapor and precipitation using GPS data over China. Adv. Space Res. 2022, 70, 56–69. [Google Scholar] [CrossRef]
  7. Bevis, M.; Businger, S.; Herring, T.; Rocken, C.; Anthes, R.; Ware, R. Gps Meteorology: Remote Sensing of Atmospheric Water Vapor Using the Global Positioning System. J. Geophys. Res. Atmos. 1992, 97, 15787–15801. [Google Scholar] [CrossRef]
  8. Rocken, C.; Hove, T.; Johnson, J.; Solheim, F.; Ware, R.; Bevis, M.; Chiswell, S.; Businger, S. Gps/Storm—Gps Sensing of Atmospheric Water Vapor for Meteorology. J. Atmos. Ocean. Technol. 1995, 12, 468–478. [Google Scholar] [CrossRef]
  9. Seidel, D.; Berger, F.; Diamond, H.; Dykema, J.; Goodrich, D.; Immler, F.; Murray, W.; Peterson, T.; Sisterson, D.; Sommer, M.; et al. Reference Upper-Air Observations for Climate: Rationale, Progress, and Plans. Bull. Am. Meteorol. Soc. 2009, 90, 361–369. [Google Scholar] [CrossRef]
  10. Sosa, C. Evaluating Forecast Skills of Moisture from Convective-Permitting Wrf-Arw Model During 2017 North American Monsoon Season. Atmosphere 2019, 10, 694. [Google Scholar]
  11. Eriksson, D.; MacMillan, D.; Gipson, J. Tropospheric Delay Ray Tracing Applied in Vlbi Analysis. J. Geophys. Res. Solid Earth 2014, 119, 9156–9170. [Google Scholar] [CrossRef]
  12. Shoji, Y. Retrieval of Water Vapor Inhomogeneity Using the Japanese Nationwide Gps Array and Its Potential for Prediction of Convective Precipitation. J. Meteorol. Soc. Jpn. 2013, 91, 43–62. [Google Scholar] [CrossRef]
  13. Tu, M.; Zhang, W.; Bai, J.; Wu, D.; Liang, H.; Lou, Y. Spatio-Temporal Variations of Precipitable Water Vapor and Horizontal Tropospheric Gradients from Gps During Typhoon Lekima. Remote Sens. 2021, 13, 4082. [Google Scholar] [CrossRef]
  14. Nykiel, G.; Figurski, M.; Bałdysz, Z. Analysis of Gnss Sensed Precipitable Water Vapour and Tropospheric Gradients During the Derecho Event in Poland of 11th August 2017. J. Atmos. Solar-Terr. Phys. 2019, 193, 105082. [Google Scholar] [CrossRef]
  15. Zus, F.; Douša, J.; Kačmařík, M.; Václavovic, P.; Dick, G.; Wickert, J. Estimating the Impact of Global Navigation Satellite System Horizontal Delay Gradients in Variational Data Assimilation. Remote Sens. 2018, 11, 41. [Google Scholar] [CrossRef]
  16. Zhang, F.; Yang, S.; Hu, Y.; Gong, Y.; Qing, H. Water vapor characteristics of the July 2023 severe torrential rain in North China. Meteorol. Mon. 2023, 49, 1421–1434. (In Chinese) [Google Scholar]
  17. Chen, T.; Chen, Y.; Fang, C.; Dong, L.; Fu, J.; Li, X.; Chen, S.; Shi, Y.; Shen, Y.; Xu, X.; et al. Fine characteristics of the July 2023 extreme rainfall in North China and associated synoptic weather patterns. Acta Meteorol. Sin. 2024, 82, 600–614. (In Chinese) [Google Scholar]
  18. Zhao, D.; Xu, H.; Li, Y.; Yu, Y.; Duan, Y.; Xu, X.; Chen, L. Locally Opposite Responses of the 2023 Beijing–Tianjin–Hebei Extreme Rainfall Event to Global Anthropogenic Warming. Npj Clim. Atmos. Sci. 2024, 7, 38. [Google Scholar] [CrossRef]
  19. Shi, C.; Guo, S.; Fan, L.; Gu, S.; Fang, X.; Zhou, L.; Zhang, T.; Li, Z.; Li, M.; Li, W.; et al. GSTAR: An innovative software platform for processing space geodetic data at the observation level. Satell. Navig. 2023, 4, 18. [Google Scholar] [CrossRef]
  20. Li, X.; Huang, J.; Li, X.; Yuan, Y.; Zhang, K.; Zheng, H.; Zhang, W. GREAT: A scientific software platform for satellite geodesy and multi-source fusion navigation. Adv. Space Res. 2024, 74, 1751–1769. [Google Scholar] [CrossRef]
  21. Zhang, K.; Li, H.; Wang, X.; Zhu, D.; He, Q.; Zhang, W. Recent progresses and future prospectives of ground-based GNSS water vapor sounding. Acta Geod. Et Cartogr. Sin. 2022, 51, 1172–1191. [Google Scholar]
  22. Herring, T.; King, R.; Floyd, M.; McClusky, S. Introduction to Gamit/Globk; Department of Earth, Atmospheric, and Planetary Sciences Massachusetts Institute of Technology: Cambridge, MA, USA, 2018; Available online: https://www-gpsg.mit.edu/~simon/gtgk/docs.htm (accessed on 15 September 2025).
  23. Zhang, W.; Lou, Y.; Zhou, Y.; Liu, M.; Zhang, Z.; Ou, S.; Liu, J. GNSS meteorological ensemble tools (GMET): A free-access online service for GNSS meteorological applications. GPS Solut. 2024, 28, 202. [Google Scholar] [CrossRef]
  24. Zhou, Y.; Lou, Y.; Zhang, W.; Kuang, C.; Liu, W.; Bai, J. Improved performance of ERA5 in global tropospheric delay retrieval. J. Geod. 2020, 94, 103. [Google Scholar] [CrossRef]
  25. Pan, Y.; Gu, J.; Yu, J.; Shen, Y.; Shi, C.; Zhou, Z. Test of merging methods for multi-source observed precipitation products at high resolution over China. Acta. Meteorol. Sin. 2018, 76, 755–766. (In Chinese) [Google Scholar]
  26. Min, C.; Chen, S.; Gourley, J.; Chen, H.; Huang, C. Coverage of China New Generation Weather Radar Network. Adv. Meteorol. 2019, 2019, 5789358. [Google Scholar] [CrossRef]
  27. Ye, B.; Lee, G. Vertical Structure of Ice Clouds and Vertical Air Motion from Vertically Pointing Cloud Radar Measurements. Remote Sens. 2021, 13, 4349. [Google Scholar] [CrossRef]
  28. Boehm, J.; Werl, B.; Schuh, H. Troposphere Mapping Functions for Gps and Very Long Baseline Interferometry from European Centre for Medium-Range Weather Forecasts Operational Analysis Data. J. Geophys. Res. Solid Earth 2006, 111, B02406. [Google Scholar] [CrossRef]
  29. Chen, G.; Herring, T. Effects of Atmospheric Azimuthal Asymmetry on the Analysis of Space Geodetic Data. J. Geophys. Res. Solid Earth 1997, 102, 20489–20502. [Google Scholar] [CrossRef]
  30. Graffigna, V.; Hernández-Pajares, M.; Gende, M.; Azpilicueta, F.; Antico, P. Interpretation of the Tropospheric Gradients Estimated with GPS During Hurricane Harvey. Earth Space Sci. 2019, 6, 1348–1365. [Google Scholar] [CrossRef]
  31. Saastamoinen, J. Atmospheric correction for the troposphere and stratosphere in radio ranging of satellites. Use Artif. Satell. Geod. 1972, 15, 247–251. [Google Scholar]
  32. Bar-Sever, Y.; Kroger, P.; Borjesson, J. Estimating Horizontal Gradients of Tropospheric Path Delay with a Single Gps Receiver. J. Geophys. Res. Solid Earth 1998, 103, 5019–5035. [Google Scholar] [CrossRef]
  33. Herring, T.; King, R.; Floyd, M.; McClusky, S. GAMITR Reference Manual; Department of Earth, Atmospheric, and Planetary Sciences Massachusetts Institute of Technology: Cambridge, MA, USA, 2018. [Google Scholar]
  34. Liu, Y.; Xu, T.; Liu, J. Characteristics of the seasonal variation of the global tropopause revealed by COSMIC/GPS data. Adv. Space Res. 2014, 54, 2274–2285. [Google Scholar] [CrossRef]
  35. Zhang, W.; Zhang, H.; Liang, H.; Lou, Y.; Cai, Y.; Cao, Y.; Zhou, Y.; Liu, W. On the suitability of ERA5 in hourly GPS precipitable water vapor retrieval over China. J. Geod. 2019, 93, 1897–1909. [Google Scholar] [CrossRef]
  36. Li, X.; Zus, F.; Lu, C.; Ning, T.; Dick, G.; Ge, M.; Wickert, J.; Schuh, H. Retrieving high-resolution tropospheric gradients from multiconstellation GNSS observations. Geophys. Res. Lett. 2015, 42, 4173–4181. [Google Scholar] [CrossRef]
  37. Kacmarik, M.; Douša, J.; Zus, F.; Vaclavovic, P.; Balidakis, K.; Dick, G.; Wickert, J. Sensitivity of GNSS tropospheric gradients to processing options. Ann. Geophys. 2019, 37, 429–446. [Google Scholar] [CrossRef]
  38. Shi, C.; Zhou, L.; Fan, L.; Zhang, W.; Cao, Y.; Wang, C.; Xiao, F.; Lü, G.; Liang, H. Analysis of “21.7” Extreme rainstorm process in Henan Province using BeiDou/GNSS observation. Chin. J. Geophys. 2022, 65, 186–196. (In Chinese) [Google Scholar]
  39. Zheng, F.; Lou, Y.; Gu, S.; Gong, X.; Shi, C. Modeling Tropospheric Wet Delays with National Gnss Reference Network in China for Beidou Precise Point Positioning. J. Geod. 2018, 92, 545–560. [Google Scholar] [CrossRef]
  40. Zhou, Y.; Cai, M.; Tan, C.; Mao, J.; Hu, Z. Quantifying the Cloud Water Resource: Basic Concepts and Characteristics. J. Meteorol. Res. 2020, 34, 1242. [Google Scholar] [CrossRef]
  41. Chen, D.; Pan, C.; Qiao, S.; Zhi, R.; Tang, S.; Yang, J.; Feng, G.; Dong, W. Evolution and Prediction of the Extreme Rainstorm Event in July 2021 in Henan Province, China. Atmos. Sci. Lett. 2023, 24, e1156. [Google Scholar] [CrossRef]
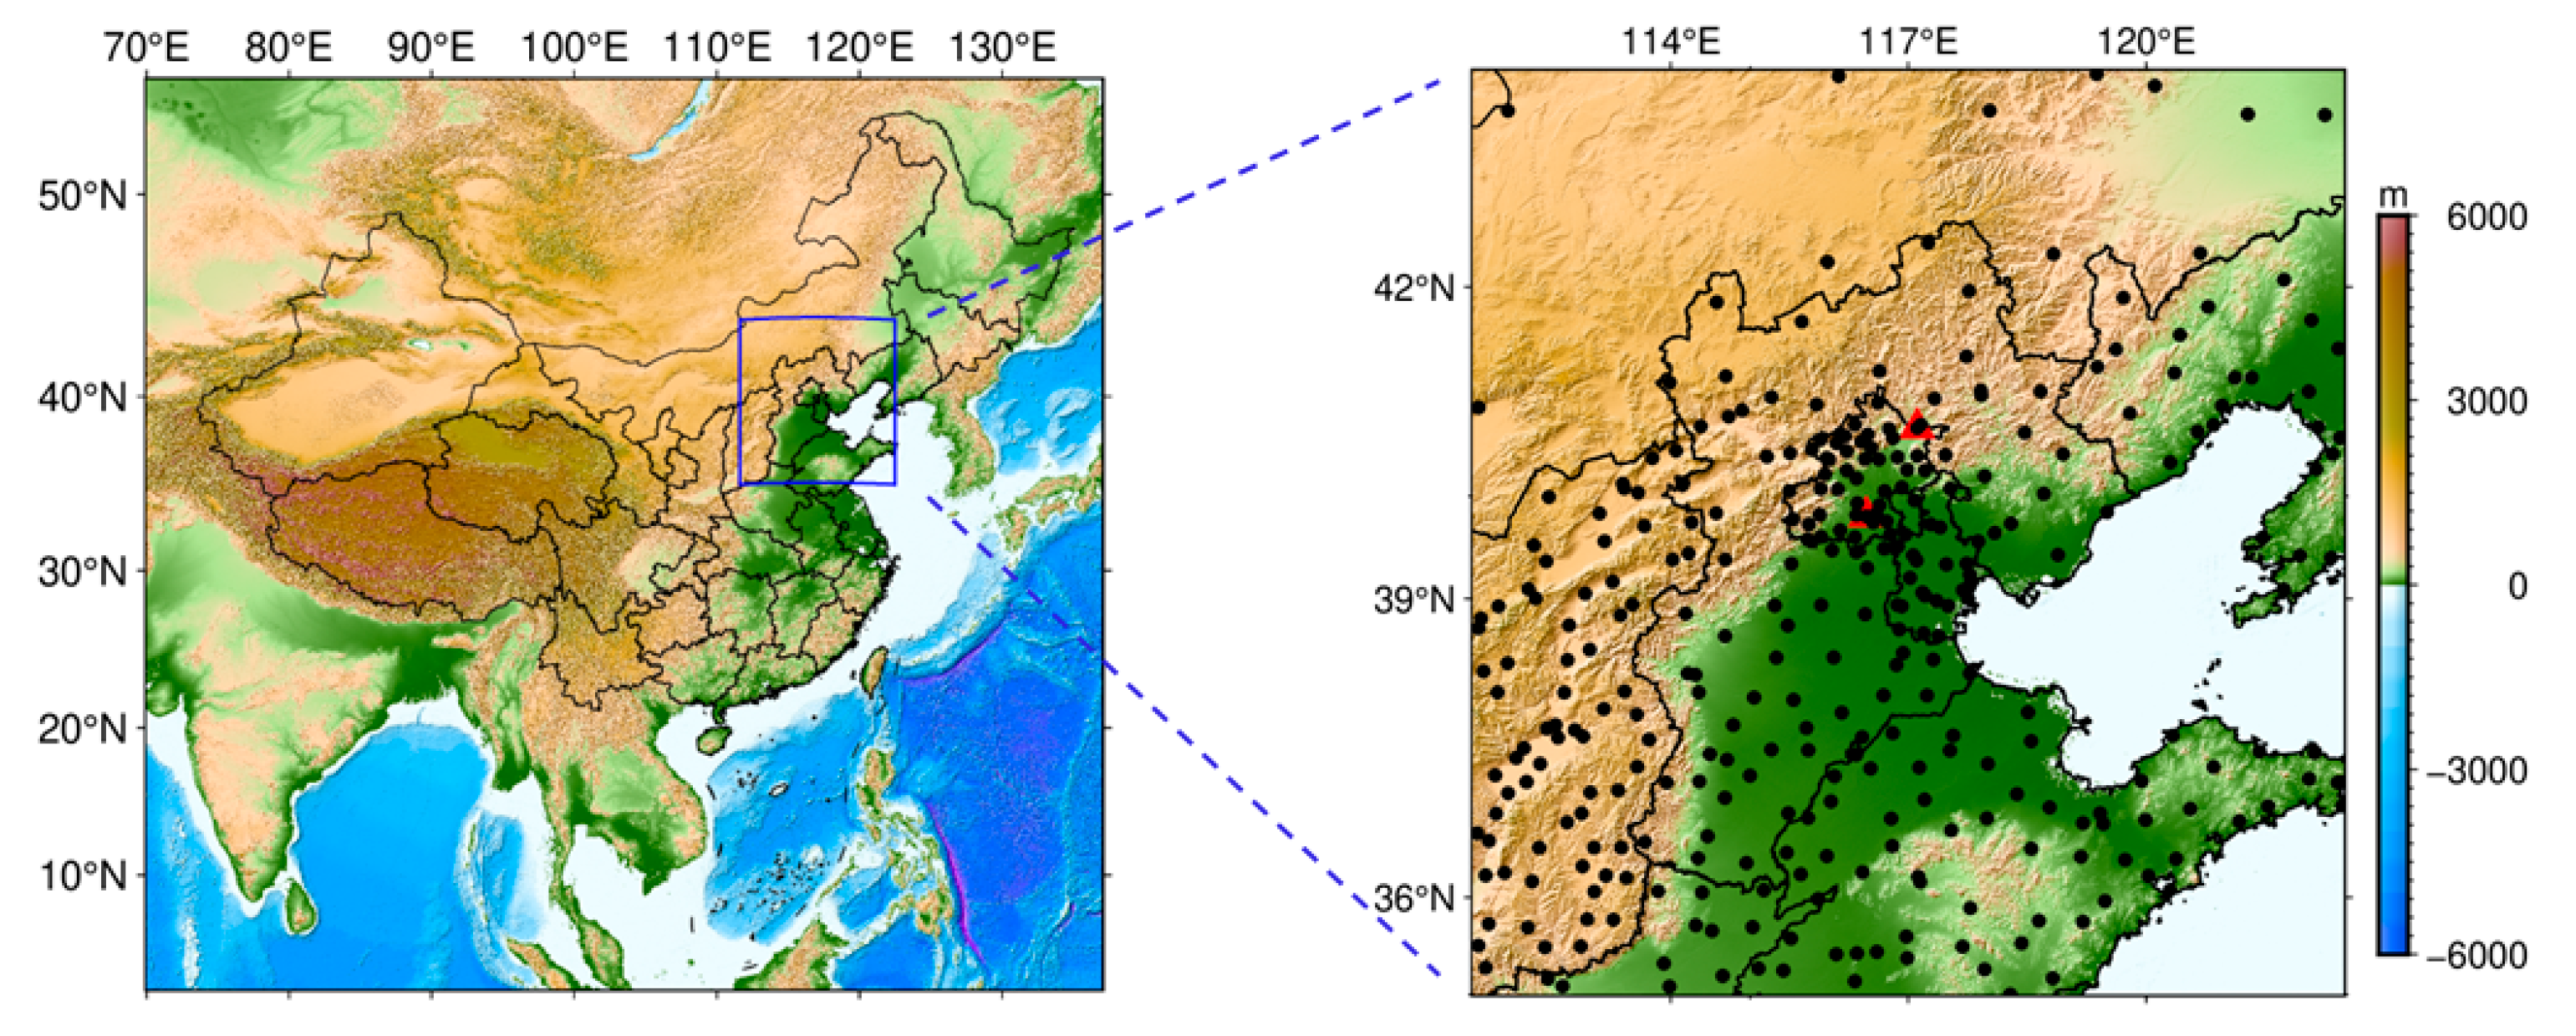
Figure 1. Distribution of GNSS stations (black dots) and cloud radar stations (red triangles). The background color represents elevation.
Remotesensing 17 03247 g001
Figure 2. Spatial distribution of cumulative precipitation (a), duration of precipitation (b) observed by automatic meteorological stations in North China from 00 UTC on 29 July to 00 UTC on 2 August.
Remotesensing 17 03247 g002
Figure 3. The daily mean integrated water vapor transport (colored and black arrows) and 500 hPa geopotential height (brown contour lines) on 29 July (a), 30 July (b), 31 July (c), and 1 August (d). Blue line represents the North China region.
Remotesensing 17 03247 g003
Figure 4. Schematic diagram of GNSS water vapor gradient algorithm (east–west direction). Yellow indicates isotropy, green indicates anisotropy, and blue is the zenith tropospheric delay ( Z T D ) mapped from slant total delay (STD) to the zenith direction. ε is the elevation angle and M i s o is the isotropic mapping function. Parentheses indicate distances, where H G E W represents the projection distance of east–west water vapor gradient in the horizontal direction, H t r o p represents the tropopause height, and D l e v e l represents the projection distance of the GNSS site in the horizontal direction.
Remotesensing 17 03247 g004
Figure 5. Two-dimensional histogram for GNSS PWV (a), WVG (b), W V G N S (c), and W V G E W (d) versus ERA5 data. The red line represents the 1:1 reference line. NO. represents the number of observations.
Remotesensing 17 03247 g005
Figure 6. Time series of the regional average of PWV (a) and WVG (b) derived from GNSS and ERA5 from 28 July to 2 August in North China.
Remotesensing 17 03247 g006
Figure 7. Spatial distribution of PWV at 00 UTC (a,d,g,j,m,p), combined reflectance at 00 UTC (b,e,h,k,n,q), cumulative precipitation at 00,01,02 UTC (c,f,i,l,o,r), and WVG at 00 UTC (black arrows) on 28 July (ac), 29 July (df), 30 July (gi), 31 July (jl), 1 August (mo), and 2 August (pr).
Remotesensing 17 03247 g007
Figure 8. Time series of radial velocity (a), reflectance factor (b), PRE, PWV, and WVG (c) at Station 54511 from 00 UTC on 28 July to 00 UTC on 2 August.
Remotesensing 17 03247 g008
Figure 9. Time series of radial velocity (a); reflectance factor (b); PRE, PWV, and WVG (c) at Station 54421 from 00 UTC on 28 July to 00 UTC on 2 August.
Remotesensing 17 03247 g009
Figure 10. (a) Two-dimensional histograms for PWV versus PRE; (b) two-dimensional histogram for WVG versus PRE. NO. represents the number of observations.
Remotesensing 17 03247 g010
Table 1. Comparison of historical rainstorm processes in Beijing.
Rainstorm Event“96·8” Rainstorm“12·7” Rainstorm“16·7” Rainstorm“23·7” Rainstorm
The onset and cessation times3–5 August 199621–22 July 201219–21 July 201629 July–2 August 2023
Maximum cumulative rainfall (mm)231.3541.0453.7744.8
Maximum hourly rainfall (mm/h)45100.356.8111.8
Maximum duration of rainfall (h)44205581
The average rainfall in Beijing (mm)163.6170212.6276.5
Disclaimer/Publisher’s Note: The statements, opinions and data contained in all publications are solely those of the individual author(s) and contributor(s) and not of MDPI and/or the editor(s). MDPI and/or the editor(s) disclaim responsibility for any injury to people or property resulting from any ideas, methods, instructions or products referred to in the content.