3.2. Results of FVC Extraction Using Three Methods
A statistical analysis was conducted on the digital number (DN) values of the nine selected VIs, along with the newly developed GRCVI. The DN values are dimensionless digital reflectance values output from the UAV camera sensor. For each treatment plot, the average DN of all corresponding pixels was calculated and used for subsequent vegetation index computation. Classification thresholds for potato plants at Tuber formation stage, Tuber expansion stage, and Maturity stage were determined using the numerical intersection method, histogram bimodal method, and Otsu thresholding method, as shown in
Table 3,
Table 4 and
Table 5. To better illustrate the threshold extraction process using different VIs, this study presents the threshold results obtained by the numerical intersection method for three VIs: GRCVI, RGCI, and EXG across the three growth stages. The corresponding histogram curves for these stages were shown in
Figure 9.
As shown in
Table 3, the classification thresholds for all ten VIs across the three growth stages were determined using the numerical intersection method. Further analysis of the intersection curves revealed that the histogram distributions of plant and non-plant regions for five vegetation indices (GRVI, RGBVI, MGRVI, NGRVI, and NGBDI) exhibited considerable overlap. For clarity,
Figure 10 presented only the histogram of NGRVI as a representative example. Due to this high degree of overlap, the classification thresholds obtained for these five VIs, even when combined with the SVM method, were unable to effectively extract potato FVC. Therefore, this study proceeded to perform FVC extraction using the remaining five VIs.
The determined thresholds were further applied to extract overall FVC information for the experimental potato field across the three growth stages. FVC was calculated using Formula (5) [
36]. The FVC extraction results for the five VIs across the three potato growth stages, based on different thresholding methods, were presented in
Table 6.
In the equation, Nplant represents the total number of vegetation pixels, Nbackground represents the total number of non-vegetation pixels.
The vegetation and non-vegetation pixel counts obtained from the SVM classification were used as the ground truth values for FVC (23.41%, 45.98%, and 58.40% for the three growth stages). The accuracy of FVC estimates produced by the three methods was compared using these reference values, and the results were shown in
Figure 11.
According to the statistical results in
Figure 11, the GRCVI vegetation index constructed in this study demonstrated strong performance in FVC estimation across all three potato growth stages. Although the Otsu thresholding method achieved slightly higher accuracy than the numerical intersection method during the Tuber formation stage and Tuber expansion stage, its performance declined significantly at the maturity stage. In contrast, the numerical intersection method combined with the GRCVI consistently provided accurate FVC estimations throughout the entire growth cycle and maintained reliable performance even under the complex field conditions present at maturity stage. To further validate the accuracy of FVC results derived from the five selected VIs using the numerical intersection method, confusion matrix analysis was conducted for the three growth stages. The corresponding overall accuracies and Kappa coefficients were presented in
Table 7.
According to the results presented in
Table 7, the GRCVI proposed in this research exhibited robust discrimination capability for potato plants throughout all three growth phases. It delivered the highest overall accuracy and Kappa coefficient at both the tuber expansion and maturity stages. Specifically, the classification accuracy reached 99.78% (Kappa coefficient = 0.9957) during the tuber expansion stage and 99.56% (Kappa coefficient = 0.9884) during the maturity stage. Additionally, at the tuber formation stage, combining the GRCVI with the numerical intersection method produced the second-highest accuracy, achieving an overall classification accuracy of 98.99% and a Kappa coefficient of 0.9951.
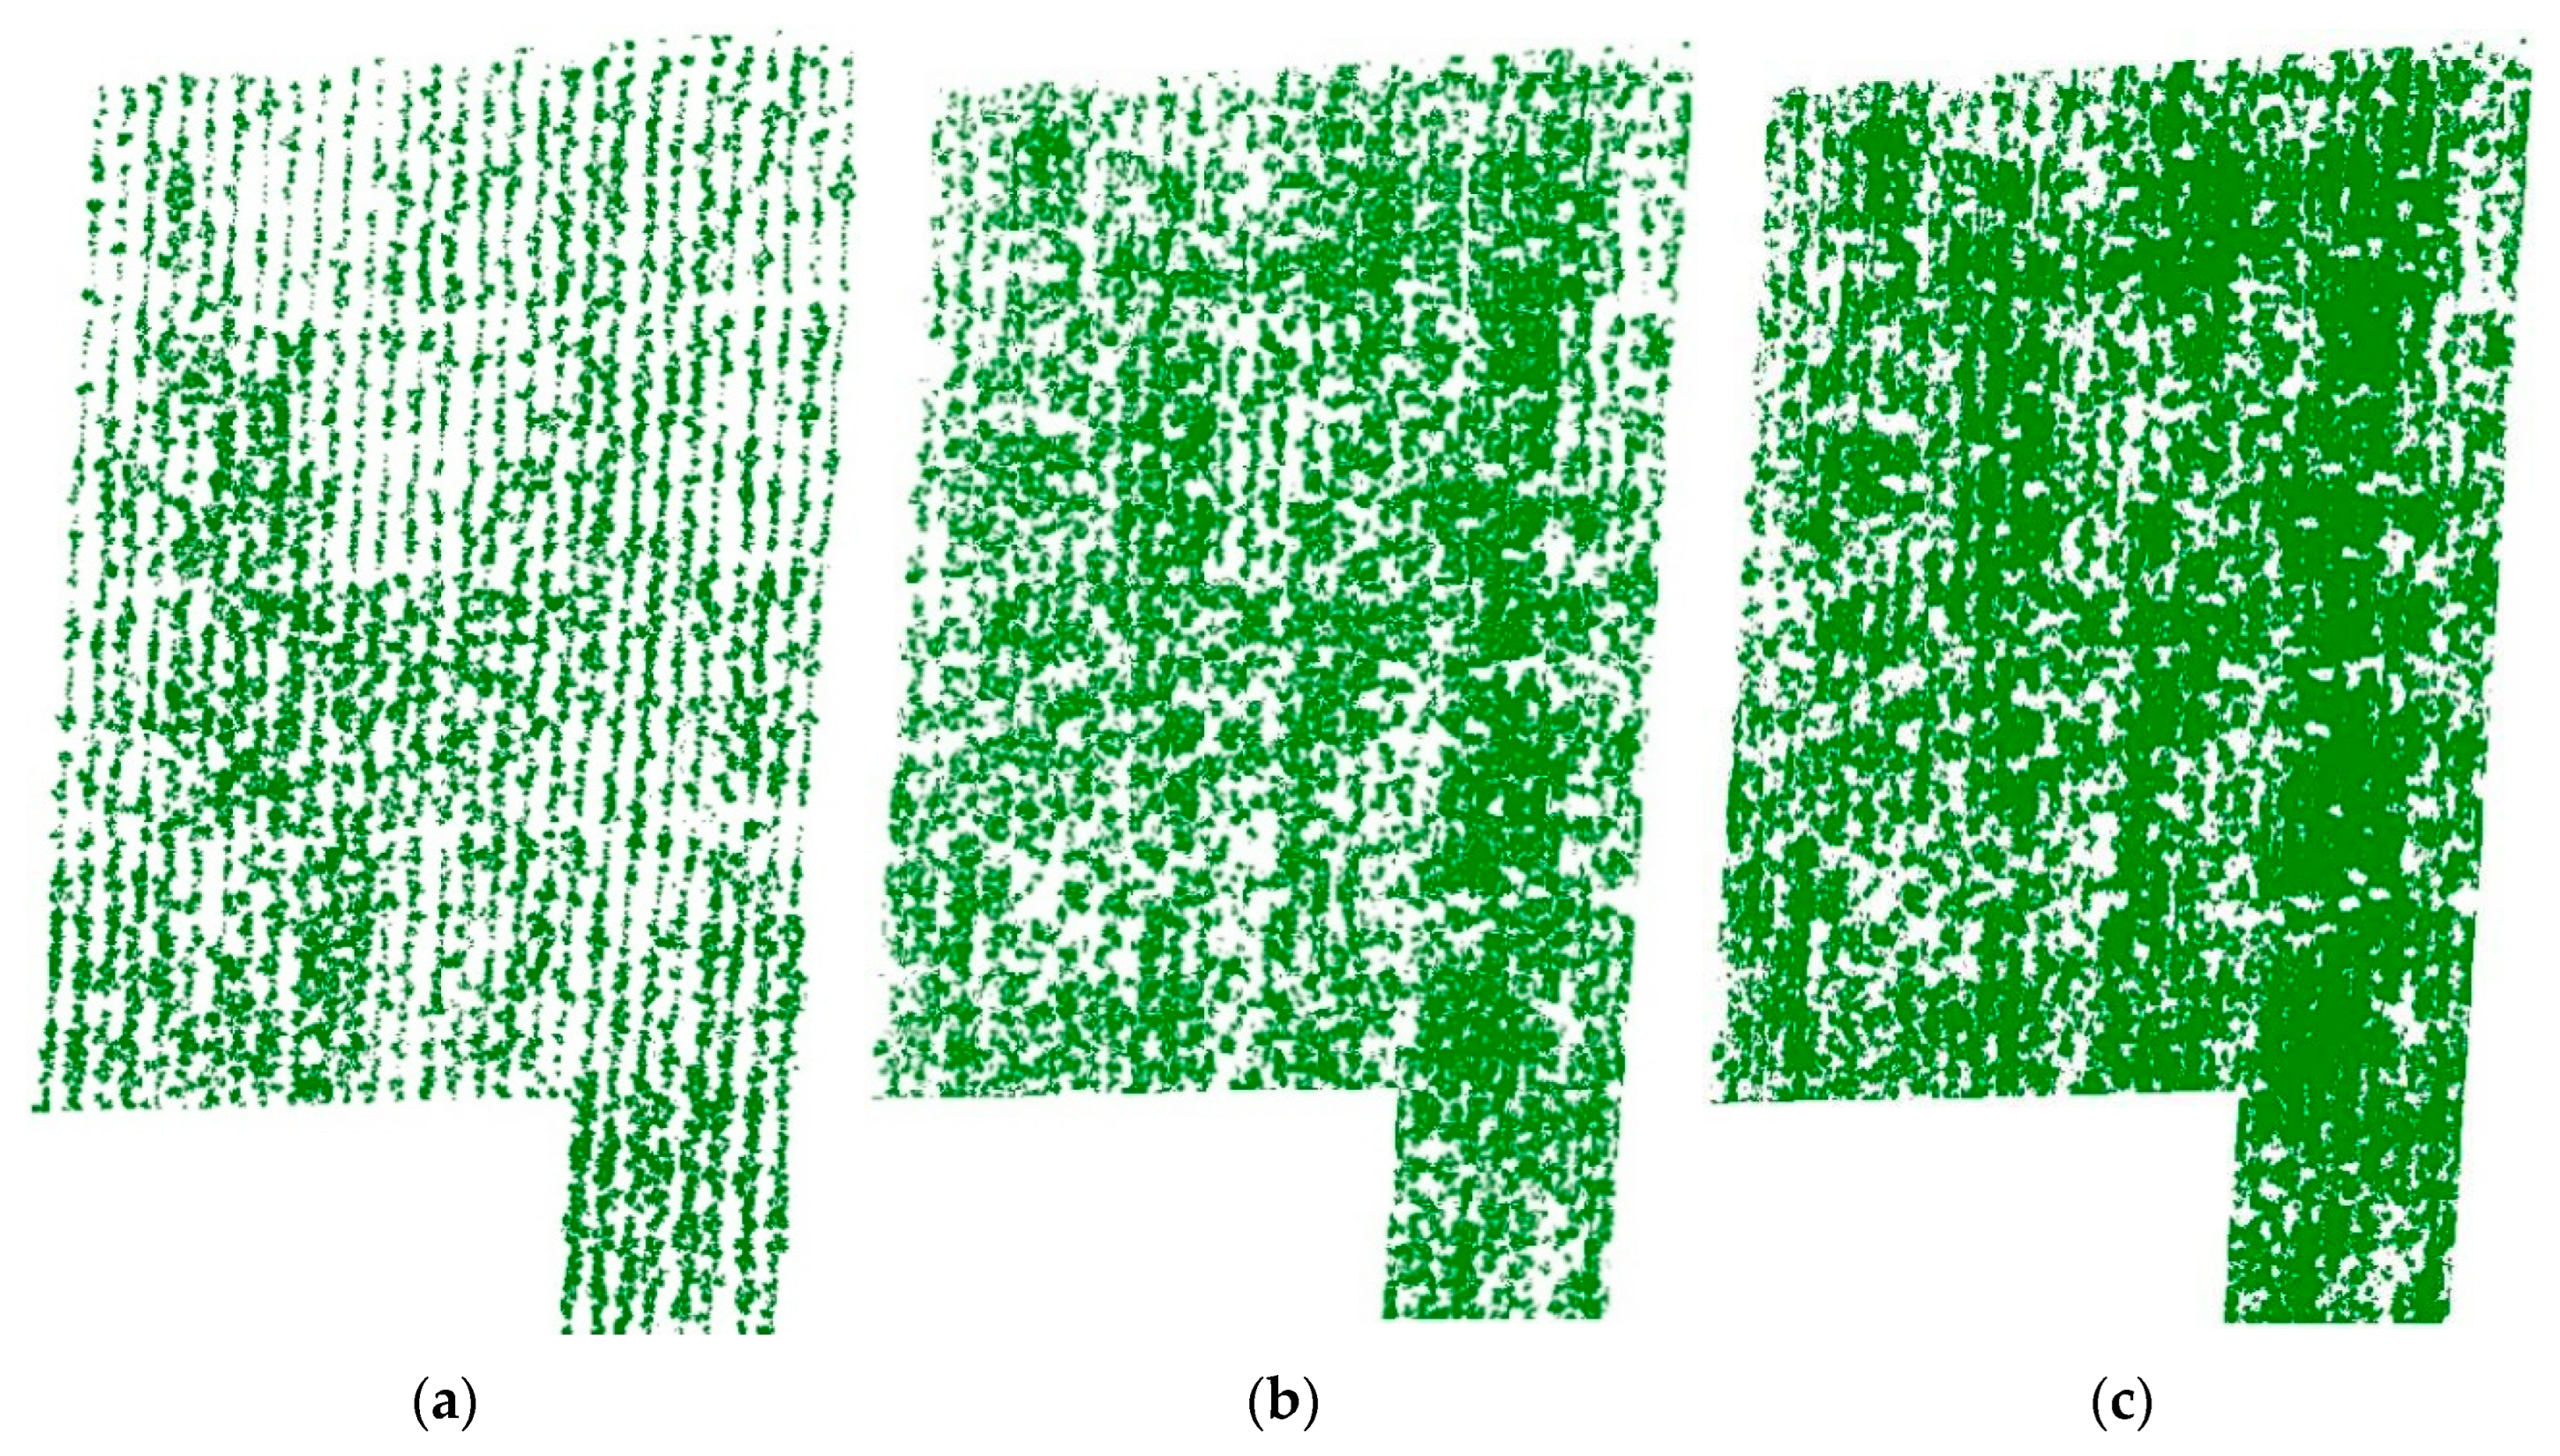
To ensure the stability and accuracy of FVC estimation, this study adopted the GRCVI in combination with the numerical intersection method based on SVM-supervised classification as the final approach for estimating potato FVC during the Tuber formation, Tuber expansion, and Maturity stages. The extracted FVC results were shown in
Figure 12.
3.3. Results of Plant Height Extraction Using the Improved SfM Method
In ENVI 5.3, the vegetation regions extracted from the FVC results were used as ROIs to create masks for segmenting the DSM images, allowing for the statistical analysis of potato plant height. The average heights extracted using the improved SfM method at the three growth stages were 19.65 cm, 37.23 cm, and 44.17 cm, respectively.
To further validate the performance of the improved SfM method, the estimated plant heights were compared with field-measured values. The estimation accuracy was assessed using the coefficient of determination (R
2) and the root mean square error (RMSE). The validation results were presented in
Figure 13.
As illustrated in
Figure 13, the improved SfM approach demonstrated strong accuracy in estimating potato plant height during the tuber formation stage, yielding an R
2 of 0.8470 and an RMSE of 1.8628 cm. In the tuber expansion stage, the estimation accuracy reached R
2 of 0.8252 and the RMSE of 1.8567 cm. At the maturity stage, the method achieved R
2 of 0.8554 and the RMSE of 2.2665 cm. These results indicate that the improved SfM method not only provides high overall estimation accuracy but also yields plant height estimates with low variability.
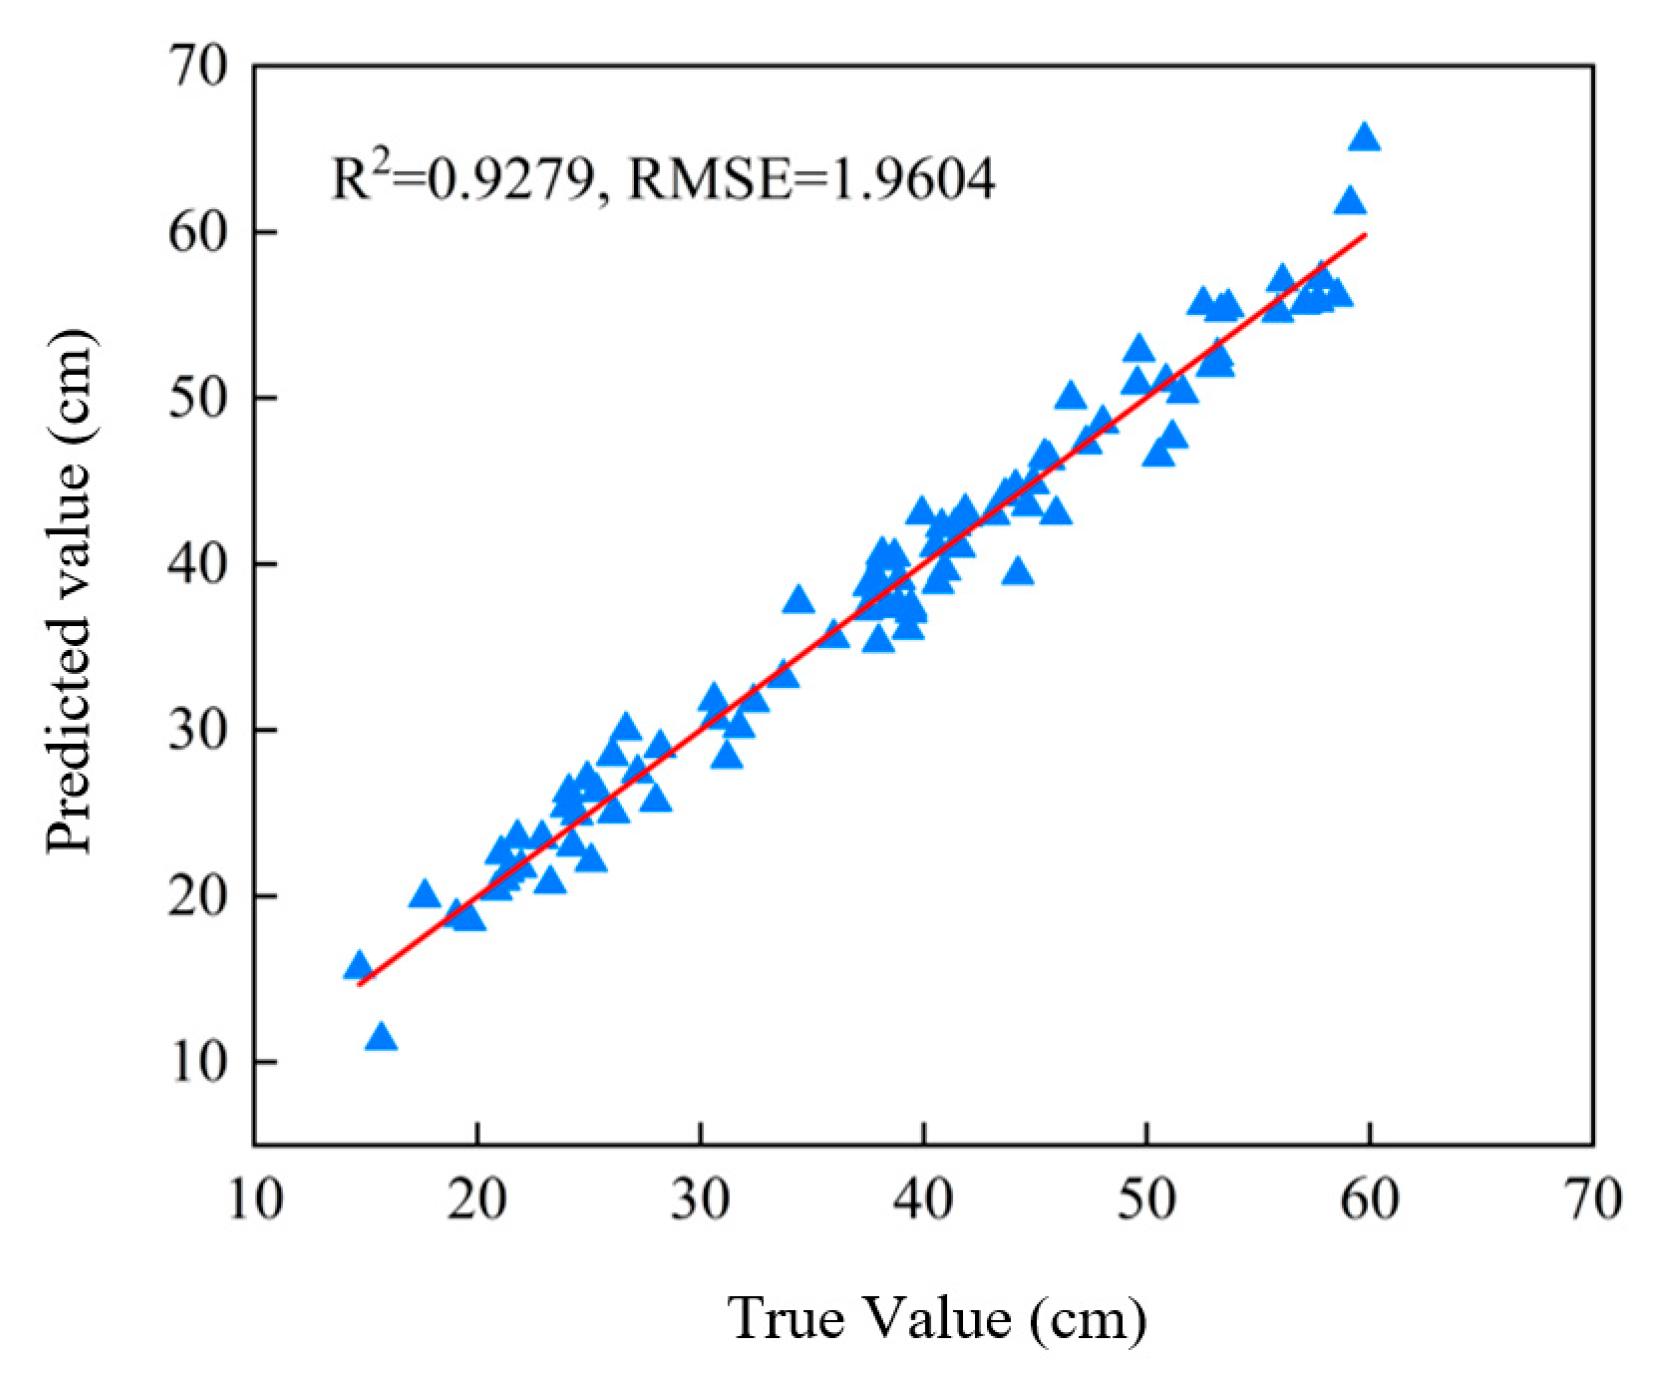
As shown in
Figure 14, analysis of the improved SfM method across the full growth period demonstrated excellent performance in potato plant height inversion, with the R
2 value of 0.9279 and the RMSE of 1.9604 cm. The accuracy validation results indicate that the improved SfM method also provides reliable estimation performance for monitoring the temporal dynamics of potato plant height throughout the entire growth cycle.
The improved SfM method developed in this study demonstrated strong environmental adaptability and stability, indicating its effectiveness and reliability in the dynamic monitoring of potato plant height.
3.5. Results of Potato AGB and Yield Prediction
In this study, a plant height–AGB prediction model was constructed using the Random Forest (RF) method based on the analysis of plant height and AGB.A dataset comprising 150 samples collected during the tuber expansion and maturity stages were utilized, with 105 samples randomly assigned for training and the remaining 45 used for model validation. To achieve optimal prediction performance, the number of decision trees in the RF model was set to 200 during training. The prediction results of the model were presented in
Figure 16.
As shown in
Figure 16, it is feasible to estimate AGB from plant height using the RF method based on the available data. However, the prediction performance of the biomass model constructed by RF varied significantly across different potato growth stages. Compared to models developed for individual growth stages, the model trained across the full growth period did not achieve satisfactory prediction accuracy. Although the inclusion of more sample data can help compensate for accuracy issues caused by plant lodging during the maturity stage, the high degree of variability in the prediction results limits the model’s applicability in practical scenarios.
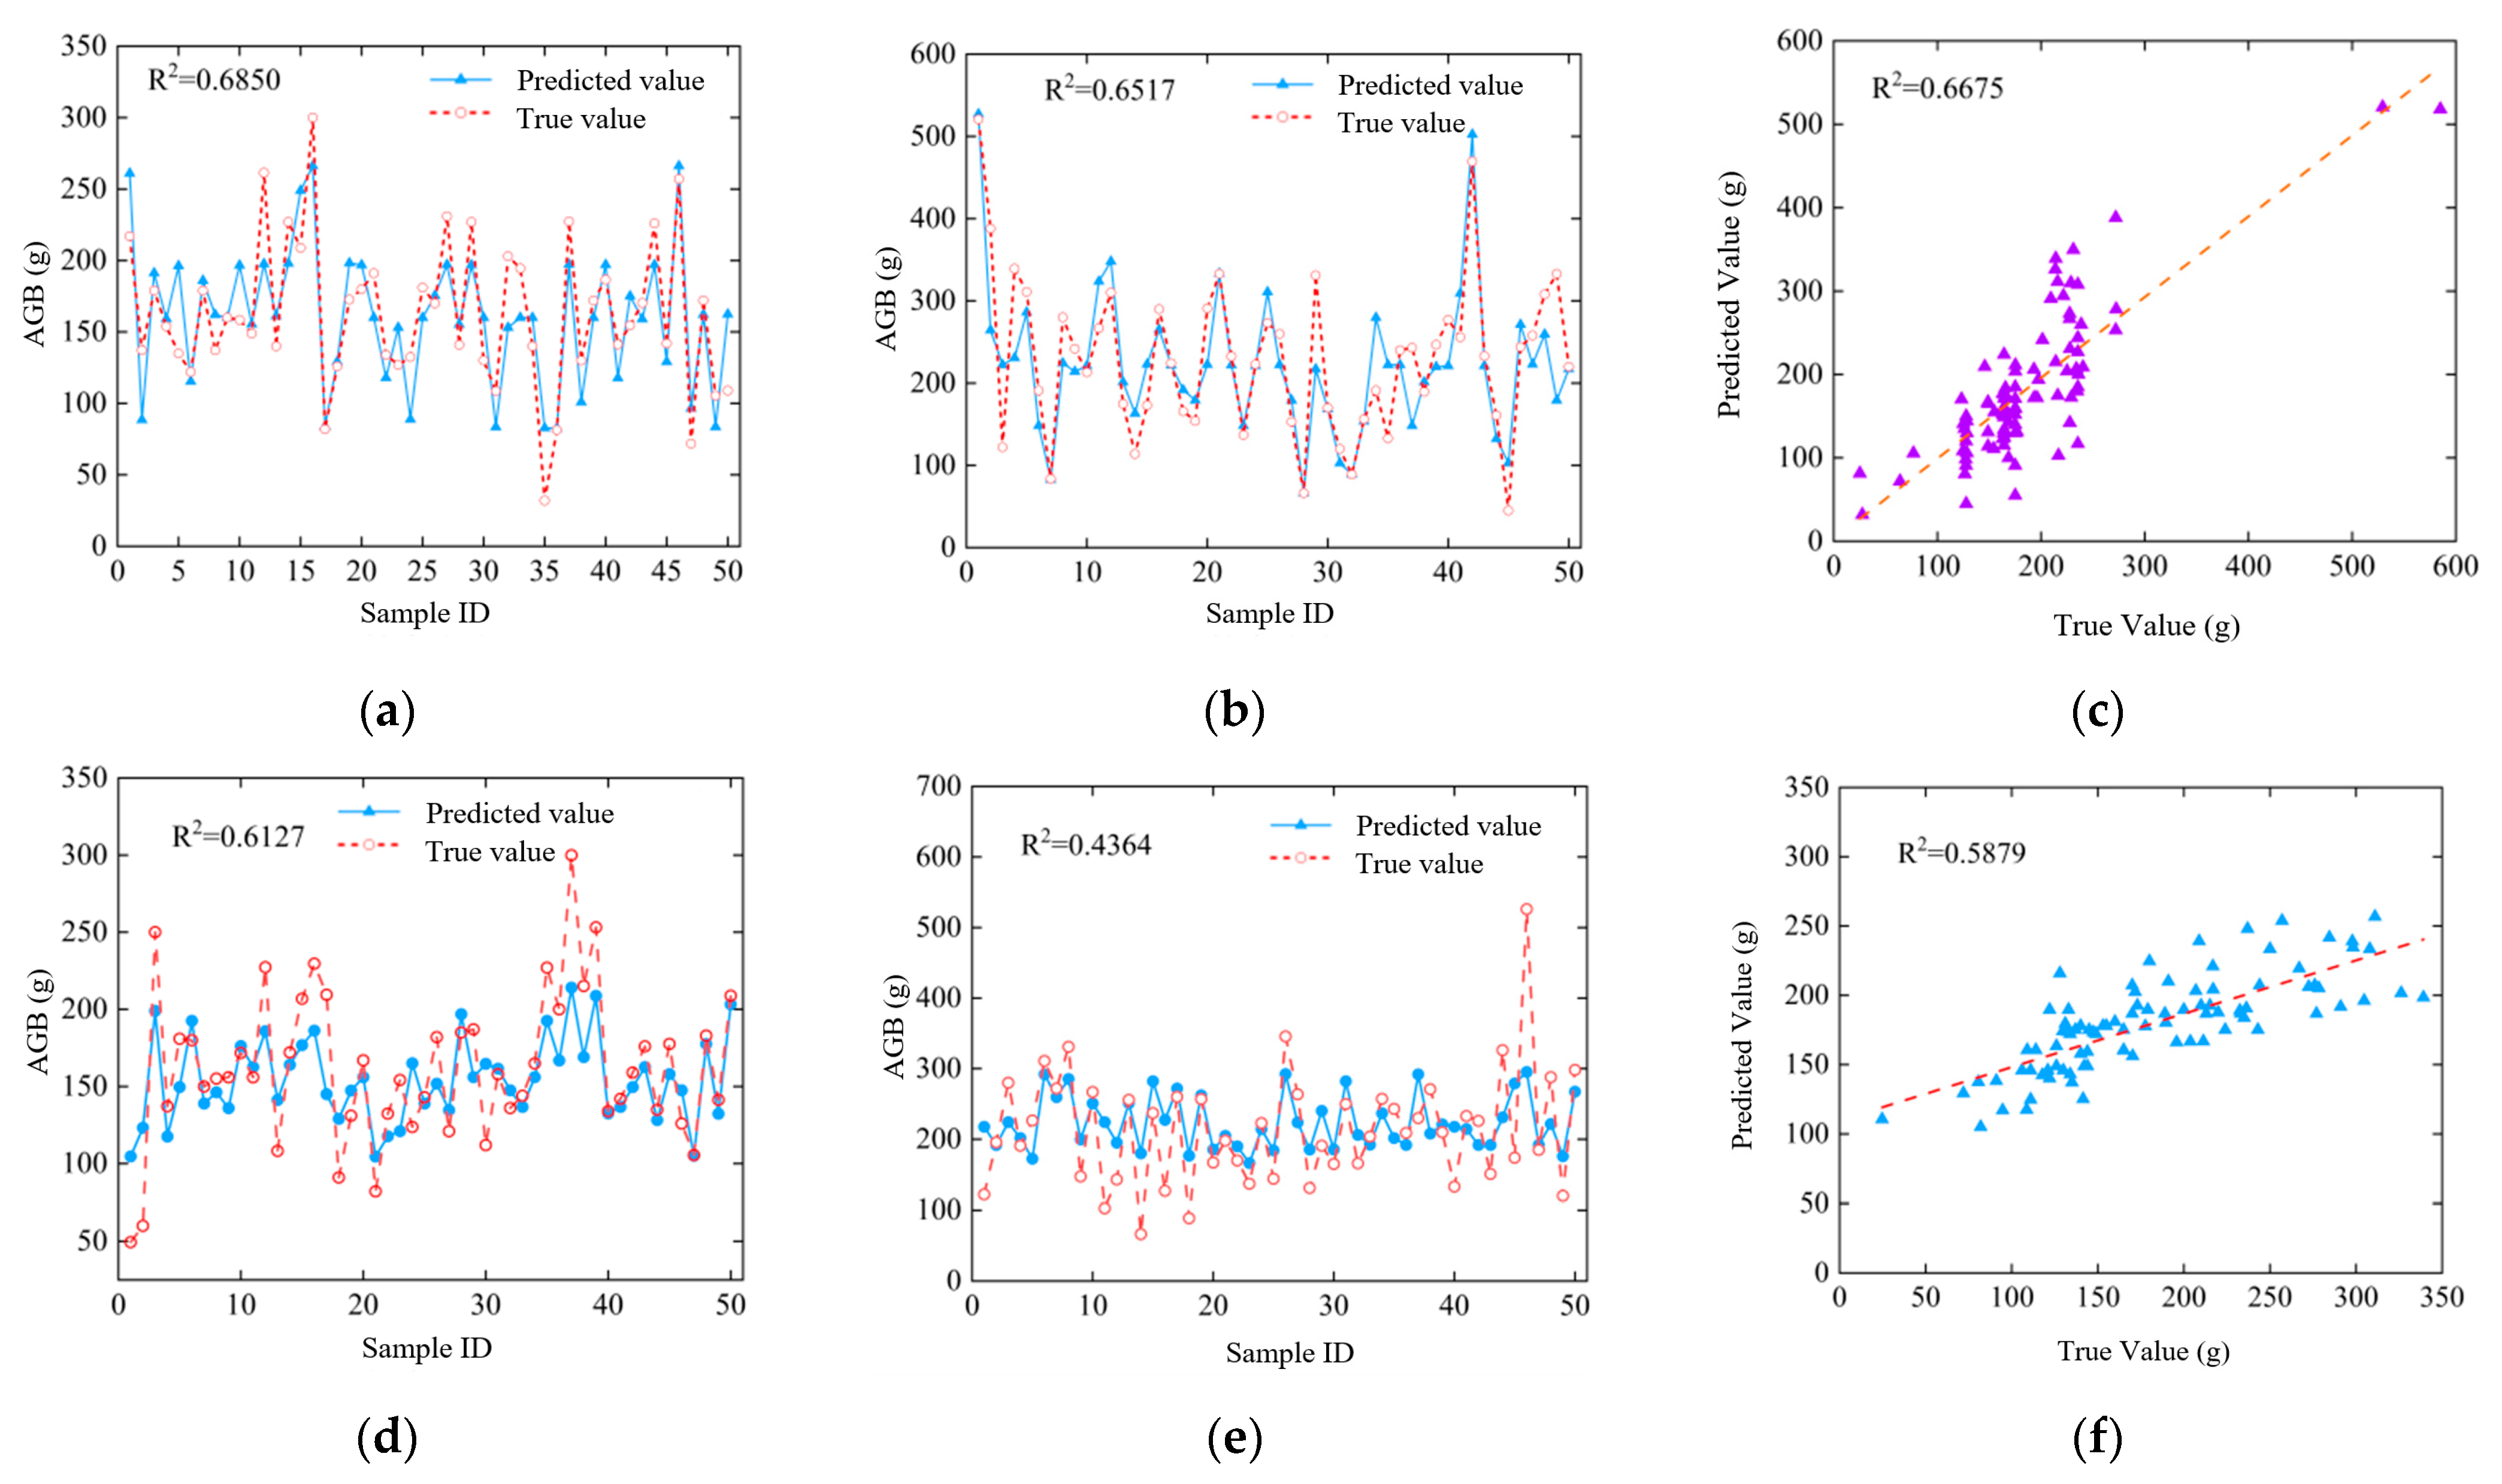
Given that the RF method did not yield satisfactory results in AGB prediction, this study further developed potato AGB prediction models using two additional machine learning approaches: Feedforward Neural Network (FNN)and Support Vector Regression (SVR). Plant height data were used as the input to predict AGB. The training and validation sets used for these two models were consistent with those applied in the RF model. After multiple trials, the optimal FNN model was configured with 25 hidden layers. The prediction results for both models were shown in
Figure 17.
As shown in
Figure 17, both machine learning methods performed best in AGB prediction during the tuber expansion stage. The FNN model achieved an R
2 of 0.6850, while the SVR model reached 0.6127, both outperforming the RF method, with FNN showing particularly superior performance. At the maturity stage, the prediction accuracy of the FNN model slightly declined to an R
2 of 0.6675, still maintaining a good level of performance. In contrast, the accuracy of the SVR model dropped significantly, with an R
2 of only 0.4364. Overall, among the three models, the FNN model demonstrated stable performance during both the expansion and maturity stages, indicating strong robustness. In comparison, the RF and SVR models exhibited greater variability in prediction accuracy, particularly during the maturity stage.
In this study, the FNN method, which demonstrated superior performance, was further optimized by incorporating both plant height and FVC data to enhance the prediction of AGB in potatoes. The optimized FNN model uses plant height and FVC as input variables and AGB as the output. The network structure includes an input layer, two hidden layers, and an output layer, where each hidden layer contains 15 neurons. The trained FNN model is mathematically expressed in Equation (6).
In the equation, W1 represents the weight matrix from the input layer to the first hidden layer, W2 represents the weight matrix from the first hidden layer to the second hidden layer, W3 represents the weight matrix from the second hidden layer to the output layer, b1 is the bias vector of the first hidden layer, b2 is the bias vector of the second hidden layer, b3 is the bias term of the output layer.
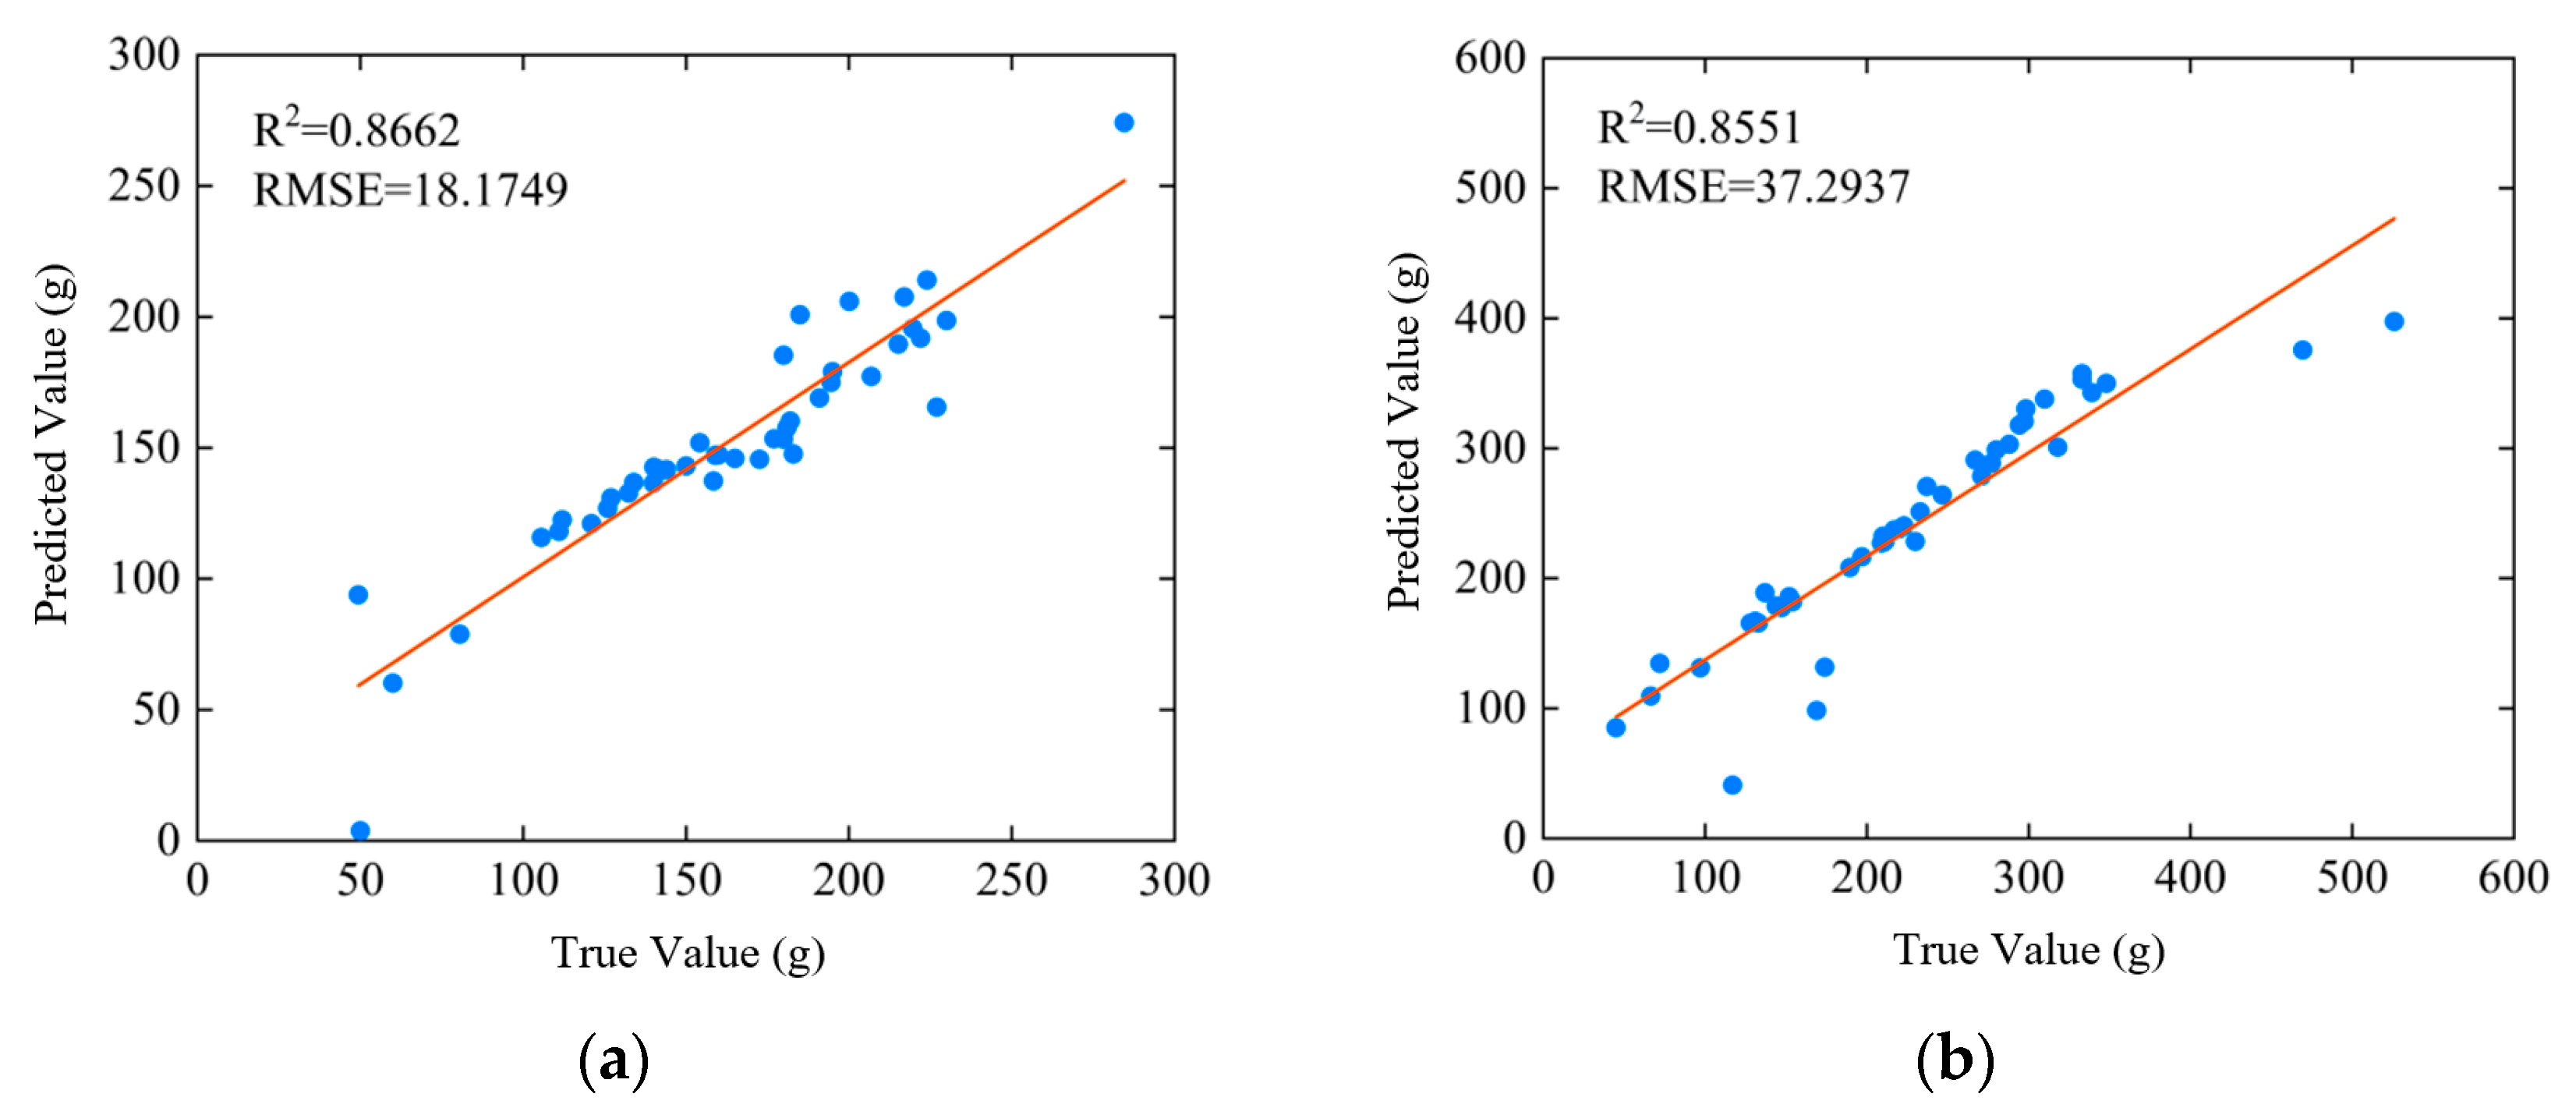
As shown in
Figure 18, the FNN-based AGB prediction model, incorporating both plant height and FVC information, achieved an R
2 of 0.8662 during the tuber expansion stage an improvement of 0.1812 compared to the unoptimized model. The RMSE of the model was 18.1749 g. At the maturity stage, the optimized model also maintained strong predictive performance, with an R
2 of 0.8551. These results indicate that the optimized AGB prediction model offers improved stability and reliability during these growth stages.
The second sampling data collected during the maturity stage were used as validation data to evaluate the performance of the optimized potato AGB prediction model. The validation results were presented in
Figure 19.
As depicted in
Figure 19a, the AGB prediction model proposed in this study exhibited high predictive accuracy, achieving a coefficient of determination (R
2) of 0.8341 and a root mean square error (RMSE) of 19.8595 g. The integration of plant height and FVC into the model significantly enhanced its performance, indicating that the AGB prediction model is both accurate and reliable. It is well-suited for estimating potato AGB across the entire growth cycle.
In addition, measured plant height combined with FVC obtained from the SVM method was used to estimate AGB, and the results showed a slightly higher accuracy (R
2 = 0.9012, RMSE = 17.3126 g), as shown in
Figure 19b. Nevertheless, the UAV-derived PH and FVC model still achieved reliable prediction performance, which demonstrates that the proposed approach can meet the requirements of AGB estimation without the need for labor-intensive ground measurements.
Leave-one-out cross-validation (LOOCV) was further applied to evaluate the performance of the AGB prediction model (
Figure 19c). The results showed a slight decrease in R
2 and a slight increase in RMSE compared with temporal validation (R
2 = 0.8147, RMSE = 21.4632 g), but the overall prediction accuracy remained stable, demonstrating that the model achieved reliable performance across different sampling subsets.
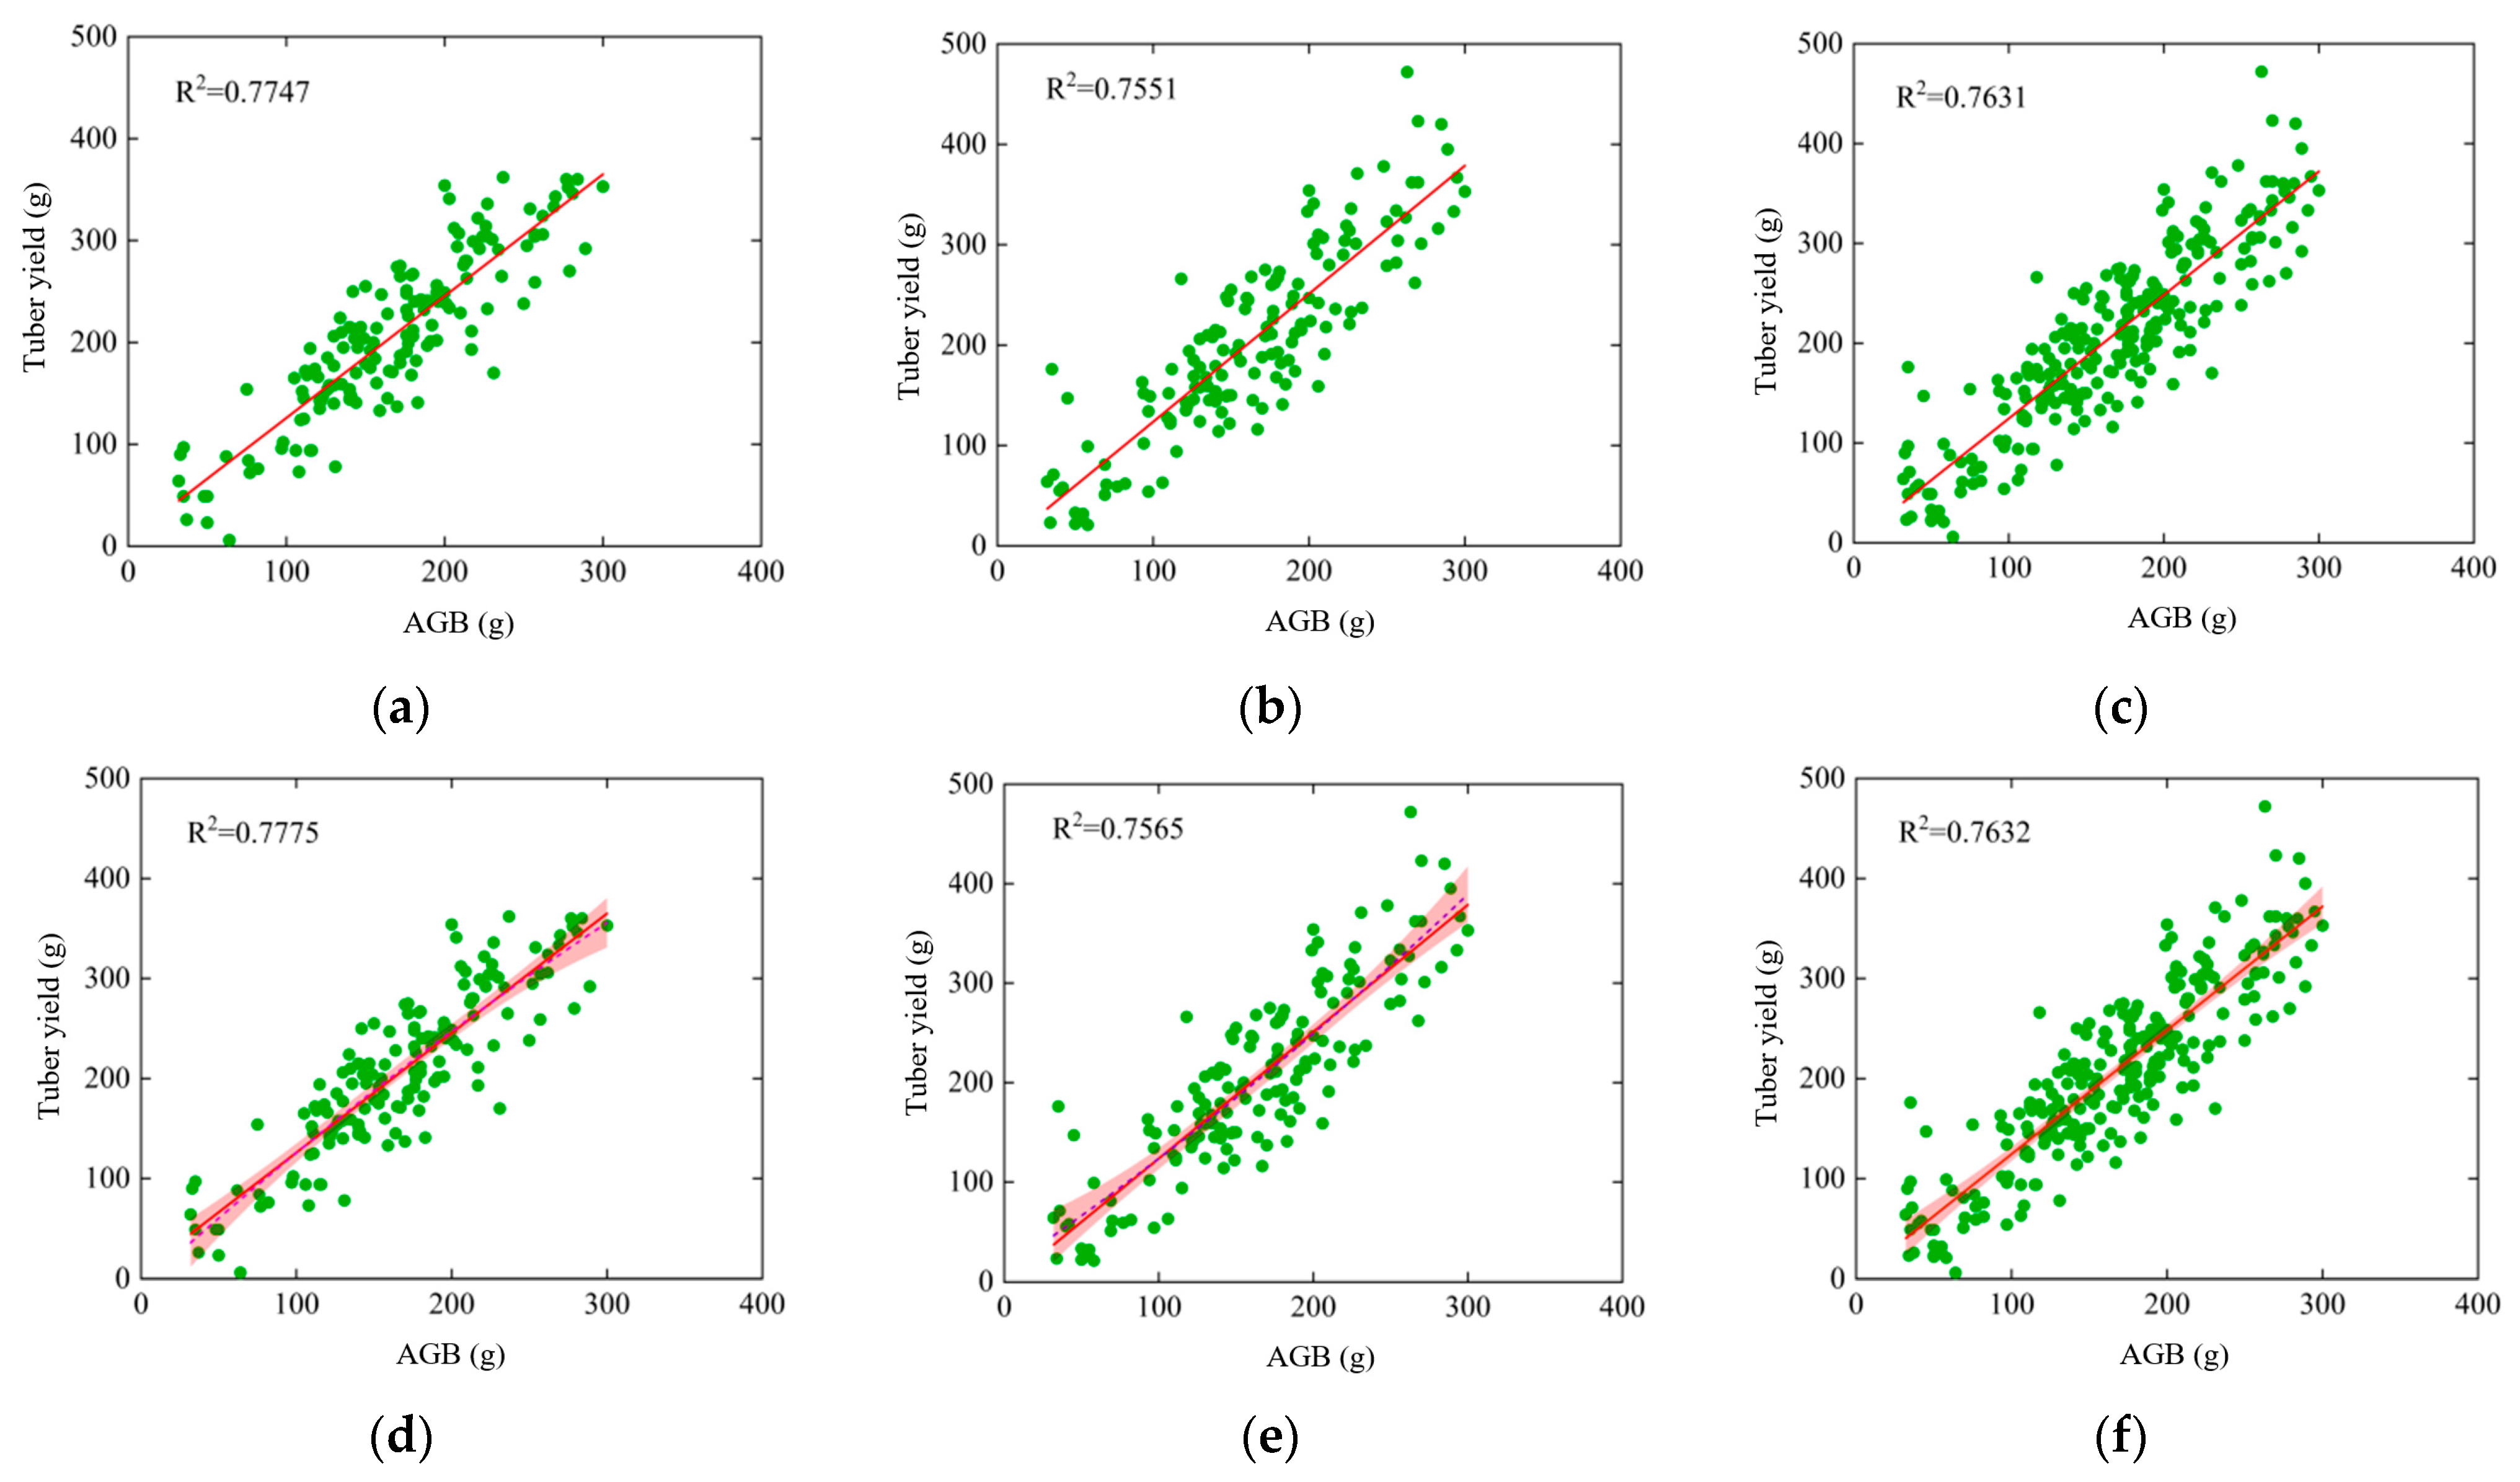
The study further conducted linear and polynomial fitting using the AGB and tuber yield data collected at two growth stages. The fitting results were presented in
Figure 20.
Analysis of
Figure 20 indicates that the results of both linear and polynomial fitting are similar, with polynomial fitting showing slightly better performance across the tuber expansion stage, maturity stage, and the full growth period. At the maturity stage, the R
2 values for linear and polynomial fitting were 0.7551 and 0.7565, respectively, both lower than those at the expansion stage, which aligns with the results of the correlation analysis. To ensure the accuracy and generalizability of the prediction, this study adopted polynomial fitting using data from the full growth period. The resulting fitted curve was then used for final tuber yield prediction. The polynomial fitting equation is presented in Equation (7).
In this study, the second sampling data from the maturity stage were used as the test set. Using the fitted polynomial equation, potato tuber yield was predicted based on AGB. A comparison between the predicted and actual yield values was shown in
Figure 21.
As shown in
Figure 21a, the model demonstrated good prediction accuracy, with the R
2 of 0.7919 and the RMSE of 47.0436 g. Through the above experiments, this study investigated the response relationship between AGB and tuber yield in potatoes, establishing a reliable correlation between AGB and yield. The results confirm the feasibility of using AGB for effective yield prediction.
Furthermore, measured AGB was directly used to predict tuber yield, and the results showed a slightly higher accuracy (R
2 = 0.8465, RMSE = 35.7286 g), as shown in
Figure 21b. However, the UAV-derived AGB model also provided reliable prediction performance, indicating that the proposed non-destructive UAV-based approach can achieve accurate yield estimation without the need for destructive ground sampling.
For yield prediction, LOOCV analysis was also performed (
Figure 21c). Consistent with the results for AGB, the yield model showed minor reductions in R
2 and slightly higher RMSE(R
2 = 0.7689, RMSE = 51.1564 g), yet maintained robust predictive capability. This indicates that the yield prediction framework can generalize well across different sample groups.
