Highlights
What are the main findings?
- A novel methodology is presented for detecting archaeological anomalies using only RGB aerial imagery.
- Spectral indices from PNOA images (2014–2024) combined with PCA and K-Means enabled temporal clustering and detection of persistent features.
What is the implication of the main finding?
- Spatially stable spectral anomalies suggest the presence of buried archaeological structures.
- The approach is scalable, cost-effective, and fully compatible with open-access geospatial datasets.
Abstract
This study investigates the use of high-resolution RGB aerial imagery from Spain’s National Aerial Orthophotography Plan (PNOA) for archeological feature detection through spectral index analysis and unsupervised clustering. Focusing on the Roman site of Munigua, eight orthophotographs acquired between 2014 and 2024 were analyzed to compute five RGB-based spectral indices: VARI, GLI, ExG, CSI, and BI. These indices were used to detect surface spectral anomalies potentially linked to buried archeological structures. A multi-temporal approach was employed, with Principal Component Analysis (PCA) and K-Means clustering applied independently to each image. This allowed for the identification of temporally persistent anomalies (areas that remained within the same spectral cluster across multiple years), suggesting the presence of underlying anthropogenic features. Despite the lack of near-infrared data, the combination of RGB-based indices and temporal clustering proved effective for non-invasive prospection. The methodology is scalable, repeatable, and relies entirely on open-access datasets, making it suitable for broader applications in heritage monitoring and landscape archeology. The results underscore the potential of RGB imagery and time-series clustering in detecting subtle archeological signals within complex vegetated environments.
1. Introduction
The field of archeological remote sensing has undergone a substantial transformation in recent decades, driven by advancements in sensor technology, computational tools, and the increasing availability of high-resolution geospatial data [1]. Aerial imagery, once limited to analog photographs and coarse-resolution satellite data, is now widely available at sub-meter spatial resolutions through national geospatial programs and commercial platforms [2]. This evolution has enabled researchers to detect and interpret subtle landscape features that may indicate the presence of archeological structures, anthropogenic modifications, or buried remains, even mines [3]. Among these data sources, RGB aerial imagery has gained renewed attention for its accessibility, spatial detail, and compatibility with automated image analysis techniques.
Unlike multispectral and hyperspectral sensors, RGB systems capture only the visible spectrum (red, green, and blue bands), limiting their sensitivity to specific material or physiological signatures [4]. However, their widespread availability and extremely high spatial resolution (often 25 cm or finer) make RGB imagery valuable for revealing shape patterns [5,6,7], useful for heritage detection and monitoring. Traditional archeological use of RGB images has often relied on visual interpretation and manual digitization [8]. Still, recent methodological advances now allow for quantitative analysis using derived spectral indices and machine learning techniques [9].
Several RGB-based spectral indices have been developed to extract meaningful information about vegetation vigor, surface brightness, and chromatic characteristics. Indices such as the Visible Atmospherically Resistant Index (VARI), Green Leaf Index (GLI), Excess Green Index (ExG), Color Saturation Index (CSI), and Brightness Index (BI) have been widely used in agriculture, forestry, and urban studies [10,11]. These indices leverage the relationships between RGB bands to highlight differences in plant health, soil exposure, material reflectance, or surface disturbances, all of which may be indirectly linked to anthropogenic activities or buried archeological elements. When computed over high-resolution aerial imagery, these indices enable the identification of subtle spatial patterns that may go unnoticed through visual inspection alone [12].
A critical advancement in this domain has been the integration of machine learning for pattern recognition [13], classification, and anomaly detection [14]. Unsupervised algorithms, such as K-Means clustering, Gaussian Mixture Models, and Self-Organizing Maps, offer robust frameworks for grouping pixels with similar spectral behavior without requiring labeled training data. These methods are particularly advantageous in archeological applications, where ground-truth information is often sparse or unavailable [15]. When applied to spectral index stacks or image composites, clustering algorithms can reveal recurring spatial structures, isolate anomalous zones, and support automated segmentation of the landscape into interpretable regions.
To enhance the performance of clustering, dimensionality reduction techniques such as Principal Component Analysis (PCA) are often employed [16]. PCA transforms multi-index or multi-band data into a set of uncorrelated components, concentrating the most relevant variance while suppressing noise and redundancy. This preprocessing step not only improves computational efficiency but also facilitates the discovery of latent spectral signatures that may correspond to archeological features. When combined with temporal imagery, this approach allows for tracking spectral stability or change over time, further increasing the reliability of anomaly detection by differentiating persistent signals from seasonal or environmental fluctuations [17].
Recent remote sensing research has shown that, despite its spectral limitations, RGB imagery can be effectively used in archeological applications when integrated with modern analytical workflows [18]. These include automated index computation, multi-temporal analysis, and the application of unsupervised learning to detect spatially coherent and temporally consistent anomalies. Such methods are cost-effective, scalable, and applicable to a wide range of geographic contexts, particularly where access to multispectral or active sensors (e.g., LiDAR and SAR) is limited [19].
Considering these developments, this study contributes to the ongoing transition toward automated, quantitative methods in archeological remote sensing. Although archeological excavations may corroborate their existence [20], this work explores the capability of RGB imagery to support spectral index-based analysis and machine learning-driven classification for identifying potential cultural features in the landscape. By demonstrating a fully unsupervised pipeline for anomaly detection across multiple dates of high-resolution RGB imagery, this research highlights the growing potential of accessible technologies for heritage documentation, monitoring, and protection in data-rich environments.
The rest of this paper is organized as follows: after presenting the case study, Section 2 addresses the research methodology to compute RGB-based indices and perform temporal clustering; Section 3 presents the results of these proceses, discussed in Section 4, where the strengths, limitations, and implication of this research are described; finally, Section 5 draws the conclusions and suggests future work.
Case Study: The Roman Site of Munigua
The archeological site of Munigua, also known as Mulva, is located approximately 8 km from Villanueva del Río y Minas and 50 km northeast of Seville (Spain) (Figure 1). The southern region of the Sierra Morena is historically significant due to its former mining activity [21,22,23]. Known in antiquity as Municipium Flavium Muniguense, the town flourished due to its proximity to mineral resources, particularly iron and copper, which were extensively exploited in the area.
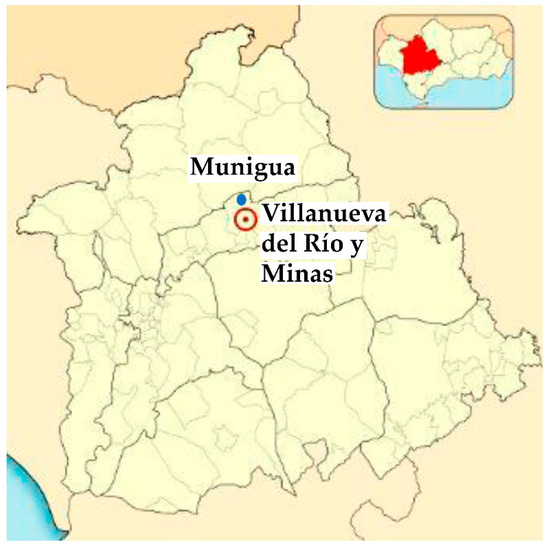
Figure 1.
Location of the Roman site of Munigua (blue point). Approximate coordinates: Latitude 37.713225 N, longitude 5.740843 W.
Munigua occupies a prominent position on a hillside that overlooks a narrow valley and the surrounding uplands, at an elevation of approximately 130 m above sea level. This strategic topographical setting played a critical role in the development, layout, and symbolic organization of the settlement, particularly the construction of its terraced sanctuary, which dominates the site from the highest point of the hill.
The site offers a uniquely well-preserved example of a small Roman urban center that experienced substantial development following its elevation to municipal status under the Flavian dynasty, particularly during the reign of Emperor Vespasian (69–79 AD) [24]. Its remote location, limited post-Roman occupation, and continued archeological conservation have contributed to the exceptional preservation of its architectural remains [25].
Munigua’s origins date back to at least the 4th century BC, with evidence of an earlier Iberian settlement and ironworking activity preceding the Roman occupation [24]. The city’s peak occurred between the late 1st century and the end of the 3rd century AD, coinciding with major urban transformations linked to its newly acquired ius Latii [24,26]. The construction of several monumental buildings took place during this period [27], including the terraced sanctuary dedicated to Fortuna and Hercules, a podium temple, the forum, aediculae, thermal baths, and city walls, many of which still retain substantial architectural integrity [28]. The terraced sanctuary (Figure 2), in particular, is of outstanding ideological and architectural significance, drawing comparisons with Italic sanctuaries such as Fortuna Primigenia in Praeneste and Hercules Victor in Tibur [29,30]. Research has shown that, from the Flavian period onwards, public buildings occupied the upper and eastern slopes, while domestic (habitational) structures were located on the lower terraces. Of the three houses excavated, two follow the Roman atrium-house plan [31].
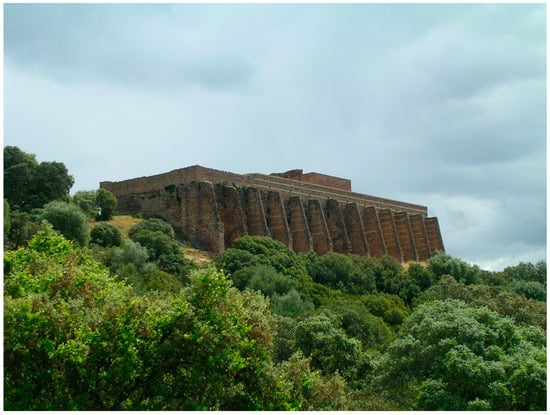
Figure 2.
The terraced sanctuary of Munigua. Source: [32].
The city functioned as a civic-religious hub, integrating Italic urban planning models into a rural Turdetanian context, possibly as part of a broader imperial strategy to assert control over indigenous populations through symbolic and administrative infrastructure [30]. Epigraphic evidence, including the tessera hospitalis issued under Augustus and inscriptions honoring emperors and deities, reflects the site’s public and official character, dominated by elite self-representation and the absence of lower-class funerary inscriptions [22,30]. The settlement declined from the late 3rd century AD onwards, potentially triggered by a seismic event affecting the lower terraces, as supported by recent geo-archeological studies [26]. Thus, research suggests that a combination of natural and anthropogenic processes shaped the archeological record of Munigua. The dense Mediterranean woodland, particularly holm oaks, helped preserve urban structures while hiding evidence of past agricultural and mining activities [28].
Systematic excavations led by the German Archeological Institute since 1956, initially under Wilhelm Grünhagen and later under Thomas G. Schattner and collaborators, have provided extensive data on Munigua’s topography, architecture, and economy [20]. Recent research has focused on generating a detailed three-dimensional reconstruction of the city and understanding the spatial and functional relationships among its structures [25] (Figure 3). The site also provides insights into various economic activities, such as iron metallurgy, quarrying, olive cultivation, and animal husbandry, which sustained both urban and rural populations within its territory [22].
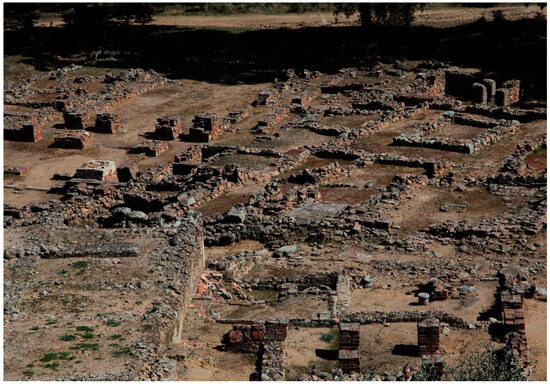
Figure 3.
Munigua’s urban fabric. Habitational spaces in the northeastern area. Source: [28].
Munigua is a heritage-listed site, a protected archeological zone due to its cultural heritage significance [21]. It was declared a historic-artistic monument in 1931 as the ‘Mulva Castle’ [33]. In addition, was designated as an asset of cultural interest (Bien de Interés Cultural (BIC), in Spanish) in 1985 [34], and was included in the General Catalogue of the Andalusian Heritage (Catálogo General del Patrimonio Histórico Andaluz (CGPHA), in Spanish) in 2007 (at the regional level) and 2008 (nationally) [35]. Being managed by the Junta de Andalucía, conservation efforts continue, particularly at the thermal complex and key public routes, ensuring the long-term preservation of this exceptional case of Roman urbanization in the Iberian Peninsula’s highlands.
2. Materials and Methods
This study employed a remote sensing-based approach using high-resolution RGB orthoimagery from the National Aerial Orthophotography Plan of Spain (PNOA, from the Spanish ‘Plan Nacional de Ortofotografía Aérea’) [36] to detect and monitor potential archeological features. The methodology (Figure 4) integrates spectral index computation, unsupervised clustering, and temporal analysis to identify persistent anomalies that may signal buried structures or anthropogenic disturbances.
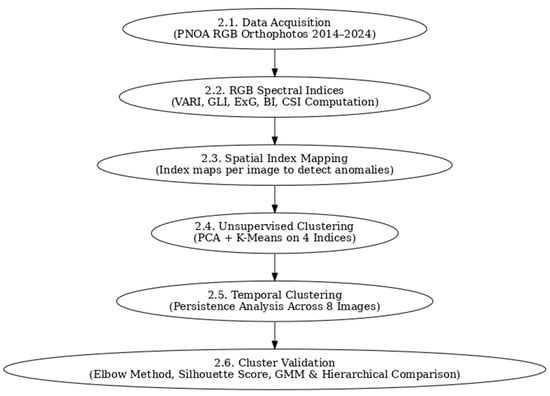
Figure 4.
Research methodology flowchart.
2.1. Data Acquisition
Eight orthoimages of the archeological site of Munigua were selected from 2014 to 2024. With a spatial resolution of 25 cm, all images were obtained from the PNOA program. The images were acquired under varying seasonal conditions and lighting environments. File naming conventions included the exact date of acquisition, enabling precise temporal ordering for multi-temporal analysis.
2.2. Spectral Indices from RGB Data
Since PNOA images provide only visible bands (red, green, and blue), a set of spectral indices adapted for RGB data was computed. These indices are sensitive to vegetation vigor, surface brightness, and chromaticity, all of which can be influenced by buried archeological features. The following indices (Table 1) were computed for each image on a per-pixel basis:

Table 1.
Relationship of spectral indices used.
All indices were calculated using Python 3.11 through a fully scripted and reproducible workflow. The NumPy library (version 1.26) was employed for array-based mathematical operations. Each RGB orthoimage was ingested as a NumPy array using either OpenCV (cv2) or scikit-image, depending on the input format. The spectral index formulas were implemented as direct per-pixel operations across the red, green, and blue (RGB) bands of each image.
For the dimensionality reduction and clustering phases, the scikit-learn library (version 1.4) was utilized. Each computed index layer was stacked to form a four-dimensional feature space (VARI, GLI, ExG, CSI), which was first standardized using z-score normalization. This was followed by Principal Component Analysis (PCA) to reduce dimensionality while retaining the most relevant spectral variance. K-Means clustering (with k = 4) was then applied to the PCA-transformed data, assigning each pixel to a spectral class. For robustness and comparative analysis, Gaussian Mixture Models (GMM) with full covariance matrices and Agglomerative Hierarchical Clustering with average linkage were also implemented.
Multi-temporal consistency was ensured by processing all eight orthoimages independently using the same pipeline. Custom Python scripts iterated through each image file, performing normalization, PCA, and clustering under identical parameter settings. The resulting cluster maps were compared over time by tracking label consistency across acquisition dates and identifying pixels presenting temporal cluster persistence, which is key to distinguishing stable archaeological anomalies from transient environmental effects.
Visualization of results was conducted using a combination of Matplotlib (version 3.8) for spatial plots and index maps, Seaborn (version 0.13) for generating time-series charts, and OpenCV for image blending and color mapping. All cluster maps and index images were exported in raster formats (e.g., PNG, JPG) using custom colormaps tailored to highlight contrast and spectral differences across the site. Every figure presented in the manuscript was generated using these open-source Python tools, ensuring full reproducibility.
2.3. Spatial Index Mapping
For each image and index, spatial maps were generated and analyzed to detect surface anomalies indicative of archeological relevance. These maps enabled the identification of subtle patterns, such as alignments or textural differences, that correlate with buried architectural remains. Particular attention was paid to differences in vegetation vigor and brightness over time.
2.4. Unsupervised Clustering for Anomaly Detection
To classify spectral anomalies and isolate patterns with potential archeological meaning, an unsupervised machine learning method using K-Means clustering (k = 4) was applied. The RGB-based indices (VARI, GLI, ExG, and CSI) were stacked into a four-band composite for each image. The resulting pixel vectors were normalized via z-score standardization and reduced to two dimensions using Principal Component Analysis (PCA). This dimensionality reduction minimized noise while retaining the most discriminative spectral variance [37].
The K-Means algorithm was then applied to the reduced feature space, assigning each pixel to one of four spectral classes. The output cluster maps were color-coded and overlaid onto the original orthoimages to assist in geographic and archeological interpretation [38].
2.5. Temporal Clustering for Anomaly Persistence Detection
To assess the persistence of spectral anomalies over time, the clustering process was repeated independently for each PNOA image. By applying the same methodology to each acquisition date, considering index calculation, dimensionality reduction via PCA, and unsupervised classification using K-Means (k = 4), consistent analytical conditions across the multi-temporal dataset were sought.
Each image was processed to extract the four RGB-based spectral indices (VARI, GLI, ExG, and CSI) on a per-pixel basis. These index layers were stacked and flattened into feature vectors, filtered for valid numerical values, and normalized using z-score standardization. A PCA transformation was then applied to reduce the four-dimensional space to two principal components, retaining the most relevant spectral variance while minimizing noise [37].
Following dimensionality reduction, K-Means clustering was performed on each image independently. The output was a spatial cluster map assigning each pixel to one of four spectral classes. These cluster maps were then overlaid on the corresponding orthoimages to facilitate interpretation in a geographic context.
By comparing the cluster maps across all acquisition dates, spatially persistent anomalies were identified, i.e., regions that consistently belong to the same or similar spectral clusters throughout time. These persistent zones are of high archeological interest, as they likely correspond to buried architectural elements, infrastructure remains, or anthropogenic soil modifications that subtly influence surface spectral properties despite seasonal or environmental variability. After all, the Roman archeological site being examined is a well-maintained and curated location, a cultural heritage area open to the public. Thus, vegetation is fairly consistent, controlled to a low level throughout the year, which effectively reduces spectral variability caused by natural phenological cycles. Therefore, seasonal changes have a minimal effect on spectral signals, making additional modeling based on weather or phenological data unnecessary. In this context, the approach of identifying temporally persistent anomalies over several years remains a valid and reliable technique for locating potential subsurface archeological features.
Considering the above, the temporal clustering approach enhances the robustness of potential archeological feature detection by distinguishing true, stable anomalies from ephemeral changes due to vegetation growth, lighting conditions, or moisture variability.
2.6. Cluster Validation and Algorithm Comparison
To support the methodological framework of the unsupervised classification process and validate the choice of k = 4 in the K-Means algorithm, a two-step validation was executed: (1) identifying the optimal number of clusters through conventional statistical techniques, including the elbow method and silhouette score analysis, and (2) juxtaposing K-Means clustering outcomes with those from alternative unsupervised algorithms, such as Gaussian Mixture Models (GMM) employing full covariance estimation and Agglomerative Hierarchical Clustering utilizing average linkage.
3. Results
This section presents the main findings derived from the RGB-based spectral indices and clustering analyses applied to the high-resolution orthophotographs from the Spanish PNOA program. Eight images, from 2014 to 2024, were analyzed individually and as a multi-temporal dataset in order to detect and characterize archeological anomalies in the Roman site of Munigua, Spain.
3.1. Spectral Index Behavior PER Acquisition Date
Five RGB-based indices were calculated for each PNOA image: the Visible Atmospherically Resistant Index (VARI), Green Leaf Index (GLI), Excess Green (ExG), Color Saturation Index (CSI), and Brightness Index (BI). Each index revealed different patterns of surface reflectance and vegetation vigor, potentially associated with anthropogenic structures or buried remains.
- 30 December 2014: High values of BI and moderate ExG were detected in open and clear areas, suggesting minimal vegetative cover and high surface reflectance, possibly due to exposed architectural elements;
- 17 February 2016 and 18 January 2018: Moderate to high VARI and ExG values indicate increased vegetation in the surrounding areas, with slight enhancement of GLI in vegetated sectors;
- 2 September 2020 and 9 June 2021: CSI and ExG increased noticeably, highlighting contrasts in color tones due to changing soil moisture or vegetation senescence, which may influence subsurface remains;
- 13 October 2021 and 13 June 2023: Lower GLI and VARI values coincide with increased heterogeneity in CSI, suggesting seasonal senescence and localized anomalies that might correspond to buried architectural features;
- 28 March 2024: The VARI index showed its highest peak, reflecting lush vegetation growth in early spring, with corresponding low CSI and BI values in vegetated sectors. However, certain zones retained high BI and CSI values, potentially due to the presence of stone surfaces or compacted soils.
3.2. Temporal Evolution of Spectral Indices
To understand how surface features evolve over time, the mean pixel values for each spectral index were plotted per acquisition date.
Figure 5 shows the temporal evolution of BI (Brightness Index), revealing a general decline from 2014 to 2020, possibly due to increased vegetation cover or image exposure variability, followed by a sharp rise in 2024. Notably, the BI minimum in 2020 aligns with the highest vegetation activity observed in visual inspection.
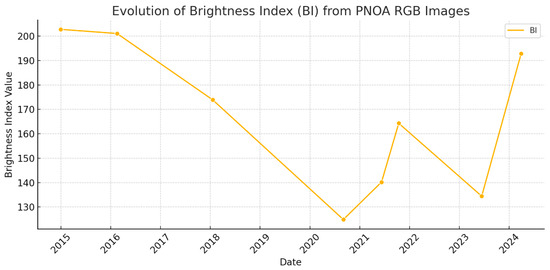
Figure 5.
Temporal evolution of the Brightness Index (BI) from PNOA RGB images (2014–2024).
Figure 6 presents the temporal trends of VARI, GLI, ExG, and CSI. The ExG index showed significant fluctuations, peaking during mid-summer (2021) and late spring (2023), correlating with phases of vegetation decline. CSI remained relatively stable across dates but showed peaks in images with increased surface exposure, such as in 2021 and 2023. Both VARI and GLI showed seasonal sensitivity, increasing in spring (2024) and dropping in summer (2023), reflecting phenological cycles.
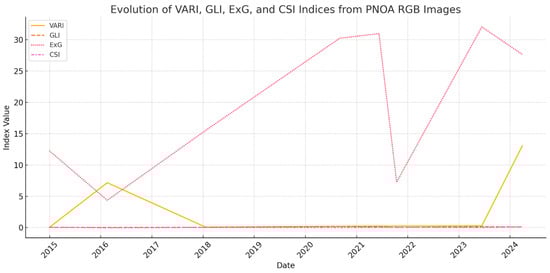
Figure 6.
Temporal evolution of VARI, GLI, ExG, and CSI indices from PNOA RGB images (2014–2024).
3.3. Spatial Patterns and Archeological Implications
Spatial index maps revealed discrete areas with consistently high or low index values, which align with known archeological structures, paths, or buried architectural traces (see Figure 7, Figure 8, Figure 9, Figure 10, Figure 11, Figure 12, Figure 13 and Figure 14):
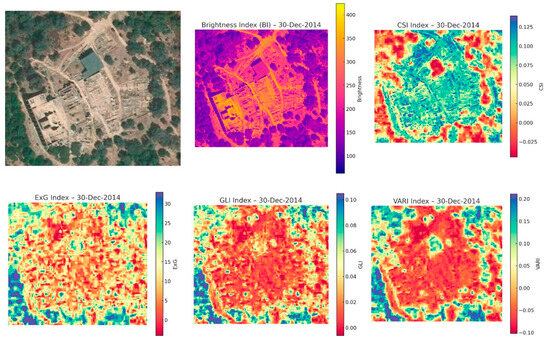
Figure 7.
Spatial indexes maps on 30 December 2014.
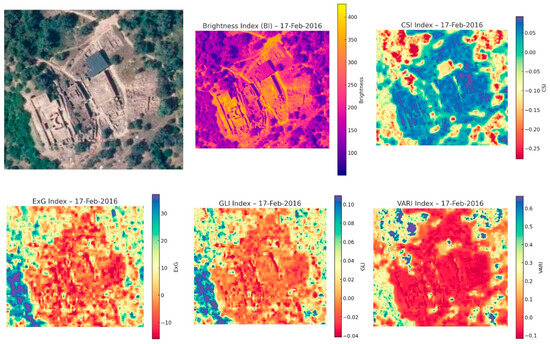
Figure 8.
Spatial index maps on 17 February 2016.
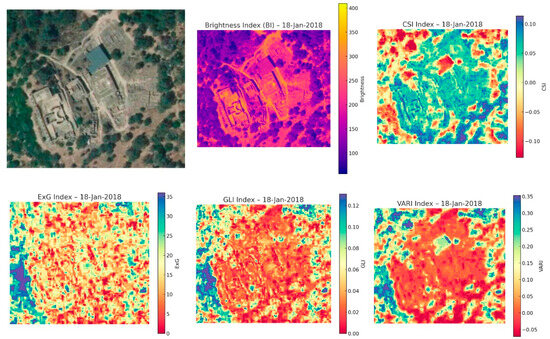
Figure 9.
Spatial index maps on 18 January 2018.
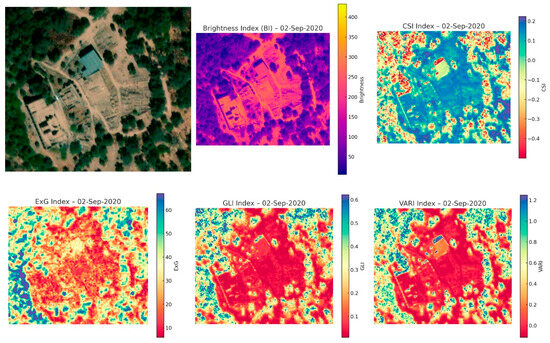
Figure 10.
Spatial index maps on 2 September 2020.
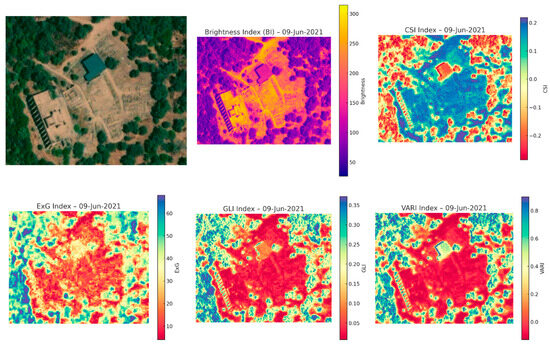
Figure 11.
Spatial index maps on 9 June 2021.
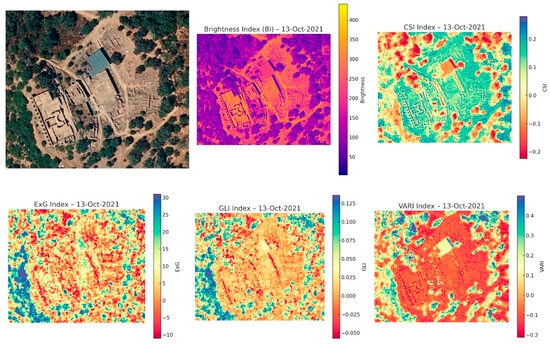
Figure 12.
Spatial index maps on 13 October 2021.
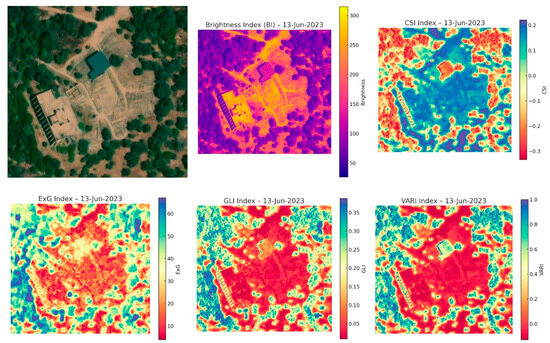
Figure 13.
Spatial index maps on 13 June 2023.
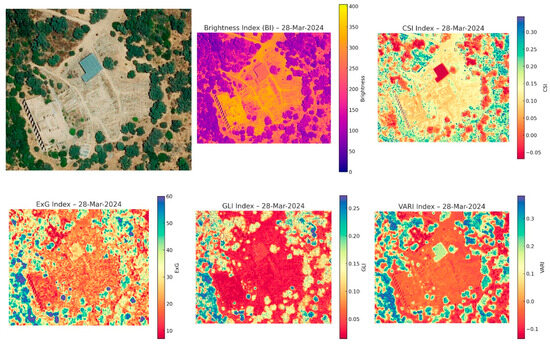
Figure 14.
Spatial index maps on 28 March 2024.
- ExG and VARI maps highlighted vegetated patches and anomalous greening over rectilinear forms;
- CSI and BI were especially sensitive to lithological and soil composition variations, accentuating linear anomalies consistent with walls or road alignments;
- Low GLI and ExG zones with high BI values coincided with open, compacted, or stone-paved areas.
3.4. Multi-Temporal Clustering Results
Temporal anomaly detection through unsupervised clustering (K-Means, k = 4) enabled the classification of each pixel based on its PCA-reduced spectral signature. Cluster maps showed persistent spatial features across multiple years, particularly:
- Clusters consistently present in at least five of the eight acquisitions were mainly concentrated in the northeast and western sectors of the site, where known structures exist (e.g., forum, baths). On the other hand, the first two principal components retained for clustering consistently captured the majority of the variance (typically above 85%) across all processed image dates. Additionally, the component loadings reflect balanced contributions from the four RGB-based indices (VARI, GLI, ExG, CSI), confirming the relevance of each index in the dimensionality reduction step.
- These zones also showed recurrent stability in BI and CSI values, suggesting minimal vegetation variability and persistent material exposure.
- Contrarily, the southern and eastern vegetated zones presented more temporal variability in cluster affiliation, likely due to phenological or environmental factors rather than archeological ones.
This persistent spatial clustering, corroborated by both spectral index values and visual inspection, enhances confidence in identifying zones of archeological interest with minimal false positives from ephemeral vegetation changes. In this way, it should be noted that the assessment of minimal false positives is based on qualitative consistency, algorithmic redundancy, and spatial-temporal alignment with known archeological features, rather than on quantitative ground-truth validation.
4. Discussion
This study aimed to assess the potential of high-resolution RGB aerial imagery from the PNOA program to support archeological prospection through the calculation of spectral indices and unsupervised clustering. The findings demonstrate that even in the absence of near-infrared (NIR) data, RGB-based indices can reveal meaningful spatial and temporal spectral anomalies that are compatible with subsurface archeological features.
4.1. Temporal Patterns and Vegetation Dynamics
Figure 5 and Figure 6 illustrate the temporal evolution of the five RGB-based indices across eight acquisition dates from 2014 to 2024. The Brightness Index (BI) exhibited a downward trend from 2014 through 2020, followed by a partial recovery in 2021 and a strong increase in 2024 (Figure 5). This trend may reflect seasonal cycles, changing lighting conditions, or alterations in vegetation cover. The lowest BI value observed in 2020 coincided with a period of high vegetation growth, which typically reduces surface reflectance and consequently BI values.
The indices VARI and GLI (Figure 6), designed to highlight vegetation vigor using green channel dominance, presented strong seasonal variability. Peaks were recorded during the spring acquisition (28 March 2024), while lower values appeared in mid-to-late summer images (e.g., 13 June 2023). These indices effectively captured phenological changes and were useful in isolating non-vegetated surfaces where archeological anomalies are more likely to manifest. Notably, areas with persistently low VARI and GLI and high BI and CSI values tended to correspond with known excavation zones or structures partially exposed on the surface.
The Excess Green Index (ExG), although not normalized, provided a strong vegetation signal and was particularly useful in highlighting subtle differences in plant stress or density across years. A significant drop in ExG occurred in the 2021 summer image, which may reflect senescent or dried vegetation, potentially revealing spectral patterns associated with buried remains.
4.2. Spatial Anomalies and Archeological Inference
The spatial distribution of indices per date, shown in Figure 7, Figure 8, Figure 9, Figure 10, Figure 11, Figure 12, Figure 13 and Figure 14, revealed high-resolution patterns that suggest the presence of subsurface features. Across nearly all dates, rectilinear and geometric anomalies aligned with the known archeological layout of Munigua, including the forum, baths, and surrounding infrastructure.
For instance, the spatial maps from 30 December 2014 (Figure 6) and 28 March 2024 (Figure 14) revealed consistently low ExG and VARI values along the same elongated structures, suggestive of buried foundations or stone pavements. High CSI values along these same paths (Figure 11 and Figure 12) further supported the interpretation of dry, mineral-rich soils typically found above buried architecture.
Importantly, changes in spectral index contrast across years, such as the shift observed between 9 June 2021 (Figure 11) and 13 June 2023 (Figure 13), highlighted how seasonal and environmental variability can obscure or enhance archeological visibility. In this regard, the multi-temporal approach proved essential in separating persistent anomalies from seasonal vegetation artifacts.
4.3. Cluster-Based Anomaly Detection
The implementation of unsupervised K-Means clustering on PCA-reduced index data enabled a robust classification of spectral behavior across the study site. Clustering results (as discussed in Section 3.4) aligned well with index-based anomaly locations, confirming the capability of this method to generalize multi-index signatures into distinct spatial classes.
A key outcome of the clustering procedure was the identification of spatially persistent anomalies, clusters that appeared in the same locations across multiple years. These zones likely indicate the presence of buried architectural remains that subtly influence vegetation patterns or soil reflectance across time. The consistency of these features across dates adds confidence to their archeological relevance.
Additionally, comparing clustering outcomes across all eight images was useful to highlight areas of temporal inconsistency, likely caused by external factors such as seasonal vegetation change, atmospheric differences, or soil moisture variations. By isolating and disregarding these transient anomalies, the method enhances the reliability of detecting potential archaeological features in RGB-only datasets.
In addition, the elbow method and silhouette score analysis were applied to a sample image set (an orthophoto taken on 9 June 2021), using the stacked spectral indices (VARI, GLI, ExG, and CSI). The elbow method plots the within-cluster sum of squares (WCSS) against different values of k (from 2 to 10). It shows a clear change at k = 4, indicating that cluster compactness stops improving after that point. Similarly, silhouette scores peaked around k = 4, indicating that this value strikes the optimal balance between cohesion within clusters and separation between clusters. These results confirm that k = 4 is a reasonable and statistically sound choice. Figure 15 shows the corresponding plot.

Figure 15.
Cluster validation using the elbow method and silhouette score analysis applied to spectral index data (9 June 2021). Both methods indicate K = 4 as the optimal number of clusters.
Conversely, to evaluate the robustness of the K-Means results, a comparative analysis utilizing two alternative clustering algorithms was conducted: Gaussian Mixture Models (GMM) with full covariance estimation and Agglomerative Hierarchical Clustering with average linkage.
The index stack was used to make a PCA-transformed feature space that all three algorithms used. GMM and hierarchical clustering generated spatial patterns that were mostly the same; however, K-Means consistently produced cluster boundaries that were more compact and coherent, especially around known structural anomalies. Also, K-Means required significantly less computational time, making it a suitable choice for the multi-temporal application across the entire dataset (2014–2024). Figure 16 illustrates how the three algorithms grouped the same orthophoto, demonstrating that K-Means outputs are more intuitive and have better spatial clarity.
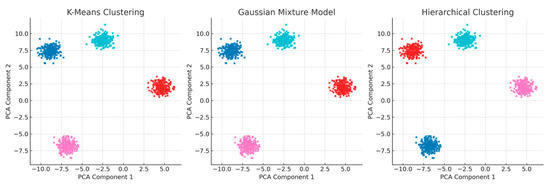
Figure 16.
Comparison of clustering algorithms applied to the PCA-reduced index space composed of four RGB-based spectral indices (VARI, GLI, ExG, and CSI): (left) K-Means, (center) Gaussian Mixture Model, and (right) Hierarchical Clustering.
From the image, each color represents a distinct spectral cluster derived from unsupervised classification: Cluster 0—Blue: Likely corresponds to low-reflectance areas such as bare soil or shaded ground; Cluster 1—Cyan: Typically associated with moderate vegetation cover or transitional zones; Cluster 2—Red: Highlights spectrally distinct regions that may reflect compacted surfaces, buried structures, or archeological remains; Cluster 3—Magenta: May indicate disturbed soils, anthropogenic modifications, or land cover anomalies.
According to Figure 16, the spatial separation of clusters and consistency across methods reinforces the spectral differentiation of the landscape and supports the identification of potential archaeological features.
4.4. Methodological Advantages and Limitations
The use of RGB imagery, despite the absence of NIR or SWIR bands typically used in remote sensing for vegetation and soil discrimination, was shown to be effective for archeological interpretation when combined with spectral indices and temporal clustering. The selected indices (VARI, GLI, ExG, CSI, BI) proved complementary: while VARI and GLI tracked vegetation vigor, CSI and BI captured soil color, texture, and material variations relevant to archeological contexts.
One limitation is that some indices, particularly ExG, are not normalized and may be influenced by lighting, image calibration, or seasonal effects. However, the use of PCA and z-score normalization during clustering helped mitigate this issue, standardizing spectral input across dates. Furthermore, although RGB data restricts access to deeper spectral properties (e.g., moisture or material composition), its availability at ultra-high spatial resolution (25 cm) compensates for this by enabling the detection of small-scale features such as walls, foundations, and roads.
Another strength of this approach lies in its scalability: the methodology can be adapted to larger sites or continuous monitoring using annually acquired orthoimages. It also supports integration with other geospatial datasets, such as LiDAR [39] or multispectral satellite imagery, enhancing hybrid archeological workflows.
4.5. Implications for Archeological Monitoring
Findings presented here highlight the utility of RGB imagery and spectral analysis for non-invasive archeological monitoring. By tracking the temporal persistence of spectral anomalies through multi-date clustering, this method provides a practical tool for detecting and validating potential archeological features. It can also serve as a prioritization mechanism for field campaigns, directing excavations toward zones with stable spectral patterns suggesting anthropogenic modification.
Moreover, the ability to reveal features masked by vegetation or seasonal effects, especially when supported by consistent temporal clustering, demonstrates the value of multi-temporal analysis in reducing false positives and identifying true archeological targets.
5. Conclusions
This study demonstrates the viability and effectiveness of using high-resolution RGB imagery from the Spanish PNOA (Plan Nacional de Ortofotografía Aérea) program for archeological feature detection through spectral indices and unsupervised temporal clustering. Although RGB imagery lacks the near-infrared (NIR) and shortwave infrared (SWIR) bands that are commonly used in remote sensing of vegetation and soil properties, the results indicate that carefully selected visible-spectrum indices, combined with multi-temporal analysis, can yield significant archeological insights.
Five spectral indices (VARI, GLI, ExG, CSI, and BI) were computed from RGB imagery across eight acquisition dates between 2014 and 2024. These indices were selected to capture subtle variations in vegetation vigor, soil brightness, and color contrast, all of which are influenced by the presence of buried archeological remains. The spatial distribution of these indices provided recurring visual signals aligned with known archeological features at the Roman site of Munigua. In particular, features such as building outlines, roads, and infrastructure appeared as spectral anomalies that persisted across multiple years and vegetation cycles.
Temporal analysis of the indices revealed consistent patterns that correspond to both seasonal changes and long-term surface characteristics. Notably, the Brightness Index (BI) captured broader changes in reflectance potentially associated with soil moisture and land cover. Meanwhile, the vegetation-sensitive indices (VARI, GLI, ExG) highlighted shifts in surface vegetation density that may reflect anthropogenic soil disturbances. The Color Saturation Index (CSI) proved particularly useful for identifying mineral-rich or construction-influenced soils.
The application of unsupervised clustering via Principal Component Analysis (PCA) and K-Means enabled the classification of per-pixel spectral behavior into stable spatial groups. By repeating this classification independently for each image and comparing the results over time, zones of temporal anomaly persistence were identified. These areas consistently belonged to the same spectral class across different dates. These persistent clusters are interpreted as highly likely indicators of buried archeological elements, based on their spectral stability and spatial coherence.
The methodological framework presented here offers several advantages:
- Scalable and repeatable: It can be applied to any geographic area covered by high-resolution aerial imagery; it can be extended to longer temporal series;
- Robust to noise: The inclusion of temporal clustering and index normalization helps mitigate the effects of seasonal vegetation changes, lighting differences, and imaging artifacts;
- Integration-ready: The results can be fused with other geospatial datasets, such as LiDAR or multispectral satellite imagery, to support archeological interpretation.
While this study focuses on RGB bands, which do not capture certain spectral phenomena as effectively as NIR or SWIR domains such as those related to soil chemistry, moisture content, or plant physiology, it demonstrates that valuable archaeological insights can still be extracted using modern analytical techniques. Also, although clustering improves interpretability, the archaeological significance of detected anomalies ultimately requires expert validation or field verification.
RGB-based multi-temporal spectral analysis and clustering represent a powerful and accessible toolset for archeological prospection and monitoring. The results from this study of Munigua’s site underscore the method’s potential for detecting stable, high-confidence anomalies that may indicate the presence of buried architectural remains. This research contributes to the broader field of archeological remote sensing by offering a replicable, low-cost, and data-driven methodology that leverages existing aerial imagery. Future work may focus on integrating this method with thermal or radar datasets to further enhance detection sensitivity, or on automating anomaly ranking systems to support large-scale heritage assessments.
Author Contributions
Conceptualization, E.R.-J. and D.A.; methodology, E.R.-J. and D.A.; software, E.R.-J. and D.A.; validation, E.R.-J. and D.A.; formal analysis, E.R.-J. and D.A.; investigation, E.R.-J. and D.A.; resources, E.R.-J. and D.A.; data curation, E.R.-J. and D.A.; writing—original draft preparation, E.R.-J. and D.A.; writing—review and editing, E.R.-J. and D.A.; visualization, E.R.-J. and D.A.; supervision, E.R.-J. and D.A.; project administration, E.R.-J. and D.A.; funding acquisition, E.R.-J. and D.A. All authors have read and agreed to the published version of the manuscript.
Funding
This work was supported by the research project ‘Climate Mission at the Universidad de Sevilla: Strategies for climate change adaptation and mitigation through architecture and construction sciences, with the goal of achieving a climate-neutral and smart Seville by 2030’, grant number SOL2024-31737. This work was also supported by the VI Plan Propio de Investigación y Transferencia of Universidad de Sevilla, Spain, under grant number VIPPIT-2020-II.5.
Data Availability Statement
All data used in this research are contained within the article.
Acknowledgments
The Authors wish to thank RS3 Remote Sensing S.L., a knowledge-based company of Universidad de Sevilla, for their collaboration in digital image processing.
Conflicts of Interest
The authors declare no conflicts of interest.
References
- Basu, A.; Paul, S.; Ghosh, S.; Das, S.; Chanda, B.; Bhagvati, C.; Snasel, V. Digital Restoration of Cultural Heritage with Data-Driven Computing: A Survey. IEEE Access 2023, 11, 53939–53977. [Google Scholar] [CrossRef]
- Thenkabail, P.S. Remote Sensing Handbook, Volume III; CRC Press: Boca Raton, FL, USA, 2024; ISBN 9781003541165. [Google Scholar]
- Tiwari, S.; Agarwal, S.; Trang, A. Buried Mine Detection in Airborne Imagery Using Co-Occurrence Texture Features. In Proceedings of the Defense and Security Symposium, Detection and Remediation Technologies for Mines and Minelike Targets XII, Orlando, FL, USA, 27 April 2007; Harmon, R.S., Broach, J.T., Holloway, J.H., Jr., Eds.; Society of Photo-Optical Instrumentation Engineers (SPIE): Orlando, FL, USA, 2007; Volume 6553, p. 65530Z. [Google Scholar]
- Kior, A.; Yudina, L.; Zolin, Y.; Sukhov, V.; Sukhova, E. RGB Imaging as a Tool for Remote Sensing of Characteristics of Terrestrial Plants: A Review. Plants 2024, 13, 1262. [Google Scholar] [CrossRef] [PubMed]
- Pons, X.; Padró, J.-C. An Operational Radiometric Correction Technique for Shadow Reduction in Multispectral UAV Imagery. Remote Sens. 2021, 13, 3808. [Google Scholar] [CrossRef]
- Kim, S.; Truong, V.-D.; Lee, K.-H.; Yoon, J. Revolutionizing Robotic Depalletizing: AI-Enhanced Parcel Detecting with Adaptive 3D Machine Vision and RGB-D Imaging for Automated Unloading. Sensors 2024, 24, 1473. [Google Scholar] [CrossRef]
- Ruban, I.; Khudov, H.; Makoveichuk, O.; Khizhnyak, I.; Kalimulin, T.; Shamrai, N. The Technique for Detecting Zones of Interest in Satellites and Drones RGB Imagery. In Proceedings of the 2022 IEEE 3rd KhPI Week on Advanced Technology (KhPIWeek), Kharkiv, Ukraine, 3–7 October 2022; IEEE: New York, NY, USA, 2022; pp. 1–5. [Google Scholar]
- Hollesen, J.; Jepsen, M.S.; Harmsen, H. The Application of RGB, Multispectral, and Thermal Imagery to Document and Monitor Archaeological Sites in the Arctic: A Case Study from South Greenland. Drones 2023, 7, 115. [Google Scholar] [CrossRef]
- Sylaiou, S.; Tsifodimou, Z.-E.; Evangelidis, K.; Stamou, A.; Tavantzis, I.; Skondras, A.; Stylianidis, E. Redefining Archaeological Research: Digital Tools, Challenges, and Integration in Advancing Methods. Appl. Sci. 2025, 15, 2495. [Google Scholar] [CrossRef]
- Ramírez-Juidias, E.; Amaro-Mellado, J.-L.; Antón, D. Wavelet Analysis of a Sentinel-2 Time Series to Detect Land Use Changes in Agriculture in the Vega Alta of the Guadalquivir River: Cantillana Case Study (Seville). Remote Sens. 2023, 15, 5225. [Google Scholar] [CrossRef]
- Vélez, S.; Martínez-Peña, R.; Castrillo, D. Beyond Vegetation: A Review Unveiling Additional Insights into Agriculture and Forestry through the Application of Vegetation Indices. Multidiscip. Sci. J. 2023, 6, 421–436. [Google Scholar] [CrossRef]
- Abdul-Al, M.; Kyeremeh, G.K.; Qahwaji, R.; Ali, N.T.; Abd-Alhameed, R.A. A Novel Approach to Enhancing Multi-Modal Facial Recognition: Integrating Convolutional Neural Networks, Principal Component Analysis, and Sequential Neural Networks. IEEE Access 2024, 12, 140823–140846. [Google Scholar] [CrossRef]
- Youssef, D.; Motto-Ros, V.; Abdel-Harith, M. Machine Learning-Based Novel Approach of Image Analysis in LIBS Elemental Mapping for Discriminating Archeological Human Bone. Spectrochim. Acta Part B At. Spectrosc. 2025, 224, 107108. [Google Scholar] [CrossRef]
- Nassif, A.B.; Talib, M.A.; Nasir, Q.; Dakalbab, F.M. Machine Learning for Anomaly Detection: A Systematic Review. IEEE Access 2021, 9, 78658–78700. [Google Scholar] [CrossRef]
- Djurdjevac Conrad, N.; Tonello, E.; Zonker, J.; Siebert, H. Detection of Dynamic Communities in Temporal Networks with Sparse Data. Appl. Netw. Sci. 2025, 10, 1. [Google Scholar] [CrossRef]
- Glascock, M.D.; MacDonald, B.L. Multivariate Analysis in Archaeology. In Handbook of Archaeological Sciences; Wiley: Hoboken, NJ, USA, 2023; pp. 1183–1192. [Google Scholar]
- Cacciari, I.; Pocobelli, G.F. Machine Learning: A Novel Tool for Archaeology. In Handbook of Cultural Heritage Analysis; Springer International Publishing: Cham, Switzerland, 2022; pp. 961–1002. [Google Scholar]
- Lu, S.; Guo, J.; Zimmer-Dauphinee, J.R.; Nieusma, J.M.; Wang, X.; vanValkenburgh, P.; Wernke, S.A.; Huo, Y. Vision Foundation Models in Remote Sensing: A Survey. IEEE Geosci. Remote Sens. Mag. 2025, 2–27. [Google Scholar] [CrossRef]
- Samadzadegan, F.; Toosi, A.; Dadrass Javan, F. A Critical Review on Multi-Sensor and Multi-Platform Remote Sensing Data Fusion Approaches: Current Status and Prospects. Int. J. Remote Sens. 2025, 46, 1327–1402. [Google Scholar] [CrossRef]
- Serrano Vargas, A.; Hernández González, S. Libros y Estudios Locales En La Provincia de Sevilla: Repertorio Bibliográfico Sobre Los Pueblos de La Sierra Norte de Sevilla. In Proceedings of the Actas del VII Encuentro Provincial de Investigadores Locales, Sevilla, Spain, 29–30 May 2009; Reina Macías, J., Ed.; Diputación de Sevilla, Casa de la Provincia: Seville, Spain, 2010. [Google Scholar]
- Agencia Andaluza de Instituciones Culturales. Consejería de Cultura y Deporte. Junta de Andalucía La Consejería de Cultura Intervendrá En Las Termas y La Calle Sur Del Enclave Arqueológico de Munigua. Available online: https://www.juntadeandalucia.es/cultura/enclaves/noticias/la-consejería-de-cultura-intervendrá-en-las-termas-y-la-calle-sur-del-enclave-arqueológico (accessed on 15 May 2025).
- Hinojo de la Rosa, J. Romanización de Munigua. In La Vega del Guadalquivir: Actas I Jornadas de Historia sobre la Provincia de Sevilla: Villaverde del Río, Cantillana y Alcalá del Río 1; Fílter Rodríguez, J.A., García Fernández, M., Eds.; Asociación Provincial Sevillana de Cronistas e Investigadores Locales: Seville, Spain, 2004; Volume 1, pp. 149–158. ISBN 84-609-2789-X. [Google Scholar]
- Ordóñez Agulla, S. Panorama de La Romanización En La Vega Del Guadalquivir. In La Vega del Guadalquivir: Actas I Jornadas de Historia sobre la Provincia de Sevilla: Villaverde del Río, Cantillana y Alcalá del Río 1; Fílter Rodríguez, J.A., García Fernández, M., Eds.; Asociación Provincial Sevillana de Cronistas e Investigadores Locales: Seville, Spain, 2004; Volume 1, pp. 23–46. ISBN 84-609-2789-X. [Google Scholar]
- Empresa Pública para la Gestión del Turismo y del Deporte de Andalucía S.A. Consejería de Turismo y Andalucía Exterior. Junta de Andalucía Enclave Munigua. Available online: https://www.andalucia.org/listing/enclave-munigua/16610102/ (accessed on 15 May 2025).
- Schattner, T.G. Munigua: Un Recorrido Por La Arqueología Del Municipium Flavium Muniguense; Consejería de Cultura y Patrimonio Histórico; Junta de Andalucía: Seville, Spain, 2019; ISBN 978-84-9959-327-2. [Google Scholar]
- Parejo, J. Munigua: La Espectacular Ciudad Romana a Una Hora de Sevilla. Available online: https://www.diariodesevilla.es/sevilla/Munigua-espectacular-ciudad-romana-1-hora-sevilla-video_0_1508549457.html (accessed on 29 July 2025).
- Agencia Andaluza de Instituciones Culturales. Consejería de Cultura y Deporte. Junta de Andalucía Enclave Arqueológico Munigua. Available online: https://www.juntadeandalucia.es/cultura/enclaves/enclave-arqueologico-munigua (accessed on 15 May 2025).
- Instituto Andaluz del Patrimonio Histórico (IAPH). Paisaje de Mulva (Sevilla); Instituto Andaluz del Patrimonio Histórico (IAPH), Conserjería de Cultura y Deporte, Junta de Andalucía: Seville, Spain, 2016. [Google Scholar]
- Coarelli, F. Munigua, Praeneste e Tibur i Modelli Laziali Di Un Municipio Della Baetica. Lucentum 1987, 6, 91–100. [Google Scholar] [CrossRef]
- Ordóñez Agulla, S.M. Aproximación a La Romanización En La Sierra Norte de Sevilla. In Actas VI Jornadas de Historia sobre la Provincia de Sevilla: Sierra Norte; Fílter Rodríguez, J.A., Ed.; Asociación Provincial Sevillana de Cronistas e Investigadores Locales: Sevilla, Spain, 2009; ISBN 978-84-613-6226-4. [Google Scholar]
- Hauschild, T. Los Templos Romanos de Munigua (Sevilla). Cuad. Arquit. Rom. 1991, 1, 133–143. [Google Scholar]
- CYBERGELO Munigua. Available online: https://commons.wikimedia.org/wiki/File:Munigua.jpg (accessed on 15 May 2025).
- Ministerio de Instrucción Pública y Bellas Artes. Decreto de 3 de Junio de 1931, Declarando Monumentos Históricos-Artísticos, Pertenecientes Al Tesoro Artístico Nacional, Los Que Se Indican; Ministerio de Instrucción Pública y Bellas Artes: Madrid, Spain, 1931; pp. 1181–1185. [Google Scholar]
- Jefatura del Estado. Ley 16/1985, de 25 de Junio, Del Patrimonio Histórico Español; Jefatura del Estado: Madrid, Spain, 1985. [Google Scholar]
- Junta de Andalucía. Ley 14/2007, de 26 de Noviembre, Del Patrimonio Histórico de Andalucía; Junta de Andalucía: Madrid, Spain, 2008. [Google Scholar]
- Instituto Geográfico Nacional Plan Nacional de Ortofotografía Aérea. Available online: https://pnoa.ign.es/ (accessed on 1 August 2025).
- Offroy, M.; Marchetti, M.; Kauffmann, T.H.; Bourson, P.; Duponchel, L.; Savarese, L.; Mechling, J.-M. Using Clustering as Pre-Processing in the Framework of Signal Unmixing for Exhaustive Exploration of Archaeological Artefacts in Raman Imaging. Talanta 2024, 274, 125955. [Google Scholar] [CrossRef] [PubMed]
- Coccato, A.; Caggiani, M.C. An Overview of Principal Components Analysis Approaches in Raman Studies of Cultural Heritage Materials. J. Raman Spectrosc. 2024, 55, 125–147. [Google Scholar] [CrossRef]
- Bowman, L.A.; Narayanan, R.M.; Kane, T.J.; Bradley, E.S.; Baran, M.S. Vehicle Detection and Attribution from a Multi-Sensor Dataset Using a Rule-Based Approach Combined with Data Fusion. Sensors 2023, 23, 8811. [Google Scholar] [CrossRef] [PubMed]
Disclaimer/Publisher’s Note: The statements, opinions and data contained in all publications are solely those of the individual author(s) and contributor(s) and not of MDPI and/or the editor(s). MDPI and/or the editor(s) disclaim responsibility for any injury to people or property resulting from any ideas, methods, instructions or products referred to in the content. |
© 2025 by the authors. Licensee MDPI, Basel, Switzerland. This article is an open access article distributed under the terms and conditions of the Creative Commons Attribution (CC BY) license (https://creativecommons.org/licenses/by/4.0/).