Article

Extending SETSM Capability from Stereo to Multi-Pair Imagery

1
Byrd Polar and Climate Research Center, The Ohio State University, Columbus, OH 43016, USA
2
School of Earth Sciences, The Ohio State University, Columbus, OH 43016, USA
*
Author to whom correspondence should be addressed.
Remote Sens. 2025, 17(18), 3206; https://doi.org/10.3390/rs17183206
Submission received: 25 July 2025 / Revised: 9 September 2025 / Accepted: 15 September 2025 / Published: 17 September 2025
(This article belongs to the Section Remote Sensing Image Processing)

Abstract

Highlights

What are the main findings?
  • Extended SETSM with multi-pair image matching for improved DSM generation.
  • Object-based 3D KWHE algorithm for optimal height estimation across multiple heights.
What is the implication of the main finding?
  • SETSM multiple-pair matching procedure effectively resolves occlusions and enhances DSM quality, while retaining the strengths of the stereopair SETSM algorithm.
  • The developed 3D KWHE algorithm significantly reduces surface roughness and noise while preserving edge information in DSM.

Abstract

The Surface Extraction by TIN-based Search-space Minimization (SETSM) algorithm provides automatic generation of stereo-photogrammetric Digital Surface Models (DSMs) from single stereopairs of stereoscopic images (i.e., stereopairs), eliminating the need for terrain-dependent parameters. SETSM has been extensively validated through the ArcticDEM and Reference Elevation Models for Antarctica (REMA) DSM mapping projects. To enhance DSM coverage, quality, and accuracy by addressing stereopair occlusions, we expand the capabilities of the SETSM algorithm from single stereopair to multiple-pair matching. Building on SETSM’s essential components, we present a SETSM multiple-pair matching procedure (SETSM MMP) that modifies 3D voxel construction, similarity measurement, and blunder detection, among other components. A novel Three-Dimensional Kernel-based Weighted Height Estimation (3D KWHE) algorithm specialized for SETSM accurately determines optimal heights and reduces surface noise. Additionally, an adaptive pixel-to-pixel matching strategy mitigates the effect of differences in ground sample distance (GSD) between images. Validation using space-borne Worldview-2 and air-borne DMC multiple images over urban landscapes, compared to USGS lidar DSM, confirms improved height accuracy and matching success rates. The results from the DMC air-borne images demonstrate efficient elimination of occlusions. SETSM MMP enables high-quality DSM generation in urban environments while retaining the original, single-stereopair SETSM’s high performance.

1. Introduction

The Surface Extraction by TIN-based Search-space Minimization (SETSM) algorithm retrieves high-resolution Digital Surface Models (DSMs) from single pairs of stereoscopic satellite images [1]. It is capable of automatically generating high-quality DSMs over all land surfaces, including those of polar regions and deserts, without predefined parameters. The quality and accuracy of SETSM DSMs have been validated through the ArcticDEM [2] and Reference Elevation Model of Antarctica (REMA) [3] projects, producing the first very-high resolution (2 m) DSMs at continental scales. The stereopair SETSM algorithm incorporates unique functionalities to support fully automated DSM generation by minimizing the need for manual intervention. It employs a coarse-to-fine strategy, calculates similarity between image features by integrating Geometrically corrected Normalized Cross-Correlation (GNCC) and Uncorrected Normalized Cross-Correlation (UNCC), iteratively minimizes the search space, and applies Triangulated Irregular Network (TIN)-based geometrically constrained blunder detection through object-based analysis. These components are systematically interlinked to ensure high-quality DSM generation, making their independent execution of individual functions impractical. Because of this object-based integrated complexity, expanding SETSM capability from stereo to multi-pair imagery requires tailored, object-based adaptations while preserving the strengths of the stereopair SETSM framework.
The quality of stereo-photogrammetric DSMs depends on the viewing direction and convergence angle between two images in a stereopair. Image looking directions closer to nadir have fewer occlusions and feature distortions, improving matching, but also a smaller convergence angle and less height accuracy. Multiple stereopairs provide more viewing angles, reducing occlusions, as well as more observations for similarity measurements between distinctive points. Through an appropriate multiple-image matching approach, the height accuracy and quality of DSMs can be improved by integrating the multiple heights from the multiple pairs. Resolving occlusions in DSMs enables applications such as automatic building mapping [4] and height estimation [5].
For implementing multiple image matching, deep-learning-based Convolutional Neural Networks (CNNs) locate corresponding features extracted through multiple channels and layers, generating disparity maps through a coarse-to-fine resolution, i.e., image pyramid, approach and multiple-cost aggregation using internal weights and unique parameters. (PSM-Net [6]). The group-wise correlation stereo network (GCS-Net [7]) groups candidate features between images and uses multiple levels to form high-dimensional feature representations. The Cost Volume Analysis Network (CVA-Net) estimates aleatoric uncertainty from 3D cost volumes [8]. Multi-view matching methodologies for 3D view reconstruction [9,10] based on CNNs combine the PSM-Net with image warping [11] approaches to directly estimate depth. These CNN-based methods require specific parameters and are sensitive to image textures, limiting their general applicability and automation in SETSM. To accurately extract deformed features by reducing the sensitivity based on CNNs, an edge deformable convolution with point set representation [12] and an end-to-end semisupervised detection method [13] are proposed.
Besides CNN-based methodologies, weighted disparities from multiple pairs, obtained from semi-global matching, are estimated by averaging all stereopair disparities [14]. Depth clustering to remove outliers and the multi-directional cost aggregation are applied with triplet similarity measurements [15]. Triangle mesh-based multiple cost aggregation is introduced for extracting the optimal depth based on semi-global matching [16]. To minimize photometric image matching errors, a 3D surface mesh refinement method for urban-area reconstruction is proposed [17]. These multiple cost aggregation methods rely on statistical information of observations, not considering physical stereo model accuracy.
In addition, depth/disparity refinement/merging algorithms based on stereopair results can be performed with geometric consistency checks [18,19]. The geometric consistency check is not applicable to SETSM, since the matching templates projected by the search heights in the Vertical Line Locus (VLL [20]) remain unchanged between stereo images. Based on the VLL approach, the averaged, Normalized Cross-Correlations (NCCs) from individual NCCs are applied to determine the optimal heights along the NCC profile, and a probability relaxation algorithm is used to preserve surface smoothness [21]. Instead of using the object-based height increment (dh) to form the NCC profile, pixel-based image segments on the reference image are searched to configure the NCC profile [22]. A Matching Distance Error (MDE) complements the limitation of NCCs from all the stereopairs and is the matching indicator in VLL [23]. The semi-global multi-directional cost aggregation, with the averaged NCC costs calculated from the rectified patches, is applied with the guidance of the orthorectified images to resolve occlusions [24]. These VLL-based methods use global dh or pixel segments regardless of stereo model accuracy and GSD discrepancy, resulting in a loss of matching accuracy or increasing computational loads.
Multiple rectified images or patches projected by layered horizontal planes are utilized to minimize image distortion and to find optimal heights with independent statistics of each voxel [11] or averaged similarity computed through multi-window matching [25]. The horizontal-plane rectified images are advantageous for matching on flat surfaces but are not suitable for continuously slanted surfaces such as mountain slopes.
Strategies and methods for multiple-image/multiple-pair depth maps or DSM generation algorithms are largely dependent on the characteristics of the stereopair matching strategy and the algorithm specified by its unique parameters, statistical information, and surface types; the adaptability of the preceding multiple-pair image matching methodology is limited to the SETSM algorithm. In addition, previous studies focus on minimizing vertical variations caused by independent outputs or aggregated cost functions from stereopairs over uniform surface textures. This is typically achieved through image-based analysis that estimates optimal surface heights or disparities by enhancing the connectivity of adjacent, texture-similar regions. However, object-based approaches, essential for extending SETSM functionality from stereo to multi-pair processing, remain underdeveloped and insufficiently addressed in current multi-pair matching.
Here, we extended SETSM’s functionality to multiple-pair DSM generation, building upon the strengths of SETSM to provide fully automated, reliable, and robust matching performance over all land surfaces, independent of surface type. We explain the key modules of the single stereopair SETSM upon which we establish our strategy to support a multiple-pair matching procedure. We then present the new methodologies for (1) estimating multiple optimal heights from multiple pairs by considering stereo model accuracy and the GSD discrepancy between images, and (2) extracting final optimal heights from the multiple optimal heights through a novel, object-based 3D Kernel-based Weighted Height Estimation (3D KWHE) approach that accounts for viewing geometry accuracy and feature similarity. Our test data include space-borne WorldView-2 and air-borne DMC imagery, as well as a reference LiDAR DSM for accuracy assessment. The quality and accuracy of the SETSM MMP DSMs are validated according to image viewing geometry and occlusion recovery.

2. Methods

The SETSM stereophotogrammetric algorithm includes the following key components based on the object space domain and coarse-to-fine strategy [1]:
  • The use of VLL to geometrically constrain matching features between images and apply object–space matching (no further update).
  • Object–space matching to iteratively update the surface model and remove the dependency of the epipolar-resampled images on the VLL (no further update).
  • Integrated similarity measurements through complimentary weighted normalized cross-correlation (WNCC) and uncorrected NCC (UNCC) from the original images and geometrically corrected NCC (GNCC) from geometrically corrected images (detailed in Section 2.2).
  • Minimization of feature orientations by the modified keypoint descriptor of the Scale-Invariant Feature Transformation (SIFT) method (detailed in Section 2.2).
  • Detection and removal of blunders and outliers with geometric constraints provided by the Triangulated Irregular Network (TIN) structure (detailed in Section 2.4).
  • Search-space minimization is based on the TIN structure to minimize the matching ambiguity due to repetitive textures and low-contrast surfaces (detailed in Section 2.4).
Components A and B are fundamental and geometrical strategies for object space matching and can be utilized for multiple pair matching without further modifications. Components C and D are employed for matching and extracting optimal heights from the WNCC profiles created between single stereopairs. In the context of a multiple-pair matching algorithm, there are two potential approaches for the application of WNCC profiles. The first approach involves merging all the pairwise similarities to create a single merged WNCC profile. The second approach entails identifying the optimal height on the WNCC profile for each stereopair and subsequently estimating a weighted optimal height based on the multiple optimal heights. The VLL approach necessitates the definition of a height increment (dh) to establish 3D voxels along the vertical line in object space. The value of dh plays a crucial role in determining matching accuracy and computational efficiency. When dealing with multiple pairs configuring various convergence angles, multiple dh values are inevitable. This poses a challenge to find a single optimal dh to compose a merged WNCC profile at a Matching Position (MP). If the optimal dh is too large for a stereopair with a wide convergence angle, the matching process may suffer from a loss of accuracy. Conversely, using a too-small dh can significantly increase the computational load. Consequently, the first method of merging WNCC profiles is not the optimal method. Therefore, we use the second approach of estimating a weighted optimal height based on the multiple optimal heights, and further details are described in Section 2.2. Component E is applied to address blunders and outliers among the candidate optimal heights obtained from the WNCC profile. This approach involves classifying anchor and blunder points based on the GNCC. Additionally, when applying the weighted optimal height in multiple-pair matching (as described in the second method above), it is necessary to appropriately modify the geometric conditions related to the GNCC to enhance the quality and accuracy of the DSM in the multiple-pair matching algorithm. Finally, the component F updates and minimizes the search space at each MP using the TIN within proper height value buffers, as described in Section 2.4.
The workflow for the developed SETSM multiple-pair matching procedure (SETSM MMP) is shown in Figure 1. SETSM MMP uses the stereopair SETSM strategies of pyramid-level processing and the 3D voxel structure. The 3D voxel is defined by the height increment (dh) and the planimetric, object–space coordinate of the MPs, as defined by the specified output DSM resolution, DSM boundary, and pyramid level. The dh of each stereopair is independently determined based on the stereopair geometry. Similarities between features in a stereopair are measured using WNCC combined with GNCC and UNCC, estimated by the modified keypoint descriptor of the SIFT. As in the single stereopair SETSM algorithm, the optimal height at each MP is determined from the WNCC profile and the updated threshold of WNCCth along the VLL. In addition to the optimal heights of each stereopair, SETSM MMP utilizes supplemental optimal heights derived from merged WNCC profiles with all the stereopairs. A final optimal height is estimated by a novel object-based 3D Kernel-based Weighted Height Estimation (KWHE) from all the optimal heights at each MP. All subsequent procedures in the algorithm, including the blunder and outlier detection, object–space surface update, and output DSM generation, are the same as the single stereopair SETSM algorithm with minor modifications.

2.1. Source Imagery and Preprocessing

SETSM MMP can utilize both the Rational Function Model (RFM) with Rational Polynomial Coefficients (RPCs) and the Rigorous Sensor Model (RSM) derived from the exterior and interior orientations of the input images. In case of using satellite images with RFM RPCs, Ground Control Points (GCPs), which are required to improve the absolute accuracy of the supplied RPCs by a bundle adjustment, may not be available for the target regions. In this case, SETSM adopts a relative RPCs bias compensation method for improving DSM quality [1]. A reference image is required to relatively adjust the bias for each pair onto a reference coordinate. An image whose looking angle is close to nadir view is selected as the reference image for minimizing occluded regions, and stereopairs are configured with the reference image.

2.2. Estimation of Optimal Height at Each MP from Multiple Pairs

SETSM MMP utilizes multiple observations of optimal heights derived from each stereopair. The optimal heights are selected among the 3D voxels constructed with the dh and MPs. The dh is determined from stereopair geometry, and MPs are globally created with target DSM resolution and boundary coordinates. The dh at each pyramid level (dhlevel) for images with RPC sensor models is determined by comparing the height per pixel (hpp), which represents the height displacement proportional to the pixel, with the target height accuracy corresponding to pyramid image resolution (PIsrlevel), without considering the stereopair convergence angle. It is calculated as follows [1]:
d h l e v e l = M i n h p p l e v e l , P I s r l e v e l
h p p l e v e l   =         h p p × T a ,   level < 1 h p p × ( 2 · T a ) ,   level 1 , P I s r l e v e l =           P I r × T a ,     level < 1 P I r × ( 2 · T a ) ,     level 1
where PIr is the pyramid image resolution, and the superscript level refers to the integer pyramid level. The variable Ta is the expected height accuracy of the output DSM, adopted as 1/5 pixel. The height per pixel, hpp, is obtained from the following expression [2]:
h p p = M a x ( h p p p 1 , h p p p 2 )
h p p p 1 = i = 1 5 h p p i 5 p 1 , h p p p 2 = i = 1 5 h p p i 5 p 2
h p p i = h m a x h m i n L R F M ( ϕ i , λ i , h m a x ) L R F M ( ϕ i , λ i , h m i n ) 2 + S R F M ( ϕ i , λ i , h m a x ) S R F M ( ϕ i , λ i , h m i n ) 2
where subscripts p1 and p2 indicate the first and second stereo images. i represents one to five locations on the horizontal (XY) plane that constrain the area of overlap, including the central point and four corners. hmin and hmax are minimum and maximum heights determined from the sensor model. The projected line and sample image coordinates are LRFM and SRFM, with the corresponding object position (ϕ, λ, and h) given by the sensor model.
The expected height accuracy, σz, dependent on the ratio of the baseline between projection centers, B, and flying attitude, H, is approximated by the following expression:
σ z = 2 σ m ( B / H ) f H = 2 σ I ( B / H )
where σm and σI are the standard errors of the contributions to the image matching measurement in the image space unit of μm and the ground sample distance (GSD) in th3 object space unit of meters (same as Z). f is the sensor’s focal length in μm.
This expected height accuracy, σz, can be used as hpp in Equation (1) to determine dhlevel. In the case of satellite images, the convergence angle of the stereopair can be computed from the elevation and azimuth angles [26] and give the expected height accuracy by converting the convergence angle into the B/H ratio.
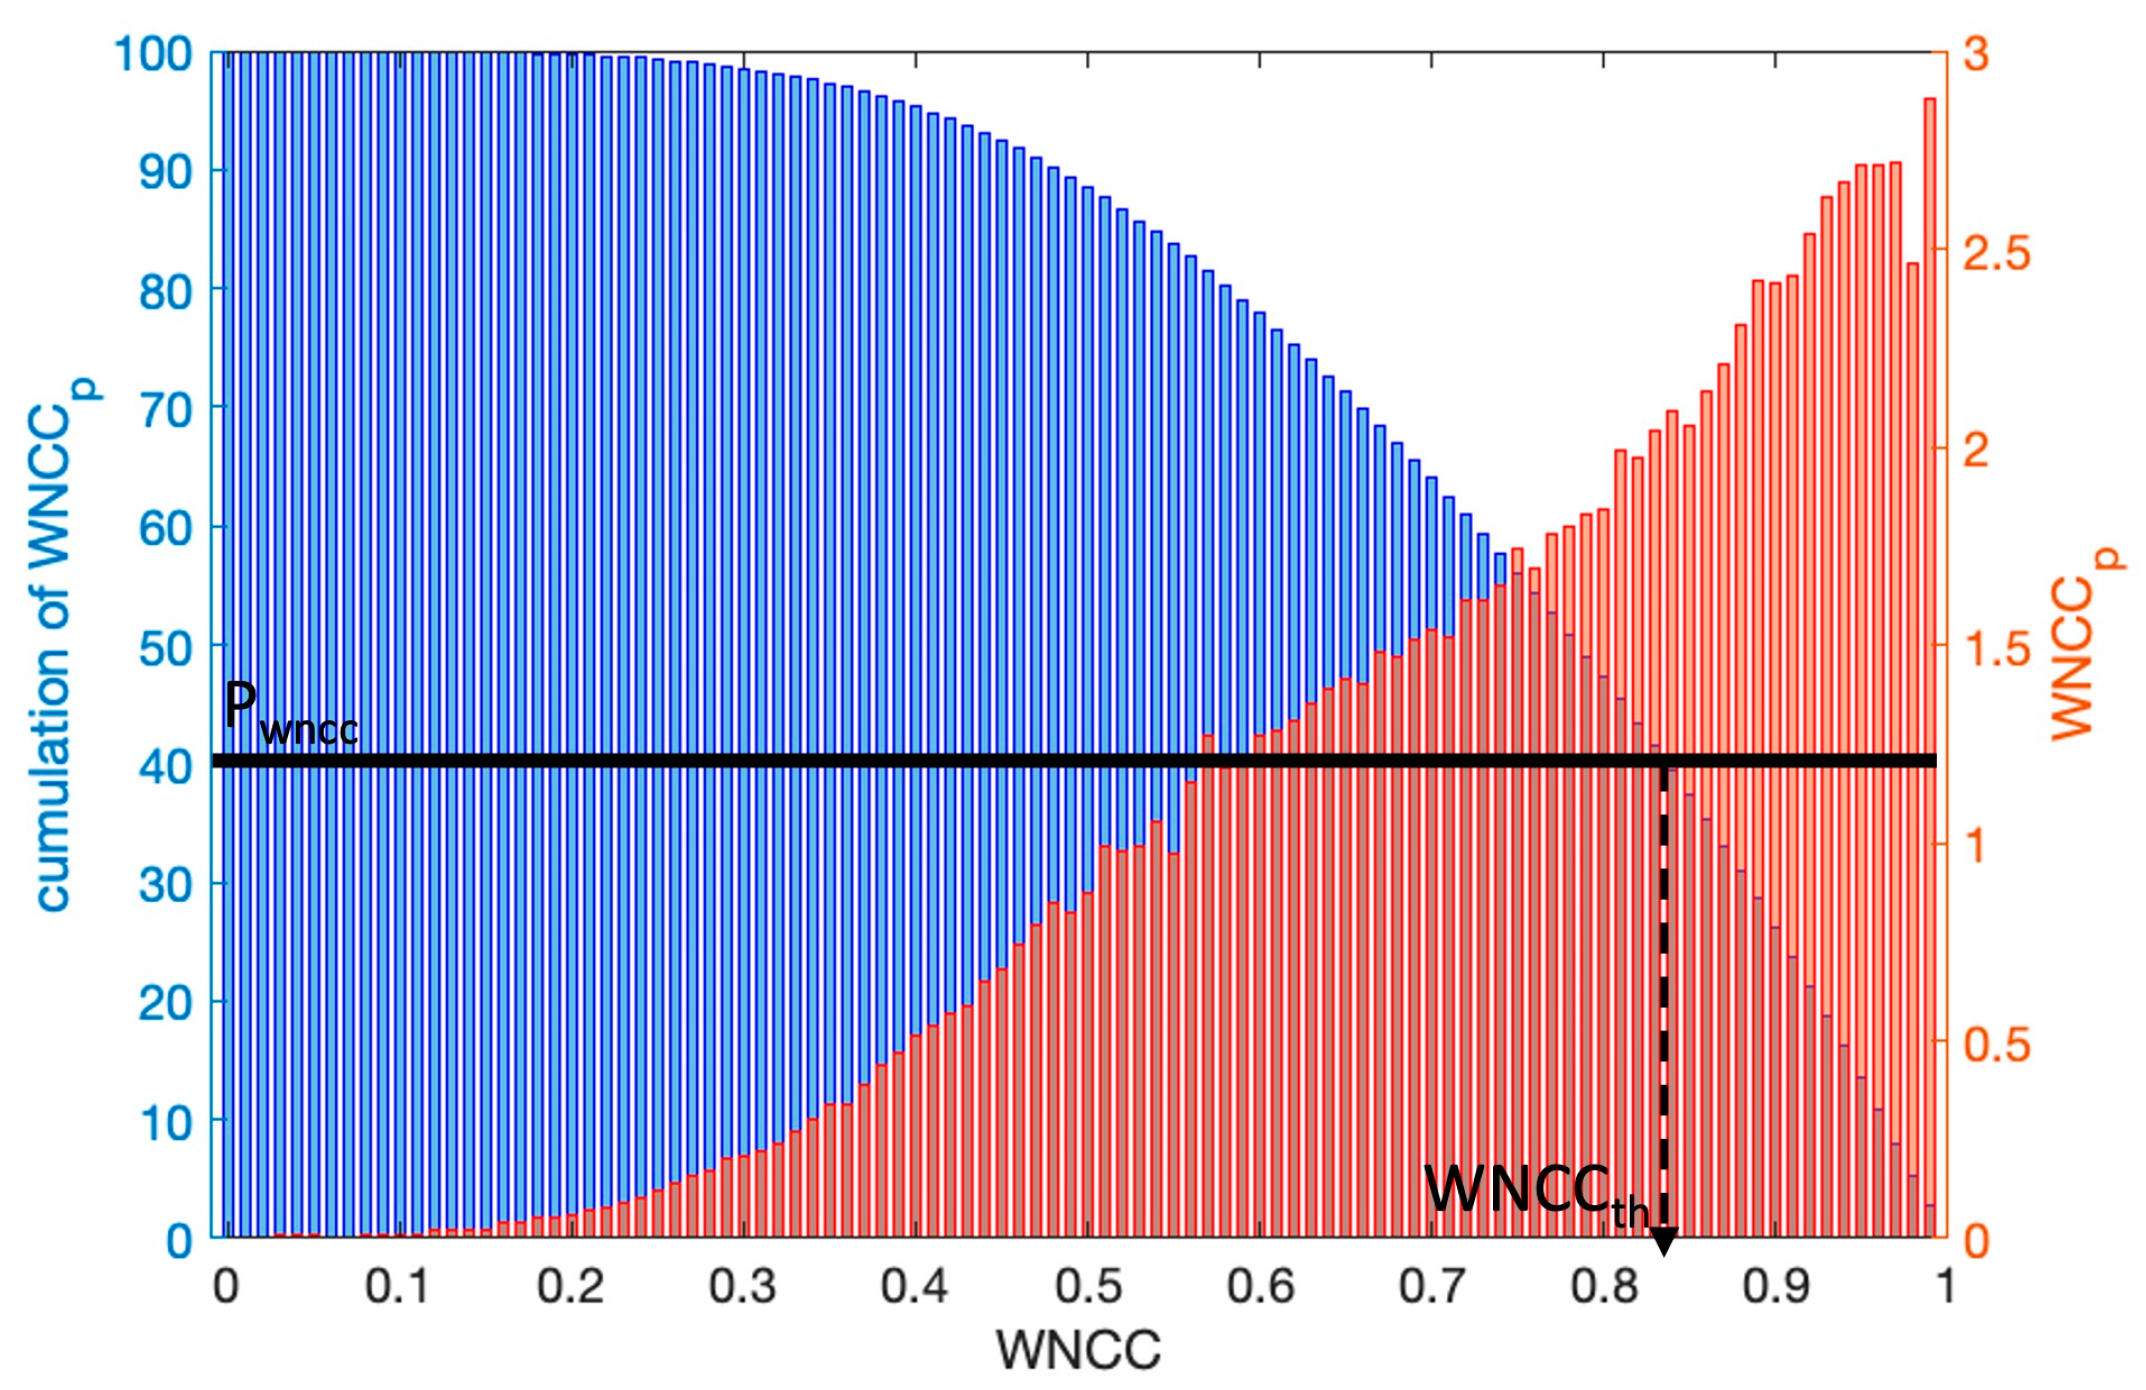
The 3D voxels, as defined by the dh of each stereopair, preserve the expected height accuracy of each stereopair and efficiently adapt the computation load to the needs of the specific pair. The similarity between corresponding image points projected from object positions defined by the 3D voxels is measured using WNCC. Optimal MP heights for each stereopair are selected along the WNCC profile according to the same criteria as in the SETSM single stereopair algorithm. The WNCC threshold value (WNCCth) for determining successful matches along the WNCC profile is newly developed to iteratively enhance feature matching accuracy across multiple stereopairs. It is statistically estimated using a histogram of the 1st highest peaks of the WNCC profile (WNCC1st_peak) across all MPs, as illustrated in Figure 2. The WNCC space (x-axis in Figure 2) is divided into intervals from 0 to 1.0 with a spacing of 0.1. Each MP is allocated into the WNCC space corresponding to the value of WNCC1st_peak. Then, the number of MPs in each interval is counted, and the percentage of the MPs (WNCCp) at each interval is determined from the total number of MPs. The cumulative WNCCp at each interval starting from the highest WNCC value of 1 is then calculated to find the WNCC value (WNCCth) corresponding to the cumulative percentage threshold (Pwncc) as shown in Figure 2. Since a higher Pwncc includes more potential matching points, the WNCCth value corresponding to Pwncc decreases as Pwncc increases. From an initial value of 40% at the first pyramid level, Pwncc is increased by 10% at each subsequent pyramid level, not exceeding 90%. With SETSM’s iterative search-space minimization and surface height refinement with a blunder and outlier detection algorithm, the incremental approach of Pwncc automatically improves the reliability of the optimal height selection at coarser levels with a higher WNCCth, extracting corresponding points with high similarity value, increasing detection of distinctive features and possible matches at finer levels with a lower WNCCth with the minimized search-space and blunders, which is for low-contrast textures. Coarse-level images result in higher similarity at corresponding points than finer-level images due to smoothing effects.
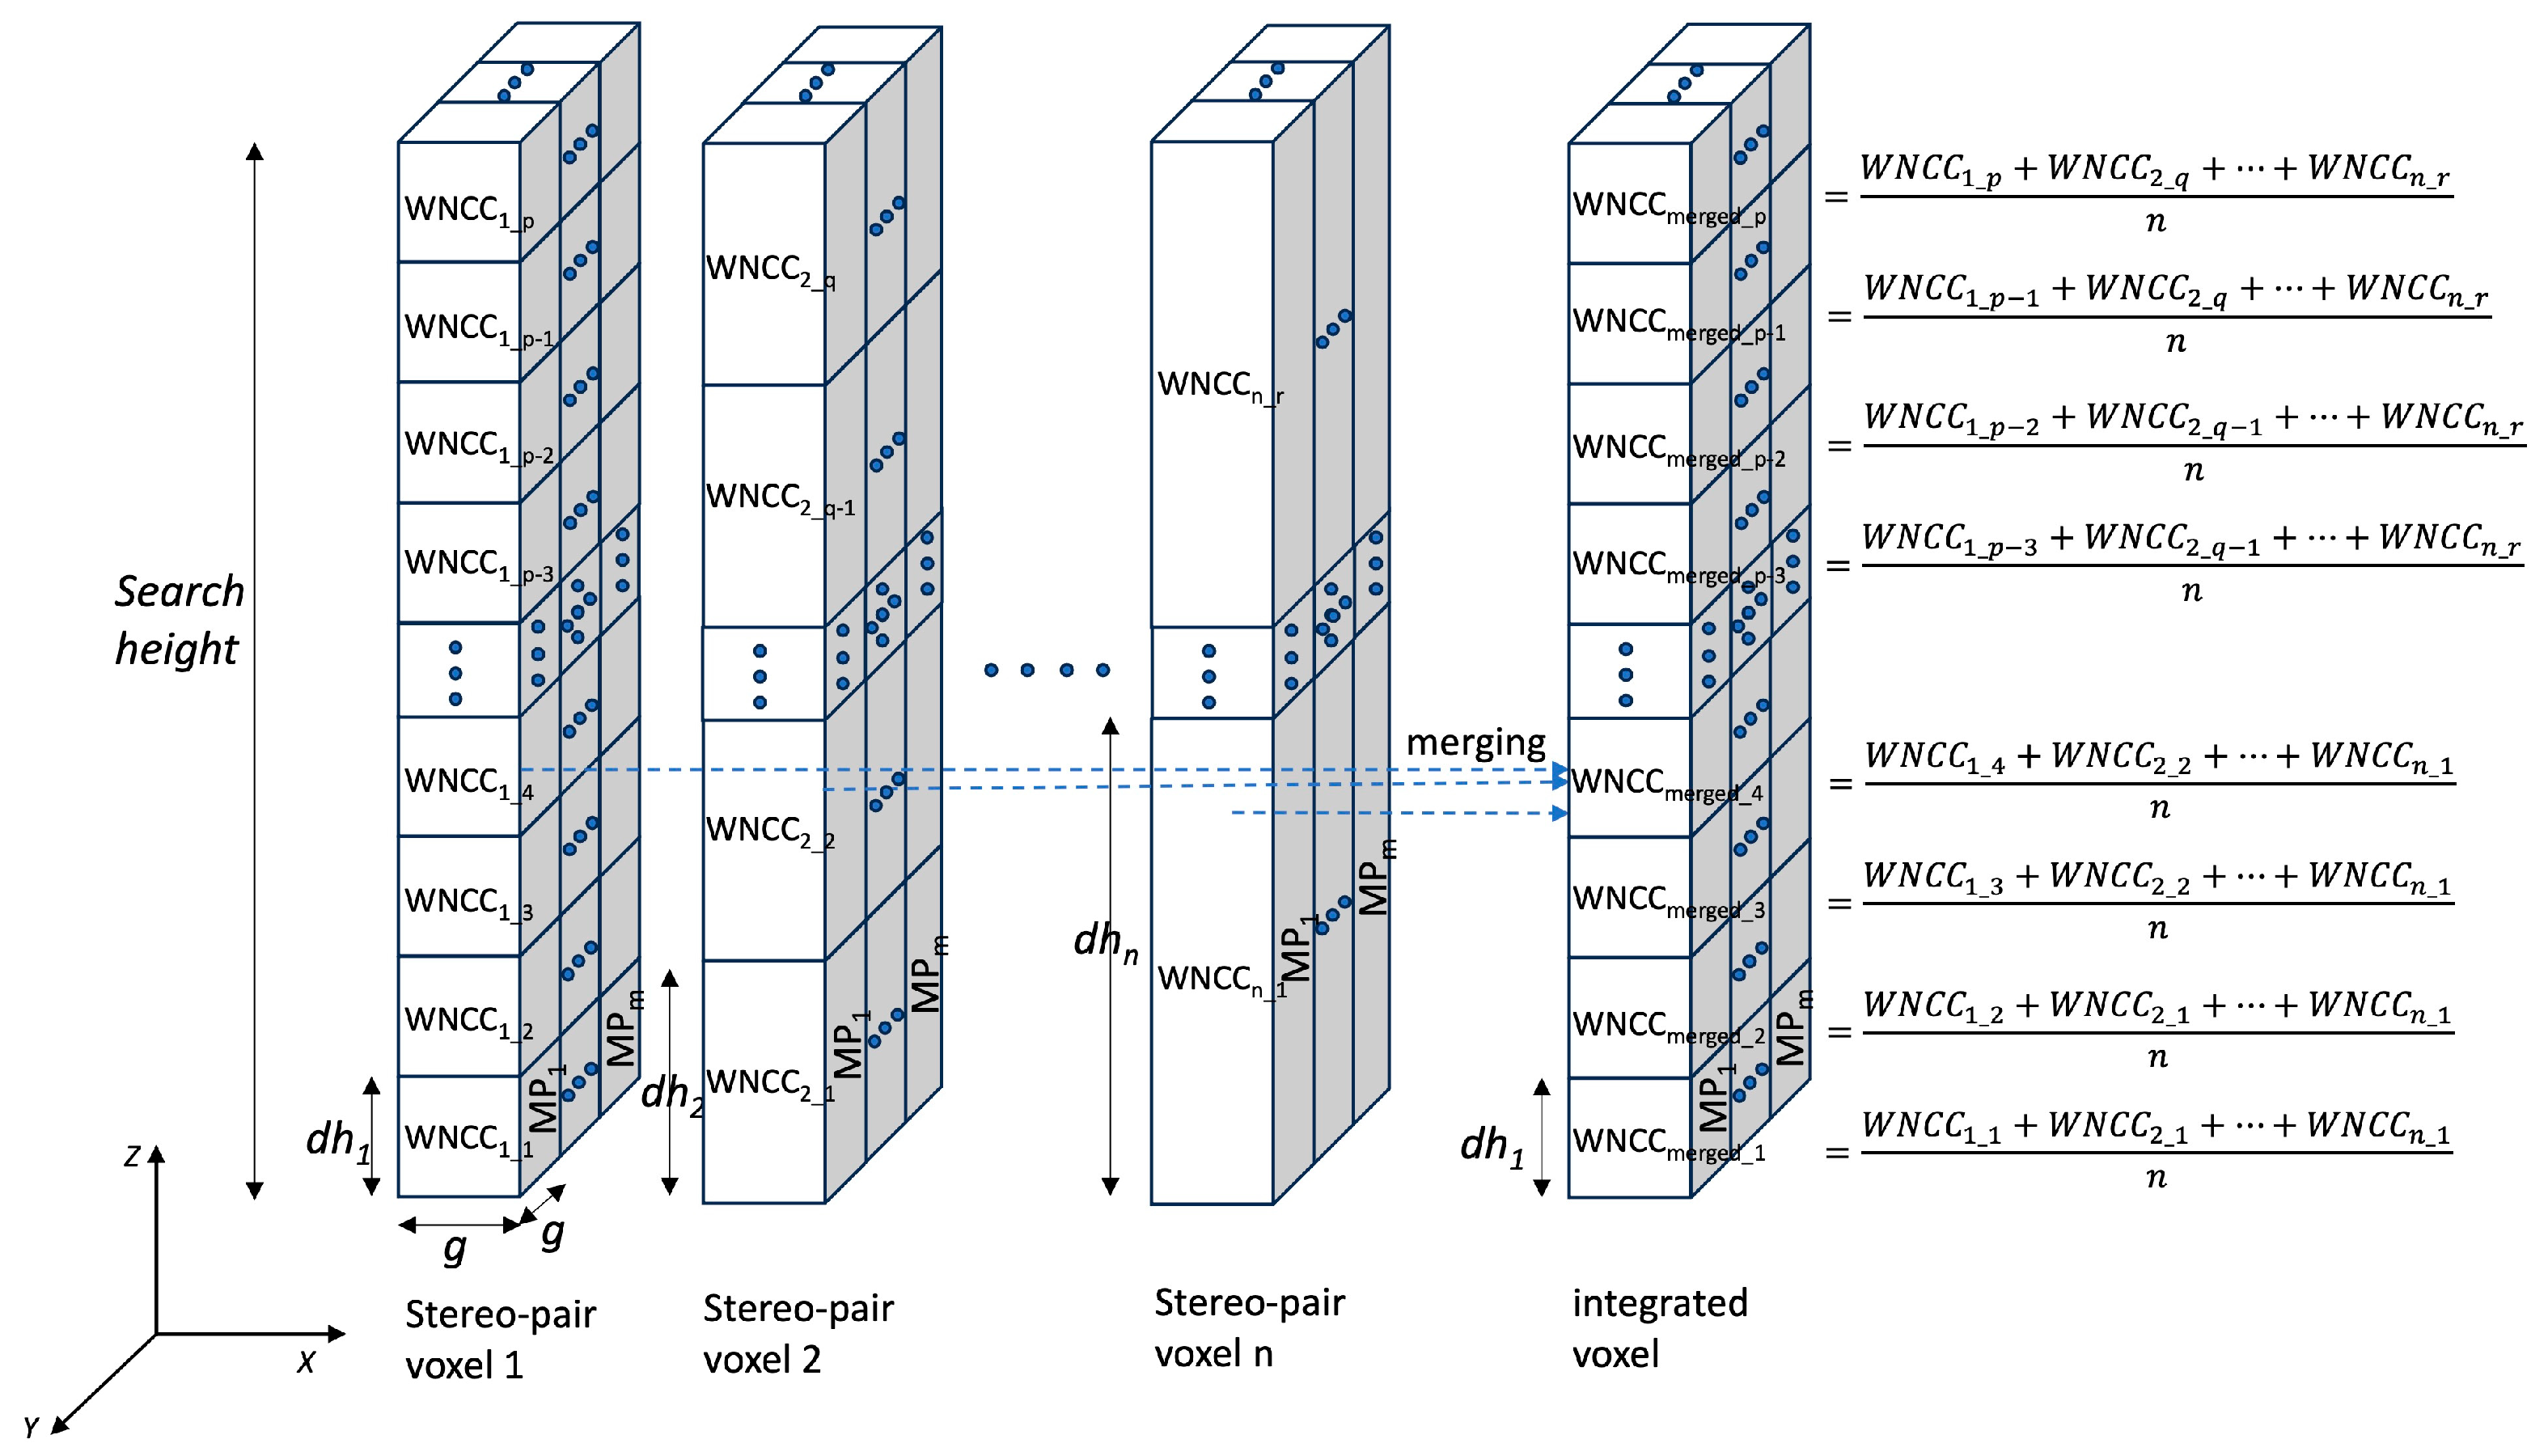
For supplemental observations, SETSM MMP adopts merged WNCC profiles to estimate smooth optimal heights from all the stereopairs. The minimum dh among all the stereopairs for constructing integrated 3D voxels to calculate the merged WNCC is selected to maintain the best height accuracy. Each WNCC in a stereopair 3D voxel is assigned to a corresponding position in the integrated 3D voxel. The merged WNCC is then calculated by averaging all the WNCCs into an integrated 3D voxel, as shown in Figure 3.
The WNCC similarity measurement uses image patches extracted with the same kernel size between stereopairs, comparing texture information on a pixel-to-pixel basis. Various off-nadir angles of satellite sensors result in differences in GSDs, which are regularly resampled by the provider from nonlinearly distorted pixel shapes, which impede alignment in pixel-to-pixel similarity measurements during area-based matching as described in Figure 4. To minimize this misalignment error, the positions of corresponding pixels are determined based on a ratio between GSDs, originating from the central position of the kernel. The central position is established by projecting the 3D voxel position.

2.3. Three-Dimensional Kernel-Based Weighted Height Estimation

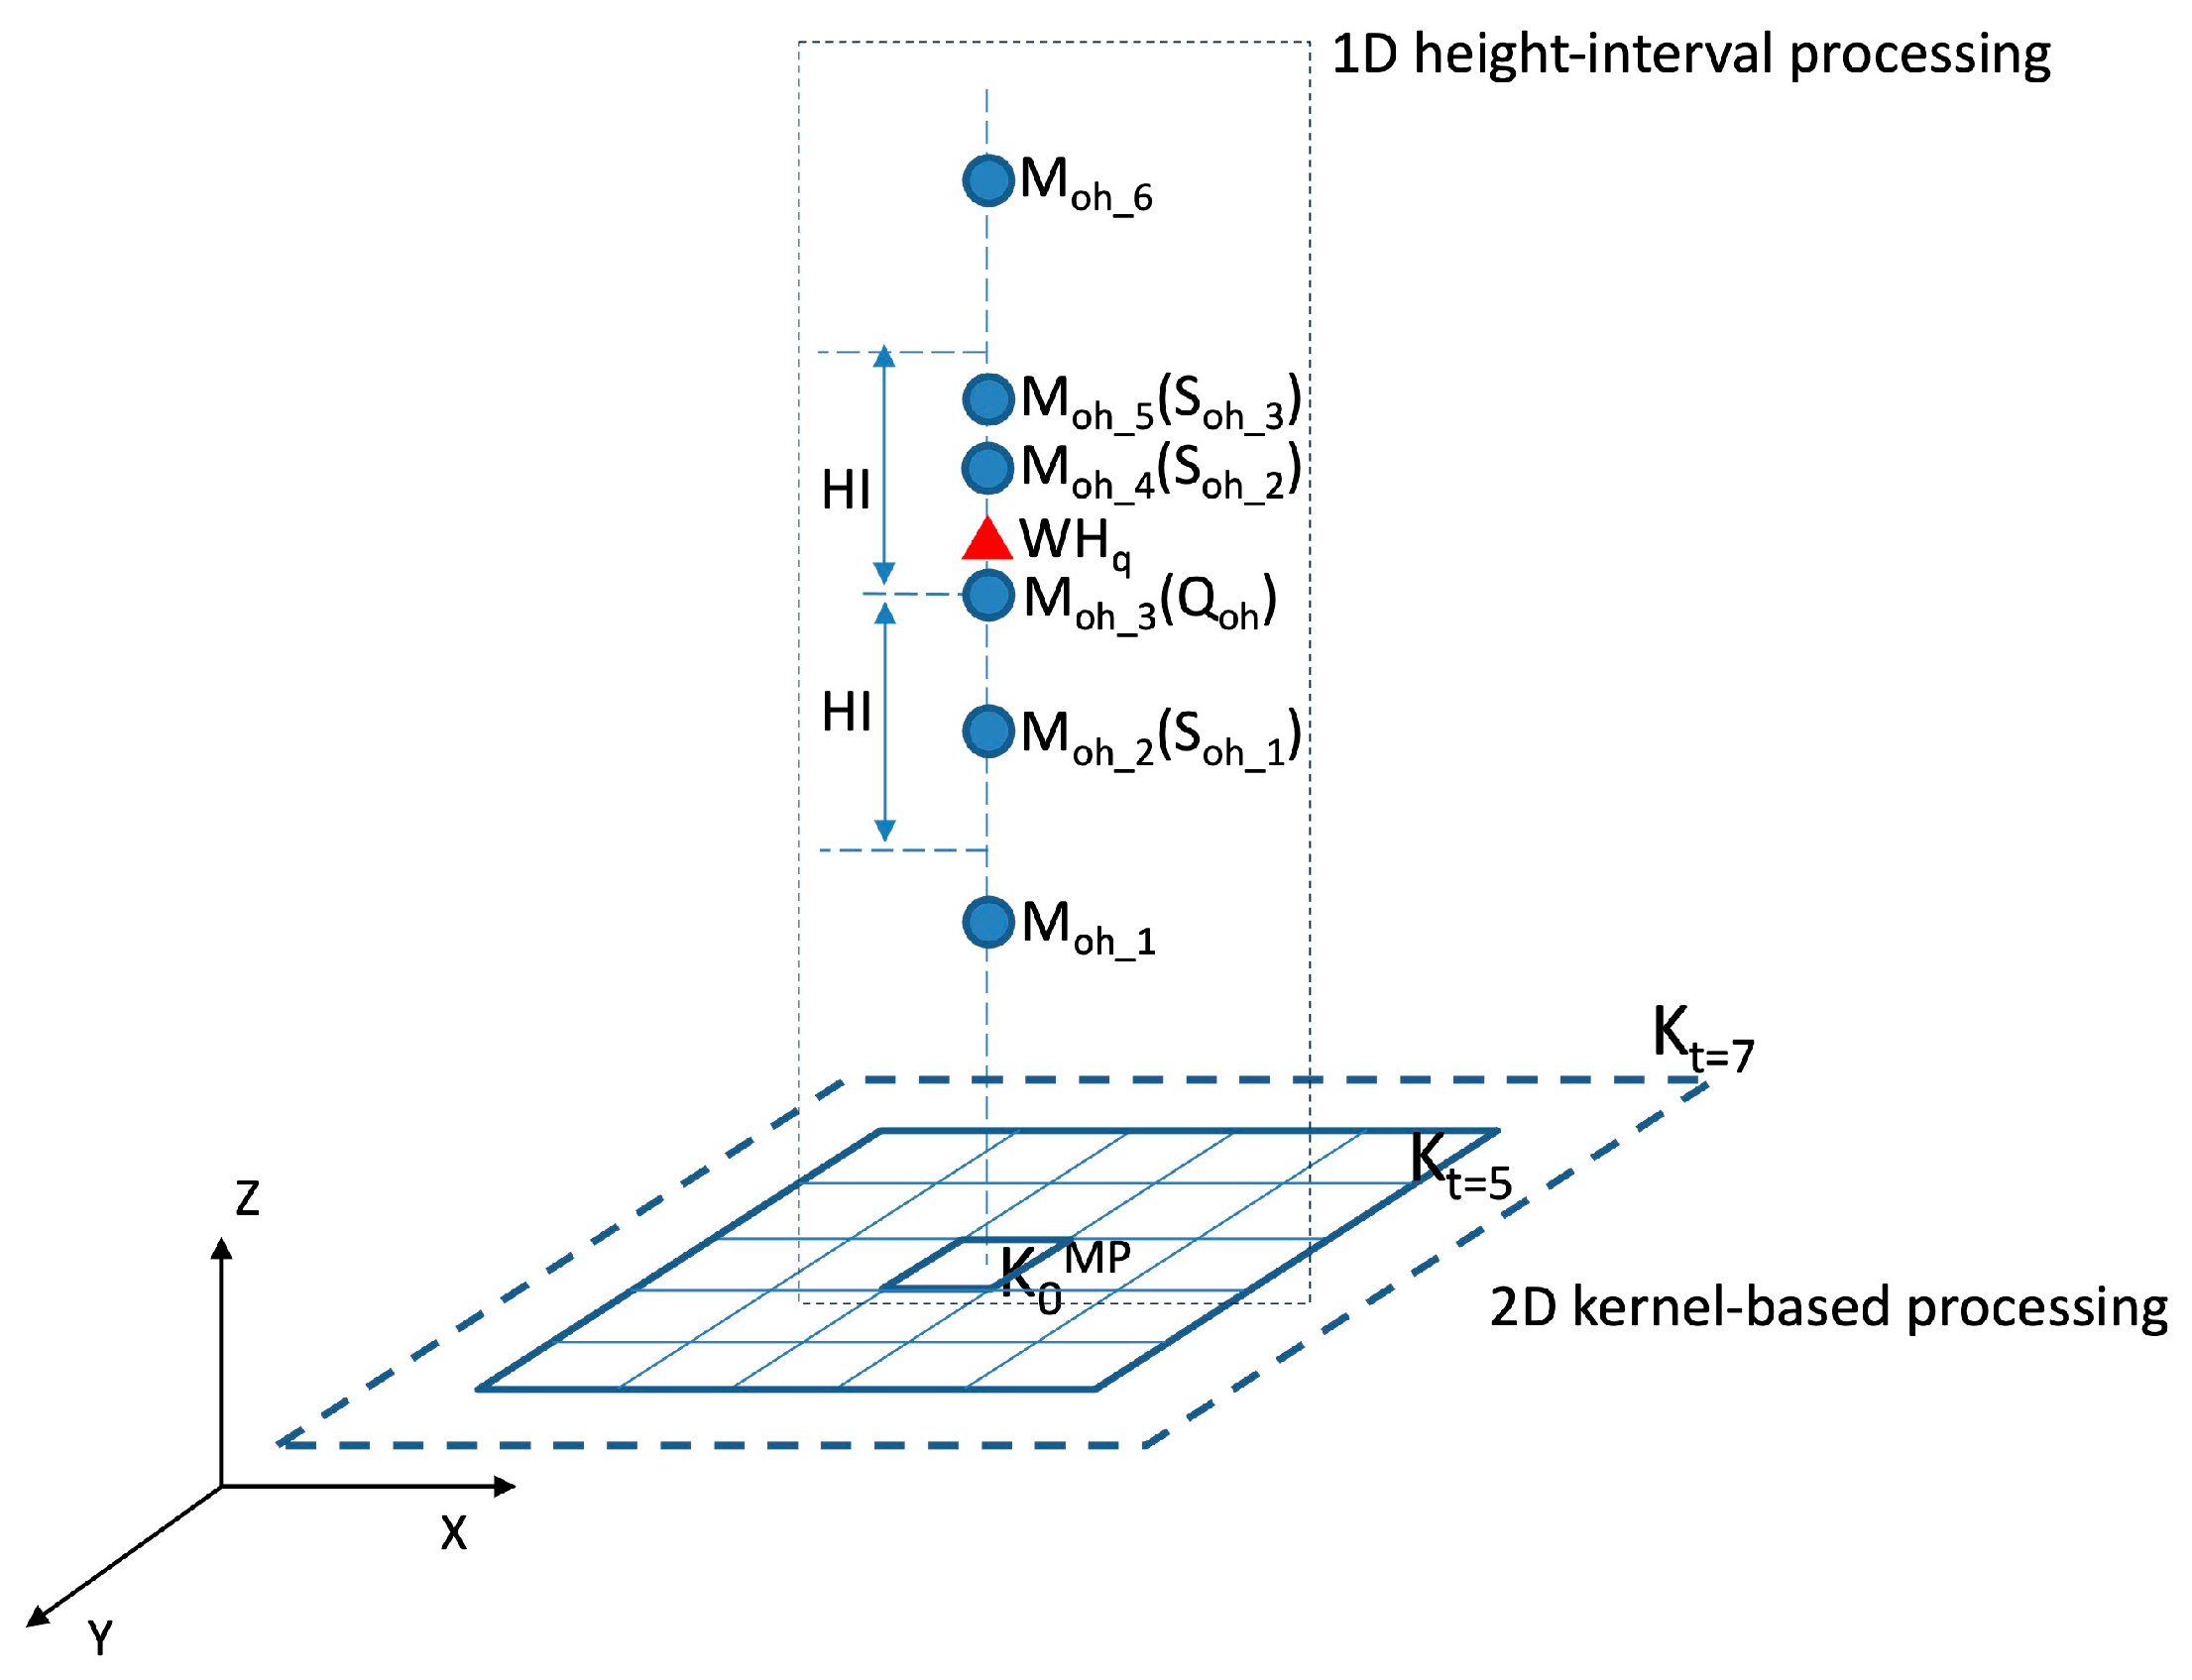
A 3D Kernel-based Weighted Height Estimation (KWHE) algorithm is developed to estimate the final optimal heights from the multiple optimal heights of all the pairs at all MPs through an object-based approach. This algorithm applies a 3D height estimation technique to improve the statistical reliability of the final optimal heights and comprises two main procedures as described in Figure 5. The first procedure involves a 1D height-interval processing in the vertical direction to estimate the most reliable optimal height at each MP. The second procedure involves 2D kernel-based processing on the XY horizontal plane for neighborhood-connected height estimation and surface noise reduction through the Local Surface Fitting (LSF) algorithm [27].
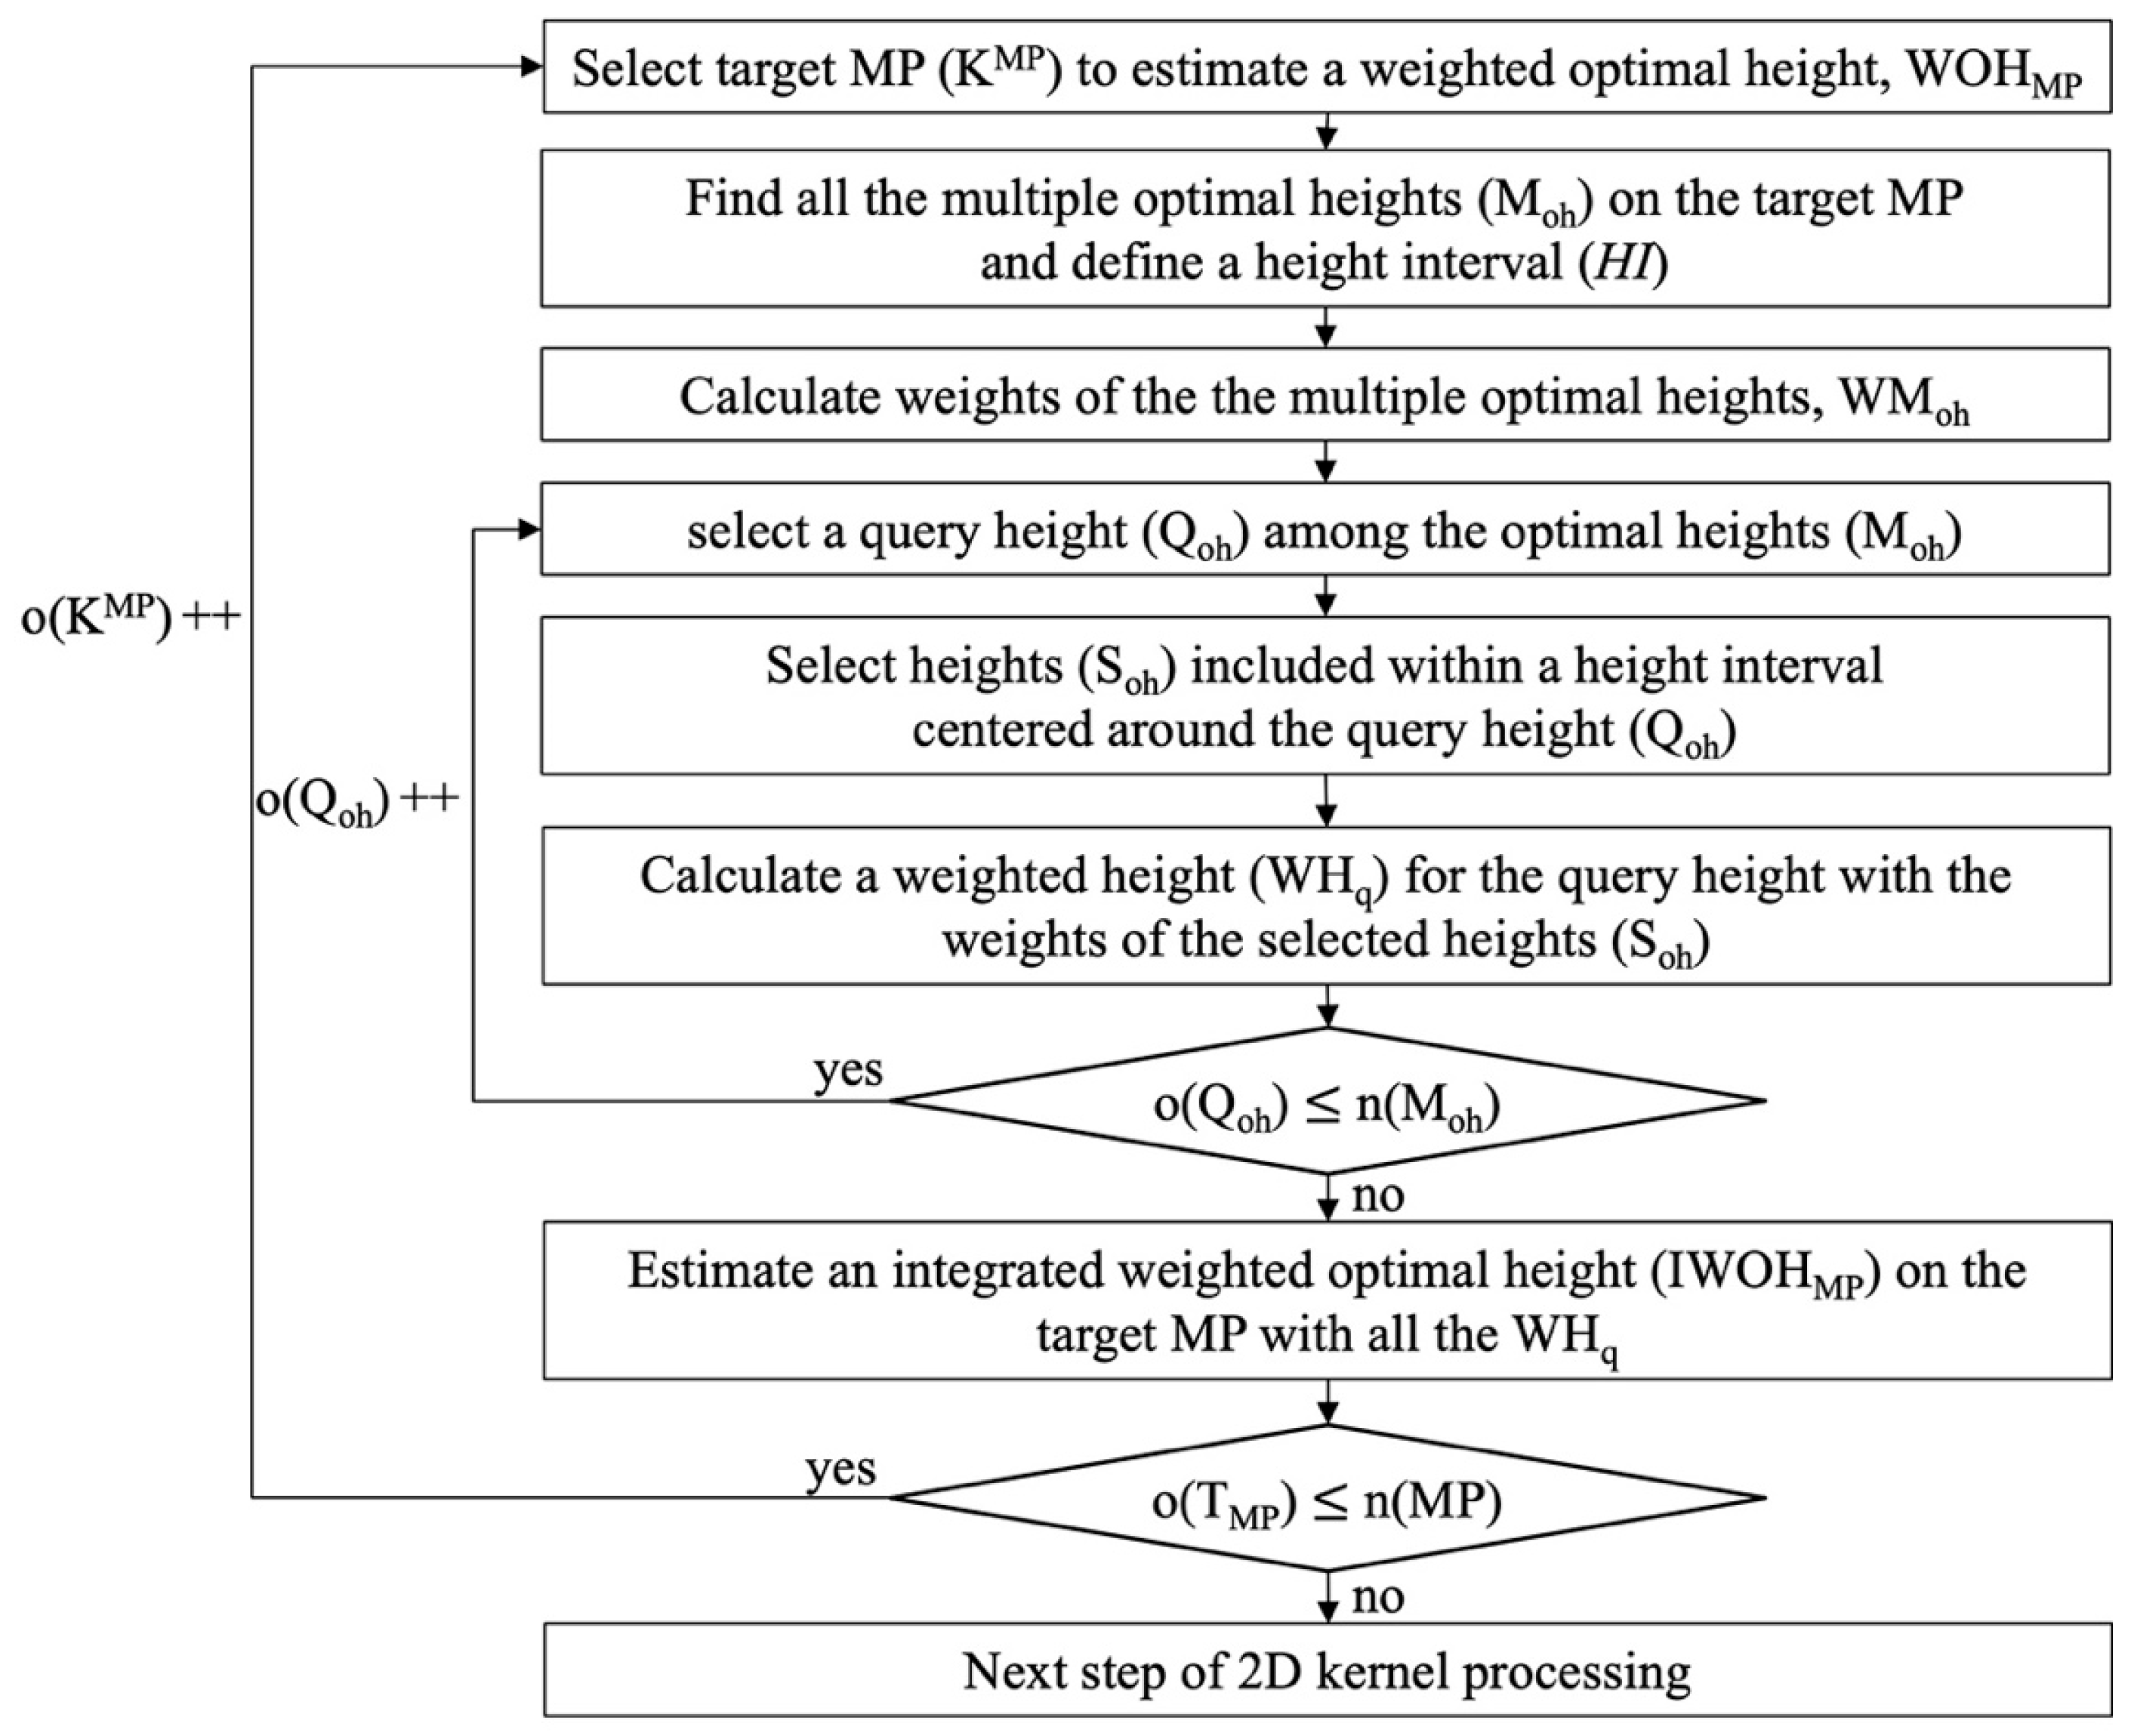
As shown in Figure 6, the height-interval processing in the vertical direction at each KMP starts with the multiple optimal heights, Moh, and the height-interval, HI, value:
H I = M a x ( σ z m a x 2 l e v e l / T a , d h l e v e l / ( 2 · T a ) )
where σzmax is the maximum σz among all the σz of the stereopairs at the target MP.
The reliability of the optimal height is contingent upon the accuracy of the stereo imaging geometry and the image matching. The height accuracy in the 3D positioning from stereo geometry increases with convergence angle. However, differences in the orientation and shapes of features between stereo images will also increase with convergence angle, which tends to decrease image matching accuracy and result in more matching failures. Moreover, area-based image matching is highly sensitive to the object area of the template size, which connects pixel-to-pixel correspondence between stereo images. Discrepancies of the pixel-to-pixel matching stem from variations in GSD between the images. To effectively integrate the effects of the three determinant factors of convergence angle, the similarity measurement of corresponding points, and variations in GSD, weights of optimal heights are estimated as follows:
W M o h = ( e x p ( 1 / σ z ) 1.0 ) 10 f s + S i m f s + D i f r e s f s
S i m = ( U N C C + 1.0 ) / 2.0 ,     i f   U N C C > G N C C ( G N C C + 1.0 ) / 2.0 , o t h e r w i s e
D i f r e s = 1.0 i n t P I r i m a g e 1 P I r i m a g e 2 100 / f I
where fs is the scaling factor and is applied as 10 for ranging each term from 1 to 10 and is ignorable. PIrimage1 and PIrimage2 are the pyramid image resolutions of image 1 and image 2 in a stereopair. fI is the interval factor for a discretion of Difres, which is defined as a desired sub-pixel accuracy equal to the Ta pyramid image resolution. If int() is less than fI, int() = fI.
Due to variations of σz and image matching accuracy among all stereopairs, the optimal heights are distributed around the true height. In addition to the individual WMoh, the reliability of each optimal height is related to a density of its corresponding height-interval group. If an optimal height is similar to adjacent optimal heights, it enhances the precision of the optimal height and increases the possibility that it represents the true height, rather than being a blunder and outlier. For the reliability measurement of each optimal height, Qoh, a weighted optimal height, WHq, is calculated with the individual WMoh and the distance weight, Wdist, of optimal heights within distance 2 HI of Qoh, as follows:
W H q = W Q o h Q o h
W Q o h = 1 n s ( W M o h W d i s t ) ,   W d i s t = 1 d i s t / d h l e v e l
where WQoh and Wdist are the weights for Qoh and for the Euclidean distance between Qoh and Soh. ns and dist are the total number of selected optimal heights, Soh, and the distance between the Qoh and Soh. If dist is less than dhlevel, dist is dhlevel.
The integrated weighted optimal heights on the target MP, IWOHMP, are then estimated as follows:
I W O H M P = 1 n ( M o h ) W H q / S W Q M P
where SWQMP is the sum of WQoh from all the optimal heights and is utilized as the weight of IWOHMP in the 2D kernel-based processing.
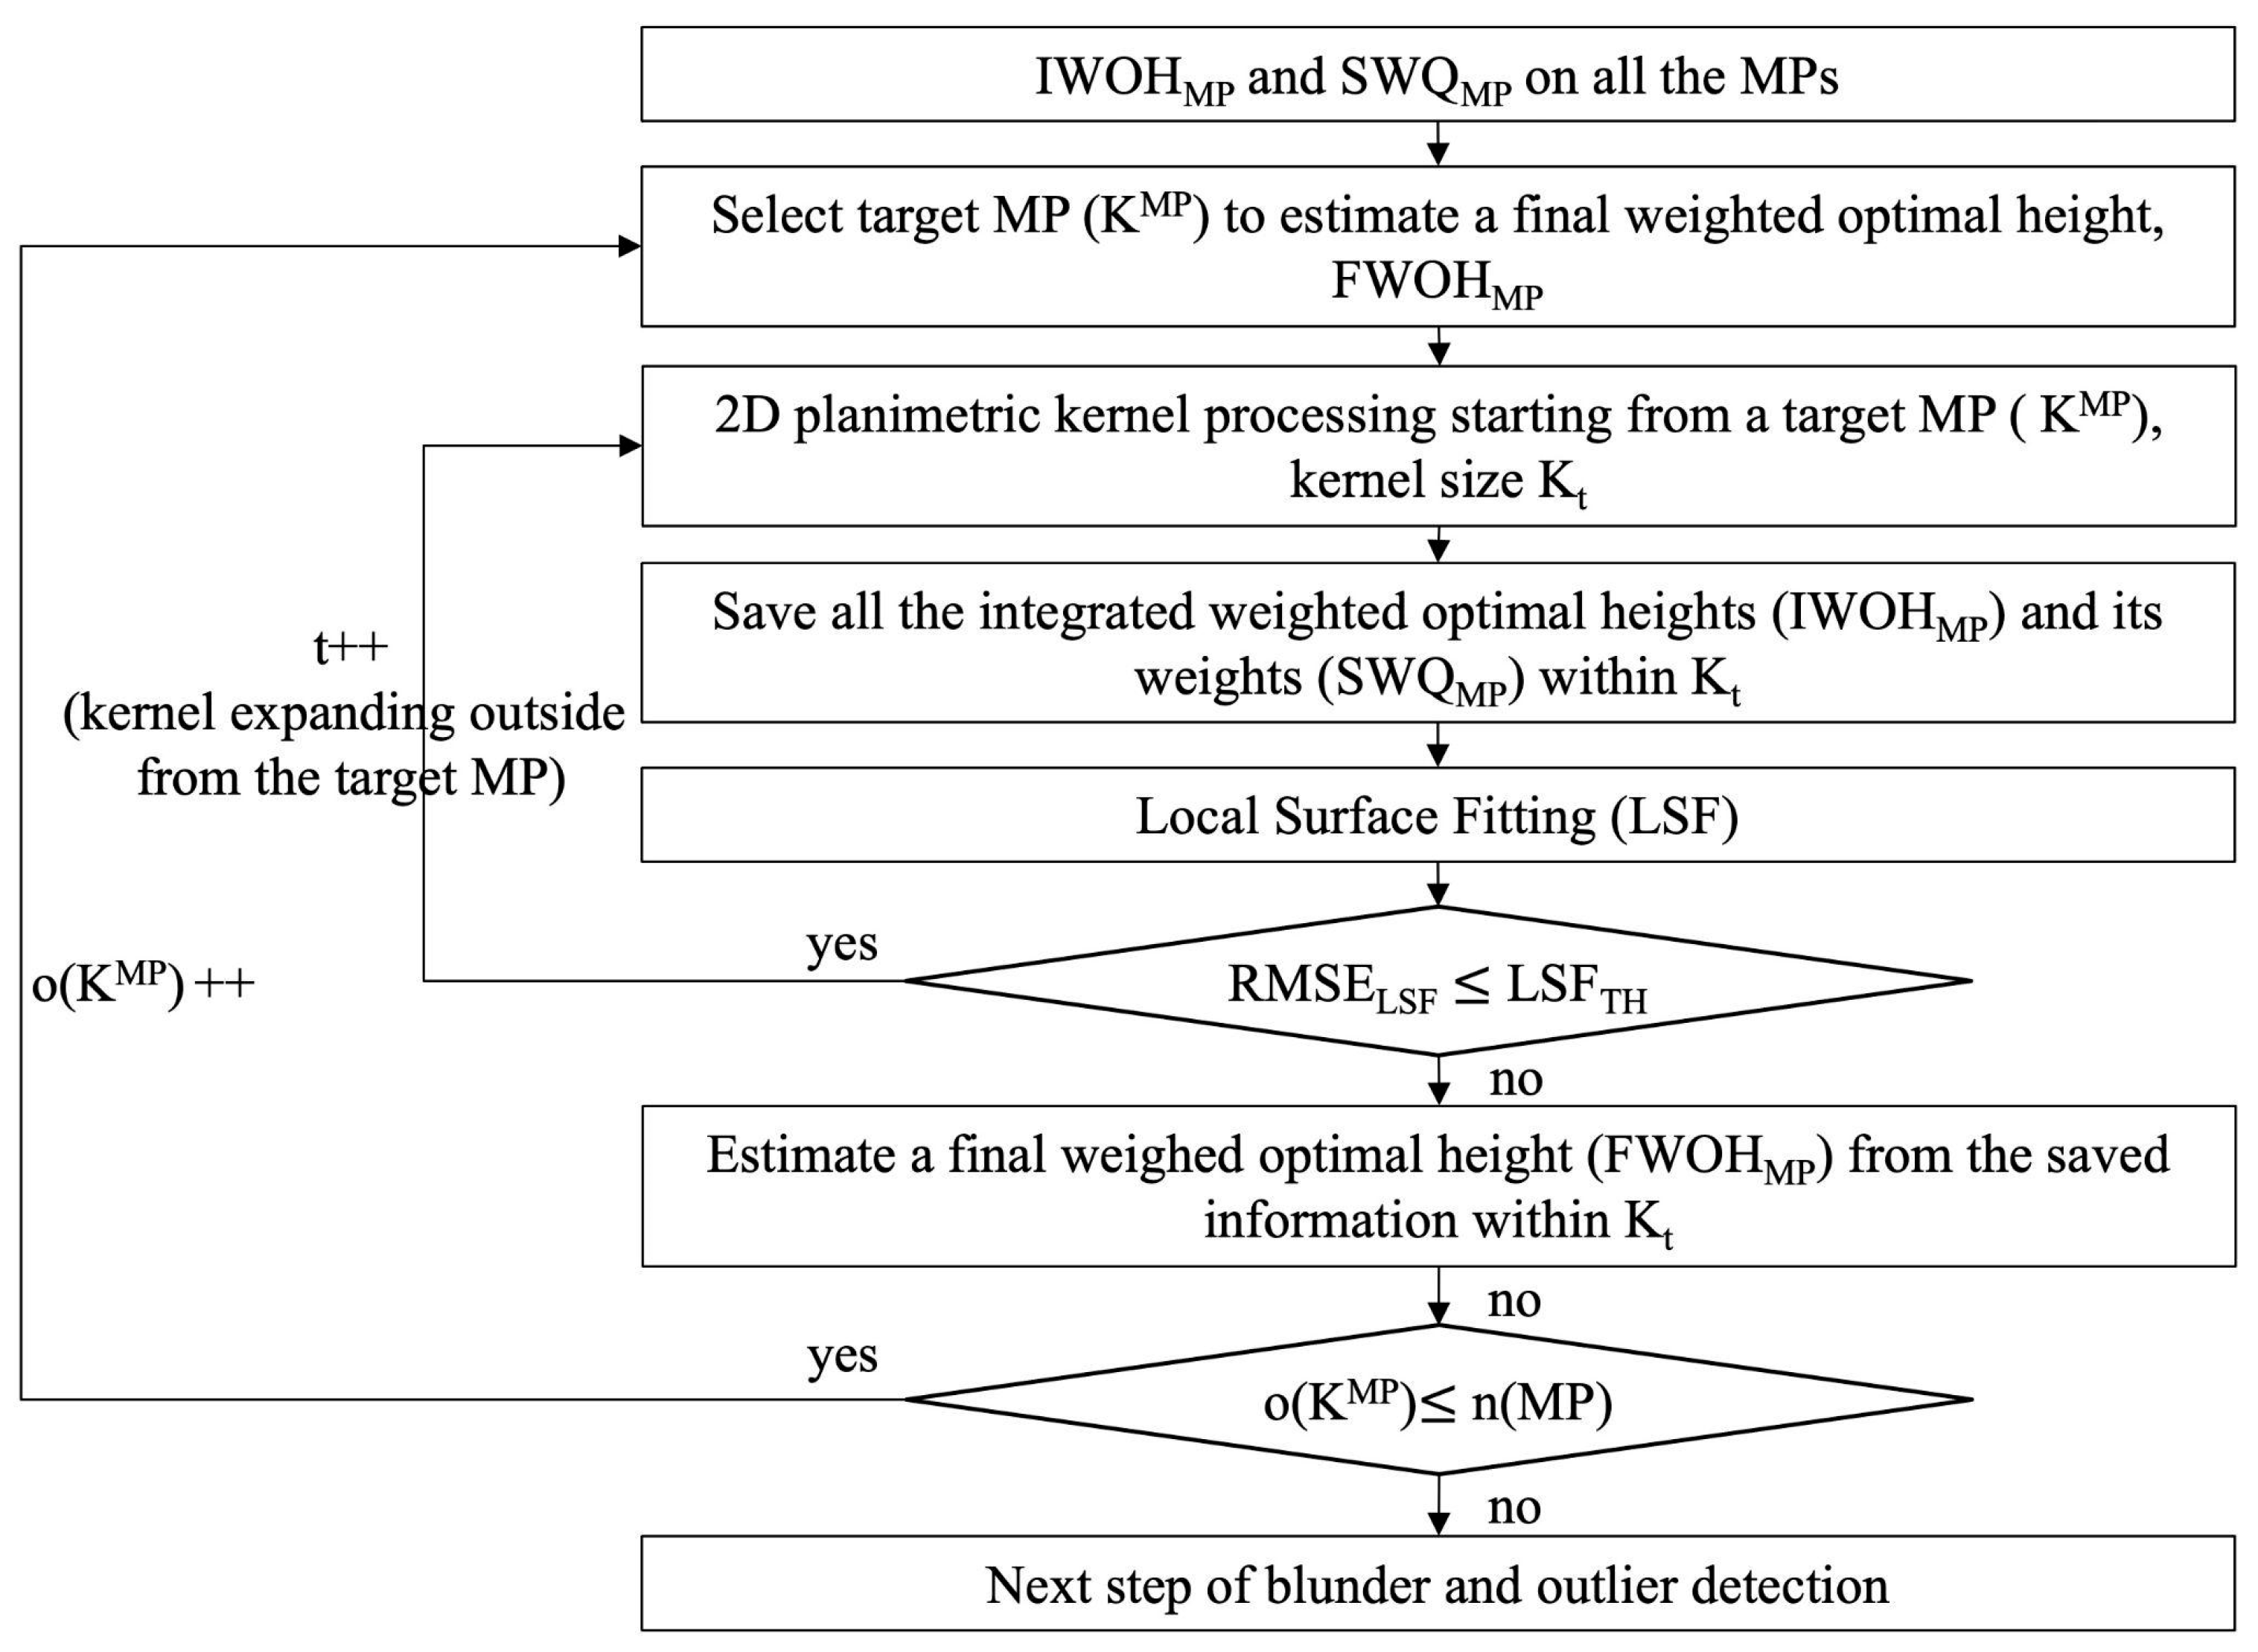
After estimating all the IWOHMP and SWQMP, the 2D kernel-based processing determines a final weighted optimal height, FWOHMP, of a target MP (KMP) as shown in Figure 7. This determination is based on the neighboring 3D information selected within a 2D kernel as illustrated in Figure 5. The 3D information, including X and Y coordinates of MPs and the IWOHMPs, is used to reconstruct 3D surfaces through the LSF algorithm [27]. The extent of the neighborhood area centered around the KMP is determined by the 2D kernel, which is expanded outward from the KMP based on root mean square error (RMSELSF) determined from the LSF. A threshold LSFTH for RMSELSF is directly connected to a level of noise and roughness reduction on surfaces and is defined by considering the expected height accuracy of MP:
L S F T H = i = 1 n ( M o h ) σ Z i n ( M o h ) 2 l e v e l T a
where n(Moh) is the total number of multiple optimal heights on MP.
The initiation and termination of the 2D kernel-based processing are guided by minimum and maximum kernel sizes (tmin and tmax), determined using a fraction between a minimum/maximum surface area and DSM grid size as follows:
t m i n = A m i n / g l e v e l , i f   t m i n < 3 , t m i n = 3
t m a x = A m a x / g l e v e l , i f   t m a x < 20 , t m a x = 21
where Amin and Amax are the minimum and maximum surface areas and are experimentally determined to be 3∙GSD and 21∙GSD, respectively. glevel is the DSM grid size at the pyramid level.
Since large kernel size can include multiple edges in dense urban areas and obscure true surface details, the maximum kernel size is applied to prevent over-expanding and overestimating of the FWOHMP. The 2D kernel expansion is terminated when the RMSELSF is larger than LSFTH, and the FWOHMP is estimated with all the IWOHMP and SWQMP within the 2D kernel, as follows:
F W O H M P = 1 n k ( I W O H M P S W Q M P ) / 1 n k S W Q M P
where nk is the number of IWOHMP within the 2D kernel.

2.4. Blunder/Outlier Detection and Object–Space Surface Refinement

After estimating the final weighted optimal heights (FWOHMP), an integrated 3D TIN facilitates the application of the geometrically constrained blunder detection algorithm in the existing stereopair SETSM algorithm. This utilizes 3D XYZ coordinates, with XY representing the MPs and Z representing the FWOHMPs. MPs that fail to estimate FWOHMPs are excluded from the integrated 3D TIN. GNCCs at all MPs are required to classify the MPs into high-confidence “anchor” and lower-confidence “candidate” MPs [1], in addition to detecting blunders and outliers. Multiple GNCCs for all stereopairs are individually calculated based on the integrated 3D TIN surfaces. The GNCC of the stereopair resulting in the maximum WQoh (the highest reliability) at each MP is selected for the MPs’ classification and blunder/outlier detection. The set of multiple observations per MP provides a key advantage over matching between a single stereopair. To utilize this advantage effectively in the blunder and outlier detection step, we inform filtering with the density of multiple optimal heights, Moh, at each MP. The density is calculated as the fraction of the number of selected optimal heights within a specified height range over the total number of multiple optimal heights. The specified height range is applied as 2level (2/Ta). Optimal heights for the density calculation are selected within the specified height range centered around each FWOHMP. MPs with a density exceeding 0.5 are not filtered out as potential blunders/outliers. Subsequent processing steps are the same as in the stereopair SETSM algorithm.

3. Materials

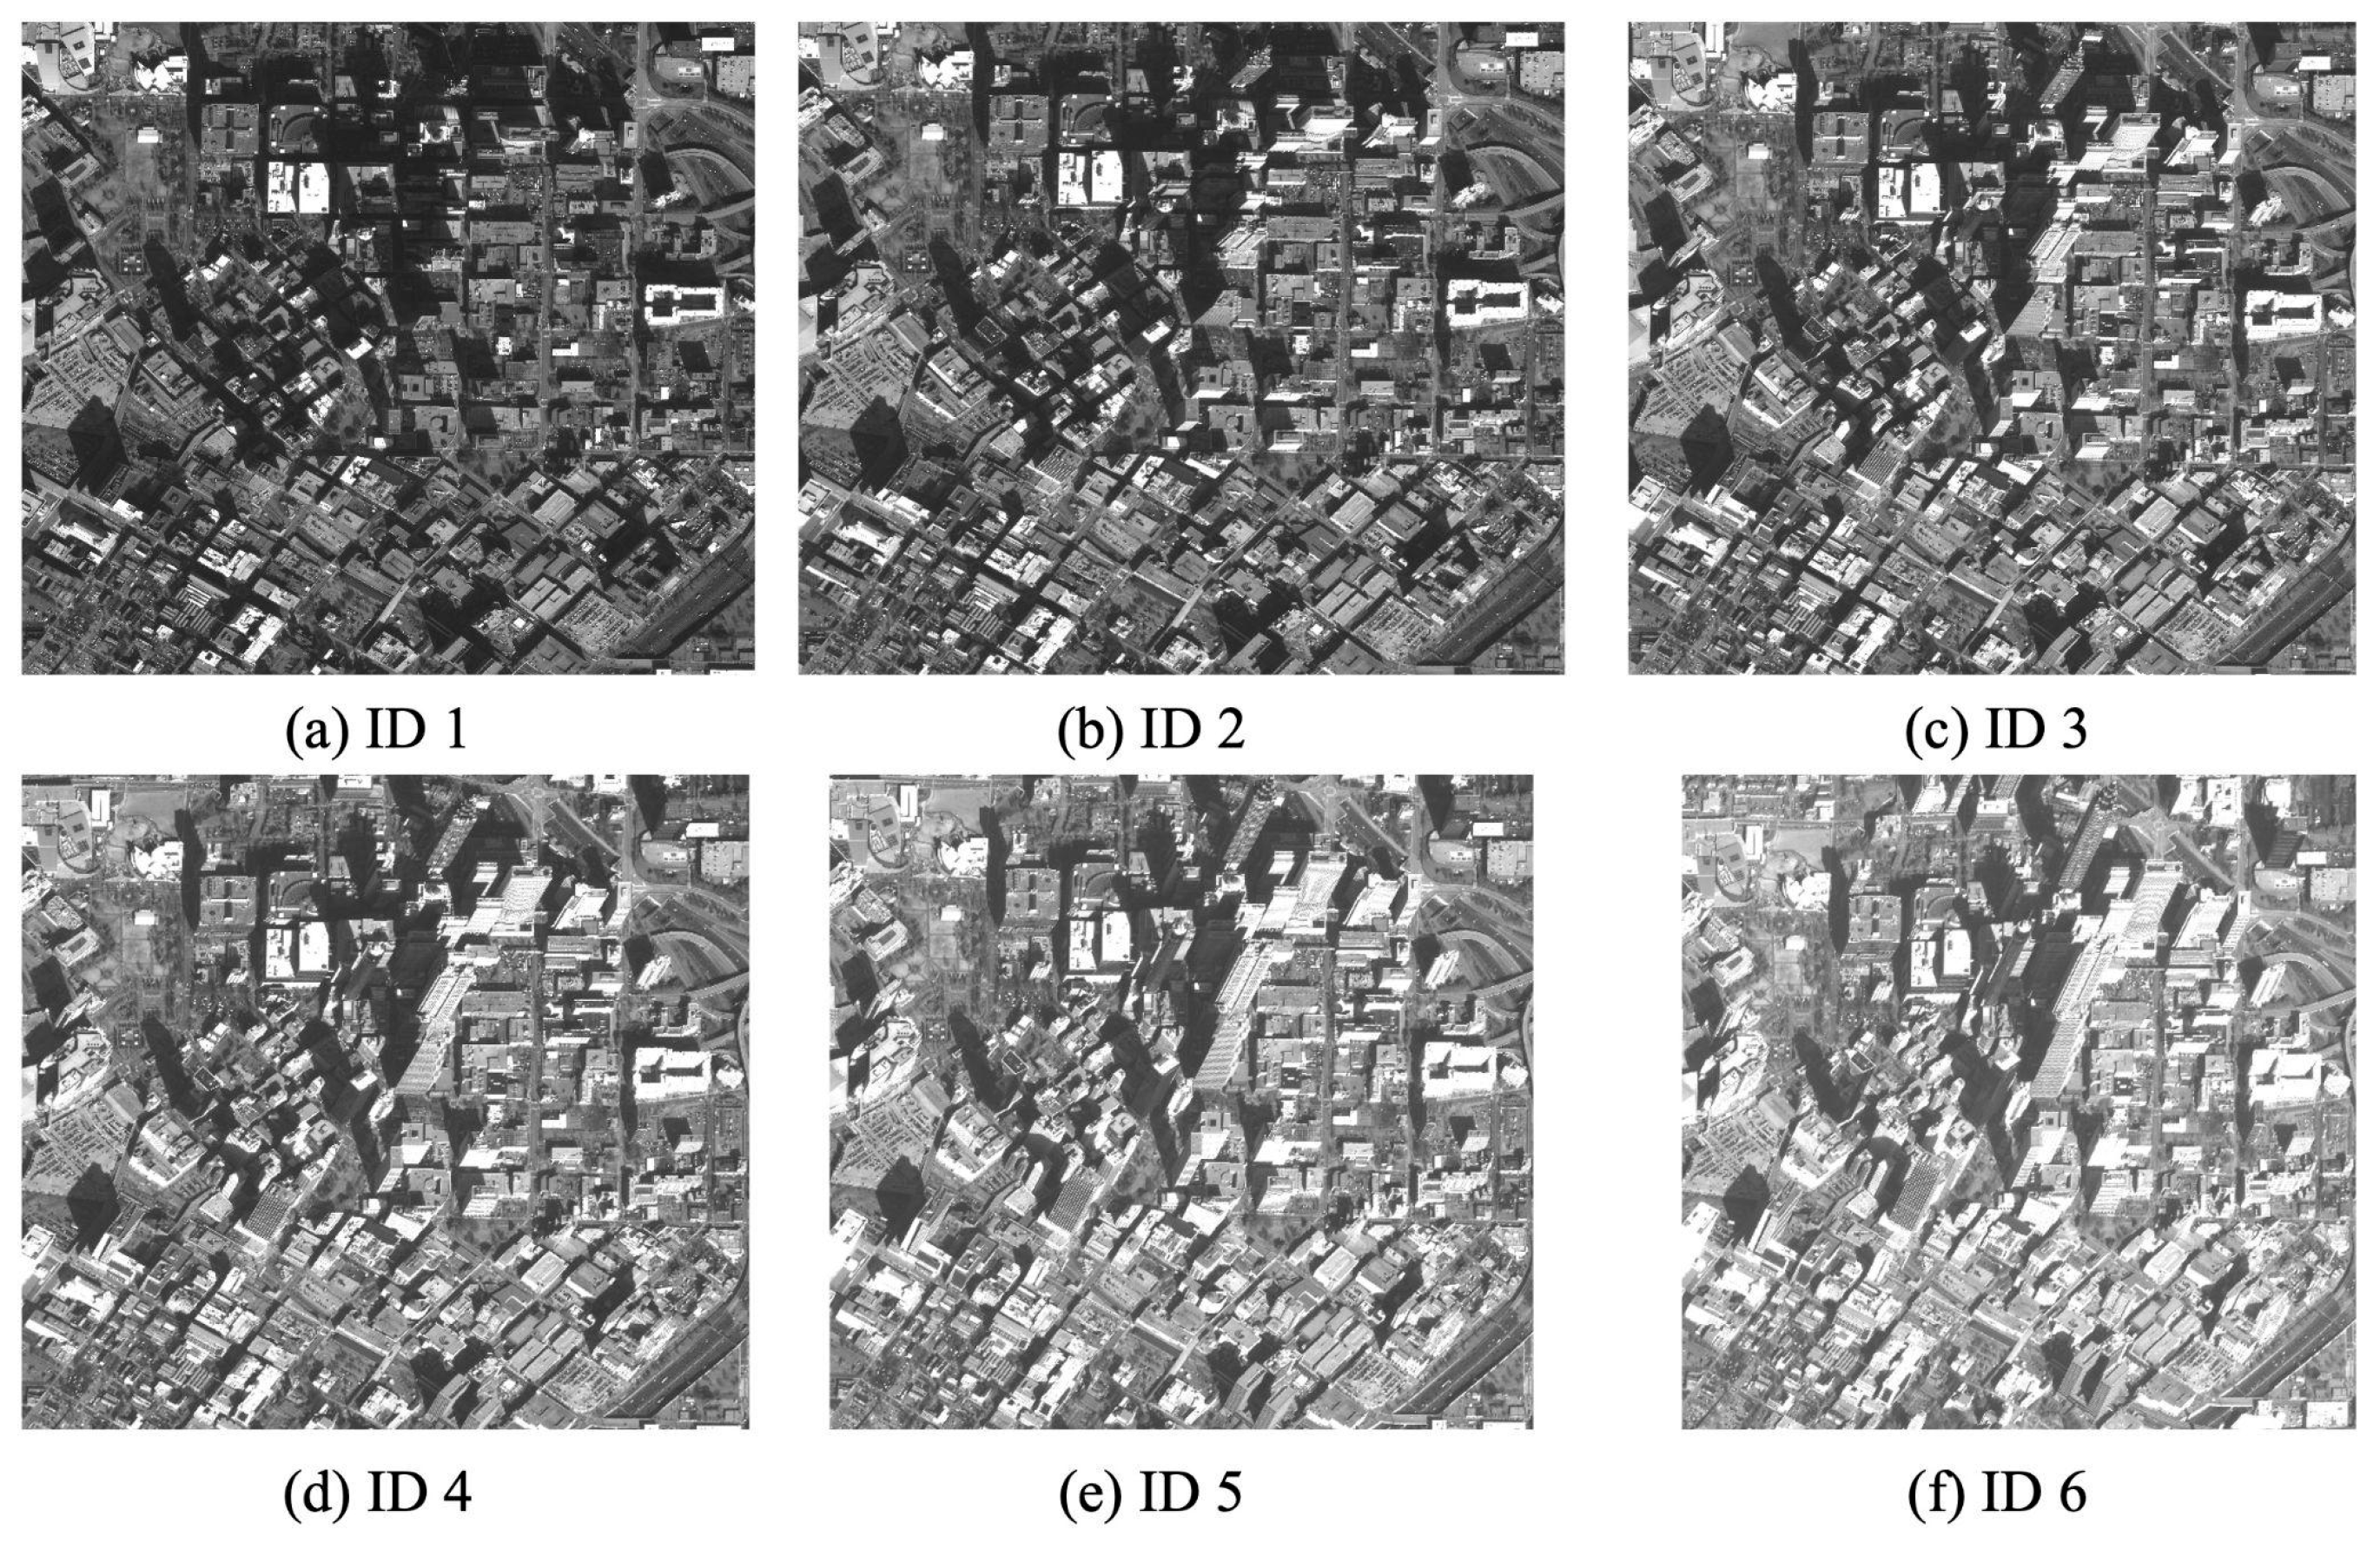
To demonstrate the multi-pair algorithm, we selected six overlapping panchromatic images from the WorldView-2 satellite at a flying altitude of 770 km with RFM/RPC sensor models provided by the distributor. Additionally, we selected fifteen images, comprising five images per survey strip, from the air-borne Digital Mapping Camera (DMC) frame sensor at a flying height of 1020 m and their associated RSMs. Due to the lower flying altitude and the central projective geometry, the DMC images exhibit significant occlusions around tall buildings compared to the WorldView-2 images. Therefore, the DMC images with diverse viewing geometries serve as ideal test data for assessing the developed algorithm’s capability to resolve occlusions. A USGS 3DEP 1-m resolution LiDAR DSM is utilized as a reference surface for validation.

3.1. Experimental Dataset Descriptions

3.1.1. WorldView Images

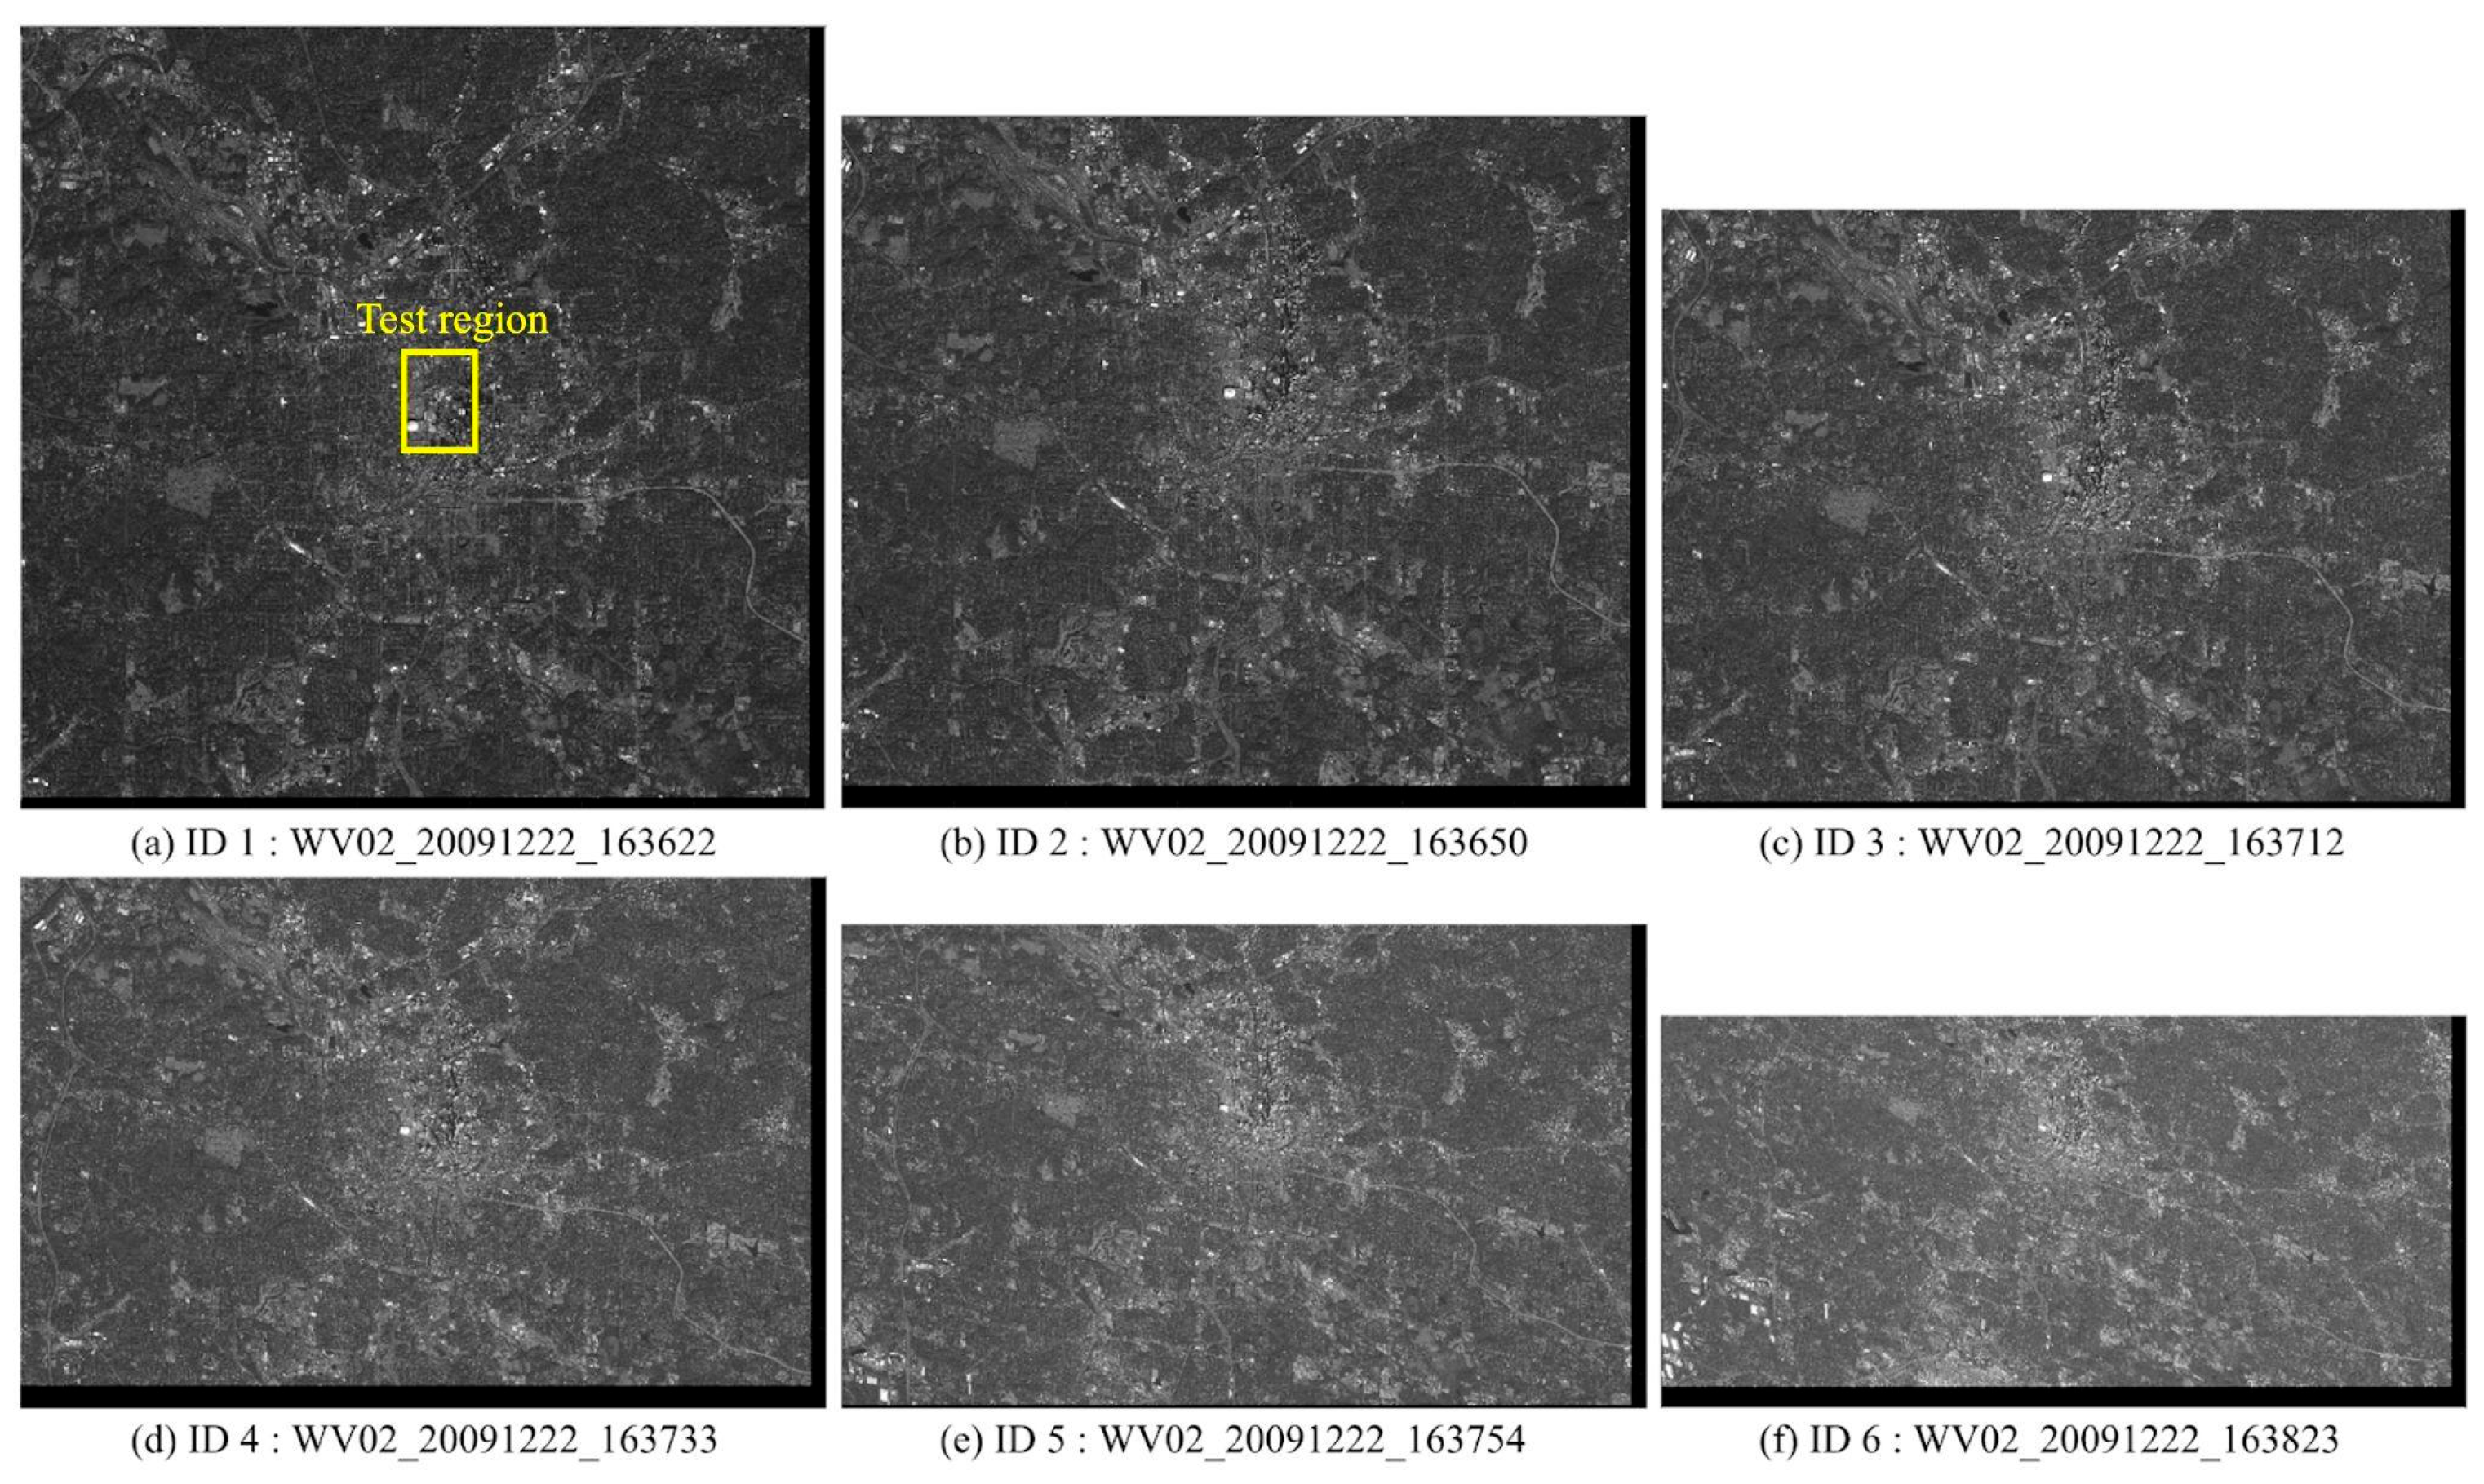
As shown in Table 1, the six WorldView-2 images have various GSDs ranging from 0.47 m to 0.92 m based on off-nadir angles, indicating twice the difference between the smallest and the biggest GSD. These discrepancies in GSDs result in mismatched texture information during pixel-to-pixel similarity measurement between image patches extracted using the same kernel size. Results derived from these data, therefore, provide a test of the performance of the developed algorithm to mitigate the effects of variable GSDs. The images were captured over the US city of Atlanta on 22 December 2009, as illustrated in Figure 8. The image with the smallest off-nadir angle (ID 1) was selected as the reference image for configuring stereopairs with others, resulting in a total of five stereopairs configured with convergence angles of 15.1°, 26.0°, 35.2°, 42.3°, and 51.5°, respectively. The test region was chosen over Atlanta’s tech square and hotel district, as shown in Figure 9. The off-nadir viewing angles are oriented toward the northeast, causing most buildings’ northeast sides to be predominantly occluded.

3.1.2. Digital Mapping Camera Images

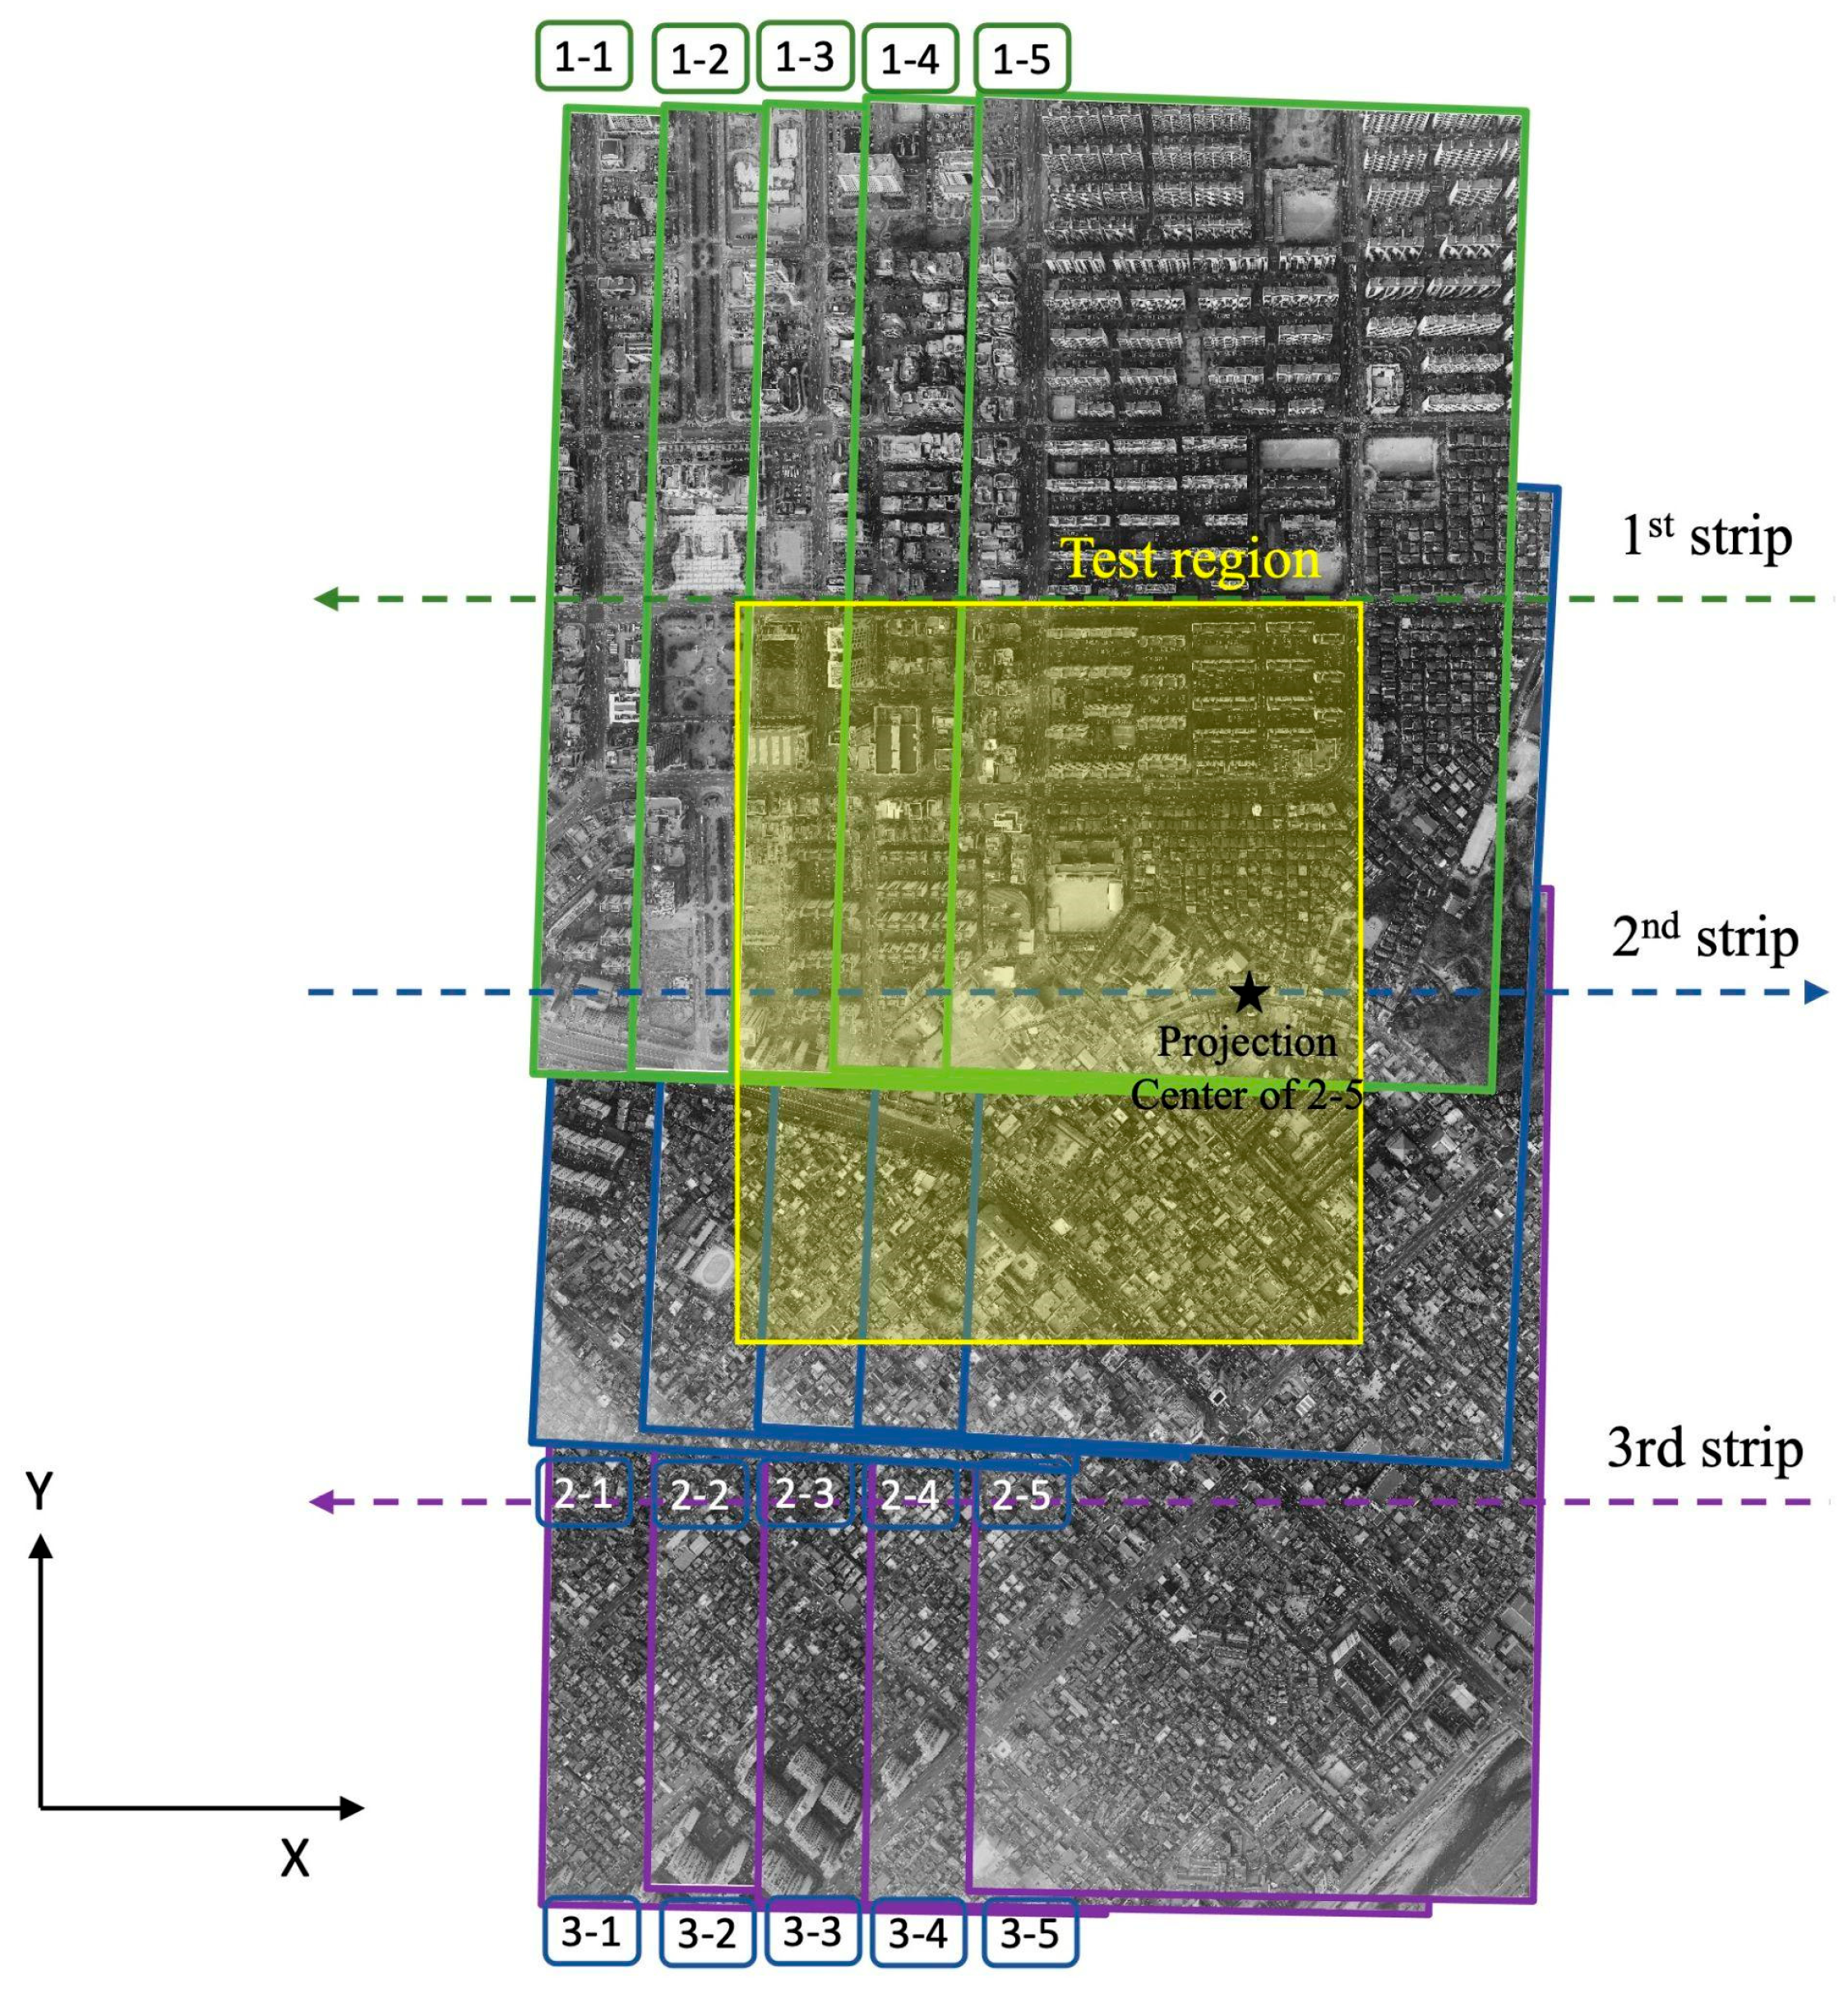
Intergraph Z/I Imaging Digital Mapping Camera (DMC) captured five vertical images along three strips with 80% endlap in the x-direction and 60% sidelap in the y-direction (Figure 10). The DMC system consists of four high-resolution and four multispectral camera heads, producing a composite image with a size of 7680 by 13,824 pixels [28]. The images have a consistent GSD of 0.1 m. Relief displacement and occlusions are oriented radially from the projection center of the image, with their effects significantly amplified by the lower altitude of the aircraft compared to the satellite imagery.

3.2. Description of Reference LiDAR Data for Validating DSMs Generated from WorldView Images

United States Geological Survey (USGS) 3DEP (3D Elevation Program) LiDAR data are used as reference heights for accuracy assessment with DSM results from WorldView-2 images (https://www.usgs.gov/3d-elevation-program/what-3dep, accessed on 4 September 2025). The LiDAR data were collected in 2018 and gridded into 1-m DSM (Figure 11). The LiDAR DSM is 9 years newer than the WorldView-2 images, so real surface height changes are expected between the two DSMs.

4. Results

4.1. SETSM DSMs with WorldView-2 Multiple Images

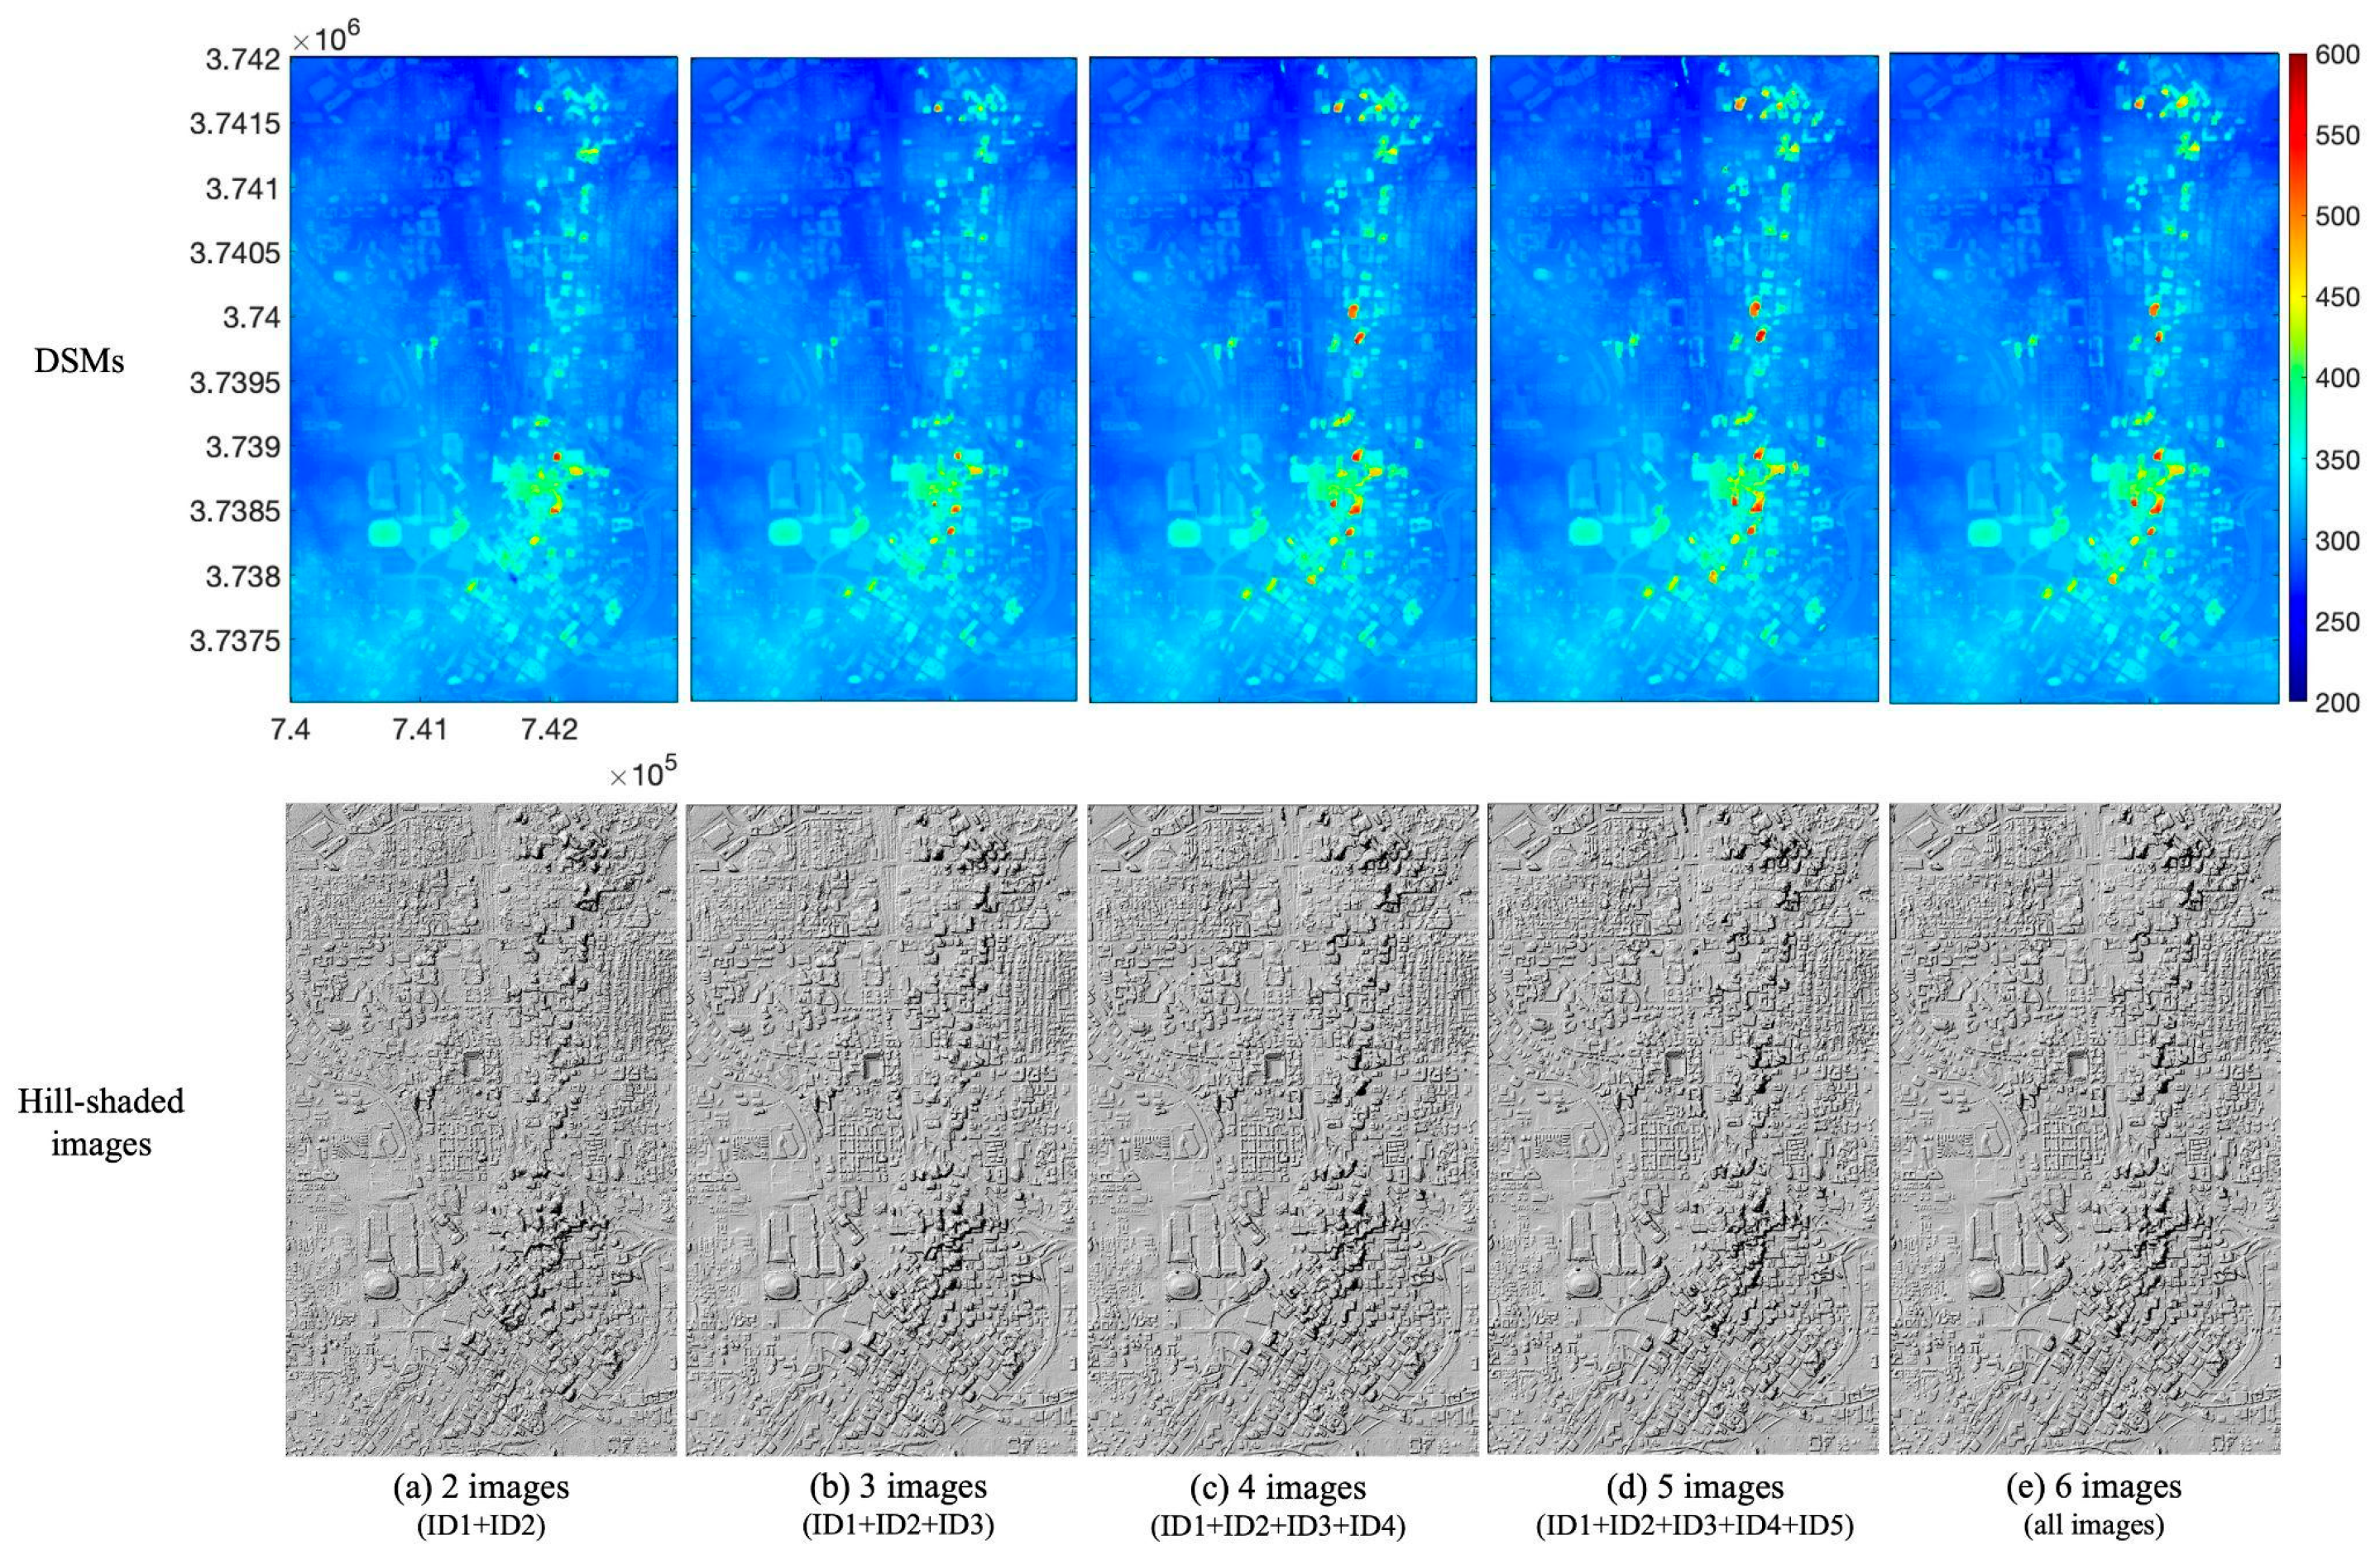
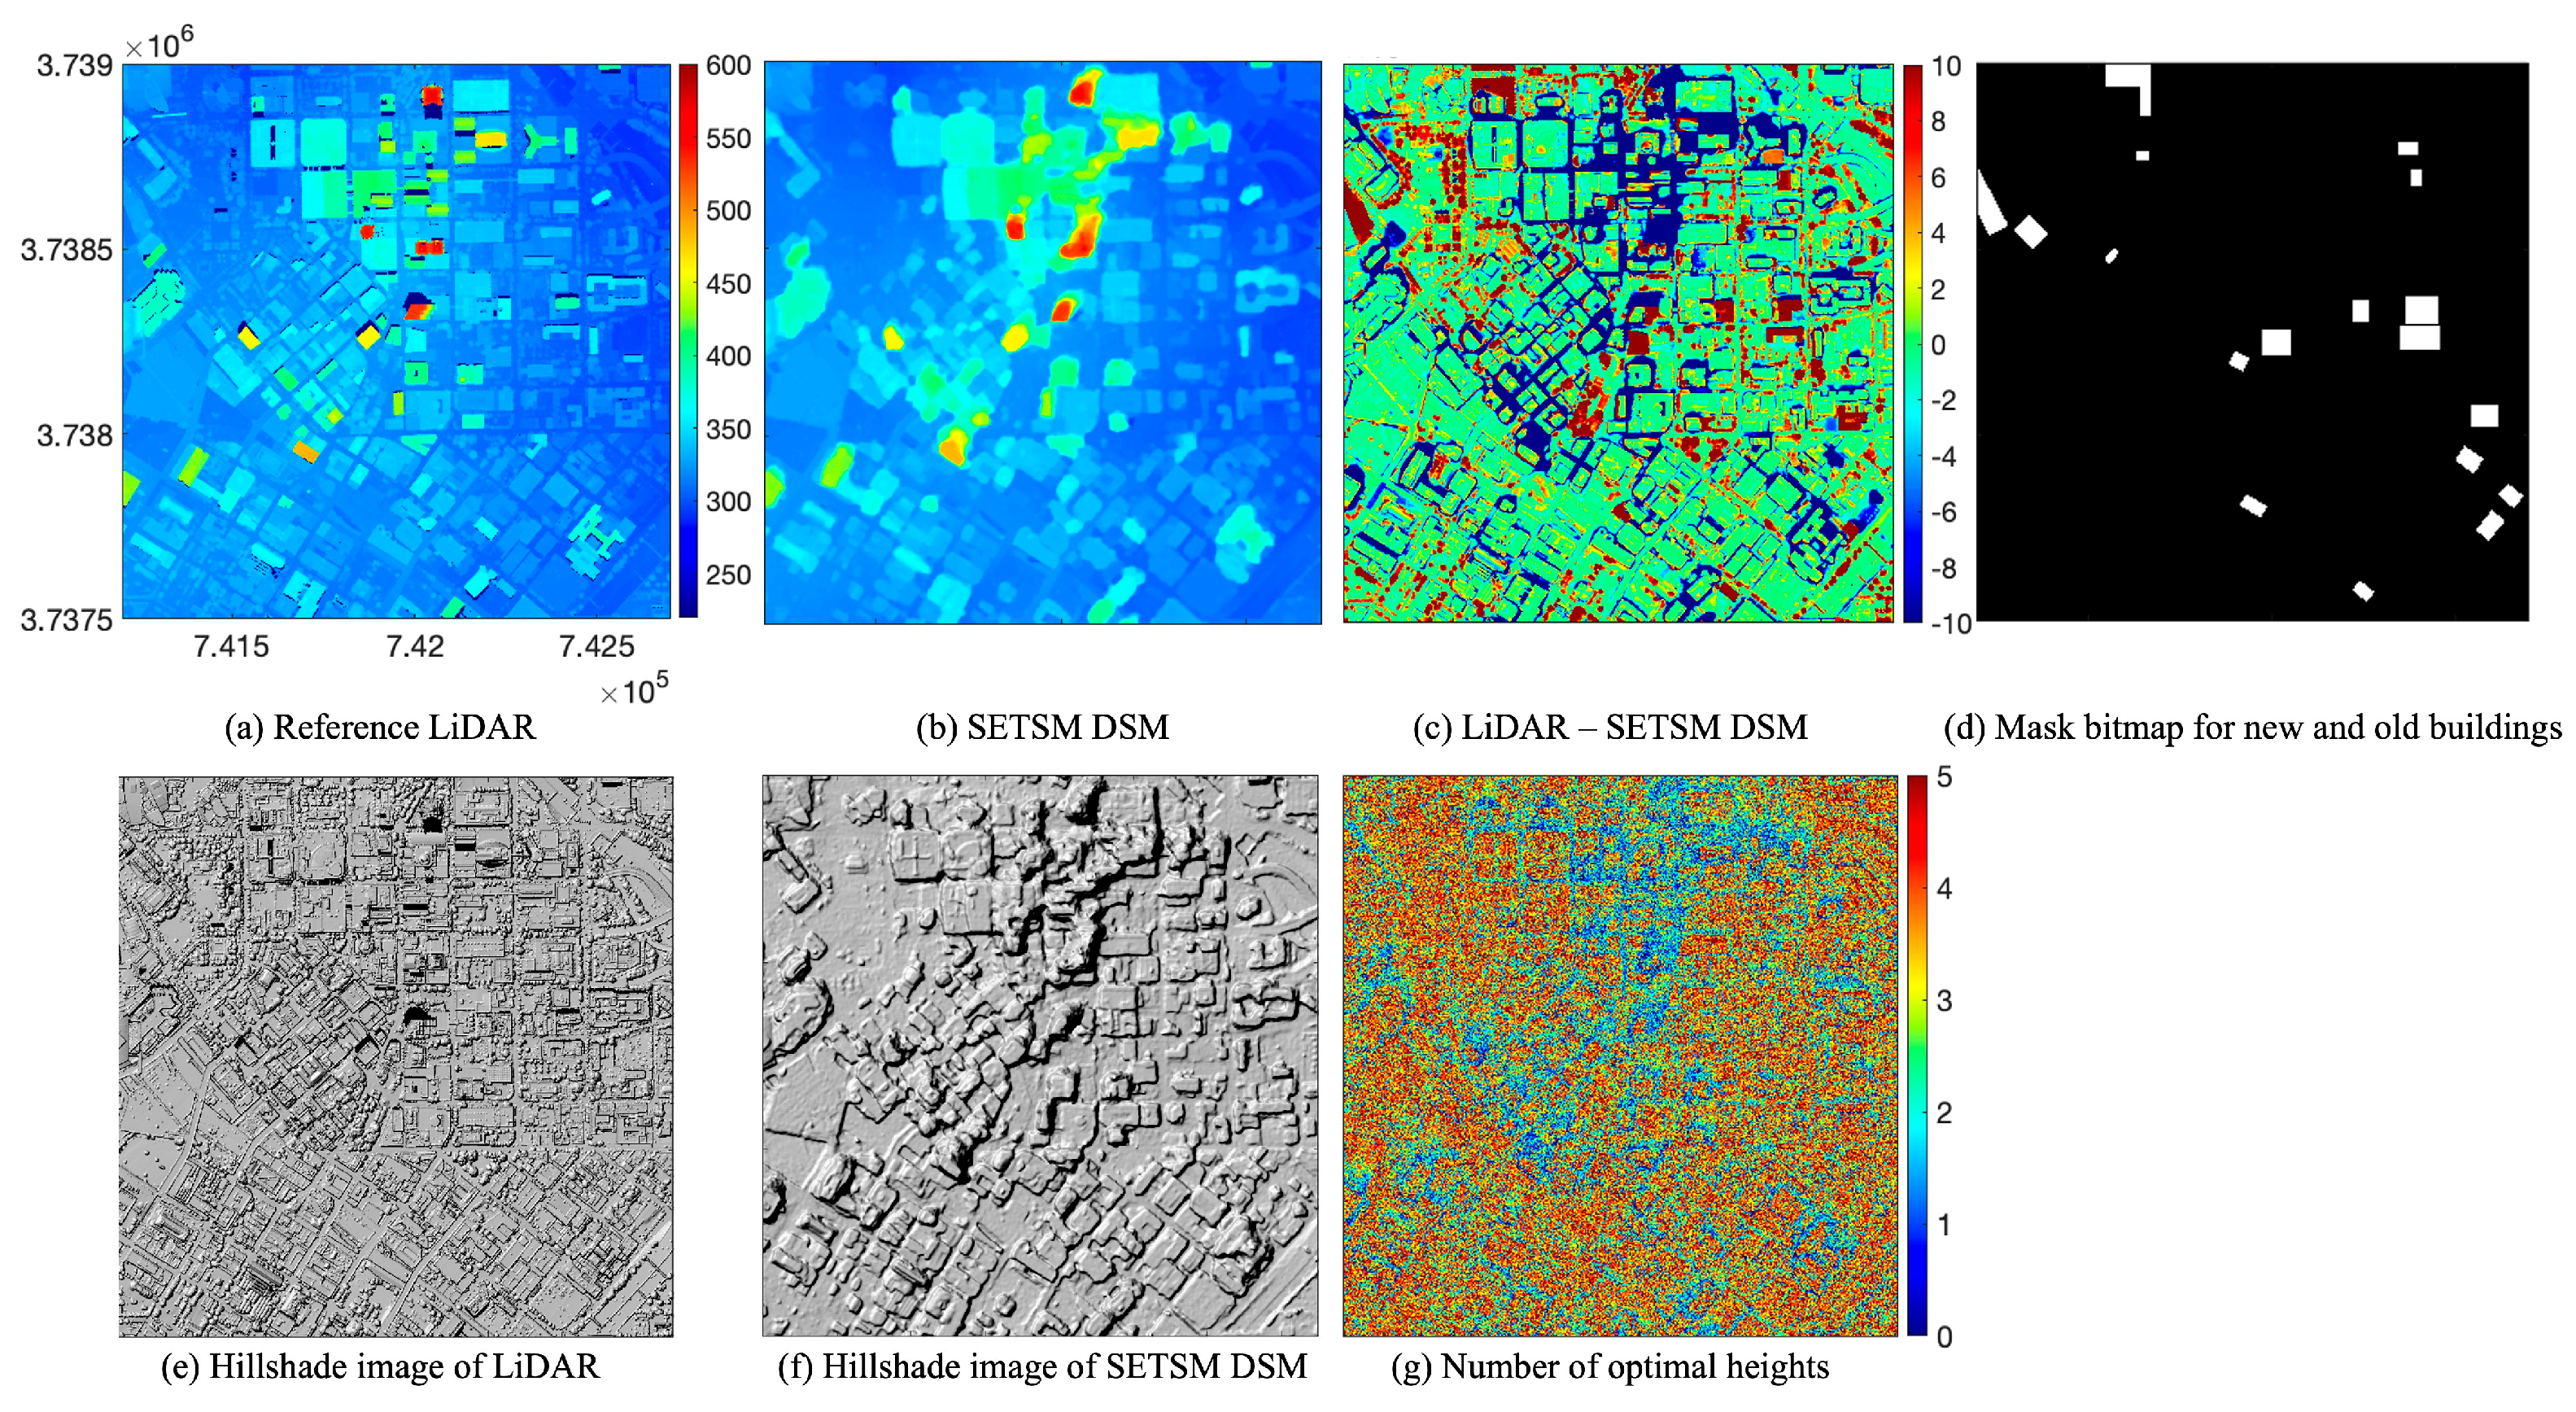
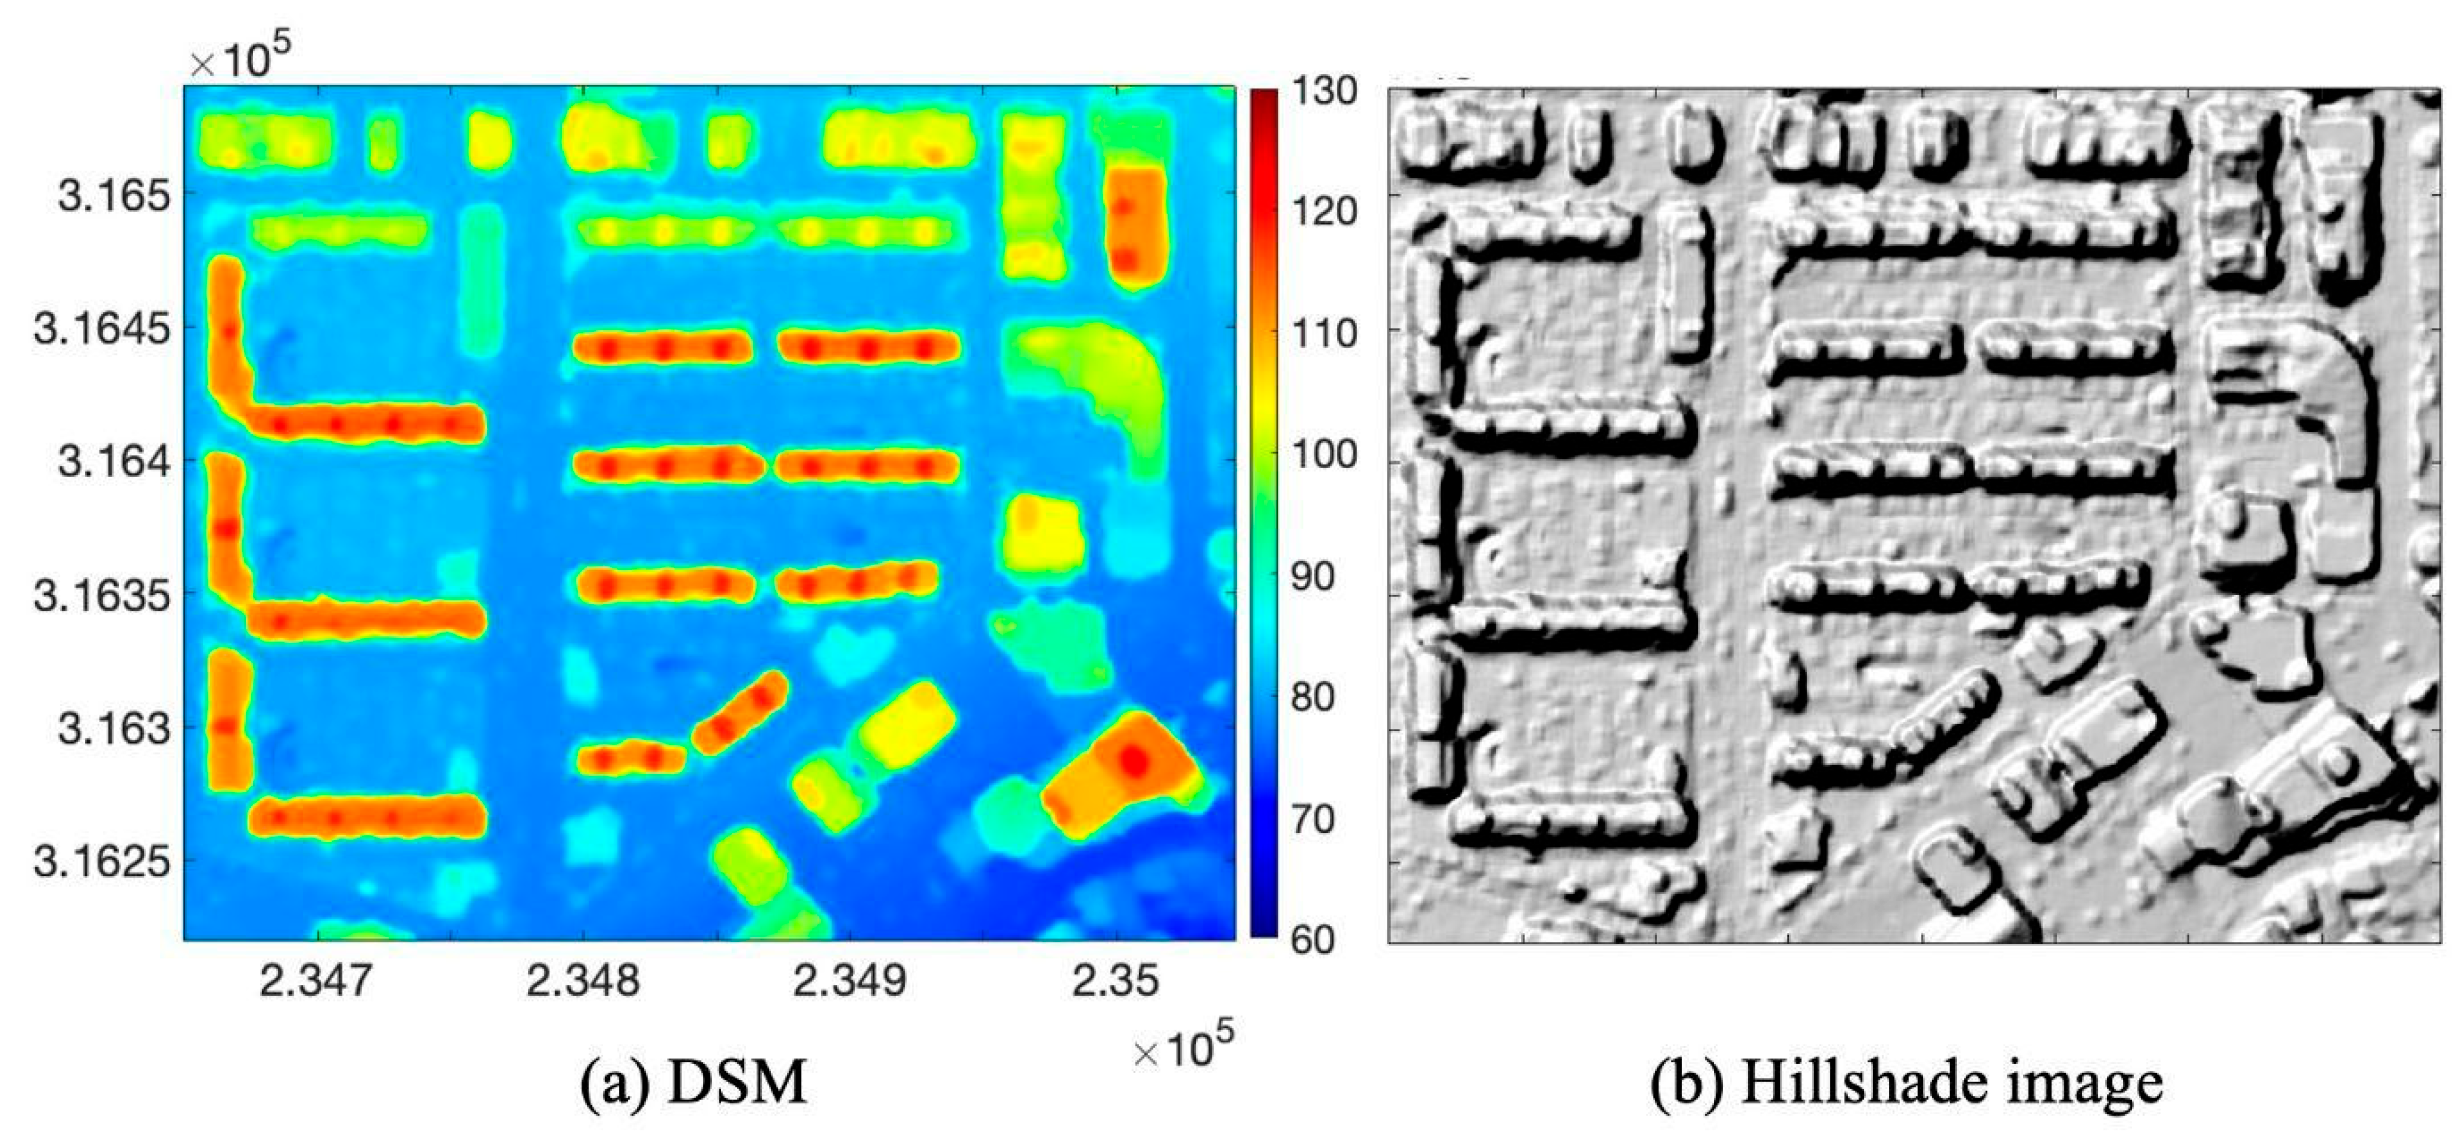
From six WorldView-2 images, five stereopairs are configured with a reference image of ID1. The reference image of ID1 has a minimum off-nadir angle of 7.50° and provides the most surface texture information among all the available images. Without GCPs, the relative RPC biases for all five stereopairs are compensated to remove image positioning biases and improve DSM quality. Figure 12 shows 1-m gridded WorldView-2 SETSM DSMs and the corresponding hillshade images according to the number of applied images, demonstrating the improvement in overall performance of SETSM MMP. When using only two images, stereopair SETSM fails to recover structures with small surface areas and tall heights, such as buildings. This is due to the reliance on a single observation and the SETSM blunder detection algorithm, which classifies sparsely distributed and highly peaked optimal heights among the 3D TIN as blunders during pyramid-level processing. The omission of optimal heights for the top edges of structures results in a reduced search height by TIN construction. Consequently, true heights for the objects are not detected in next-level processing, leading to failure in reconstructing these features in the final DSM. Adding more images in SETSM MMP increases the density of matched MPs with the final weighted optimal height (FWOHMP), resolving the issue of the reduced search-height problem and helping to detect true object positions with a denser distribution of matched MPs than in the single stereopair case. As shown in Figure 12c–e, all structures missing in (a) and (b) are successfully recovered. The large off-nadir angles of image IDs 5 and 6 cause them to have highly distorted object shapes and, respectively, 53% and 95% coarser GSDs than the ID 1 reference image. Despite these attributes, including these high off-nadir images, DSM production (Figure 12d,e) results in similar or improved quality of matching results. Thus, SETSM MMP mitigates the effects of the GSD differences and improves the quality of the DSMs without affecting the accuracy of the matched optimal heights. Height accuracy and matching success rate for each case are obtained from comparing the reference USGS LiDAR DSM, shown in Figure 13, with statistics plotted in Figure 14. The WorldView-2 images (2009) and reference DSM (2018) have a 9-year difference, reflecting significant surface changes in structures and vegetation. The temporal gap introduces errors in DSM quality assessment, particularly in height-difference RMSE calculations. To reduce the temporal errors, new and old buildings between the WorldView and reference DSM are manually filtered out, and the masked RMSE is calculated for a test site bounded in Figure 13a. Figure 13c illustrates these changes with a height difference map with a ±10 m scale bar, highlighting the most changed regions as red and blue scale color. The most notable change is the construction of the Atlanta Mercedes-Benz Stadium in August 2017, which is located in the southwest of Figure 13. The old Georgia Dome was successfully reconstructed in the SETSM DSM and disappeared in December 2016. Due to the viewing geometry limitations of the images, the northeast side of structures remains occluded and is interpolated in the final DSM. Smooth and continuous surfaces such as roads and parking lots show height differences within ±1 m, resulting in noiseless surfaces in the DSM hillshaded image. These effects are strongly related to the number of optimal heights as described in Figure 13d. Visible areas in all the images have the maximum number of optimal heights (five out of five stereopairs), whereas the occluded areas have mostly one or two optimal heights with falsely matched results from inappropriate search spaces. To minimize the discrepancy arising from actual surface changes and interpolated MPs in the accuracy statistics, MPs are selected only in areas with height differences within ±10 m. Matched and interpolated MPs are classified based on the presence or absence of the final weighted optimal height (FWOHMP). Interpolated MPs are those where FWOHMP estimation failed. The total ratio of MPs coverage within the height difference range is around 83% for all cases in Figure 12.
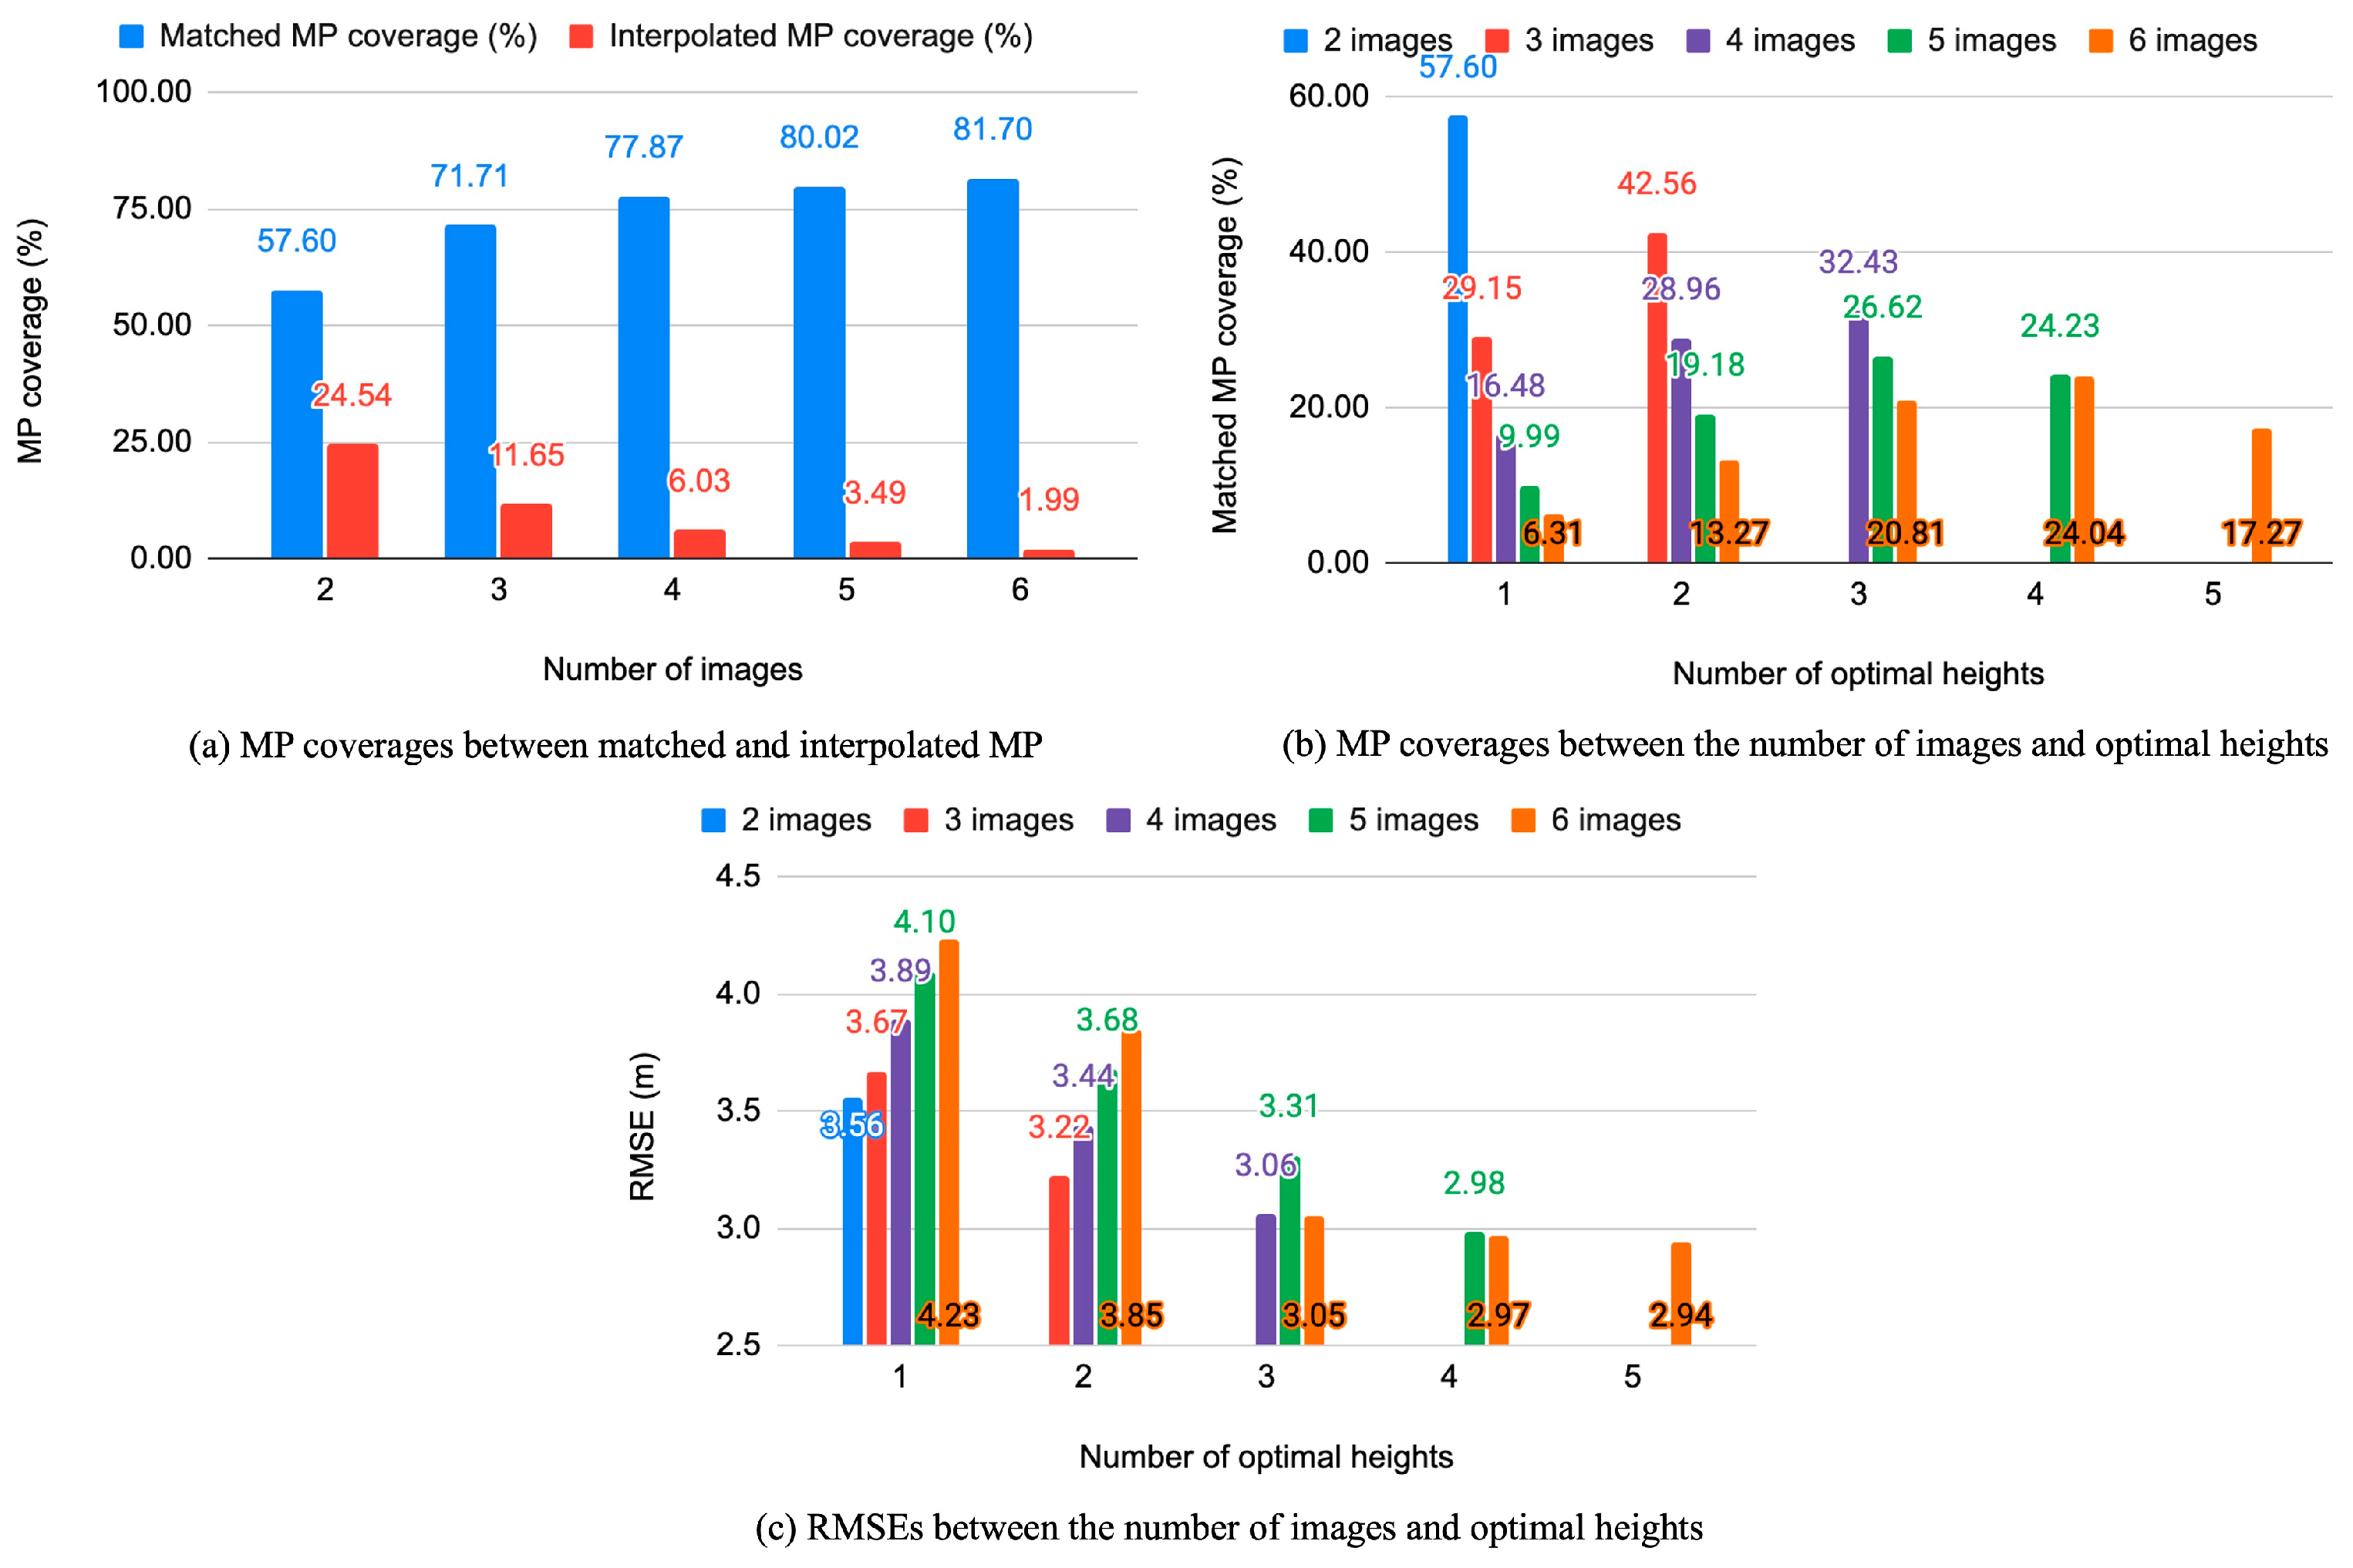
As shown in Figure 14a, the ratio of matched MPs coverage gradually increases with the number of images, rising from 57.60% for two images to 81.70% for results obtained from six images. The ratio of interpolated MPs also decreases dramatically from 24.54% with two images to 1.99% with six images. This indicates the effectiveness of matching in recovering small and densely distributed 3D objects, such as in urban areas, with multiple images. The RMSE height accuracy and the coverage ratio of matched MPs improve as the number of images increases. For the case of six images shown in Figure 14b,c, the RMSE height accuracy and the coverage ratio improve from 4.23 m and 6.31%, respectively, with one optimal height, to 2.94 m and 17.27% with five optimal heights, respectively. Although image ID 6 is extremely tilted with a 44.10-degree off-nadir angle, and the stereopair between image ID 1 and ID 5 results in nearly double the GSD difference, image ID 6 is successfully incorporated in SETSM MMP for increasing the matching success ratio. Although a decline in the coverage ratio is observed in four to five optimal height cases, decreasing from 24.01% to 17.27%, because of image ID 6, the RMSE height accuracy improves from 2.97 m to 2.94 m. This improvement is attributed to the largest convergence angle, which provides the best accurate expected height accuracy. This demonstrates that the novel KWHE algorithm accurately estimates the final weighted optimal heights by effectively assigning weights based on similarity measurement and stereo model accuracy. For the case of one optimal height, the RMSE and the coverage ratio range from 3.67 m and 29.15% with three images to 4.23 m and 6.31% with six images. Increasing the number of applied images enhances the reliability of image matching by increasing observations and reducing the distribution of spurious or interpolated MPs. Using six images results in the best RMSE accuracy with more than three optimal heights, such as 3.05 m with three optimal heights, 2.97 m with four optimal heights, and 2.94 m with five optimal heights. The collection of matched MPs from stereopairs with relatively narrow convergence angles is redistributed to MPs with better height accuracy by incorporating stereopairs with wider convergence angles. This demonstrates that SETSM MMP improves both the height accuracy and matching success ratio by adding more images with wider convergence angles, effectively integrating additional observations of optimal heights. Since the matched MPs include blunders, real surface changes, and falsely matched MPs from occlusions within ±10 m height changes, the RMSE accuracy might not properly represent a localized accuracy, especially on smooth surfaces such as roads and the tops of buildings.
For a detailed investigation of the WorldView-2 SETSM DSM, a test site including dense urban areas is bounded in Figure 13a. Figure 15 compares the reference USGS LiDAR and SETSM MMP DSM created from all six images with hillshade images for the test site. The mask bitmap in Figure 15d is used to exclude new and old buildings between LiDAR and SETSM MMP DSM when calculating the RMSE accuracy. The RMSE accuracy with MPs within ±10 m height difference is 3.11 m, with a matched MP coverage ratio of 81.71%. Approximately 20% of MPs are interpolated due to occlusions, matching failures, and surface changes. The height difference map in Figure 15c shows occluded areas in blue (lower than −10 m height difference) and new structures in red (higher than 10 m height difference), corresponding to the number of optimal heights in Figure 15g. Figure 16 represents the original WorldView-2 images, describing the direction of the viewing angle (northeast) and shadows (northwest). The quality of SETSM DSMs is not significantly affected by shadows, allowing for successfully reconstructing surface information. The stereopair comprising Image ID 1 and ID 2 covers the most visible areas for overlapping regions among all five stereopairs, representing the maximum reconstructable area through stereo matching. The heights of buildings are accurately estimated with a height difference of less than ±1 m (green scale color in Figure 15c). Roads between tall buildings are not successfully retrieved and are interpolated with neighborhood building heights through the SETSM algorithm due to the search-space propagation between the pyramid levels and the absence of true height within the search space. Matching failures around the bottom edges of buildings result in the smoothing of building shapes through the interpolation process, as shown in the SETSM DSM and its hillshade image of Figure 15b,f, respectively. Despite the lack of matched MPs along the bottom edges, building top boundaries are recognizable in the SETSM DSM compared to the LiDAR hillshade image with morphological similarity.
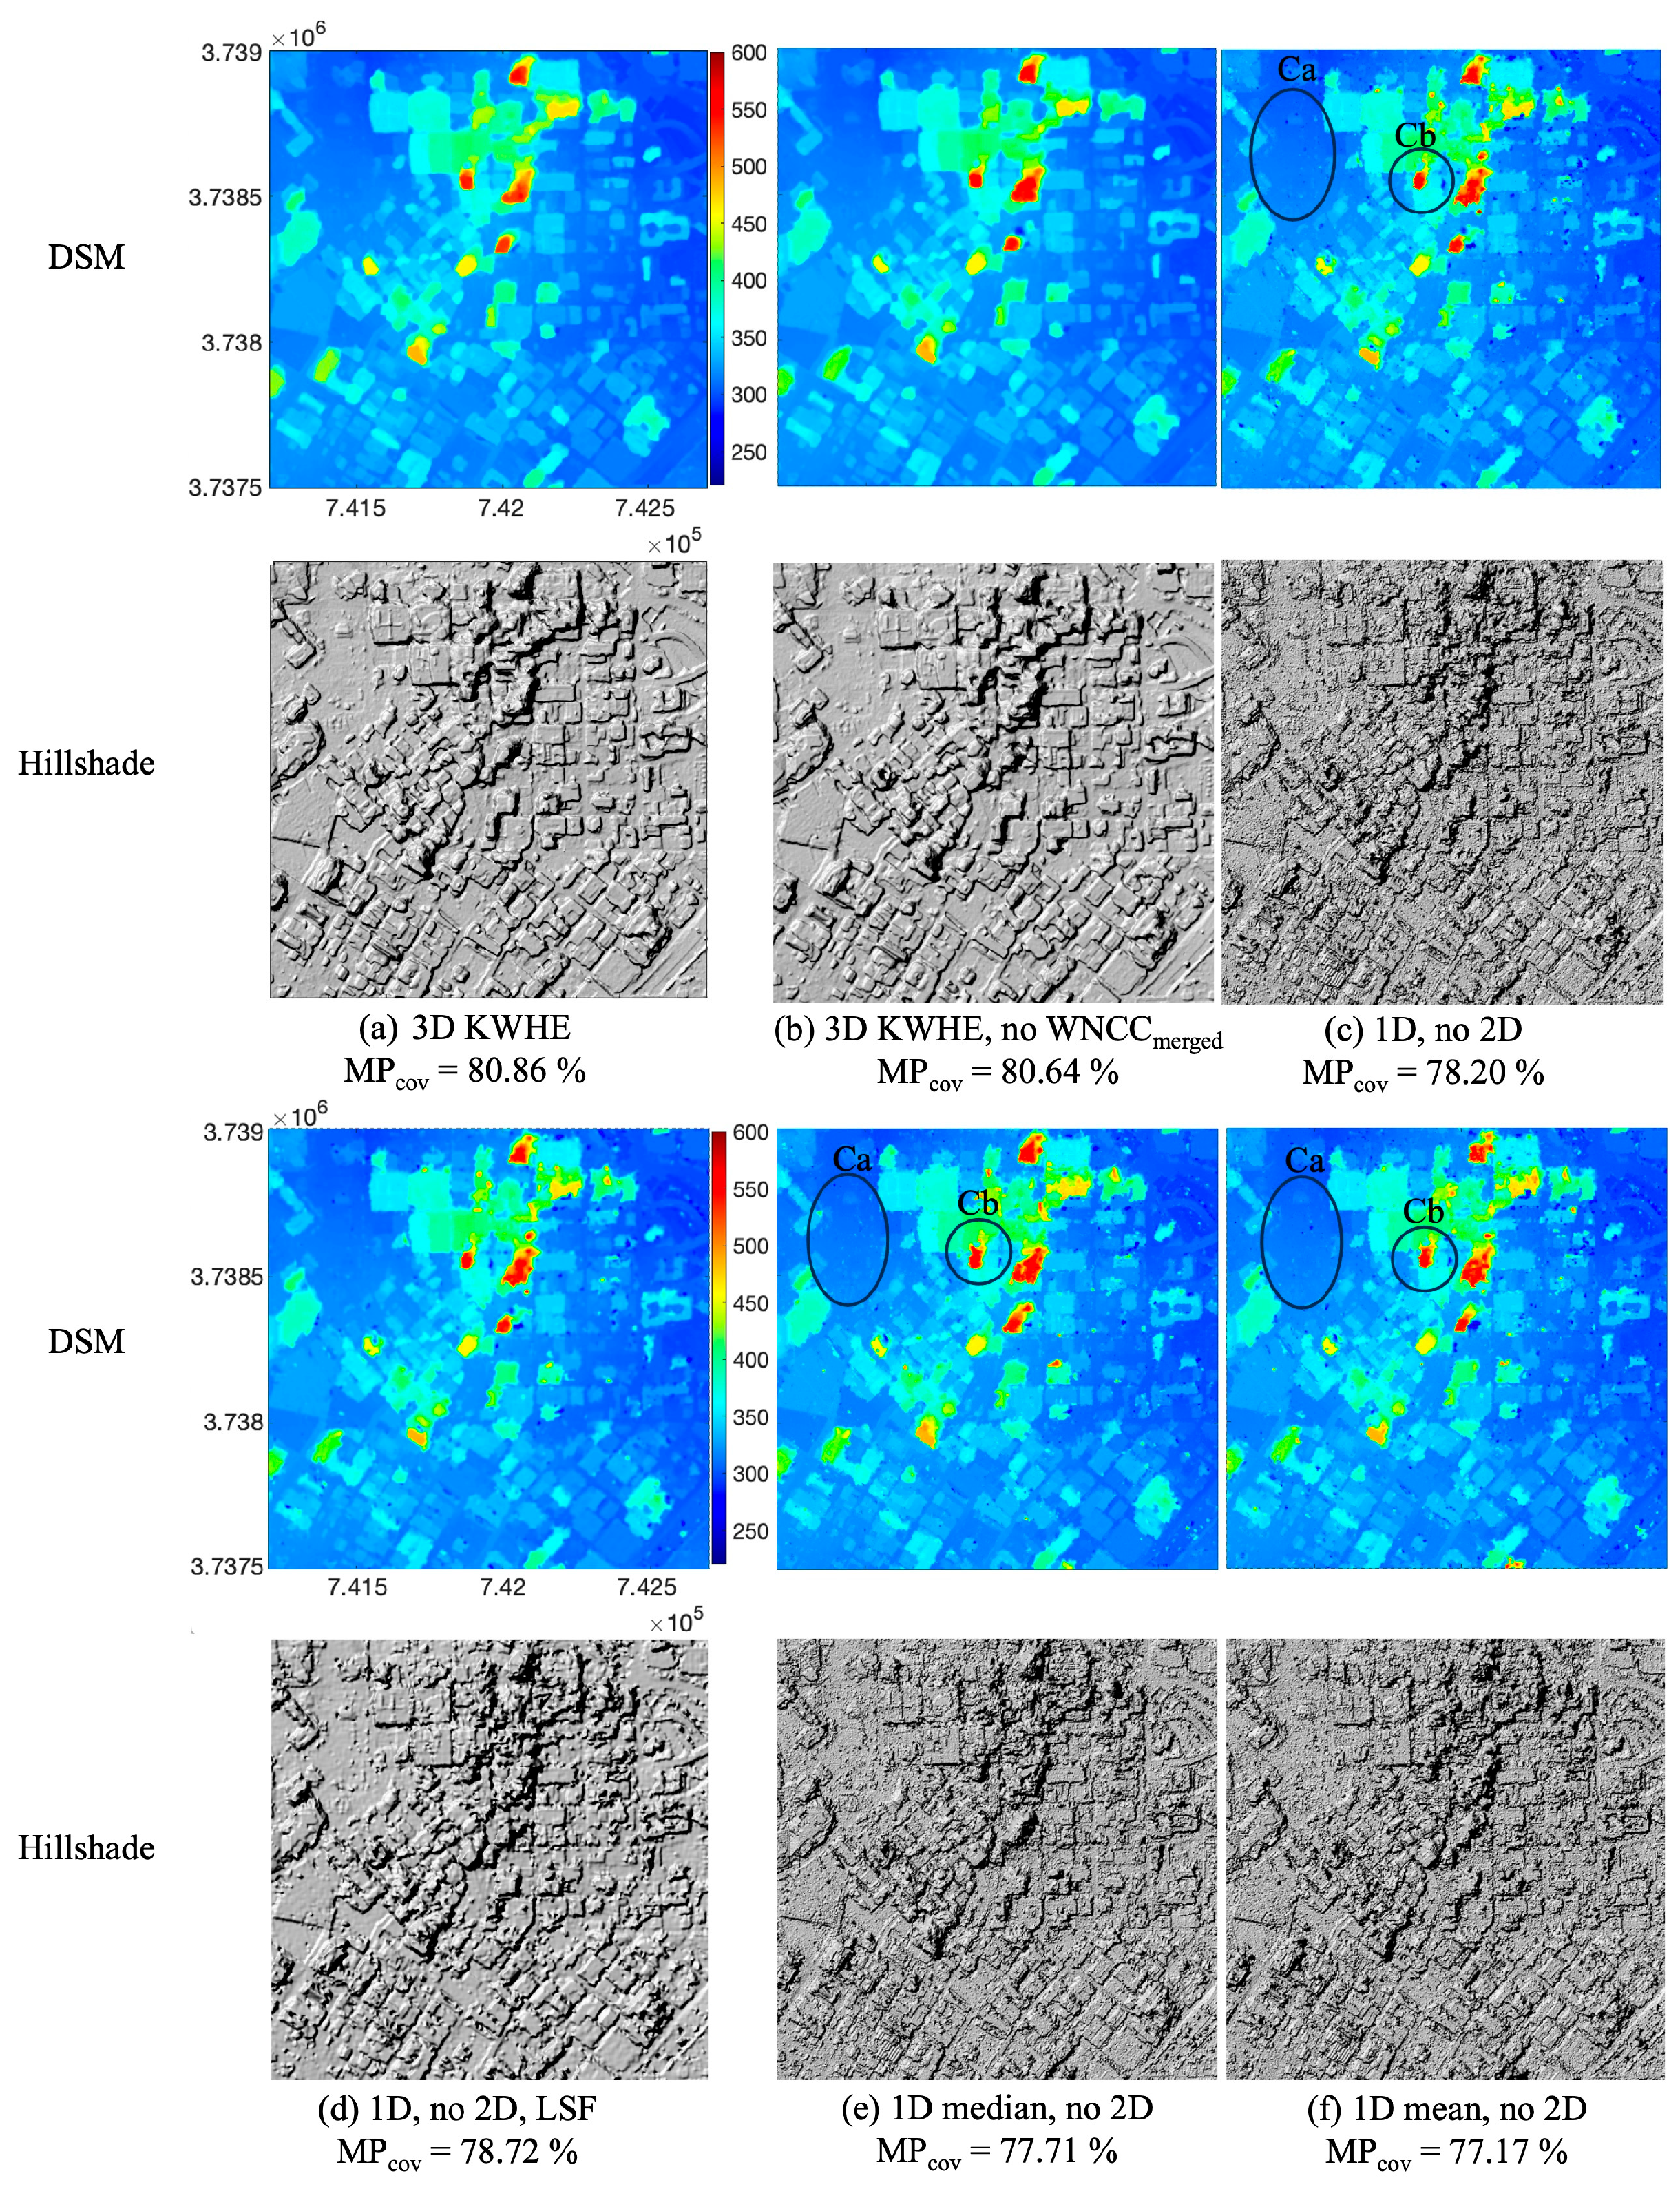
Performance of the developed 3D KWHE method is evaluated both quantitatively and qualitatively using the six processing scenarios shown in Figure 17. Statistical comparisons are summarized in Figure 18. These scenarios are as follows: (a) full application of 3D KWHE; (b) 3D KWHE without merged WNCC (WNCCmerged); (c) only 1D height-interval processing without 2D kernel-based processing; (d) LSF application based on the result of scenario (c); (e) only 1D height-interval processing with median optimal heights instead of the developed integrated weighted optimal heights; and (f) only 1D height-interval processing with mean optimal heights. Comparisons between (c), (e), and (f) demonstrate that the integrated weighted optimal heights method results in the highest quality DSM by increasing the coverage ratio of matched MPs (MPcov) within a 10 m absolute height difference by 0.49% and 1.03%, and MPcov for absolute height differences ranging from 0 m to 2 m by 0.05% and 1.18%, respectively. Additionally, (c) reduces blunders on smooth surfaces (Ca in Figure 17) and enhances edge preservation for buildings (Cb in Figure 17). Applying 2D kernel-based processing significantly reduces surface noise by achieving 80.86% MPcov and 56.39% MPcov for height differences ranging from 0 m to 2 m. It also more clearly delineates structures compared to (c). This results in an improved RMSE within a ±10 m height difference of 3.11 m, compared to 3.29 m in scenario (c). The LSF method of scenario (d), which is part of the stereopair SETSM module, effectively suppresses low-frequency surface noise; however, it struggles to preserve building boundaries due to its inherent smoothness effect as described in [27]. The proposed 2D kernel-based processing overcomes the limitation of the LSF method, improving RMSE by 0.26 m and MPcov by 2.14%. Integrating the WNCCmerged component further enhances DSM quality in terms of both MPcov and RMSE, achieving the best overall performance.
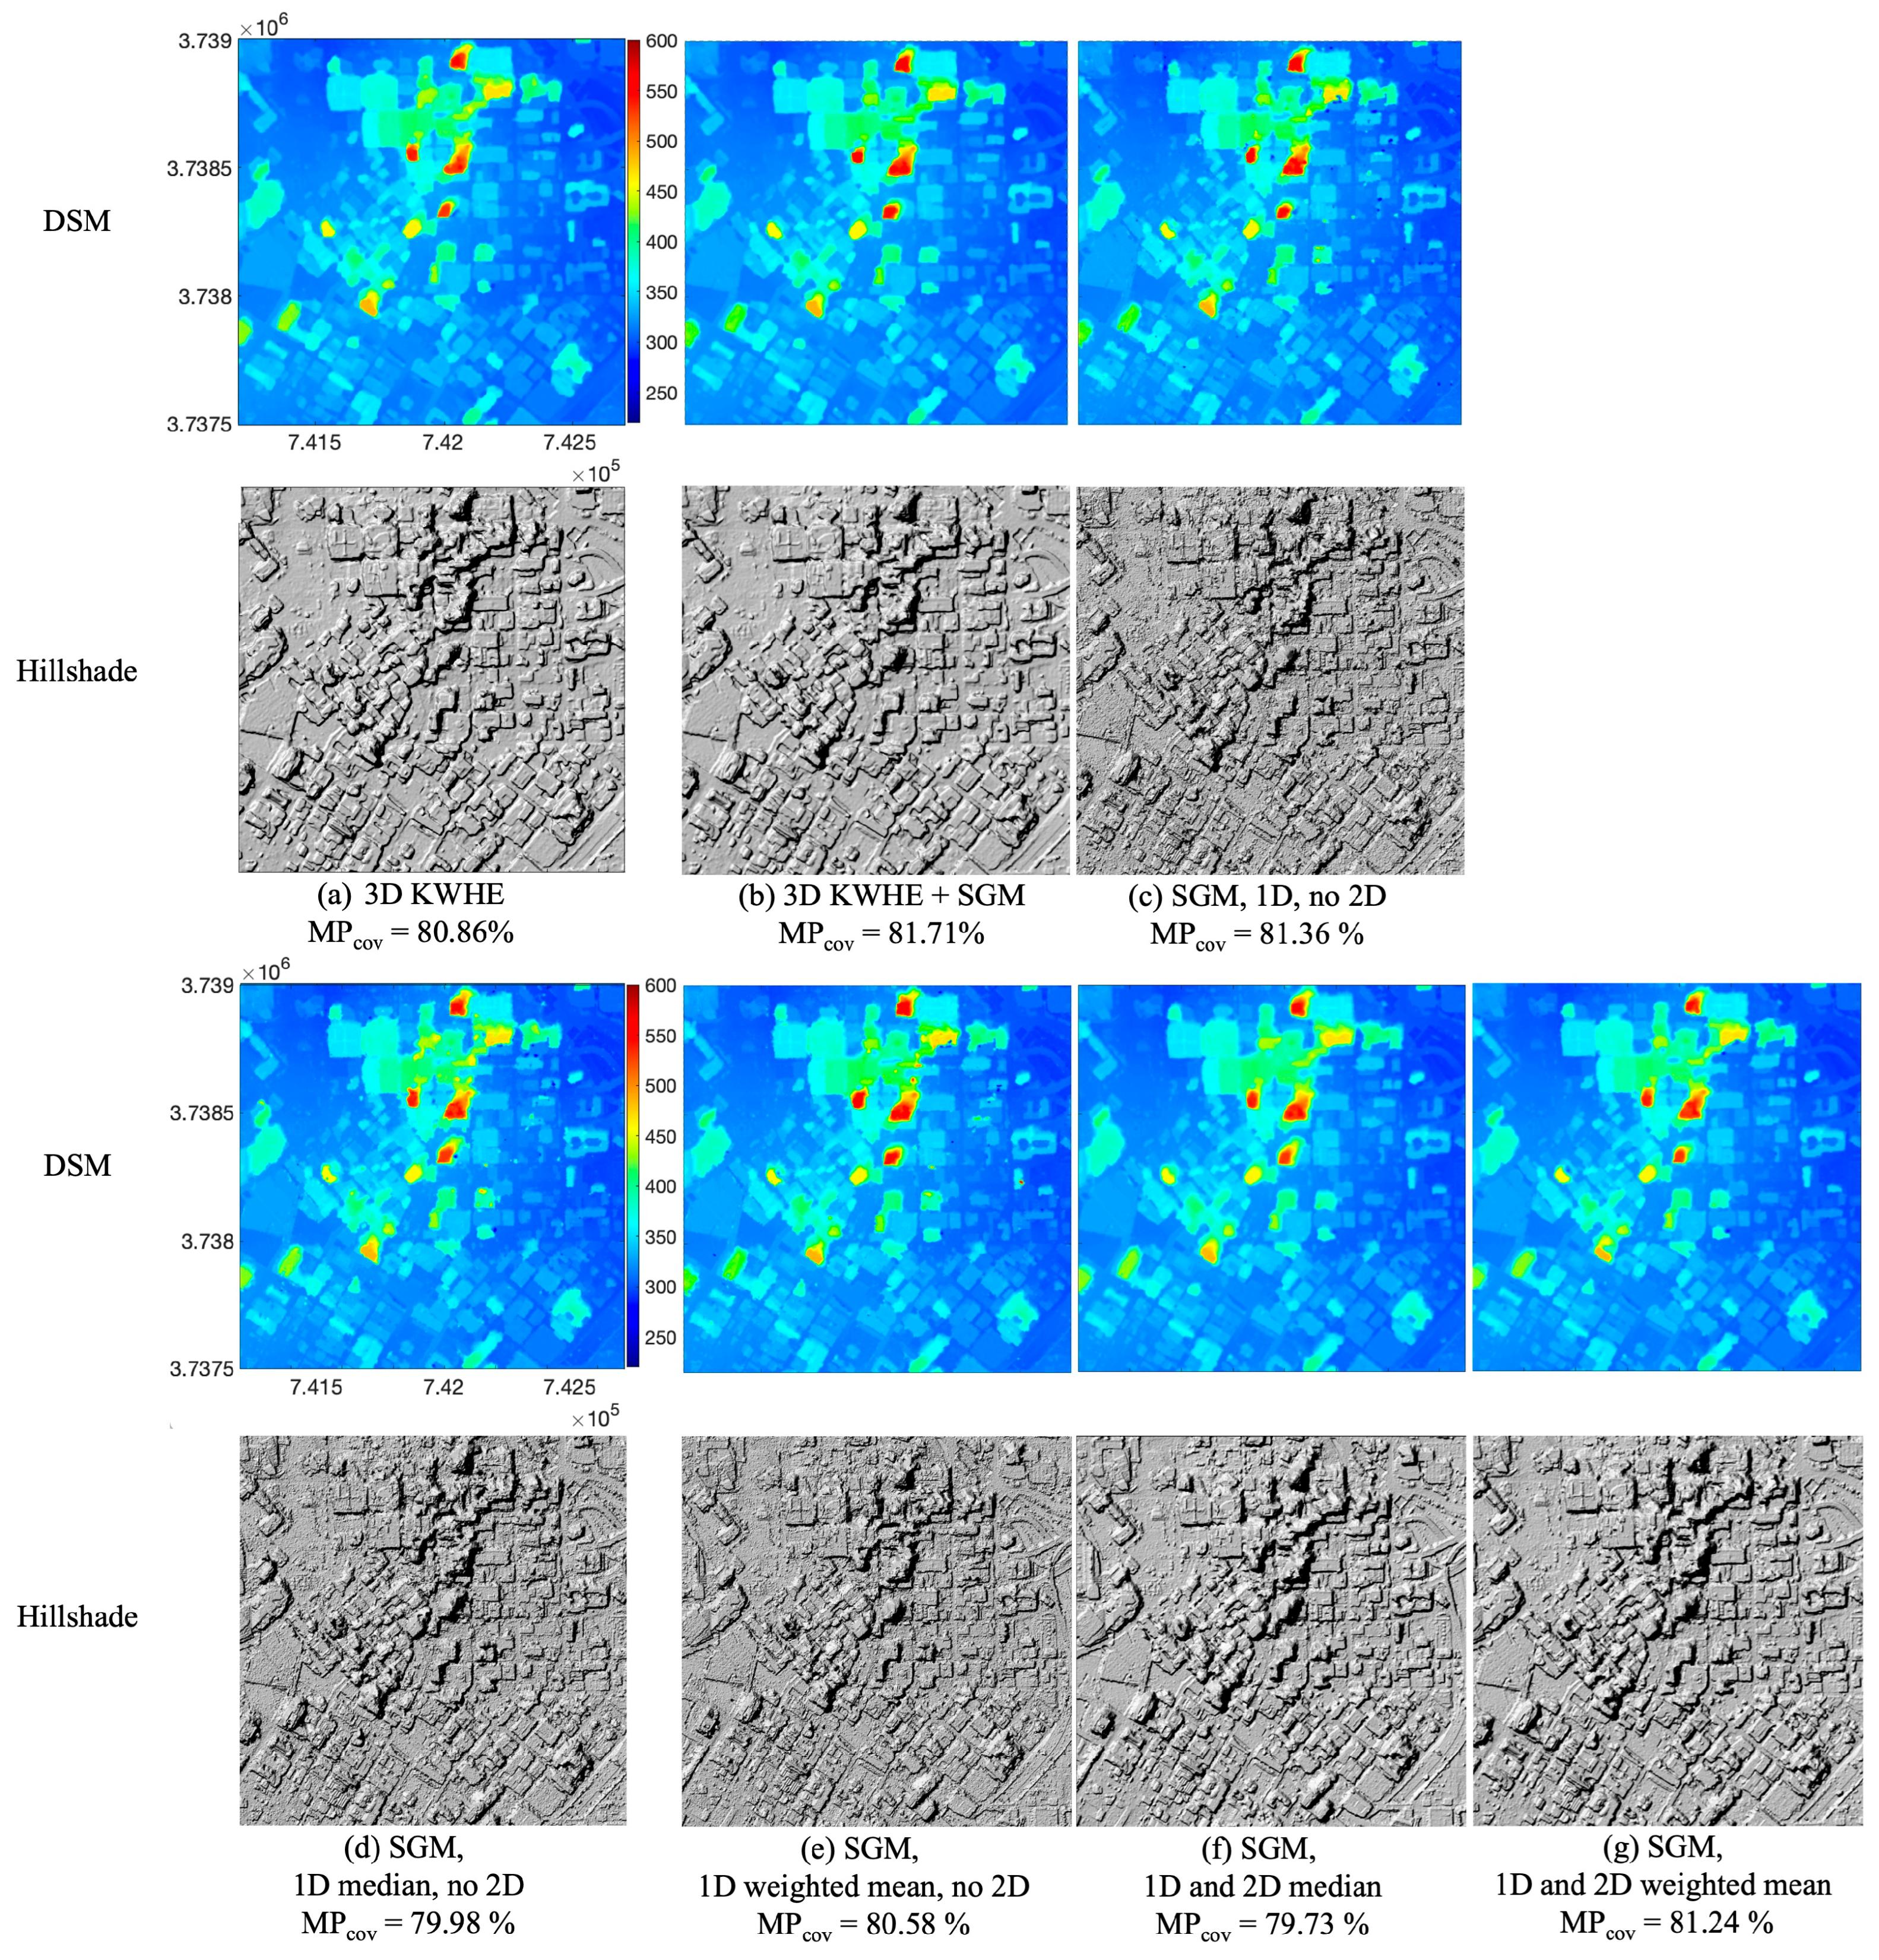
Figure 19 presents a quality comparison with 8-directional semi-global matching (SGM) cost aggregation into the SETSM workflow, introducing six additional scenarios: 3D KWHE with SGM (Figure 19b), SGM with integrated weighted optimal heights in 1D height-interval processing (Figure 19c), SGM with median and mean optimal heights in 1D height-interval processing (Figure 19d,e), and SGM with both median and mean values in 1D and 2D processing. Table 2 summarizes the quality statistics according to applied methods from (a) to (g) in Figure 19. Applying SGM without 2D kernel-based processing in SETSM reduces noise by increasing MPcov within 10 m and within 0 m to 2 m absolute height difference ranges by 3.16% and 3.69%, respectively (Figure 17c and Figure 19c). However, SGM alone cannot sufficiently suppress low-frequency surface noise on smooth surfaces and falls short of matching the quality achieved by the 3D KWHE method in SETSM. Among the SGM scenarios, using median and weighted mean optimal heights within 1D interval-height processing (Figure 19d,e) results in more blunders and noise, with both 3.20 m and RMSE and 79.98% and 80.58% MPcov, respectively. Ref. [14] proposes an SGM 1D weighted mean approach with median values to fuse multiple disparities such as Figure 19e. With additional 2D processing in the weighted mean approach, surface noise and blunders are more reduced than without 2D processing, improving RMSE by 0.06 m and MPcov by 0.66%. In contrast, integrating 3D KWHE with SGM (Figure 19b) results in the best performance, improving DSM quality and increasing MPcov within 10 m and within 0–4 m height differences by 0.85% and 0.76%, respectively, and achieving a similar RMSE of 3.10 m. These results demonstrate that the proposed 3D KWHE enhances DSM quality in terms of edge preservation and surface noise reduction compared to the SGM-only approach. Additionally, combining SGM with 3D KWHE can further improve DSM quality in the SETSM workflow with approximately 3% increased processing time.
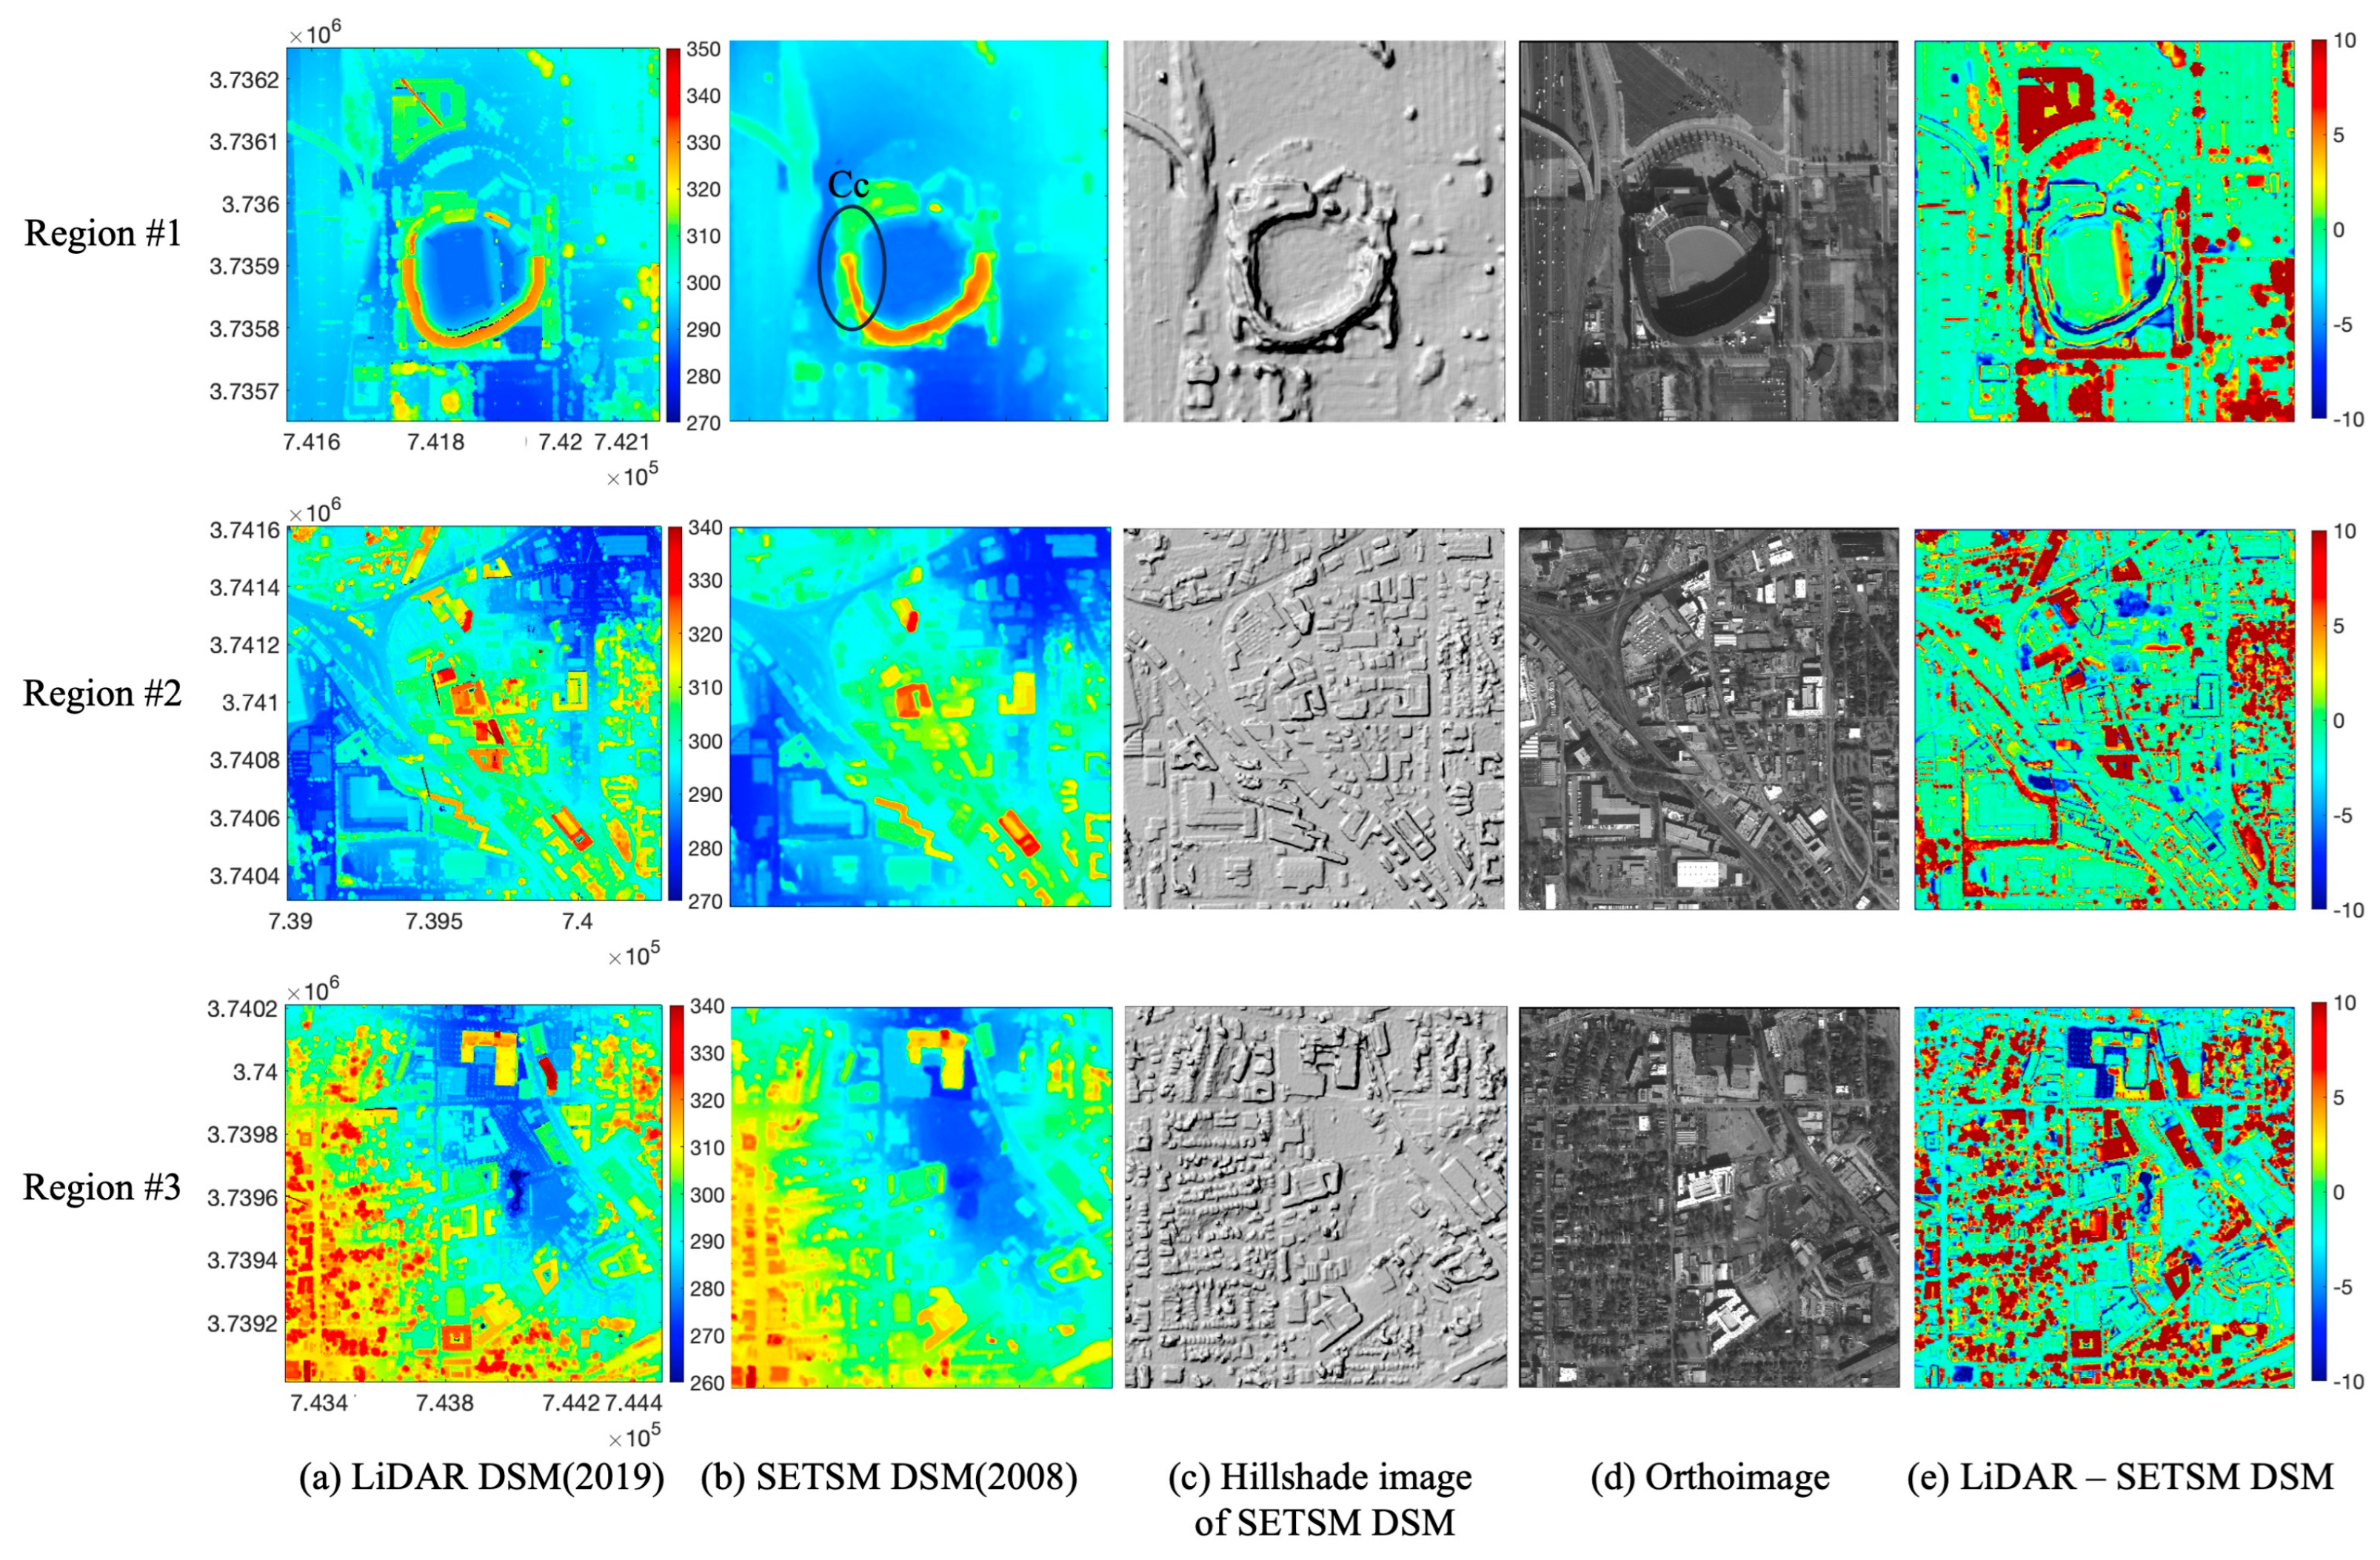
To further demonstrate the quality comparison, three additional regions with approximately 80 m elevation ranges were selected as shown in Figure 20, which includes the LiDAR DSM (2018), the SETSM DSM (2009), a hillshade image of the SETSM DSM, the orthoimage, and a height difference map between the LiDAR and SETSM DSMs. In region #1, the shape and outline of the Center Parc Stadium were successfully reconstructed, despite the infields being obscured due to shadows. However, the upper section of the stadium indicated by Cc in Figure 20b was not fully reconstructed. Surface changes are clearly identifiable in the height difference map, highlighting the transformation of a baseball field into a soccer stadium and allowing the measurement of newly planted trees’ heights. In regions #2 and #3, all built features are accurately extracted, with well-preserved edge information and effectively suppressed surface noise. The change detection map in Figure 20e reveals surface changes over the 9-year period, including newly built structures and vegetation growth.

4.2. SETSM DSMs with DMC Multiple Images

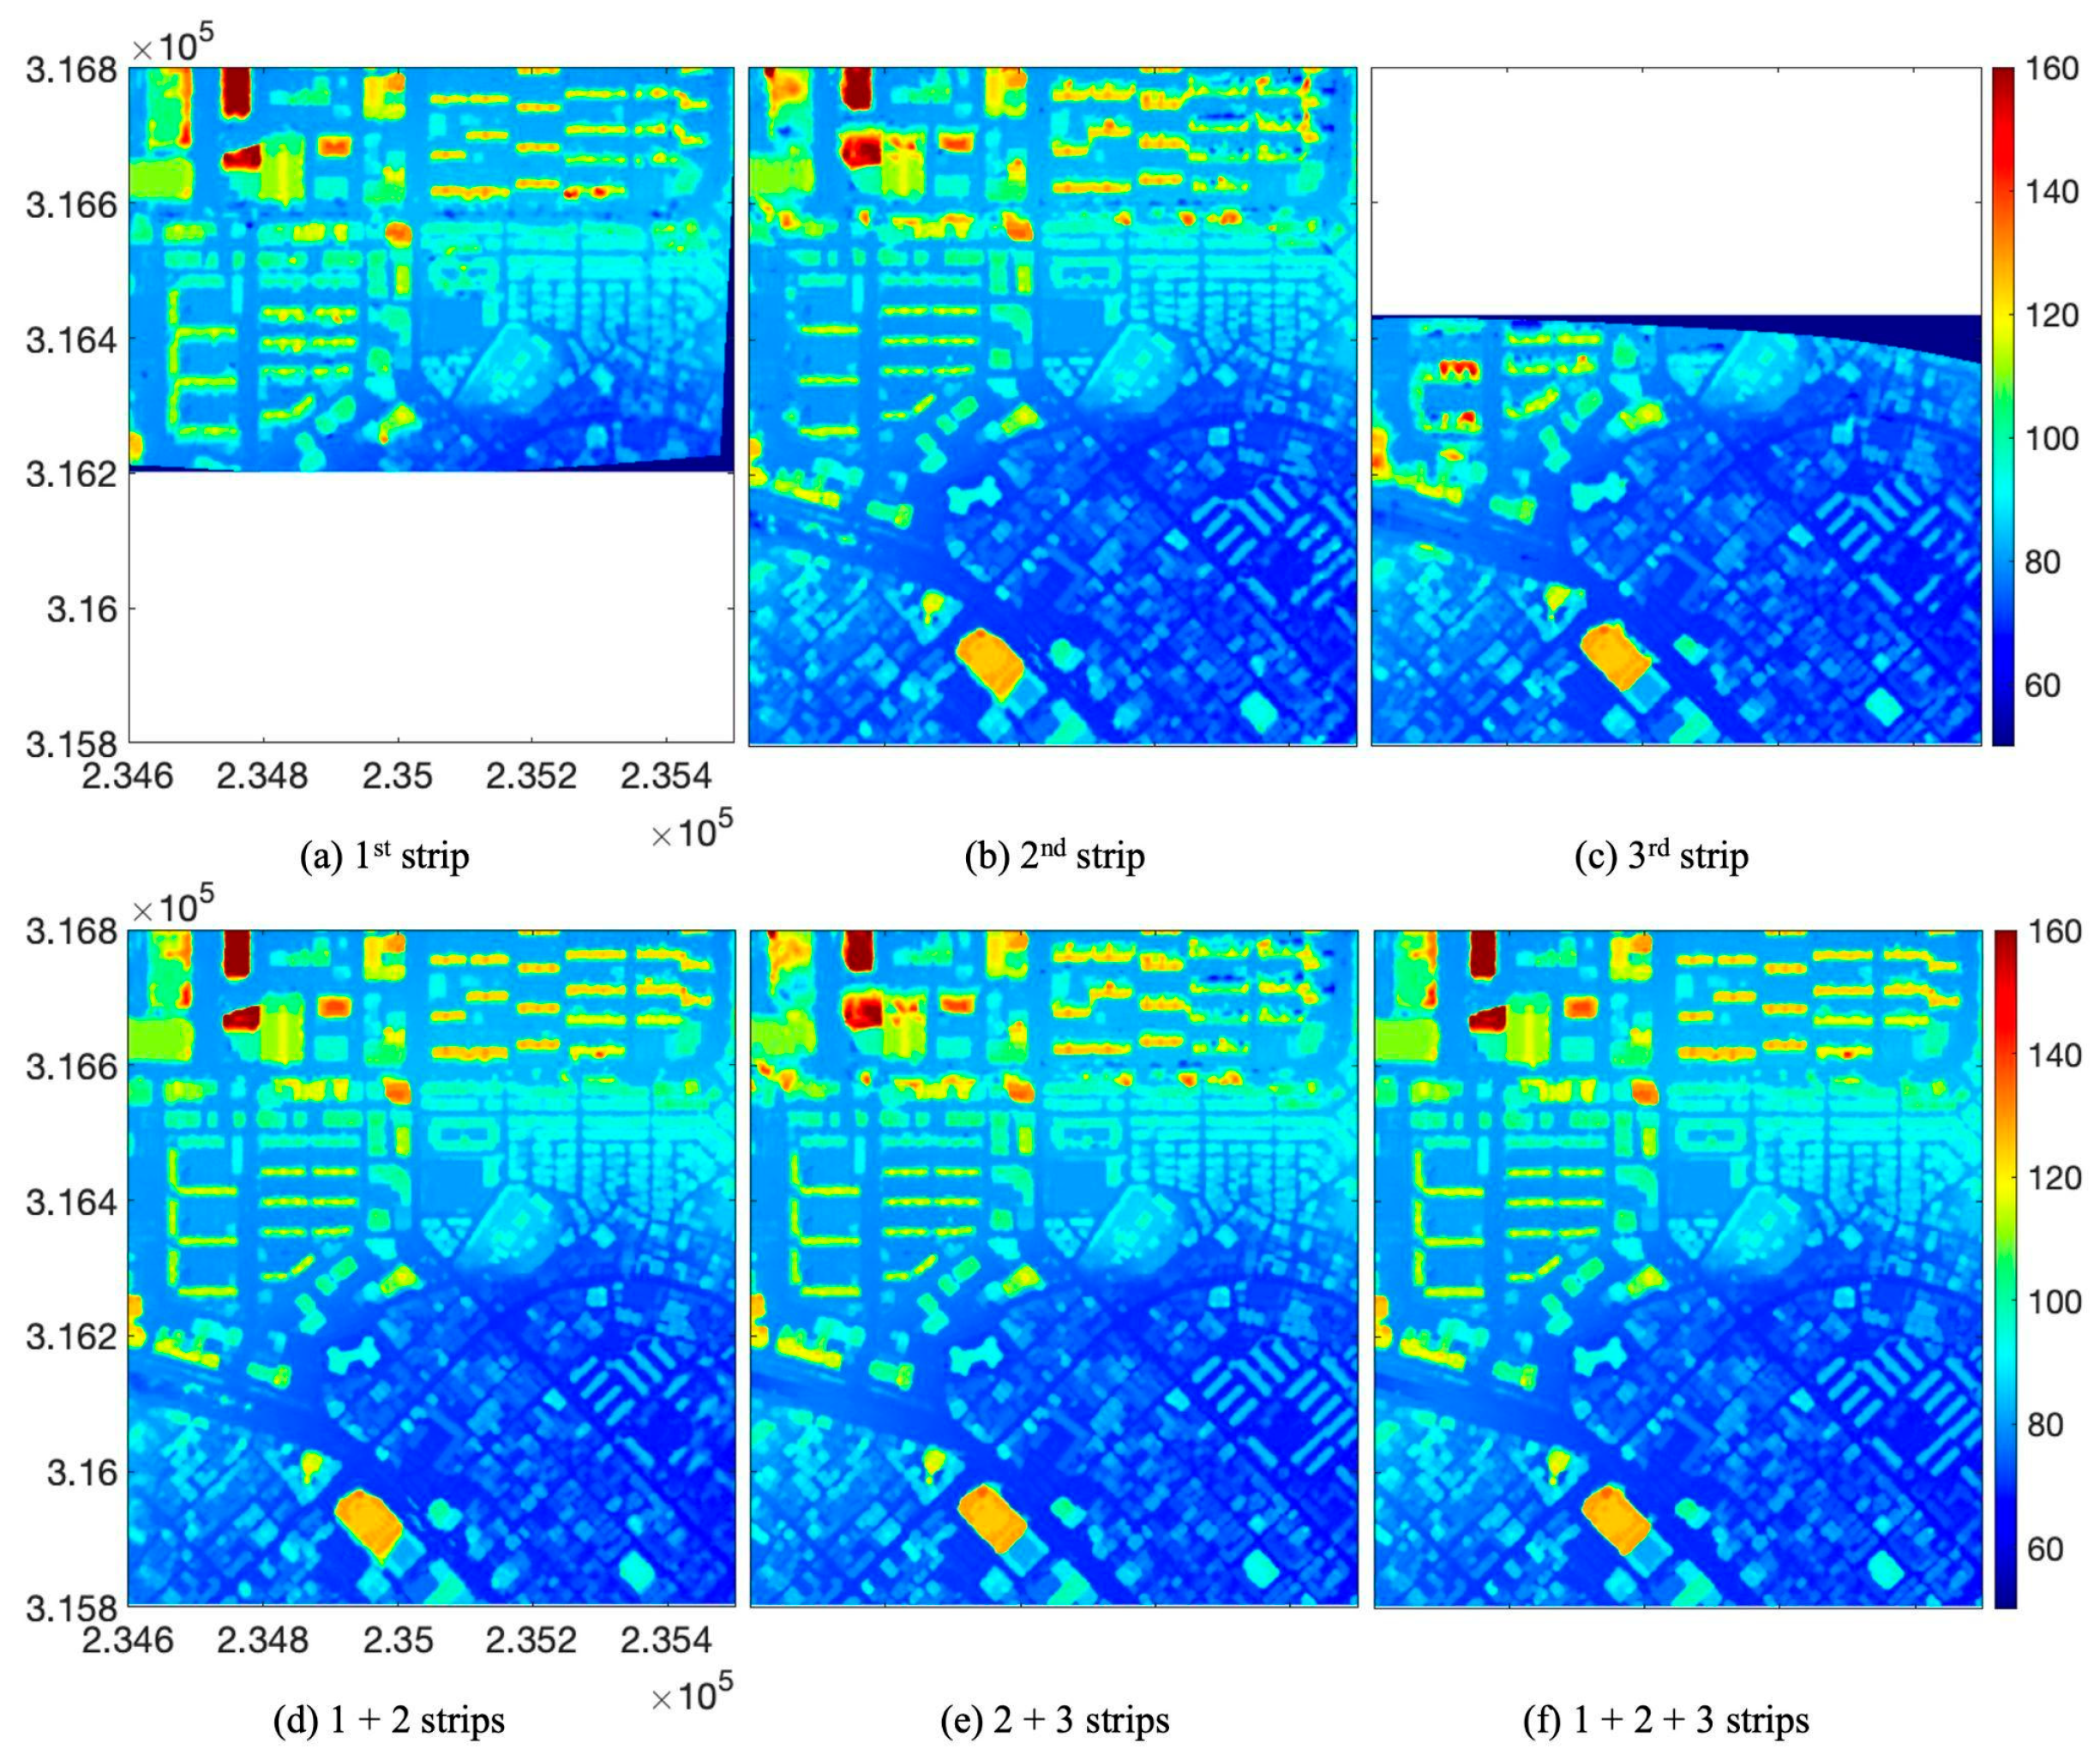
DMC images are captured by a frame sensor with central projective geometry. Due to the radial direction of relief displacements and occlusions inherent in central projection, the surface visibility of each image depends on the locations of projection centers. The reference images of MPs are individually decided by the locations of MPs and projection centers. To maximize image visibility, a reference image for each MP is selected based on the minimum distance between the projection center of the image and the image position projected from the 3D voxel coordinates of the MP. Given the complexity of image geometry, DMC images are utilized to demonstrate the ability of SETSM MMP to recover occlusions. Figure 21 shows 0.5-m gridded SETSM DSMs, extracted from the DMC image set, according to combinations of strip data. Each strip has individual lines of projection centers: north for the first strip, center for the second strip, and south for the third strip. Figure 21a–c illustrates the matching failures and the interpolated MPs caused by occlusions, corresponding to the locations of projection centers. By combining the first and second strips in Figure 21d, the northern regions that failed to recover surface information from the second image strip are successfully reconstructed with ground and building surfaces by utilizing the first strip’s image textures to recover the occlusions. Similarly, the problematic surfaces in the northern regions of the third strip are clearly reconstructed using the second strip’s images, as shown in Figure 21e. With the combination of all three strips, all the visible surfaces from all the applied images are successfully recovered, eliminating loss due to occlusions. Table 3 presents the occlusion recovery statistics for each strip after strip combination. The percentage of occlusion recovery is calculated as the ratio of occlusion grids recovered by the combined strip to the total number of grids in each strip. When all three strips are combined, the occlusions are recovered by 22.40%, 17.36%, and 14.29% for each strip of 1, 2, and 3, respectively, corresponding to the central perspective view direction, and the recovery results are propagated from the pairwise combinations of the first and second strips and the second and third strips.
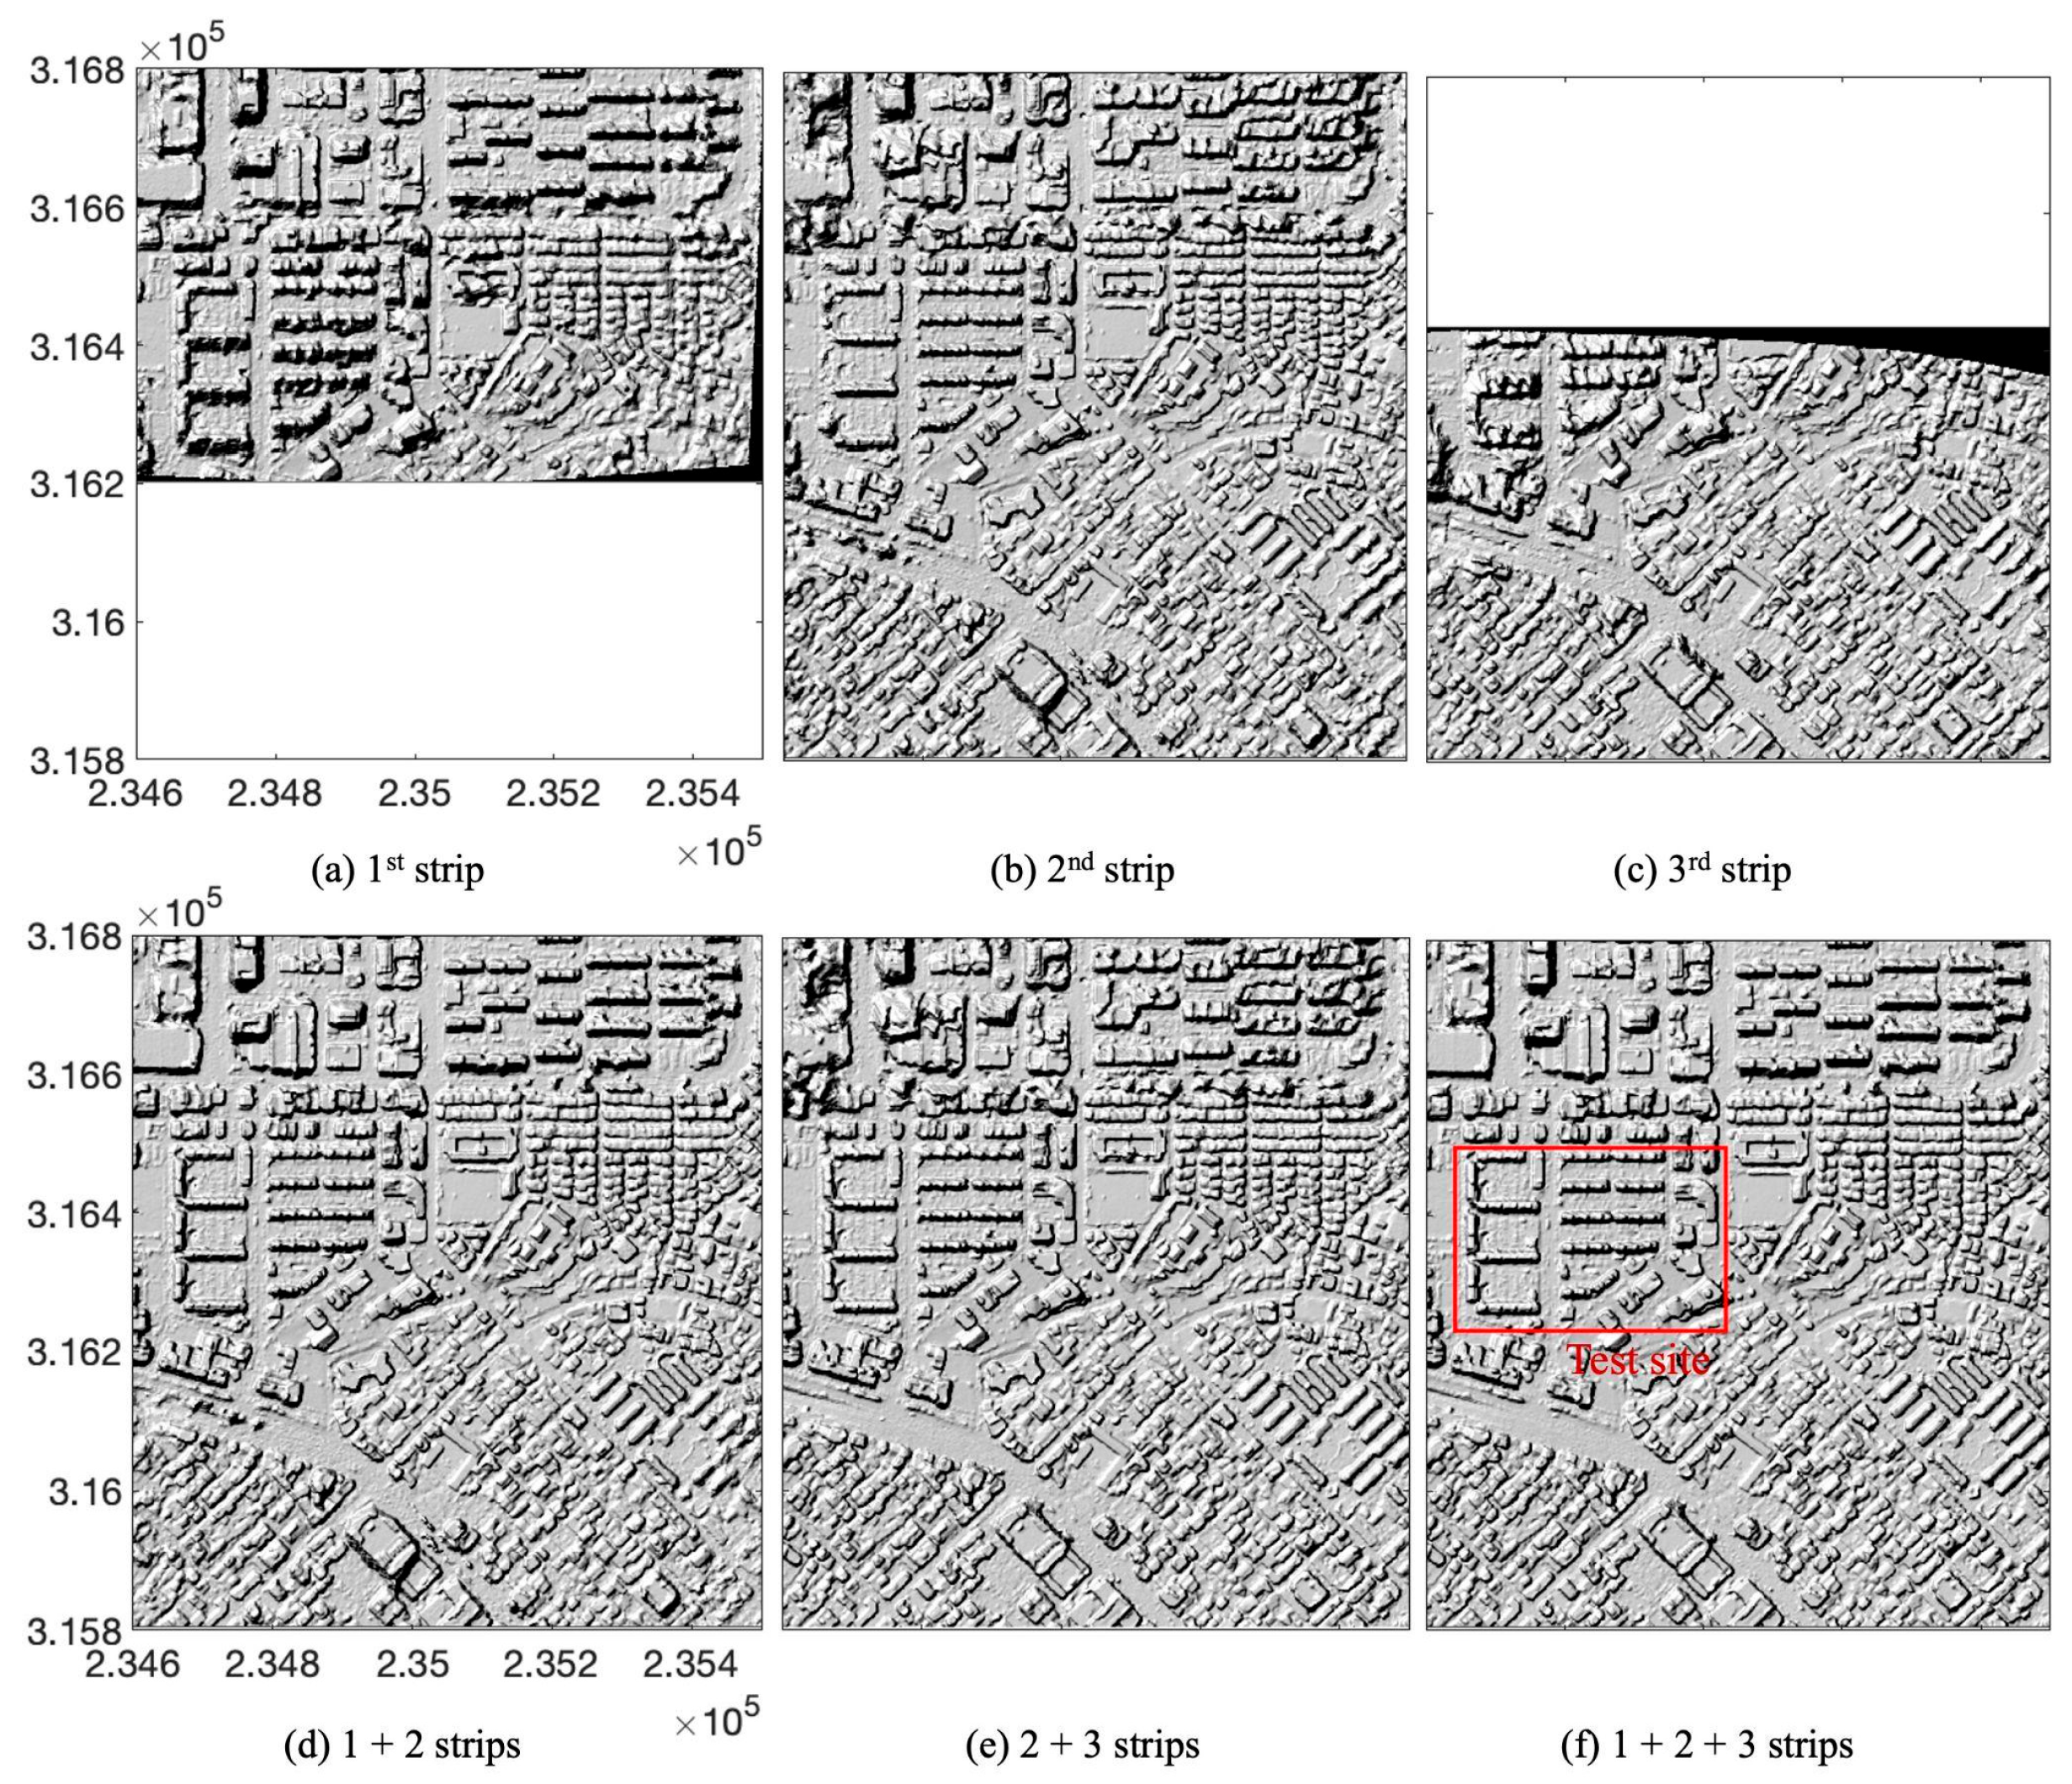
Furthermore, matching failures and interpolated MPs from each strip do not affect the quality of DSM in the combined result, as shown in Figure 21f, resulting in the best quality of DSM. This demonstrates the robustness and performance of SETSM MMP with the 3D KWHE algorithm in recovering and reconstructing 3D information from multiple images. Figure 22 shows hillshade images corresponding to the strip combinations. The test site in Figure 22f (red box) is selected for a detailed comparison between the quality of DSM in Figure 23 and the original DMC images in Figure 24. The six DMC images exhibit independent directions and amounts of relief displacement and occlusions. SETSM MMP extracts the best 3D object surface information from all the available images, minimizing surface roughness and noise, as shown in Figure 23b.

5. Discussion

In this paper, we present a novel object-based multiple image matching algorithm based on the stereopair SETSM algorithm, which has been widely validated for its capability to automatically generate DSMs using satellite imagery, contributing to ArcticDEMs and REMA projects. To address occlusions in single stereopairs that severely degrade matching quality, we extended the capabilities of the stereopair SETSM algorithm to support multiple image matching. We provide an overview of the essential components of the stereopair SETSM algorithm, detailing the key parameters necessary for the multiple image matching procedures. Our contributions include innovative methods for determining the height increment (dh) based on the stereo model height accuracy, automatically selecting optimal WNCC thresholds (WNCCth) based on the distribution of WNCC, integrating 3D voxels to enhance matching accuracy, and implementing blunder detection techniques. Furthermore, we propose a pixel-to-pixel similarity measurement method to improve the matching accuracy in case of discrepancies in GSD between images. To accurately and efficiently merge optimal heights from all stereopairs in an object–space matching scheme, we developed the object-based Kernel-based Weighted Estimation (KWHE) algorithm, employing a new sequential 3D processing approach. This algorithm assigns reliability levels to each optimal height through integrated weighting, considering stereo model accuracy, image matching similarity, and GSD differences in the vertical direction. Subsequently, optimal heights are determined through 1D height interval processing based on the integrated weights. Based on these optimal heights, a 2D kernel-based processing minimizes surface roughness and noise while preserving edge information in DSMs. We validated SETSM MMP using both satellite WorldView-2 and air-borne DMC imagery. Although WorldView images and reference DSM are separated by 9 years, causing significant surface changes in structures and vegetation and temporal errors in DSM quality assessments, comparative analysis with reference USGS 1-m LiDAR DSM demonstrates the efficacy of our approach in utilizing the multiple observations for accurately extracting true heights, increasing the successful matching ratio, and minimizing the problem of reduced search space. In addition, the quality and accuracy of DSMs are improved by increasing stereo model accuracy and through mitigation of variable GSDs between images. Failed structures in the single stereopair SETSM DSM are successfully extracted with SETSM MMP. With the 3D KWHE algorithm, the edge sharpness of structures and smoothness of continuous surfaces are accordingly represented in the DSMs compared to the reference LiDAR DSM. The 1D interval-height processing with integrated weighted optimal heights effectively improves DSM quality compared to approaches using median and mean optimal heights. Additionally, 2D kernel-based processing outperforms SGM in reducing surface noise while effectively preserving object edge information. DSM quality generated from SETSM MMP can be further improved by adapting SGM cost aggregation. The air-borne three-strip DMC frame images with central projective geometry are used to validate the ability to resolve occlusions. The 0.5-m gridded DSM generated with all three strip images shows that all occluded regions on each strip DSM are successfully recovered with edge-preserved structures and surface smoothness. As with the single-pair SETSM, all DSMs from the WorldView-2 and DMC images are automatically generated without any user-defined or surface-dependent parameters. Our results demonstrate that SETSM MMP is adaptable to different sensor types and GSD differences, effective in extracting object heights according to stereo model accuracy, and robust with automatic processing. Since we only used WorldView satellite imagery oriented toward the northeast, SETSM MMP may produce DSMs of varying quality depending on viewing geometry. The SETSM MMP successfully expands the capabilities of the stereopair SETSM to resolve occlusions and increase matching quality from multiple images over urban regions, while inheriting the merits of the stereopair SETSM algorithm. SETSM adopts a tiling scheme for processing the target area to prevent physical memory issues and to accelerate processing speed. When handling large-scale datasets with extensive surface height variations, such as non-urban areas in SETSM MMP, the tile size and DSM output resolution should be empirically determined by scaling tests based on both the capacity of the computing system and the surface height range, which determines the number of 3D voxels.

6. Conclusions

We successfully expanded stereopair SETSM to multi-pair image matching by automatically adjusting the required parameters of incremental heights and similarity measurements and by introducing a novel 3D KWHE algorithm to estimate optimal surface heights from multiple height candidates. The sequential 1D and 2D processing in 3D KWHE enhances DSM quality by effectively incorporating stereo viewing geometry and matching quality, while reducing surface noises over flat terrain and preserving edge information, comparable to the SGM algorithm. The experiment results using aerial central projective images demonstrate the effectiveness of SETSM MMP in resolving occlusions and improving DSM quality.
In the future, we plan to validate the developed SETSM MMP using multi-pair satellite images acquired over diverse terrain types and viewing geometries to support application to other imagery sources for expanded terrain measurement and surface monitoring. In particular, we will explore application to the large volumes of imagery collected by the smallest constellations.

Author Contributions

Conceptualization, M.-J.N.; methodology, M.-J.N.; software, M.-J.N.; validation, M.-J.N.; formal analysis, M.-J.N.; investigation, M.-J.N.; resources, M.-J.N. and I.M.H.; data curation, M.-J.N. and I.M.H.; writing—original draft preparation, M.-J.N.; writing—review and editing, I.M.H.; visualization, M.-J.N.; supervision, I.M.H.; project administration, I.M.H.; funding acquisition, M.-J.N. and I.M.H. All authors have read and agreed to the published version of the manuscript.

Funding

This research was funded by grants #80NSSC22K1093 and #80NSSC20K1422 from the U.S. National Aeronautics and Space Administration and #1559691 from the U.S. National Science Foundation Office of Polar Programs.

Data Availability Statement

LiDAR data were downloaded from the United State Geological Survey 3D Elevation Program (https://www.usgs.gov/the-national-map-data-delivery/gis-data-download (accessed on 22 July 2025)). Maxar WorldView images were obtained from the Polar Geospatial Center as part of the EarthDEM project supported by the National Geospatial-Intelligence Agency (NGA) and National Science Foundation Office of Polar Programs (NSF OPP A010607701). Air-borne DMC images are not available due to technical/time limitations.

Acknowledgments

The Polar Geospatial Center provided the satellite imagery.

Conflicts of Interest

The authors declare no conflicts of interest. The funders had no role in the design of this study; in the collection, analyses, or interpretation of data; in the writing of this manuscript; or in the decision to publish the results.

Abbreviations

The following abbreviations are used in this manuscript:
SETSMSurface Extraction by TIN-based Search-space Minimization
MMPmultiple-pair matching procedure
DSMDigital Surface Model
REMAReference Elevation Models for Antarctica
KWHEKernel-based Weighted Height Estimation
GSDground sample distance
DMCdigital modular camera
CNNConvolutional Neural Network
PSM-Netpyramid stereo-matching network
GCS-Netgroup-wise correlation stereo network
CVA-NetCost Volume Analysis Network
VLLVertical Line Locus
NCCNormalized Cross-Correlation
MDEMatching Distance Error
WNCCweighted normalized cross-correlation
UNCCUncorrected Normalized Cross-Correlation
GNCCgeometrically corrected normalized cross-correlation
SIFTScale-Invariant Feature Transformation
TINTriangulated Irregular Network
MPMatching Position
RFMRational Function Model
RPCRational Polynomial Coefficient
RSMRigorous Sensor Model
GCPGround Control Point
LSFLocal Surface Fitting
USGSUnited States Geological Survey
3DEPThree-dimensional Elevation Program

References

  1. Noh, M.-J.; Howat, I.M. The Surface Extraction from TIN based Search-space Minimization (SETSM) algorithm. ISPRS J. Photogramm. Remote Sens. 2017, 129, 55–76. [Google Scholar] [CrossRef]
  2. Noh, M.-J.; Howat, I.M. Automated stereo-photogrammetric DEM generation at high latitudes: Surface Extraction with TIN-based Search-space Minimization (SETSM) validation and demonstration over glaciated regions. GISci. Remote Sens. 2015, 52, 198–217. [Google Scholar] [CrossRef]
  3. Howat, I.M.; Porter, C.; Smith, B.E.; Noh, M.-J.; Morin, P. The Reference Elevation Model of Antarctica. Cryosphere 2019, 13, 665–674. [Google Scholar] [CrossRef]
  4. Höhle, J. Automated mapping of buildings through classification of DSM-based ortho-images and cartographic enhancement. Int. J. Appl. Earth Obs. Geoinf. 2021, 95, 102237. [Google Scholar] [CrossRef]
  5. Du, S.; Liu, H.; Xing, J.; Du, S. Fusing multimodal data of nature-economy-society for large-scale urban building height estimation. Int. J. Appl. Earth Obs. Geoinf. 2024, 129, 103809. [Google Scholar] [CrossRef]
  6. Chang, J.-R.; Chen, Y.-S. Pyramid stereo matching network. In Proceedings of the IEEE/CVF Conference on Computer Vision and Pattern Recognition, Salt Lake City, UT, USA, 18–23 June 2018. [Google Scholar]
  7. Guo, X.; Yang, K.; Yang, W.; Wang, X.; Li, H. Group-wise correlation stereo network. In Proceedings of the IEEE/CVF Conference on Computer Vision and Pattern Recognition, Long Beach, CA, USA, 15–20 June 2019. [Google Scholar]
  8. Mehltretter, M.; Heipke, C. Aleatoric uncertainty estimation for dense stereo matching via CNN-based cost volume analysis. ISPRS J. Photogramm. Remote Sens. 2021, 171, 63–75. [Google Scholar] [CrossRef]
  9. Gao, J.; Liu, J.; Ji, S. A general deep learning based framework for 3D reconstruction from multi-view stereo satellite images. ISPRS J. Photogramm. Remote Sens. 2023, 195, 446–461. [Google Scholar] [CrossRef]
  10. He, S.; Li, S.; Jiang, S.; Jiang, W. HMSM-Net: Hierarchical multi-scale matching network for disparity estimation of high-resolution satellite stereo images. ISPRS J. Photogramm. Remote Sens. 2022, 188, 314–330. [Google Scholar] [CrossRef]
  11. Collins, R.T. Space-sweep approach to true multi-image matching. In Proceedings of the CVPR IEEE Computer Society Conference on Computer Vision and Pattern Recognition, San Francisco, CA, USA, 18–20 June 1996. [Google Scholar]
  12. Guan, T.; Chang, S.; Deng, Y.; Xue, F.; Wang, C.; Jia, X. Oriented SAR ship detection based on edge deformable convolution and point set representation. Remote Sens. 2025, 17, 1612. [Google Scholar] [CrossRef]
  13. Tian, Z.; Wang, W.; Zhou, K.; Song, X.; Shen, Y.; Liu, S. Weighted pseudo-labels and bounding boxes for semisupervised SAR target detection. IEEE J. Sel. Top. Appl. Earth Obs. Remote Sens. 2024, 17, 5193–5203. [Google Scholar] [CrossRef]
  14. Hirschmuller, H. Stereo processing by semiglobal matching and mutual information. IEEE Trans. Pattern Anal. Mach. Intell. 2008, 30, 328–341. [Google Scholar] [CrossRef]
  15. Rupnik, E.; Pierrot-Deseilligny, M.; Delorme, A. 3D reconstruction from multi-view VHR-satellite images in MicMac. ISPRS J. Photogramm. Remote Sens. 2018, 139, 201–211. [Google Scholar] [CrossRef]
  16. Bulatov, D.; Wernerus, P.; Heipke, C. Multi-view dense matching supported by triangular meshes. ISPRS J. Photogramm. Remote Sens. 2011, 66, 907–918. [Google Scholar] [CrossRef]
  17. Lv, B.; Liu, J.; Wang, P.; Yasir, M. DSM generation from multi-view high-resolution satellite images based on the photometric mesh refinement method. Remote Sens. 2022, 14, 6259. [Google Scholar] [CrossRef]
  18. Stathopoulou, E.K.; Battisti, R.; Cernea, D.; Georgopoulos, A. Multiple view stereo with quadtree-guided priors. ISPRS J. Photogramm. Remote Sens. 2023, 196, 197–209. [Google Scholar] [CrossRef]
  19. Shen, S. Accurate multiple view 3D reconstruction using patch-based stereo for large-scale scenes. IEEE Trans. Image Process. 2013, 22, 1901–1914. [Google Scholar] [CrossRef]
  20. Schenk, T. Digital Photogrammetry, 3rd ed.; TerraScience: Laurelville, OH, USA, 1999. [Google Scholar]
  21. Zhang, L.; Gruen, A. Multi-image matching for DSM generation from IKONOS imagery. ISPRS J. Photogramm. Remote Sens. 2006, 60, 195–211. [Google Scholar] [CrossRef]
  22. Zhang, K.; Sheng, Y.; Wang, M.; Fu, S. An enhanced multi-view vertical line locus matching algorithm of object space ground primitives based on positioning consistency for aerial and space images. ISPRS J. Photogram. Remote Sens. 2018, 139, 241–254. [Google Scholar] [CrossRef]
  23. Kim, J.-I.; Hyen, C.-U.; Han, H.; Kim, H.-C. Digital surface model generation for drifting Arctic sea ice with low-textured surface based on drone images. ISPRS J. Photogramm. Remote Sens. 2021, 172, 147–159. [Google Scholar] [CrossRef]
  24. Zhang, Y.; Zhang, Y.; Mo, D.; Zhang, Y.; Li, X. Direct digital surface model generation by semi-global vertical line locus matching. Remote Sens. 2017, 9, 214. [Google Scholar] [CrossRef]
  25. Chen, Y.-C.; Tseng, Y.-H.; Hsieh, C.-Y.; Wang, P.-C.; Tsai, P.-C. Object-space multi-image matching of mobile-mapping-system image sequences. Int. Arch. Photogramm. Remote Sens. Spat. Inf. Sci. 2012, 39, 465–470. [Google Scholar] [CrossRef]
  26. Li, R.; Zhou, F.; Niu, X.; Di, K. Integration of Ikonos and QuickBird Imagery for geopositioning accuracy analysis. Photogramm. Eng. Remote Sens. 2007, 73, 1067–1074. [Google Scholar]
  27. Noh, M.-J.; Howat, I.M. Applications of high-resolution, cross-track, pushbroom satellite images with the SETSM algorithm. IEEE J. Sel. Top. Appl. Earth Obs. Remote Sens. 2019, 12, 3885–3899. [Google Scholar] [CrossRef]
  28. Digital Mapping Camera System. Available online: https://aerial-survey-base.com/wp-content/uploads/2017/01/DMC-Brochure.pdf (accessed on 4 September 2025).
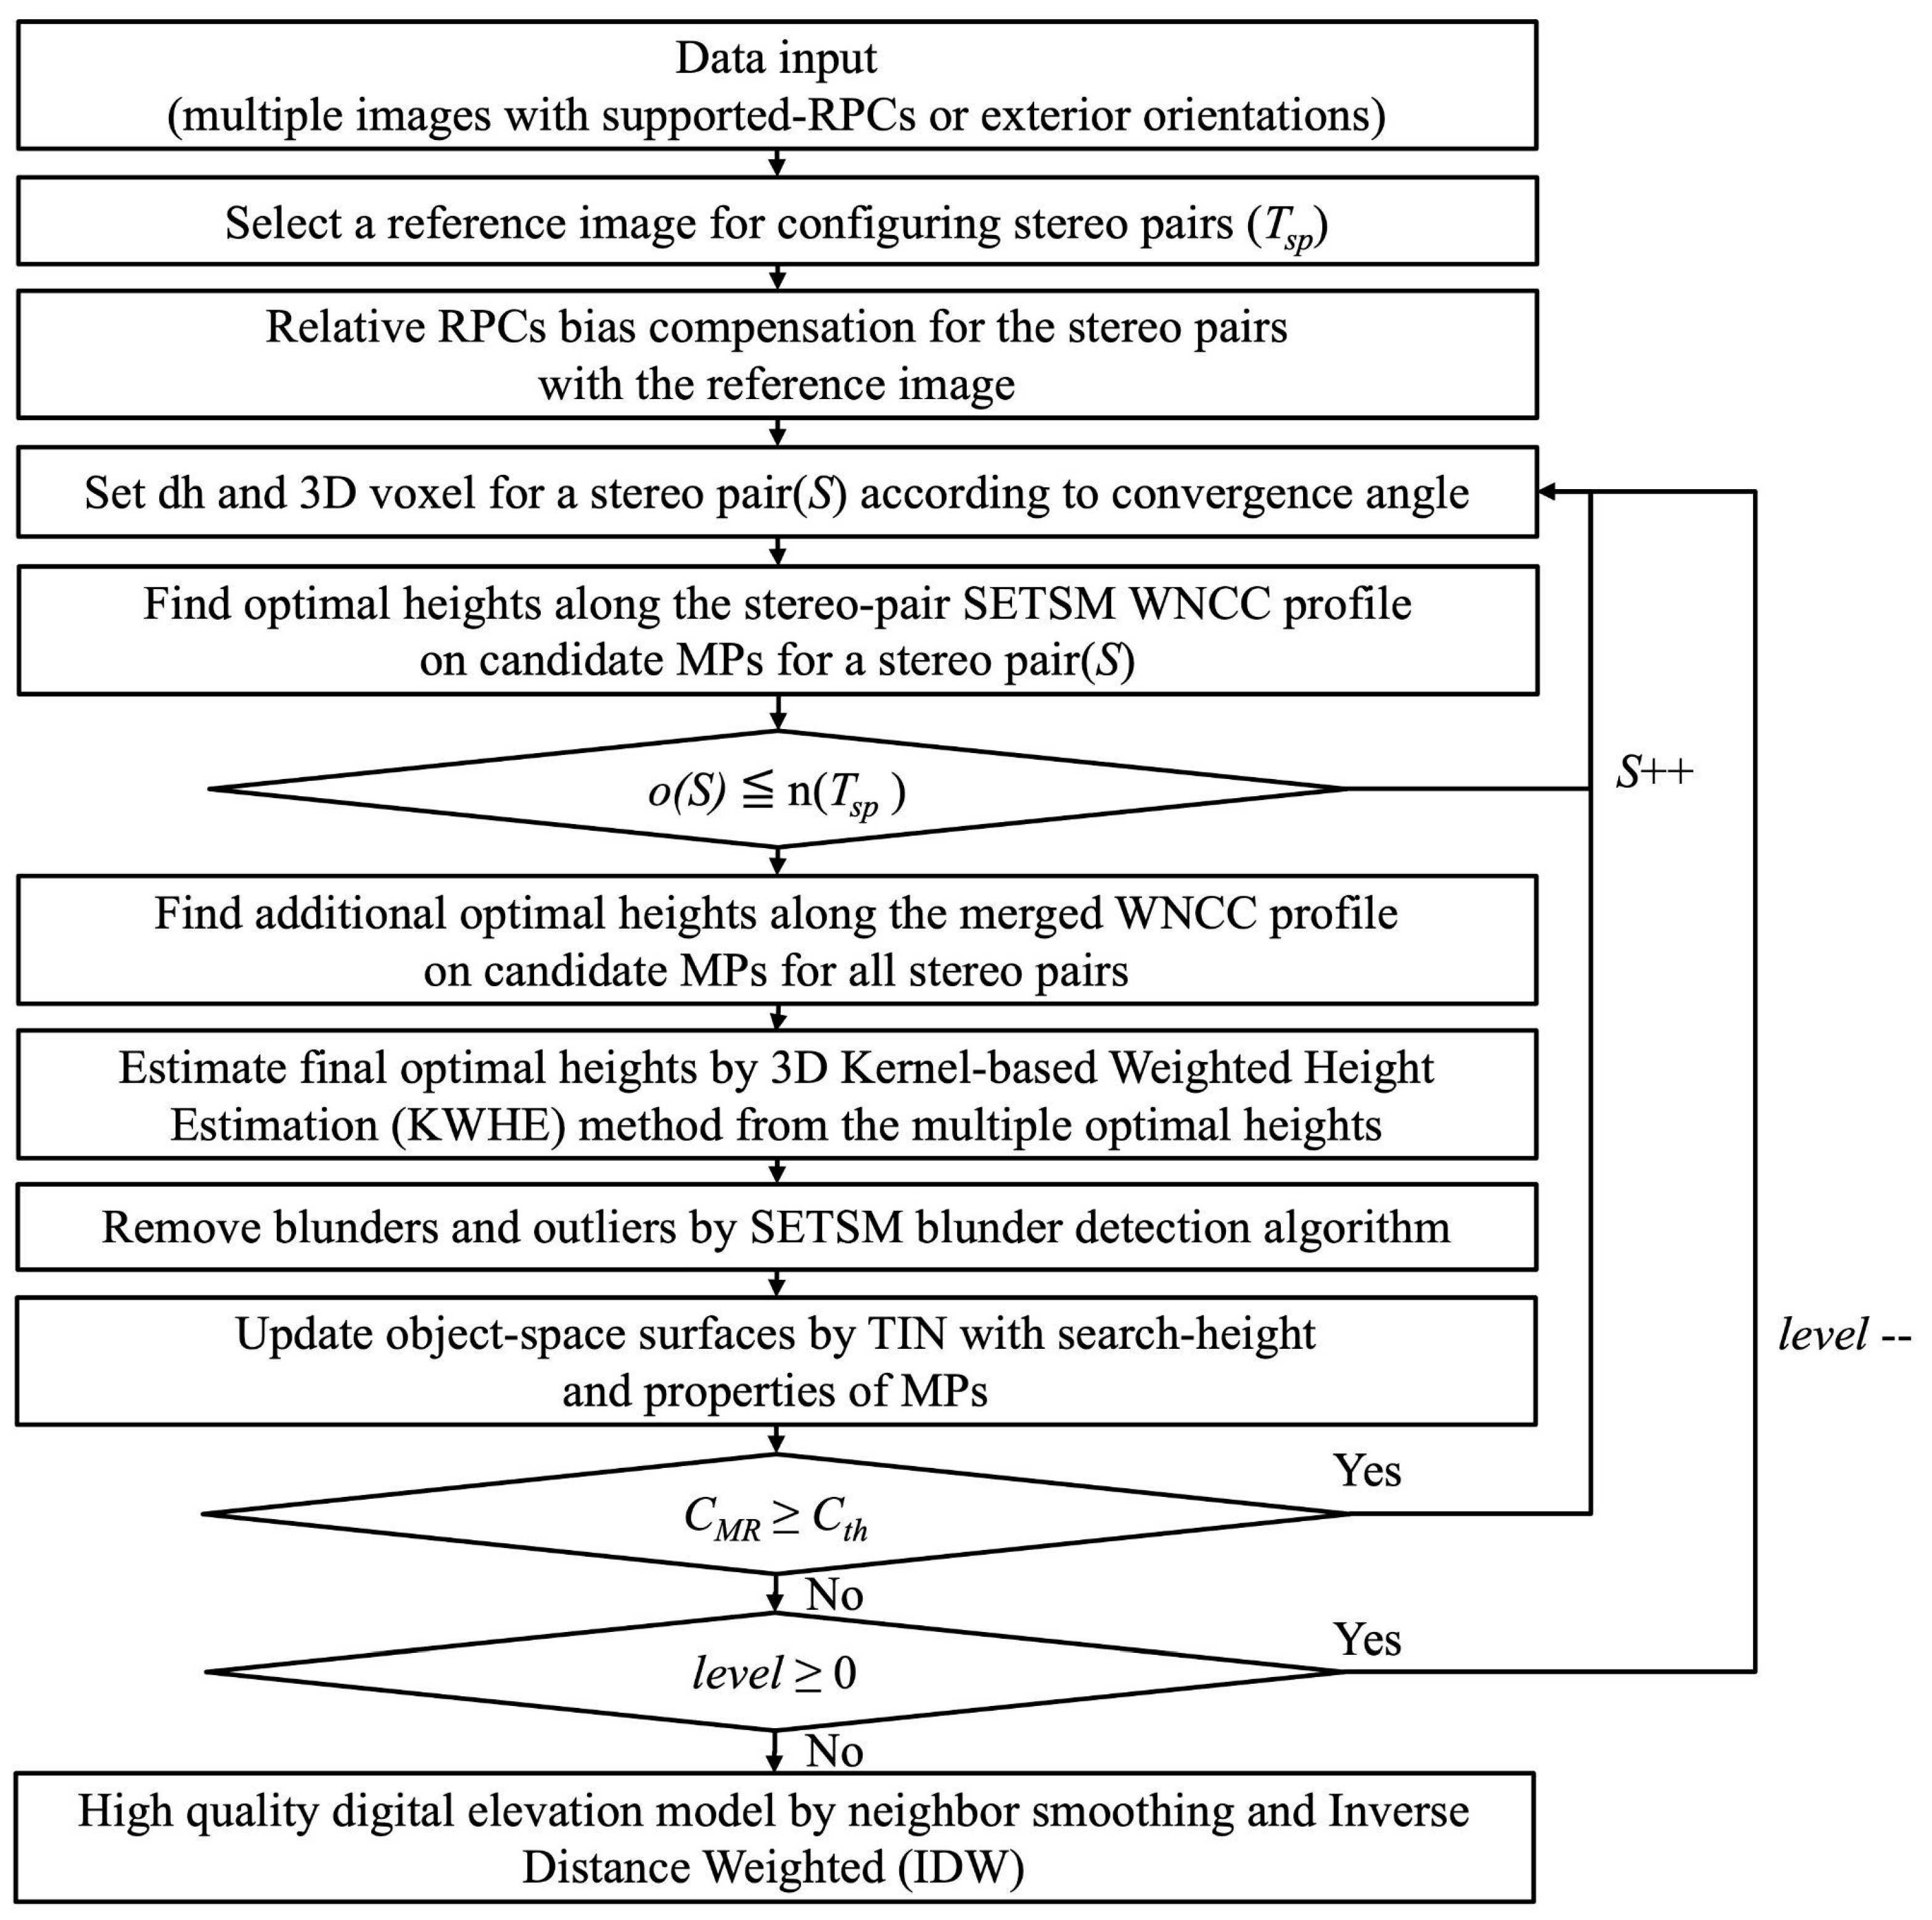
Figure 1. Workflow for SETSM MIMP. n(Tsp) and o(S) are the total number of stereopairs and order of a selected stereopair. CMR and Cth are the changes in matching rate between each iteration, and the threshold value of 0.001 (0.1%) for the CMR level is the integer pyramid level.
Remotesensing 17 03206 g001
Figure 2. Example of how WNCCth is determined for optimal height selection from the cumulative WNCCp at each WNCC interval starting from 1. Pwncc is the cumulative percentage threshold for selecting WNCCth.
Remotesensing 17 03206 g002
Figure 3. Illustration of merging multiple MP 3D voxels and WNCCs. Stereopair voxel n is the 3D voxel constructed by the dhn defined from the nth stereopair geometry. WNCCn is the similarity between corresponding points projected from the object position of the 3D voxel of the nth stereopair. WNCCmerged is the averaged WNCC from all the WNCCn. g is the DSM grid size.
Remotesensing 17 03206 g003
Figure 4. Pixel-to-pixel similarity measurement with GSD difference. Red lines are the kernel locations with 3-by-3 kernels, and blue dots are the corresponding pixel locations to measure similarity. Pixel values of the blue locations are resampled by bilinear interpolation from original resolution patches.
Remotesensing 17 03206 g004
Figure 5. Illustration of the 3D Kernel-based Weighted Height Estimation (KWHE) consisting of 1D processing in the vertical direction at each MP and 2D kernel-based processing on the xy plane. HI is the height interval, Mohs are the multiple optimal heights, Qoh is the query optimal height for calculating a weighted optimal height (WHq), and Soh are the selected optimal heights within the HI for the query optimal height (Qoh). KtMP defines the 2D kernel with t size centered around a target MP (K0MP).
Remotesensing 17 03206 g005
Figure 6. Flow diagram of 1D height-interval processing for estimating integrated weighted optimal heights. o(Qoh) and o(KMP) are the orders of Qoh and KMP, respectively. n(Moh) and n(MP) represent the total number of Moh and MP, respectively.
Remotesensing 17 03206 g006
Figure 7. Two-dimensional kernel-based processing for estimating final weighted optimal heights. o(KMP) is the order of target MP (KMP).
Remotesensing 17 03206 g007
Figure 8. Panchromatic images of WorldView-2. Imagery © 2009, MAXAR, Inc. (Westminster, CO, USA).
Remotesensing 17 03206 g008
Figure 9. Test target region. The complete target region (a) includes Atlanta’s tech square and hotel district. Image © 2025, Google. In this figure, (bg) depict the enlarged images of the target region from the original images. Imagery © 2009, MAXAR, Inc.
Remotesensing 17 03206 g009
Figure 10. Aligned panchromatic images of DMC.
Remotesensing 17 03206 g010
Figure 11. USGS 3DEP 1-m LiDAR DSM (left) and hillshade image (right). Axes are meters easting and northing in the UTM 16N projection, and the color scale is height above the WGS84 ellipsoid.
Remotesensing 17 03206 g011
Figure 12. WorldView-2 SETSM DSMs and hillshade images according to the number of applied images. Created from MAXAR imagery. In this figure, (a) is generated by stereopair SETSM, and (be) are results of SETSM MMP, respectively.
Remotesensing 17 03206 g012
Figure 13. Comparison between SETSM DSM with six WorldView-2 images and the reference LiDAR DSM. The test site is selected for more detailed comparison over structures. SETSM DSM was created by the MAXAR imagery.
Remotesensing 17 03206 g013
Figure 14. Statistics for MP success rate and RMSEs of height differences between the reference LiDAR and SETSM DSMs over the target region.
Remotesensing 17 03206 g014
Figure 15. Comparison between the SETSM DSM with six WorldView-2 images and the reference LiDAR DSM for the test site. SETSM DSM was created by the MAXAR imagery.
Remotesensing 17 03206 g015
Figure 16. WorldView-2 subset images for the test site located in Figure 13. Imagery © 2009, MAXAR, Inc.
Remotesensing 17 03206 g016
Figure 17. Quality comparison according to applied methods. In this figure, (a) is the 3D KWHE result, and (b) is the 3D KWHE result without the merged WNCC observation. (cf) are the results without 2D kernel-based processing; (c) applies only the 1D height-interval processing; (d) is the LSF applied result with 1D height-interval processing; and (e,f) apply the final optimal heights from median/mean values among all optimal heights from stereopairs, respectively.
Remotesensing 17 03206 g017
Figure 18. Quality statistics according to applied methods from (a) to (f) in Figure 17. The MPcov is separated by absolute height difference range with a 2 m interval: ‘0–2’, ‘2–4’, ‘4– 6’, ‘6–8’, and ‘8–10’.
Remotesensing 17 03206 g018
Figure 19. Quality comparison with SGM applications. In this figure, (a) is the 3D KWHE result, and (b) is the 3D KWHE result with 8-directional SGM cost aggregation. Moreover, (cf) are the results without 2D kernel-based processing with SGM cost aggregation: (c) applies only the 1D height-interval processing, and (d,e) apply the final optimal heights from median and weighted mean values among all optimal heights from stereopairs. (f,g) uses both median and weighted mean values in 1D and 2D processing.
Remotesensing 17 03206 g019
Figure 20. SETSM DSMs for three additional regions.
Remotesensing 17 03206 g020
Figure 21. DMC SETSM DSMs according to combinations of strip data. Each strip has five images. The DSMs are projected by TM (Transverse Mercator). Constructed by the MAXAR imagery.
Remotesensing 17 03206 g021
Figure 22. Hillshade images of DMC SETSM DSMs according to strip combinations. Constructed by the MAXAR imagery.
Remotesensing 17 03206 g022
Figure 23. DMC SETSM DSM and hillshade image for the test site. Constructed by the MAXAR imagery.
Remotesensing 17 03206 g023
Figure 24. DMC images for the test site.
Remotesensing 17 03206 g024
Table 1. Specifications of test WorldView-2 images. The image name is composed of sensor type (WV #), acquisition date (yyyymmdd), and time (hhmmss).
IDImage NameImage Pixel Size
(col by Row)
Col GSD
(m)
Row GSD
(m)
Product GSD
(m)
Off
Nadir
(deg)
Intrack
Angle
(deg)
1WV02_20091222_163622
(reference image)
35,840 by 34,8160.470.470.477.501.80
2WV02_20091222_16365035,840 by 30,7200.490.490.4914.90−12.50
3WV02_20091222_16371235,840 by 26,6240.560.540.5523.60−22.10
4WV02_20091222_16373335,840 by 23,5520.660.600.6331.20−30.00
5WV02_20091222_16375435,840 by 21,5040.770.670.7237.00−35.00
6WV02_20091222_16382335,840 by 17,4081.010.830.9244.10−43.20
Table 2. Quality statistics according to applied methods from (a) to (g) in Figure 19.
MethodQuality StatisticsMPcov (%)
Absolute Height Difference Ranging from 0 to 10 m
RMSE (m)MPcov (%)0–2 m2–4 m4–6 m6–8 m8–10 m
a3.1180.8656.3910.466.034.493.49
b3.1081.7156.6210.996.114.543.45
c3.1781.3655.0511.696.364.703.56
d3.2079.9853.9111.376.334.763.62
e3.2080.5854.0511.836.414.713.58
f3.2179.7353.8211.036.394.803.69
g3.1481.2455.7911.116.244.603.49
Table 3. Percentage of occlusion recovery for each strip by the combined strip.
Combined StripRecovered Occlusion (%)
Strip 1Strip 2Strip 3
1 + 222.0314.97-
2 + 3 9.9113.76
1 + 2 + 322.4017.3614.29
Disclaimer/Publisher’s Note: The statements, opinions and data contained in all publications are solely those of the individual author(s) and contributor(s) and not of MDPI and/or the editor(s). MDPI and/or the editor(s) disclaim responsibility for any injury to people or property resulting from any ideas, methods, instructions or products referred to in the content.