Technical Note

Understanding 20 Years of Vegetation Change in Deer-Impacted Grasslands

1
Faculty of Bioenvironmental Science, Kyoto University of Advanced Science, Kameoka 621-8555, Japan
2
Graduate School of Advanced Technology and Science, Tokushima University, Tokushima 770-8506, Japan
3
Graduate School of Technology, Industrial and Social Sciences, Tokushima University, Tokushima 770-8506, Japan
*
Author to whom correspondence should be addressed.
Remote Sens. 2025, 17(18), 3187; https://doi.org/10.3390/rs17183187
Submission received: 25 July 2025 / Revised: 11 September 2025 / Accepted: 11 September 2025 / Published: 15 September 2025

Abstract

Highlights

What are the main findings?
  • The deer browsing reduced the cover of S. hayatae and increased the cover of M. sinensis, but the extent of these changes was spatially heterogeneous.
  • Using UAV-mounted LiDAR, we estimated the densities of S. hayatae and M. sinensis, which are important for understanding vegetation changes.
What is the implication of the main finding?
  • In grassland management, understanding spatial and temporal changes in vegetation is important.
  • The combination of small-scale field sampling and remote sensing is an excellent approach to obtain important information for grassland management.

Abstract

The impact of Cervus nippon browsing on vegetation in grasslands in Japan has become pronounced. In obtaining useful information for the management of grasslands affected by C. nippon browsing, we aimed to clarify the relationship between changes in the cover of Sasa hayatae and Miscanthus sinensis under the browsing impact of C. nippon and the distribution of grassland species based on vegetation survey data from two time periods and to use UAV-mounted LiDAR data to determine the distribution of S. hayatae and M. sinensis that have a significant impact on vegetation change on an areal basis. The study area was approximately 23 ha around the Ochiai Pass in Higashi Iya Ochiai, Miyoshi City, Tokushima Prefecture. A vegetation survey was conducted in 2022 at the same 35 sites as in 2002 to understand the changes in vegetation. The ordination using nonmetric multidimensional scaling (NMDS) revealed that the entire study site was not changing along the same directionality of succession, although C. nippon browsing likely returns the S. hayatae-dominated grassland to M. sinensis-dominated grassland at the study site. It was found that sites with high M. sinensis cover in 2022 exhibited higher diversity of grassland plants. The impact of deer browsing was suggested to increase M. sinensis coverage and contribute to the survival of grassland plants. Using UAV-mounted LiDAR, we estimated the densities of S. hayatae and M. sinensis, which are important for understanding vegetation changes in the study site. This allowed us to spatially identify areas critical for conserving grassland plant diversity and areas strongly affected by deer browsing.

1. Introduction

In North America, Europe, Japan, and New Zealand, high-density deer have an altered vegetation structure and species composition [1]. In Japan, the range of Cervus nippon continues to expand [2]. Deer browsing reduces the number of plants that deer do not prefer to browse (hereafter, unpalatable species) [3,4,5,6,7], allowing unpalatable and browse-resistant plants to dominate [3,4,5,8]. In general, ferns [9] and browse-tolerant gramineous and sedge plants [5], which are often unpalatable species, will become dominant. The continued dominance of unpalatable or browse-tolerant plants may not restore vegetation to its original state even after deer control [10,11], and vegetation does not recover to its original state more than 20 years after deer browsing has been reduced [11,12].
In Japan, grassland biomes are not found except for grasslands in high mountains and coastal areas. Grasslands in mountainous and lowland areas are maintained by human disturbances such as mowing, grazing, and burning [13]. Even in these grasslands, the impact of deer has become more pronounced, and the disappearance of Sasa hayatae and the dominance of Miscanthus sinensis caused by the browsing of C. nippon have been reported [14]. Some species are unique to grasslands (hereafter grassland species), and changes in vegetation caused by the browsing of C. nippon have made it a challenge to conserve these species [15]. Plant communities are spatially diverse, and responses to a given browse pressure likely vary within and among plant communities [16,17]. In general, grassland plant communities are in the process of secondary succession, and community dynamics are diverse depending on the type, intensity, frequency, and duration of disturbance [15]. Therefore, understanding entire grassland as having the same directionality of succession, such as progression or regression, is difficult [18].
In grassland management, understanding the spatial and temporal changes in vegetation with high spatial resolution is important [19,20], and remote sensing is an effective tool for this purpose [21]. Remote sensing of grasslands has primarily used optical imagery, such as near-infrared [21]. LiDAR, which has recently emerged, can be used to measure information about vegetation that cannot be measured optically with high spatial resolution [20]. Optical measurements primarily capture surface information of vegetation, whereas LiDAR can obtain information within the vegetation. For example, it is used to understand forest floor topography and stratification in forests. While vegetation research using LiDAR often focuses on forests, it can also be applied to grassland. Although some studies have used LiDAR data to classify grassland types [22], monitoring grasslands using LiDAR data has not been well studied [20]. Furthermore, the latest technology, UAV-mounted LiDAR, can remarkably reduce the cost of data acquisition, which is a drawback of conventional aircraft-mounted LiDAR [23]. Therefore, the development of methods for monitoring grasslands using UAV-mounted LiDAR is an important research topic.
This study aimed to obtain useful information for the management of grasslands affected by C. nippon browsing by (1) clarify the relationship between changes in the cover of S. hayatae and M. sinensis under the browsing impact of C. nippon and the distribution of grassland species based on vegetation survey data from two time periods and (2) using UAV-mounted LiDAR data to determine the distribution of S. hayatae and M. sinensis that have a significant impact on vegetation changes on an areal basis and estimate locations that are important for grassland species conservation.

2. Materials and Methods

2.1. Study Site

The study site was a 23-ha area around the Ochiai Pass in Higashi Iya Ochiai, Miyoshi City, Tokushima Prefecture (Figure 1). The study site is located in the Kenzan mountain range in the eastern part of the Shikoku Mountains at an elevation of 1560 m above sea level. The climatic zone of the study site is cool temperate. The study site was a grassland dominated by M. sinensis until around 1990, but around 2005, it became a grassland dominated by S. hayatae [24]. At present, S. hayatae is distributed mainly along the ridge, interspersed with trees such as Abies homolepis (Figure 2). The establishment of grasslands in the study site is due to the influence of previous human disturbances, such as fire burning [25]. No human disturbance is currently occurring in the study site. In Japan, the impact of browsing damage on vegetation has become more pronounced because of the increase in deer population density. According to a survey conducted by the Shikoku Regional Forest Office in 2011, the density of C. nippon in the vicinity of the study area was remarkably high at 49.5 deer/km2, which has had a great impact on vegetation. In the study site, the effects of C. nippon browsing were also observed, including the browsing scars of S. hayatae and the death of shrubs caused by browsing damage. In addition, A. homolepis has died because of bark stripping by C. nippon [26]. Understanding the relationship between the distribution of S. hayatae and M. sinensis, which have significantly larger abundances than other species, and grassland species, as well as the impact of C. nippon browsing on these two species, are crucial for managing the study site.

2.2. Vegetation Survey

A vegetation survey was conducted in 2022 at the same 35 sites as in 2002 to understand the changes in vegetation. The 2022 survey was conducted at approximately the same locations as in 2002 by importing the locations of the 2002 survey sites into a single positioning GNSS (Garmin GPSMAP 66i) and confirming them in the field. The survey method was the same for both years. A 2 m × 2 m quadrat for the herbaceous community and a 5 m × 5 m quadrat for the woody community were set up. The layers were divided into the first subtree layer (T1), second subtree layer (T2), shrub layer (S), and herbaceous layer, and the species occurrence and percent cover were recorded for each layer. The 2002 survey was conducted from September 6 to September 8, and the 2022 survey was conducted in October 11 and October 12.
The vegetation survey results were used for ordination to understand the relationship between the distribution of S. hayatae and M. sinensis and grassland species. The percent cover of each layer in 2022 was used as the species data. In addition, the percent cover of S. hayatae in 2002 (S. hayatae cover 2002) and 2022 (S. hayatae cover 2022), the 20-year change in percent cover (Change in S. hayatae cover), the percent cover of M. sinensis in 2002 (M. sinensis cover 2002) and 2022 (M. sinensis cover 2022), and the 20-year change in percent cover (Change in M. sinensis cover) were used as environmental factor data. The data were ordinalized using nonmetric multidimensional scaling (NMDS). The 20-year change in percent cover was calculated by subtracting the 2002 survey data from the 2022 survey data. Through ordination, survey sites and species are plotted in a two-dimensional space, allowing similarities to be identified from their spatial distribution and relationships with environmental factors to be understood. The R language (version 4.3.2, R Foundation for Statistical Computing) was used for statistical analysis, and the "vegan" package was used for NMDS.

2.3. Estimation of the Density of S. hayatae and M. sinensis

The data acquired using the UAV-mounted LiDAR were used to estimate the density of S. hayatae and M. sinensis as indicators of vegetation change in an areal basis. DJI L1 was used on a DJI Matrice 300. In this case, the horizontal field of view was 70.4°; the vertical field of view was 4.5°; the scan rate was 480,000 points/s, and the system accuracy was 10 cm horizontal and 5 cm vertical. Using UgCS (SPH Engineering, Latvia, EU), a flight route was created with a flight altitude of 60 m and a sidelap of 70%. The created flight route was imported into the DJI Pilot2 and measured at a flight speed of 5 m/s. Simultaneously, A DJI D-RTK 2 mobile station was installed, and the position was corrected by real-time kinematics. 12 October 2022 data were measured. The measured data were postprocessed in DJI Terra to obtain a 3D point cloud model. Three-dimensional point cloud model processed using GreenValley LiDAR360 v8.0. After removing outliers from the 3D point cloud model, the ground surface point cloud was classified using default parameters. A 5 cm × 5 cm digital terrain model (DTM) was created by interpolating the point cloud of the ground surface using the triangulated irregular network method. DTM was used to correct the height of the 3D point cloud model from elevation to ground level (normalization). The normalized 3D point cloud model was extracted at 10 cm intervals up to 2 m above ground level, and a 10 m × 10 m grid was used as the aggregation unit to calculate the number of point clouds and the mean reflection intensity for the first return at each 10 cm interval.
Using Esri ArcGIS, grid aggregation values were extracted from vegetation survey points. The correlation between S. hayatae cover 2022 and grid aggregate values (the number of point clouds and the mean reflection intensity), and the correlation between M. sinensis cover 2022 and grid aggregate values, were calculated separately for each 10 cm interval.

3. Results

3.1. Vegetation Survey

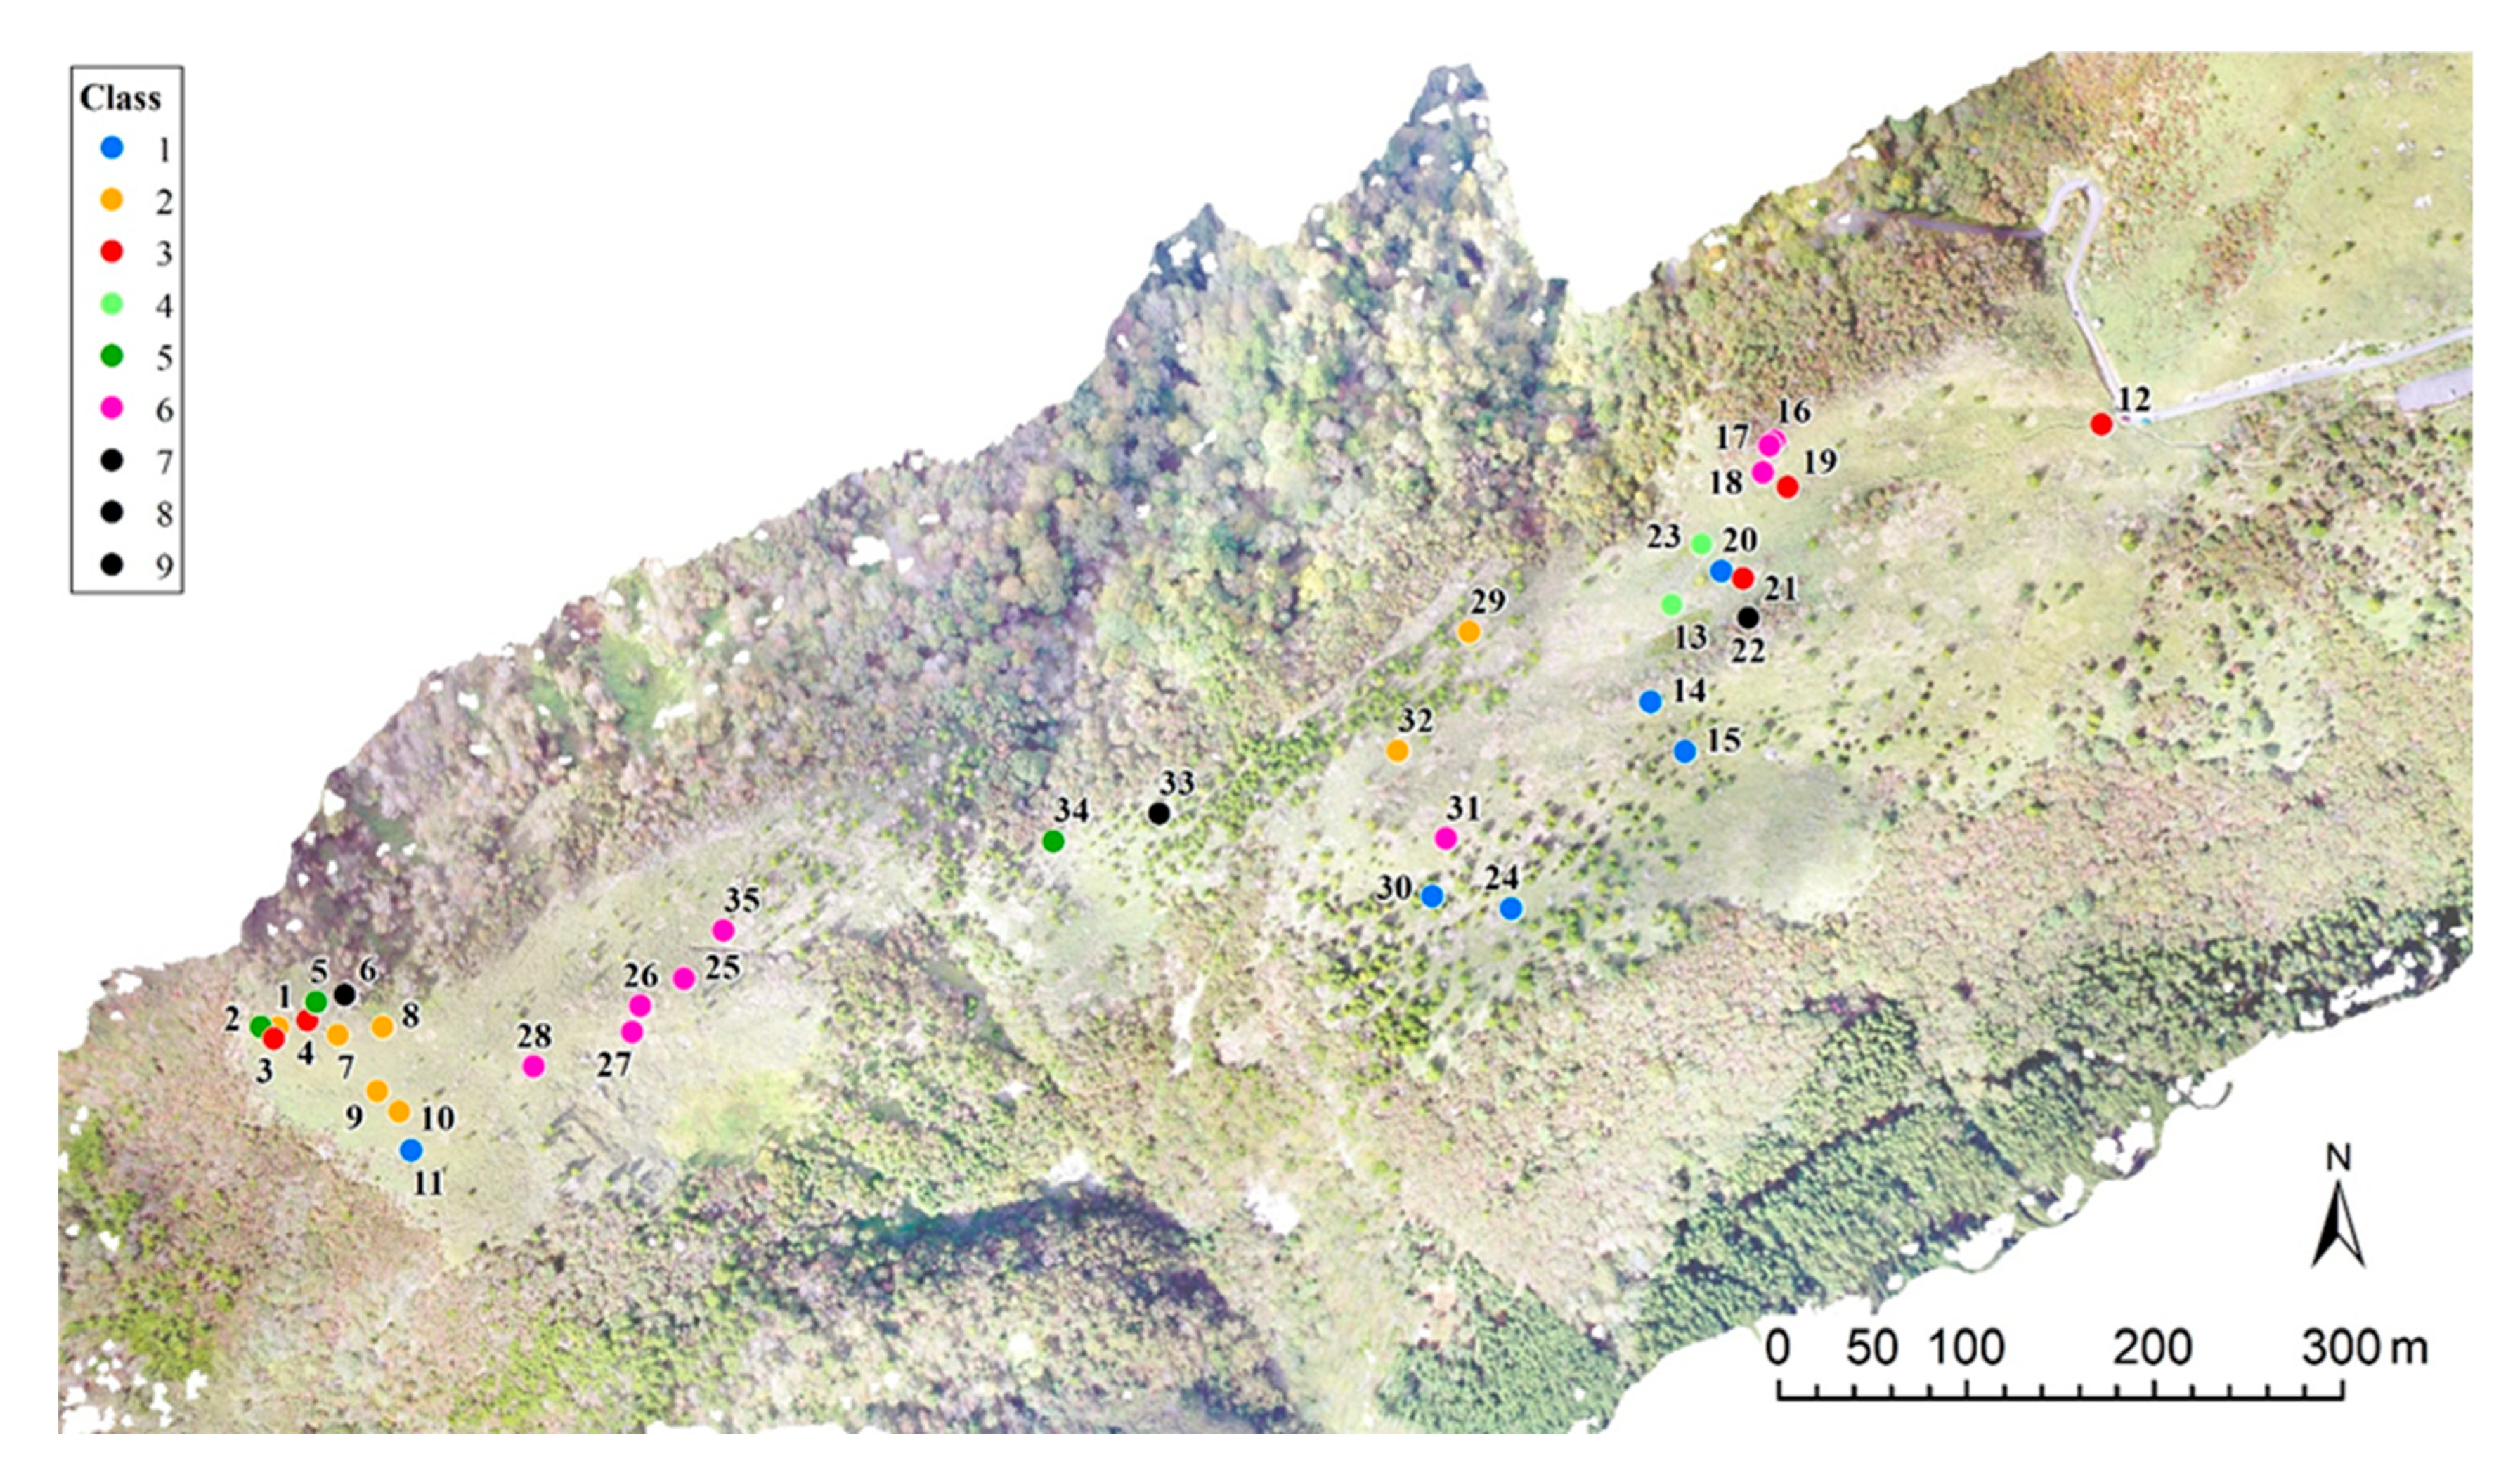
Sixty-three species in 40 families were identified during the 2022 survey (Table 1). One species was on the Red List of the Ministry of the Environment; four species were on the Red List of Tokushima Prefecture, and 15 species were unpalatable species of C. nippon [27]. The stress value, which indicates the fit quality when plotted in two dimensions using NMDS, was 0.17. A stress value between 0.1 and 0.2 is considered a moderate fit. In NMDS, a table indicating how well environmental factors explain the variation in the two-dimensional plot is obtained, and the strength of the fit for environmental factors is indicated by the Pr value (Table 2). Environmental factors that were significant were the M. sinensis cover 2022, change in S. hayatae cover, and change in M. sinensis cover. The distribution of the survey sites and vectors of environmental factors is shown in Figure 3. The survey sites were classified into nine classes based on their spatial grouping in the coordinate space, and their distribution is shown in Figure 4. The distribution of species and vectors of environmental factors is shown in Figure 5. More species were distributed in areas with high M. sinensis cover 2022 than in areas with high S. hayatae cover 2022. The endangered species were distributed in areas with increasing M. sinensis cover and areas with little change in S. hayatae cover and M. sinensis cover. Furthermore, unpalatable species of C. nippon were randomly distributed.

3.2. Estimation of the Density of S. hayatae and M. sinensis

The results of the 2022 vegetation survey showed that the mean and maximum vegetation heights of S. hayatae were 53 and 160 cm, respectively, and those of M. sinensis were 84 and 200 cm, respectively (Figure 6). The correlation between S. hayatae cover 2022 and grid aggregate values (the number of point clouds and the mean reflection intensity), and the correlation between M. sinensis cover 2022 and grid aggregate values, were calculated separately for each 10 cm interval (Table 3), with many R2 values < 0.01, all of which were low. In addition, a high correlation was determined between the mean values of the reflection intensity at heights of 0.7–0.8 m in S. hayatae and 1.4–1.5 m in M. sinensis, where R2 was the largest and the p-value was the smallest. The mean values of the reflection intensity at those heights and the S. hayatae cover 2022 and M. sinensis cover 2022 at the study sites are shown in Figure 7 and Figure 8.

3.3. Evaluation of Areas Important for Grassland Species Conservation

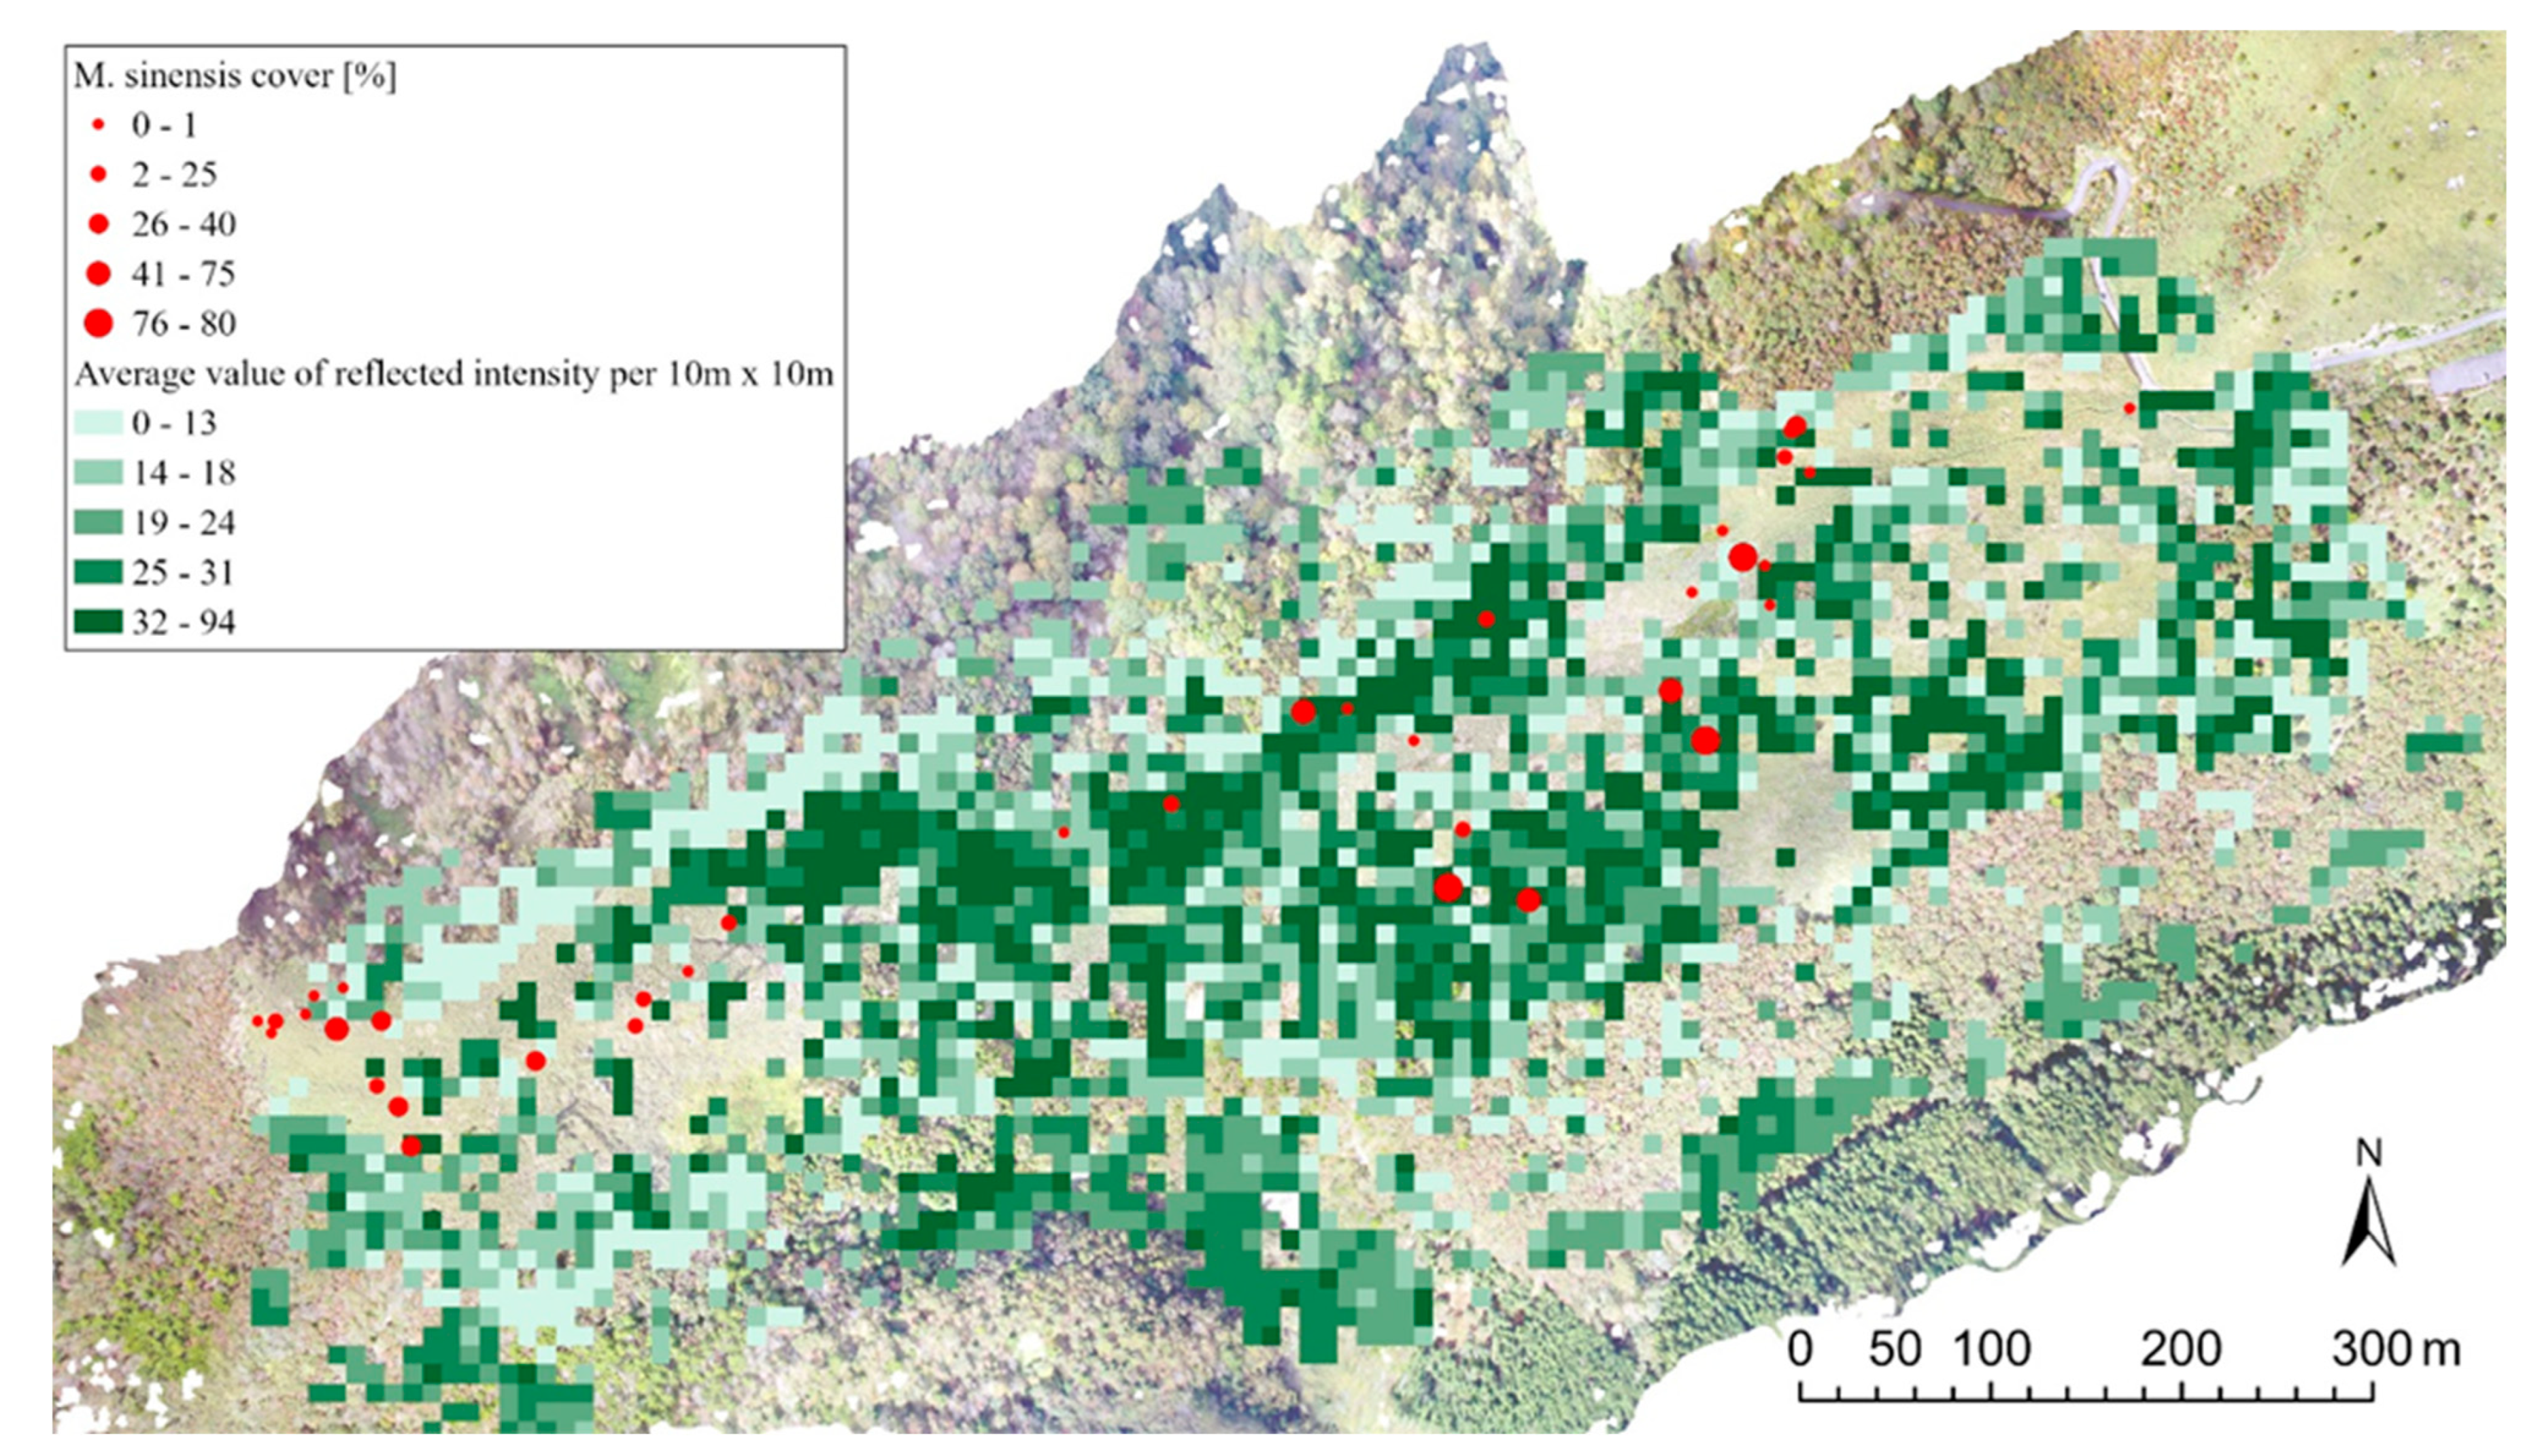
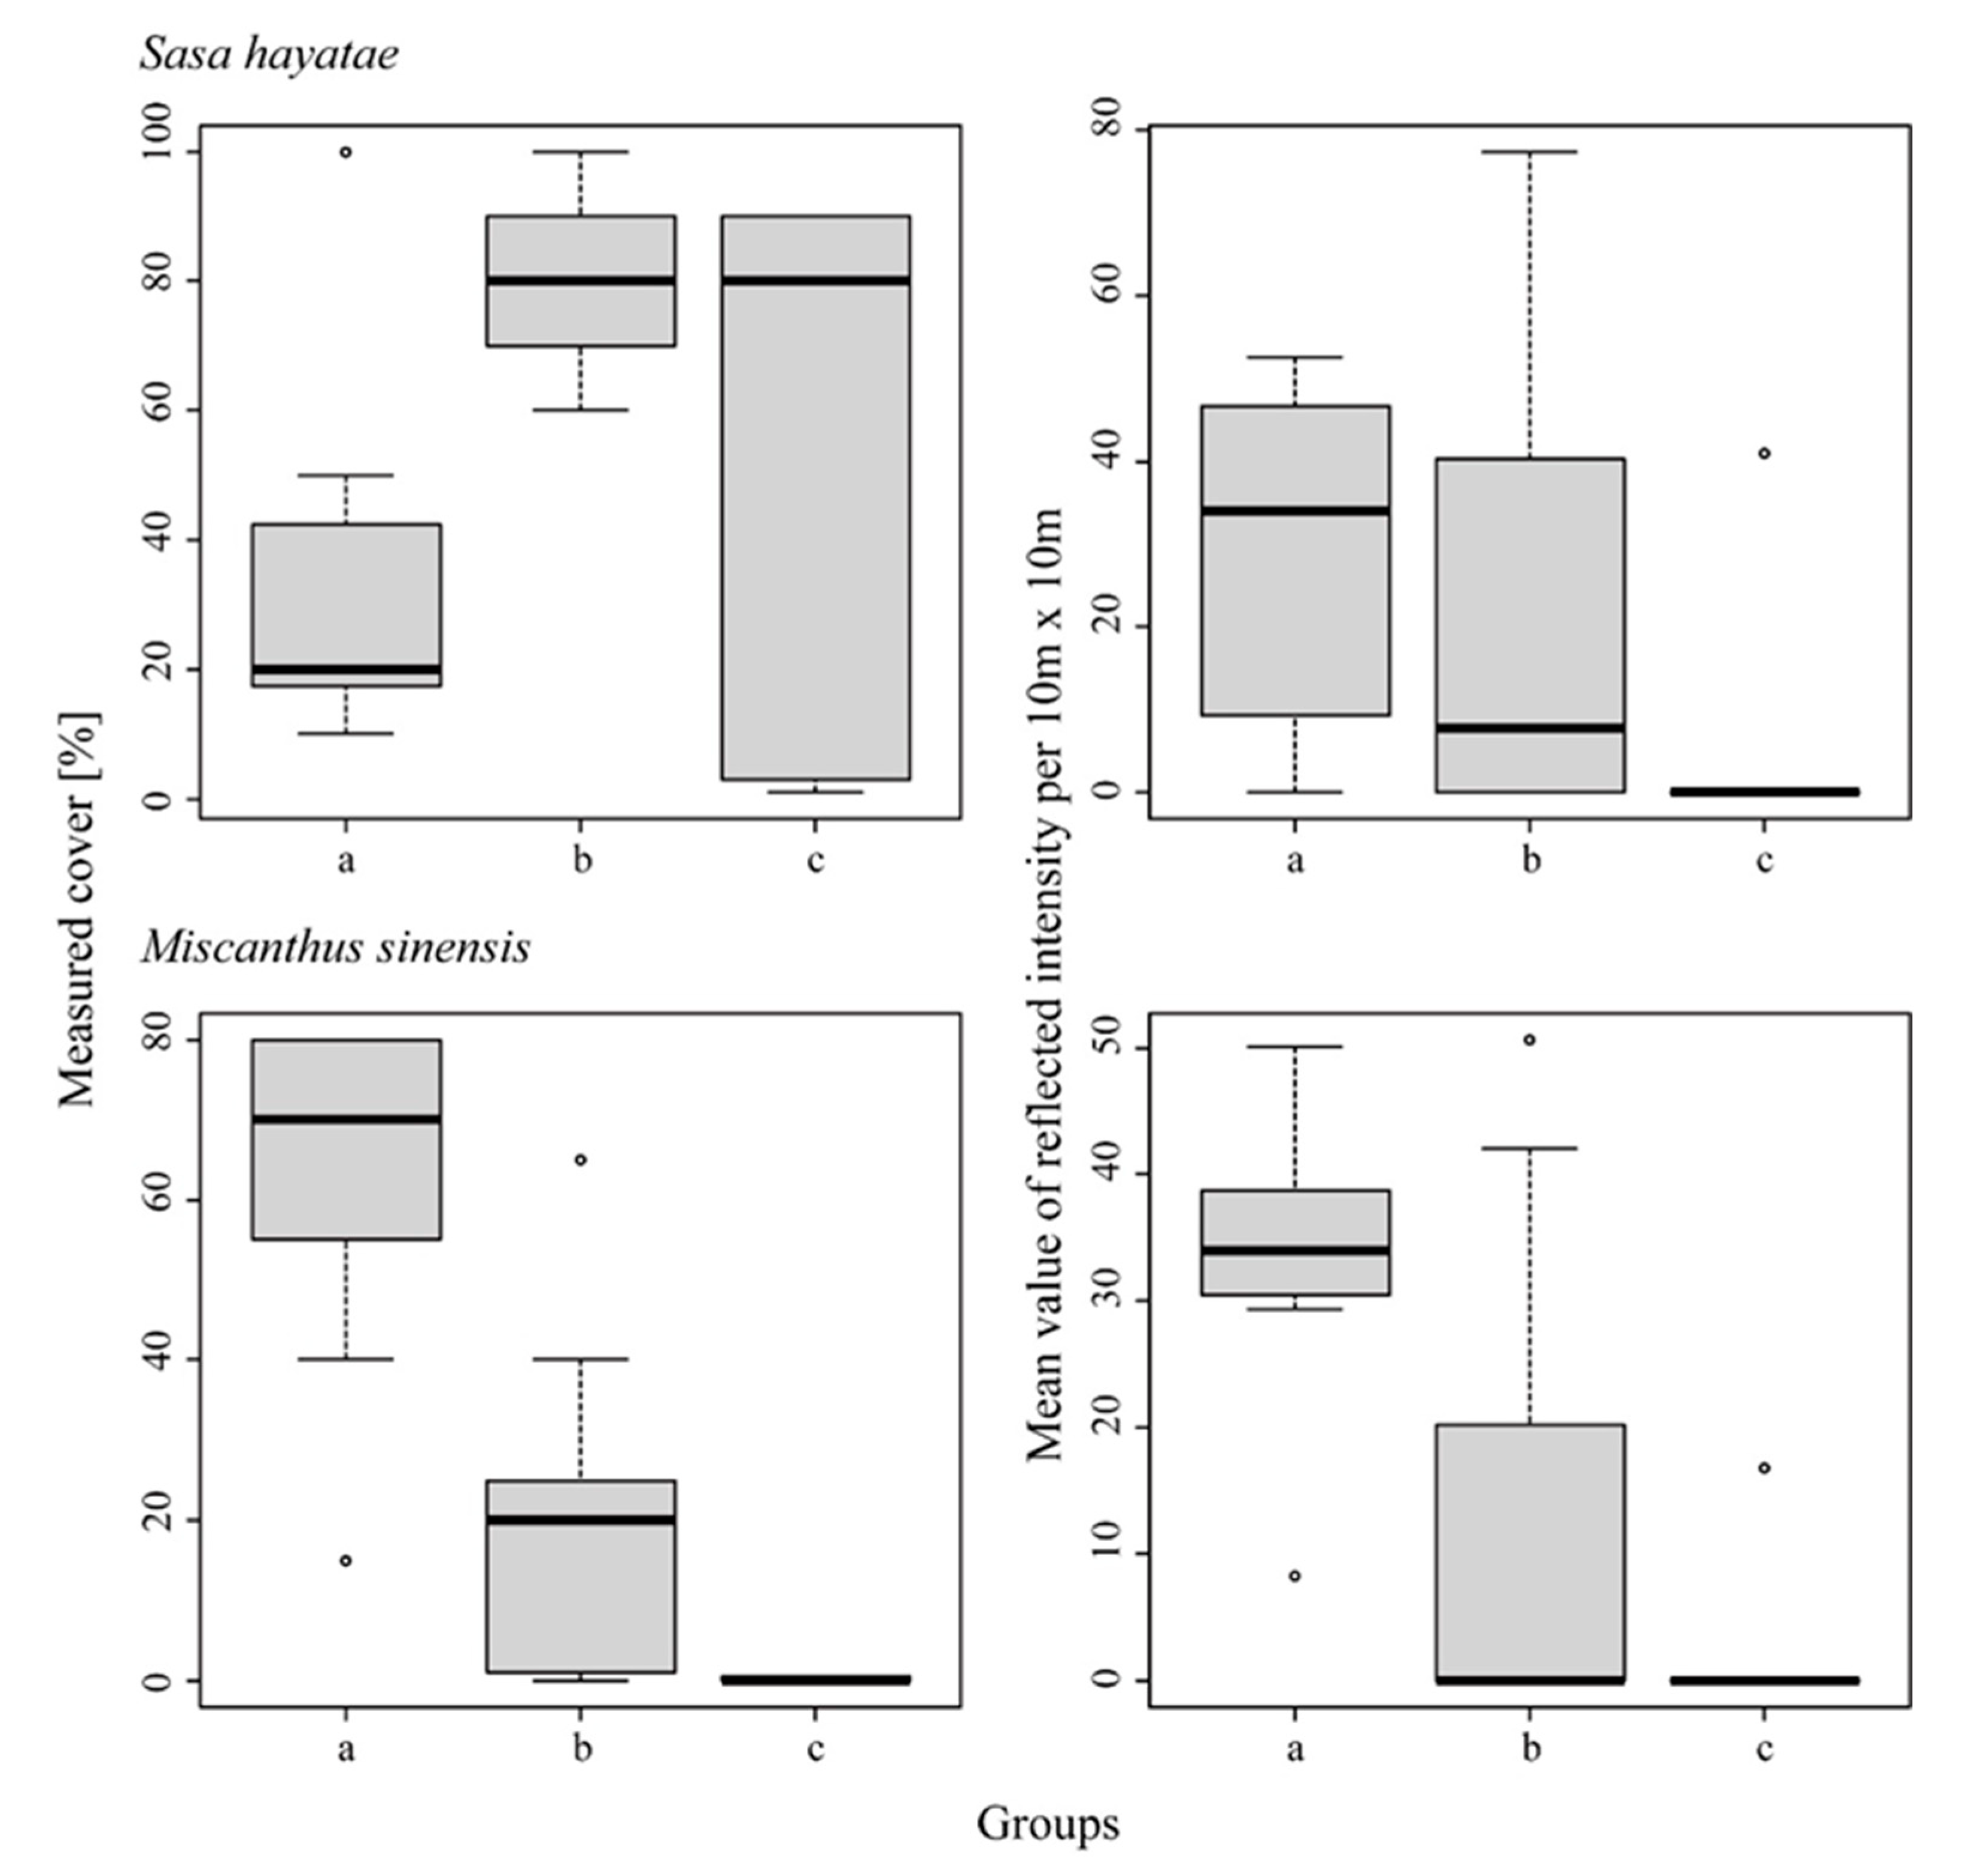
The nine NMDS classes were grouped into three categories based on their positions relative to the M. sinensis cover 2022 and the S. hayatae cover 2022: classes 1 and 7 were grouped into category a, classes 2, 3, and 6 into category b, and classes 4 and 5 into category c (Table 4). The mean values of the reflection intensity were calculated for S. hayatae at a height of 0.7–0.8 m and for M. sinensis at a height of 1.4–1.5 m, and M. sinensis cover 2022 and the S. hayatae cover 2022 were summarized for each of the a, b, and c categories (Figure 9). M. sinensis cover 2022, which was significant as an environmental factor in the NMDS results, better reflected the cover trends at the site. Based on the above, we considered that using the three categories a–c and the estimated M. sinensis cover 2022 could evaluate areas of high conservation importance for grassland species at the study site (Table 4). Category a, exhibiting high diversity of grassland species, is considered the most important for conservation. From the box-and-whisker plots of the mean values of the reflection intensity M. sinensis in Figure 9, thresholds of 0, 0–20, and 30–40 were set and their distribution within the study site is shown in Figure 10.

4. Discussion

4.1. Vegetation Change

The study area had been a grassland dominated by M. sinensis until about 1990, but around 2005, it became a grassland dominated by S. hayatae [24]. In Japan, where the climax is forest, M. sinensis grasslands often persist because of human disturbances such as mowing, burning, and grazing [28,29]. At the study site, M. sinensis grasslands were also established by human disturbances such as burning [25]. Sasa species can grow vigorously and overwhelm M. sinensis even under M. sinensis dominance by receiving nutrients from the parent plant through underground stems [30]. Therefore, the study site likely became a grassland dominated by S. hayatae around 2005, after human disturbance had ceased. Sasa spp. compete with tree seedlings for light availability, and their high cover prevents tree restoration [31]. Therefore, the vegetation in the study area can cause S. hayatae grassland to intersperse with trees such as A. homolepis.
Sasa spp. are evergreen, with high above-ground biomass, and they are highly valuable as food for deer [32,33]. Sasa spp. also serves as winter food [2,34]. Grasslands dominated by Sasa spp. revert to M. sinensis grasslands upon resumption of human disturbances [29,30,33,35]. At the study site, the population density of C. nippon was high around 2011, and C. nippon browsing is considered to be a disturbance, causing a part of the grassland dominated by S. hayatae to return to the grassland dominated by M. sinensis. The identification of 15 (24%) unpalatable species of C. nippon in the 2022 vegetation survey indicates that the area has been affected by C. nippon browsing.
In the ordination using NMDS, environmental factors were considered significant for M. sinensis cover 2022, change in S. hayatae cover, and change in M. sinensis cover. The change in S. hayatae cover and M. sinensis cover as well as the M. sinensis cover 2022 caused by the changes affected the vegetation in the study area. The vectors of the change in S. hayatae cover and M. sinensis cover were in opposite directions, and the study sites were distributed in both directions. As mentioned earlier, the NMDS revealed that the entire study site was not changing along the same directionality as succession, although C. nippon browsing likely returns the S. hayatae-dominated grassland to M. sinensis-dominated grassland at the study site.
Class 1 areas tend to be dominated by herbaceous plants with above-ground parts near the ground surface. C. nippon forages on M. sinensis but only if they pinch the tips of M. sinensis leaves. Moreover, the young leaf stage is often foraged by C. nippon [33]. Unpalatable plants and browse-resistant species cover nearby edible species and protect them from browsing [33,36,37]. In addition, the change from grassland to M. sinensis grassland improves near-surface light conditions and increases the number of species and populations of grassland plants [30]. Thus, Class 1 is considered to be a place where M. sinensis cover increases because of C. nippon browsing and where grassland vegetation can grow because of improved light conditions and protection from browsing. Class 1 is important for the conservation of grassland species diversity in the study site because it contains the endangered grassland species Geranium shikokianum var. shikokianum.
Classes 2, 3, and 6 are the areas where a slight change in S. hayatae cover and M. sinensis cover is observed. Classes 2 and 3 are considered to be the areas where S. hayatae continues to dominate, in which the high cover of S. hayatae has resulted in few distributed species, and where only shrubs such as the pioneer species Fallopia japonica and the unpalatable species Rosa multiflora can grow. Class 6 is the area where M. sinensis continues to dominate. Apart from grassland plants, many species that are naturally distributed in the study site are found in the area, such as the endangered species Tricyrtis macropoda and Rhododendron tsurugisanense, which are important for the conservation of plant diversity in the study area.
Classes 4 and 5 are the areas where S. hayatae cover increased. Considering that only unpalatable and prickly plants are distributed in these areas, such areas are considered to be heavily influenced by C. nippon browsing. Class 4 is considered to be an over-humid area because of the distribution of Juncus decipiens.
Classes 7, 8, and 9 are considered as the areas in which the influence of forests is significant because of the distribution of woody plants. Class 7 is an area of increased M. sinensis cover, and Class 9 is an area of increased S. hayatae cover. Class 8, located in the middle of Classes 7 and 9, is important for the conservation of plant diversity in the study area because of the distribution of the endangered species Oxalis nipponica subsp. nipponica.

4.2. Estimation of the Density of S. hayatae and M. sinensis

The highest correlations of mean reflection intensity were determined at heights of 0.7–0.8 m for S. hayatae and 1.4–1.5 m for M. sinensis, where R2 was the largest and p-value was the smallest. Considering that the height selected was between the third quartile of vegetation height and the maximum value for S. hayatae and M. sinensis (Figure 6), the point cloud data at the height where the above-ground parts of S. hayatae and M. sinensis were located were selected, which is considered a reasonable result. However, M. sinensis had maximum R2 at heights of 1.6–1.7 m and 1.7–1.8 m, with slightly higher P values. Therefore, M. sinensis have a high potential for density estimation in the 1.4–1.8 m height range.
R2 was <0.01 in most cases, all of which were low. When measured at an altitude of 100 m, the size of the DJI L1 beam at the ground surface was relatively large, measuring 50 cm × 5 cm. Therefore, in dense vegetation such as S. hayatae and M. sinensis, a single return may have captured the surface of multiple plants, which may have contributed to low R2. However, by using only the first return, the point cloud was limited to only the surface of the vegetation, and by using the average reflection intensity to reflect the density of the vegetation, the height at which the density of S. hayatae and M. sinensis could be best estimated was selected. In the future, comparative validation using different LiDAR systems can estimate density with a higher correlation.

4.3. Grassland Management

In grassland management, understanding spatial and temporal changes in vegetation is important [19,20]. Using NMDS enabled us to understand the relationship between survey site positioning and species. By analyzing the cover of the dominant species, S. hayatae and M. sinensis, as environmental factors, we could infer their relationship with 20 years of vegetation change. As a result, we were able to evaluate the spatial heterogeneity of C. nippon browsing impacts and identify important areas for conserving grassland species diversity.
We were also able to estimate the density of S. hayatae and M. sinensis, which are important for understanding vegetation changes in the study site, using UAV-mounted LiDAR data. Furthermore, by combining the results of NDMS and density estimation, we were able to identify important areas for the conservation of grassland species diversity in the study area and areas strongly affected by deer browsing. The combination of small-scale field sampling and remote sensing is an excellent approach to obtain important information for grassland management [38], which we demonstrated in this study. Furthermore, we could propose a method for monitoring grasslands using UAV-mounted LiDAR, which has rarely been studied. The method proposed in this study can be used to monitor spatial and temporal changes in vegetation and could be applied to the management of different types of grasslands.

5. Conclusions

At the study site, deer browsing reduced the cover of S. hayatae and increased the cover of M. sinensis, but the extent of these changes was spatially heterogeneous. It was found that sites with high M. sinensis cover in 2022 exhibited higher diversity of grassland species. The impact of deer browsing was suggested to increase M. sinensis coverage and contribute to the survival of grassland plants. Using UAV-mounted LiDAR, we estimated the densities of S. hayatae and M. sinensis, which are important for understanding vegetation changes in the study site. This allowed us to spatially identify areas critical for conserving grassland plant diversity.

Author Contributions

Conceptualization, H.N. and M.K.; methodology, H.N., G.D., M.O. and M.K.; software, H.N.; validation, H.N.; formal analysis, H.N.; investigation; H.N., G.D., M.O. and M.K. re-sources, H.N. and M.K.; data curation, H.N., G.D., M.O. and M.K.; writing—original draft preparation, H.N.; writing—review and editing, H.N.; visu-alization, H.N.; supervision, H.N. and M.K.; project administration, H.N. and M.K.; funding acquisition, H.N. and M.K. All authors have read and agreed to the published version of the manuscript.

Funding

This research received no external funding.

Data Availability Statement

Data cannot be shared openly but are available on request from authors.

Conflicts of Interest

The authors declare no conflicts of interest.

References

  1. Gill, R.M.A. A Review of Damage by Mammals in North Temperate Forests: 1. Deer. For. Int. J. For. Res. 1992, 65, 145–169. [Google Scholar] [CrossRef]
  2. Takahashi, K.; Uehara, A.; Takatsuki, S. Food habits of Sika deer at Otome Highland, Yamanashi, with reference to Sasa nipponica. Mammal Study 2013, 38, 231–234. [Google Scholar] [CrossRef]
  3. Anderson, R.C.; Katz, A.J. Recovery of browse-sensitive tree species following release from white-tailed deer Odocoileus virginianus zimmerman browsing pressure. Biol. Conserv. 1993, 63, 203–208. [Google Scholar] [CrossRef]
  4. Horsley, S.B.; Stout, S.L.; DeCalesta, D.S. White-tailed deer impact on the vegetation dynamics of a northern hardwood forest. Ecol. Appl. 2003, 13, 98–118. [Google Scholar] [CrossRef]
  5. Rooney, T.P. High white-tailed deer densities benefit graminoids and contribute to biotic homogenization of forest ground-layer vegetation. Plant Ecol. 2009, 202, 103–111. [Google Scholar] [CrossRef]
  6. Inatomi, Y.; Uno, H.; Iijima, H. Effects of sika deer (Cervus nippon) and dwarf bamboo (Sasa senanensis) on trillium populations in Akan National Park, eastern Hokkaido, Japan. Plant Species Biol. 2017, 32, 423–431. [Google Scholar] [CrossRef]
  7. Otsu, C.; Iijima, H.; Nagaike, T. Plant community recovery from intense deer grazing depends on reduction of graminoids and the time after exclosure installation in a semi-natural grassland. PeerJ 2019, 7, e7833. [Google Scholar] [CrossRef] [PubMed]
  8. Rooney, T.P.; Waller, D.M. Direct and indirect effects of white-tailed deer in forest ecosystems. For. Ecol. Manag. 2003, 181, 165–176. [Google Scholar] [CrossRef]
  9. Rooney, T.; Dress, W. Species loss over sixty-six years in the ground-layer vegetation of heart’s content, and old-growth forest in Pennsylvania, USA. Nat. Areas J. 1997, 17, 297–305. [Google Scholar]
  10. Tanentzap, A.J.; Burrows, L.E.; Lee, W.G.; Nugent, G.; Maxwell, J.M.; Coomes, D.A. Landscape-level vegetation recovery from herbivory: Progress after four decades of invasive red deer control. J. Appl. Ecol. 2009, 46, 1064–1072. [Google Scholar] [CrossRef]
  11. Nuttle, T.; Ristau, T.E.; Royo, A.A. Long-term biological legacies of herbivore density in a landscape-scale experiment: Forest understoreys reflect past deer density treatments for at least 20 years. J. Ecol. 2014, 102, 221–228. [Google Scholar]
  12. Boulanger, V.; Baltzinger, C.; Said, S.; Ballon, P.; Picard, J.F.; Dupouey, J.L. Decreasing deer browsing pressure influenced understory vegetation dynamics over 30 years. Ann. For. Sci. 2015, 72, 367–378. [Google Scholar] [CrossRef]
  13. Yamamoto, Y.; Saito, Y.; Kirita, H.; Hayashi, H.; Nishimura, N. Ordination of vegetation of miscanthus-type grassland under the some artificial pressure. Jpn. J. Grassl. Sci. 1997, 42, 307–314. [Google Scholar]
  14. Takatsuki, S.; Ishikawa, S.; Higa, M. Altitudinal variation in sika deer food habits on Mt. Miune, Shikoku, Japan. Jpn. J. Ecol. 2021, 71, 5. [Google Scholar]
  15. Okubo, K. The present state in the study of biological diversity on semi-natural grassland in Japan. Jpn. J. Grassl. Sci. 2002, 48, 268–276. [Google Scholar]
  16. Weisberg, P.J.; Bonavia, F.; Bugmann, H. Modeling the interacting effects of browsing and shading on mountain forest tree regeneration (Picea abies). Ecol. Model. 2005, 185, 213–230. [Google Scholar] [CrossRef]
  17. Wisdom, M.J.; Vavra, M.; Boyd, J.M.; Hemstrom, M.A.; Ager, A.A.; Johnson, B.K. Understanding ungulate herbivory—Episodic disturbance effects on vegetation dynamics: Knowledge gaps and management needs. Wildl. Soc. Bull. 2006, 34, 283–292. [Google Scholar] [CrossRef]
  18. Yamamoto, Y. Succession and various vegetation of grassland. Jpn. J. Grassl. Sci. 2001, 47, 424–429. [Google Scholar]
  19. Baeza, S.; Lezama, F.; Piñeiro, G.; Altesor, A.; Paruelo, J.M. Spatial variability of above-ground net primary production in Uruguayan grasslands: A remote sensing approach. Appl. Veg. Sci. 2010, 13, 72–85. [Google Scholar]
  20. Zhang, X.; Bao, Y.; Wang, D.; Xin, X.; Ding, L.; Xu, D.; Hou, L.; Shen, J. Using UAV lidar to extract vegetation parameters of inner mongolian grassland. Remote Sens. 2021, 13, 656. [Google Scholar]
  21. Maake, R.; Mutanga, O.; Chirima, G.; Sibanda, M. Quantifying Aboveground Grass Biomass Using Space-Borne Sensors: A Meta-Analysis and Systematic Review. Geomatics 2023, 3, 478–500. [Google Scholar] [CrossRef]
  22. Fisher, R.J.; Sawa, B.; Prieto, B. A novel technique using LiDAR to identify native-dominated and tame-dominated grasslands in Canada. Remote Sens. Environ. 2018, 218, 201–206. [Google Scholar] [CrossRef]
  23. da Rocha, N.S.; Veettil, B.K.; Ward, R.D.; Costi, J.; Rolim, S.B.A. Remote sensing of grasslands in the South American Pampas (scientometrics analysis). Land Degrad. Dev. 2023, 34, 2723–2734. [Google Scholar] [CrossRef]
  24. Kogushi, S.; Kamada, M.; Hasegawa, K. Vegetation change relating to a change of management ad Ochiai-Pass in Higashi-Iyayama Village in Tokushima Prefecture, Shikoku, Japan, Bull. Tokushima Pref. Mus. 2005, 15, 1–20. [Google Scholar]
  25. Kamada, M. Process of the establishment and maintenance of Sasa grassland in Tsurugi Mountains in Tokushima Prefecture, Shikoku, Japan, Bull. Tokushima Pref. Mus. 1994, 4, 97–113. [Google Scholar]
  26. Niwa, H.; Dai, G.; Ogawa, M.; Kamada, M. Development of a Monitoring Method Using UAVs That Can Detect the Occurrence of Bark Stripping by Deer. Remote Sens. 2023, 15, 644. [Google Scholar] [CrossRef]
  27. Hashimoto, Y.; Fujiki, D. List of food plants and unpalatable plants of sika deer (Cervus nippon) in Japan. Hum. Nat. 2014, 25, 133–160. [Google Scholar]
  28. Sakanoue, S. Long-term trends in Miscanthus sinensis grassland vegetation: A 20-year field observation. Jpn. J. Grassl. Sci. 2001, 47, 430–435. [Google Scholar]
  29. Yamamoto, Y.; Saito, Y.; Kirita, H.; Takahashi, S.; Kitahara, N. Difference in vegetational changes in miscanthus-type grassland following cutting and burning treatments. Jpn. J. Grassl. Sci. 2007, 53, 28–30. [Google Scholar]
  30. Hashimoto, Y.; Ishimaru, K.; Kuroda, A.; Masunaga, S.; Yokota, J. Effects of mowing resumption on recovery and richness of grassland plant species in abandoned grasslands dominated by dwarf bamboo. Landsc. Res. Jpn. Online 2012, 5, 95. [Google Scholar] [CrossRef]
  31. Nakashizuka, T. Regeneration of beech (Fagus crenata) after the simultaneous death of undergrowing dwarf bamboo (Sasa kurilensis). Ecol. Res. 1988, 3, 21–35. [Google Scholar] [CrossRef]
  32. Yokoyama, M.; Kaji, K.; Suzuki, M. Food habits of sika deer and nutritional value of sika deer diets in eastern Hokkaido, Japan. Ecol. Res. 2000, 15, 345–355. [Google Scholar] [CrossRef]
  33. Takatsuki, S.; Uehara, A. Cause of vegetation changes to a Miscanthus sinensis community in Otome Highland, Yamanashi, central Japan. Veg. Sci. 2021, 38, 81–93. [Google Scholar]
  34. Tanaka, Y.; Takatsuki, S.; Takayanagi, A. Decline of Sasa palmata community by grazing of Sika deer (Cervus nippon) at Ashiu Research Forest Station. For. Res. Kyoto 2008, 77, 13–23. [Google Scholar]
  35. Sakanoue, S.; Fukuda, E.; Ogawa, Y.; Okamoto, K.; Kitahara, N. Successional process in a Sasa nipponica grassland through summer grazing by beef cattle. Jpn. J. Grassl. Sci. 1995, 40, 443–447. [Google Scholar]
  36. Milchunas, D.G.; Noy-Meir, I. Grazing refuges, external avoidance of herbivory and plant diversity. Oikos 2002, 99, 113–130. [Google Scholar] [CrossRef]
  37. Callaway, R.M.; Kikodze, D.; Chiboshvili, M.; Khetsuriani, L. Unpalatable plants protect neighbors from grazing and increase plant community diversity. Ecology 2005, 86, 1856–1862. [Google Scholar] [CrossRef]
  38. Aragón, R.; Oesterheld, M. Linking vegetation heterogeneity and functional attributes of temperate grasslands through remote sensing. Appl. Veg. Sci. 2008, 11, 117–130. [Google Scholar] [CrossRef]
Figure 1. Map of the study site. This map is based on the GSI Tiles collection published by Geospatial Information Authority of Japan.
Remotesensing 17 03187 g001
Figure 2. Aerial view of the study site. Sasa hayatae is distributed mainly along the ridge, interspersed with trees such as Abies homolepis.
Remotesensing 17 03187 g002
Figure 3. Results of sites ordination using NMDS. Numbers indicate sites positions; green arrows represent environmental factor vectors (See Table 2 for the environmental factor codes). Sites were grouped into nine classes based on spatial clustering (red box and text).
Remotesensing 17 03187 g003
Figure 4. Distribution of nine classes classified from the NMDS results.
Remotesensing 17 03187 g004
Figure 5. Results of species ordination using NMDS. Green arrows indicate vectors of environmental factors (See Table 2 for the environmental factor codes). Red text, endangered species; blue text, unpalatable species of C. nippon. Species were shown for each layer they appeared in and labeled with abbreviations (T1, T2, S); however, herbaceous layer was omitted. The mortal individuals are labeled D.
Remotesensing 17 03187 g005
Figure 6. Measured vegetation height of S. hayatae and M. sinensis.
Remotesensing 17 03187 g006
Figure 7. Measured S. hayatae cover in 2022 and the mean values of the reflection intensity at heights of 0.7–0.8 m in S. hayatae, where R2 was the largest and the p-value was the smallest.
Remotesensing 17 03187 g007
Figure 8. Measured M. sinensis cover in 2022 and the mean values of the reflection intensity at heights of 1.4–1.5 m in M. sinensis, where R2 was the largest and the p-value was the smallest.
Remotesensing 17 03187 g008
Figure 9. The mean values of the reflection intensity were calculated for S. hayatae at a height of 0.7–0.8 m and for M. sinensis at a height of 1.4–1.5 m and, and M. sinensis cover 2022 and the S. hayatae cover 2022 were summarized for each of the a, b, and c categories. The nine NMDS classes were grouped into three categories: classes 1 and 7 were grouped into category a, classes 2, 3, and 6 into category b, and classes 4 and 5 into category c.
Remotesensing 17 03187 g009
Figure 10. The areas are important for grassland species conservation. From the box-and-whisker plots of the mean values of the reflection intensity at a height of 1.4–1.5 m for M. sinensis, thresholds of 0, 0–20, and 30–40 were set. 30–40 is an important area for conserving the diversity of grassland species in the survey area.
Remotesensing 17 03187 g010
Table 1. List of species in the survey. CR: Critically Endangered, EN: Endangered, NT: Near Threatened, These are Red List categories.
FamilyScientific NameRed ListUnpalatable Species
Tokushima Pref.Ministry of the Environment
AmaryllidaceaeAllium thunbergii
AnacardiaceaeToxicodendron orientale subsp. orientale
AraliaceaeKalopanax septemlobus
AsteraceaeCirsium japonicum var. horridum
AsteraceaeCrassocephalum crepidioides
AsteraceaeErechtites hieraciifolius
AsteraceaeIxeridium dentatum
AsteraceaeSolidago virgaurea subsp. leiocarpa
BlechnaceaeStruthiopteris niponica
CampanulaceaeAdenophora triphylla subsp. aperticampanulata
CaryophyllaceaeStellaria sessiliflora
ClethraceaeClethra barbinervis
DennstaedtiaceaeHypolepis punctata
ElaeagnaceaeElaeagnus umbellata var. umbellata
EricaceaeLyonia ovalifolia var. elliptica
EricaceaeRhododendron kaempferi var. kaempferi
EricaceaeRhododendron tsurugisanenseNT
EricaceaeVaccinium oldhamii
EricaceaeVaccinium smallii var. versicolor
FagaceaeQuercus crispula var. crispula
GentianaceaeGentiana scabra var. buergeri
GentianaceaeTripterospermum japonicum
GeraniaceaeGeranium shikokianum var. shikokianumNTNT
HaloragaceaeGonocarpus micranthus
HydrangeaceaeHydrangea hydrangeoides
HydrangeaceaeHydrangea paniculata
HypericaceaeHypericum erectum
HypericaceaeHypericum sikokumontanum
JuncaceaeJuncus decipiens
LamiaceaeComanthospace japonica
LamiaceaeGlechoma hederacea subsp. grandis
LardizabalaceaeAkebia trifoliata
LiliaceaeTricyrtis macropodaEN
LycopodiaceaeLycopodium dendroideum
OleaceaeFraxinus sieboldiana
OnagraceaeCircaea alpina subsp. alpina
OsmundaceaeOsmunda japonica
OxalidaceaeOxalis nipponica subsp. nipponicaCR
PinaceaeAbies homolepis
PoaceaeArundinella hirta
PoaceaeCarex sp.
PoaceaeMiscanthus sinensis
PoaceaePoaceae sp.
PoaceaeSasa hayatae
PolygalaceaePolygala japonica
PolygonaceaeFallopia japonica
PrimulaceaeLysimachia japonica
RosaceaePotentilla hebiichigo
RosaceaeRosa multiflora
RosaceaeRubus crataegifolius
RosaceaeRubus illecebrosus
RosaceaeRubus palmatus var. coptophyllus
RosaceaeSorbus commixta
RubiaceaeGalium trifidum subsp. columbianum
SalicaceaeSalix sieboldiana var. sieboldiana
SapindaceaeAcer micranthum
SapindaceaeAcer rufinerve
SapindaceaeAcer sieboldianum
SymplocaceaeSymplocos coreana
ThelypteridaceaeThelypteris pozoi subsp. mollissima
UrticaceaePilea pumila
ViburnaceaeViburnum furcatum
ViolaceaeViola sp.
Table 2. Environmental factors explain the variation in the two-dimensional plot.
FactorsCodeR2Pr(>r)
S. hayatae cover 2002SC20020.06 0.35
S. hayatae cover 2022SC20220.08 0.26
M. sinensis cover 2002MC20020.10 0.19
M. sinensis cover 2022MC20220.57 0.00
Change in S. hayatae coverCiSC0.17 0.05
Change in M. sinensis coverCiMC0.21 0.02
Table 3. The correlation between S. hayatae cover 2022 and grid aggregate values (the number of point clouds and the mean reflection intensity), and the correlation between M. sinensis cover 2022 and grid aggregate values. Correlations were calculated separately for each 10 cm interval. Number shows the number of point clouds of the first return, intensity shows the average value of the reflection intensity of the first return. Bold text shows R2 was the largest and the p-value was the smallest. Red shows R2 is largest and p-value is smallest; bold shows both requirements are met.
Height
[m]
Sasa hayataeMiscanthus sinensis
NumberIntensityNumberIntensity
R2pR2pR2pR2p
0–0.10.010.137 0.010.135 <0.010.387 <0.010.520
0.1–0.2<0.010.281 <0.010.165 <0.010.505 <0.010.609
0.2–0.3<0.010.713 <0.010.176 <0.010.888 <0.010.684
0.3–0.4<0.010.644 <0.010.196 <0.010.512 <0.010.684
0.4–0.5<0.010.544 <0.010.185 <0.010.228 <0.010.684
0.5–0.6<0.010.336 <0.010.279 <0.010.223 <0.010.637
0.6–0.7<0.010.271 <0.010.183 <0.010.585 <0.010.713
0.70.8<0.010.652 0.020.086 <0.010.727 <0.010.719
0.8–0.9<0.010.838 <0.010.252 <0.010.357 <0.010.891
0.9–1<0.010.971 <0.010.254 <0.010.477 <0.010.757
1–1.1<0.010.968 <0.010.210 <0.010.441 <0.010.698
1.1–1.2<0.010.892 <0.010.270 <0.010.422 <0.010.780
1.2–1.3<0.010.461 <0.010.397 0.010.127 <0.010.946
1.3–1.4<0.010.243 <0.010.303 <0.010.715 0.020.090
1.41.5<0.010.735 <0.010.237 <0.010.283 0.040.020
1.5–1.6<0.010.645 <0.010.310 <0.010.303 0.030.038
1.6–1.7<0.010.744 <0.010.316 <0.010.259 0.040.023
1.7–1.8<0.010.676 <0.010.394 <0.010.321 0.040.026
1.8–1.9<0.010.863 <0.010.592 <0.010.168 0.030.039
1.9–2<0.010.743 <0.010.407 <0.010.336 <0.010.796
Table 4. Evaluation of areas important for grassland species conservation. 30–40 is an important area for conserving the diversity of grassland species in the survey area.
Classes of NMDSThree Categories Based on Their Positions Relative to the M. sinensis Cover 2022Estimation of the Density of M. sinensis
(The Mean Values of the Reflected Intensity at a Height of 1.4–1.5 m)
Grassland Plant Diversity
1a30–40High
7
2b0–20Low
3
6
4c0Low
5
8na
9
Disclaimer/Publisher’s Note: The statements, opinions and data contained in all publications are solely those of the individual author(s) and contributor(s) and not of MDPI and/or the editor(s). MDPI and/or the editor(s) disclaim responsibility for any injury to people or property resulting from any ideas, methods, instructions or products referred to in the content.