Abstract
Phenology prediction is critical for optimizing the timing of rice crop management operations such as fertilization and irrigation, particularly in the face of increasing climate variability. This study aimed to estimate three key developmental stages in the temperate irrigated rice systems of Australia: panicle initiation (PI), flowering, and harvest maturity. Extensive and diverse field observations () were collected over four consecutive seasons (2022–2025) from the rice-growing regions of the Murrumbidgee and Murray Valleys in southern New South Wales, encompassing six varieties and three sowing methods. The extent of data available allowed a number of traditional and emerging machine learning (ML) models to be directly compared to determine the most robust strategies to predict Australian rice crop phenology. Among all models, Tabular Prior-data Fitted Network (TabPFN), a pre-trained transformer model trained on large synthetic datasets, achieved the highest precision for PI and flowering predictions, with root mean square errors (RMSEs) of 4.9 and 6.5 days, respectively. Meanwhile, long short-term memory (LSTM) excelled in predicting harvest maturity with an RMSE of 5.9 days. Notably, TabPFN achieved strong results without the need for hyperparameter tuning, consistently outperforming other ML approaches. Across all stages, models that integrated remote sensing (RS) and weather variables consistently outperformed those relying on single-source input. These findings underscore the value of hybrid data fusion and modern time series modeling techniques for accurate and scalable phenology prediction, ultimately enabling more informed and adaptive agronomic decision-making.
1. Introduction
Rice is the world’s most important staple crop, providing more than 20% of caloric intake for over half the global population. In the 2024–2025 season, global rice production reached record levels, estimated at 535.8 million tonnes (milled basis), an increase of nearly 3% year on year, and it supports a multibillion-dollar market vital to global food security and economic stability [1,2].
Rice phenology refers to the timing of key developmental stages in the life cycle of the rice plant, including germination, vegetative growth, reproduction, and ripening. Accurate phenology prediction is vital because it facilitates adaptation strategies to climate change [3], aids in variety selection [4], enables optimized crop management practices [5], and supports yield predictions for specific growing conditions [6,7]. There are three phenological growth stages of high agronomic significance: panicle initiation (PI), flowering, and harvest maturity.
The timing of PI is critical, as it signals the transition into the reproductive phase and informs key management decisions such as nitrogen (N) topdressing and water management, both of which influence yield potential [8]. If cold temperatures occur during the microspore stage (shortly after PI), they can induce sterility and lead to severe yield losses, especially in sensitive varieties [9,10]. Accurate prediction of flowering is essential for timely harvest scheduling, which helps minimize losses from adverse weather and supports optimal grain quality [11]. Additionally, higher yields have been associated with earlier flowering, elevated chlorophyll indices, and favorable thermal conditions around flowering [7].
Harvest maturity, specifically reaching 22% grain moisture content, is widely regarded as the optimal point for harvest in Australian rice systems to avoid grain cracking and post-harvest quality degradation [12,13,14]. Collectively, these stages inform tactical decisions throughout the growing season and underpin broader strategies for climate adaptation, varietal selection, and resource optimization [3,4].
Environmental conditions and management practices jointly shape phenological development, introducing considerable variability. Temperature is a dominant driver: high temperatures accelerate development, while low temperatures can delay growth or cause sterility, particularly during reproductive stages such as PI [15,16,17]. Daylength sensitivity further complicates flowering predictions, especially in photoperiod-sensitive varieties [18,19]. Additionally, environmental factors such as radiation, soil moisture, and nutrient status significantly influence stage transitions [5,6,20]. Grain quality at harvest maturity is highly sensitive to environmental conditions during the grain-filling period and post-maturity handling. Although the grain is physiologically mature once filling is complete, delayed drainage and harvest—especially under high moisture and temperature conditions—can lead to declines in grain quality traits such as whole grain yield and increased chalkiness [12]. Therefore, aligning drainage and harvest timing with environmental cues is important for preserving quality in Australian production systems. On the management side, sowing dates, water application, and fertilization schedules must be precisely aligned with variety requirements and climatic conditions [10,21]. These interdependencies underscore the challenge of developing accurate and generalizable phenology models across diverse environments and cropping systems.
Traditional approaches to tracking rice phenology rely on field-based observations using standardized growth stage scales such as BBCH (Biologische Bundesanstalt, Bundessortenamt und CHemische Industrie). While accurate, these methods are labor-intensive and difficult to scale for large areas or time-sensitive decision-making [20]. Mechanistic crop models, often based on degree-day accumulation, simulate phenological stages using thermal time and photoperiod thresholds [22,23]. However, such models frequently require variety-specific calibration and may not adequately capture spatial variability, including in-field soil differences and between-field environmental or management effects [24].
To overcome these limitations, remote sensing (RS) offers a scalable, data-driven alternative for phenology monitoring. Multispectral imagery from sensors such as Sentinel-2 (S2) captures vegetation indices such as the normalized difference vegetation index (NDVI), chlorophyll index red edge 2 (CIRE2), and the normalized difference water index (NDWI), which are sensitive to canopy greenness, chlorophyll status, and moisture content [25,26,27]. Time-series analysis of these indices allows for the detection of key phenological transitions such as PI, flowering, and harvest maturity [28,29,30,31]. Although unmanned aerial vehicle (UAV)-based approaches have demonstrated high accuracy in capturing crop height and detecting phenological stages [32], scalability remains a challenge for implementation over large agricultural regions. For instance, Yang et al. [33] showed that UAV imagery combined with deep learning like convolutional neural networks (CNNs) can classify phenological stages from single-date images, enabling near real-time monitoring without full time-series data, whereas Brinkhoff et al. [7] used satellite-based RS phenology signals to improve yield prediction. Beyond UAV studies, recent advances have demonstrated the value of scalable machine learning (ML) approaches for rice phenology prediction. These include particle-filtering frameworks with support vector regression (SVR) and random forest regression (RFR) models applied to Sentinel-1 (S1) data for real-time phenology estimation [34], deep learning classifiers such as Residual Neural Networks (ResNet-50) trained on high-resolution imagery for predicting six rice growth stages [35], and multi-sensor fusion models combining Landsat, S1, and S2 for large-scale phenology mapping with high accuracy [36]. Ensemble and sequential learning models such as random forest (RF), light gradient boosting machine (LightGBM), and long short-term memory (LSTM) have also shown promise in such tasks, especially when combining RS and weather variables [13,37]. Parallel to RS-based approaches, weather-driven models remain widely used for phenology forecasting, often relying on cumulative thermal time or growing degree days [32]. For instance, the Rice Clock model simulates phenology based on mean daily temperature [22], while Darbyshire et al. [15] and Sharifi et al. [23] demonstrated the importance of stage-specific temperature thresholds for PI across locations and cultivars. For rice phenological stages, crop models such as the crop environment resource synthesis-rice (CERES-Rice), the ORYZA rice growth model, and the RiceGrow model have been integrated with machine learning to improve prediction robustness [37,38], and data-driven methods have shown superior accuracy compared to physics-based and hybrid models [39].
Despite clear advances, most prior studies have focused on either weather-based or RS-based inputs, with few offering direct comparisons between them. While recent efforts have explored fusing RS and weather data for yield prediction [7,39], their combined effectiveness for modeling stage-specific phenological events remains underexplored.
Building on these advances, recent ML developments, particularly Tabular Prior-data Fitted Network (TabPFN), a pretrained transformer model designed for tabular data, have further expanded the potential for phenology forecasting [40]. TabPFN has shown competitive performance relative to gradient-boosted models such as extreme gradient boosting (XGBoost), categorical boosting (CatBoost), and LightGBM in agricultural prediction tasks [41], highlighting opportunities to improve accuracy through modern ML architectures and multi-source data integration.
Therefore, the objectives of this study are as follows:
- To predict PI, flowering, and harvest maturity using integrated daily time-series data from S2 imagery and weather observations.
- To compare the performance of weather-only, RS-only, and combined remote sensing and weather (RS + W) input types for predicting key rice phenological stages.
- To evaluate and compare three modeling frameworks: (i) logistic regression (LR) and tree-based ensembles, (ii) sequential model (LSTM), and (iii) the pretrained transformer-based TabPFN, focusing on their accuracy, robustness, and field-scale applicability.
2. Materials and Methods
2.1. Study Area
The study area is located in the rice-growing region of southern New South Wales (NSW), Australia, specifically within the Murrumbidgee and Murray Valley irrigation areas. Rice samples were collected from various locations during the 2022–2025 harvest years (Figure 1). Rice cultivation in this region follows an annual cycle, with planting occurring once a year. Typically, rice is seeded in October, experiences peak development during the summer months (December–February), and is harvested from April to May.
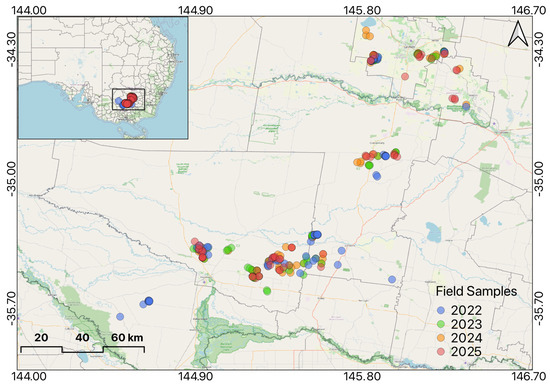
Figure 1.
Field samples of rice collected during the 2022−2025 seasons in the rice−growing region.
2.2. Phenology Data
We compiled a dataset of rice phenology and agronomic variables for the 2022–2025 growing seasons, including sowing dates and methods, key management events (e.g., permanent water application dates), field types, and the major rice varieties cultivated.
- PI: Field monitoring for PI was conducted through multiple visits from late December to January. During each visit, 10 random tillers were selected per field and sliced at the base to check for panicle initiation. This process was repeated every 2–3 days. The PI date was determined by interpolating observations over time and defined as the date when 3 out of 10 main tillers exhibited a panicle measuring between 1 mm and 3 mm in length.
- Flowering: Flowering occurs in the reproductive phase of rice development, typically 25–35 days after PI [4,16,21]. This phase begins with panicle emergence from the flag leaf sheath (heading), which precedes full flowering. The flowering period usually lasts about 7–10 days for a single panicle and 10–14 days for the entire plant, varying due to differences in tiller development [42]. Flowering was assessed through inspections every three to five days, visually estimating the percentage of tillers with developed panicles—specifically when more than 50% of the florets had bloomed. The flowering date was interpolated to identify the day when 50% of tillers exhibited flowering.
- Harvest maturity: Harvest maturity occurs approximately 45–55 days after flowering [43]. Field visits were conducted every 3–5 days to visually assess grain color changes from green to golden yellow. Grain samples were collected in the afternoon to minimize moisture variation and were threshed using a rice threshing machine. The samples were analysed using the CropScan 2000B whole grain analyser (NIR Technology Systems, Australia), which was calibrated on Japanese rice samples with reference laboratory values for protein, moisture, and amylose. Spectral measurements were collected in the 720–1100 nm wavelength range using an 18 mm pathlength cell. Each sample was sub-scanned five times, and the average spectrum was used for analysis [44]. It uses calibrations built from grains of known moisture levels to estimate grain moisture content. Optimum maturity is reached when grain moisture drops to 22%, varying by variety, nitrogen (N) level, and temperature. Medium-grain varieties typically mature slightly later than short-grain varieties, whereas long-grain varieties reach harvest maturity fastest [43,45].
2.3. Field Data
Phenological data were collected from 216 commercial fields and 88 experimental sites, yielding 779 observations across PI, flowering, and harvest maturity (defined as the stage when grain moisture reaches approximately 22%) (Table 1). Multiple stages were recorded per field where possible. In experimental sites, N levels were varied while holding variety, sowing method, location, and other management factors constant to isolate the effect of N on phenology. The dataset spans seven varieties (primarily V071 and Reiziq) and three sowing methods: aerial, direct drill, and dry broadcast [26]. While direct drill was most common, the diversity of methods supports robust phenological comparisons across management systems.

Table 1.
Phenology data by year, sample count, type, variety, and sowing method.
The dataset reveals interannual variability and trends specific to each sowing method across the phenological stages (Figure 2). The timing and spread of PI, flowering, and maturity events vary from year to year, reflecting climatic fluctuations and management practices such as irrigation timing and sowing dates. Including this variability in the training data is crucial for developing phenology models that are robust across seasons, varieties, and agronomic systems. This comprehensive dataset, encompassing () unique sampling locations observed over four years, provides a rich foundation for training and validating phenological prediction models. It also facilitates the analysis of how sowing methods and seasonal conditions affect key crop stages, contributing to model generalizability and agronomic relevance.
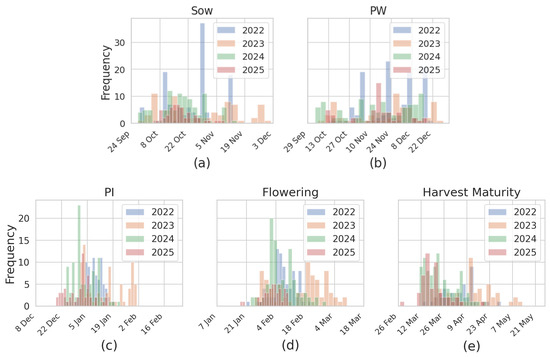
Figure 2.
Histograms showing the distribution of rice field samples used to define input data windows for model training: (a) sowing, (b) permanent water, (c) panicle initiation (PI), (d) flowering, and (e) harvest maturity, categorized by sowing method and year.
2.4. Time-Series RS and Weather Data
RS data were obtained from S2 imagery using Google Earth Engine (GEE) [46], which provides top-of-atmosphere (TOA) reflectance at 10–20 m spatial resolution [47]. While surface reflectance (SR) is often preferred for its atmospheric correction, previous studies have shown that TOA can yield comparable model performance for crop-related predictions [7,48]. Likewise, our preliminary comparisons in phenology modeling showed no consistent improvement when using SR over TOA data. Therefore, all model development in this study was based on TOA reflectance products.
Images were filtered from 1 September to 15 May for each season and clipped to field boundaries. Cloud masking was applied using the cloud score plus (CSP) algorithm with a 60% threshold [49]. Vegetation indices (VIs) and spectral band reflectance values were extracted at their native 5-day S2 revisit intervals and first interpolated to a daily time step using linear interpolation, applied separately for each field. This step produced continuous daily time series while preserving within-season trends. The resulting daily series were then smoothed using a Savitzky–Golay (SG) filter [50]. The SG filter was applied using window size 9 and polynomial order 2 to all remotely sensed bands and VIs, producing noise-reduced daily profiles for subsequent feature extraction. Daily weather data were retrieved from the Scientific Information for Land Owners (SILO) database [51] at each field’s centroid, covering the same seasonal period. Although multiple weather variables were downloaded—including temperature, solar radiation, rainfall, vapour pressure deficit (VPD), and relative humidity—only those showing strong predictive performance were retained, as detailed in the subsequent section on predictors.
2.5. Predictors
For all ML models except LSTM, cumulative values of both RS and weather predictors were used to capture the combined effects of canopy development and environmental conditions on phenological transitions. In contrast, LSTM models utilized the full daily time-series inputs, enabling them to explicitly learn temporal dependencies across the growing season. The complete list of predictor variables is summarized in Table 2.

Table 2.
Categorisation of predictors used in the models. All variables include both daily and cumulative values, derived from sowing dates.
2.5.1. Weather-Based Predictors
In addition to daily meteorological variables, derived predictors were created to better capture physiological drivers of development. Growing degree days (GDD) were calculated using the DD0 model [15], which has proven reliable for rice phenology in Australia:
where , , and .
All weather-related variables, including temperature metrics (Tmin, and Tmax), solar radiation, and derived indicators such as GDD, were prepared in both daily and cumulative formats. While not a meteorological parameter, “days since sowing” was also included due to its predictive value. All values were accumulated from sowing dates to capture growing season dynamics relevant to phenology (Table 2).
2.5.2. RS-Based Predictors
Spectral bands (B1–B12) and VIs from S2 imagery served as the core RS features. Based on existing research highlighting their predictive relevance and complementary sensitivities, three VIs were retained for modeling: NDVI, CIRE2, and NDWI. These indices have been shown to capture distinct biophysical processes—NDVI reflects canopy greenness, CIRE2 relates to chlorophyll status, and NDWI indicates canopy moisture content. The predictor set thus contains complementary as well as collinear features, which the machine learning algorithms employed are able to learn from [25,26,27], ensuring that the predictor set captured distinct physiological aspects of crop condition. The combination of these indices provides broader sensitivity to phenological changes while limiting redundancy. To support this selection, a correlation matrix of the final predictor set, incorporating both RS and key meteorological variables, is presented in the Results section.
- NDVI: Sensitive to green biomass and canopy structure;
- CIRE2: Responsive to crop nitrogen status and chlorophyll concentration;
- NDWI: Reflects canopy moisture content and water stress.
Each index was computed using the following equations:
Because Bands 6 and 11 have a native spatial resolution of 20 m and Band 8 is 10 m, the bands were resampled to a common 10 m grid by Google Earth Engine (GEE) during index computation. By default, GEE applies nearest-neighbor resampling when reprojection occurs, unless explicitly overridden by the user [52].
To account for cumulative vegetation dynamics, each index was also computed in cumulative form, starting from both the sowing date and the permanent water date.
Figure 3 illustrates the temporal variability in temperature across seasons. Panel (a) compares year-wise average temperatures across fields, while panel (b) shows normalized cumulative temperature profiles across the season. The latter clearly highlights interannual variability, with 2025 standing out as the hottest year and 2023 as the coolest.
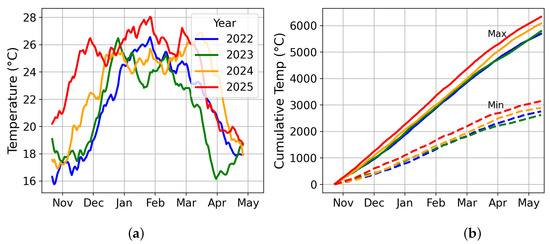
Figure 3.
Temperature comparison used in feature engineering: (a) year-wise mean field temperatures; (b) cumulative temperature from mean sowing date (≈20 October).
2.6. Modelling Approach
We evaluated a diverse set of ML models to predict rice phenological stages from integrated S2 satellite time-series and SILO weather data. Four classification-based models were implemented: LR, RF [53], LightGBM [54], and TabPFN [40]. These models were trained in a daily binary classification framework, where the goal was to predict, for each date, whether the target phenological stage had been reached.
Additionally, a regression-based sequential model, LSTM [55], was employed to directly estimate phenological dates as continuous outputs. For all models, phenological dates (e.g., PI, flowering, and harvest maturity) were converted to day-of-season (DOS), calculated from 1 July of each year, to standardize temporal comparisons across seasons. The overall modelling workflow, including data preparation, feature engineering, model training, and evaluation, is illustrated in Figure 4.
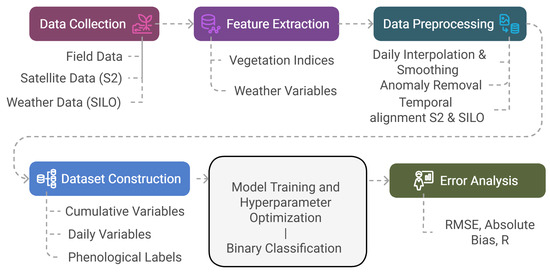
Figure 4.
Proposed modelling workflow, including data processing steps, model training, and evaluation pipeline.
2.6.1. Training Windows and Filtering
Phenology prediction was framed as a daily binary classification task. For each field, dates before the phenological event were labelled as 0, and dates at or after the event as 1. The model then predicted the probability of transition across the time series, and the estimated event date was identified as the first point where the predicted class switched from 0 to 1.
To focus model training on relevant periods and reduce noise, field-level time series were restricted to known event-specific date ranges:
- PI: 6 December–8 February;
- Flowering: 5 January–16 March;
- Harvest maturity: 20 February–15 May.
These dynamic windows, visualized in Figure 2, helped balance the 0/1 class distribution and excluded irrelevant pre- and post-event dates.
2.6.2. Logistic Regression (LR)
LR served as a baseline model due to its simplicity and interpretability. It was trained to identify phenological transition points from binary-labeled time-series data. Preprocessing included standard scaling of input variables and class weight balancing to address class imbalance. Predictions were generated as daily probabilities, and the predicted event date was defined as the first occurrence where the probability exceeded the decision threshold.
2.6.3. Tree-Based Models
RF and LightGBM were implemented using the same classification framework. RF uses an ensemble of decorrelated decision trees to enhance robustness, while LightGBM applies histogram-based gradient boosting for computational efficiency and improved accuracy on tabular data.
2.6.4. Pretrained Transformer-Based Model
TabPFN is a transformer-based model pretrained on millions of synthetic datasets, designed for tabular data. It enables fast inference with minimal task-specific tuning. In this study, TabPFN classified phenological stages using tabular inputs composed of cumulative statistics from RS and weather variables.
2.6.5. Hyperparameter Tuning
Grid search was applied to all models except TabPFN, which operates with fixed pretrained parameters:
- LR: Regularization strength ;
- LightGBM: Learning rate , estimators ;
- RF: Estimators , max depth .
Time-Series Deep Learning (LSTM)
The LSTM network learned temporal patterns from sequential daily RS and weather data. As shown in Figure 5, each input was a multivariate time series with shape (batch_size, n, 8), where n is the number of daily time steps and 8 is the feature dimension (as listed in Table 2). The model consisted of two stacked LSTM layers with dropout and L2 regularization, followed by a dense output layer. The configuration was as follows:
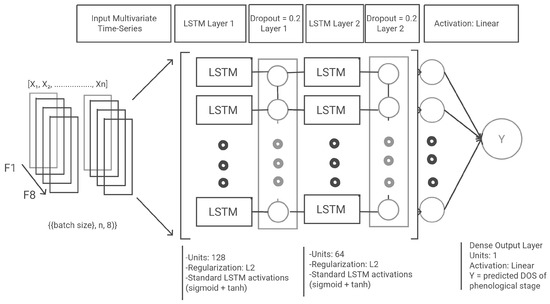
Figure 5.
Proposed long short-term memory (LSTM) architecture, showing multivariate input representation, sequential processing through stacked LSTM layers, and final dense output prediction.
- Batch size: 10;
- First LSTM layer: 128 units, return sequences enabled, L2 regularization;
- Dropout: rate = 0.2;
- Second LSTM layer: 64 units, return sequences enabled, L2 regularization;
- Dropout: rate = 0.2;
- Dense output layer: 1 unit, linear activation.
The model was trained with the Adam optimiser, mean squared error (MSE) loss, and early stopping based on validation loss.
2.7. Validation Strategy
We evaluated model performance using a leave-one-year-out cross-validation (LOYO-CV) strategy, hereafter referred to as LOYO. Models were trained on three years and tested on the remaining year. In other words, the training set always consisted of three complete seasons, and the fourth season was held out entirely for testing. This ensured that within-year phenological correlations could not influence test performance and that prediction of phenological variation in the independent held-out season was robustly assessed [56]. This season-based split also avoided mixing data from the same season across training and test sets, which could otherwise inflate accuracy due to shared environmental conditions. For example, when harvest maturity in 2025 was used as the test year, models were trained on 185 field-level time-series records (remote sensing and weather) from 2022–2024 and evaluated on 49 independent fields from the 2025 season. The same procedure was repeated for 2022, 2023, and 2024 as the held-out years, providing reliable interannual evaluation across all folds.
While the dataset size is moderate—particularly for deep learning models such as LSTM—several measures were applied to reduce overfitting risk. These included early stopping based on validation loss, dropout regularization, and limiting model complexity by constraining hidden layer size and training epochs. For tabular models, regularization parameters were tuned via nested LOYO within the training years to avoid information leakage. Performance metrics were averaged across folds to assess interannual generalization.
2.8. Evaluation Metrics
Models were evaluated using root mean square error (RMSE), mean absolute error (MAE), Pearson’s correlation coefficient (R), and absolute bias, where absolute bias is defined as the absolute value of the mean difference between observed and predicted phenological dates.
The RMSE is calculated as:
The MAE is calculated as:
The absolute bias is computed as:
Here, denotes the observed phenological dates, and denotes the predicted dates.
Pearson’s correlation coefficient (R) is calculated as:
where and are the mean observed and predicted phenological dates, respectively.
Additionally, classification metrics such as the receiver operating characteristic–area under the curve (ROC-AUC), classification accuracy, and probabilistic calibration metrics were used to assess the reliability of binary classification outputs. ROC-AUC measures the model’s ability to distinguish between the two classes across all possible classification thresholds, with higher values indicating better performance. Furthermore, Shapley additive explanations (SHAP) were employed to understand the relative importance and contribution of individual predictors in influencing the model outputs.
3. Results
The correlation matrix (Figure 6) shows that, among the eight predictors used, NDVI was correlated with both CIRE2 and NDWI (). NDWI had a moderate correlation with CIRE2 (). Meteorological variables showed varying degrees of association: maximum temperature and minimum temperature were correlated with GDD (), as expected due to the cumulative temperature basis of GDD. Radiation displayed weak to moderate correlations with most other variables (R = −0.6 to 0.4). Days since sowing (DSS) was weakly correlated with most predictors. These relationships confirm that the selected predictor set contains both complementary and partially collinear features, ensuring representation of distinct environmental and canopy signals, which the ML algorithms are able to learn from.
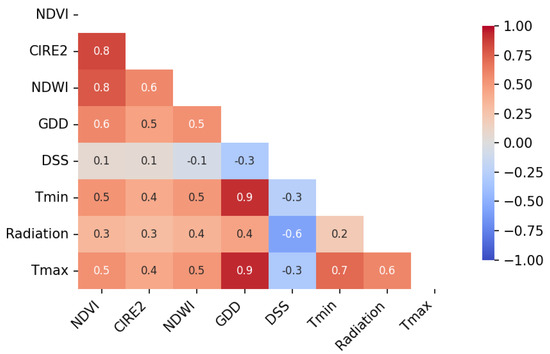
Figure 6.
Pearson correlation matrix among the eight meteorological and remote sensing (RS) predictors used in this study: normalized difference vegetation index (NDVI), chlorophyll index red−edge 2 (CIRE2), normalized difference water index (NDWI), growing degree days (GDD), days since sowing (DSS), minimum temperature (Tmin), maximum temperature (Tmax).
3.1. PI
Figure 7 summarises the performance of all models across different input types—weather, RS, and combined RS + W—for PI prediction. Five models, LSTM, LightGBM, LR, RF, and TabPFN, were evaluated based on RMSE and absolute bias. Models trained on integrated RS + W features consistently outperformed those using single-source inputs, reflecting the complementary value of combining canopy status and environmental cues. Among these, TabPFN achieved the lowest RMSE (4.91 days) and absolute bias (3.80 days) with RS + W features, followed closely by RF (RMSE = 5.41 days; absolute bias = 4.15 days) and LR (RMSE = 5.45 days; absolute bias = 4.05 days). LightGBM (RMSE = 6.00 days; absolute bias = 4.64 days) and LSTM (RMSE = 6.14 days; absolute bias = 4.97 days) showed slightly higher errors, with LSTM also exhibiting greater interannual variability.
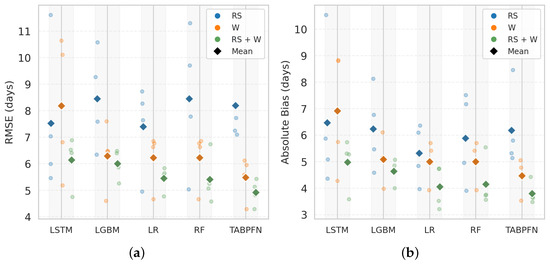
Figure 7.
Comparison of model performance for panicle initiation (PI) prediction using (a) root mean square error (RMSE, days) and (b) absolute bias (days) across different machine learning models. Results are shown for three input feature sets: remote sensing (RS), weather (W), and their combination (RS + W). Faded circular markers represent leave−one−year−out (LOYO) test results (2022–2025), while colored diamonds indicate the mean performance of each feature set in the corresponding color.
TabPFN was selected for more detailed visual and classification-based evaluation due to its superior performance. Figure 8 presents scatterplots of predicted versus observed PI dates across the three input types. RS + W predictions (Figure 8c) showed the tightest clustering along the 1:1 line, indicating strong agreement with observations, whereas RS-only and W-only predictions exhibited greater dispersion.
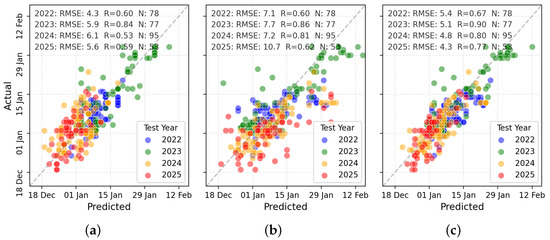
Figure 8.
Scatterplot comparisons for PI prediction using (a) W variables, (b) RS variables, and (c) combined RS + W variables.
The binary classification framework also assessed the model’s ability to distinguish pre- and post-PI periods. Using TabPFN, high ROC–AUC values (0.85–0.99) across test years demonstrated strong temporal sensitivity to phenological change.
A full summary of RMSE and absolute bias for different feature sets is presented in Table A1. TabPFN achieved the lowest absolute bias for W-only inputs (4.46 days) and similarly low bias with RS + W (3.80 days), consistently delivering minimal error magnitude across seasons.
To further understand feature contributions, SHAP (Figure A1a) was analyzed for PI predictions using TabPFN. Cumulative GDD and maximum temperature were the dominant predictors. High cumulative GDD values (pink) increased the probability of PI occurrence, indicating that greater thermal accumulation accelerates the likelihood of reaching this stage. Conversely, lower GDD values (blue) reduced the probability, consistent with delayed PI under cooler conditions. RS predictors such as NDVI also contributed modestly to the prediction.
3.2. Flowering
Similar to PI, Figure 9 compares RMSE and bias across the five models, LSTM, LightGBM, LR, RF, and TabPFN, trained with RS, W, and RS + W inputs. RS + W consistently outperformed single-source inputs. TabPFN with RS + W achieved the lowest RMSE (6.52 days) and bias (5.14 days). Binary classification analysis for pre-/post-flowering periods yielded high ROC–AUC values (0.91–0.998), confirming the model’s temporal sensitivity.
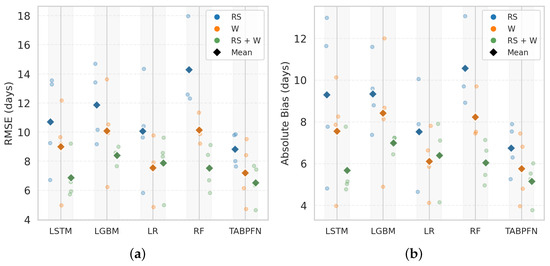
Figure 9.
Comparison of model performance for flowering prediction using (a) RMSE (days) and (b) absolute bias (days) across different machine learning models. Results are shown for three input feature sets: RS, W, and their combination (RS + W). Faded circular markers represent LOYO test results (2022–2025), while colored diamonds indicate the mean performance of each feature set in the corresponding color.
LSTM performed competitively with RS + W (RMSE = 6.86 days; absolute bias = 5.67 days). RF and LR also performed well (RMSE = 7.52 and 7.87 days; absolute bias = 6.04 and 6.38 days, respectively), while LightGBM showed higher error (RMSE = 8.40 days; absolute bias = 6.98 days).
Figure 10 shows TabPFN scatterplots for flowering prediction. RS + W (Figure 10c) produced the tightest clustering along the identity line, while RS-only and W-only showed greater spread. TabPFN performance declined with RS-only (RMSE = 8.82 days; bias = 6.74 days) and W-only (RMSE = 7.20 days; bias = 5.75 days), reinforcing the value of multi-source inputs.
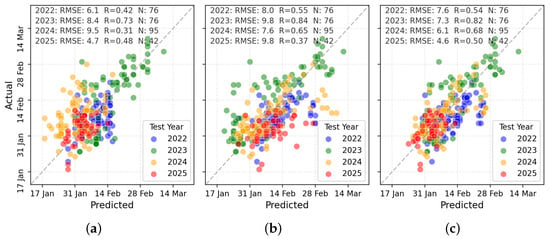
Figure 10.
Scatterplot comparisons for flowering prediction using (a) W variables, (b) RS variables, and (c) combined RS + W variables.
To further understand feature contributions, SHAP (Figure A1b) was analysed for flowering predictions using TabPFN. Cumulative radiation and days since sowing were the strongest predictors, supported by GDD and maximum temperature. Higher radiation and longer durations since sowing (pink) increased the probability of flowering occurrence, while lower values (blue) reduced it. This aligns with the role of accumulated energy and crop age in triggering reproductive transition.
3.3. Harvest Maturity
Figure 11 compares RMSE and absolute bias for harvest maturity prediction. LSTM with RS + W inputs achieved the best performance (RMSE = 5.96 days; absolute bias = 4.71 days), benefiting from its sequential structure for capturing late-season canopy and environmental dynamics. TabPFN followed closely (RMSE = 6.24 days; bias = 4.99 days). Both outperformed tree-based and linear models in prediction stability and bias control.
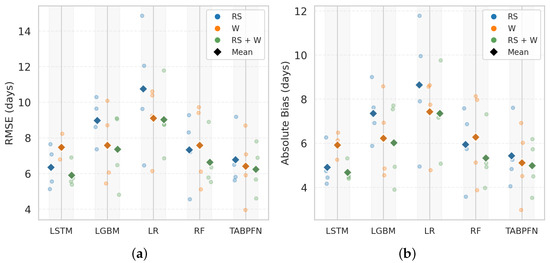
Figure 11.
Comparison of model performance for harvest maturity prediction using (a) RMSE (days) and (b) absolute bias (days) across different machine learning models. Results are shown for three input feature sets: RS, W, and their combination (RS + W). Faded circular markers represent LOYO test results (2022–2025), while colored diamonds indicate the mean performance of each feature set in the corresponding color.
Among non-sequential models, RF and LightGBM showed moderate-to-high errors with RS + W (RMSE = 6.63 and 7.36 days; absolute bias = 5.33 and 6.00 days, respectively). LR had the lowest accuracy, with RS + W yielding RMSE = 9.03 days and absolute bias = 7.35 days.
Figure 12 presents TabPFN predictions for harvest maturity. RS + W (Figure 12c) yielded tightly clustered points along the identity line, whereas RS-only and W-only inputs showed greater spread and systematic deviations.
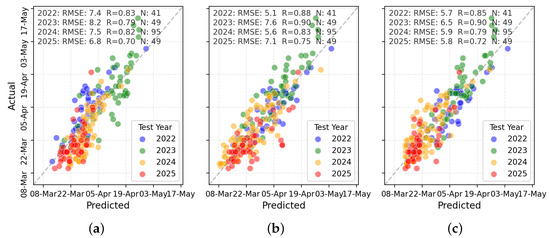
Figure 12.
Scatterplot comparisons for harvest maturity prediction using (a) W variables, (b) RS variables, and (c) combined RS + W variables.
A complete year-wise summary of RMSE and absolute bias for all models and input types is provided in Table A1.
To further understand feature contributions, SHAP (Figure A1c) was analyzed for harvest maturity predictions using TabPFN. Although the LSTM model achieved the lowest error (5.9 days), TabPFN was very close (6.2 days), and SHAP analysis was conducted with TabPFN for consistency. Radiation and GDD were the most influential predictors. Higher radiation and GDD values (pink) increased the probability of harvest maturity being reached earlier, while RS predictors like NDVI (blue) also contributed to harvest maturity prediction, reflecting the combined roles of energy supply and plant development in driving senescence.
3.4. Summary
The integration of RS and weather data consistently improved phenology prediction across all models and stages, outperforming approaches that rely solely on RS or only W data. This synergy justifies the focus on RS + W results in Table 3, which presents a comparative overview of model performance for PI, flowering, and harvest maturity, averaged across four seasons (2022–2025).

Table 3.
Comparison of top-performing models using RS + W features for PI, flowering, and harvest maturity prediction. Metrics are averaged across years (2022–2025). Best values for each stage are in bold.
For PI, the TabPFN achieved the highest accuracy, with the lowest RMSE (4.91 days) and absolute bias (3.80 days). RF and LR also performed well, with RMSEs of approximately 5.4 days), highlighting the effectiveness of cumulative features for early-stage prediction. In flowering, TabPFN again led (RMSE = 6.52 days; absolute bias = 5.14 days), slightly outperforming LSTM (RMSE = 6.86 days). For harvest maturity, both models performed strongly, suggesting that while LSTM benefits from sequential learning, tabular models with engineered cumulative features can achieve comparable accuracy. For harvest maturity, LSTM delivered an RMSE of 5.96 days and an absolute bias of 4.71 days, and TabPFN delivered an RMSE of 6.24 days, so LSTM performed well, likely due to its capacity to model gradual senescence from sequential daily inputs.
4. Discussion
4.1. PI
Given its agronomic importance, accurate PI prediction is crucial for timely nitrogen topdressing [5] and minimizing spikelet sterility risks during the cold-sensitive microspore stage [9]. This reinforces the need for reliable and transferable modeling approaches.
The TabPFN consistently achieved the best performance across years and sowing conditions, demonstrating the effectiveness of transformer-based tabular models pre-trained on large synthetic datasets with cumulative inputs. Prior studies have reported comparable PI accuracy using process-based or temperature-driven models. For example, Darbyshire et al. [15] developed a two-stage GDD accumulation model, achieving RMSE values of 3.8–4.4 days across multiple Australian field trials. Similarly, Sharifi et al. [23] optimized cardinal temperature thresholds for different cultivars in Iran, achieving RMSE values of 3.2–5.1 days across two seasons and three locations. Both studies, however, required manual parameter tuning and lacked year-wise validation. A notably low RMSE of 1.8 days was reported by Champness et al. [57] using a linear model based on irrigation deficit integrals (IDI) in aerobic rice, though this was developed from just 18 plots in two seasons and a single environment, limiting its broader applicability.
In contrast, our LOYO evaluation framework provides a more robust assessment of model generalization across seasons, reducing the overfitting risk inherent to random data splits [56]. Our results also confirm the predictive value of RS and weather variables such as GDD, the NDWI, and the CIRE2 [25,37,39], which capture early canopy development, green biomass, and nitrogen status—physiological signals that precede PI and influence its timing.
Ensemble models such as RF and LightGBM performed competitively (RMSE ≈ 5.4–5.6 days), but with slightly higher bias compared to TabPFN. Zhang et al. [37] reported similar findings, later improving LightGBM predictions by integrating simulated phenology in a hybrid framework. LR achieved an RMSE of 3.9 days in Brinkhoff et al. [26] using cumulative temperature, but performance decreased to 5.5 days RMSE in our dataset, highlighting the benefit of integrating RS-derived canopy features with thermal predictors. Overall, cumulative thermal and canopy indicators proved most effective for early-stage phenology modeling, with TabPFN offering a practical and scalable solution across diverse rice environments.
4.2. Flowering
Flowering is a key transition in rice development, influencing subsequent growth phases and yield potential, and is highly sensitive to environmental variation. Wang et al. [58] highlighted the strong influence of weather variability on rice phenology and the importance of accurately identifying flowering timing. In our study, TabPFN (RMSE = 6.52 days) and LSTM (RMSE = 6.86 days) outperformed other models. Previous work has reported lower RMSEs in some cases—for example, 4.65 days with XGBoost [37], 2.44–2.57 days with distributed RFs [39], and 2.65–7.69 days using hybrid crop model–ML approaches with leave-one-genotype-out and leave-one-genotype-location-combination-out cross-validation [38]. However, these evaluations generally did not account for inter-annual variation, limiting their ability to assess seasonal generalization.
Process-based models have achieved high accuracy; for example, the Rice Clock model reported RMSE as low as 3.5 days across six sites [22], and RiceGrow achieved 3.2–6.6 days across years and locations [59]. These models, however, require detailed physiological parameters and site-specific calibration, constraining scalability. In contrast, TabPFN approached this accuracy while relying solely on RS and weather inputs, making it more suitable for large-scale operational prediction.
Our seasonally independent evaluation further confirmed that integrating RS + W features outperformed simpler baselines. LR (RMSE = 7.87 days; bias = 1.91 days) performed well using thermal time alone, consistent with Brinkhoff et al. [26], who reported 5.2 days RMSE using temperature and sowing dates. Our LR (W) model achieved 6.9–7.55 days RMSE, confirming temperature’s central role but also underscoring the added value of RS-derived canopy metrics. Overall, combining spectral and meteorological indicators improved flowering predictions, with TabPFN slightly outperforming LSTM under cross-season conditions.
4.3. Harvest Maturity
LSTM achieved the highest accuracy for harvest maturity prediction (RMSE = 5.96 days), effectively capturing late-season canopy senescence and drying dynamics through sequential RS and weather inputs. This is consistent with Rahimi and Jung [60] and Aslam and Farhan [61], who reported the advantage of LSTM for temporal modeling in crop monitoring tasks. Zhang et al. [37] achieved a 5.72-day RMSE using hybrid models, though without explicit seasonal validation. Our LOYO evaluation confirms LSTM’s robustness under year-to-year variation.
TabPFN also performed strongly (RMSE = 6.24 days), making it valuable where large sequential datasets are unavailable. Comparable performance was observed by Brinkhoff et al. [13], where Ridge, Lasso, and LightGBM models predicted optimal harvest timing (22% grain moisture content) with ∼6.5 days RMSE, confirming the utility of cumulative RS and weather metrics. In Australian rice systems, 22% grain moisture is considered ideal for harvest [12], with delays from late-season rainfall or drying variability reducing head rice yield and grain quality [12,13].
LSTM’s advantage likely comes from its ability to model moisture-sensitive spectral indicators such as NDWI and CIRE2, which reflect canopy water content and senescence progression. Ensemble models such as LightGBM and RF (RMSE = 6.63–7.36 days) underperformed in a binary classification framework, underscoring the benefits of time-series modeling for harvest maturity prediction.
4.4. Implications, Limitations, and Future Directions
This study improves rice phenology prediction using a multi-season, multi-variety dataset covering diverse sowing methods, enhancing model generalizability for Australian irrigated rice. TabPFN showed strong predictive ability, without requiring tuning, demonstrating effective learning from weather and RS data. Future work should investigate forecasting the timing of phenological events using a combination of prior RS observations and future weather forecast data (Brinkhoff et al. [13]). Another approach could involve forecasting RS sequences using LSTM or similar models, which could then be integrated with weather forecasts to enable phenology prediction ahead of satellite observation availability (e.g., due to cloud cover or revisit gaps). With climate-driven shifts in sowing, management, and new varieties, ongoing model updates are essential. Expanding training data across more seasons and genotypes will improve robustness and practical application under changing agricultural conditions.
An important consideration for future development is the imbalance in the current dataset. While it spans four seasons and captures a wide range of management practices, the distribution of samples across varieties and sowing methods is uneven, with a predominance of V071 and direct-drill sowing (Table 1). Such imbalance may bias model learning toward patterns characteristic of the most represented variety and method, potentially limiting generalization to less-represented cases such as Reiziq or aerial sowing. In practical terms, predictions for underrepresented varieties may carry greater uncertainty, particularly when their phenological responses to weather or management diverge from the majority group. Addressing this limitation could involve targeted data collection for under-represented classes, stratified model training, or the use of class-weighted loss functions to ensure balanced learning across categories.
From a physiological standpoint, some of the residual prediction errors are likely linked to mechanistic drivers of rice development that are not fully captured by statistical learning. Phenology is shaped by nonlinear interactions between temperature, photoperiod sensitivity, and genotype-specific thermal thresholds. For example, low temperature at the young microspore stage causes spikelet sterility and reduced grain yield [62]. High nighttime temperature increased the rate of grain filling in the early grain-filling days, although it reduced final grain-filling mass and grain quality (e.g., chalkiness and milling metrics) [63]. Similarly, management factors—such as delayed permanent water application or variations in nitrogen timing—can shift phenological events in ways that are not easily inferred from cumulative or sequential predictors. These physiological and management-induced processes introduce variability that purely data-driven models may only partially resolve, especially when genotype-specific responses are not explicitly parameterized. Future work could address these mechanistic limitations by incorporating larger multi-season datasets that capture a wider range of climatic and management variability, thereby improving model generalizability.
From an operational perspective, the modeling framework demonstrated here has clear practical prospects. TabPFN offers a low-maintenance, high-accuracy option for early- and mid-season predictions without extensive tuning, making it suitable for integration into decision-support systems where computational resources or technical expertise may be limited. For later stages such as harvest maturity, the LSTM model’s capacity to exploit sequential canopy and weather data provides superior accuracy, which is particularly valuable for optimizing harvest timing and preserving grain quality. A combined stage-specific deployment—using TabPFN for PI and flowering and LSTM for maturity—could provide a robust forecasting pipeline to support timely nitrogen management, harvest scheduling, and post-harvest logistics. With the growing availability of near-real-time satellite imagery and reliable weather forecasts, such a system could deliver rolling phenology updates throughout the season, offering tangible benefits for efficiency and risk reduction in Australian rice production systems. Since LSTM relies on time-series patterns, incorporating additional seasons of data in future work would further enhance robustness by capturing a wider range of interannual variability and management practices, thereby strengthening the long-term applicability of deep learning approaches for rice phenology monitoring.
5. Conclusions
This study provides a comprehensive evaluation of rice phenology prediction using integrated RS and weather time series in temperate irrigated systems of Australia. Leveraging more than 300 field samples collected over four seasons (2022–2025), we compared multiple ML models for predicting three key phenological stages: PI, flowering, and harvest maturity. The TabPFN consistently delivered the highest accuracy for early and mid-season stages, achieving RMSE values of 4.91 days for PI and 6.52 days for flowering when using combined RS and weather (RS + W) features, without requiring hyperparameter tuning. For harvest maturity, the LSTM model achieved the lowest RMSE (5.96 days), while TabPFN performed competitively (6.24 days), demonstrating its versatility despite being a non-sequential model.
These phenological predictions have clear operational value. Accurate PI prediction supports timely nitrogen topdressing and early detection of the cold-sensitive microspore stage, reducing the risk of sterility and yield loss. Flowering prediction provides a critical benchmark for harvest timing and grain quality management, marking the shift from vegetative growth to grain filling. Harvest maturity prediction enables optimal harvest scheduling to prevent grain cracking and post-maturity losses under variable field conditions.
Overall, our findings show that combining cumulative predictors (e.g., thermal time and vegetation indices) for early and mid-season stages with sequential daily inputs for later stages—implemented through architectures such as TabPFN and LSTM—offers a robust and scalable pathway for operational phenology prediction across diverse environments and management conditions.
Author Contributions
Conceptualization, S.K.J. and J.B.; methodology, S.K.J. and J.B.; software, S.K.J.; investigation, S.K.J.; data curation, B.W.D.; writing—original draft preparation, S.K.J.; writing—review and editing, S.K.J., J.B., A.J.R. and B.W.D.; supervision, J.B., A.J.R. and B.W.D.; funding acquisition, J.B. All authors have read and agreed to the published version of the manuscript.
Funding
This work was funded by AgriFutures Australia under Grant PRO-013078, titled “Real-time Remote-Sensing Based Monitoring for the Rice Industry.”
Data Availability Statement
The satellite-derived RS data and weather information utilized in this research are sourced from open-access repositories. Specific datasets processed and analyzed during the current study can be provided by the corresponding author upon request. Phenology-related data remain confidential due to commercial sensitivities and privacy agreements.
Acknowledgments
The authors sincerely thank Tina Dunn, Josh Hart, and Alex Schultz for their valuable support in field data collection, which played a crucial role in the successful completion of this study. The authors also appreciate the work of the anonymous reviewers, which helped improve this paper.
Conflicts of Interest
The authors declare no conflicts of interest.
Appendix A

Table A1.
Summary of phenology prediction performance across models and feature groups. Metrics are averaged over four years (2022–2025) and are reported in days.
Table A1.
Summary of phenology prediction performance across models and feature groups. Metrics are averaged over four years (2022–2025) and are reported in days.
| Model + Features | PI RMSE | PI Bias | FL RMSE | FL Bias | HM RMSE | HM Bias |
|---|---|---|---|---|---|---|
| LightGBM (RS) | 8.44 | 6.24 | 11.85 | 9.33 | 8.98 | 7.35 |
| LightGBM (W) | 6.29 | 5.08 | 10.07 | 8.42 | 7.58 | 6.23 |
| LightGBM (RS + W) | 6.00 | 4.64 | 8.40 | 6.98 | 7.36 | 6.02 |
| LR (RS) | 7.40 | 5.31 | 10.05 | 7.53 | 10.75 | 8.64 |
| LR (W) | 6.23 | 5.00 | 7.55 | 6.10 | 9.10 | 7.43 |
| LR (RS + W) | 5.45 | 4.05 | 7.87 | 6.38 | 9.03 | 7.35 |
| RF (RS) | 8.45 | 5.89 | 14.28 | 10.56 | 7.34 | 5.94 |
| RF (W) | 6.23 | 5.00 | 10.14 | 8.22 | 7.59 | 6.28 |
| RF (RS + W) | 5.41 | 4.15 | 7.52 | 6.04 | 6.63 | 5.33 |
| TabPFN (RS) | 8.19 | 6.18 | 8.82 | 6.74 | 6.78 | 5.44 |
| TabPFN (W) | 5.48 | 4.46 | 7.20 | 5.75 | 6.41 | 5.11 |
| TabPFN (RS + W) | 4.91 | 3.80 | 6.52 | 5.14 | 6.24 | 4.99 |
| LSTM (RS) | 7.52 | 6.46 | 10.70 | 9.29 | 6.35 | 4.91 |
| LSTM (W) | 8.19 | 6.91 | 8.99 | 7.55 | 7.46 | 5.93 |
| LSTM (RS + W) | 6.14 | 4.97 | 6.86 | 5.67 | 5.96 | 4.71 |
PI: Panicle Initiation, FL: Flowering, HM: Harvest Maturity. Bias = Absolute Bias.
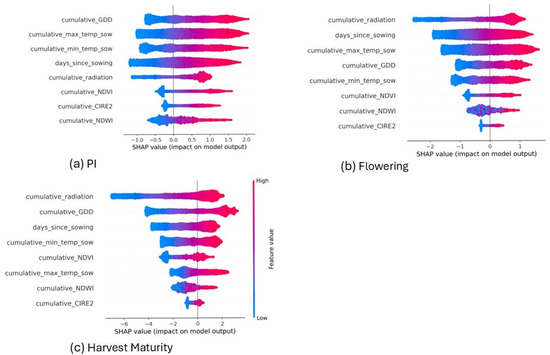
Figure A1.
SHAP summary plots showing the average impact of each feature on the model output for (a) panicle initiation (PI), (b) flowering, and (c) harvest maturity (HM). Plots are based on models trained on data from all four seasons using TabPFN. Color indicates the feature value (pink = high, blue = low), while position along the x-axis indicates the SHAP value (impact on prediction).
References
- USDA Economic Research Service. Rice Outlook: April 2025. Available online: https://ers.usda.gov/publications/pub-details?pubid=111378 (accessed on 20 May 2025).
- Food and Agriculture Organization of the United Nations. Cereal Supply and Demand Brief; Food and Agriculture Organization of the United Nations (FAO): Rome, Italy, 2025; Available online: https://www.fao.org/worldfoodsituation/csdb/en/ (accessed on 20 May 2025).
- Zhang, S.; Tao, F. Improving rice development and phenology prediction across contrasting climate zones of China. Agric. For. Meteorol. 2019, 268, 224–233. [Google Scholar] [CrossRef]
- Moldenhauer, K.; Slaton, N. Rice growth and development. Rice Prod. Handb. 2001, 192, 7–14. [Google Scholar]
- Dunn, B.; Dunn, T.; Orchard, B. Nitrogen rate and timing effects on growth and yield of drill-sown rice. Crop Pasture Sci. 2016, 67, 1202–1211. [Google Scholar] [CrossRef]
- Guo, Y.; Wu, W.; Liu, Y.; Wu, Z.; Geng, X.; Zhang, Y.; Bryant, C.R.; Fu, Y. Impacts of climate and phenology on the yields of early mature rice in China. Sustainability 2020, 12, 10133. [Google Scholar] [CrossRef]
- Brinkhoff, J.; Clarke, A.; Dunn, B.W.; Groat, M. Analysis and forecasting of Australian rice yield using phenology-based aggregation of satellite and weather data. Agric. For. Meteorol. 2024, 353, 110055. [Google Scholar] [CrossRef]
- Dunn, B.; Dunn, T.; Beecher, H. Nitrogen timing and rate effects on growth and grain yield of delayed permanent-water rice in south-eastern Australia. Crop Pasture Sci. 2014, 65, 878–887. [Google Scholar] [CrossRef]
- Gunawardena, T.A.; Fukai, S.; Blamey, F.P.C. Low temperature induced spikelet sterility in rice. I. Nitrogen fertilisation and sensitive reproductive period. Aust. J. Agric. Res. 2003, 54, 937–946. [Google Scholar] [CrossRef]
- Farrell, T.; Fox, K.; Williams, R.; Fukai, S.; Lewin, L. Minimising cold damage during reproductive development among temperate rice genotypes. II. Genotypic variation and flowering traits related to cold tolerance screening. Aust. J. Agric. Res. 2006, 57, 89–100. [Google Scholar] [CrossRef]
- Xu, X.; Jia, Q.; Li, S.; Wei, J.; Ming, L.; Yu, Q.; Jiang, J.; Zhang, P.; Yao, H.; Wang, S.; et al. Redefining the accumulated temperature index for accurate prediction of rice flowering time in diverse environments. Plant Biotechnol. J. 2024, 23, 302–312. [Google Scholar] [CrossRef]
- Ward, R. Rice Growing Guide 2021; NSW Department of Primary Industries: Yanco, NSW, Australia, 2021. Available online: https://www.dpi.nsw.gov.au/__data/assets/pdf_file/0004/1361173/RGG-2021-web-final-26Oct2021.pdf (accessed on 5 June 2025).
- Brinkhoff, J.; Dunn, B.W.; Dunn, T.; Schultz, A.; Hart, J. Forecasting field rice grain moisture content using Sentinel-2 and weather data. Precis. Agric. 2025, 26, 28. [Google Scholar] [CrossRef]
- Nalley, L.; Dixon, B.; Tack, J.; Barkley, A.; Jagadish, K. Optimal Harvest Moisture Content for Maximizing Mid-South Rice Milling Yields and Returns. Agron. J. 2016, 108, 701–712. [Google Scholar] [CrossRef]
- Darbyshire, R.; Crean, E.; Dunn, T.; Dunn, B. Predicting panicle initiation timing in rice grown using water efficient systems. Field Crop. Res. 2019, 239, 159–164. [Google Scholar] [CrossRef]
- Devkota, K.; Manschadi, A.; Devkota, M.; Lamers, J.; Ruzibaev, E.; Egamberdiev, O.; Amiri, E.; Vlek, P. Simulating the impact of climate change on rice phenology and grain yield in irrigated drylands of Central Asia. J. Appl. Meteorol. Climatol. 2013, 52, 2033–2050. [Google Scholar] [CrossRef]
- Laza, M.R.C.; Sakai, H.; Cheng, W.; Tokida, T.; Peng, S.; Hasegawa, T. Differential response of rice plants to high night temperatures imposed at varying developmental phases. Agric. For. Meteorol. 2015, 209, 69–77. [Google Scholar] [CrossRef]
- Vicentini, G.; Biancucci, M.; Mineri, L.; Chirivì, D.; Giaume, F.; Miao, Y.; Kyozuka, J.; Brambilla, V.; Betti, C.; Fornara, F. Environmental control of rice flowering time. Plant Commun. 2023, 4, 100610. [Google Scholar] [CrossRef]
- Lee, H.S.; Kim, J.H.; Jo, S.H.; Yang, S.Y.; Baek, J.K.; Song, Y.S.; Cho, J.I.; Shon, J. Physiological factors influencing climate-smart agriculture: Daylength-mediated interaction between tillering and flowering in rice. BMC Plant Biol. 2025, 25, 400. [Google Scholar] [CrossRef]
- Wang, B.; Liu, Y.; Sheng, Q.; Li, J.; Tao, J.; Yan, Z. Rice phenology retrieval based on growth curve simulation and multi-temporal sentinel-1 data. Sustainability 2022, 14, 8009. [Google Scholar] [CrossRef]
- Moldenhauer, K.; Counce, P.; Hardke, J. Rice Growth and Development; University of Arkansas System Division of Agriculture: Fayetteville, AR, USA, 2013. [Google Scholar]
- Gao, L.; Jin, Z.; Huang, Y.; Zhang, L. Rice clock model—A computer model to simulate rice development. Agric. For. Meteorol. 1992, 60, 1–16. [Google Scholar] [CrossRef]
- Sharifi, H.; Hijmans, R.J.; Hill, J.E.; Linquist, B.A. Using stage-dependent temperature parameters to improve phenological model prediction accuracy in rice models. Crop Sci. 2017, 57, 444–453. [Google Scholar] [CrossRef]
- Zhang, T.; Zhu, J.; Yang, X. Non-stationary thermal time accumulation reduces the predictability of climate change effects on agriculture. Agric. For. Meteorol. 2008, 148, 1412–1418. [Google Scholar] [CrossRef]
- Houborg, R.; Soegaard, H.; Boegh, E. Combining vegetation index and model inversion methods for the extraction of key vegetation biophysical parameters using Terra and Aqua MODIS reflectance data. Remote Sens. Environ. 2007, 106, 39–58. [Google Scholar] [CrossRef]
- Brinkhoff, J.; McGavin, S.L.; Dunn, T.; Dunn, B.W. Predicting rice phenology and optimal sowing dates in temperate regions using machine learning. Agron. J. 2023, 116, 871–885. [Google Scholar] [CrossRef]
- Zeng, Y.; Hao, D.; Huete, A.; Dechant, B.; Berry, J.; Chen, J.M.; Joiner, J.; Frankenberg, C.; Bond-Lamberty, B.; Ryu, Y.; et al. Optical vegetation indices for monitoring terrestrial ecosystems globally. Nat. Rev. Earth Environ. 2022, 3, 477–493. [Google Scholar] [CrossRef]
- Zheng, H.; Cheng, T.; Yao, X.; Deng, X.; Tian, Y.; Cao, W.; Zhu, Y. Detection of rice phenology through time series analysis of ground-based spectral index data. Field Crop. Res. 2016, 198, 131–139. [Google Scholar] [CrossRef]
- Wang, M.; Wang, J.; Chen, L.; Du, Z. Mapping paddy rice and rice phenology with Sentinel-1 SAR time series using a unified dynamic programming framework. Open Geosci. 2022, 14, 414–428. [Google Scholar] [CrossRef]
- Tian, G.; Li, H.; Jiang, Q.; Qiao, B.; Li, N.; Guo, Z.; Zhao, J.; Yang, H. An Automatic Method for Rice Mapping Based on Phenological Features with Sentinel-1 Time-Series Images. Remote Sens. 2023, 15, 2785. [Google Scholar] [CrossRef]
- He, Z.; Li, S.; Wang, Y.; Dai, L.; Lin, S. Monitoring rice phenology based on backscattering characteristics of multi-temporal RADARSAT-2 datasets. Remote Sens. 2018, 10, 340. [Google Scholar] [CrossRef]
- Yang, C.Y.; Yang, M.D.; Tseng, W.C.; Hsu, Y.C.; Li, G.S.; Lai, M.H.; Wu, D.H.; Lu, H.Y. Assessment of rice developmental stage using time series UAV imagery for variable irrigation management. Sensors 2020, 20, 5354. [Google Scholar] [CrossRef] [PubMed]
- Yang, Q.; Shi, L.; Han, J.; Yu, J.; Huang, K. A near real-time deep learning approach for detecting rice phenology based on UAV images. Agric. For. Meteorol. 2020, 287, 107938. [Google Scholar] [CrossRef]
- Yang, J.; Shi, H.; Xie, Q.; Lopez-Sanchez, J.M.; Peng, X.; Yu, J.; Chen, L. Crop Phenology Estimation in Rice Fields Using Sentinel-1 GRD SAR Data and Machine Learning-Aided Particle Filtering Approach. Int. Arch. Photogramm. Remote Sens. Spat. Inf. Sci. 2024, 48, 799–804. [Google Scholar] [CrossRef]
- Qin, J.; Hu, T.; Yuan, J.; Liu, Q.; Wang, W.; Liu, J.; Guo, L.; Song, G. Deep-learning-based rice phenological stage recognition. Remote Sens. 2023, 15, 2891. [Google Scholar] [CrossRef]
- Shojaeezadeh, S.A.; Elnashar, A.; Weber, T.K.D. A novel fusion of Sentinel-1 and Sentinel-2 with climate data for crop phenology estimation using Machine Learning. Sci. Remote Sens. 2025, 11, 100227. [Google Scholar] [CrossRef]
- Zhang, J.; Lin, X.; Jiang, C.; Hu, X.; Liu, B.; Liu, L.; Xiao, L.; Zhu, Y.; Cao, W.; Tang, L. Predicting rice phenology across China by integrating crop phenology model and machine learning. Sci. Total Environ. 2024, 951, 175585. [Google Scholar] [CrossRef]
- Chen, T.S.; Aoike, T.; Yamasaki, M.; Kajiya-Kanegae, H.; Iwata, H. Predicting rice heading date using an integrated approach combining a machine learning method and a crop growth model. Front. Genet. 2020, 11, 599510. [Google Scholar] [CrossRef]
- Yu, J.; Zhao, Y.; Lei, G.; Zeng, W. A comparison of physics-based, data-driven, and hybrid modeling approaches for rice phenology prediction. Agron. J. 2025, 117, e70010. [Google Scholar] [CrossRef]
- Hollmann, N.; Müller, S.; Eggensperger, K.; Hutter, F. Tabpfn: A transformer that solves small tabular classification problems in a second. arXiv 2022, arXiv:2207.01848. [Google Scholar] [CrossRef]
- Zhao, W.; Efremova, N. Grapevine Disease Prediction Using Climate Variables from Multi-Sensor Remote Sensing Imagery via a Transformer Model. arXiv 2024, arXiv:2406.07094. [Google Scholar] [CrossRef]
- Yoshida, S. Fundamentals of Rice Crop Science; International Rice Research Institute/Philippines: Los Baños, Philippines, 1981. [Google Scholar]
- Dunn, B.; Dunn, T. Rice variety guide 2024–25. In DPI Primefact, 14th ed.; NSW DPI: Yanco, Australia, 2024; Volume Primefact 1112. [Google Scholar]
- NIR Technology Systems. Application Note 45: CropScan 2000B–Analysis of Rice. NIR Technology Systems: Condell Park, NSW, Australia. Available online: https://www.nextinstruments.net/application/files/4914/8159/4642/Appl_Note_45._Cropscan_2000B_-_Analysis_of_Rice.pdf (accessed on 18 August 2025).
- Brinkhoff, J.; Dunn, B.W.; Dunn, T. The influence of nitrogen and variety on rice grain moisture content dry-down. Field Crop. Res. 2023, 302, 109044. [Google Scholar] [CrossRef]
- Gorelick, N.; Hancher, M.; Dixon, M.; Ilyushchenko, S.; Thau, D.; Moore, R. Google Earth Engine: Planetary-scale geospatial analysis for everyone. Remote Sens. Environ. 2017, 202, 18–27. [Google Scholar] [CrossRef]
- Veloso, A.; Mermoz, S.; Bouvet, A.; Le Toan, T.; Planells, M.; Dejoux, J.F.; Ceschia, E. Understanding the temporal behavior of crops using Sentinel-1 and Sentinel-2-like data for agricultural applications. Remote Sens. Environ. 2017, 199, 415–426. [Google Scholar] [CrossRef]
- Li, D.; Croft, H.; Duveiller, G.; Schreiner-McGraw, A.P.; Belwalkar, A.; Cheng, T.; Zhu, Y.; Cao, W.; Yu, K. Global retrieval of canopy chlorophyll content from Sentinel-3 OLCI TOA data using a two-step upscaling method integrating physical and machine learning models. Remote Sens. Environ. 2025, 328, 114845. [Google Scholar] [CrossRef]
- Rifai, M. Integration of Cloud Score+ with Sentinel-2 Harmonized for land use and land cover classification using machine learning algorithms. IOP Conf. Ser. Earth Environ. Sci. 2024, 1418, 012039. [Google Scholar] [CrossRef]
- Löw, M.; Koukal, T. Phenology modelling and forest disturbance mapping with Sentinel-2 time series in Austria. Remote Sens. 2020, 12, 4191. [Google Scholar] [CrossRef]
- Jeffrey, S.J.; Carter, J.O.; Moodie, K.B.; Beswick, A.R. Using spatial interpolation to construct a comprehensive archive of Australian climate data. Environ. Model. Softw. 2001, 16, 309–330. [Google Scholar] [CrossRef]
- Google Earth Engine Developers Guide: Reprojection and Resampling. 2025. Available online: https://developers.google.com/earth-engine/guides/resample (accessed on 18 August 2025).
- Pedregosa, F.; Varoquaux, G.; Gramfort, A.; Michel, V.; Thirion, B.; Grisel, O.; Blondel, M.; Prettenhofer, P.; Weiss, R.; Dubourg, V.; et al. Scikit-learn: Machine learning in Python. J. Mach. Learn. Res. 2011, 12, 2825–2830. [Google Scholar] [CrossRef]
- Ke, G.; Meng, Q.; Finley, T.; Wang, T.; Chen, W.; Ma, W.; Ye, Q.; Liu, T.Y. LightGBM: A Highly Efficient Gradient Boosting Decision Tree. In Proceedings of the Advances in Neural Information Processing Systems 30: Annual Conference on Neural Information Processing Systems 2017, Long Beach, CA, USA, 4–9 December 2017; Volume 30, pp. 3149–3157. Available online: http://papers.nips.cc/paper/6907-lightgbm-a-highly-efficient-gradient-boosting-decision-tree (accessed on 18 August 2025).
- Hochreiter, S.; Schmidhuber, J. Long short-term memory. Neural Comput. 1997, 9, 1735–1780. [Google Scholar] [CrossRef]
- Filippi, P.; Han, S.Y.; Bishop, T.F. On crop yield modelling, predicting, and forecasting and addressing the common issues in published studies. Precis. Agric. 2025, 26, 8. [Google Scholar] [CrossRef]
- Champness, M.; Vial, L.; Ballester, C.; Hornbuckle, J. Decision Support Tool to Predict Panicle Initiation in Aerobic Rice. Agronomy 2023, 13, 789. [Google Scholar] [CrossRef]
- Wang, H.; Ghosh, A.; Linquist, B.A.; Hijmans, R.J. Satellite-based observations reveal effects of weather variation on rice phenology. Remote Sens. 2020, 12, 1522. [Google Scholar] [CrossRef]
- Tang, L.; Zhu, Y.; Hannaway, D.; Meng, Y.; Liu, L.; Chen, L.; Cao, W. RiceGrow: A rice growth and productivity model. NJAS-Wagening. J. Life Sci. 2009, 57, 83–92. [Google Scholar] [CrossRef]
- Rahimi, M.; Jung, J.K. Phenology-Based Classification of Apple and Rice Crops Using Long Short-Term Memory Neural Networks. J. Korea Multimed. Soc. 2024, 27, 251–260. [Google Scholar] [CrossRef]
- Aslam, S.N.; Farhan, M. Deep fusion of ResNet and LSTM for rice yield prediction from satellite images and meteorological data. PeerJ Comput. Sci. 2024, 10, e2219. [Google Scholar] [CrossRef]
- Farrell, T.; Fox, K.; Williams, R.; Fukai, S. Genotypic variation for cold tolerance during reproductive development in rice: Screening with cold air and cold water. Field Crop. Res. 2006, 98, 178–194. [Google Scholar] [CrossRef]
- Song, X.; Du, Y.; Song, X.; Zhao, Q. Effect of high night temperature during grain filling on amyloplast development and grain quality in japonica rice. Cereal Chem. 2013, 90, 114–119. [Google Scholar] [CrossRef]
Disclaimer/Publisher’s Note: The statements, opinions and data contained in all publications are solely those of the individual author(s) and contributor(s) and not of MDPI and/or the editor(s). MDPI and/or the editor(s) disclaim responsibility for any injury to people or property resulting from any ideas, methods, instructions or products referred to in the content. |
© 2025 by the authors. Licensee MDPI, Basel, Switzerland. This article is an open access article distributed under the terms and conditions of the Creative Commons Attribution (CC BY) license (https://creativecommons.org/licenses/by/4.0/).