1. Introduction
Target recognition [
1,
2,
3] based on the SAR [
4,
5,
6] image holds significant importance in contemporary military operations. Deep learning methods [
7,
8] have profoundly advanced SAR target recognition [
9,
10,
11], driving significant progress in the field. However, with the deeper research, the limitations of deep learning-based SAR target recognition methods are gradually exposed. Currently, the intelligent algorithms for SAR target recognition are generally based on visual neural networks and highly dependent on sufficient training samples. The acquisition of high-quality labeled SAR data is a time-consuming and laborious subject due to the complexity of the imaging mechanism and the difficulty of visual interpretation. Incorporating target knowledge into deep learning models is the key solution to break through the bottleneck of existing methods, which has the following advantages: (i) guiding the model to focus on the key features of the target to enhance its representational capabilities; and (ii) introducing the prior knowledge to alleviate the limitation of insufficient training samples. Thus, an increasing number of researchers have focused on target recognition methods that incorporate prior target features.
Electromagnetic scattering features [
12,
13] describe the essential properties of SAR image targets and are widely employed in the field of SAR image interpretation. Existing methods have been extensively studied for fusing the scattering center [
12,
14,
15] knowledge of targets and can be broadly categorized into two groups: The first group is the simple feature fusion approach, whose core idea is to improve the completeness and distinctiveness of target representations by integrating multiple features. Zhang et al. [
16] quantized the Attributed Scattering Center (ASC) features into k feature vectors and designed a network framework to fuse ASC features with deep features. Jiang et al. [
12] employed the convolutional neural network (CNN) to perform the preliminary classification of input samples and evaluate the reliability of the output results. When the classification results were deemed highly reliable, the recognition results were directly output; otherwise, the ASC matching module was activated to further identify the category of the test sample, and the outcome was taken as the final classification decision. Xiao et al. [
17] fused multi-channel features with peak features to enhance the saliency of the aircraft, which improved the representation of the features and the detection performance of multi-scale aircraft.
The second group is the SAR target recognition method based on deep scattering information mining, which constructs the new scattering feature representation and mines the deep target scattering information. Liu et al. [
18] divided the ASC features into distinct local feature sets and employed point cloud networks to extract deep scattering information. This approach enabled the deep network to autonomously filter useful information, ultimately yielding the complete target representation through the weighted feature fusion method. Wen et al. [
19] proposed a novel multimodal feature fusion learning framework that captures integrated target features from different domains, which fuses features learned from the phase history and scattering domains with image features obtained from an off-the-shelf deep feature extractor for final target recognition. Zhang et al. [
20] employed a k-nearest neighbor (KNN) algorithm to transform the ASC into a local graph structure, followed by an ASC feature association module to generate multi-scale global scattering features. These scattering features were then fused with deep features through weighted integration to enhance feature diversity. Sun et al. [
21,
22,
23,
24] realized the prediction of scattering points of ships, airplanes, and other targets based on deep networks for the first time. They further employed different loss functions to jointly constrain scattering information prediction and deep feature extraction, ultimately enabling intelligent scattering feature extraction and fusion. Feng et al. [
25] designed the ASC parameter estimation network and obtained a more complete feature representation by fusing multi-level deep scattering features with deep learning features.
These fusion methods undoubtedly enhance the representation and discrimination of features, but they also suffer from the following intractable problems:
- (1)
The networks utilize the scattering feature insufficiently. Currently, the exploitation of scattering center features mainly relies on the spatial proximity of local scattering points, and techniques such as clustering, point cloud construction, or graph structure are used to extract scattering information. These methods are still insufficient to reveal deep intrinsic correlations among scattering points. The scattering centers of the target are closely related to the local structure of the target, and their overall distribution reflects the global geometry of the target. Therefore, it is crucial to construct correlations among scattering points relying on the visual geometry of the target.
- (2)
Simple feature fusion strategies result in poor feature discrimination. Existing fusion frameworks assume that a priori scattering center features and deep image features are either independent or complementary, and they integrate scattering knowledge through manually assigned weights to obtain discriminative representations. Once the target background environment or input data distribution changes, the original weights may no longer be applicable, leading to the decrease in the discriminability of the fused features.
These two factors create performance bottlenecks for existing methods.
To solve the above problems, the multi-level structured scattering feature fusion network (MSSFF-Net) is proposed in this paper. The graph is the effective tool for modeling the nonlinear representation of scattering point features. Thus, in this paper, the graph nodes represent the features of each local scattering point, while the edges represent the correlations between the individual scattering point features. Moreover, the target scattering structure matching the local and global structure of the target is constructed to mine the deep structure scattering information. On this basis, the information entropy between the feature and the target category is utilized as the weight, and the discriminative information in the feature is fused to enhance the representation ability of the feature. Moreover, a cosine space classifier is proposed to enhance feature separability by projecting features onto a spherical manifold, while simultaneously establishing correlations between features and azimuthal angles to improve feature robustness. The details of the work are as follows:
- (1)
For target scattering information mining, the adaptive k-nearest neighbor method is used to construct the target scattering structure model, firstly. Such a method matches the geometrical structural properties of the target and constructs the intrinsic association among the local scattering features of the target. Subsequently, the scattering association pyramid network is designed to mine the scattering information of the target layer by layer to obtain the complete scattering information.
- (2)
In the feature fusion stage, the information entropy is used as the theoretical basis to quantify the target discrimination information in the deep scattering domain features and deep image features. The measured results are employed as fusion weights to adaptively fuse the target discriminative information in various features.
- (3)
A cosine space classifier is proposed to transfer the features from the mutually coupled and entangled Euclidean space to the divisible manifold space by simple feature projection. The robustness of the features to azimuth variations is improved, which enhances the generalization ability of the features.
The rest of this article is organized as follows.
Section 2 describes the principles of attribute scattering center.
Section 3 describes the proposed method in detail. The experimental results and discussion are reported in
Section 4 and
Section 5. Finally, the conclusion is drawn in
Section 6.
2. Attribute Scattering Center
In this paper, we employ ASC features and fuse them with deep features to enhance the representational capacity of the features. The ASC theory is introduced below.
The backscatter response in the high-frequency region of the target can be equated to the superposition effect of several localized phenomena, which are referred to as scattering centers. The ASC model is a more complete modeling of target knowledge and is formulated as follows:
where
denotes the backward scattering of the overall target at an azimuth angle
and the frequency
f.
p is the number of scattering centers. For the
ASC, the backscattered field is shown below.
where
A is the amplitude,
L is the size of the localized scattering structure, and
describes the frequency dependence. If the
ASC is localized,
, otherwise, the ASC is distributed,
, and
.
is the wave number, and
c is the speed of light.
indicates the azimuth angle, which takes values within [
,
], and
is the maximum imaging observation angle.
denotes the degree of deviation from the imaging azimuth angle of the distributed ASC.
(
,
) is the projection of the the ASC position on the imaging plane, and
,
expresses the position parameter of the ASC in the range and azimuth angle, respectively.
Thus, the entire ASC model of the target can be represented by a parameter set , where each element (, , , , , , ), . Thus, the ASC features of the target are expressed as the set of feature points.
3. Materials and Methods
3.1. Overall Framework
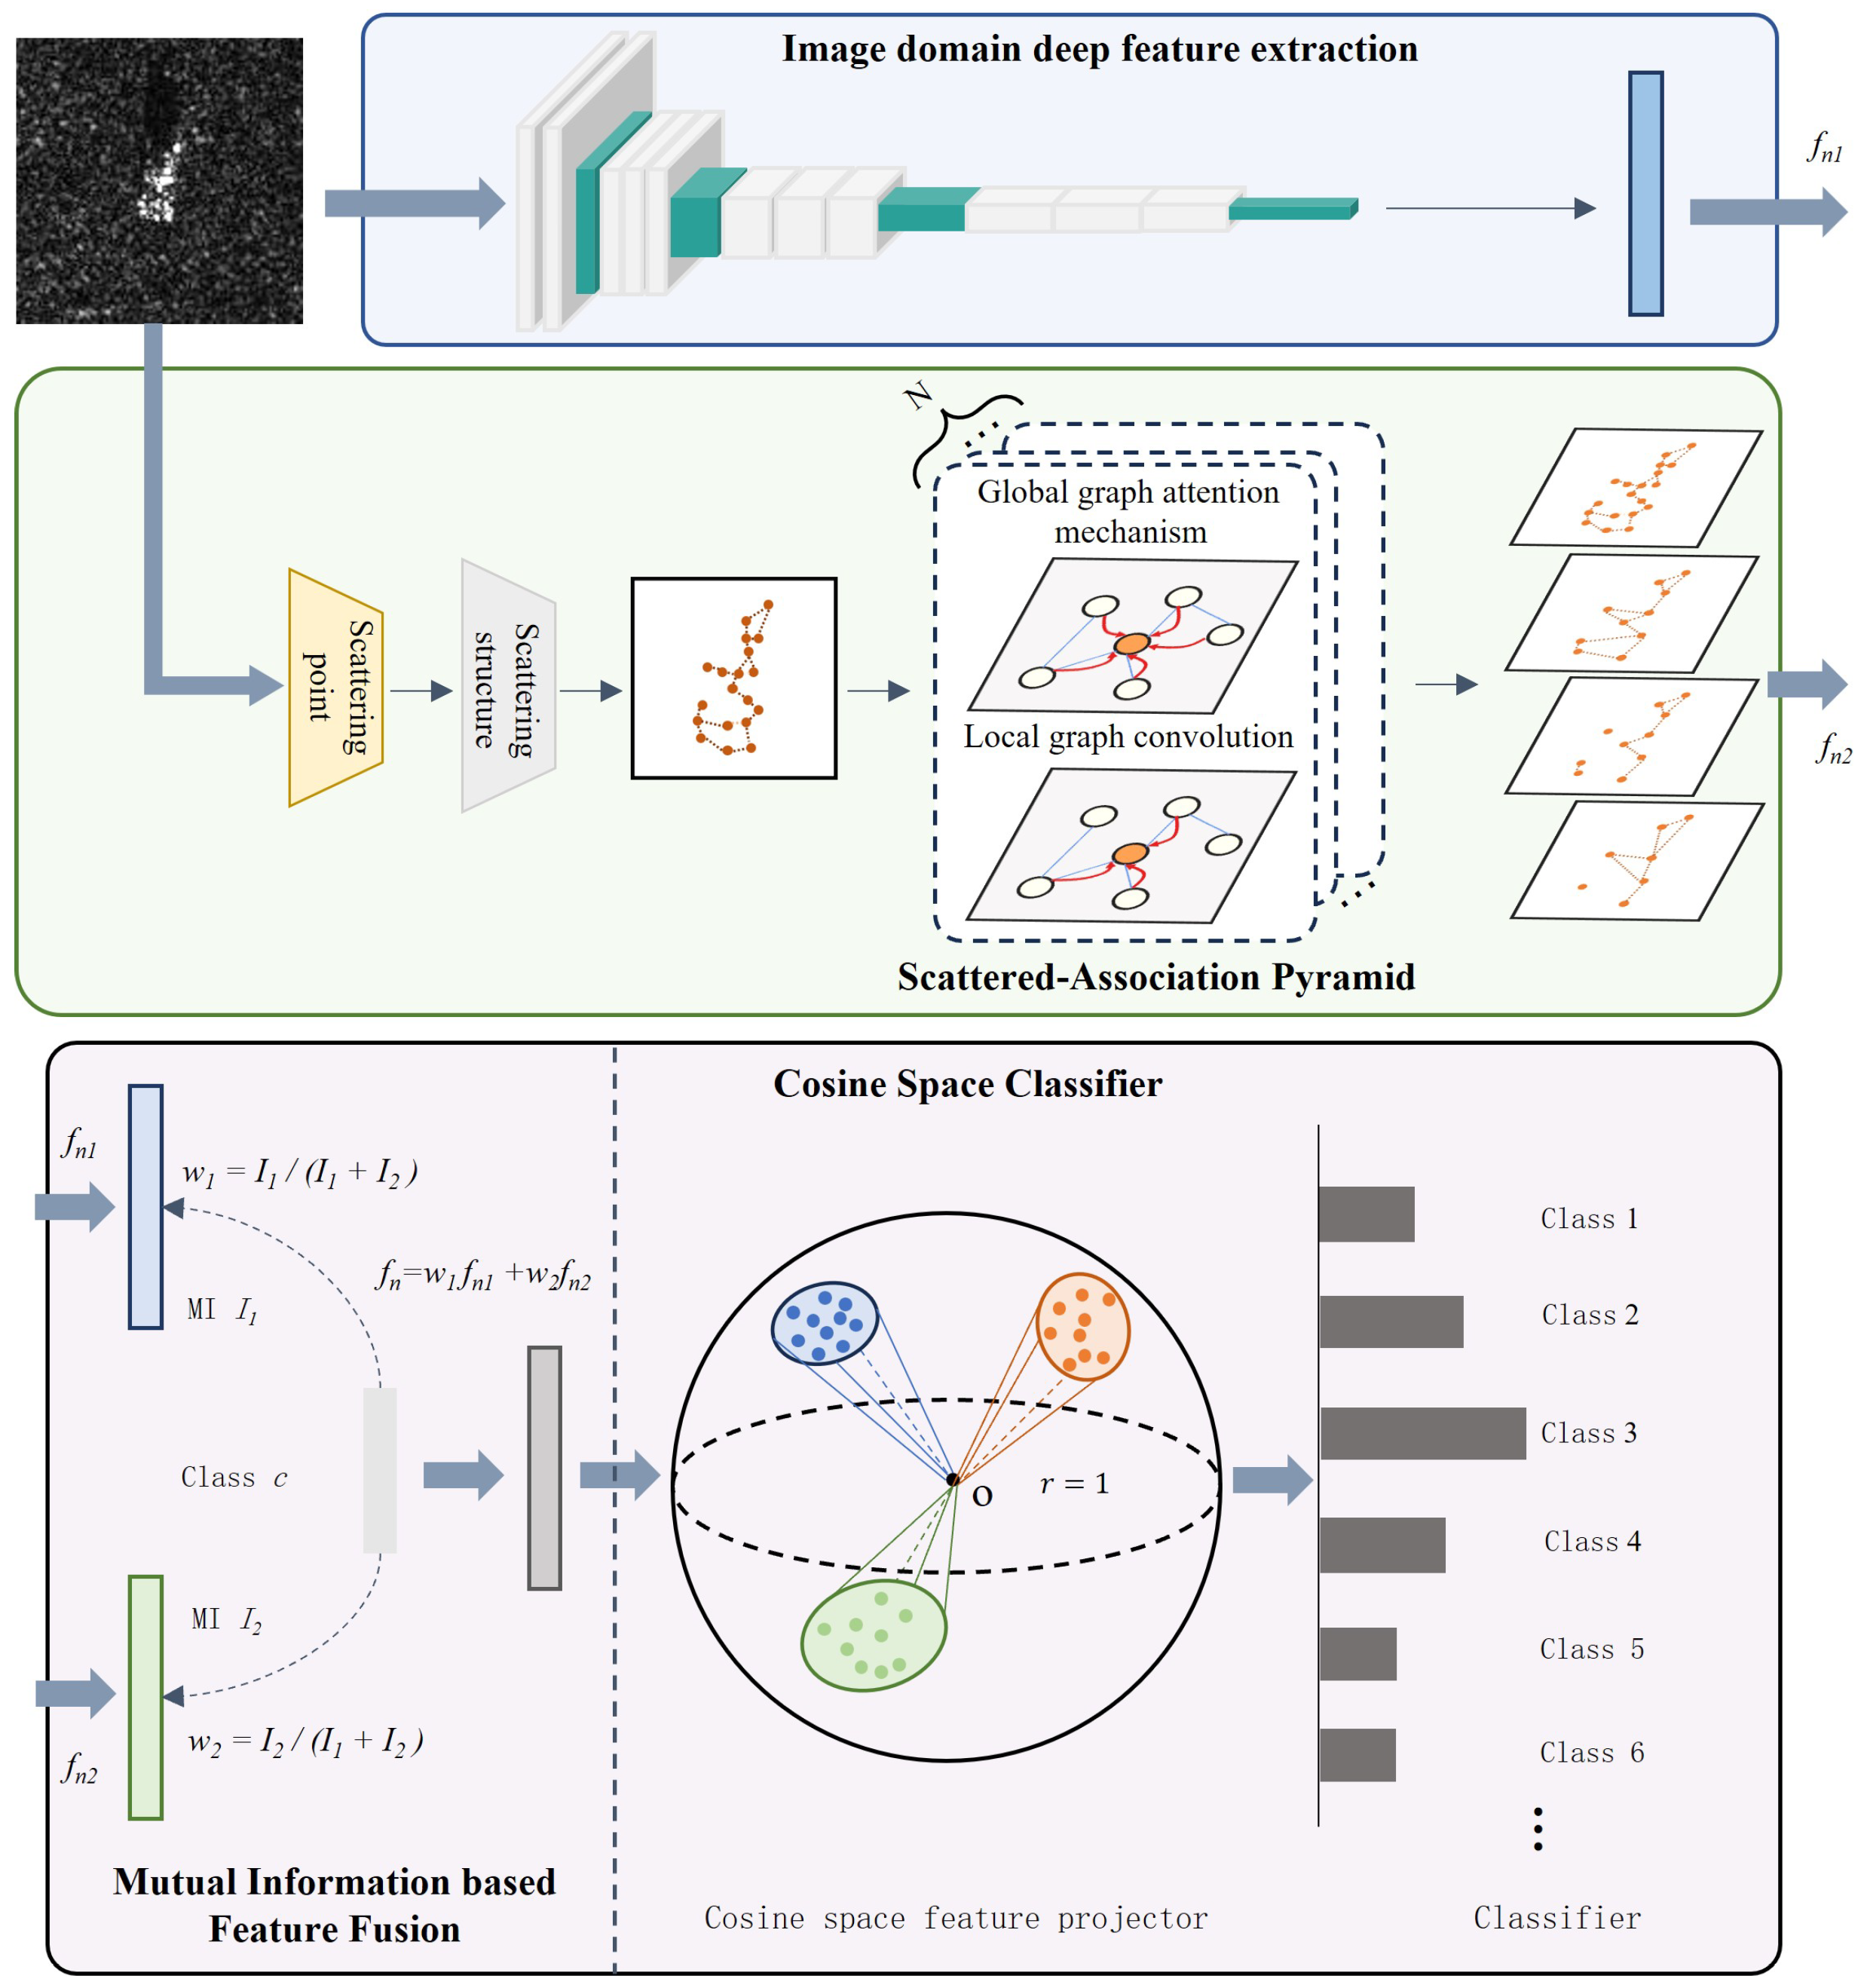
The network structure proposed in this paper is shown in
Figure 1. Specifically, the MSSFF-Net includes the following key modules: the image domain deep feature extraction (IDD-FE) module, the scattering association pyramid (SAP) module, the mutual information-based feature fusion (MI-FF) module and the cosine space classifier (CSC). By coupling the proposed modules, the feature representation capability and robustness of the model are improved.
Firstly, the proposed method constructs the target scattering structure representation by using the adaptive KNN method. On this basis, the SAP module is proposed to extract hierarchical target electromagnetic scattering information. Secondly, the MI-FF module is proposed to fuse discriminative target information. Specifically, the mutual information (MI) between features and label information is calculated in the training phase and used as weights to realize adaptive fusion between different features. In the testing phase, the average value of the mutual information weights obtained in the training phase is used as the weight to realize feature fusion. Finally, the robustness and separability of the features are enhanced by projecting the features into the spherical manifold space via CSC.
In this paper, we focus on mining and fusing the deep scattering information; thus, the classical network, i.e., AconvNet [
9], is employed to extract the deep feature from SAR images. The network details are presented in the
Table 1.
3.2. Scattering Structure Construction
The construction of the scattering structure is the key part of the proposed method, which directly affects the mining of deep scattering information by the model. In this paper, the scattering structure is constructed by graph theory, where the graph nodes represent scattering point features and the edges are correlation maps between scattering point features. Edge features are particularly important and reveal the correlation among different scattering points. Specifically, two main criteria define the edges: (i) how to measure the relationships between scattering points; and (ii) which relationships among scattering points need to be preserved.
3.2.1. Scattering Point Similarity Measure
We assume that there are two nodes
u and
v, with corresponding ground scattering features
and
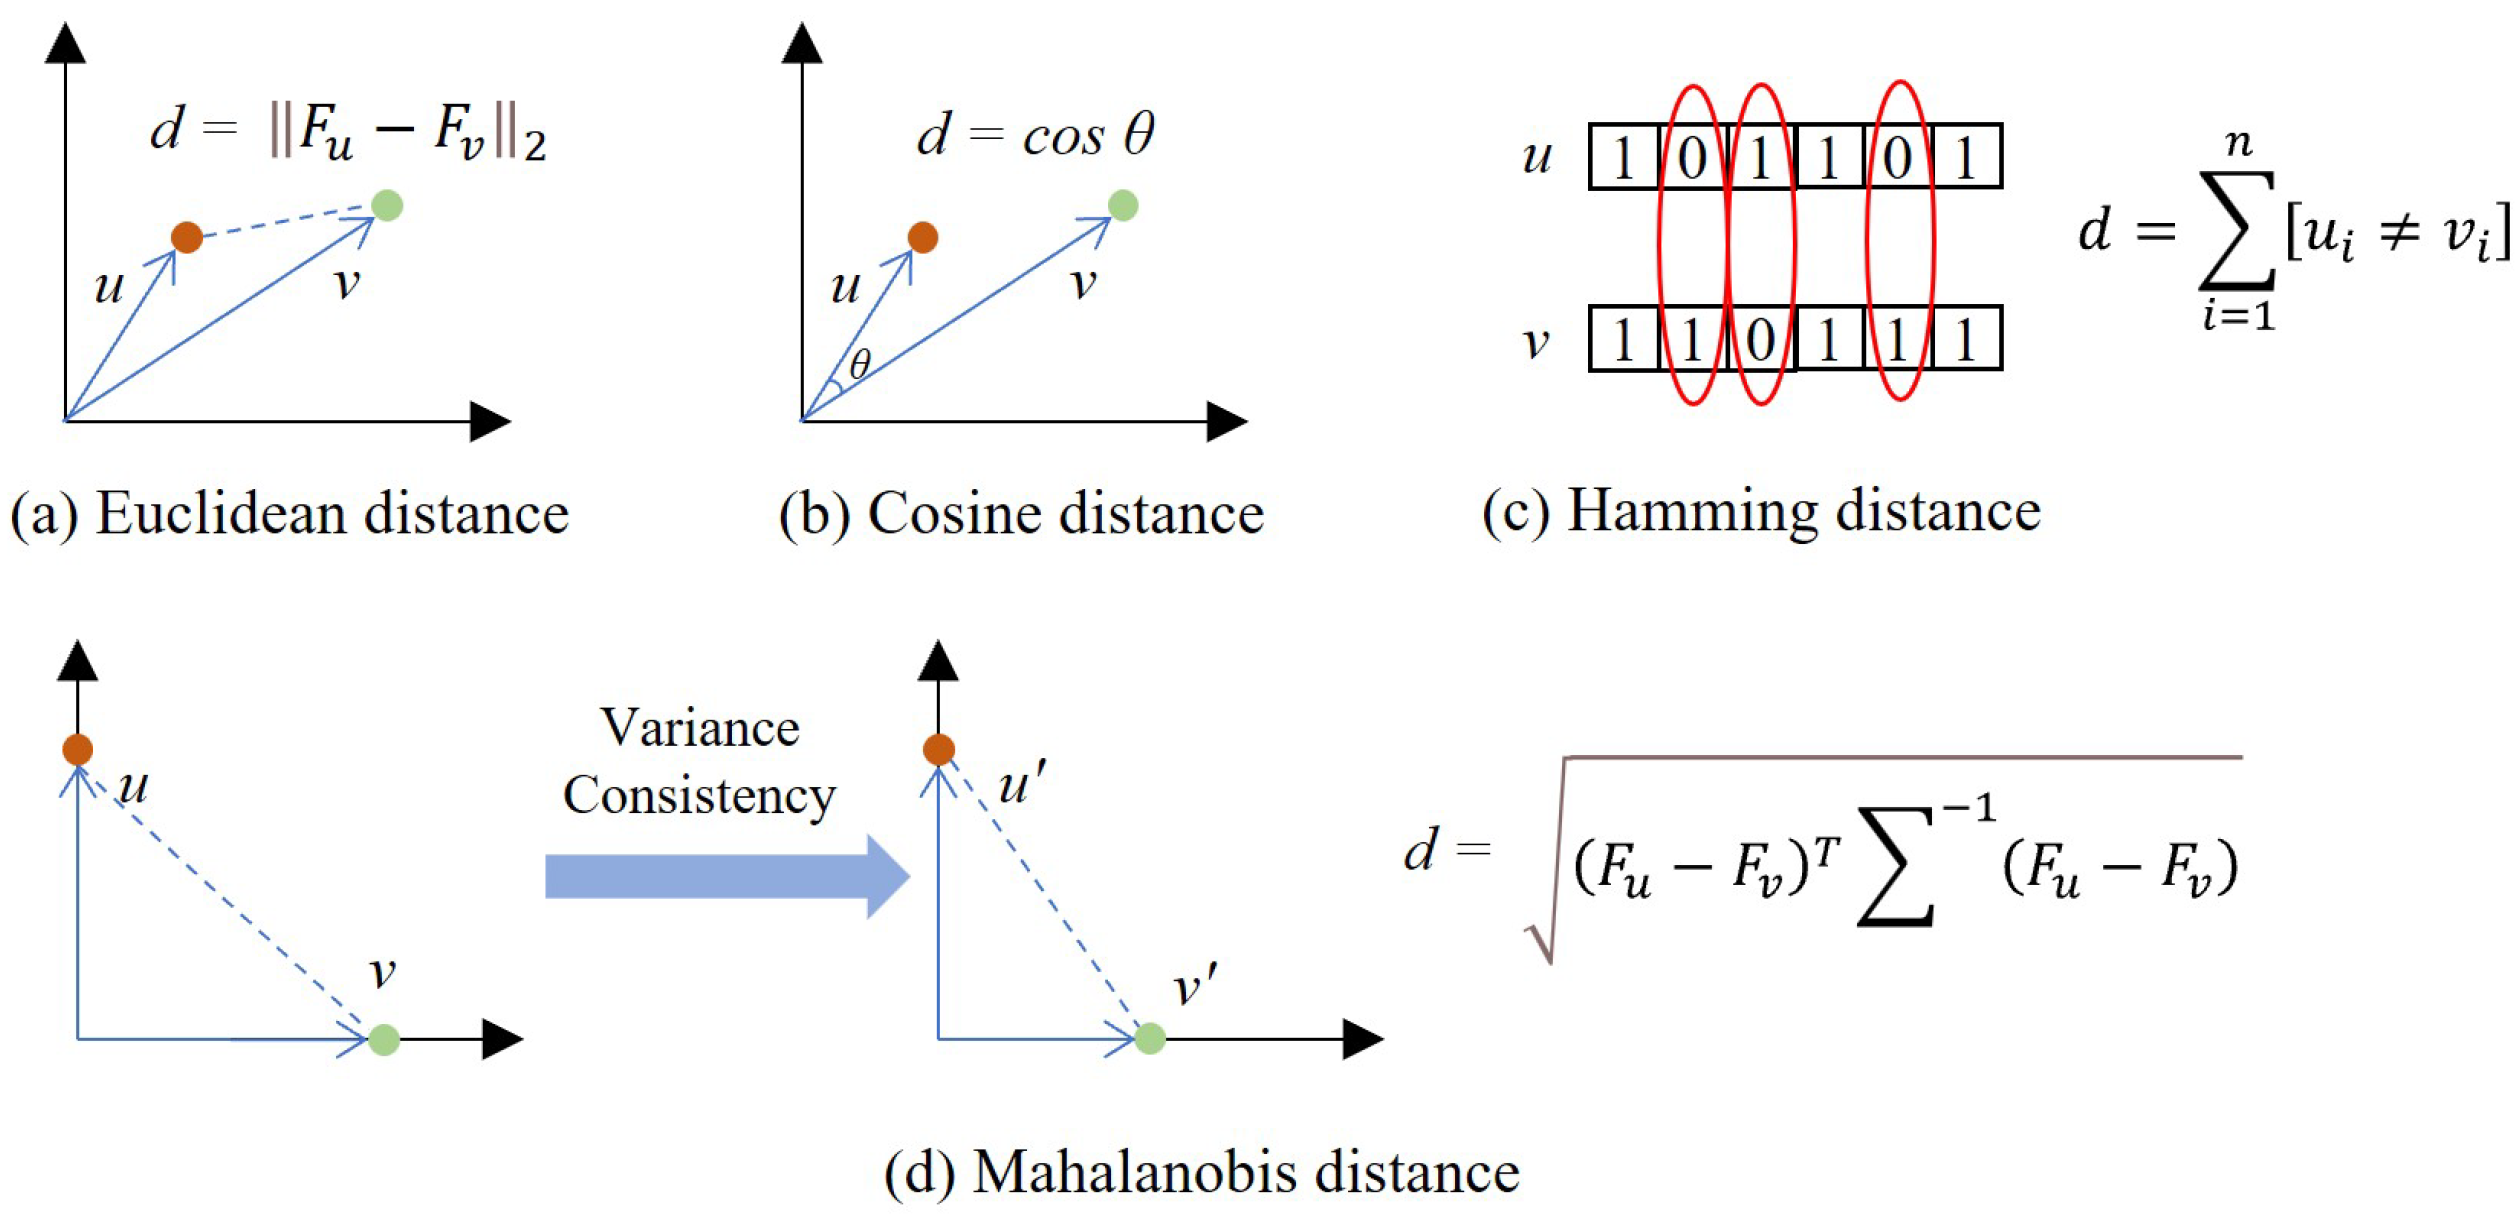
, respectively. Here, the distance between them is defined as the relationship. The commonly used metrics include euclidean distance, cosine distance, hamming distance, and mahalanobis distance. Their computational principles are shown in
Figure 2.
Euclidean distance is the spatial distance metric that preserves the properties of neighboring nodes nearer to the center node, which is strongly related to the actual physical structure of the target and is also consistent with human visual perception. Therefore, in this paper, the correlations between scattering points are measured by Euclidean distances that match the constructed scattering structure to the visual geometry.
3.2.2. Scattering Point Correlation Construction
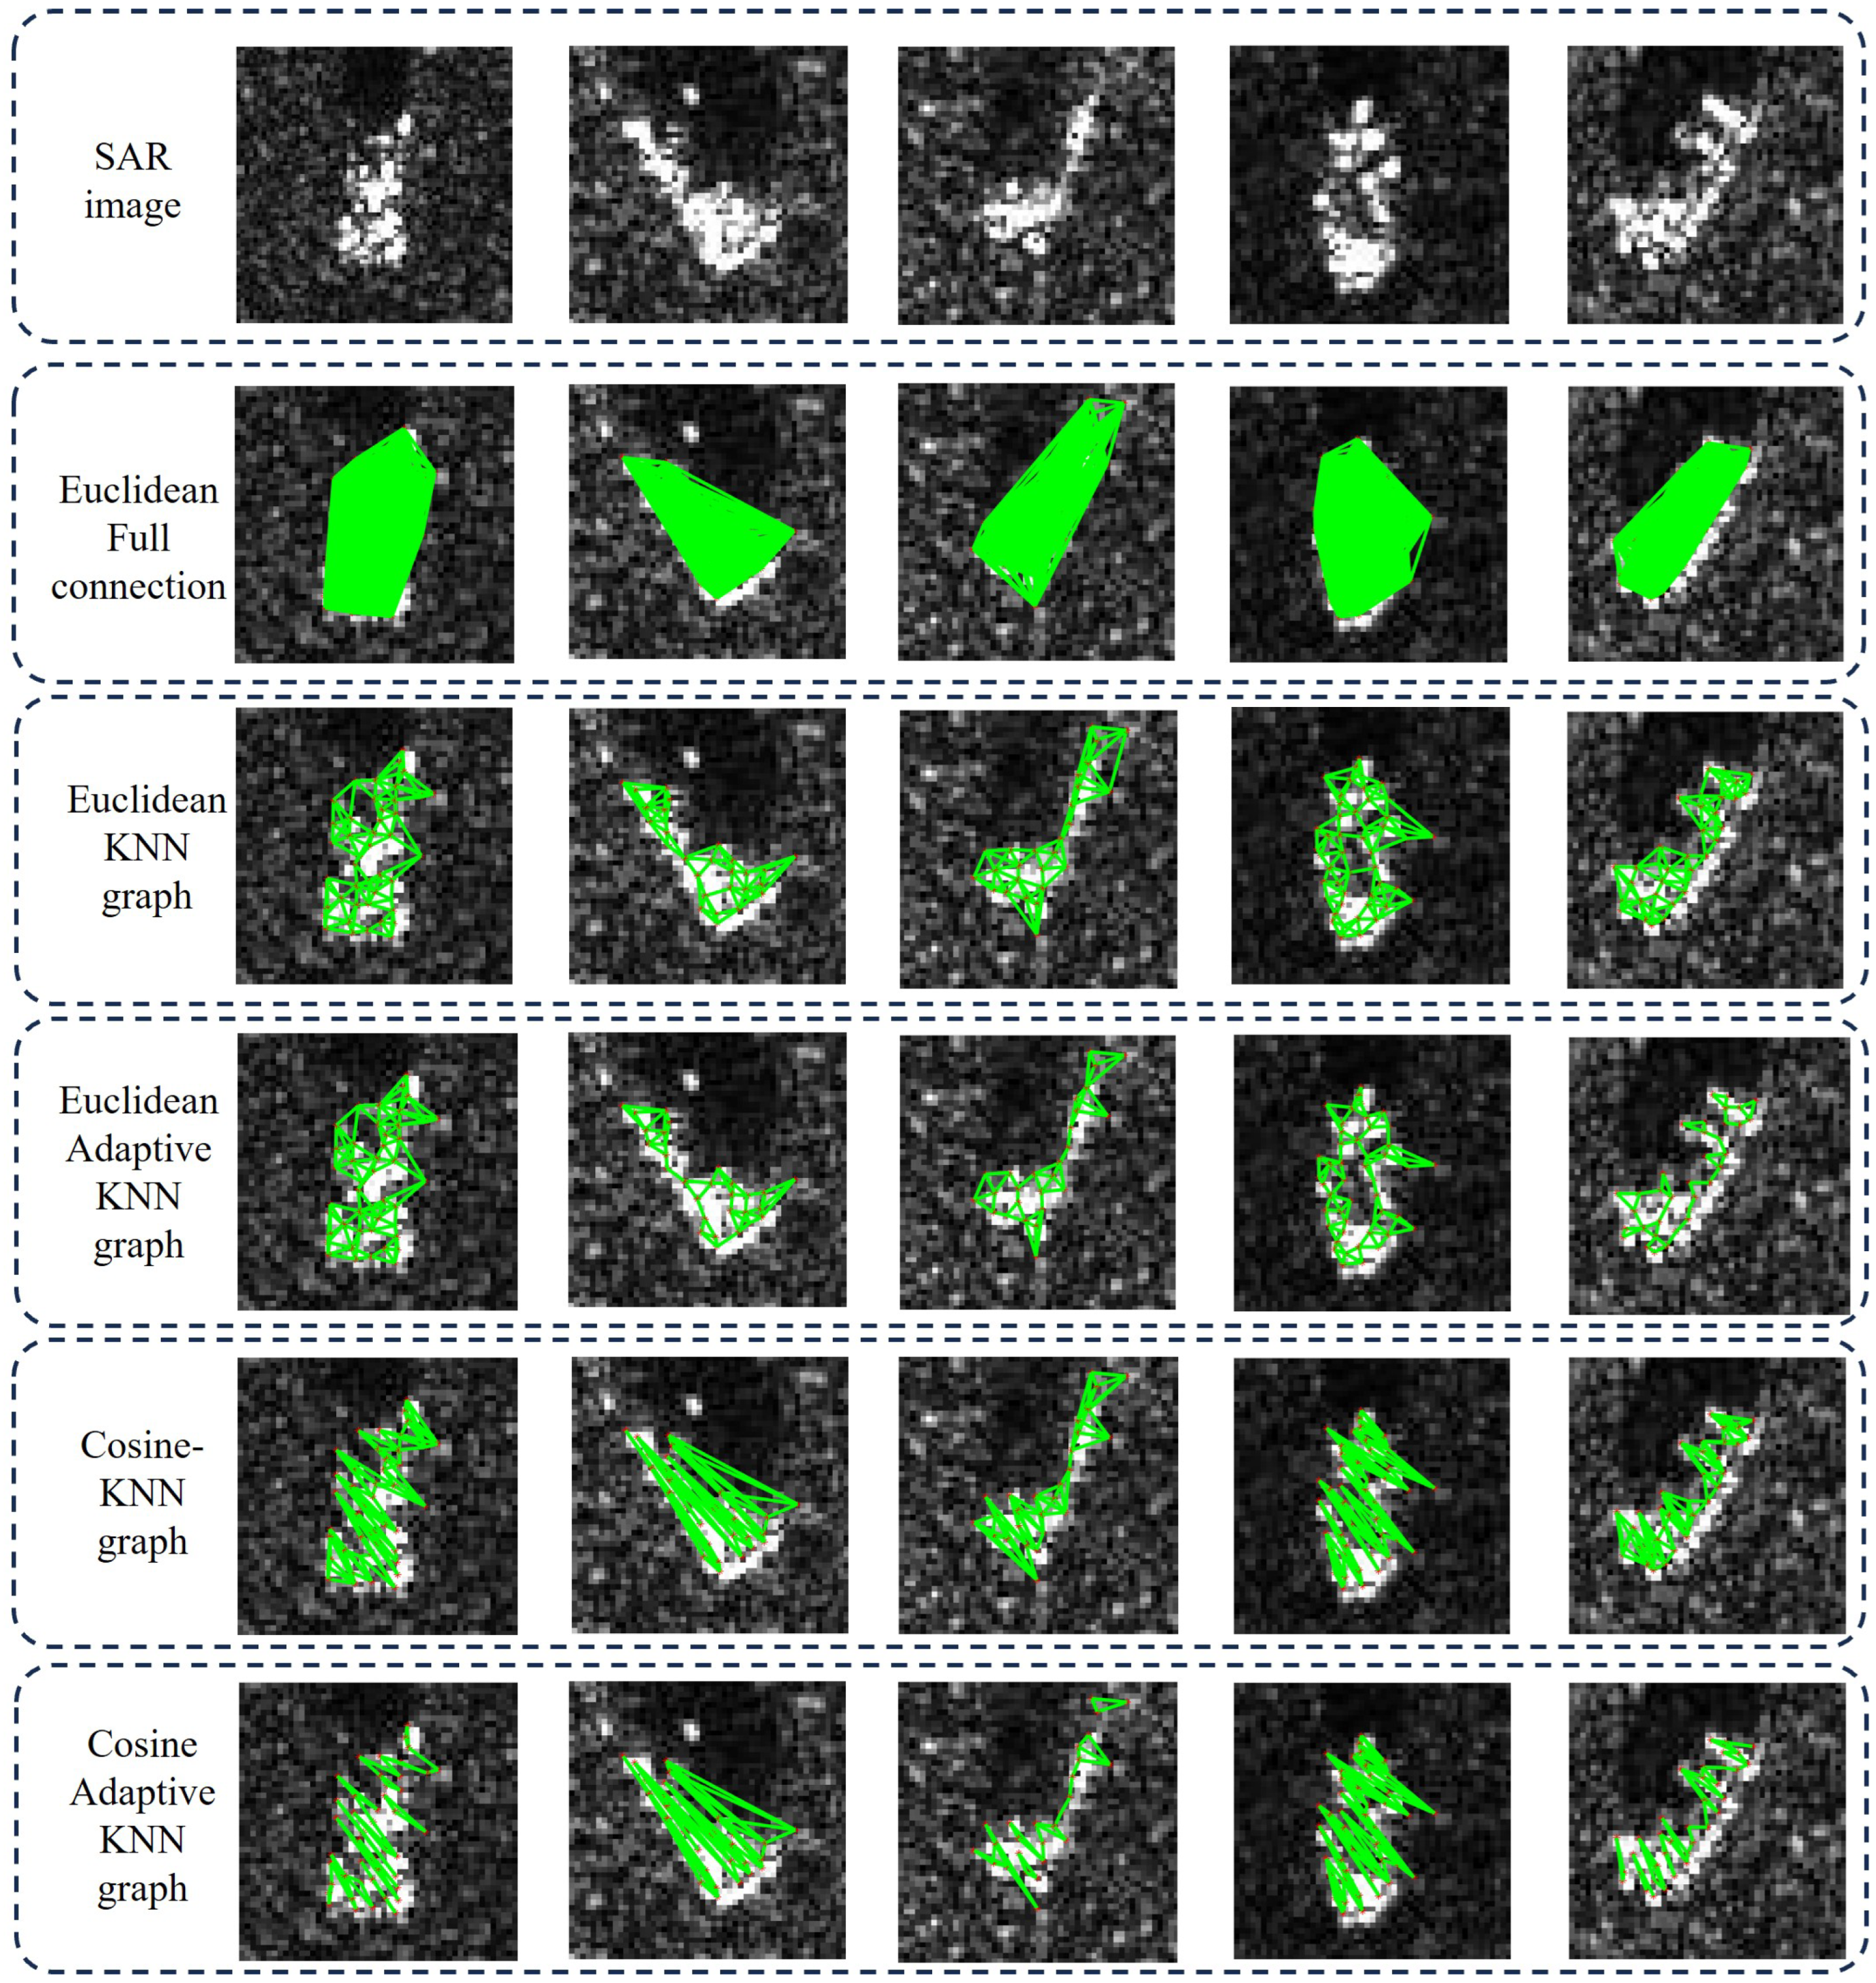
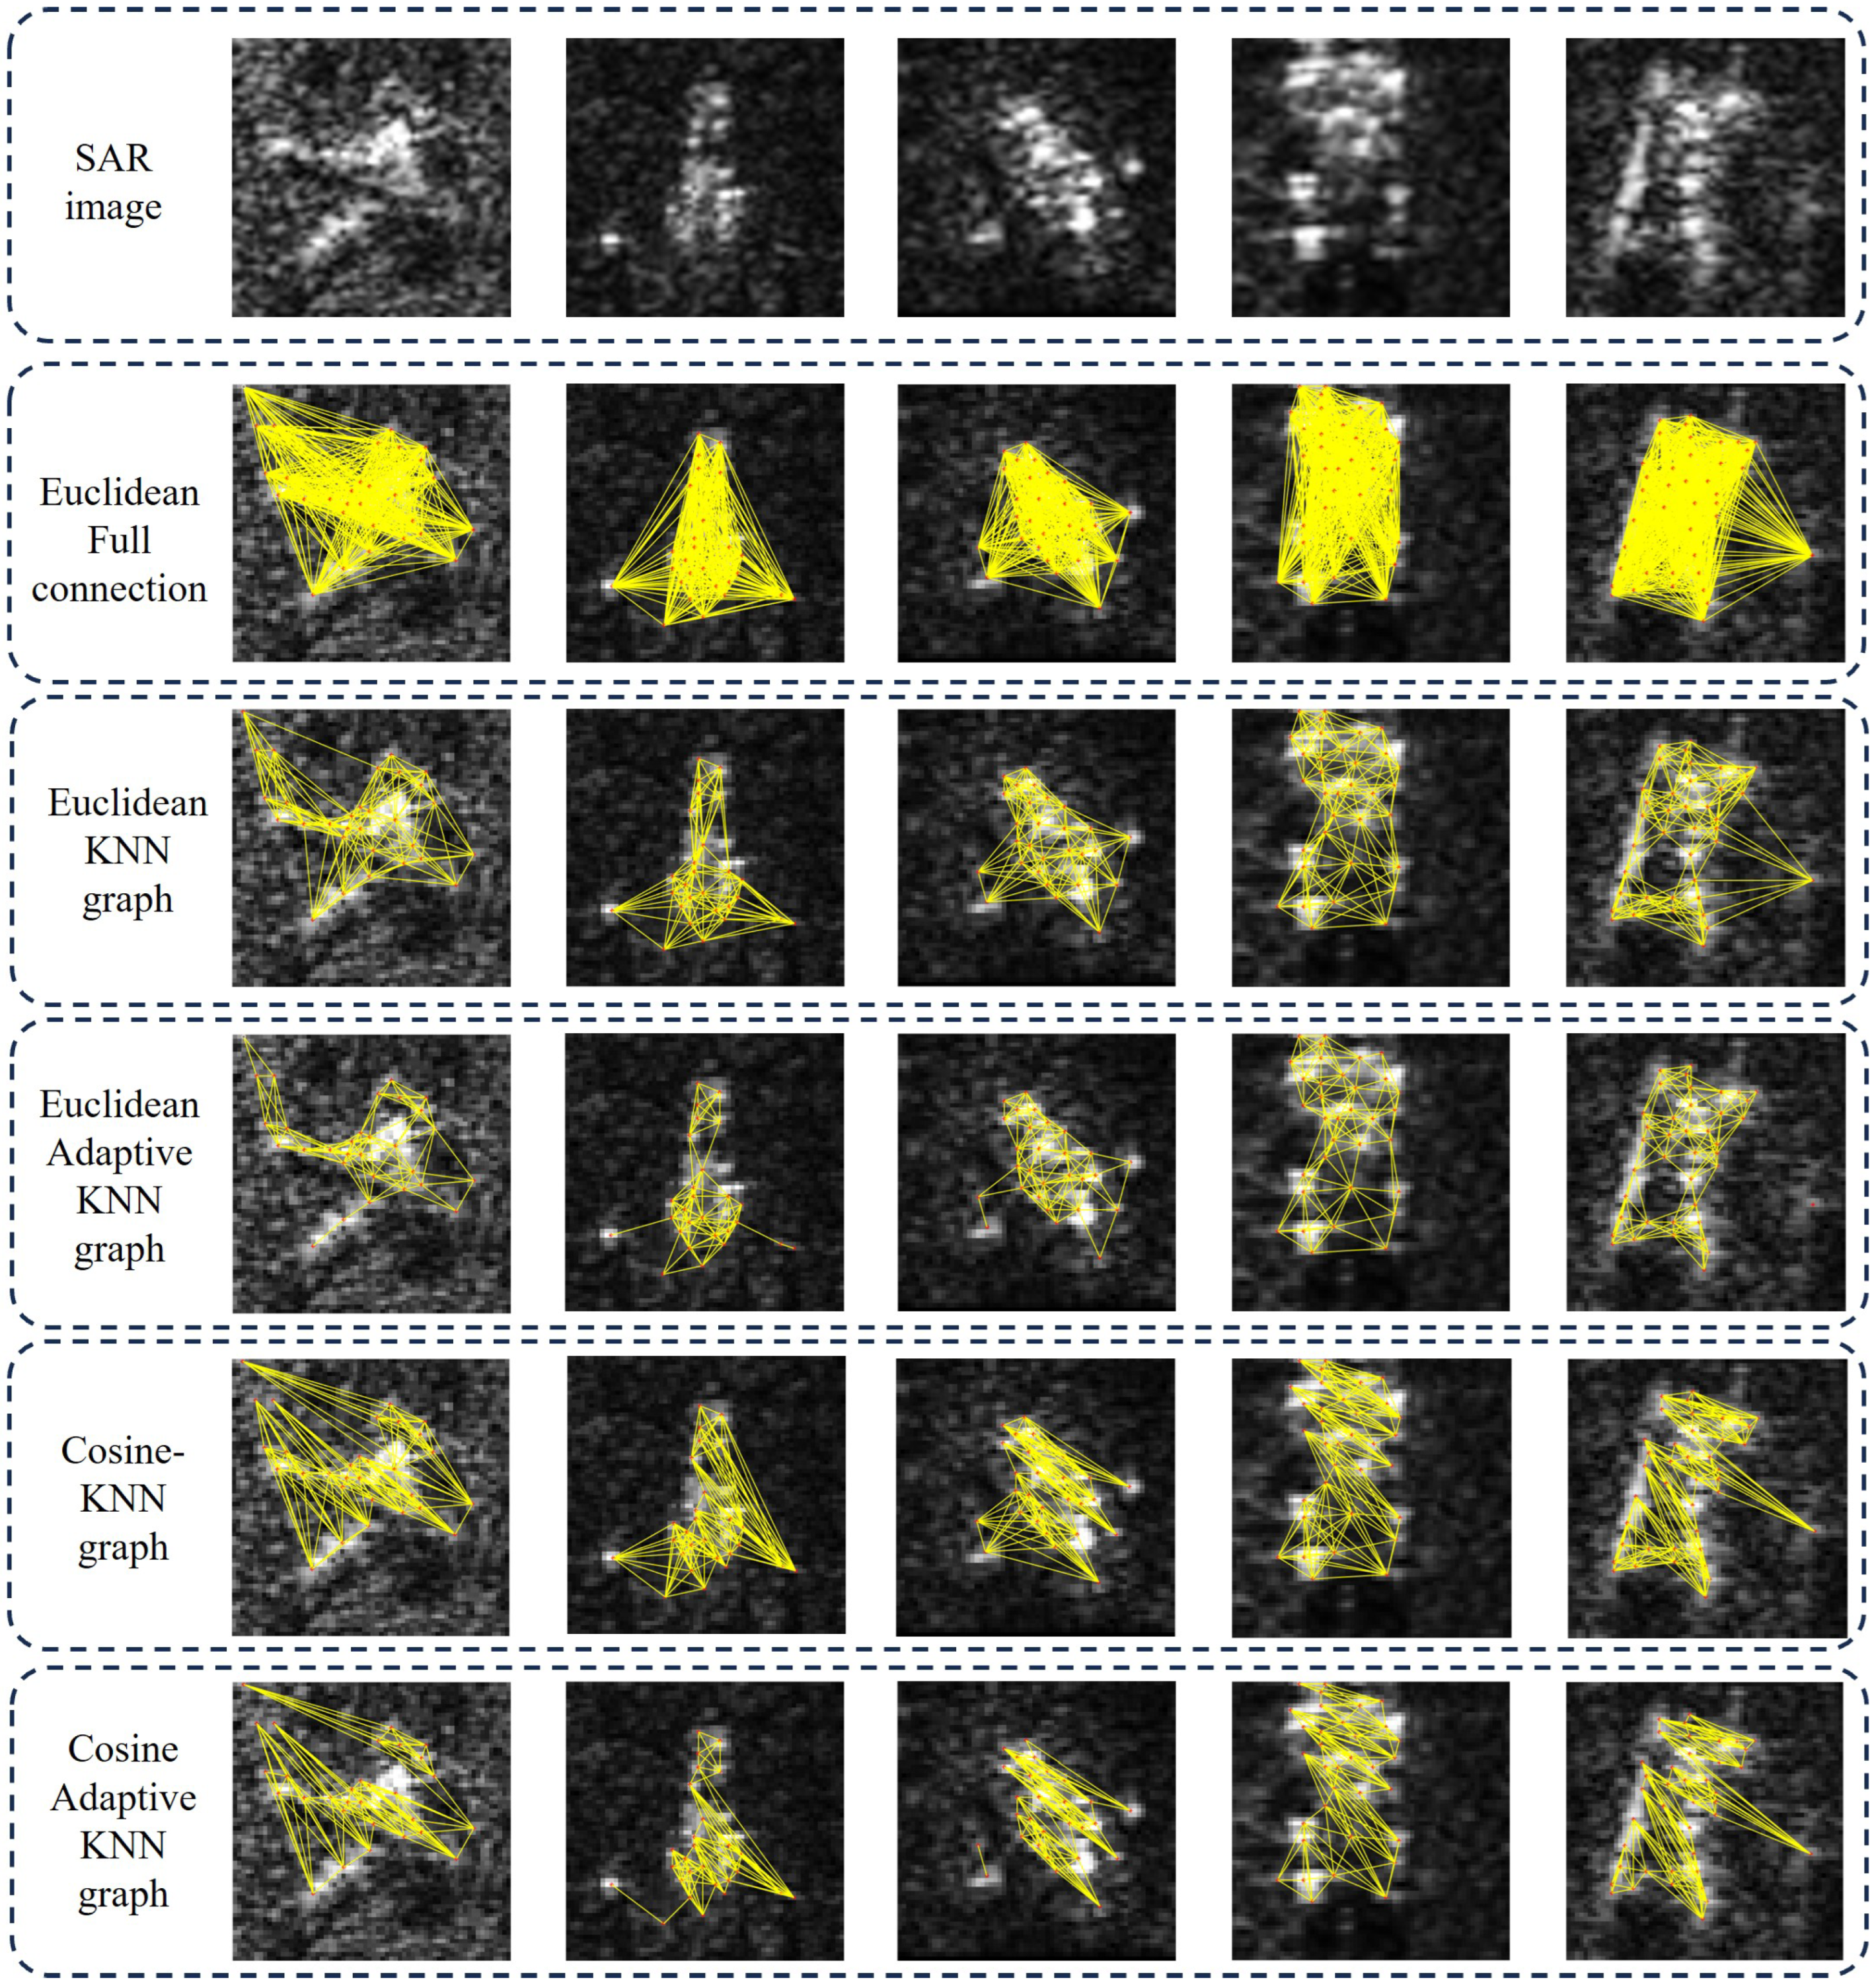
In this paper, the adaptive KNN approach [
26,
27] is implemented to represent the physical information of the target scattering structure, and the modeling results are analyzed. Then, the computational procedure of the adaptive KNN method is described:
Step 1: Select the maximum and minimum values of K, , and construct KNN graph with as initial value.
Step 2: Calculate the indegree of each vertex i in the KNN graph.
Step 3: Calculate the final number of neighbors
K of node
i, where
Through the above computational process, the appropriate number of neighbors is matched for each node to generate the representation that is more compatible with the target geometry.
3.3. Scattered Association Pyramid Network
Subsequently, the SAP module is proposed to mine deep target scattering information, as shown in
Figure 1. The input to the SAP module is the target scattering structure and the output is the target deep scattering feature. Specifically, SAP is realized through the Stacked Scattered Information Interaction (SII) network, which is implemented by the Graph AttenTion mechanism (GAT) [
28], Graph Convolutional Network (GCN) [
29], and graph coarsening (GC). The GAT breaks the limitation of the input scattering structure to realize the aggregation of global node information. The GCN aggregates information from neighboring scattering points in the local structure based on the original scattering structure. Moreover, we coarsen the initial scattering structure to capture multi-level, multi-scale target scattering representations. The network structure of the SII module is described in detail.
The SII module is the proprietary network for processing scattering structure data that capture more comprehensive target knowledge from global and local structures, as shown in
Figure 3. The computational principles of the GAT, GCN, and GC will be described in detail.
The GAT learns the attention weight
of each node to its neighboring nodes to measure the importance of neighboring node
j to node
i. Firstly, feature mapping of node features
is performed by the learnable shared weight matrix
W:
. Then, the correlation between node
i and its neighbor
j is calculated, denoted as
.
where
denotes the feature splicing function, and
can map the spliced features to a number, which is the similarity value between two nodes. Subsequently,
is normalized by the softmax function to obtain the correlation coefficients.
Finally, the features of the neighbors are aggregated by weight and the node representation is updated:
where
is the activation function, such as
.
The GCN learns the new node representations by fusing information from neighboring nodes, which is more dependent on the target scattering structure. Obviously, the GCN is fundamentally different from the GAT in that the former focuses on capturing local information, while the latter is more concerned with global information aggregation and feature updating. They complement each other to achieve the more comprehensive interaction and update of scattering information. The kernel operation of the GCN is realized by the following equation:
where
is the node feature in
l layer,
is the learnable weight matrix for layer
l, and
is the normalized adjacency matrix. The adjacency matrix
is the highly important a priori input that records information about the relationship among all scattering points.
Then, the multi-scale target scattering information is obtained by the GC. The coarse-grained structural description of the target is achieved by dividing the graph into
k non-intersecting substructures depending on the topology of the graph. Specifically, Adaptive Structure-Aware Pooling (ASAPooling) [
30] is used to achieve this objective. ASAPooling determines which nodes can be aggregated by comparing their structural characteristics (e.g., adjacencies, node characteristics) and aggregates similar nodes into the same supernode to maximize the preservation of local structure. The calculation process is shown in
Figure 4. In general, the core idea is pooling through adaptive clustering among nodes, which is limited by two aspects: (i) preserving the local structure of the graph, i.e., dynamically adjusting clustering by node features and topological information; and (ii) preserving valid node information, i.e., selectively aggregating similar nodes by learning their importance weights.
ASAPooling is an effective graph coarsening method that combines the node features and structural information of the graph to maximize the preservation of important local scattering structural properties during the dimensionality reduction process.
3.4. Mutual Information-Based Feature Fusion
After obtaining the image domain deep features and target scattering information, it is necessary to fuse them to achieve a more complete target representation. To better integrate and fully utilize their advantages, the adaptive weight feature fusion strategy based on information entropy theory is proposed, i.e., the MI-FF method.
MI is a commonly used information measurement method that indicates the degree of correlation or the amount of information shared between two random variables. The proposed feature fusion method utilizes MI to measure the correlation of each feature with the category and takes the results of the metric as weights to achieve feature fusion.
Assume that the image domain features and scattering features are
and
, respectively, and the category label is
c. It can be defined as follows:
where
is the joint probability distribution of
and
c.
and
are the marginal distribution probabilities of them. The larger the MI, the stronger the discriminative information about the category in feature
. The feature weights
are calculated:
Then, the discriminative feature representation of the target is obtained as follows:
Notably, the method obtains more discriminative target features on the one hand, and the weight interpretability is enhanced on the other hand. Therefore, the subjectivity and fixity associated with manual weight settings are avoided in the feature fusion process.
3.5. Cosine Space Classifier
The above feature extraction and fusion process implements the projection of the SAR image to feature spaces (from the image space to the feature space). Subsequently, the mapping from features to categories needs to be implemented with the help of the classifier. In an ideal feature space, different classes of features have significant discrimination, which can simplify the classification task. Therefore, the selection of the reasonable feature space is an important prerequisite for achieving precise classification.
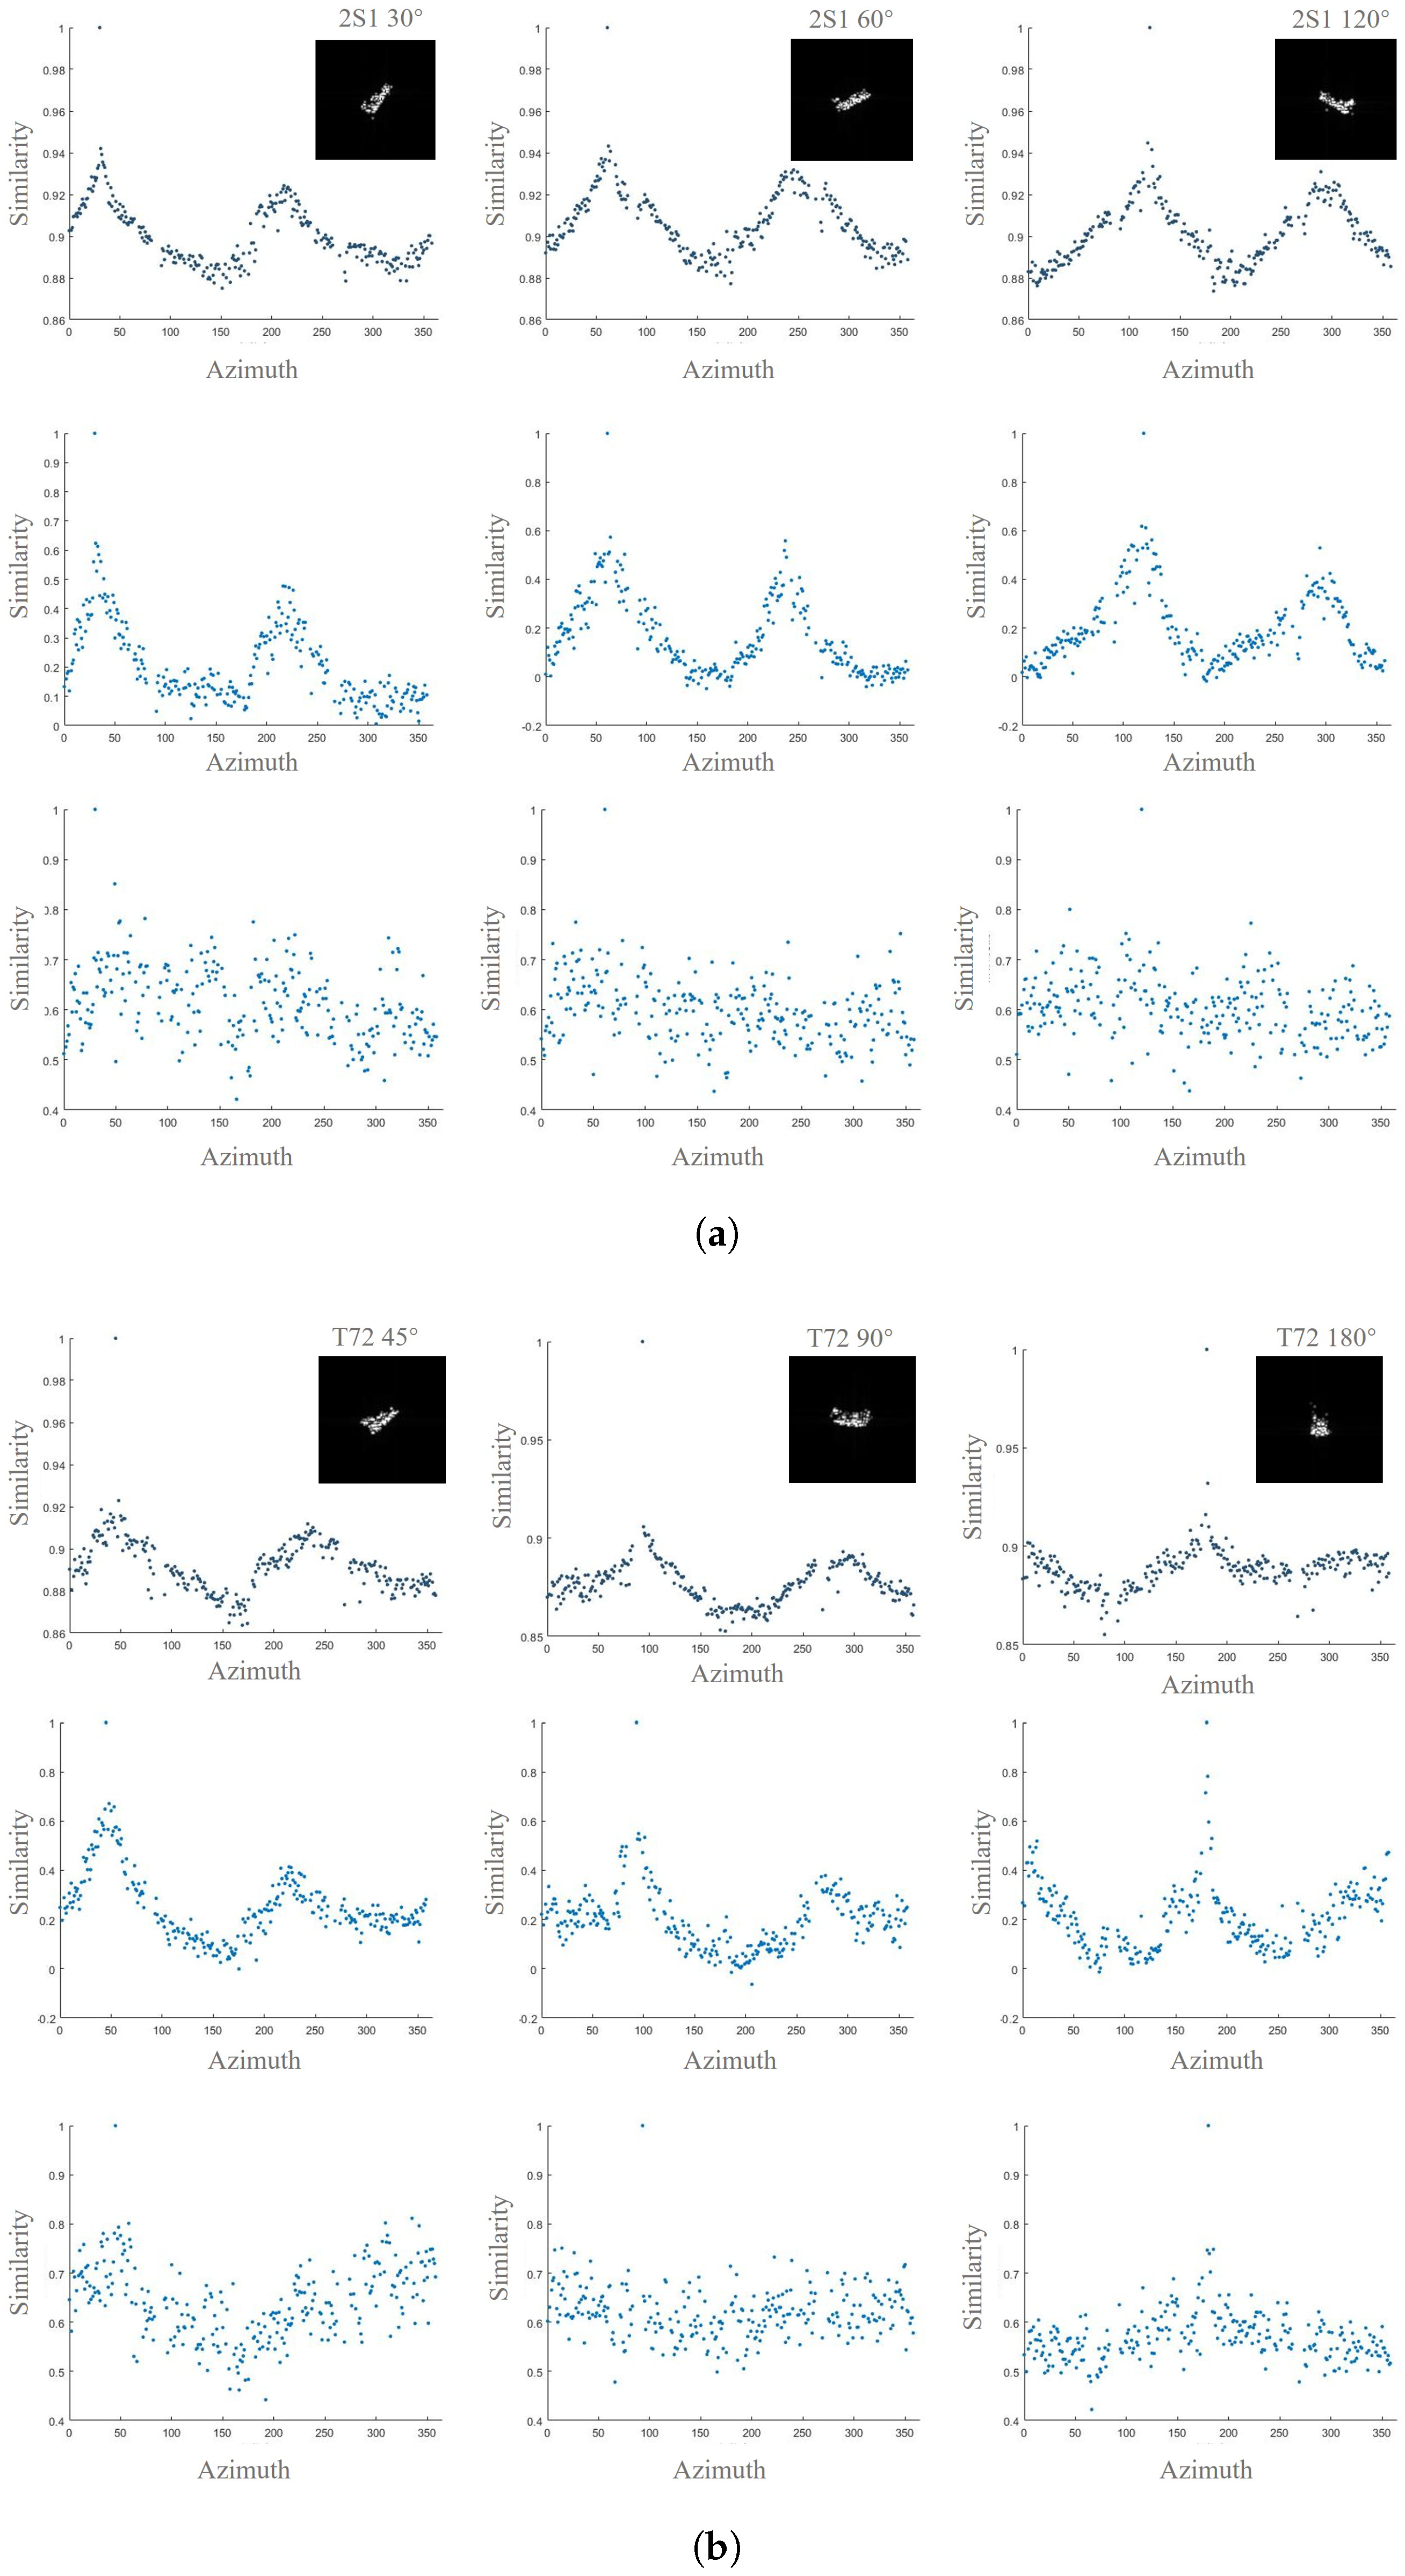
SAR images have the high-dimensional representation in Euclidean space, but their actual effective information tends to be concentrated in low-dimensional manifolds because of the physical limitations of the imaging process and the geometrical characteristics of the target. Therefore, mapping the features to the manifold space contributes to obtaining the essential attributes of the target. The Structure Similarity Index Measure (SSIM) is an image similarity measure based on the perception of the human visual system, which evaluates the overall image similarity by calculating the structural, luminance, and contrast similarity between two images in a localized area. Such a method of comparing image structures, intensities, and variations based on local regions is actually a similarity comparison of the scattering characteristics of different SAR images, which is highly consistent with the objective laws of the scattering characteristics of SAR images and can clearly describe the data structure of the manifold space.
Figure 5 shows the similarity results of the original SAR image space versus the feature space of the SAR image. Specifically, we measure the similarity between a SAR image or feature and other SAR images or features at ranging from 0° to 360°. It is found that the projection of the features into the cosine space is strongly consistent with the manifolds of the SAR images. Obviously, the tendency of the target scattering properties to vary with azimuth is reflected in this manifold space, enhancing the ability of the feature to characterize azimuthal information. Thus, the separability of the features in cosine space is enhanced. Additionally, the similarities in features within the Euclidean space exhibit a messy characteristic, indicating that it is difficult to highlight the critical scattering information and azimuth information of the target within the Euclidean space. These comparative results further emphasize the significance of the cosine space classifier.
Therefore, the cosine space classifier is proposed to project the feature space into the spherical manifold space to preserve the critical information of the features. The calculation process is shown below:
where
c is the target category,
C is the total number of categories,
is the angle of the feature,
is the feature, and
is the learnable weights.
4. Results
All experiments are conducted on a personal computer equipped with an Intel i9-11900K CPU, an NVIDIA RTX 4090 GPU, and 24 GB of RAM. The implementation is carried out in a Python 3.9 environment using the open-source machine learning framework PyTorch 2.01. Additionally, CUDA 11.7 is employed to leverage GPU acceleration for enhanced computational efficiency.
4.1. Dataset Description
In this paper, experimental validations are carried out on the Moving and Stationary Target Acquisition and Recognition (MSTAR) [
31] and Full Aspect Stationary Targets-Vehicle (FAST-Vehicle) [
32] datasets.
4.1.1. MSTAR
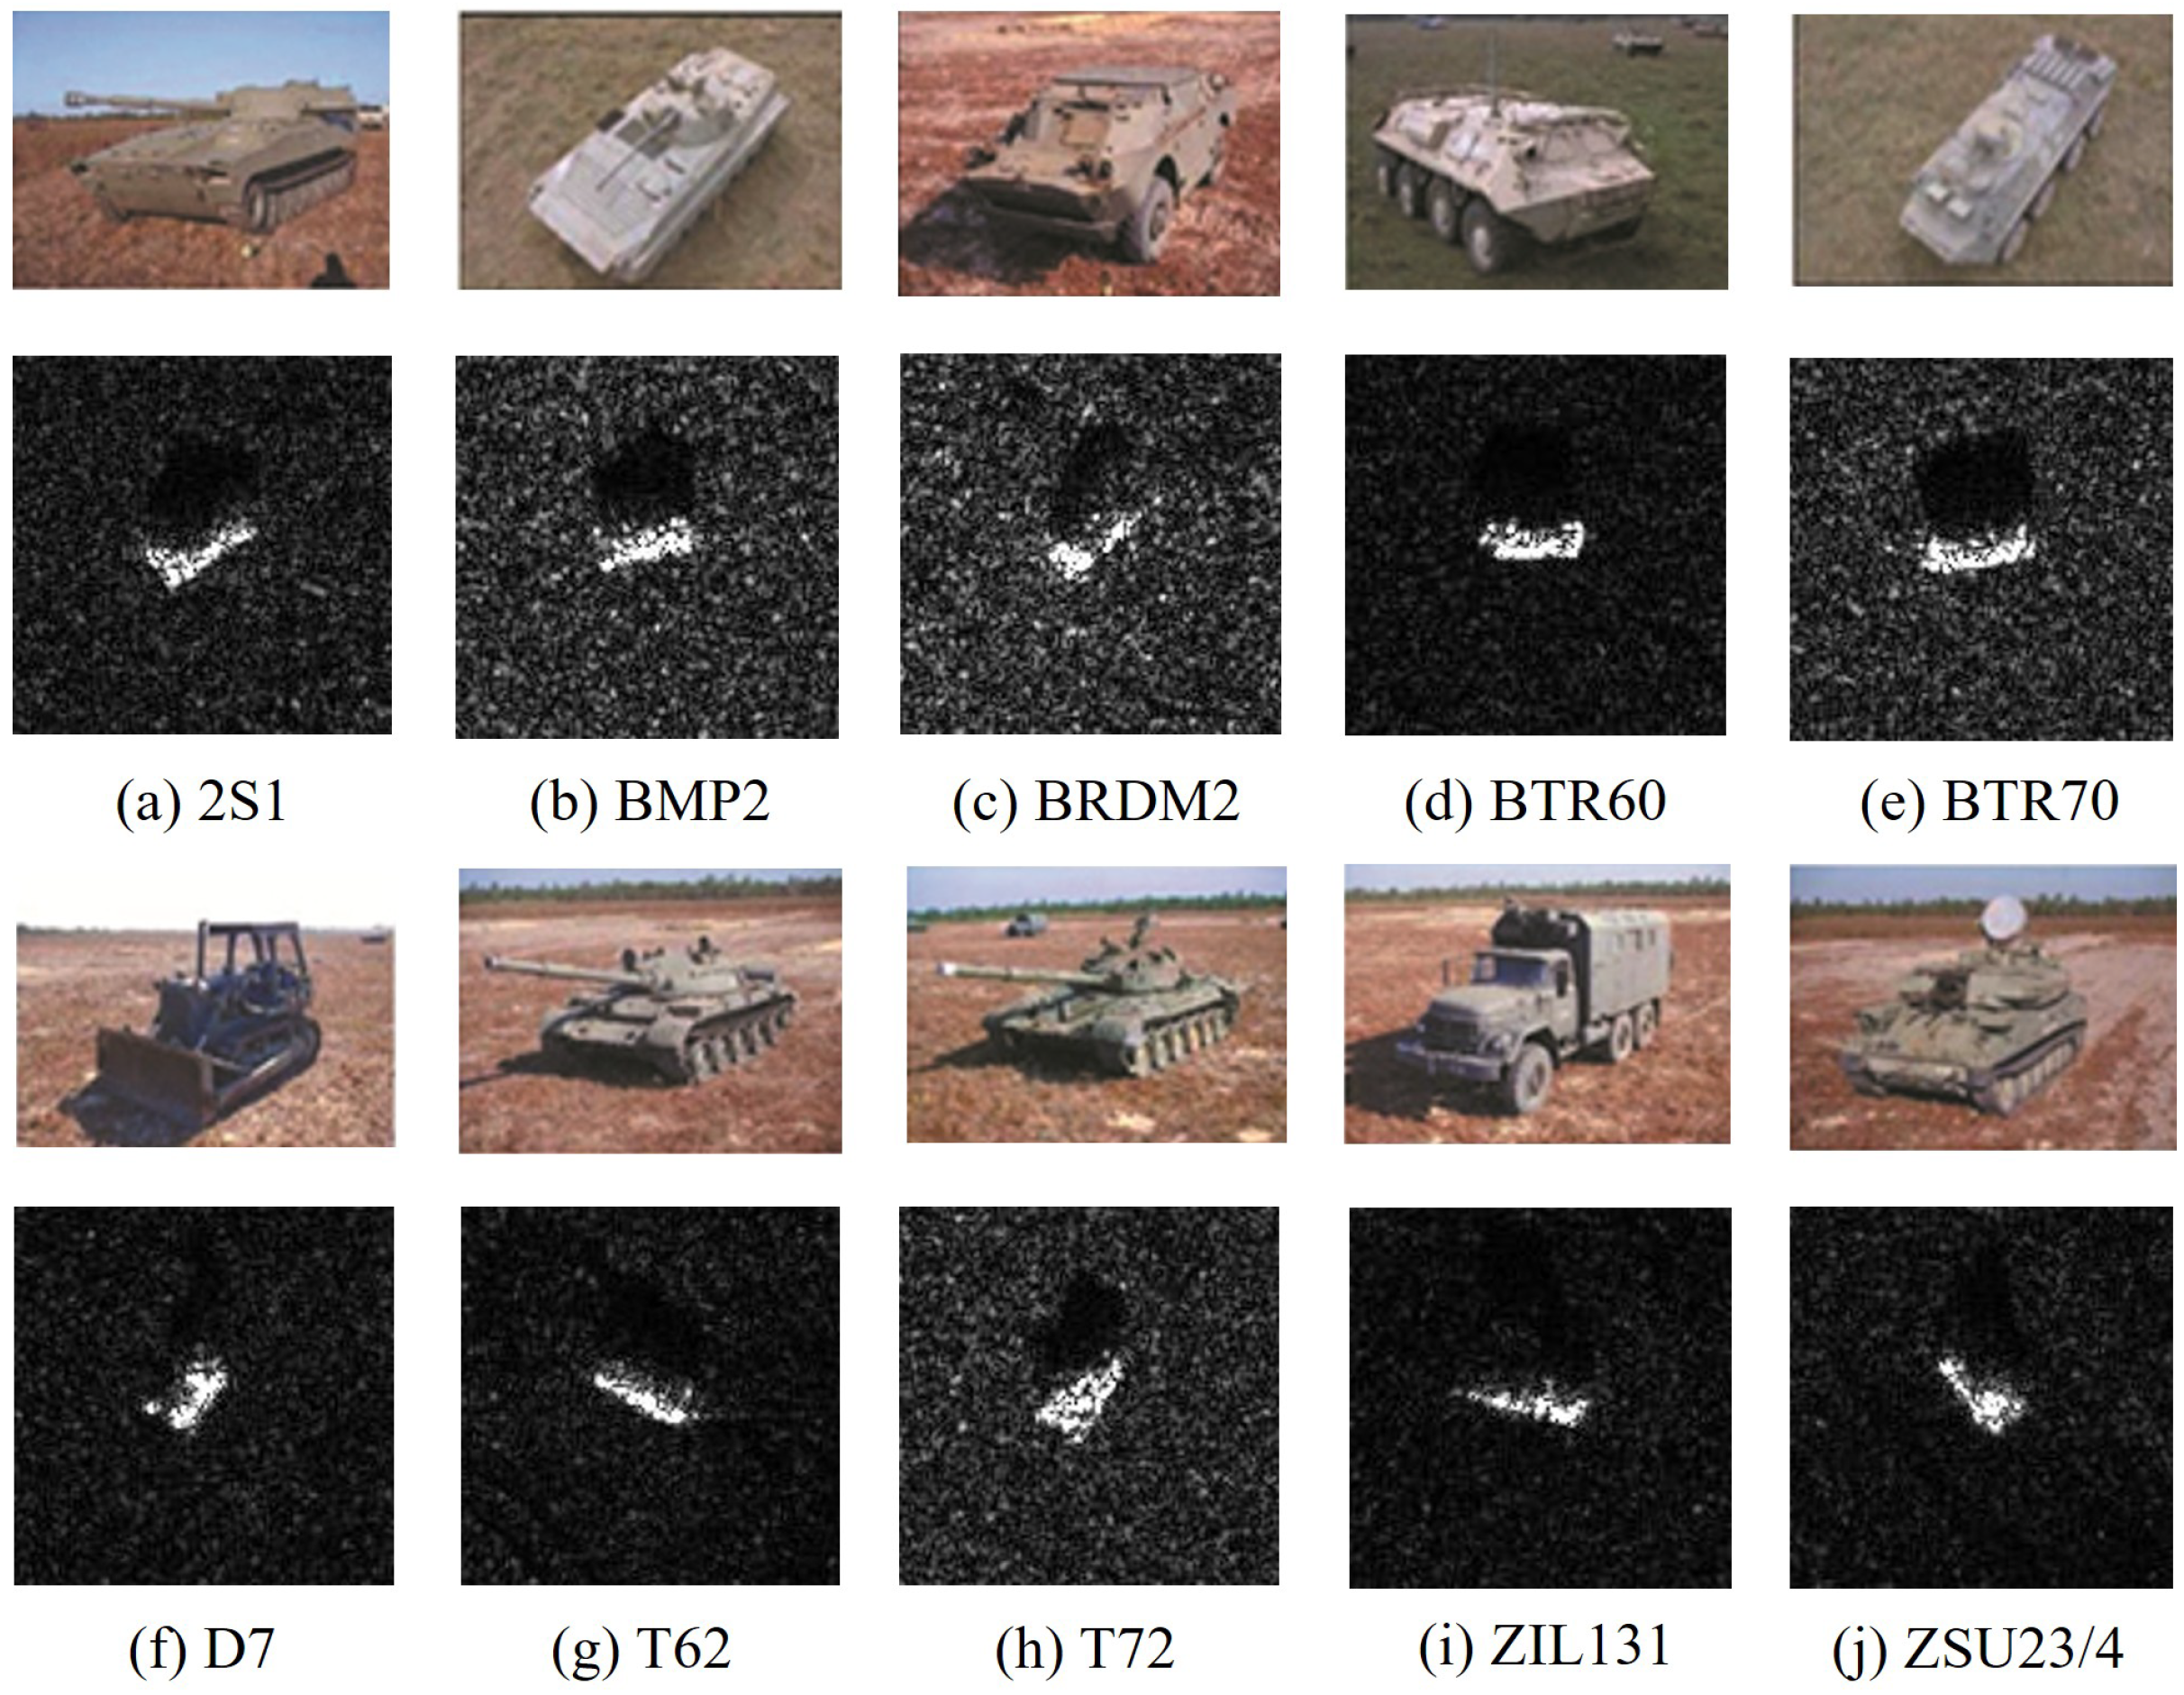
The MSTAR dataset was developed under the sponsorship of the U.S. Department of Defense’s Advanced Research Projects Agency (DARPA) and the Air Force Research Laboratory (AFRL) to support the evaluation of target recognition methodologies, with an emphasis on completeness, diversity, and standardization. This is a public SAR target recognition dataset. The dataset comprises SAR images of ground targets captured under varying configurations, including different target types, azimuth angles, and radar depression angles. Specifically, it contains X-band spotlight mode images at a resolution of 0.3 m, with azimuth angles ranging from 0° to 360°. The dataset includes 10 categories of Soviet-era ground armored vehicles: 2S1, BMP2, BRDM2, BTR60, BTR70, D7, T62, T72, ZIL131, and ZSU23/4. The optical image of the above target and its corresponding SAR image are shown in
Figure 6.
To support targeted studies, researchers commonly construct sub-datasets under standard (SOC) and extended (EOC) operating conditions according to the specific observation settings. Under SOC, the imaging conditions of the training and test datasets are largely consistent, differing only slightly in depression angle 17° for training and 15° for testing. The specific configurations of the training and test sets under SOC are summarized in
Table 2. In contrast, the EOC scenarios introduce substantial variations between the training and test sets, such as differences in depression angles and target variants, as detailed in
Table 3 and
Table 4.
4.1.2. FAST-Vehicle
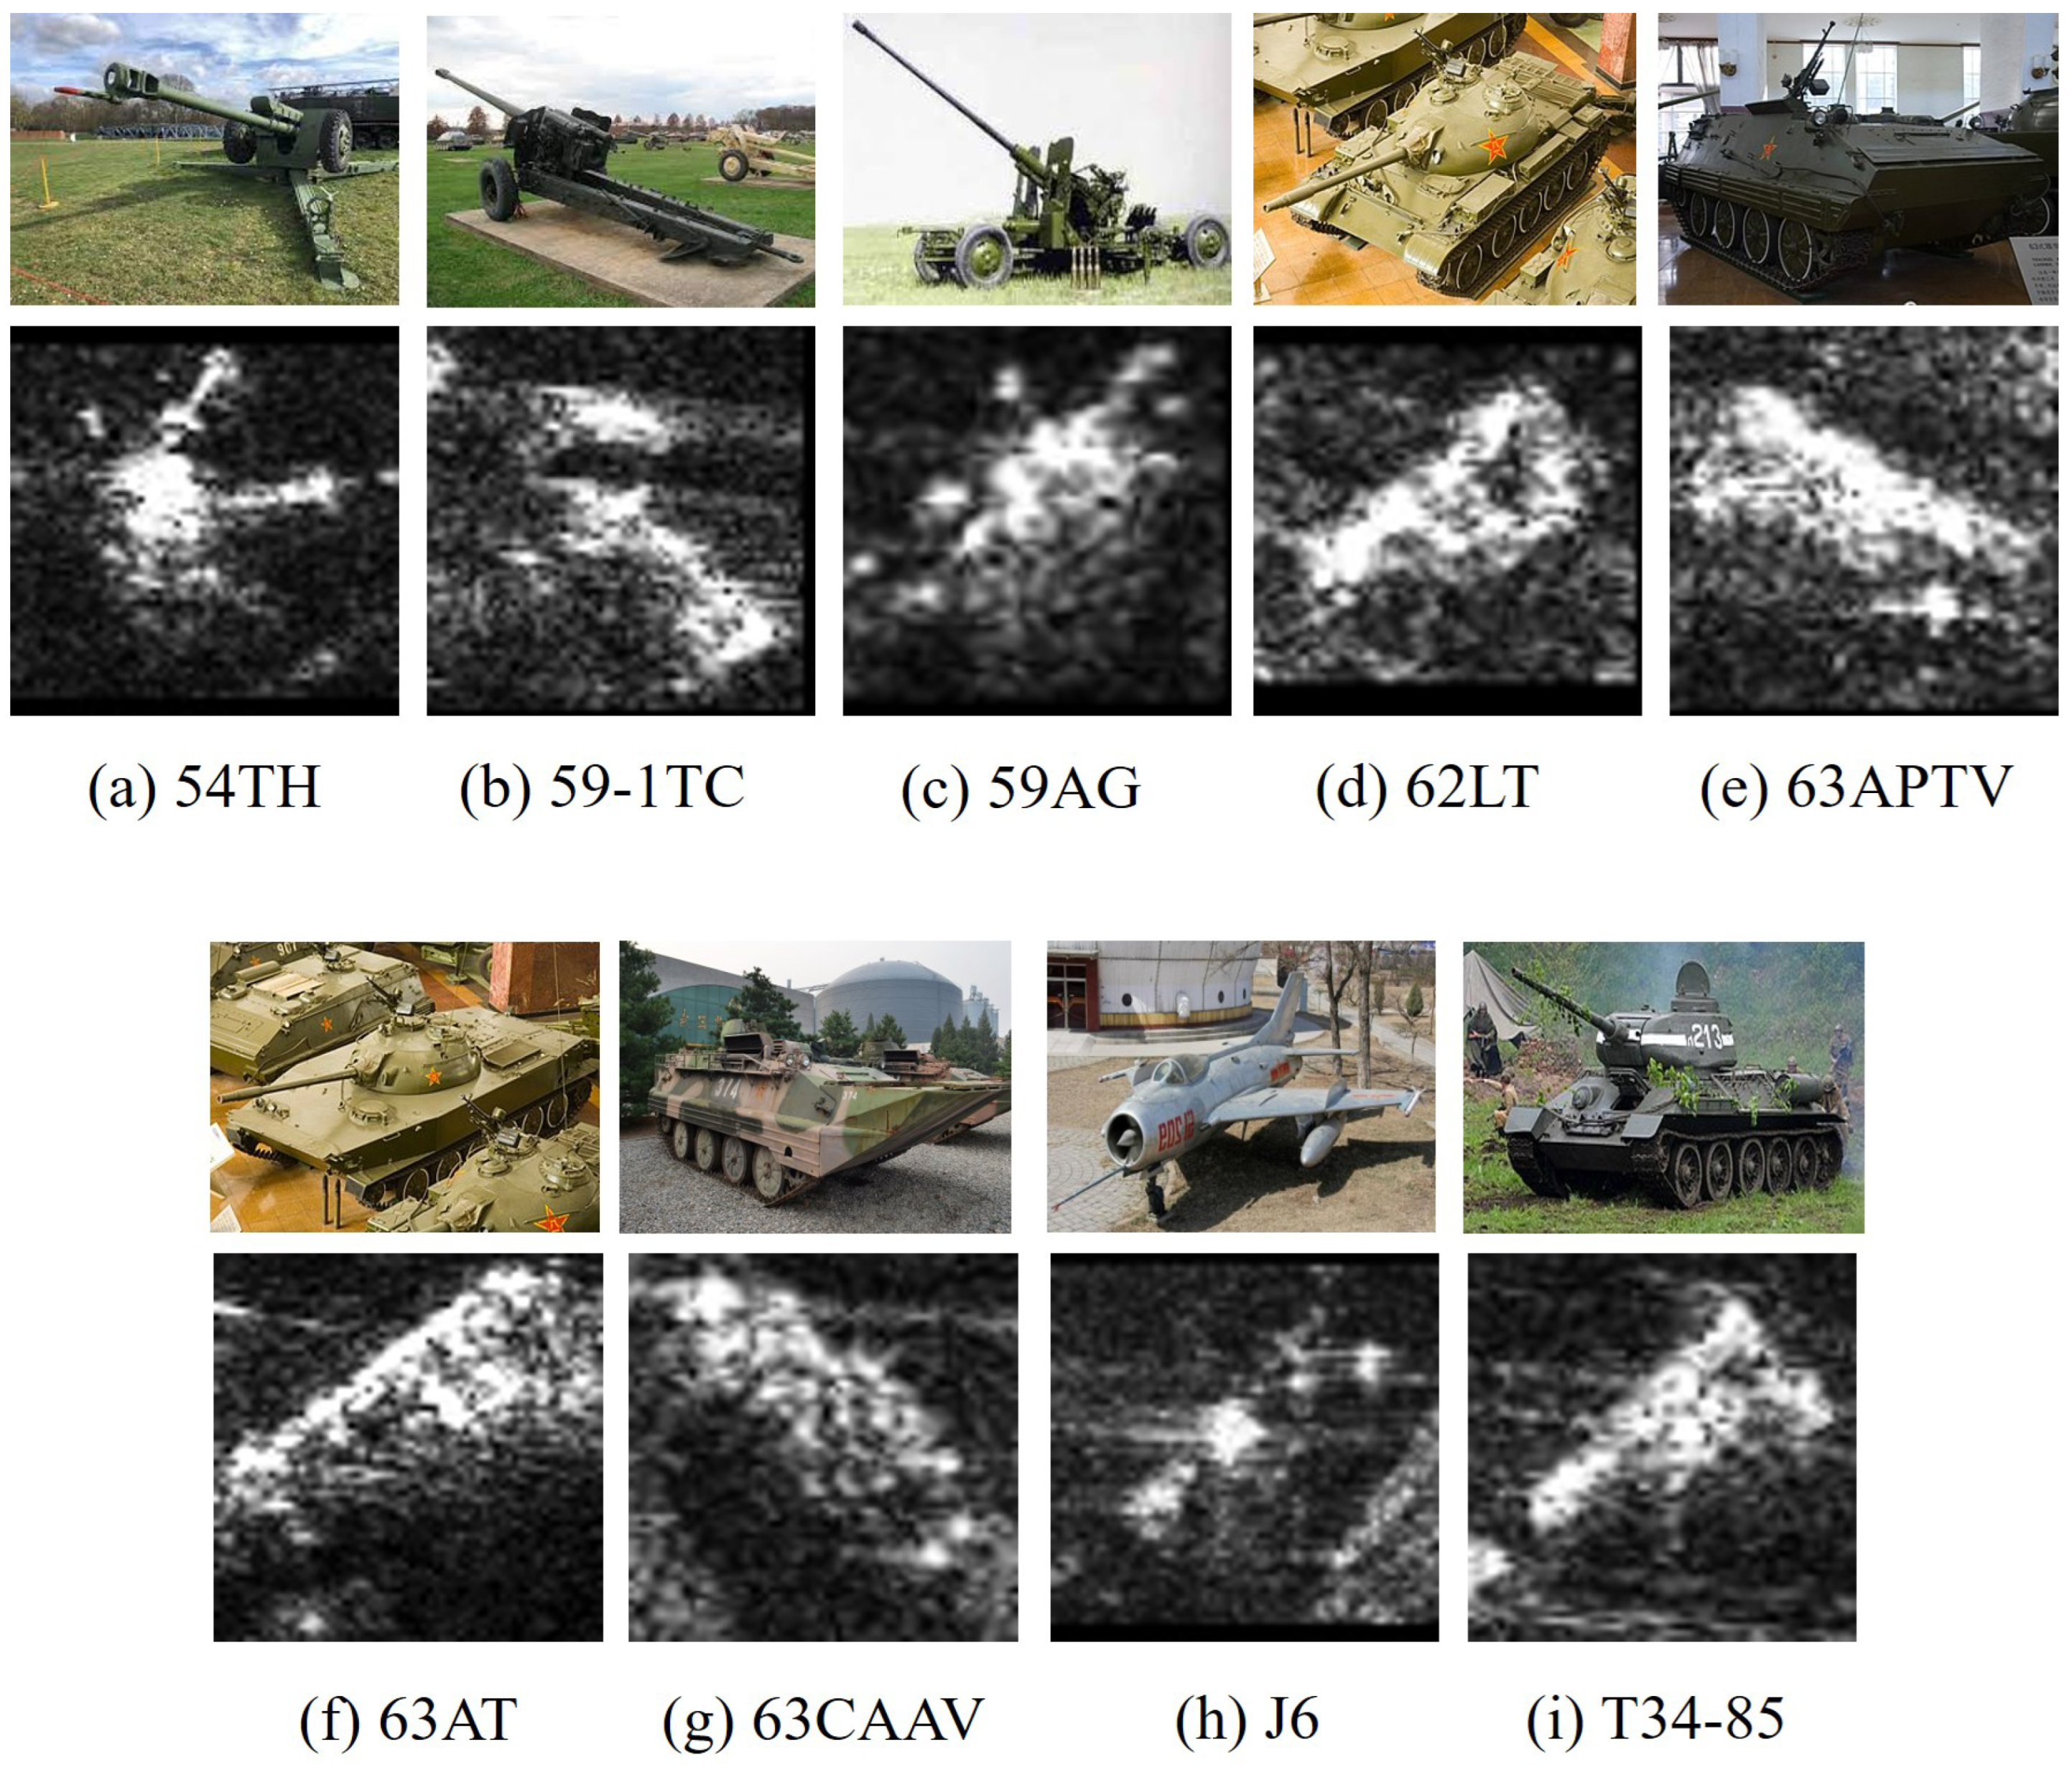
The FAST-Vehicle dataset comprises vehicle SAR data in X-band spotlight mode, collected using the MiniSAR system developed by Nanjing University of Aeronautics and Astronautics (NUAA). It offers a high spatial resolution of 0.1 meters and covers a full azimuth range from 0° to 360°. The copyright of FAST-Vehicle dataset belongs to NUAA. The SAR images were acquired in March and July 2022, encompassing nine target categories: 62LT, 63APTV, 63CAAV, 63AT, T3485, 591TC, 54TH, 59AG, and J6. The optical image of the above targets and their corresponding SAR images are shown in
Figure 7.
Compared to the classical SAR ATR dataset MSTAR, the FAST-Vehicle dataset offers SAR imagery under more diverse conditions, including a wider range of imaging parameters and multiple acquisition times, as summarized in
Table 5. To comprehensively evaluate the effectiveness of the proposed method, three main groups of experimental conditions are designed as follows:
- (1)
Scenario 1: same time, different azimuths. July 26° depression angle data are used as the training set, and 31°, 37°, and 45° are used as the test set, respectively.
- (2)
Scenario 2: different time, same azimuth. We treat July 31° and 45° as the training set and, correspondingly, March 31° and 45° as the test set, respectively.
These experimental conditions are designed to both effectively leverage the dataset’s complexity and rigorously validate the effectiveness of the proposed method.
4.2. Experimental Setup
In this paper, we adopt AconvNet as the backbone network. The Adaptive Moment Estimation (Adam) optimizer is utilized with the learning rate of 0.01. All experiments are trained for 500 epochs with a batch size of 32.
4.3. Comparison Experiments on MSTAR Dataset
Firstly, the performance of the algorithm is verified on the MSTAR dataset.
4.3.1. Comparative Experimental Analysis Under SOC
The experimental results are shown in the
Table 6. The overall recognition performance of the proposed algorithm reaches 99.46% when all the data in the training set are used for training, i.e., almost all the data in the test set are correctly classified. Subsequently, the size of the training set is further reduced to verify the recognition performance of the proposed method under limited training samples. As the training samples continue to decrease, when 20 or 30 samples are randomly selected from each class, the recognition rate of the proposed method is still able to maintain more than 85%. Moreover, with the much smaller sample size, i.e., only 10 training samples per class, the recognition rate of the proposed method still reaches 65.54%, achieving correct classification for most of the test samples. The above experiments verify the basic performance of the proposed method with sufficient training samples and the effectiveness and stability of the algorithm with limited training samples.
Moreover, to verify the superiority of the proposed method, we compared some classical methods, and the experiment results are shown in
Table 6. Specifically, the compared methods are divided into two groups: methods relying solely on SAR images and methods based on feature fusion. The first category of methods includes AlexNet, VGGNet, ResNet, AconvNet, Lm-BN-CNN, and SRC. Among them, the first three methods are classical methods in the field of computer vision, and these methods have been successfully transplanted to the field of SAR image target recognition. Methods other than these are proprietary network structures designed for SAR target recognition tasks. Clearly, the AlexNet network has the worst recognition performance in all limited training sample cases. When each category contains 20 or more training samples, the recognition performances of the VGGNet and ResNet methods are similar; and when the number of training sets is reduced, the recognition performance of the VGGNet method is relatively better. In the SAR proprietary network, AconvNet maintains the optimal recognition performance. The Lm-BN-CNN and SRC methods have poor generalization ability with limited training samples. Therefore, it is reasonable to adopt the AconvNet method as the backbone network for feature extraction in the SAR image domain in this paper.
To further illustrate the superiority of the proposed method, some representative fusion methods are selected for performance comparison in this paper, including FEC, SDF-Net, and ASC-MACN. These methods are implemented to model a priori scattering points by utilizing vectorized modeling, point cloud modeling, and deep modeling, respectively. Under the condition of limited training samples, the performance difference among them is small, around 2%. The proposed method constructs the scattering structure of the target based on the visual geometric properties of the target, while mining and fusing the multi-level scattering information of the target to achieve sufficient and complete target representation. On this basis, the separability among various categories is enhanced by a cosine space classifier. Thus, the proposed method ensures optimal recognition under any training sample setting conditions, which proves the robustness and advancement of the proposed method.
4.3.2. Comparative Experimental Analysis Under EOC
Based on the experimental results in
Table 7, several methods with better performance are selected in this section for experiments under EOC, including VGGNet, Lm-BN-CNN, AconvNet, FEC, SDF-Net, and ASC-MACN.
Under EOC1, the degress angle difference between the training and test sets further increases, i.e., the similarity between the training and test samples decreases. The recognition performance of the fusion methods is slightly better when all training data are used for training under EOC1. However, as the training samples are reduced, the methods in which only SAR image data is utilized for training achieve better recognition performance. When the training samples are limited, the recognition performance of AconvNet is optimal among the compared methods. The proposed method ensures the best recognition performance under any conditions, proves the validity and reasonableness of the proposed scattering structure representation, and achieves the full utilization of the a priori knowledge of the target.
Under EOC2, the target categories are more fine-grained; thus, more detailed information about the target needs to be obtained to achieve precise classification. From
Table 8, it can be found that the fusion method obtains higher recognition performance in the case of limited training samples. Such extra target scattering information enhances the network’s ability to perceive localized information about the target, making it more discriminative in distinguishing fine-grained target classes. That result is also highly consistent with the general laws of the human perception of things. The proposed method not only fully mines and fuses the scattering information of the target to achieve complete target representation, but also enhances the separability of the features through the cosine space classifier, thus realizing the more superior and robust recognition performance.
4.4. Comparison Experiments on FAST-Vehicle Dataset
To verify the generality of the proposed method, experimental validations are performed on the latest FAST-Vehicle dataset.
4.4.1. Comparative Experimental Analysis Under Scenario 1
Table 9,
Table 10 and
Table 11 demonstrate the performance of all algorithms under Scenario 1 conditions. Due to the poor image quality in the FAST-Vehicle dataset, the overall performance of all the algorithms on this dataset is worse. When all the data in the training set are used for training, the AconvNet method achieves recognition rates of 59.19%, 66.14%, and 53.37% under EXP1, EXP2, and EXP3 conditions, respectively. Under the EXP1 condition, the fusion of a priori scattering information leads to the performance gain and, thus, the fusion method is superior to AconvNet. When only 50 samples per class are used for training, the complex manner of scattering information mining will bring burden to the network, thus making the ASC-MACN method worse among the fusion methods. At this time, the FEC method achieves the best recognition performance among the compared methods. With the increase in training samples, the difference in recognition performance between the FEC method and the ASC-MACN method is small, and the performance of the SDF-Net method gradually improves and is optimal among the compared methods when the training samples are sufficient. The proposed method achieves the best recognition performance of 68.55% in the EXP1 condition. This method designs a more adapted modeling approach and takes into account the presence of redundant information in the features that is irrelevant to the classification task, and it compresses the redundant information through mutual information to achieve further enhancement of the discriminative information. The following factors work together to achieve the optimal performance of the proposed method: (i) relying on the visual structural attributes to construct the scattering structure association, and mining the target multilevel scattering information based on it to enrich the target representation; (ii) quantifying the discriminative information in the features by information entropy, and filtering the redundant information to improve the discrimination of the fused features; and (iii) enhancing the divisibility of features by projecting them into the spherical manifold space.
Under the EXP2 condition, the recognition performance of the FEC method reaches the best among all the compared methods at 67.97%, making it the only method that performs better than AconvNet among all the compared methods. Although the performance of the SDF-Net method is degraded, it still outperforms the recognition performance of the ASC-MACN method, which reaches 64.58% and 64.15%, respectively. Such performance patterns are maintained in the EXP3 experimental conditions, which achieved 53.72%, 53.26%, and 50.27% for the three fusion methods, respectively. The proposed method maintains the optimal recognition performance under Scenario 1 conditions.
In the case of limited samples, the discriminative information provided by the training data is limited, and adding extra target information is the powerful tool to enrich the target discriminative information. Under the EXP1 conditions, the fusion methods show significant performance improvement over AconvNet, regardless of whether the training samples have 150, 100, or 50 samples per class. With the changes in the degress angle, the performances of the SDF-Net algorithm and the ASC-MACN algorithm show different degrees of degradation, and are even slightly worse than the recognition effect of AconvNet. The proposed method relies on the reasonable a priori scattering model knowledge representation strategy, which enhances the ability to utilize the knowledge of the a priori scattering model to achieve robust recognition in the case of limited training samples.
4.4.2. Comparative Experimental Analysis Under Scenario 2
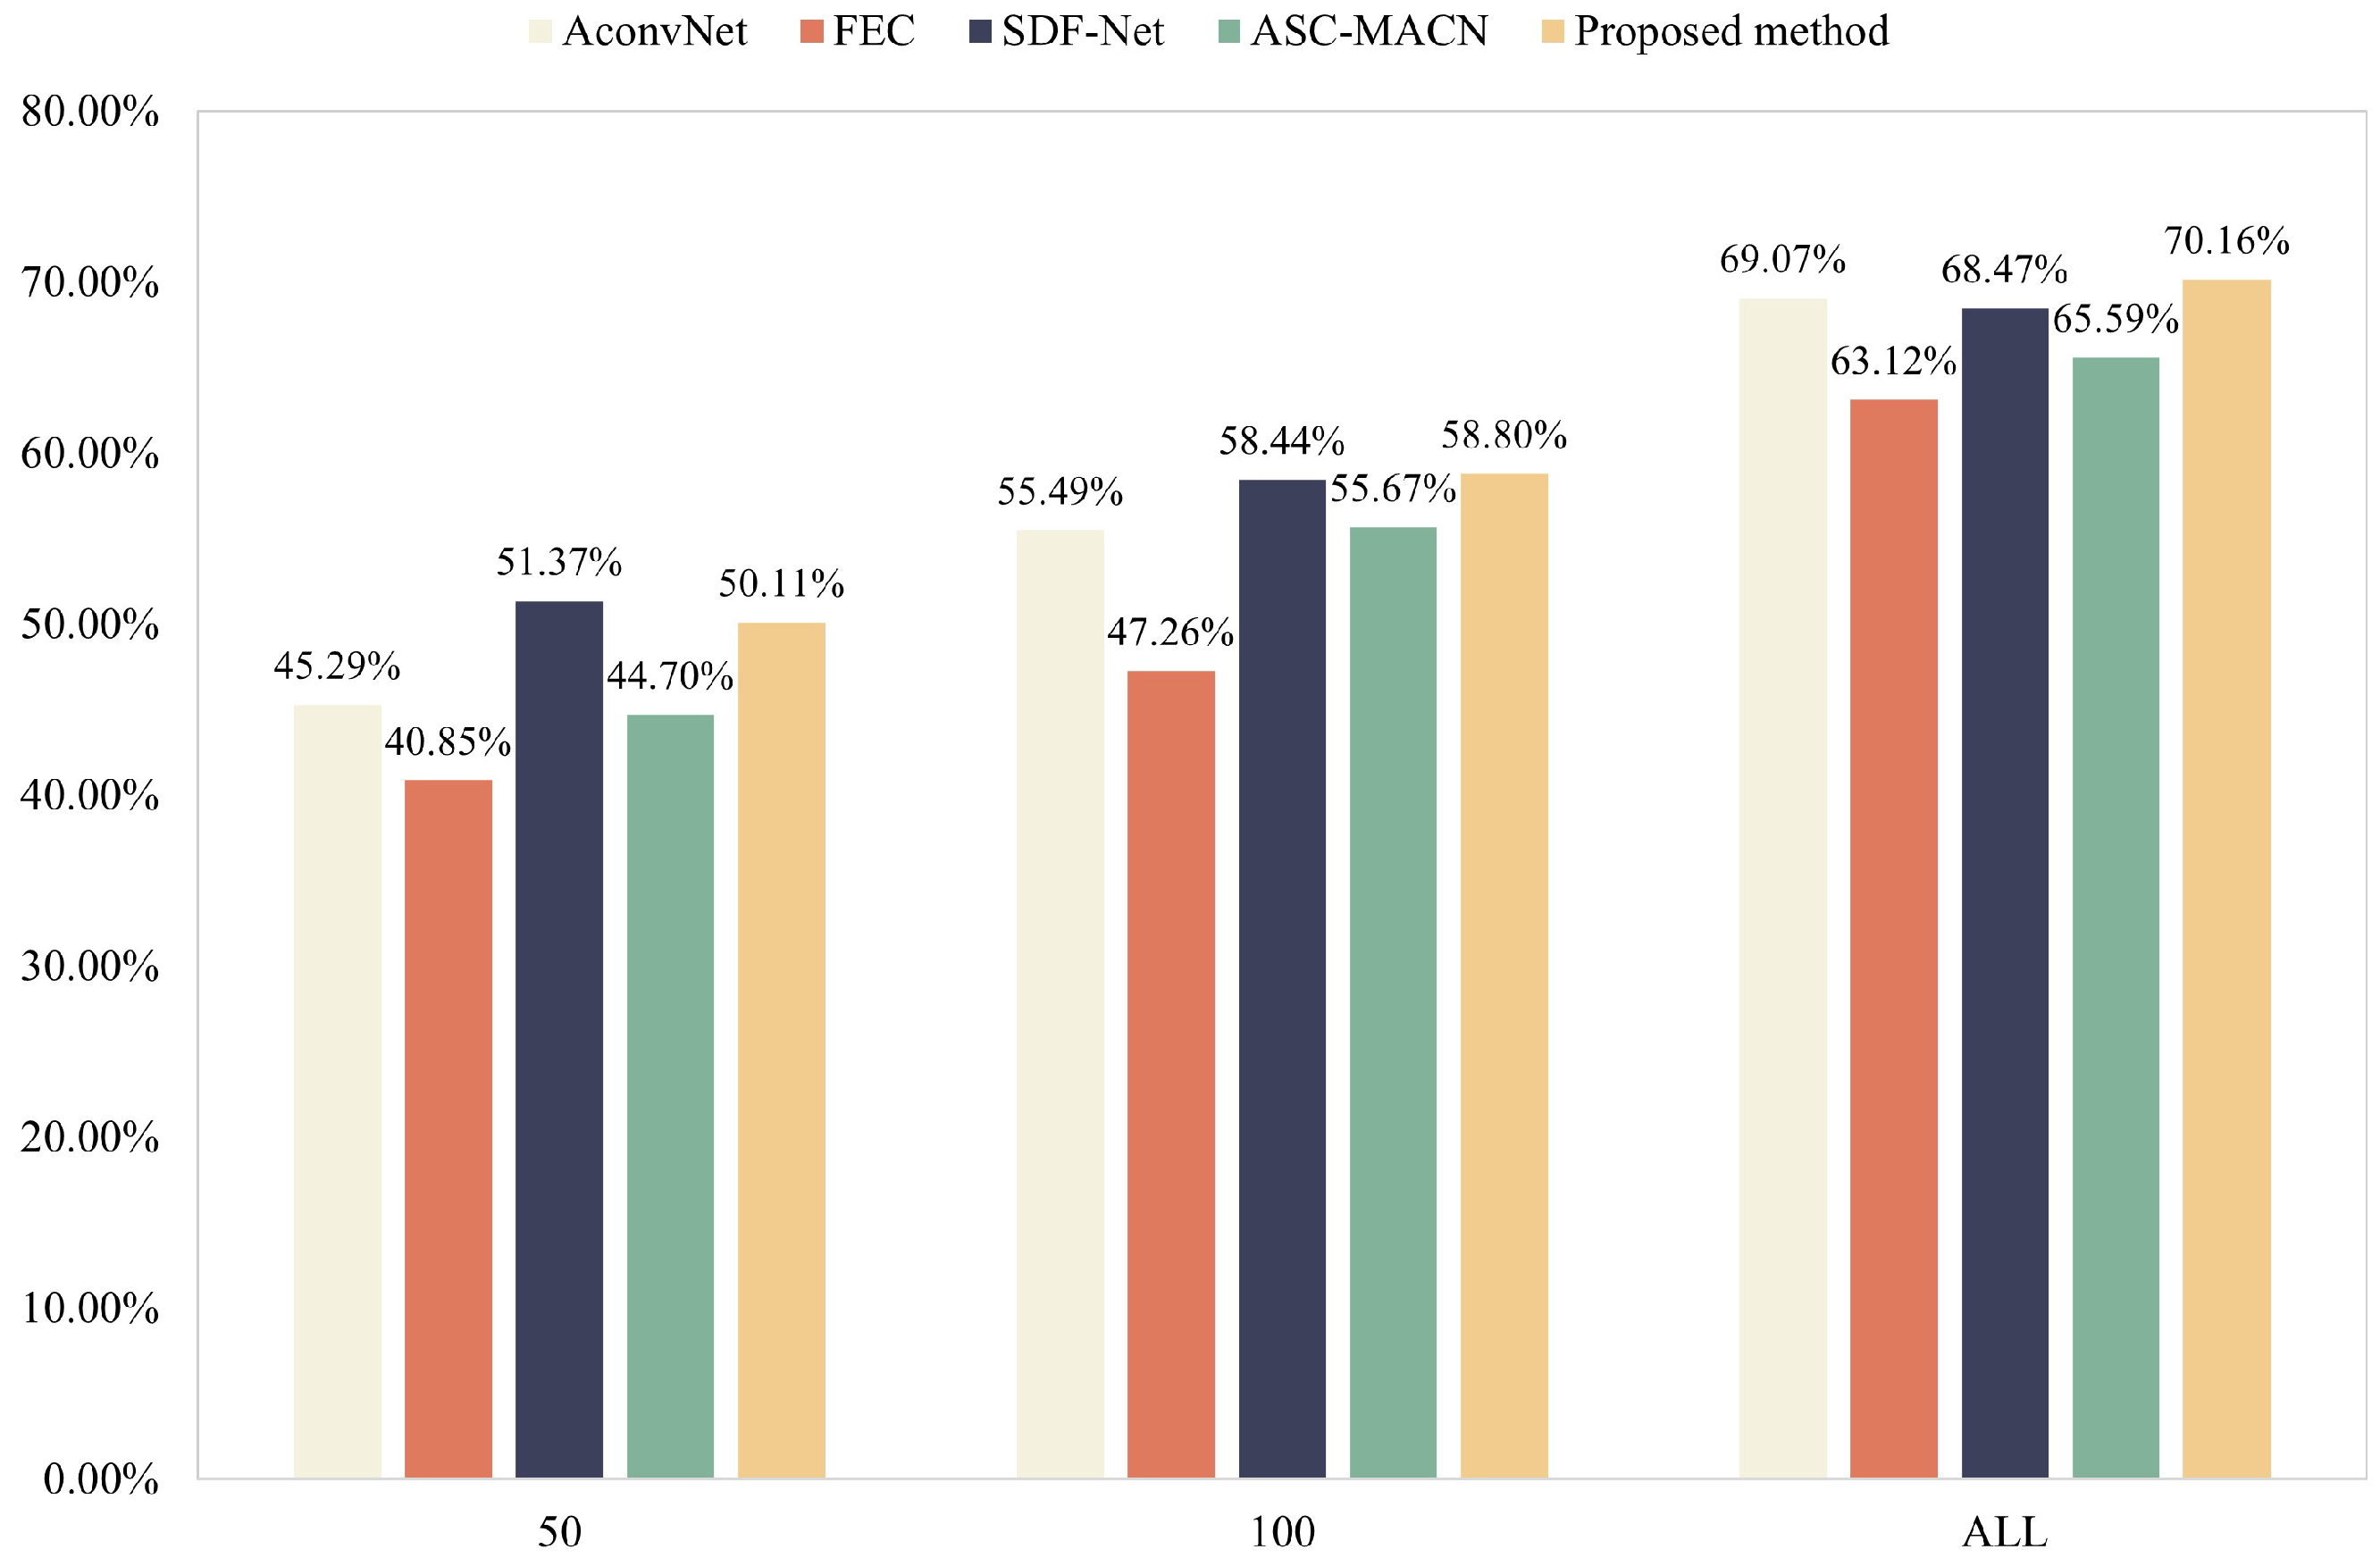
In the Scenario 2 condition of FAST-Vehicle, the training and test sets are samples at the same degress angle with different acquisition times, including the EXP4 and EXP5 experimental conditions. SAR images acquired at different acquisition times have more uncontrollable factors and are more complex, e.g., the surrounding environment changes significantly during different seasons and meteorological conditions may also produce uncontrollable variability in the imaging results. The experimental results under Scenario 2 conditions are shown in
Figure 8 and
Figure 9.
Among the compared methods, the SDF-Net method shows superior recognition performance under the training samples conditions. However, even the recognition performances of the FEC and SDF-Net methods show various degrees of performance degradation compared to the AconvNet method. Moreover, as the number of training samples increases, the advantage of the fused feature methods in the comparison methods gradually disappears compared to AconvNet, and all comparison methods show performance degradation. Such phenomenon is inseparable from the inconsistent imaging quality of the FAST-Vehicle dataset. The proposed method improves in all aspects, from the modeling and mining of scattering information to feature fusion and classifier. (i) On the one hand, the more complete representation of the target is achieved. (ii) On the other hand, the target discriminative information is further enhanced by the feature fusion strategy. (iii) The features are also projected into the manifold space, which enables better feature distinguishability. Thus, the proposed method maintains the optimal recognition performance even when the data situation is more complex.
