Article

High-Resolution Drone-Based Aeromagnetic Survey at the Tajogaite Volcano (La Palma, Canary Islands): Insights into Its Early Post-Eruptive Shallow Structure

by
María C. Romero-Toribio
1,2,*,
Fátima Martín-Hernández
1,2 and
Juanjo Ledo
1
1
Departamento de Física de la Tierra y Astrofísica, Facultad de Ciencias Físicas, Universidad Complutense de Madrid, Plaza de las Ciencias 1, 28040 Madrid, Spain
2
Instituto de Geociencias (CSIC-UCM), Calle Doctor Severo Ochoa 7, 28040 Madrid, Spain
*
Author to whom correspondence should be addressed.
Remote Sens. 2025, 17(18), 3153; https://doi.org/10.3390/rs17183153
Submission received: 14 July 2025 / Revised: 20 August 2025 / Accepted: 3 September 2025 / Published: 11 September 2025

Abstract

The 2021 eruption of the Tajogaite volcano (La Palma, Canary Islands) provided a unique opportunity to investigate the early post-eruptive magnetic structure of a newly formed volcanic edifice. Understanding these structures is essential for improving hazard assessment and risk mitigation strategies. In this study, we present the first high-resolution, drone-based aeromagnetic dataset over the Tajogaite volcano, aimed at clarifying its still-uncertain geodynamic framework at shallow depths. We describe the data acquisition and processing workflows for surveying volcanic terrains, providing insights into the challenges encountered and the methodologies applied. The magnetic dataset was analyzed and used to construct a 3D magnetic susceptibility model of the volcanic edifice and its surroundings. Our results revealed very low magnetic susceptibility values at very shallow depths (~50 m below the surface) over the main volcanic edifice, suggesting the presence of a likely vertical, dyke-like structure feeding the eruption. These findings indicate that these materials remain above their Curie temperature around two years after the eruption. Moreover, the magnetic anomalies display patterns that correlate with the previously inferred two-fault systems, which likely played a critical role in channelling magma toward the eruptive vents. An elongated zone of slightly low magnetic susceptibility was identified following the NE-SW Mazo fault orientation, extending toward the eruptive fissure. This feature was associated with a single, fault-controlled magma pathway that remained at high temperatures at the time of the survey, in agreement with studies in other volcanic environments. This study highlights the value of aeromagnetic surveys, particularly those conducted with drones, as effective tools for advancing our understanding of young and dynamic volcanic systems, especially regarding their shallow structures.

1. Introduction

In the Canary Archipelago, the active volcanic region of La Palma Island, the Cumbre Vieja volcanic ridge, has been extensively studied in recent years, largely driven by the 2021 eruption of the Tajogaite volcano (e.g., [1,2,3]). This eruption created a unique opportunity to investigate the early post-eruptive physical properties of a newly formed volcanic edifice, providing critical insights into eruptive dynamics and volcanic evolution (e.g., [4,5,6]), with implications in future hazard mitigation strategies for the local population.
The Tajogaite eruption, which lasted from 19 September to 13 December 2021, was the most damaging one [3,7] among the historical eruptions of La Palma [8]. Since then, the region has been continuously monitored using geophysical (e.g., [4,5,9,10,11]) and geochemical methods (e.g., [12,13,14,15]) to unravel the eruption mechanisms and assess its ongoing evolution. Despite these efforts, important uncertainties persist regarding the migration path of magma during the hours immediately preceding the eruption, particularly as it approached shallow depths reaching the surface. In this context, a high-resolution characterization of the shallow subsurface structure of the Tajogaite volcanic edifice using aeromagnetic data represents a valuable opportunity to delineate structural features to clarify these questions and complement existing geophysical and geochemical observations.
Magnetic surveys are a powerful tool for identifying contrasts in magnetic susceptibility between adjacent rock units, allowing the detection of geological structures including orientation, dip, and strike of faults and dykes [16]. Under specific conditions, magnetic anomalies can also indicate areas of hydrothermal alteration (e.g., [17]), where magnetization is lost or modified due to mineralogical changes, or highlight thermal anomalies in rocks that remain above their Curie temperature [16]. Magnetic studies have successfully imaged magmatic feeding systems in other active environments, yielding crucial insights into their structure [18,19,20]. This makes magnetometry particularly valuable in post-eruptive settings, where rapid infrastructure planning and geological risk assessment are essential [21]. Drone-based surveys have emerged as an efficient and cost-effective solution for acquiring dense, high-quality magnetic data (e.g., [22,23,24] particularly in new volcanic terrains characterized by steep relief and limited accessibility due to legal and/or security restrictions (e.g., hot ground). The ability to conduct non-invasive, low-altitude surveys makes this approach especially advantageous at those settings [25].
In this study, we present the first high-resolution, post-eruption drone-based magnetic anomaly map of the Tajogaite volcano. The main objectives of this work are: (1) to evaluate the performance of drone-based aeromagnetic surveys in recent volcanic terrains, assessing the operational and processing limitations; and (2) to characterize the shallow structure of the Tajogaite edifice through 3D magnetic susceptibility inversion modelling. The results derived from this study offer new insights into the eruptive dynamics and thermal evolution of the Tajogaite system, contributing to a better understanding of post-eruptive volcanic processes and their geophysical signature.

2. The Tajogaite Eruption

The Cumbre Vieja ridge, the only active volcanic unit on La Palma Island, dates back 125,000 years, cooling entirely under the normal polarity of the present-day geomagnetic Brunhes chron [26]. The most recent eruption occurred at the Tajogaite volcano on 19 September 2021, as part of this ongoing volcanic activity in the Canary Islands (Figure 1). The eruption lasted until 13 December 2021, becoming also the longest historical eruption in La Palma (85 days) [8]. It was also the most damaging one with approximately 73 km of roads, several infrastructures, and agricultural crops affected, impacting around 7200 people [21].
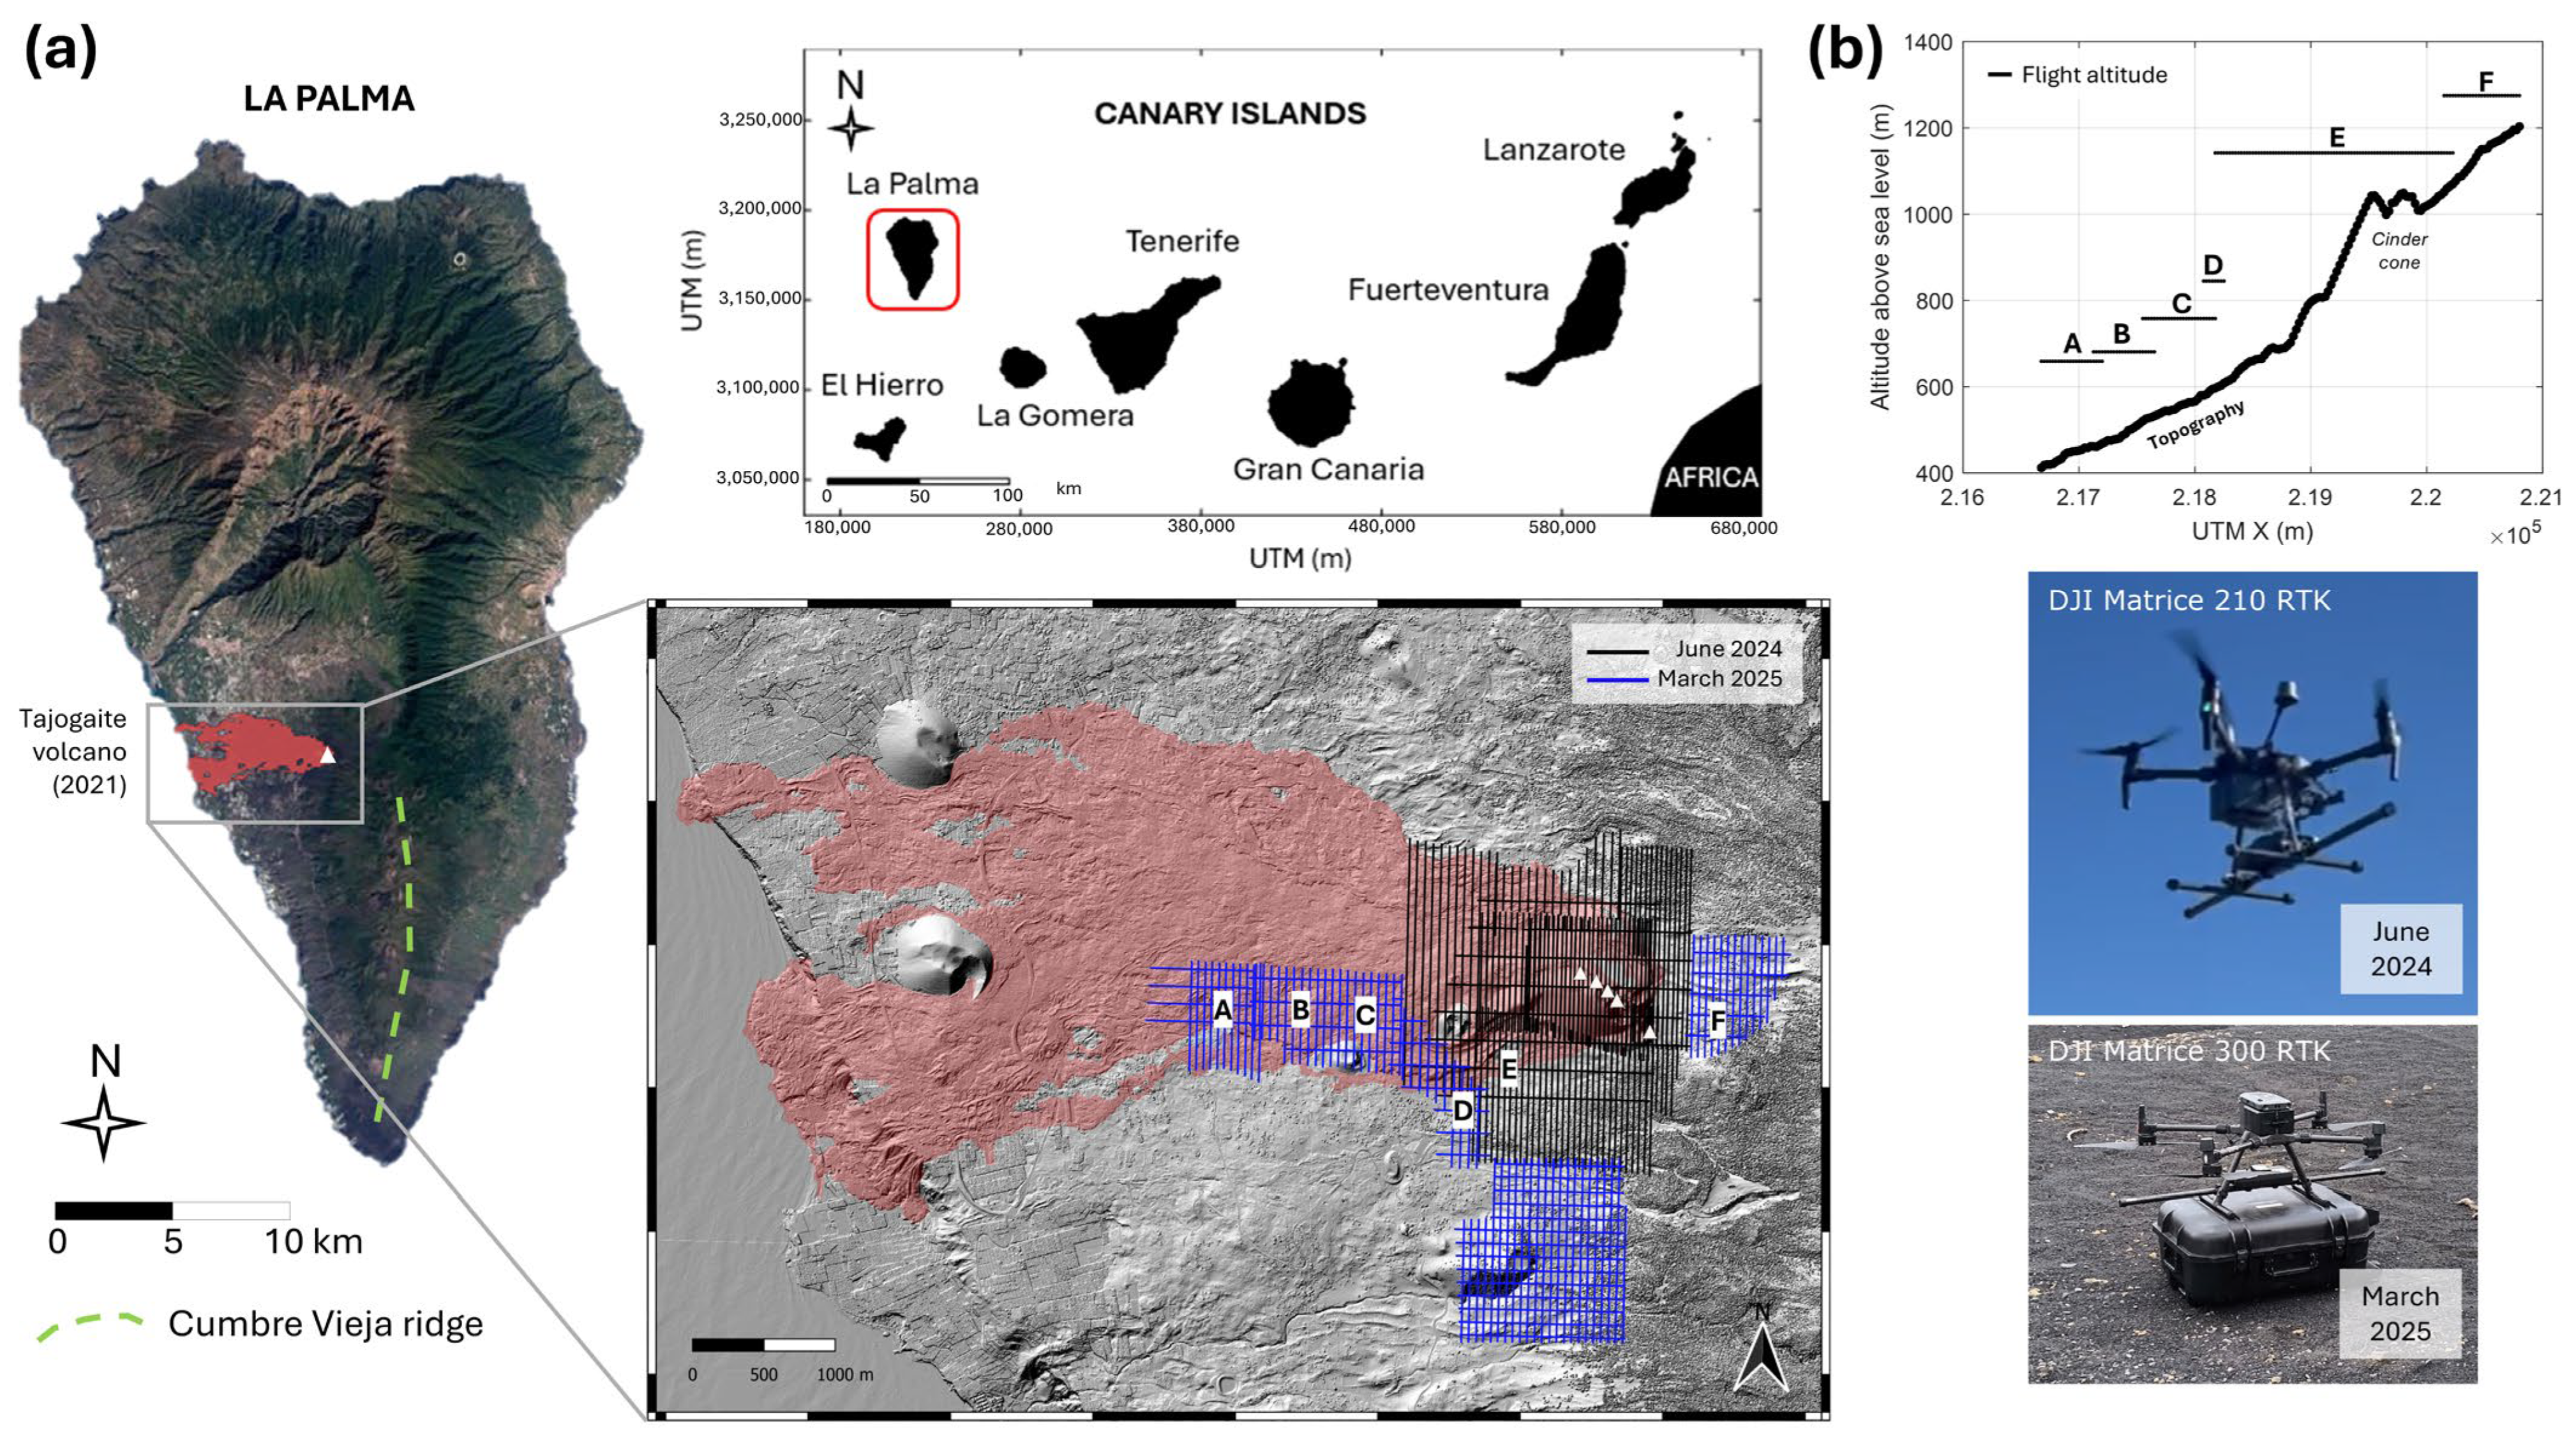
The Tajogaite volcano has undergone a fissure eruption, with magma emerging from several aligned vents in a NW-SE orientation over a 557 m long fissure (PEVOLCA report, 25 December 2021, [27]). This hybrid eruption involved alternating explosive and effusive activity [3], producing mostly viscous aa-type lava (<900 °C), and more fluid pahoehoe type lava flows that reached higher temperatures (~1140 °C). The average thickness of the lava flows is estimated to be around 12 m, with a maximum thickness of 70–80 m. (PEVOLCA report, 25 December 2021). The summit of the main volcanic edifice is around 1071 m a.s.l., 187 m higher than the land surface before the eruption [28]. The elevation in the study area ranges from 390 m a.s.l. at the westernmost surveyed location to 1305 m a.s.l. at the easternmost location, according to the Digital Surface Model (DSM).
The volcanic products of the eruption were tephrites (volcanic glass, crystals of pyroxene, amphibole, plagioclase, and iron and titanium oxides), and basanites (with olivine crystals) [29]. The study of magnetic properties in lava flows and lapilli [30,31] revealed a predominant abundance of Ti-magnetite with a variable medium Ti content [30]. The Day-Dunlop plot suggested that lava flows exhibit coercivity ratios like those of other well-known basaltic flows such as Azores or Vesuvius: pseudo-single domain or mixed single and pseudo-single domain grain populations [30]. In contrast, lapilli present higher proportion of multidomain grains [30]. The cooling rates of lava flows have also been studied using borehole temperature data and models of homogeneous and heterogeneous conditions [21] suggesting very low cooling rates at locations 3 km SW from the vents.
In recent years, geophysical research has mainly focused on revealing the deep pathways of magma ascent. The studies of seismicity revealed two clusters at ~10–14 km and ~33–39 km depths, separated by an aseismic zone that could imply pre-eruptive magma storage [6,32]. Also, rapid magma ascent from this reservoir at ~11 km depth is supported by a decrease in seismic wave velocity one week before the eruption [1]. From this reservoir’s depth, a model consisting of sill and dykes based on gravity changes and the hypocenters of earthquakes path was proposed for the initial stages before the eruption [33]. Studies on geodesy, complemented with seismicity, also inferred a shallow magma reservoir around 3.5 km depth, 7 km SSW from the eruptive cones, from where the magma migrated northward [34]. Authors using DInSAR measurements also highlight a sill–like source active in the pre–eruptive phase and two dikes during the co-eruptive phase [35]. Other study suggested a twisted dyke morphology based on geodetic imaging that interacted with pre-existing structures [36]. Magnetotelluric monitoring sync- and post-eruption supported a rapid magma ascent through a likely vertical dike due to a decrease in electrical resistivity [4]. These changes are also supported by 10 nT amplitude signals revealed through the analysis of the time series of the geomagnetic field before and during the eruption [5]. A recent study identified two active fault systems (Tazacorte and Mazo faults) associated with a regional Atlantic extensional tectonic field (NW-SE) and the local tectonic field (NE-SW), respectively, which likely facilitated the rapid ascent of magma before the eruption [37]. Hypocenter relocation [32] showed a slight alignment with the Mazo fault system [37], with seismicity depth clusters occurring approximately 2.5 km SW from the vents the day before the eruption.
Figure 1. (a) Aeromagnetic data acquisition over the Tajogaite volcano, La Palma (red box), Canary Islands. Lava flows as of December 2021 are shown in red [38]. White triangles indicate the location of the eruptive vents [27]; (b) Flight altitudes during the survey, relative to the topography, are shown for an E-W profile crossing the main cinder cone (UTM Y = 3,168,600). Drone models for both data acquisition dates are also shown in this panel. Letters from “A” to “F” denote each survey block according to its flight altitude.
Remotesensing 17 03153 g001

3. Data and Methods

3.1. Drone Survey

An aeromagnetic survey was conducted over the Tajogaite volcano, covering a total area of ~7 km2 (Figure 1a). The volcanic fissure area was mapped on 24–27 June 2024, while the surroundings and lava flows were surveyed on 25 and 27 March 2025. In both acquisitions, drones (DJI Matrice 210 RTK and DJI Matrice 300 RTK, respectively) were equipped with the same fluxgate magnetometer (MagDrone R3, SENSYS Inc., Neu Golm, Germany) operating at a sampling rate of 200 Hz, with two sensors spaced 1 m apart. The velocity of the drones was set to 10 m/s, and their position was tracked using the magnetometer’s internal positioning system, which recorded latitude, longitude and altitude at a sampling rate of 10 Hz. Each drone flight consisted of parallel track lines (lawnmower pattern) and lasted approximately 20 min. A total of 30 flights were acquired, excluding test, calibration, and tie line flights, which were carried out right before and after the survey lines. Over the eruptive fissure, survey lines were spaced approximately 30 m apart in the N-S direction, while in the surrounding areas, line spacing was around 50 m. Tie lines were acquired as shown in Figure 1a every 150–200 m in the E-W direction. The drones operated at a constant altitude above sea level (a.s.l.), though in some areas this was limited by the highest topographic points or legal restrictions. In the eruptive vents area, data was acquired at 1142 m a.s.l., which is approximately 70 m above the summit of the volcanic edifice. At the Northeast of the fissure, data was acquired at 1275 m a.s.l., corresponding to a mean altitude of 130 m above the surface. In the area surveyed over the Southwest lava flows, flight altitudes were adjusted according to legal restrictions, flying at 845 m, 758 m, 681 m, and 659 m a.s.l. in different survey blocks (Figure 1b). These altitudes correspond to mean average heights of approximately 209 m, 197 m, 184 m, and 220 m, respectively, above the surface. Additionally, calibration flights were taken in an area of low magnetic gradient, at high altitude, extending 100 × 100 m2 and with a velocity equal to that of the survey lines (Supplementary Figure S1). To analyze diurnal magnetic field variations, we used a magnetotelluric experiment provided with a triaxial fluxgate magnetometer, located 2.4 km NE from the volcanic fissure, as a reference station. For more details on the these recordings refer to [4].

3.2. Corrections on Magnetic Data

Using MagDrone Data Tool (SENSYS Inc.), the total magnetic intensity (TMI) was derived from the components of each fluxgate sensor. The magnetic signals corresponding to sharp drone turns were removed afterwards. Next, the frequency content of the time series signals was analyzed using the Short-Time Fourier Transform (STFT), which enabled identification of the frequencies likely associated with electromagnetic interferences generated by the drone rotors in operation [39]. This noise becomes more pronounced when the magnetometer is attached to the drone legs [39,40], as in our case. This analysis of the high-frequency content allowed us to identify signals of continuous frequencies of around 50 Hz and 80 Hz and their harmonics [39,41] in the recordings of June 2024 and March 2025, respectively (Figure 2a). These are related to the use of different drone models. To isolate the low-frequency magnetic signal associated with subsurface structures of interest, a 1 Hz low-pass filter was applied (see track line example in Figure 2b). The cut-off frequency was selected to preserve the shortest-wavelength geological anomalies measured in the Reduced-To-the-Pole (RTP) anomaly over the eruptive fissure (~245 m). Considering the drone speed of 10 m/s, the frequency of interest is calculated as f = (2 × 10 m/s)/(245 m/2) = 0.16 Hz, ensuring that the filter effectively attenuates higher-frequency drone-induced noise while preserving the relevant geological signal [39,42].
The influence of drone movements (pitch, yaw, and roll) on the magnetic data from both sensors was assessed and corrected where necessary. This step resulted essential, as the drone flew in a lawnmower pattern changing its heading and producing a systematic noise in the measurements. This unwanted noise, also produced by the drone’s electromagnetic components [40], creates a strip-like pattern in track lines when plotted together. To correct the magnetic data, cloverleaf-shaped calibration flights were used, which represent the most effective pattern for capturing all drone movements during the survey [40]. These flights were specially designed to enhance the magnetic signal from the drone relative to that produced by shallow geology [40]. As the noise patterns differ between drones, as shown in the prior noise analysis, a comparative statistical evaluation of both sensors was conducted before and after heading error correction (Supplementary Text S1 and Supplementary Figure S2) to identify the data offering the highest signal quality for the final magnetic maps.
The diurnal variation analysis was carried out in MATLAB (MATLAB software, v. 2024b). According to the magnetic activity index (K) at the Güímar geomagnetic observatory, the days during data acquisition were considered magnetically quiet, except for 27 March 2025, which presented a slightly elevated K-index during midday hours (12 pm to 3 pm, with a K = 5 value). Diurnal corrections were considered unnecessary due to the short flight durations, the consequent minimal diurnal variations at low latitudes (Supplementary Figure S3), and the high dynamic range of the anomalies mapped, making this correction negligible in these cases [24]. Lag correction was not necessary since the positioning system used was attached to the drone legs. To correct residual heading errors, a conventional levelling procedure using the tie lines was performed with Oasis Montaj software v. 8.3 (Geosoft Inc., Toronto, ON, Canada). The largest cross-differences between tie and survey lines were observed in the survey block at 1142 m above sea level, where levelling corrections ranged from a minimum of 0.006 nT to a maximum of 105.522 nT, with the largest values located at the edges of the study area. These differences at line intersections exhibited patterns suggesting an association with residual heading errors. The levelling procedure effectively minimized these discrepancies, ensuring the consistency and reliability of the corrected magnetic dataset (Figure 3).
The TMI data was interpolated every 25 m using the kriging method, producing different maps according to the constant altitude at which measurements were taken: 1275 m (NE of the volcanic cone), 1142 m (central area containing the volcanic vents), 845 m, 758 m, 681 m, and 659 m (SW lava flows area) above sea level (Figure 1b). Legal and topographical constraints prevented uniform flight heights. As a result, upward continuation of the magnetic anomalies for the creation of a single map was discarded due to edge effects when performing the Fourier Fast Transform, and anomalies were processed accounting for independent height-controlled survey blocks. To minimize the impact of the different flight altitudes, only the blocks acquired at comparable elevations were used for the construction of the final anomaly map (Figure 4a), while the lower- and higher-altitude blocks were incorporated exclusively into the 3D inversion to ensure continuity of the model. This strategy allowed us to preserve the coherence of the anomaly patterns across the study area while taking advantage of the broader dataset for inversion purposes. Magnetic anomalies were calculated by subtracting the IGRF-14 model [43].

3.3. Magnetic Inversion

The modelling of magnetic anomalies was performed with the ZondGM3D software v. 2.0 (http://zond-geo.com/english/, accessed on 16 March 2024). We present a 3D magnetic susceptibility model that uses the entire dataset acquired at different altitudes to provide a comprehensive and complete view of the magnetic structures beneath the Tajogaite volcano.
The relief surface was included into the initial mesh, accounting for topographic effects on the magnetic anomalies. The topography data used for the magnetic inversion belongs to a 1 m-spatial resolution LiDAR data (IGN, 2023), from which a 1 m resolution Digital Surface Model (DSM) was generated using QGIS v. 3.40.4 [44]. The 3D initial model mesh for the inversion consisted of 169 × 144 horizontal cells spaced 25 m. The depth cells were divided into 18 vertical layers increasing by a factor of 1.25, starting with a top layer of 5 m thickness down to a depth of 1100 m below the surface. The starting magnetic susceptibility value of the numerical inversion was 100 × 10−4 (in cgs units) based on previously measured bulk susceptibility values in lava flows by [30]. Forward modelling was used to successfully test if this value was representative of such a large dynamic range of the magnetic field anomalies at the Tajogaite volcano. The inversion algorithm employed an L2-norm (Occam) regularization and was run for 10 iterations.
The magnetic susceptibility was calculated under the assumption that all magnetization in these volcanic rocks is induced and oriented on the direction of the current geomagnetic field (inclination = 36.9°, declination = −4.4° according to the IGRF-14 model. Thus, this modelling is considered a first scalar approach to solve the inverse problem and obtain magnetic susceptibility values. The same inducting direction was used for the calculation of the Reduction to the Pole (RTP) magnetic anomaly map (Figure 4b).
We also tested a 3D inversion using local anomalies obtained by removing a first-order regional trend from the original anomaly map (at 1142 m a.s.l., Figure 4a) to avoid masking short-wavelength signals in the main study area. The resulting anomaly map, 3D model, and associated error are provided in Supplementary Figures S4 and S5. Although this model achieved a better data fit (Supplementary Figure S4), we selected for interpretation the model based on the full dataset (including all survey blocks at different altitudes) as it offered a more consistent correlation with the geological framework.

4. Results

4.1. Magnetic Anomalies at the Tajogaite Volcano

Drone-based mapping provided a high-resolution aeromagnetic anomaly dataset at different altitudes over the Tajogaite volcano, after applying several corrections including downsampling, low-pass filtering, calibration, levelling adjustments, and removal of the IGRF geomagnetic intensity. This process revealed valuable methodological insights, which are discussed in the following section.
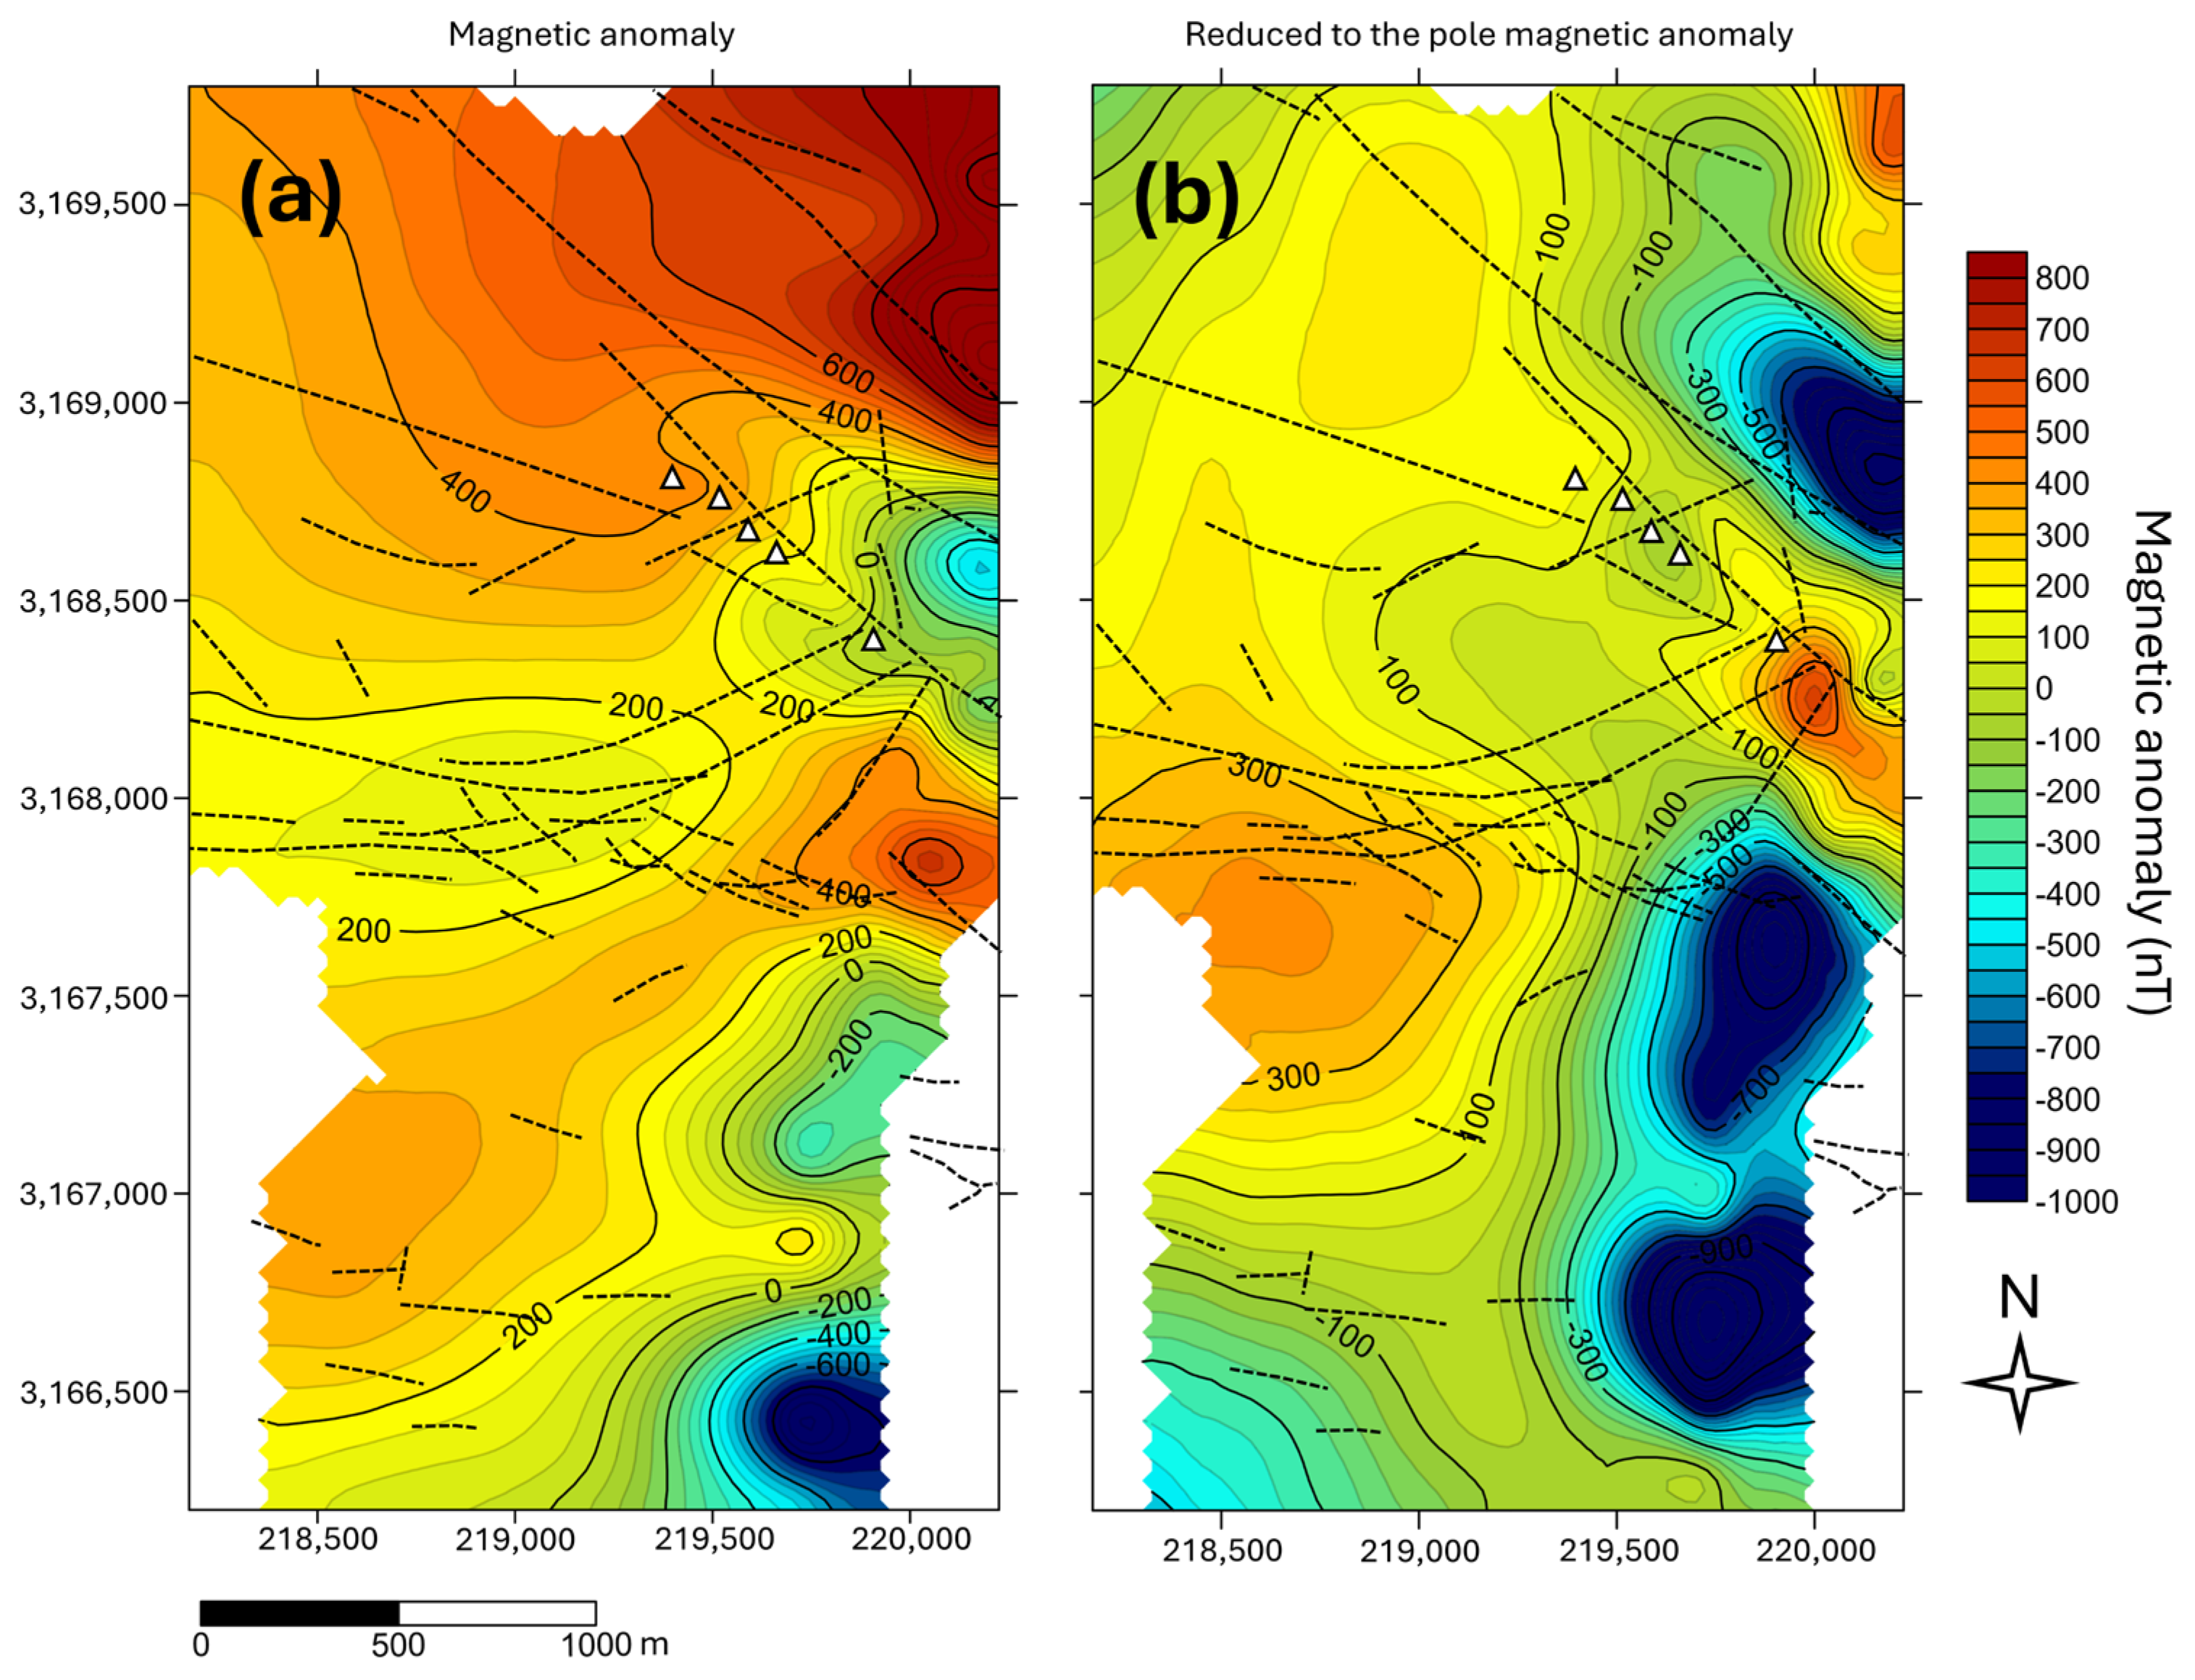
The measured drone-magnetic anomalies over the Tajogaite volcano range from −1000 nT to 1200 nT. The main map analyzed, acquired at 1142 m above sea level (Figure 4a), reveals both short-wavelength features such as those located immediately above the vents, and broader, long-wavelength anomalies. These broader anomalies extend to the North, ranging from −500 nT to 1200 nT, and to the South, ranging from −100 nT to 350 nT, likely reflecting underlying regional structural patterns. Strong spatial correlations between these anomalies and the fault systems [37] in this area are revealed. Additional anomalies observed at the edges of the survey area were excluded from the interpretation due to incomplete coverage and their probable association with older eruptive events, although a clear spatial correlation with the fault system [37] in this region is evident. The magnetic data are clearly influenced by the area’s steep topography (Figure 1b), as the measurements were conducted at a constant flight altitude. This is particularly evident in the very high intensities (e.g., 1200 nT) recorded on the eastern side of the surveyed area (Figure 4a), where the sensors were closer to the surface.
Since the Reduction to the Pole (RTP) transformation does not compensate for topographic effects, this influence is also noticeable in the RTP magnetic intensity map (Figure 4b). The most significant feature in the RTP is a monopolar, relatively negative magnetic anomaly (ranging from −50 to 0 nT) located directly above the volcanic vents.

4.2. Magnetic Susceptibility at the Tajogaite Volcano

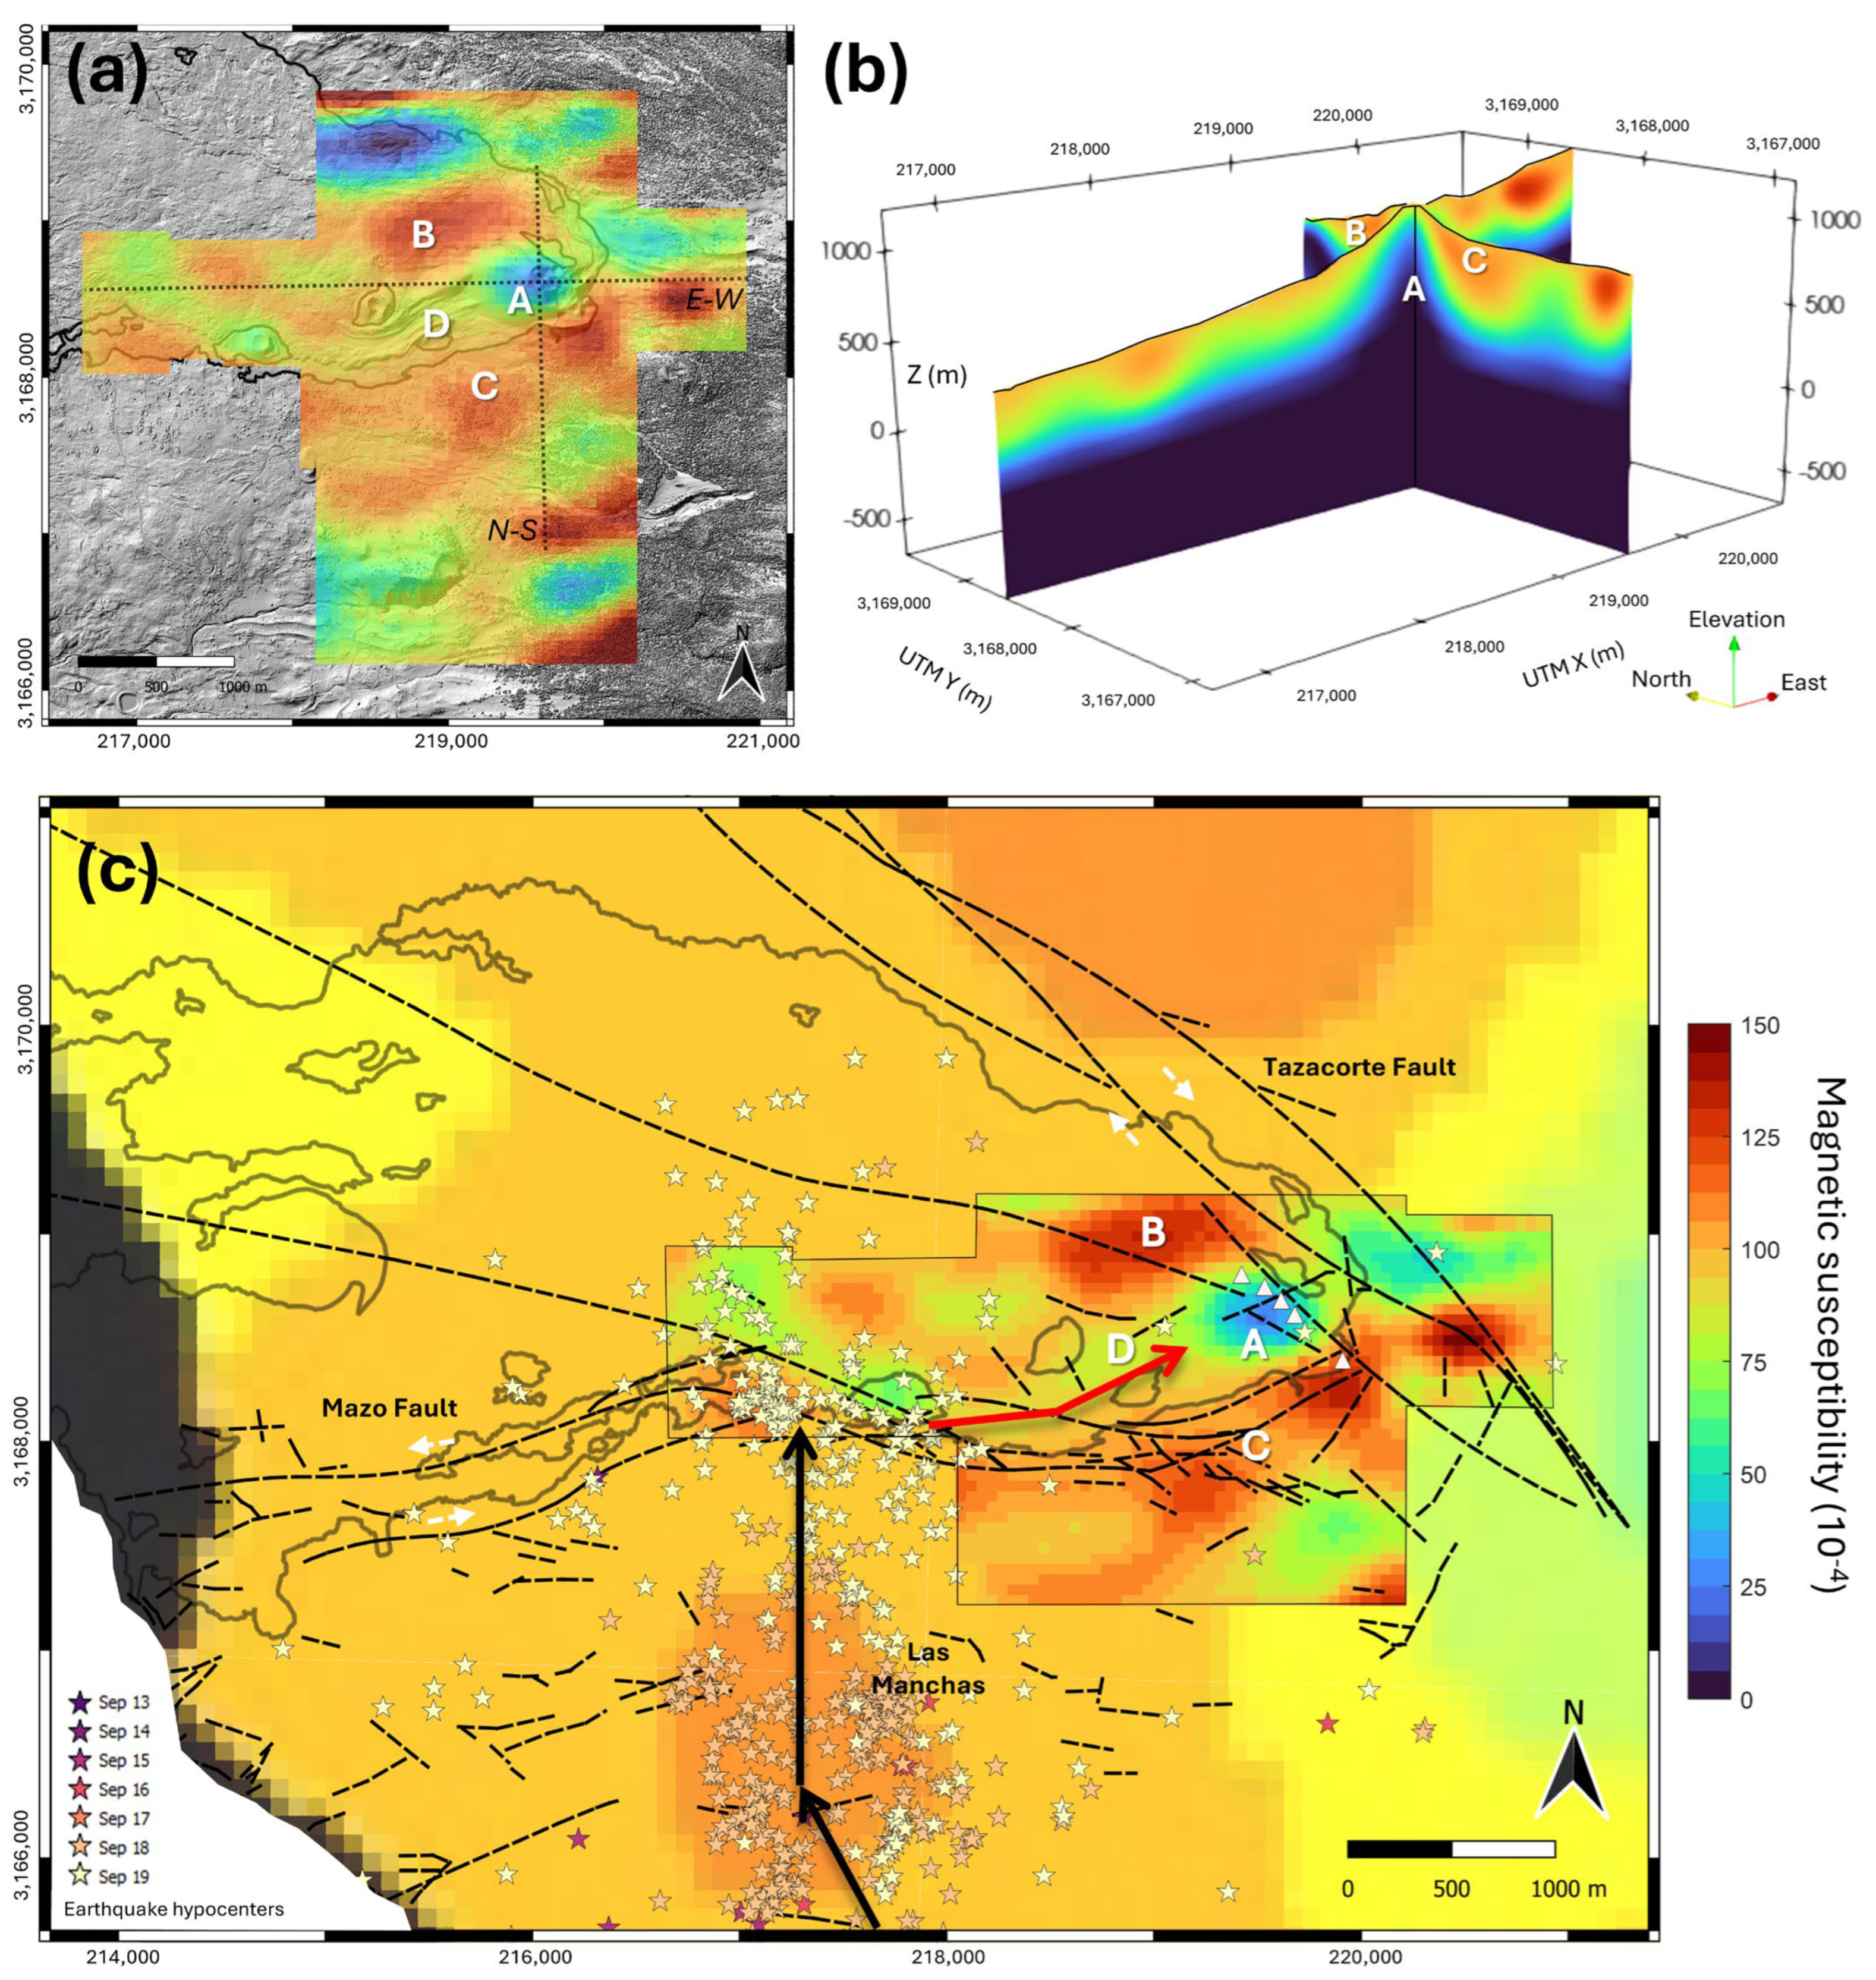
The resulting magnetic susceptibility distribution is shown in Figure 5. Figure 5a presents an oblique horizontal slice at approximately 50 m depth below the surface (following the topography), while Figure 5b shows two vertical cross-sections along N-S and E-W directions intersecting the main volcanic edifice. The feature labelled A is characterized by very low magnetic susceptibility values (0–25 × 10−4 in cgs units) in contrast with bodies labelled B and C, which exhibit significantly higher values (~130 × 10−4). In the oblique slice, the A body presents a clearly rounded geometry, while the surrounding B and C bodies display a clear westward elongated geometry. Additionally, the model reveals a fourth structure, labelled as D, that corresponds to a slightly lower-susceptibility zone (~75 × 10−4) right to the North of B. Overall, the maximum depth extent of the modelled structures is approximately 300 m below the surface, which is discussed in the next section.

5. Discussion

High-resolution drone-based magnetic surveying, combined with data inversion, offers strong horizontal sensitivity to map shallow subsurface structures [16]. This approach is therefore particularly well suited to address the current lack of detailed geophysical information within the uppermost part of the Tajogaite volcanic system. In this Discussion Section, we first address the methodological lessons learned when mapping a recently erupted area using unmanned aerial vehicles, followed by the structural interpretation derived from the magnetic data analysis and inversion.

5.1. Methodological Lessons on Drone Magnetometry over the Tajogaite Volcano

The methodology applied in this study highlights the drone-dependent nature of the induced magnetic noise, revealing persistent magnetic frequencies of 50 Hz in the June 2024 data collection, associated with the DJI Matrice 210 RTK drone operation, and 80 Hz in the March 2025 acquisition, associated with the DJI Matrice 300 RTK. However, this did not affect the merging of datasets acquired from different flights using different drones, as all frequencies above 1 Hz were filtered out, effectively isolating the magnetic signal related to the geology of the study area [39] and enabling reliable magnetic mapping. The main implication of this finding is the potential for fast and efficient magnetic mapping using multiple unmanned aerial vehicles operating simultaneously in different areas. This offers a notable operational advantage in time-critical survey scenarios where the survey area is large or if different drone models are available.
Another remarkable lesson from this methodology is the detection of distinct heading error patterns associated with each drone used in both acquisition dates, caused by the influence of the drone when flying in different directions. To address this issue, we suggest planning flight paths in a lawnmower pattern without changing the drone’s orientation at the end of each track line. This strategy would likely reduce striping effects when interpolating data between adjacent lines. If such heading noise patterns are detected after data acquisition, cloverleaf-shaped calibration flights can be used as a corrective technique [40]. However, acquiring low-gradient magnetic data for calibration purposes can be challenging in volcanic environments, where operational safety may also impose altitude restrictions.
The areas surrounding the main volcanic edifice were mapped nine months after the first acquisition (Figure 1a) due to time constraints. Despite the temporal offset, good continuity was observed in the measured magnetic anomalies, with a maximum difference of 9 nT in the overlapping zones of 2024 and 2025 where the flight altitude remained constant once levelling corrections were applied. Considering that the recorded magnetic anomalies in the study area range from −1000 nT to 1200 nT, potential variations in this magnitude in localized areas are not considered substantial on a regional scale. On the other hand, the lava flows associated with the eruption exhibit very slow cooling processes. Cooling down from 100 °C to 50 °C at a depth of 10 m would require 16–18 months according to the heterogeneous model by [21] based on borehole measurements. Therefore, any potential changes in the magnetic properties of the lava flows or underlying material between both data acquisition dates are considered negligible, as is their influence on the overall interpretation of the magnetic model.

5.2. Considerations into the Magnetic Modelling

Considerations should be given to the limitations inherent to the inversion method used in this study. Although the susceptibility values obtained from our model are consistent with bulk measurements from laboratory analyses of lava flow samples reported by Parés et al. [30] (130 × 10−4 in cgs units), tests performed on synthetic bodies using direct modelling demonstrated the relative nature of the recovered susceptibility values, which are highly dependent on the initial model value introduced (in this case, 100 × 10−4). For this reason, the resulting values should be regarded as relative with respect to the initial values, rather than absolute, comparable to those obtained directly in the field or in laboratory settings. Additionally, this modelling assumes that the remanent component of the total magnetization vector in the rocks is relatively small compared to the induced component. However, it is well documented that in volcanic environments such as Cumbre Vieja the ratio of remanent to induced magnetization (the Königsberger ratio) ranges between 1 and 54 [46]. Since the Tajogaite rocks cooled under the present-day geomagnetic polarity, the remanent and induced components are parallel, meaning that the total magnetization intensity increases without altering its direction. Under our purely induced assumption, this additional magnetization is misattributed entirely to magnetic susceptibility, leading to an overestimation of the recovered susceptibility values. Nevertheless, because the total-field vector remains parallel to the assumed induced field, the geometry and position of the interpreted bodies are not significantly affected. For this reason, the reported susceptibilities should be regarded as apparent maximum values that also incorporate the contribution from the remanent component. Finally, while the source depths inferred in our model suggest that at approximately 300 m below the surface, either the material remains sufficiently hot for magnetic structures to be absent, or the lateral extent of our map is insufficient to resolve deeper sources, it must be noted that depth resolution in magnetic inversion is inherently limited in the absence of independent constraints [16]. In this case, no such constraints could be incorporated to improve depth resolution due to the lack of complementary geophysical studies with such a high horizontal resolution as the acquired magnetic data, given the recent occurrence of this volcanic event.

5.3. Magnetic Signature of the Tajogaite Eruption

In the final stages before the Tajogaite eruption, previous studies on magma dynamics suggested northward migration from a shallow reservoir located at approximately 3 km depth below the populated area of Las Manchas, 36 h before the eruption (18 September) [6,32,33,34]. On 19 September, 14 h before the eruption, a cluster of earthquake hypocentres was detected about 2.5 km southwest of the eruptive vents, within the first 500 m b.s.l. [6] (see yellow stars in Figure 5c). This was the last seismic cluster identified before fissure opening. Structural analysis later revealed two fault systems, Tazacorte (NW-SE) and Mazo (ENE-WSW), that controlled the distribution of hypocentres and the location of effusive vents. Both systems were likely reactivated during the eruption [37], likely channelling magma. This context established the main objective of this work: to identify potential magma pathways based on magnetic anomalies, delineating conduits that may have facilitated magma ascent from the southwest of the vents during the shallowest pre-eruptive stage.
The magnetic anomaly map, along with the reduced-to-the-pole (RTP) anomaly map (Figure 4), reveal significant lateral variations in the magnetic field. The trends associated with these anomalies show a clear spatial correlation with the orientations of the Mazo and Tazacorte fault systems [37] (black dashed lines in Figure 5c). It is therefore reasonable to expect that the observed magnetic contrasts are generated by bodies influenced by these structures (e.g., [18,19,47]). To date, excluding the aerial mapping and relationship with seismicity, this fault system had not been highlighted by any other geophysical method.
The RTP transformation of magnetic anomalies is a standard procedure for enhancing the spatial source positions by correcting for the inclination and declination of the inducing geomagnetic field at the survey location and date. In this case, both the induced and remanent components of the total magnetic vector share the same orientation since it is a recently formed edifice, with an inclination of 36.9° and a declination of −4.4°, according to the IGRF-14 model. The RTP map effectively centres magnetic anomalies over their causative sources, removing the characteristic dipolar asymmetry [16]. Notably, the short-wavelength anomaly right above the volcanic cones that is aligned along the same NW–SE trend as the eruptive fissure, in the RTP map is shown as a relative negative monopole, with an intensity ranging from −50 to 0 nT. This observation is consistent with a strong magnetic susceptibility contrast between the eruptive centres whose material is still above the Curie point temperature owing to such a recent eruption, and their surroundings, at colder temperature. This type of magnetic signature is characteristic of active volcanic systems. For example, at Stromboli volcano, which last erupted in 2022, a magnetization low was also identified right over the eruptive centre, interpreted as demagnetization caused by thermal effects from conduits and hydrothermal activity [20]. Similarly, at Piton de la Fournaise volcano, which erupted in 2023 on La Réunion Island, the RTP map also reveals magnetic lows directly over the volcanic cone, attributed to hydrothermal circulation systems [48]. At Usu Volcano, in Japan, erupted in the 2000, showing similar features the authors concluded that the material under the volcanic edifice had not cooled enough to become strongly magnetized by the time the survey was conducted, few months after the eruption [49].
The magnetic susceptibility of ferromagnetic minerals, such as those identified in the new lava flows from the Tajogaite eruption [30,31], decreases with increasing temperature ideally according to Curie-Weiss’s law [50]. It also varies with magnetic grain size, which in turn may change depending on the lava cooling rate, or with the crystallization of new, weakly magnetic minerals within the rock, such as hydrothermally altered products [50]. However, in recently erupted volcanic environments, temperature-driven changes in magnetic susceptibility are the most likely source of variation. When the temperature of magnetic minerals exceeds their Curie point, they lose their ability to align with the ambient geomagnetic field, resulting in a significant reduction in their magnetic susceptibility [50]. As already suggested by the RTP anomaly map, structure A from our model (Figure 5a,b) can be interpreted as a vertically oriented (dyke) cylindrical body with lower magnetic susceptibility (0–25 × 10−4 in cgs units) relative to the surrounding areas (>100 × 10−4). Our model additionally suggests that this absence of magnetic properties lies at very shallow depths, extending to just a few metres beneath the surface (Figure 5a,b) thereby reinforcing this hypothesis. The slow cooling rates reported in lava flows [21], support the assumption that, at the time of the survey over the eruptive fissure (two years and 190 days after the eruption), both the subsurface conduits and the area immediately beneath the main cone likely remain at temperatures exceeding 200 °C (approximately the reported Curie temperature for these titanomagnetite [30]). Titanomagnetite rises this value to 580 °C at pure magnetite [31,50]). According to cooling models for lava flows [21], it would take between 3.36 and 3.97 years after the end of the eruption for the temperature at a depth of 10 m at 3 km from the vents to drop to 100 °C, likely below the Curie point reported in [30,31]. This corresponds approximately to the period between March and December 2025, suggesting that the lava flows are still cooling and acquiring their magnetic properties, while the sill or dykes associated with the eruption likely remain non-magnetized. Additionally, a previous magnetic monitoring study at the Tajogaite volcano detected a ~10 nT amplitude anomaly in time series associated with changes in the magnetization of rocks beneath the volcanic edifice, caused by magma intrusion and the circulation of hydrothermal fluids [5]. Magnetotelluric monitoring conducted months after the eruption also revealed low electrical resistivity values associated with magma ascent close to this area, consistent with the presence of molten material or hot hydrothermal fluids [4].
Longer wavelength anomalies in Figure 4a appear to be aligned with the Tazacorte and Mazo fault systems, which have been mapped at the surface [37]. Similar tectono-structural alignments have been observed in other recent volcanic systems, such as the Vulcano and Lipari islands, where a spatial correlation analysis revealed that the strike of magnetic anomalies, eruptive centres, and faults followed the same orientation [19]. According to our magnetic model in Figure 5, these anomalies are associated with bodies labelled B and C of high magnetic susceptibility structures surrounding the main cone (~130 × 10−4) along the same orientation as the faults, reaching a depth of approximately 500 m a.s.l., inferring that these magnetic sources are likely regionally influenced. A previous 3D magnetic susceptibility model of La Palma, based on a 1993 regional dataset, identified two high-susceptibility bodies (120 × 10−4–130 × 10−4) North of both sides of the Cumbre Vieja ridge, associated with the volcanic activity in La Palma around 125 ka [45]. One of these bodies, shown in Figure 5c as a contour background, is located beneath the 2021 eruption site and appears to control the mapped fault system and the eruption location. This high-susceptibility body extends both North of the Tazacorte fault and South of the Mazo fault, delineating the onset location. In this study, we correlate structures B and C with these regionally imaged, older bodies West of the Cumbre Vieja ridge [45] (Figure 5c).
To the North of the C body (Figure 5), a lower magnetic susceptibility feature (~75 × 10−4) is revealed, labelled as D, following the same orientation and connecting directly with the main cone area. Literature has long established that in fault zones and fissures acting as pathways for hot hydrothermal fluids, magnetite can be oxidized to hematite or mineral phases may be destroyed, reducing magnetic susceptibility along these conduits [50]. However, we considered that the eruptive event is very recent and followed our previously proposed hypothesis, which attributes the low susceptibility beneath the main vents to material above the Curie temperature. It is therefore reasonable to assume that the slight decrease in susceptibility observed at D may indicate the preferential pathway used by magma during the final stage prior to the eruption. This pathway, extending ~280 m wide (measured in the NW-SE direction), likely followed the orientation of the local Mazo fault system [37]. Similar magnetic patterns have been reported by other authors at different well-studied active volcanic systems such as Kīlauea (2018) and Bárðarbunga (2014) [51]. They show the evolution of magnetic signals associated with magma migration, reinforcing the interpretation that low magnetic susceptibility features reaching the surface, like those detected at the summit of the Tajogaite main cone, can be attributed to recent magma ascent. These signatures reflect the progressive cooling of potential dykes beneath distal areas, persisting at high temperature between 2.77 and 3.52 years after the eruption.
This study opens new lines of future research through the inversion of the total magnetization vector, explicitly considering the effects of remanent magnetization. It also proposes integrating constraints from other geophysical data, such as magnetotelluric data with sufficient shallow resolution to imaging structures associated with the formation of the new Tajogaite volcano. Moreover, this work highlights the potential for a future 4D study approach focused on monitoring the thermal state of the volcanic crust. This would be particularly valuable when new aeromagnetic data become available in the coming years, once rock magnetization stabilizes. These data would enable more accurate interpretations of mineral alteration processes within the volcanic system or dyke-associated susceptibility contrasts [16].
Our results highlight the potential of magnetic methods, particularly of drone-driven measurements, for imaging internal volcanic structures, and monitoring the thermal evolution of recently active systems. These insights are crucial for understanding post-eruptive dynamics with implications on hazard assessment, land use planning, and infrastructure management.

6. Conclusions

High-resolution aeromagnetic mapping was successfully conducted at the Tajogaite volcano using drones during the second and third years following the 2021 eruption on La Palma (Canary Islands), providing valuable insights into its shallow subsurface structure and late-stage magma migration.
Regarding the methodological approach, the survey revealed distinct high-frequency noise and heading error patterns associated with the use of different drones; however, these did not affect anomaly continuity after applying filtering, calibration, and levelling corrections. This demonstrates that faster magnetic data acquisition using two or more drones simultaneously is feasible, which is particularly advantageous when survey time is limited. The methodological insights provided in this study offer practical guidelines for future drone-based magnetic surveys in volcanic terrains. The magnetic anomalies and the derived 3D susceptibility model enabled the identification of key structures within the Tajogaite volcanic edifice. The results revealed a likely vertically oriented, still-hot conduit beneath the main eruptive vents, imaged as a very low-susceptibility body extending from shallow depths. Clear spatial correlations were established between magnetic anomaly lineaments and the Mazo and Tazacorte fault systems. Additionally, slightly reduced magnetic susceptibility values suggested a single NE–SW magma pathway aligned with the Mazo fault reaching the surface at the eruptive fissure, remaining thermally anomalous in 2024, two years and nine months post-eruption.
This study confirms the value of drone-based magnetic methods for imaging and monitoring recently erupted volcanoes such as the Tajogaite volcano, where high-resolution, low-altitude data acquisition is essential. It provides new, high-quality geophysical constraints on the eruptive dynamics and thermal evolution of the Tajogaite volcanic system.

Supplementary Materials

The following supporting information can be downloaded at: https://www.mdpi.com/article/10.3390/rs17183153/s1, Text S1: details on the heading correction; Figure S1: Magnetic anomaly calculated relative to the median value of the total magnetic intensity for the calibration pattern (sensor 2) acquired on 27 March 2025. Cloverleaf pattern as suggested by [40]. The black arrows show the direction of the drone operation; Figure S2: Summarized statistics for a representative flight conducted in 2025 over the lava flows. Red values correspond to the differences between back-and-forth paths for sensor 1 before and after calibration, and blue values correspond to sensor 2 before and after calibration. TMI stands for Total Magnetic Intensity. Figure S3: Geomagnetic field variation during 24 June 2024, recorded at the base station, 2.5 km from the eruptive vents. The maximum slope of correction using the linear trend is 9 nT/h. Figure S4: Differences between observed and calculated magnetic anomalies for the full dataset model (up) and the regionally corrected magnetic model (down). Local magnetic anomalies at 1142 m above sea level were calculated by removing a 1st order regional surface to the original map. Figure S5: Oblique slice at 50 m depth (following the topography) from the 3D magnetic susceptibility model obtained using the local magnetic anomalies (regionally corrected map at 1142 m above sea level).

Author Contributions

Conceptualization, F.M.-H., J.L. and M.C.R.-T.; methodology, F.M.-H., J.L. and M.C.R.-T.; software, M.C.R.-T.; validation, F.M.-H., J.L. and M.C.R.-T.; formal analysis, F.M.-H., J.L. and M.C.R.-T.; investigation, F.M.-H., J.L. and M.C.R.-T.; resources, F.M.-H. and J.L.; data curation, M.C.R.-T.; writing—original draft preparation, M.C.R.-T.; writing—review and editing, F.M.-H., J.L. and M.C.R.-T.; visualization, F.M.-H. and M.C.R.-T.; supervision, F.M.-H. and J.L.; project administration, F.M.-H. and J.L.; funding acquisition, F.M.-H. and J.L. All authors have read and agreed to the published version of the manuscript.

Funding

This research was funded by the European Union (NextGenerationEU/PRTR), and by the Spanish Ministry of Science and Innovation, State Research Agency (MCIN/AEI/10.13039/501100011033), through the projects GEOTHERPAL (TED2021-131882B-C41), CLIP (PID2023-148666NB-I00) and GIFT (PID2023-146964OB-C31). Additional funding was provided by the Comunidad de Madrid regional government through the predoctoral fellowship PIPF-2023/ECO-30212.

Data Availability Statement

The magnetic susceptibility model presented in this study is included in the Supplementary Material. Further inquiries can be directed to the corresponding author.

Acknowledgments

The authors are grateful for the research support provided by the Instituto Volcanológico de Canarias (INVOLCAN), which was essential for the development of this work. We thank David Martínez van Dorth and Víctor Ortega-Ramos for their assistance in the field. The authors are grateful to the Universitat de Barcelona and especially to Perla Piña-Varas for providing the magnetometer data from the base station.

Conflicts of Interest

The authors declare no conflicts of interest.

Abbreviations

The following abbreviations are used in this manuscript:
PEVOLCAPlan de Emergencias Volcánicas de Canarias
DInSARDiferential Interferometric Synthetic Aperture Radar
DSMDigital Surface Model
TMITotal Magnetic Intensity
STFTShort-Time Fourier Transform
LiDARLight Detection and Ranging
IGNInstitute Geográfico Nacional (Spanish National Geographic Institute)
RTPReduction to the Pole
IGRFInternational Geomagnetic Reference Field

References

  1. Mezcua, J.; Rueda, J. Seismic velocity variations observed prior to the La Palma volcano eruption on 19 September 2021, in Cumbre Vieja, Canary Islands (Spain). Seism. Rec. 2024, 4, 11–20. [Google Scholar] [CrossRef]
  2. Torres-González, P.A.; Luengo-Oroz, N.; Lamolda, H.; D’Alessandro, W.; Albert, H.; Iribarren, I.; Moure-García, D.; Soler, V. Unrest signals after 46 years of quiescence at cumbre vieja, la palma, Canary Islands. J. Volcanol. Geotherm. Res. 2020, 392, 106757. [Google Scholar] [CrossRef]
  3. Bonadonna, C.; Pistolesi, M.; Biass, S.; Voloschina, M.; Romero, J.; Coppola, D.; Folch, A.; D’Auria, L.; Martin-Lorenzo, A.; Dominguez, L. Physical characterization of long-lasting hybrid eruptions: The 2021 Tajogaite eruption of Cumbre Vieja (La Palma, Canary Islands). J. Geophys. Res. Solid Earth 2022, 127, e2022JB025302. [Google Scholar] [CrossRef]
  4. Piña-Varas, P.; Ledo, J.; Queralt, P.; van Dorth, D.M.; Marcuello, A.; Cabrera-Pérez, I.; D’Auria, L.; Martí, A. Volcanic monitoring of the 2021 La Palma eruption using long-period magnetotelluric data. Sci. Rep. 2023, 13, 15929. [Google Scholar] [CrossRef]
  5. Blanco-Montenegro, I.; Arnoso, J.; Sánchez, N.; Montesinos, F.G.; Gómez-Ortiz, D.; Nicolosi, I.; Vélez, E.; Benavent, M. Volcanomagnetic signals related to the 2021 Tajogaite volcanic eruption in the Cumbre Vieja rift (La Palma, Canary Islands). J. Volcanol. Geotherm. Res. 2024, 455, 108200. [Google Scholar] [CrossRef]
  6. Del Fresno, C.; Cesca, S.; Klügel, A.; Domínguez Cerdeña, I.; Díaz-Suárez, E.A.; Dahm, T.; García-Cañada, L.; Meletlidis, S.; Milkereit, C.; Valenzuela-Malebrán, C. Magmatic plumbing and dynamic evolution of the 2021 La Palma eruption. Nat. Commun. 2023, 14, 358. [Google Scholar] [CrossRef]
  7. Benito, M.; Alvarado, G.; Marchamalo, M.; Rejas, J.; Murphy, P.; Franco, R.; Castro, D.; Garcia-Lanchares, C.; Sanchez, J. Temporal and spatial evolution of the 2021 eruption in the Tajogaite volcano (Cumbre Vieja rift zone, La Palma, Canary Islands) from geophysical and geodetic parameter analyses. Nat. Hazards 2023, 118, 2245–2284. [Google Scholar] [CrossRef]
  8. Hernandez-Pacheco, A.; Valls, M. The historic eruptions of La Palma island (Canaries). Arquipél. Sér. Ciênc. Nat. 1982, 3, 83–94. [Google Scholar]
  9. Alcázar-Treviño, J.; Lara, G.; Suarez, E.D.; Bou, M.; Domínguez, I.; Buchan, S.; Domínguez, F.; Fraile-Nuez, E. Hydroacoustic sensing of seismic events during the Tajogaite volcanic eruption (La Palma, Spain). Sci. Rep. 2025, 15, 4137. [Google Scholar] [CrossRef]
  10. Fernández, J.; Escayo, J.; Hu, Z.; Camacho, A.G.; Samsonov, S.V.; Prieto, J.F.; Tiampo, K.F.; Palano, M.; Mallorquí, J.J.; Ancochea, E. Detection of volcanic unrest onset in La Palma, Canary Islands, evolution and implications. Sci. Rep. 2021, 11, 2540. [Google Scholar] [CrossRef]
  11. Fernández, J.; Escayo, J.; Prieto, J.F.; Tiampo, K.F.; Camacho, A.G.; Ancochea, E. Volcanic unrest after the 2021 eruption of La Palma. Geophys. Res. Lett. 2024, 51, e2024GL108803. [Google Scholar] [CrossRef]
  12. Fabbrizio, A.; Bamber, E.C.; Michailidou, E.; Romero, J.E.; Arzilli, F.; Bonechi, B.; Polacci, M.; Burton, M. Phase equilibrium experiments and thermodynamic simulations to constrain the pre-eruptive conditions of the 2021 Tajogaite eruption (Cumbre Vieja volcano, La Palma, Canary Islands). J. Volcanol. Geotherm. Res. 2023, 442, 107901. [Google Scholar] [CrossRef]
  13. Andújar, J.; Scaillet, B.; Frascerra, D.; Di Carlo, I.; Casillas, R.; Suárez, E.; Domínguez-Cerdeña, I.; Meletlidis, S.; López, C.; Slodczyk, A. Evolution of the crustal reservoir feeding La Palma 2021 eruption. Insights from phase equilibrium experiments and petrologically derived time scales. J. Volcanol. Geotherm. Res. 2025, 463, 108327. [Google Scholar] [CrossRef]
  14. Da Mommio, S.; Voloschina, M.; Coldwell, B.C.; Pérez, N.M.; Bonadonna, C.; Pistolesi, M. Eruptive dynamics of the 2021 Tajogaite eruption (La Palma, Canary Islands) as revealed by the physical and textural characterization of tephra. Bull. Volcanol. 2025, 87, 43. [Google Scholar] [CrossRef]
  15. Biagioli, E.; La Spina, G.; Polacci, M.; Bonechi, B.; Romero, J.E.; Burton, M. Numerical modeling integrated with field observations and analytical data of the 2021 Cumbre Vieja eruption improves understanding of eruption dynamics at mafic volcanoes. J. Geophys. Res. Solid Earth 2025, 130, e2024JB029692. [Google Scholar] [CrossRef]
  16. Hinze, W.J.; Von Frese, R.R.; Von Frese, R.; Saad, A.H. Gravity and Magnetic Exploration: Principles, Practices, and Applications; Cambridge University Press: Cambridge, UK, 2013. [Google Scholar]
  17. Barone, A.; Milano, M.; Fedi, M. Inhomogeneous magnetization of Tyrrhenian seamounts revealed from gravity and magnetic correlation analysis. J. Geophys. Res. Solid Earth 2024, 129, e2024JB028977. [Google Scholar] [CrossRef]
  18. Caracciolo, F.A.; Nicolosi, I.; Carluccio, R.; Chiappini, S.; De Ritis, R.; Giuntini, A.; Materni, V.; Messina, A.; Chiappini, M. High resolution aeromagnetic anomaly map of Mount Etna volcano, Southern Italy. J. Volcanol. Geotherm. Res. 2014, 277, 36–40. [Google Scholar] [CrossRef]
  19. De Ritis, R.; Chiappini, M. High resolution magnetic anomalies, volcanism and tectonics of the active “La Fossa” vulcanic system (Vulcano island) and Lipari Island (South Italy). J. Volcanol. Geotherm. Res. 2023, 438, 107823. [Google Scholar] [CrossRef]
  20. Okuma, S.; Stotter, C.; Supper, R.; Nakatsuka, T.; Furukawa, R.; Motschka, K. Aeromagnetic constraints on the subsurface structure of Stromboli Volcano, Aeolian Islands, Italy. Tectonophysics 2009, 478, 19–33. [Google Scholar] [CrossRef]
  21. González-de-Vallejo, L.; Álvarez-Hernández, A.; Ferrer, M.; Lockwood, J.P.; Pérez, N.M.; Hernández, P.A.; Miranda-Hardisson, A.; Rodríguez-Losada, J.A.; Afonso-Falcón, D.; de-los-Ríos, H. La Palma 2021 Eruption (Canary Islands): Measurements and Modelling of Lava Flow Cooling Rates and Applications for Infrastructure Reconstruction and Risk Mitigation. GeoHazards 2024, 5, 1093–1124. [Google Scholar] [CrossRef]
  22. Mercogliano, F.; Barone, A.; Esposito, G.; Accomando, F.; Vitale, A.; Gennarelli, G.; Castaldo, R.; Tizzani, P.; Catapano, I. ITINERIS Geophysical Technologies@ CNR-IREA: Drone-Based Tests at Altopiano di Verteglia, Avellino (Southern Italy). In Proceedings of the International Conference on Computational Science and Its Applications, Istanbul, Turkey, 30 June–3 July 2025; pp. 373–383. [Google Scholar]
  23. Gailler, L.; Labazuy, P.; Régis, E.; Bontemps, M.; Souriot, T.; Bacques, G.; Carton, B. Validation of a new UAV magnetic prospecting tool for volcano monitoring and geohazard assessment. Remote Sens. 2021, 13, 894. [Google Scholar] [CrossRef]
  24. Accomando, F.; Bonfante, A.; Buonanno, M.; Natale, J.; Vitale, S.; Florio, G. The drone-borne magnetic survey as the optimal strategy for high-resolution investigations in presence of extremely rough terrains: The case study of the Taverna San Felice quarry dike. J. Appl. Geophys. 2023, 217, 105186. [Google Scholar] [CrossRef]
  25. James, M.R.; Carr, B.; D’Arcy, F.; Diefenbach, A.; Dietterich, H.; Fornaciai, A.; Lev, E.; Liu, E.; Pieri, D.; Rodgers, M. Volcanological applications of unoccupied aircraft systems (UAS): Developments, strategies, and future challenges. Volcanica 2020, 3, 67–114. [Google Scholar] [CrossRef]
  26. Carracedo, J.C.; Badiola, E.R.; Guillou, H.; de la Nuez, J.; Pérez Torrado, F.J. Geology and volcanology of La Palma and El Hierro, Western Canaries. Estud. Geol. 2001, 57, 175–273. [Google Scholar] [CrossRef]
  27. Muñoz, V.; Walter, T.R.; Zorn, E.U.; Shevchenko, A.V.; González, P.J.; Reale, D.; Sansosti, E. Satellite radar and camera time series reveal transition from aligned to distributed crater arrangement during the 2021 eruption of Cumbre Vieja, La Palma (Spain). Remote Sens. 2022, 14, 6168. [Google Scholar] [CrossRef]
  28. Civico, R.; Ricci, T.; Scarlato, P.; Taddeucci, J.; Andronico, D.; Del Bello, E.; D’Auria, L.; Hernández, P.A.; Pérez, N.M. High-resolution digital surface model of the 2021 eruption deposit of Cumbre Vieja volcano, La Palma, Spain. Sci. Data 2022, 9, 435. [Google Scholar] [CrossRef]
  29. Pankhurst, M.J.; Scarrow, J.H.; Barbee, O.A.; Hickey, J.; Coldwell, B.C.; Rollinson, G.K.; Rodríguez-Losada, J.A.; Lorenzo, A.M.; Rodríguez, F.; Hernández, W. Rapid response petrology for the opening eruptive phase of the 2021 Cumbre Vieja eruption, La Palma, Canary Islands. Volcanica 2022, 5, 1–10. [Google Scholar] [CrossRef]
  30. Parés, J.M.; Vernet, E.; Calvo-Rathert, M.; Soler, V.; Bógalo, M.-F.; Álvaro, A. Rock Magnetism of Lapilli and Lava Flows from Cumbre Vieja Volcano, 2021 Eruption (La Palma, Canary Islands): Initial Reports. Geosciences 2022, 12, 271. [Google Scholar] [CrossRef]
  31. Calvo-Rathert, M.; Vernet, E.; Parés, J.M.; Soler, V.; Sánchez-Moreno, E.-M.; Bógalo, M.-F.; Carrancho, Á.; Yamamoto, Y.; Rodríguez-Méndez, L. Reliability of the palaeomagnetic signal recorded in a lava flow erupted on 4 December 2021 in La Palma (Canary Islands, Spain). Geophys. J. Int. 2024, 239, 841–861. [Google Scholar] [CrossRef]
  32. Suarez, E.; Domínguez-Cerdeña, I.; Villaseñor, A.; Aparicio, S.S.-M.; del Fresno, C.; García-Cañada, L. Unveiling the pre-eruptive seismic series of the La Palma 2021 eruption: Insights through a fully automated analysis. J. Volcanol. Geotherm. Res. 2023, 444, 107946. [Google Scholar] [CrossRef]
  33. Montesinos, F.G.; Sainz-Maza, S.; Gómez-Ortiz, D.; Arnoso, J.; Blanco-Montenegro, I.; Benavent, M.; Vélez, E.; Sánchez, N.; Martín-Crespo, T. Insights into the Magmatic Feeding System of the 2021 Eruption at Cumbre Vieja (La Palma, Canary Islands) Inferred from Gravity Data Modeling. Remote Sens. 2023, 15, 1936. [Google Scholar] [CrossRef]
  34. Fernández, J.; Escayo, J.; Camacho, A.G.; Palano, M.; Prieto, J.F.; Hu, Z.; Samsonov, S.V.; Tiampo, K.F.; Ancochea, E. Shallow magmatic intrusion evolution below La Palma before and during the 2021 eruption. Sci. Rep. 2022, 12, 20257. [Google Scholar] [CrossRef]
  35. De Luca, C.; Valerio, E.; Giudicepietro, F.; Macedonio, G.; Casu, F.; Lanari, R. Pre-and Co-Eruptive Analysis of the September 2021 Eruption at Cumbre Vieja Volcano (La Palma, Canary Islands) Through DInSAR Measurements and Analytical Modeling. Geophys. Res. Lett. 2022, 49, e2021GL097293. [Google Scholar] [CrossRef]
  36. Przeor, M.; Castaldo, R.; D’Auria, L.; Pepe, A.; Pepe, S.; Sagiya, T.; Solaro, G.; Tizzani, P.; Barrancos Martínez, J.; Pérez, N. Geodetic imaging of magma ascent through a bent and twisted dike during the Tajogaite eruption of 2021 (La Palma, Canary Islands). Sci. Rep. 2024, 14, 212. [Google Scholar] [CrossRef] [PubMed]
  37. Rodríguez-Pascua, M.Á.; Perez-Lopez, R.; Perucha, M.Á.; Sánchez, N.; López-Gutierrez, J.; Mediato, J.F.; Sanz-Mangas, D.; Lozano, G.; Galindo, I.; García-Davalillo, J.C. Active Faults, Kinematics, and Seismotectonic Evolution during Tajogaite Eruption 2021 (La Palma, Canary Islands, Spain). Appl. Sci. 2024, 14, 2745. [Google Scholar] [CrossRef]
  38. Copernicus Emergency Management Service. Activation EMSR546—La Palma Volcanic Eruption. 2023. Available online: https://mapping.emergency.copernicus.eu/activations/EMSR546/ (accessed on 5 June 2025).
  39. Accomando, F.; Vitale, A.; Bonfante, A.; Buonanno, M.; Florio, G. Performance of two different flight configurations for drone-borne magnetic data. Sensors 2021, 21, 5736. [Google Scholar] [CrossRef]
  40. Kaub, L.; Keller, G.; Bouligand, C.; Glen, J.M. Magnetic surveys with Unmanned Aerial Systems: Software for assessing and comparing the accuracy of different sensor systems, suspension designs and compensation methods. Geochem. Geophys. Geosyst. 2021, 22, e2021GC009745. [Google Scholar] [CrossRef]
  41. Accomando, F.; Florio, G. Applicability of Small and Low-Cost Magnetic Sensors to Geophysical Exploration. Sensors 2024, 24, 7047. [Google Scholar] [CrossRef]
  42. Walter, C.; Braun, A.; Fotopoulos, G. Characterizing electromagnetic interference signals for unmanned aerial vehicle geophysical surveys. Geophysics 2021, 86, J21–J32. [Google Scholar] [CrossRef]
  43. International Association of Geomagnetism and Aeronomy. IGRF-14. Zenodo. 2024. Available online: https://zenodo.org/records/14012303 (accessed on 5 June 2025).
  44. QGIS Team. QGIS Geographic Information System, version 3.40.4; Open Source Geospatial Foundation: Beaverton, OR, USA, 2025.
  45. Romero-Toribio, M.C.; Martín-Hernández, F.; Ledo, J. The Aeromagnetic Signature of the Tajogaite Volcano on La Palma Island, Canary Archipelago (Abstract AS25-0573). In Proceedings of the IAGA/IASPEI Joint Scientific Meeting 2025, Lisbon, Portugal, 31 August–5 September 2025; Book of Abstracts. CZECH-IN s.r.o.: Prague, Czech Republic, 2025; p. 136. [Google Scholar]
  46. Magli, A.; Del Carlo, P.; Di Roberto, A.; Giordano, G.; Meletlidis, S.; Pompilio, M.; Speranza, F. Age-clustered eruptive activity at La Palma (Canary Islands) during the last 4000 years: Evidence from paleomagnetic dating. J. Volcanol. Geotherm. Res. 2025, 462, 108328. [Google Scholar] [CrossRef]
  47. Lopez-Loera, H.; Urrutia-Fucugauchi, J.; Alva-Valdivia, L.M. Magnetic characteristics of fracture zones and constraints on the subsurface structure of the Colima Volcanic Complex, western Mexico. Geosphere 2010, 6, 35–46. [Google Scholar] [CrossRef]
  48. Dumont, M.; Peltier, A.; Roblin, E.; Reninger, P.-A.; Barde-Cabusson, S.; Finizola, A.; Ferrazzini, V. Imagery of internal structure and destabilization features of active volcano by 3D high resolution airborne electromagnetism. Sci. Rep. 2019, 9, 18280. [Google Scholar] [CrossRef]
  49. Okuma, S.; Nakatsuka, T.; Ishizuka, Y. Aeromagnetic constraints on the subsurface structure of Usu Volcano, Hokkaido, Japan. Explor. Geophys. 2014, 45, 24–36. [Google Scholar] [CrossRef]
  50. Dunlop, D.J.; Özdemir, Ö. Rock Magnetism: Fundamentals and Frontiers; Cambridge University Press: Cambridge, UK, 1997. [Google Scholar]
  51. Biasi, J.; Tivey, M.; Fluegel, B. Volcano monitoring with magnetic measurements: A simulation of eruptions at Axial Seamount, Kīlauea, Bárðarbunga, and Mount Saint Helens. Geophys. Res. Lett. 2022, 49, e2022GL100006. [Google Scholar] [CrossRef]
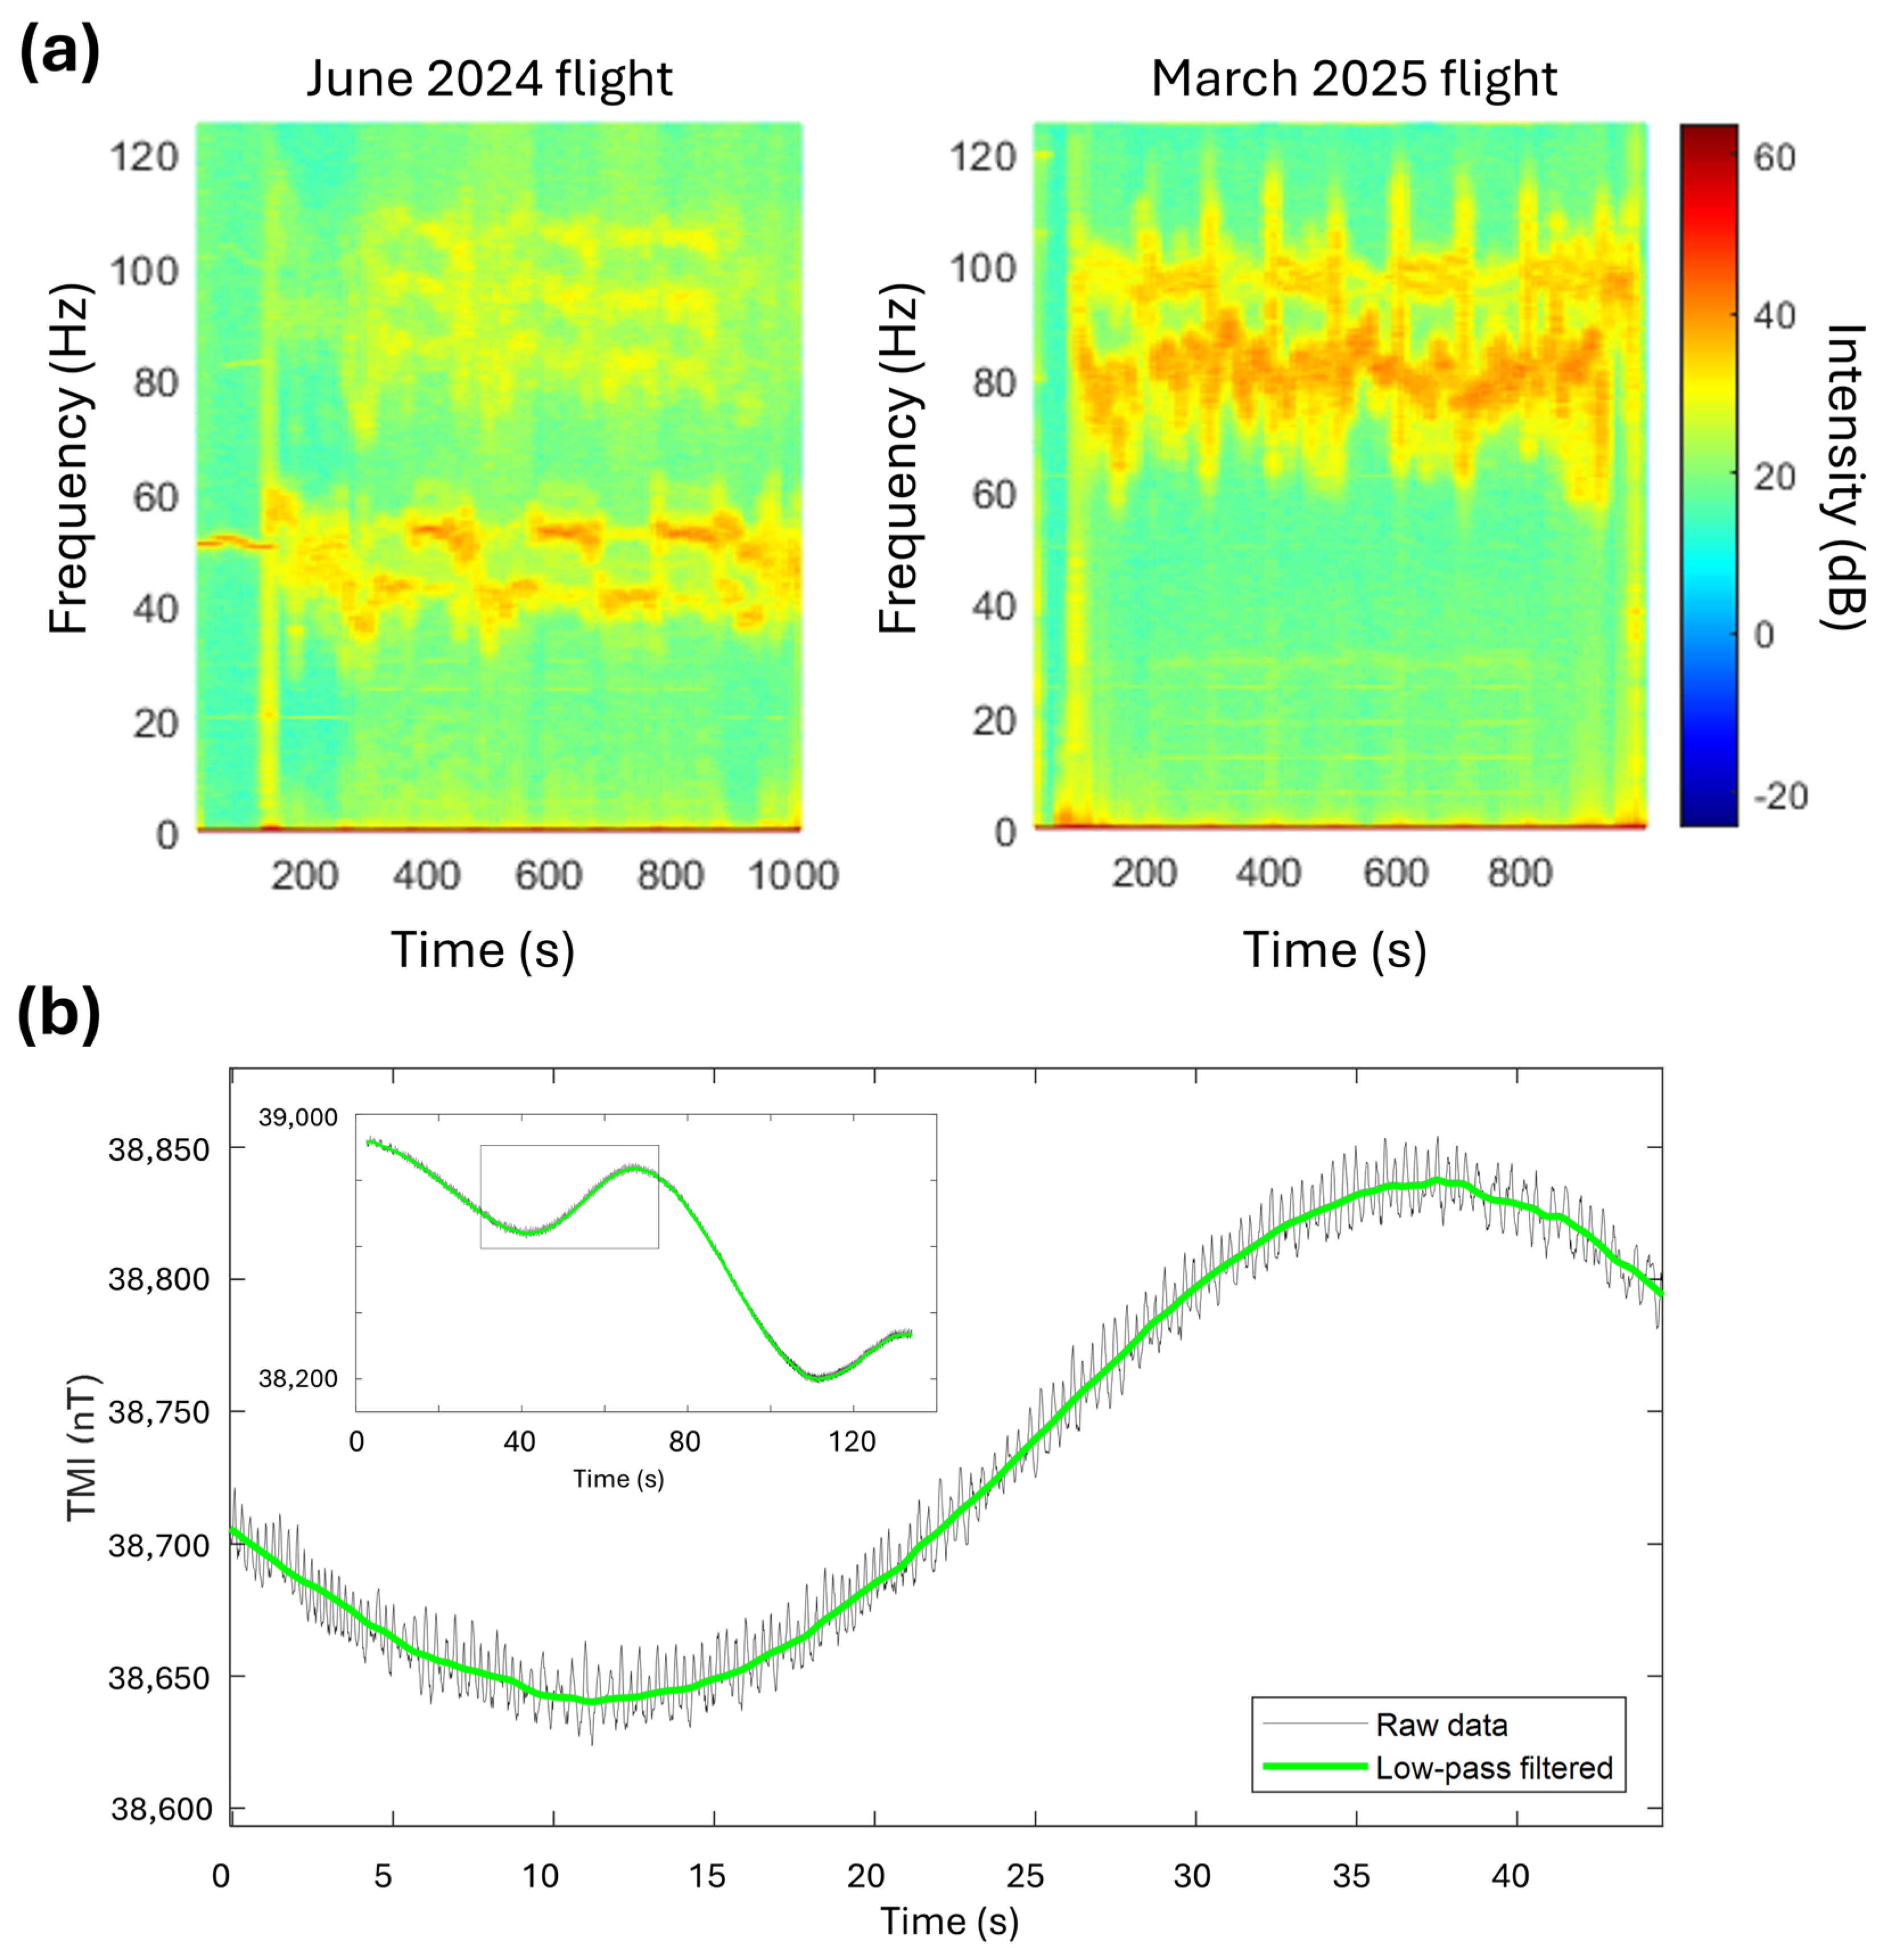
Figure 2. High-frequency noise analysis for representative flights examples. (a) STFT spectrograms for data acquired during a flight in June 2024 (drone DJI Matrice 210 RTK) and March 2025 (drone DJI Matrice 300 RTK). The signal around 50 Hz and 80 Hz is attributed to the drone’s rotor operation, which is different depending on the drone’s model; (b) Total Magnetic Intensity from an example of a flight track acquired during the 2025 acquisition South of the main volcanic edifice, and a 45 s zoomed-in fragment (rectangle), both before and after the application of a low-pass filter with a cut-off frequency of 1 Hz.
Remotesensing 17 03153 g002
Figure 3. Map of total magnetic intensity after corrections. Lava flows from December 2021 [38] are shown in dark grey.
Remotesensing 17 03153 g003
Figure 4. (a) Magnetic anomaly map at 1142 m a.s.l. after IGRF model removal; (b) Reduced to the pole magnetic anomaly map. Black dashed lines represent the fault systems (Mazo and Tazacorte) in the area [37]. White triangles show the eruptive vents on 20 September 2021 [27].
Remotesensing 17 03153 g004
Figure 5. Three-dimensional magnetic susceptibility model (a) at approximately 50 m depth (oblique slice following the topography) and (b) two vertical slices in the N-S direction (X = 219,500 m) and E-W direction (Y = 3,168,600 m) crossing the main volcanic unit. Black dotted line in (a) represents the profiles shown in (b); (c) Same oblique slice as (a) along with other geophysical datasets (only the interpreted features are shown, labelled with letters in all panels). Lava flows in December 2021 are outlined in thick grey and black lines [38] and white triangles indicate the eruptive vents on 20 September 2021 [27]. Stars represent the relocated earthquake hypocenters between 13 and 19 September 2021. Black arrows represent the path followed by magma before the onset [32] and the red arrow indicates the last stage magma path inferred in this study according to magnetic anomalies. The Mazo and Tazacorte fault systems are shown with black dashed lines [37]. The magnetic susceptibility 3D model at sea level from [45] appears as the background contour underlying the model slice. UTM 28 N coordinates are used in metres.
Remotesensing 17 03153 g005
Disclaimer/Publisher’s Note: The statements, opinions and data contained in all publications are solely those of the individual author(s) and contributor(s) and not of MDPI and/or the editor(s). MDPI and/or the editor(s) disclaim responsibility for any injury to people or property resulting from any ideas, methods, instructions or products referred to in the content.