Article

Assessing Spectral Reflectance in African Smallholder Cereal Farms Using Sentinel-2 Imagery

1
Department of Plant and Soil Sciences, Oklahoma State University, Stillwater, OK 74074, USA
2
African Plant Nutrition Institute, Nairobi P.O. Box 30772, Kenya
3
Department of Soil, Climate and Crop Sciences, University of Lome, Lome 01 BP 1515, Togo
4
National Institute of Field Crops, Bousalem 8170, Tunisia
5
Tanzania Agricultural Research Institute, Kigoma P.O. Box 132, Tanzania
*
Author to whom correspondence should be addressed.
Remote Sens. 2025, 17(18), 3135; https://doi.org/10.3390/rs17183135
Submission received: 20 June 2025 / Revised: 26 August 2025 / Accepted: 29 August 2025 / Published: 10 September 2025
(This article belongs to the Section Remote Sensing in Agriculture and Vegetation)

Abstract

Achieving food security in Africa requires the sustainable intensification of cereal production, particularly for wheat, rice, and maize, which form the foundation of daily caloric intake in Africa. Smallholder farmers, who dominate cereal production in Africa, face challenges such as low productivity, limited resources, and varying climatic conditions. Remote sensing, specifically through Sentinel-2 satellite imagery, offers a cost-effective method to monitor and improve farming practices. This study evaluates the possibility of extracting spectral reflectance curves of cereal crops from Sentinel-2 imagery across 68 smallholder farms in Togo, Tunisia, and Tanzania from 2021 to 2023. The farms ranged in size from 1 to 2 ha. We also assessed the separability of reflectance values following improved management practices (IPs), which included optimized seeding, fertilization, and pest control, and traditional farmers’ practices (FPs), which are typically characterized by inconsistent plant spacing and sub-optimal fertilization and pest management. Additionally, we analyzed regional variability in reflectance values to understand how climatic and management differences affect crop performance. Results showed that Sentinel-2 successfully captured spectral reflectance curves in all the countries and delineated management practice differences in Togo and Tunisia.

1. Introduction

Cereal crops, including wheat (Triticum aestivum), rice (Oryza sativa), and maize (Zea mays), are the cornerstone of global food security, providing essential nutrients and calories to billions of people [1]. These crops are particularly vital in Africa, accounting for 50% of the average daily caloric intake, with wheat, rice, and maize contributing 30%, 16%, and 20% of cereal calories consumed, respectively [2,3]. Despite their importance, most cereals are produced by smallholder farmers in fields smaller than two hectares, typically relying heavily on family labor and rainfall [4].
Smallholder farmers face numerous challenges that hinder productivity and sustainability such as limited land distribution, restricted market participation, and the necessity for increased productivity [5,6,7,8]. The fragmentation of land and lack of access to advanced agricultural technologies further exacerbate these challenges [9]. Limited market access often means smallholders cannot benefit from economies of scale or receive fair product prices [10]. Additionally, global agricultural subsidies, climate change, and soil degradation pose significant threats to their livelihoods. These constraints necessitate innovative solutions to enhance productivity and sustainability [11]. Another critical challenge faced by smallholder farmers is the scarcity of production-related information. With millions of smallholders operating diverse farming systems, traditional agricultural extension services are often insufficient to meet their needs [12,13]. Extension services, where they exist, can only reach a small fraction of growers, leaving many without access to vital information and support [14,15]. This gap in information dissemination can be bridged by remote sensing technologies, which offer cost-effective solutions for acquiring information needed to monitor and manage agricultural crops at scale [16].
Remote sensing technology, particularly Sentinel-2 imagery, offers a promising solution for enhancing agricultural practices for better productivity [17]. Sentinel-2, a satellite system launched by the European Space Agency (ESA), provides high-resolution imagery that can be used to monitor crop health, assess soil properties, and detect changes in land use [18]. For example, remote sensing can help smallholder farmers by providing early warnings of pest and disease outbreaks and optimizing irrigation schedules by assessing soil moisture levels [19]. These applications can significantly improve decision-making processes, leading to better resource management and increased crop yields. Furthermore, remote sensing can facilitate better land use planning and crop rotation strategies, enhancing soil fertility and the long-term sustainability of smallholder farms [11]. By analyzing historical yield data and soil conditions, remote sensing technologies can help farmers plan optimal crop rotations to maintain soil health and maximize productivity. This approach improves soil fertility and reduces the risk of pest and disease buildup, leading to more resilient farming systems [20]. Additionally, remote sensing can assist in identifying the most suitable crops for specific soil types and climatic conditions, further optimizing land use and ensuring sustainable agricultural practices [21].
A key component of remote sensing is the use of spectral reflectance curves (SRCs), which are graphical representations of how different plant and soil materials reflect electromagnetic radiation across various wavelengths. These curves serve as unique signatures for different materials, enabling their identification and analysis from satellite imagery. It has been demonstrated that SRCs can provide critical information about vegetation health and biomass vigor [22]. For instance, spectral vegetation indices, such as the Normalized Difference Vegetation Index (NDVI) and Carotenoid Reflectance Index (CRI), calculated from the spectral reflectance values derived from SRCs are effective in detecting maize diseases at various growth stages. Showing that these indices can reveal disease-related spectral variations makes them valuable for early disease detection and crop management [23]. In the context of nutrient management, research showed that the Ratio Vegetation Index (RVI) and Leaf Area Index (LAI) have been used to develop reference curves for detecting nitrogen stress in potatoes. These methods help guide nitrogen fertigation, ensuring optimal crop nutrition and improving yield [24]. Spectral reflectance data have also been applied to monitor water stress in oil palm seedlings where the research found that near-infrared reflectance spectra in the 900 to 1000 nm region can classify stress levels, providing early detection of water deficiency and aiding in efficient water management practices [25]. Additionally, it has been demonstrated that spectral vegetation indices have the potential to estimate green biomass in corn. Indices like the Enhanced Vegetation Index (EVI), Soil-Adjusted Vegetation Index (SAVI), and Optimized Soil-Adjusted Vegetation Index (OSAVI) have been found to correlate strongly with the photosynthetic vegetation sub-pixel fraction, making them reliable indicators of biomass and crop yield [26]. In rice cultivation, it has been shown that combining canopy spectral reflectance with RGB imagery from unmanned aerial vehicles (UAVs) improves the estimation of leaf chlorophyll content and grain yield. This multi-source approach enhances the accuracy of crop monitoring and supports precision agriculture practices [27].
However, most of the published analyses of spectral reflectance in farmlands have been conducted using fields significantly larger than what we find in the smallholder farms common to Africa [28]. This research gap highlights the need for studies that explore the potential of SRCs to provide detailed insights into crop health and management practices in smallholder farms of 1 ha or less. By filling this gap, we can better understand how remote sensing technologies can be tailored to meet the specific needs and the reality of African smallholder farmers. Moreover, the integration of remote sensing technologies into smallholder farming practices can lead to significant socio-economic benefits. By improving crop yields and reducing losses due to pests, diseases, and climate uncertainties, smallholder farmers can achieve higher incomes and better food security. The use of remote sensing data can support government and non-governmental organizations in designing targeted interventions and policies to support smallholder farmers, ensuring that resources are allocated efficiently and effectively.
Therefore, the objectives of this study were as follows:
  • Determine the effectiveness of Sentinel-2 in extracting spectral reflectance values from African smallholder cereal farms (1 ha or smaller).
  • Assess the capability of Sentinel-2 spectral reflectance to detect differences in crop yield potential at the smallholder scale.

2. Materials and Methods

2.1. Site Selection

This study was conducted on smallholder farms in Tanzania, Togo, and Tunisia from 2021 to 2023 (Figure 1). These countries were selected to capture the effects of variations in climate, soil properties, and cropping systems on the vigor of maize, wheat, and rice crops, and how these variations are reflected in their SRCs. The study sites span diverse agroecological zones, providing a robust framework for examining regional and crop-specific variability in spectral signatures.
In Togo, 20 smallholder maize farm sites were monitored over the 2022 and 2023 cropping seasons in the Savannah and Central regions. These regions exhibit distinct climatic regimes: the Central region has a tropical climate with mean annual precipitation of 1200 mm, while the Savannah region, influenced by the Sahara, experiences semi-arid conditions with mean annual precipitation not exceeding 890 mm [29]. Maize cultivation dominates the agricultural landscape in Togo, occupying over 700,000 hectares and constituting 40% of the country’s total cropland [30]. The study sites represent typical farm sizes for the region, ranging from 1 to 5 hectares. Maize yields in Togo vary significantly, with national averages around 1.2 to 1.5 t/ha, compared to potential yields of 4 to 5 t/ha, indicating substantial yield gaps [31].
In Tunisia, 20 wheat farm sites were evaluated during the 2021–2022 growing season across major wheat-producing regions, including Kairouan, Amdoun, Beja-Nord, Jdaida, Mornagnia, and Teboursek. These sites represent diverse water management strategies, ranging from irrigated systems in Kairouan, characterized by a subtropical climate with mean annual precipitation of 287 mm, to rainfed systems in other regions dominated by arid conditions with less than 100 mm annual precipitation [32]. Wheat cultivation is significant in Tunisia, with grain production extending across 1.7 million hectares, occupying 43% of the utilized agricultural area [33]. The study sites encompassed a range of farm sizes, from 2 to 10 hectares. Wheat yields in Tunisia average around 1.5 to 2 t/ha, with potential yields of 5 to 6 t/ha under optimal conditions [33].
In Tanzania, eight rice farm sites managed under irrigation were monitored during the 2023 growing seasons in the Kigoma region, a key agricultural area with a tropical climate and mean annual precipitation of 200 mm [34]. Rice farming is the second most important food crop in Tanzania after maize, with over 1.5 million hectares dedicated to its cultivation. However, productivity remains low, averaging between 0.7 and 3.3 t/ha, compared to the global average of 4.5 t/ha [35]. The study sites in Tanzania were selected to represent typical smallholder rice farming systems, with plot sizes averaging 0.5 hectares.
The diversity of these study areas, spanning West, North, and East Africa, provides a robust framework for examining the variation in SRCs across different regions and agroecological zones. The selection of maize, wheat, and rice as focal crops reflects their importance in African smallholder farming systems and their varying spectral responses to environmental and management factors. By evaluating these crops in distinct climatic and management contexts, this study aims to provide insights into the potential of Sentinel-2 imagery for monitoring smallholder cereal production across diverse agroecological conditions.

2.2. Study Design

In addition to exploring the potential of Sentinel-2 to generate SRCs in smallholder fields, this study aimed to assess whether these SRCs can effectively capture differences in yield potential at a small scale. To achieve this, two sets of management practices were implemented on each site. Each site was divided into two equal plots (approximately 1 ha each in Tunisia and Togo and 0.5 ha each in Tanzania), with one plot receiving traditional farmer practices (FPs) influenced by local customs and resource constraints. These practices typically result in inconsistent planting densities and spacing, insufficient fertilizer application, limited pest control and thinning, and reliance on manual labor, resulting in variable crop management across the field. The other plot in each field received a set of improved management practices (IPs), which included optimized planting density, timely and adequate fertilization, consistent weeding and thinning, and proactive pest control. The hypothesis underpinning these two sets of practices was that the IP areas, with their optimized and consistent management, would generate SRCs that closely reflect the expected curves indicative of well-managed crops. Conversely, the FP areas, with their variability in inputs and management, were expected to produce more inconsistent SRC responses, reflecting less-than-optimum crop health and development.

2.3. Ground Data

The scouting and grain yield sampling strategy involved dividing each plot into nine equally sized subplots, measuring approximately 1111 m2 in the wheat and maize plots and 555 m2 in the rice plots. The nine subplots were further divided into four smaller sub-sections, resulting in thirty-six sampling points per plot. Grain yield data were collected by hand-harvesting a 1 m2 area from each sub-section for the wheat and rice sites in Tunisia and Tanzania, respectively, while a 4.5 m2 harvest area was used for the maize sites in Togo. The corresponding geographic coordinates from each harvest area were recorded to align with satellite data for reference and calibration. Crop scouting was also performed at each site three to four times during the growing season to take note of stand density, weed pressure, and other factors that might affect SRC responses. This approach provided a granularity of ground-truthing, allowing for a detailed evaluation of the relationship between spectral reflectance and crop performance.

2.4. Satellite Data

Sentinel-2 features a multispectral instrument (MSI) that captures data across 13 spectral bands, ranging from the visible to the shortwave infrared part of the spectrum. Specifically, it measures reflectance in the blue, green, red, and near-infrared 1 bands at 10 m resolution; the red-edge 1–3, near-infrared 2, and shortwave infrared 1 and 2 bands at 20 m resolution; and three atmospheric bands (Band 1, Band 9, and Band 10) at 60 m resolution [36]. The three atmospheric bands were not used in this study as they are primarily dedicated to atmospheric corrections and cloud screening. Sentinel-2 provides a revisit time of approximately five days at the equator, enabling frequent monitoring of crop conditions and timely detection of changes in reflectance properties. The imagery dates used for the analyses were selected to match the late vegetative or early reproductive stages of each crop in the respective countries. However, due to frequent cloud cover during the growing seasons in Togo and Tanzania, the number of dates where images were available for all sites was reduced to 1 to 2 per season. In contrast, Tunisia’s arid climate provided an average of 5 images per season, covering the vegetative stage more comprehensively. The spectral data were accessed and preprocessed using the analysis sandbox tool in the Digital Earth Africa (DEAfrica) Platform, which is a cloud-based computational platform operating in a Jupyter Lab environment [37]. Cloud coverage tolerance was set at 10%.

2.5. Spectral Reflectance Curves

The reflectance values were extracted using ArcGIS Pro 3.4.0 software using the Zonal Statistics tool in the Spatial Analyst toolbox. Python 2.7.16 was then used to calculate the average surface reflectance values for the plots and generate the SRCs. The SRCs were analyzed to compare the variability between IP and FP, highlighting how different crop management approaches impact surface reflectance properties. Additionally, the variability of SRCs within the IP plots was examined across different regions to understand how varying soils and climates affect the SRCs of the different crops.

2.6. Statistical Analysis

We conducted a three-level statistical analysis to evaluate spectral reflectance differences between plots managed with improved practices (IPs) and farmer practices (FPs) for each crop. First, independent-sample t-tests were used to assess mean reflectance differences across ten spectral bands (blue, green, red, RE1–RE3, NIR1–NIR2, SWIR1–SWIR2), with effect sizes calculated using Cohen’s d and statistical significance evaluated at α = 0.05. Second, although six intraclass correlation coefficient (ICC) models—ICC(1), ICC(2), ICC(3), and their average-measure forms ICC(1k), ICC(2k), and ICC(3k)—were initially considered to quantify measurement reliability between IP and FP plots, the ICC(3k) model was ultimately selected as the primary indicator of consistency due to its robustness and ease of interpretation. Third, for countries with multiple IP regions (Togo and Tunisia), regional analyses were conducted using t-tests and Cohen’s d to compare spectral reflectance among those zones.

3. Results

3.1. Spectral Reflectance of Maize, Wheat, and Rice

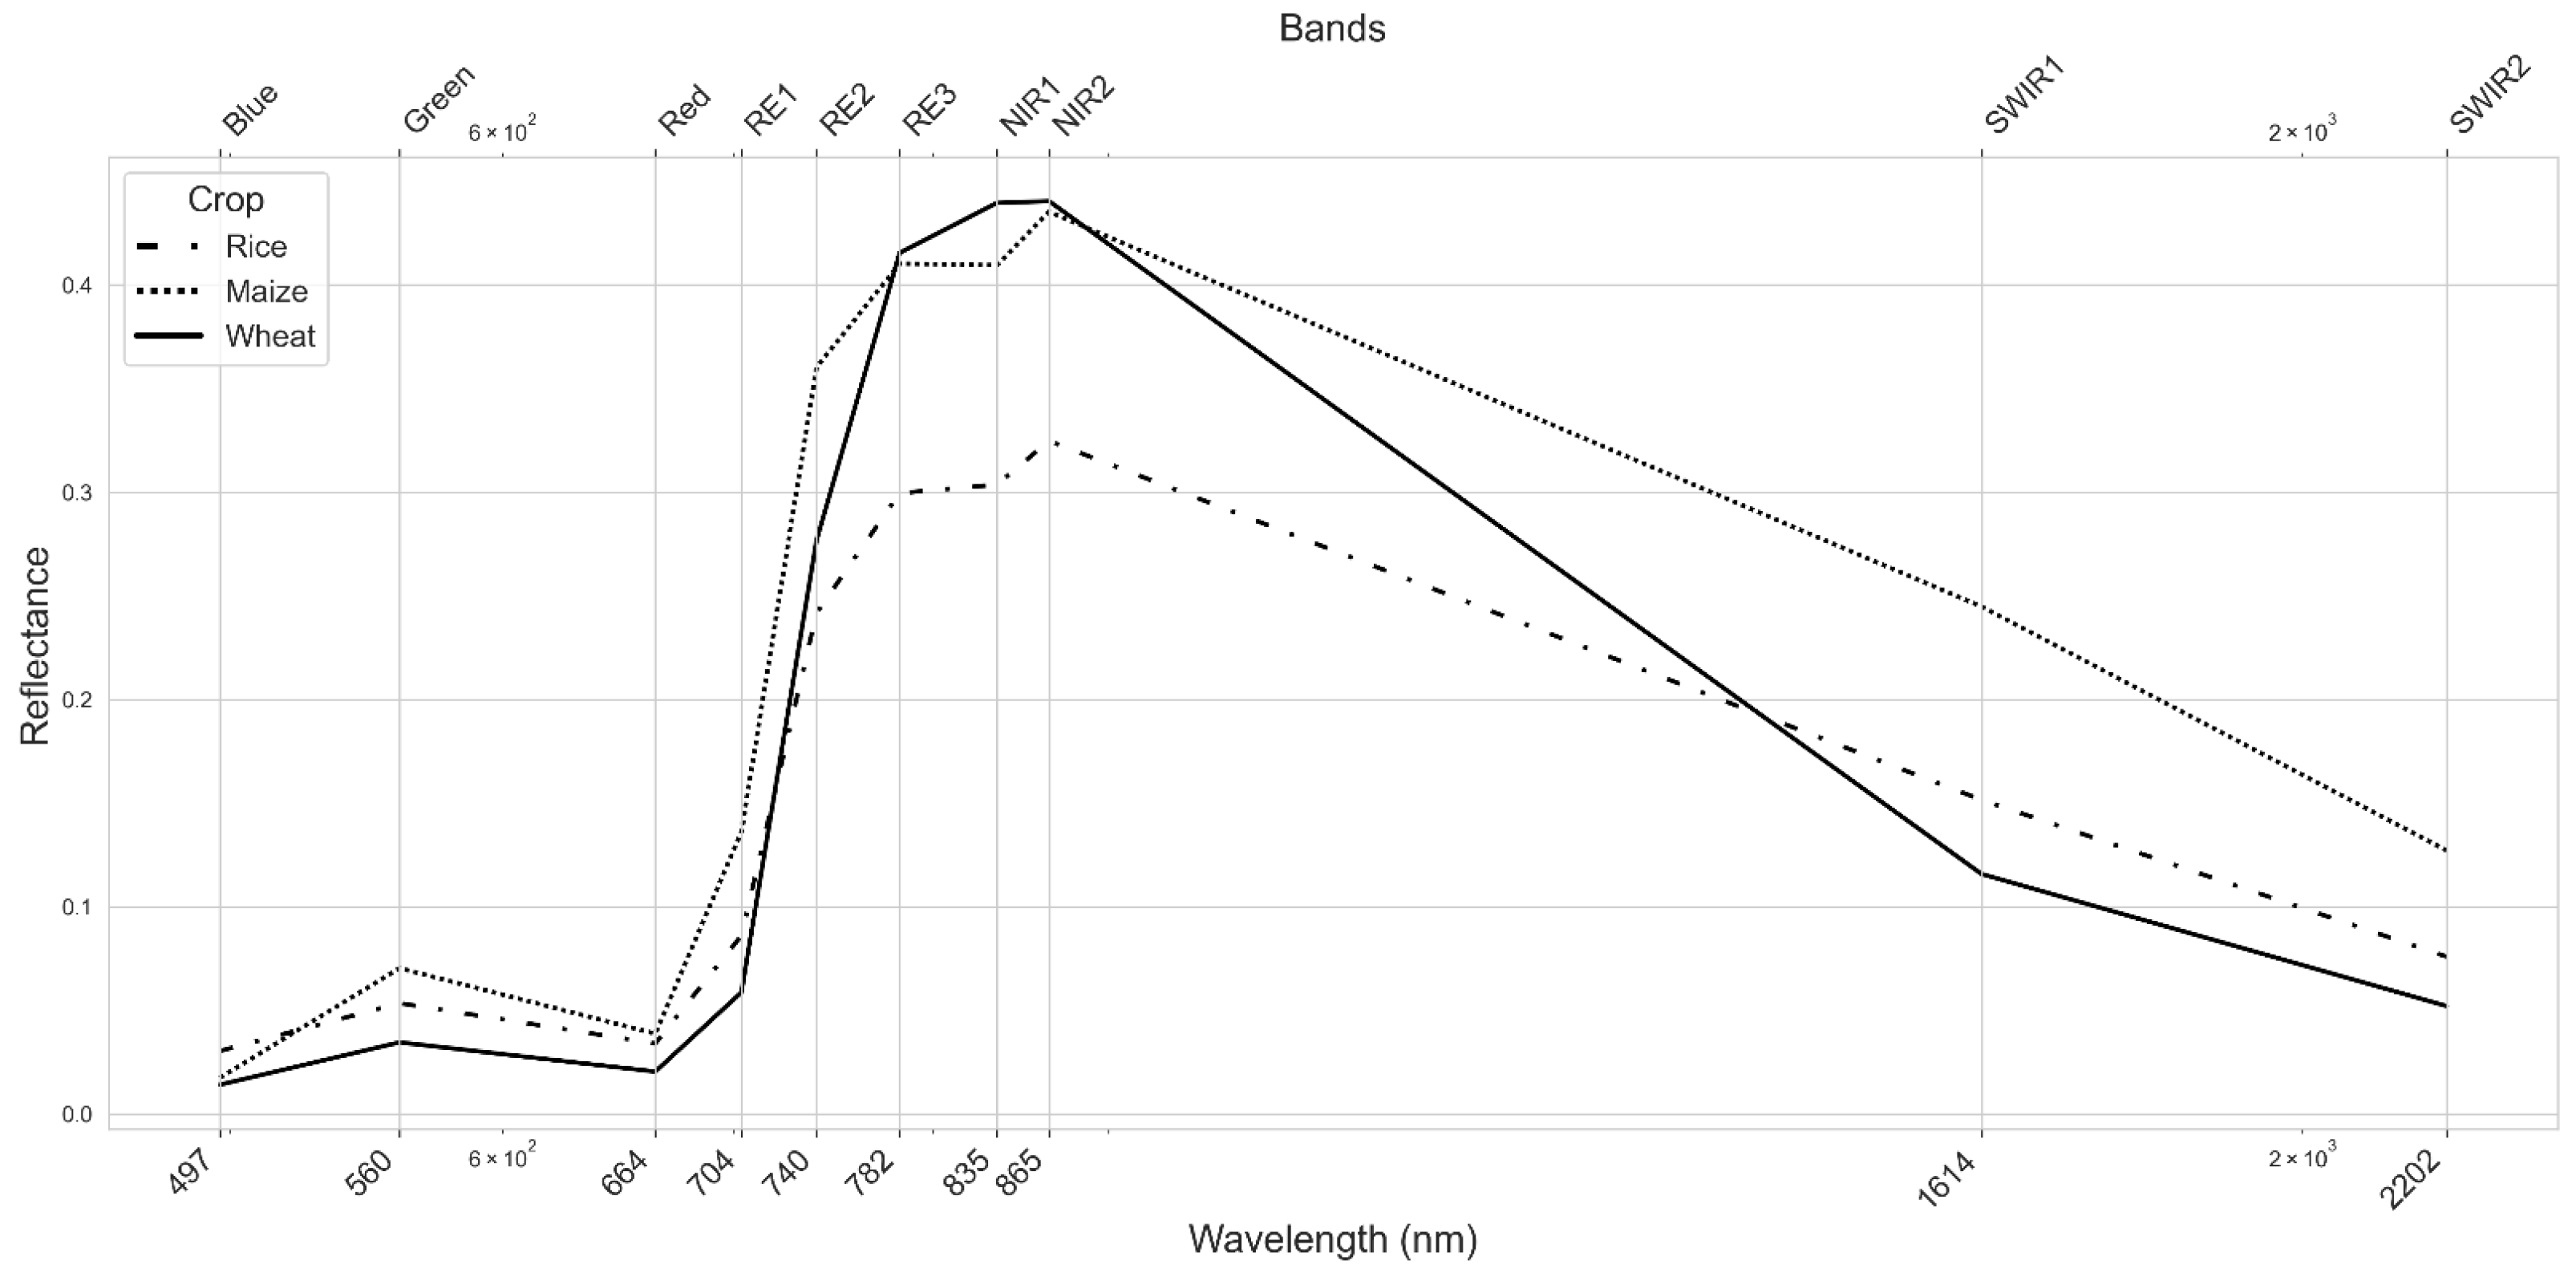
The SRCs of maize, rice, and wheat collected during the late vegetative to early reproductive developmental stages from the IP plots revealed distinct separability across spectral regions (Figure 2). In the visible range, rice exhibited the highest blue reflectance, while maize had stronger signals in the green and red bands. In the red-edge region, maize dominated RE1 and RE2, whereas wheat peaked at RE3. Wheat also showed the highest NIR1 reflectance, with maize being slightly lower and rice reflectance being significantly lower than the other two crops. The strongest crop differentiation occurred in the SWIR region, where maize reflectance was highest, followed by rice and then wheat. Effect size analysis supported these observations, with the greatest separation between maize and wheat in SWIR2 (ES = 0.838).

3.2. Spectral Reflectance of Maize

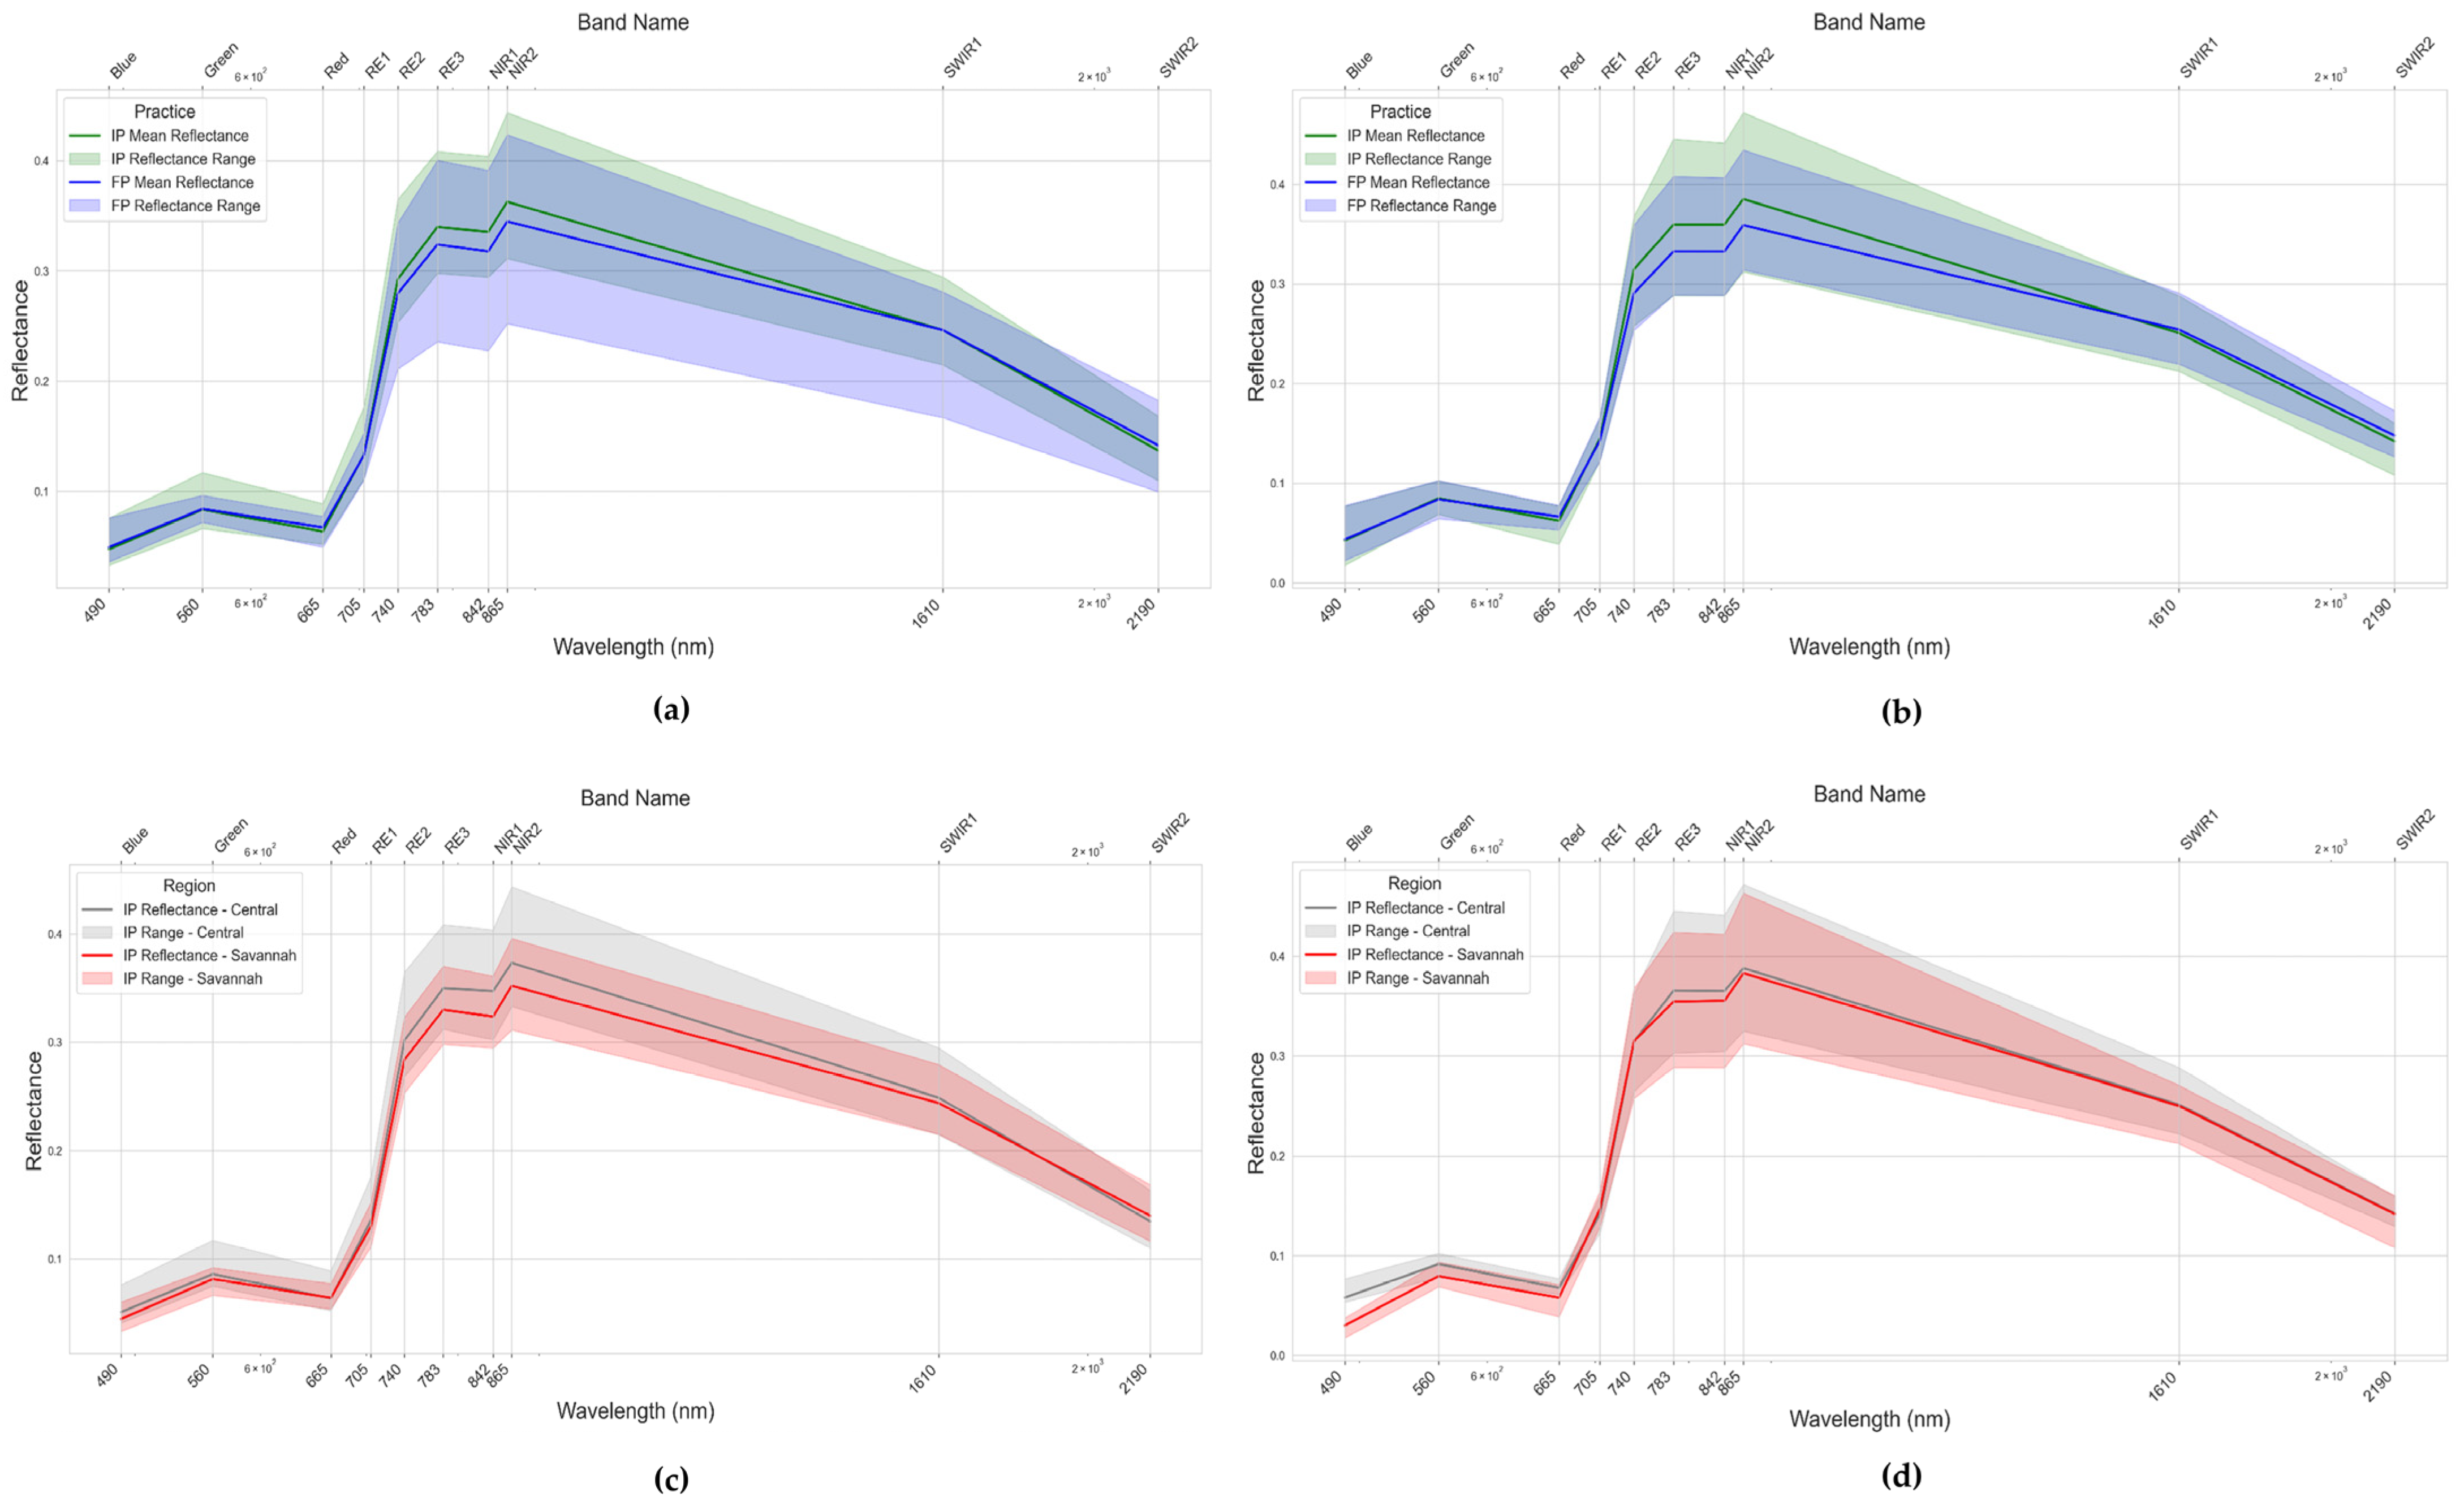
During the early reproductive stages of maize (R1–R2) in 2021, SRCs revealed consistently higher reflectance under IP compared to FP, particularly in the red-edge and NIR regions (Figure 3a). The largest differences were RE3 and NIR1, while minimal variation was observed in the visible and SWIR bands. Measurement reliability in 2021 was high in the blue band (ICC3k = 0.97) but poor in red-edge and NIR bands (ICC3k < 0.5). In 2022, the spectral contrast between practices was more pronounced, with a significant difference in RE2 (p = 0.039, Cohen’s d = 0.718), and marginal differences in RE3 and NIR1 (p < 0.07; d > 0.63), while SWIR bands remained similar (Figure 3b). Intraclass correlation coefficients in 2022 improved markedly across all bands (ICC3k > 0.85), confirming strong measurement consistency. Regionally, no significant differences were observed in 2021 (Figure 3c); however, in 2022, blue reflectance in the Central region rose significantly (p < 0.001, d = −3.451), with notable increases in green and red bands (p < 0.05; Figure 3d). Red-edge and NIR differences remained stable but non-significant, and SWIR bands showed minimal regional variation across years.

3.3. Spectral Reflectance of Wheat

In Tunisia, spectral profiles of IP and FP plots displayed largely overlapping patterns across all bands, with no statistically significant differences observed (Figure 4a). Vegetation-sensitive bands such as RE3 and NIR1 exhibited slightly higher reflectance under IP, though effect sizes remained small (Cohen’s d < 0.36), indicating negligible practical differences. Visible and SWIR bands similarly showed minimal variation between practices. Measurement reliability was consistently high, with ICC values exceeding 0.89 across all bands, and reaching above 0.95 in red-edge and NIR regions, confirming strong spectral measurement consistency.
In contrast, regional analysis of IP plots revealed significant spectral differences (Figure 4b). Amdoun, Beja-Nord, and Kairouan consistently exhibited the highest reflectance in vegetation-sensitive bands, particularly RE3, NIR1, and NIR2, with very large effect sizes (Cohen’s d > 11.7, p < 0.05), indicating superior canopy vigor relative to the other regions (Figure 4b). SWIR2 reflectance was significantly elevated in Mornaguia, while Teboursek showed markedly lower reflectance across all vegetation-indicative wavelengths (Figure 4b), suggesting that there may be regional disparities in reflectance resulting more from environment than management.

3.4. Spectral Reflectance of Rice

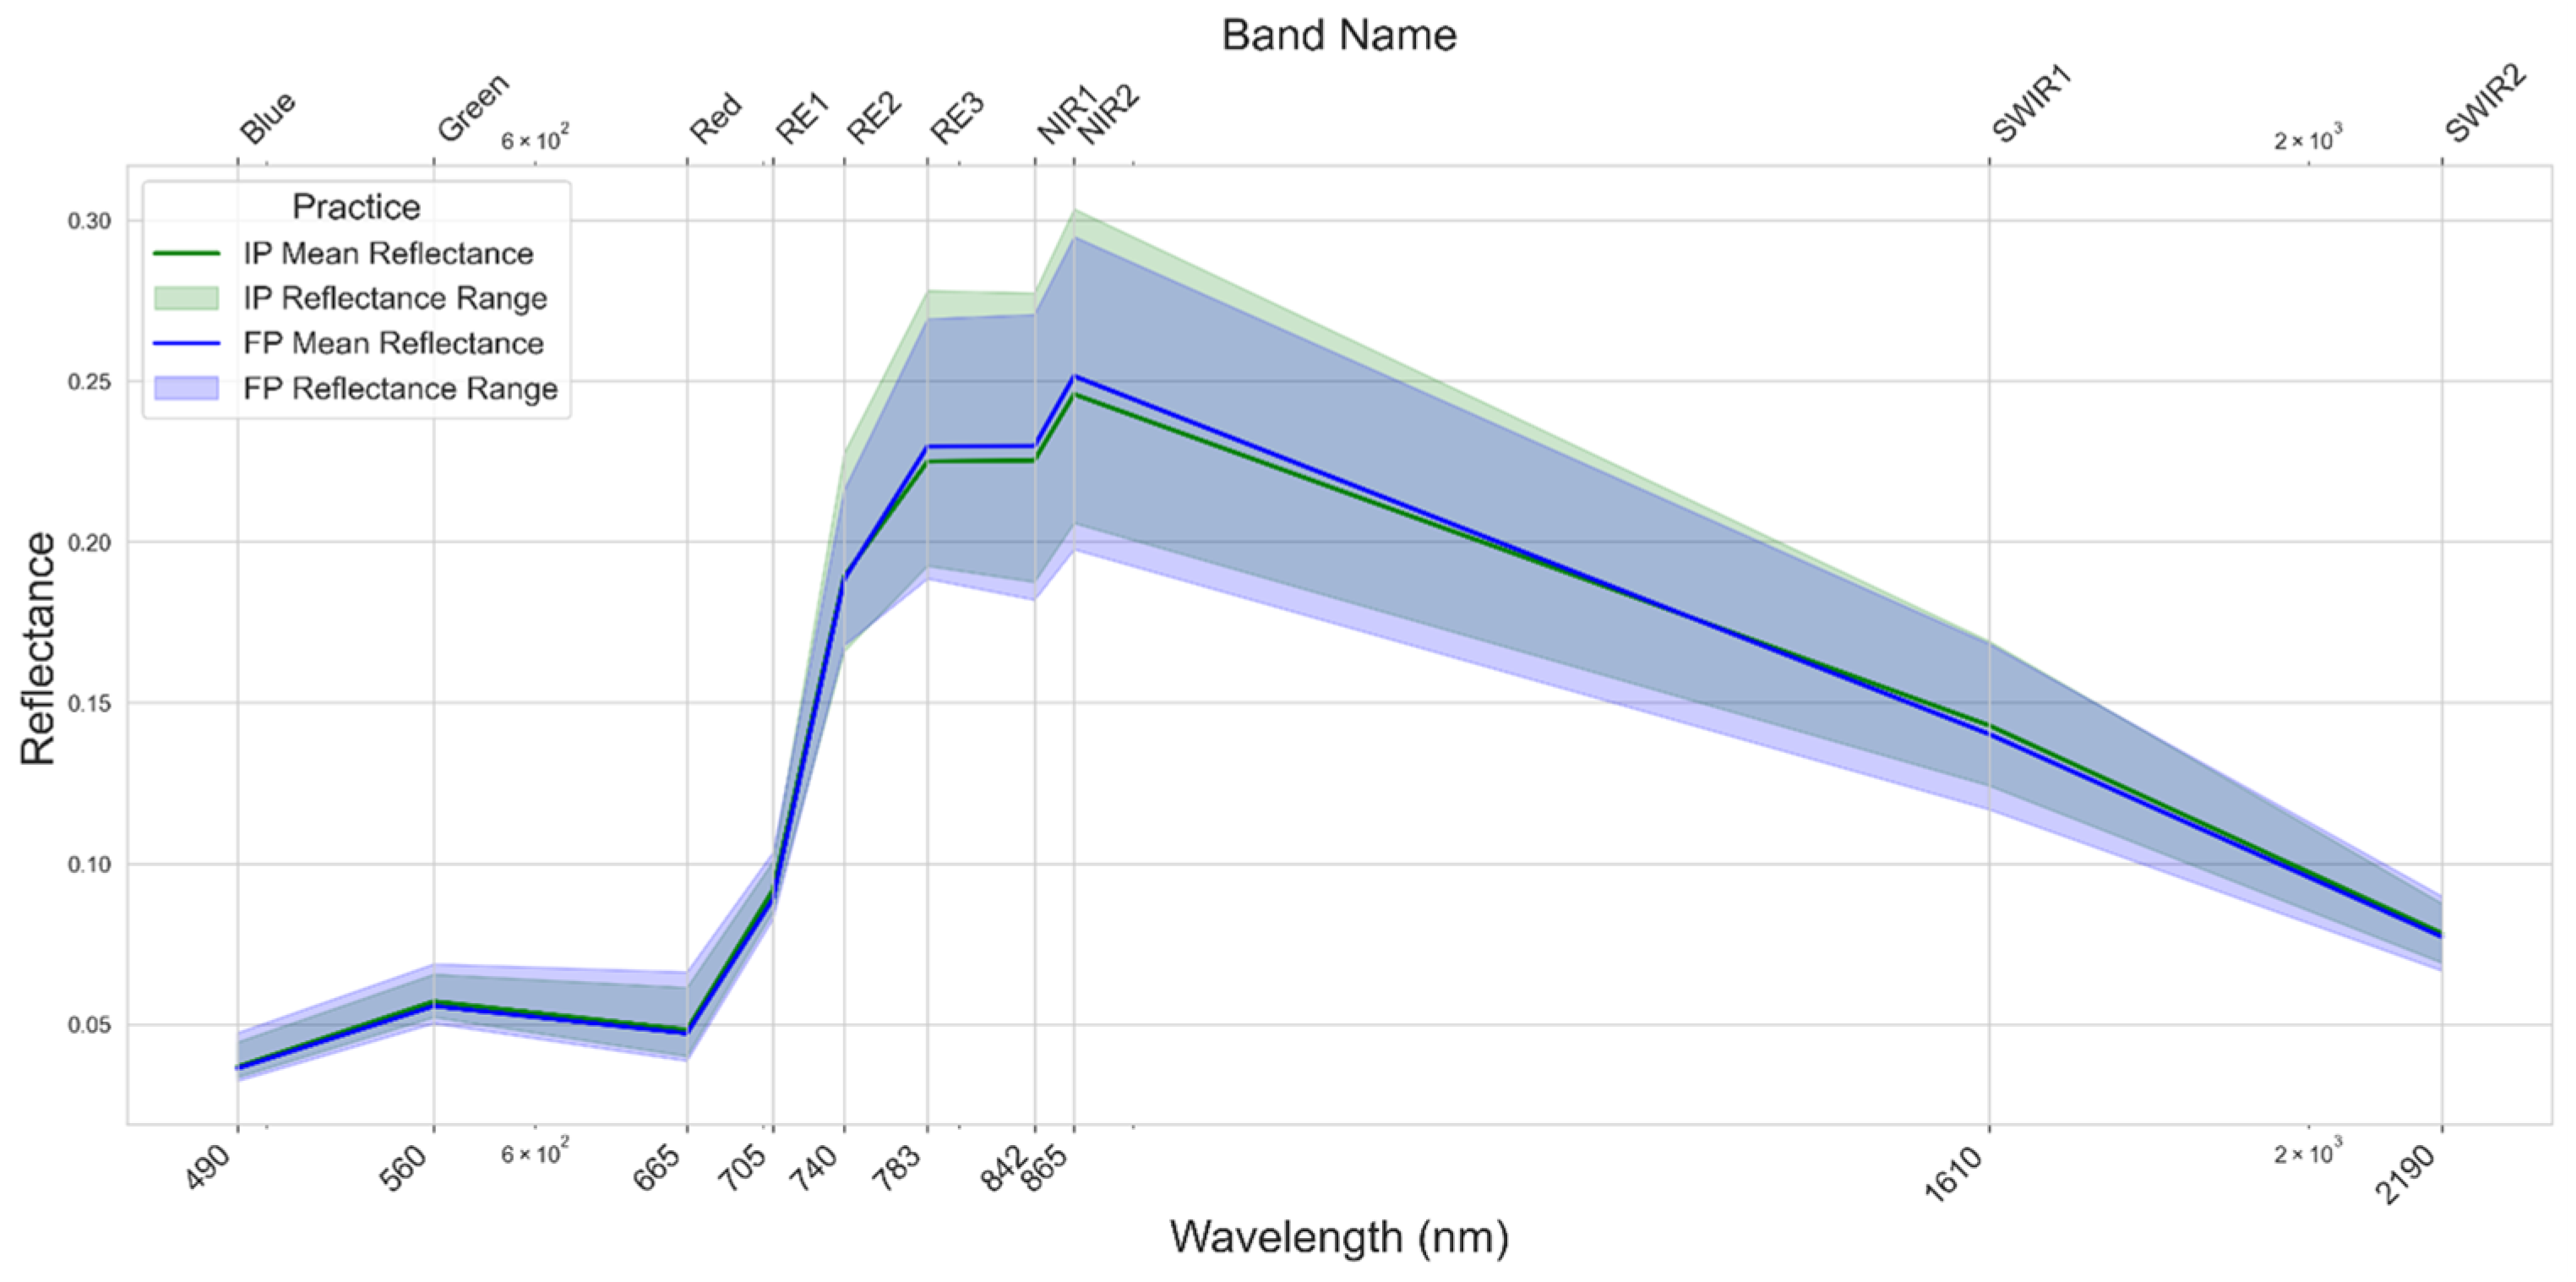
The spectral reflectance curves of rice under FP and IP in Tanzania exhibited highly similar patterns across all spectral regions (Figure 5). In the visible range, reflectance values in blue and green bands were nearly identical between practices with small effect sizes (Cohen’s d < 0.2). Red-edge bands showed minimal variation and effect sizes consistently below 0.35, indicating limited discrimination. Near-infrared bands also demonstrated overlapping values with small effect sizes, reflecting similar canopy vigor under both practices. SWIR bands displayed comparable reflectance with no significant differences observed. Overall, ICC analyses confirmed excellent measurement reliability across all bands (ICC > 0.87), particularly in red-edge and SWIR regions. The near-identical reflectance and low effect sizes across key vegetation-sensitive bands reflecting the limited spectral separability between FP and IP rice in the context of this study.

4. Discussion

4.1. Implications of Spectral Reflectance Patterns for Crop Discrimination

The spectral reflectance patterns generated from imagery captured during late vegetative to early reproductive growth stages in Figure 2 reveal distinct biophysical signatures consistent with the known characteristics of the three crops. The pronounced differences in NIR reflectance among crops reflect fundamental variations in canopy architecture and physiological status. Wheat exhibited the highest NIR reflectance in both bands, attributable to its dense tillering pattern and high Leaf Area Index (LAI) that promote strong internal leaf scattering [24,38,39,40]. The concurrent low red reflectance indicates vigorous chlorophyll absorption during the late vegetative stage [41].
In contrast, rice displayed the lowest NIR reflectance, primarily due to flooded soil conditions that absorb NIR radiation and the species’ characteristically narrow leaf morphology, resulting in reduced canopy density [27,42]. The relatively higher blue reflectance in rice likely results from increased scattering by standing water surfaces and potentially lower anthocyanin concentrations compared to the other crops [43,44].
Maize occupied an intermediate position with moderately high NIR reflectance, reflecting its more open canopy structure and typically lower LAI relative to wheat [28,40]. The higher red reflectance in maize suggests either reduced chlorophyll density per unit leaf area or greater influence from soil background due to wider row spacing [41,45].
The red-edge region provided additional discrimination capabilities, with the shift from maize dominance in RE1 and RE2 to wheat superiority in RE3 potentially reflecting species-specific chlorophyll–protein complexes and leaf internal structure variations that affect the precise position and shape of the red-edge inflection point [46,47].
The SWIR bands yielded the most robust spectral separation, with maize consistently showing higher reflectance than both rice and wheat. This pattern suggests lower foliar water content in maize, consistent with its C4 photosynthetic pathway and associated water-use efficiency adaptations [48,49,50,51,52]. The large effect sizes observed for SWIR2 comparisons, particularly between maize and wheat, indicate that these bands provide the strongest discriminatory power for operational crop mapping applications [53].
Notably, these spectral differences remained detectable across slightly varying phenological stages (late vegetative for wheat versus reproductive for maize), suggesting that the observed patterns reflect inherent species characteristics rather than purely developmental effects. This robustness enhances the practical utility of Sentinel-2A-derived spectral features for crop discrimination in mixed agricultural landscapes.

4.2. Management and Regional Effects on Maize Spectral Reflectance in Togo

The Sentinel-2A spectral analysis during early reproductive growth stages of maize revealed differences between IP and FP across Togo’s agroecological zones. These differences are most pronounced in vegetation-sensitive bands (red, NIR, red-edge) that drive vegetation indices such as NDVI and NDRE calculations, with IP systems consistently showing superior spectral indicators of crop health [38,41].
During 2021, IP plots demonstrated a non-significant but noteworthy numerical increase in RE3 and NIR1 reflectance compared with FP plots (Figure 3a), which would result in a higher NDVI that logically corresponds with the significant grain yield increase reported in Table 1. In 2022, spectral separability increased significantly in RE2 (p = 0.039, d = 0.72) and NIR1 (p = 0.048). This enhanced discrimination corresponded with a grain yield increase in the IP plots (Table 1). The narrowing FP reflectance ranges in 2022 suggest that practice-related physiological differences became more distinguishable at this stage of crop growth [41] and the improved consistency in measurements across all bands (ICC3k > 0.85) reinforces the reliability of these observations.
Examining regional patterns, the Central region consistently showed higher NIR reflectance than the Savannah (Figure 3c,d). However, Central’s elevated 2021 red reflectance may indicate early-season stress [41]. NIR reflectance in the Savannah improved notably from 2021 to 2022 compared to in the Central region, and corresponding yield gains were more significant (p = 0.001 vs. Central’s p = 0.023).
From a spectral band perspective, changes in red-edge bands (RE2/RE3) appear to provide an indication of management impacts, whereas SWIR bands showed minimal discrimination (p > 0.60) [51]. These findings demonstrate that differences between spectral reflectance in 2021 and 2022 suggest both climatic and agronomic improvements [51].

4.3. Management and Regional Effects on Wheat Spectral Reflectance in Tunisia

The spectral analysis during the late vegetative to early reproductive growth stages in wheat in Tunisia reveals large overlaps in the spectral profiles for IP and FP plots (Figure 4a) with no statistically significant differences observed in any band despite consistently high measurement reliability across all bands. Slightly higher reflectance values under IP were noted in vegetation-sensitive bands such as RE3 and NIR1, but the small effect sizes (Cohen’s d < 0.36) confirm negligible practical differences. These findings suggest that, at this growth stage, both practices achieved broadly similar canopy development, and that any benefits of improved practices may not have been sufficient to produce distinct spectral signals under the local environmental conditions. However, IP plots demonstrated superior canopy consistency, with narrower red reflectance ranges compared to FP, indicating more uniform chlorophyll absorption and canopy health that aligns with established NDVI dynamics where red variability directly impacts vegetation indices [38].
The 2× wider red range in FP systems suggests heterogeneous field conditions, likely from uneven input application or soil variability [54], though, notably, IP’s spectral consistency did not translate to yield gains (Table 1), implying these practices may stabilize production rather than increase absolute output. Regarding biomass management, the comparable NIR ranges between systems indicate that both achieved similar maximum biomass potential, while FP’s broader distribution reflects inconsistent canopy closure that matches the known sensitivity of NIR to planting density and weed pressure [54]. However, the exceptional regional variability in IP systems (Figure 4b) outweighs practice-based differences, suggesting that agroecological potential dominated spectral signals and that any benefit from improved practices could have been masked by inherent regional constraints, which explains the non-significant yield differences despite IP’s spectral advantages. While IP systems showed spectral indicators of better crop management through consistent red absorption and uniform NIR, the missing yield impact may result from measurement timing where spectral advantages manifest earlier than yield differences, regional ceilings that constrain maximum potential yield by local climate and soils, or implementation gaps between prescribed and applied IP techniques. These findings underscore that red-band monitoring provides the most sensitive practice indicator for early stress detection, regional benchmarking is essential before practice comparisons, and temporal tracking is needed to capture practice effects that may precede yield changes [55].

4.4. Management Effects on Rice Spectral Reflectance in Tanzania

The Sentinel-2A spectral analysis of rice fields in Tanzania during the reproductive growth stages revealed minimal spectral separability between IP and FP plots, despite a substantial yield difference. As shown in Figure 5, the reflectance curves for IP and FP plots were nearly identical across all spectral regions, with blue and green reflectance values overlapping and negligible effect sizes (Cohen’s d < 0.2). Similarly, the red-edge and NIR bands, which are typically responsive to vegetation structure and chlorophyll content, showed narrow reflectance ranges and small effect sizes (<0.35), indicating little spectral contrast between the two management systems. These observations were supported by strong measurement consistency across bands (ICC > 0.87), particularly in the red-edge and SWIR regions.
Yet this spectral uniformity contrasted sharply with the yield results (Table 1). This spectral-yield paradox, in which FP plots exhibited slightly higher mean NIR reflectance despite lower productivity, challenges the conventional assumption that higher NIR values are always indicative of greater biomass or yield potential [38]. This contradiction suggests that the elevated NIR reflectance in FP plots may be the result of mixed pixels from non-crop elements such as weeds or exposed bunds, rather than increased crop vigor. In contrast, IP plots, with more uniform management, may have achieved greater photosynthetic efficiency and better nitrogen use without necessarily expanding canopy biomass.
This interpretation is supported by the spectral distribution characteristics. Although RE3 reflectance ranges were of similar width between practices, the IP plots exhibited a clear upward shift in minimum values. This shift suggests improved weed suppression and more consistent canopy cover under IP, likely driven by standardized seed and fertilizer application, as well as more precise irrigation management [51]. The suppression of low-reflectance outliers in IP plots potentially caused by bare patches or weed infestation improves the reliability of red-edge and NIR readings as indicators of crop condition.
The limited ability of Sentinel-2 to resolve smallholder heterogeneity may further explain the observed discrepancies. At 10 m spatial resolution, Sentinel-2 pixels in Tanzania’s small rice fields (~0.5 ha) often incorporate non-crop elements. This pixel mixing disproportionately affects FP plots, which typically exhibit more management variability, including irregular plant spacing, unaligned bunds, and scattered weed cover [56]. In contrast, the more homogeneous canopies under IP management yield cleaner spectral signals. These findings help explain why Togo’s larger maize plots (~1 ha) revealed clearer spectral-yield associations, whereas Tanzania’s smaller and more heterogeneous rice fields did not.
Overall, the Tanzania results illustrate that spectral similarity does not equate to agronomic equivalence. The yield gains under IP in Tanzania were not captured through traditional vegetation-sensitive bands, suggesting that hidden physiological efficiencies such as nutrient assimilation and stress avoidance, can manifest without clear spectral separation. To address these nuances, future analyses must go beyond mean reflectance values. Distributional metrics (e.g., minimums, interquartile ranges), ancillary management data (e.g., input rates, weed pressure), and yield ground truthing are essential for accurate interpretation. The FP plots’ broader spectral ranges continue to signal management variability, while IP plots’ narrower, upward-shifted distributions indicate optimized inputs. Finally, the observed measurement consistency in SWIR bands (ICC3k = 0.98) suggests that SWIR data may complement vegetation indices when using higher-resolution sensors, such as UAVs, to better resolve spatial heterogeneity in smallholder rice systems [56].

5. Conclusions

This multi-country study assessed the potential of free-access Sentinel-2A imagery to generate reliable SRCs over African smallholder-managed cereal plots of 0.5 ha to 1 ha in diverse agroecological contexts across Tunisia (wheat), Togo (maize), and Tanzania (rice). Specifically, we evaluated whether Sentinel-2A could distinguish between SRCs resulting from traditional farmer practices (FPs) and improved practices (IPs) under real-world field conditions. Results demonstrated that in plot sizes of 1 ha, such as those in Togo, Sentinel-2A effectively captured significant spectral differences aligned with yield advantages following IP. However, in more fragmented, heterogeneous landscapes like Tanzania, spectral separability was limited despite substantial yield gaps, likely due to pixel mixing effects and plot-scale variability. Tunisia’s case further underscored the strong influence of agroecological conditions, where minimal differences between practices contrasted with large regional disparities, highlighting the dominance of environmental constraints over management effects.
The primary limitation of this study was the reliance on a single Sentinel-2A acquisition, which restricted our ability to (1) track crop phenology, (2) generate noise-reducing composites, and (3) capture temporal effects of management interventions. We note that these findings are specific to the observed environmental and temporal conditions of our study period; therefore, further site-specific validation should be completed when extrapolating these results to other years, locations, or cropping systems.
Despite this, the study successfully demonstrated that Sentinel-2A has the potential to support SRC development for smallholder plots under certain conditions. Notably, NIR- and RE-associated bands emerged as the most discriminatory, offering promising spectral windows for practice differentiation. Future work should integrate agronomic variables, climatic data, and derivative indices like NDVI and NDRE, combined with machine learning techniques such as Random Forests, to model the drivers of spectral variation between IP and FP. The goal is to develop a framework capable of flagging plots where interventions are likely needed, using spectral cues as early-warning signals. Additional future work should also address spatial scale limitations by incorporating high-resolution UAV imagery for sub-meter crop masking in small plots and multi-temporal satellite data (e.g., PlanetScope) to improve phenological monitoring. Ultimately, this study highlights that SRC reliability in smallholder systems is highly contingent on environmental conditions, including climate, edaphic factors, and local management practices. As such, regional stratification is essential before interpreting practice effects, and a multi-sensor, multi-temporal, and ground-informed approach will be critical to unlocking the full potential of satellite-based crop monitoring in African smallholder agriculture.

Author Contributions

Conceptualization, S.P.; Methodology, S.P.; Formal analysis, A.B. and S.P.; Investigation, S.P., I.A., J.S., M.M. and B.K.; Data curation, A.B., S.P. and I.A.; Writing—original draft, A.B.; Writing—review & editing, S.P.; Supervision, S.P., I.A., J.S., M.M. and B.K.; Project administration, S.P.; Funding acquisition, I.A. All authors have read and agreed to the published version of the manuscript.

Funding

This research was funded by the African Plant Nutrition Institution and OCP Africa.

Data Availability Statement

The original contributions presented in this study are included in the article. Further inquiries can be directed to the corresponding author.

Conflicts of Interest

The authors declare no conflict of interest.

References

  1. Grote, U.; Fasse, A.; Nguyen, T.T.; Erenstein, O. Food Security and the Dynamics of Wheat and Maize Value Chains in Africa and Asia. Front. Sustain. Food Syst. 2021, 4, 617009. [Google Scholar] [CrossRef]
  2. Alahira, J. Atlas of African Agriculture. Available online: https://www.agriculturenigeria.com/atlas-of-african-agriculture/ (accessed on 19 January 2025).
  3. Erenstein, O.; Jaleta, M.; Mottaleb, K.A.; Sonder, K.; Donovan, J.; Braun, H.J. Global Trends in Wheat Production, Consumption and Trade; Springer Nature: London, UK, 2022; Chapter 4; ISBN 978-3-030-90672-6. [Google Scholar]
  4. Rapsomanikis, G. The Economic Lives of Smallholder Farmers; Food and Agriculture Organization of the United Nations: Rome, Italy, 2015. [Google Scholar]
  5. Jayne, T.S.; Mather, D.; Mghenyi, E. Principal Challenges Confronting Smallholder Agriculture in Sub-Saharan Africa. World Dev. 2010, 38, 1384–1398. [Google Scholar] [CrossRef]
  6. Cairns, J.E.; Hellin, J.; Sonder, K.; Araus, J.L.; MacRobert, J.F.; Thierfelder, C.; Prasanna, B.M. Adapting Maize Production to Climate Change in Sub-Saharan Africa. Food Secur. 2013, 5, 345–360. [Google Scholar] [CrossRef]
  7. Nyambo, P.; Nyambo, P.; Mavunganidze, Z.; Nyambo, V. Sub-Saharan Africa Smallholder Farmers Agricultural Productivity: Risks and Challenges. In Food Security for African Smallholder Farmers; Mupambwa, H.A., Nciizah, A.D., Nyambo, P., Muchara, B., Gabriel, N.N., Eds.; Springer Nature: Singapore, 2022; pp. 47–58. ISBN 9789811667718. [Google Scholar]
  8. Mpandeli, S.; Maponya, P. Constraints and Challenges Facing the Small Scale Farmers in Limpopo Province, South Africa. J. Agric. Sci. 2014, 6, 135. [Google Scholar] [CrossRef]
  9. Dhillon, R.; Moncur, Q. Small-Scale Farming: A Review of Challenges and Potential Opportunities Offered by Technological Advancements. Sustainability 2023, 15, 15478. [Google Scholar] [CrossRef]
  10. Yuan, Y.; Sun, Y. Practices, Challenges, and Future of Digital Transformation in Smallholder Agriculture: Insights from a Literature Review. Agriculture 2024, 14, 2193. [Google Scholar] [CrossRef]
  11. Sishodia, R.P.; Ray, R.L.; Singh, S.K. Applications of Remote Sensing in Precision Agriculture: A Review. Remote Sens. 2020, 12, 3136. [Google Scholar] [CrossRef]
  12. Aker, J.C. Dial “A” for Agriculture: A Review of Information and Communication Technologies for Agricultural Extension in Developing Countries. Agric. Econ. 2011, 42, 631–647. [Google Scholar] [CrossRef]
  13. Feder, G.; Savastano, S. The Role of Opinion Leaders in the Diffusion of New Knowledge: The Case of Integrated Pest Management. World Dev. 2006, 34, 1287–1300. [Google Scholar] [CrossRef]
  14. Davis, K.; Nkonya, E.; Kato, E.; Mekonnen, D.A.; Odendo, M.; Miiro, R.; Nkuba, J. Impact of Farmer Field Schools on Agricultural Productivity and Poverty in East Africa. World Dev. 2012, 40, 402–413. [Google Scholar] [CrossRef]
  15. Anderson, J.R.; Feder, G. Agricultural Extension: Good Intentions and Hard Realities. World Bank Res. Obs. 2004, 19, 41–60. [Google Scholar] [CrossRef]
  16. Omia, E.; Bae, H.; Park, E.; Kim, M.S.; Baek, I.; Kabenge, I.; Cho, B.-K. Remote Sensing in Field Crop Monitoring: A Comprehensive Review of Sensor Systems, Data Analyses and Recent Advances. Remote Sens. 2023, 15, 354. [Google Scholar] [CrossRef]
  17. Li, M.; Shamshiri, R.R.; Weltzien, C.; Schirrmann, M. Crop Monitoring Using Sentinel-2 and UAV Multispectral Imagery: A Comparison Case Study in Northeastern Germany. Remote Sens. 2022, 14, 4426. [Google Scholar] [CrossRef]
  18. Segarra, J.; Buchaillot, M.L.; Araus, J.L.; Kefauver, S.C. Remote Sensing for Precision Agriculture: Sentinel-2 Improved Features and Applications. Agronomy 2020, 10, 641. [Google Scholar] [CrossRef]
  19. Guin, A.; Sahoo, S.; Samanta, S.; Maity, N.; Bera, B. Advancements in Agricultural Technology: A Historical Perspective. In Smart and Sustainable Agricultural Technology; Lovely Professional University (LPU): Phagwara, India, 2023; ISBN 978-81-19-33475-9. [Google Scholar]
  20. Hirel, B.; Tétu, T.; Lea, P.J.; Dubois, F. Improving Nitrogen Use Efficiency in Crops for Sustainable Agriculture. Sustainability 2011, 3, 1452–1485. [Google Scholar] [CrossRef]
  21. Crespin-Boucaud, A.; Lebourgeois, V.; Lo Seen, D.; Castets, M.; Bégué, A. Agriculturally Consistent Mapping of smallholder Farming Systems Using Remote Sensing and Spatial Modelling. Int. Arch. Photogramm. Remote Sens. Spat. Inf. Sci. 2020, XLII-3/W11, 35–42. [Google Scholar] [CrossRef]
  22. Bowker, E.; Davis, E.; Myrick, L. Spectral Reflectances of Natural Targets for Use in Remote Sensing Studies; National Aeronautics and Space Administration: Washington, DC, USA, 1985.
  23. Lammy Nkuna, B.; George Chirima, J.; Newete, S.W.; Nyamugama, A.; van der Walt, A.J. Developing Models to Detect Maize Diseases Using Spectral Vegetation Indices Derived from Spectral Signatures. Egypt. J. Remote Sens. Space Sci. 2024, 27, 597–603. [Google Scholar] [CrossRef]
  24. Zhou, Z.; Plauborg, F.; Thomsen, A.G.; Andersen, M.N. A RVI/LAI-Reference Curve to Detect N Stress and Guide N Fertigation Using Combined Information from Spectral Reflectance and Leaf Area Measurements in Potato. Eur. J. Agron. 2017, 87, 1–7. [Google Scholar] [CrossRef]
  25. Raypah, M.E.; Nasru, M.I.M.; Nazim, M.H.H.; Omar, A.F.; Zahir, S.A.D.M.; Jamlos, M.F.; Muncan, J. Spectral Response to Early Detection of Stressed Oil Palm Seedlings Using Near-Infrared Reflectance Spectra at Region 900-1000 Nm. Infrared Phys. Technol. 2023, 135, 104984. [Google Scholar] [CrossRef]
  26. Peroni Venancio, L.; Chartuni Mantovani, E.; do Amaral, C.H.; Usher Neale, C.M.; Zution Gonçalves, I.; Filgueiras, R.; Coelho Eugenio, F. Potential of Using Spectral Vegetation Indices for Corn Green Biomass Estimation Based on Their Relationship with the Photosynthetic Vegetation Sub-Pixel Fraction. Agric. Water Manag. 2020, 236, 106155. [Google Scholar] [CrossRef]
  27. Wang, Z.; Tan, X.; Ma, Y.; Liu, T.; He, L.; Yang, F.; Shu, C.; Li, L.; Fu, H.; Li, B.; et al. Combining Canopy Spectral Reflectance and RGB Images to Estimate Leaf Chlorophyll Content and Grain Yield in Rice. Comput. Electron. Agric. 2024, 221, 108975. [Google Scholar] [CrossRef]
  28. Lambert, M.-J.; Traoré, P.C.S.; Blaes, X.; Baret, P.; Defourny, P. Estimating Smallholder Crops Production at Village Level from Sentinel-2 Time Series in Mali’s Cotton Belt. Remote Sens. Environ. 2018, 216, 647–657. [Google Scholar] [CrossRef]
  29. World Bank Group Climate in Togo. Available online: https://climateknowledgeportal.worldbank.org/country/togo (accessed on 20 January 2025).
  30. Renaud, A. 1.5 Million People Cultivate Maize in Togo. Available online: https://www.togofirst.com/en/agriculture/0209-3774-1-5-million-people-cultivate-maize-in-togo (accessed on 20 June 2024).
  31. Food and Agriculture Organization of the United Nations. FAO Country Profiles: Togo. Available online: http://www.fao.org/countryprofiles/index/en/?iso3=TGO (accessed on 19 January 2025).
  32. World Bank. Climate Change Knowledge Portal. Tunisia Climate. Available online: https://climateknowledgeportal.worldbank.org/country/tunisia (accessed on 20 January 2025).
  33. Latiri, K.; Lhomme, J.-P.; Annabi, M.; Setter, T. Wheat Production in Tunisia: Progress, Inter-Annual Variability and Relation to Rainfall. Eur. J. Agron. 2010, 33, 33–42. [Google Scholar] [CrossRef]
  34. USDA. Rice Explorer—Tanzania. Available online: https://ipad.fas.usda.gov/cropexplorer/cropview/comm_chartview.aspx?ftypeid=47&fattributeid=1&fctypeid=60&fcattributeid=1&regionid=safrica&cntryid=TZA&cropid=0422110&nationalgraph=False&sel_year=2022&startrow=1 (accessed on 20 January 2025).
  35. USDA, Foreign Agricultural Service. Tanzania: Grain and Feed Annual. Available online: https://www.fas.usda.gov/data/tanzania-grain-and-feed-annual-7 (accessed on 19 January 2025).
  36. Drusch, M.; Del Bello, U.; Carlier, S.; Colin, O.; Fernandez, V.; Gascon, F.; Hoersch, B.; Isola, C.; Laberinti, P.; Martimort, P.; et al. Sentinel-2: ESA’s Optical High-Resolution Mission for GMES Operational Services. Remote Sens. Environ. 2012, 120, 25–36. [Google Scholar] [CrossRef]
  37. DEAfrica Team. Analysis Sandbox—Digital Earth Africa 2021 Documentation. Available online: https://docs.digitalearthafrica.org/en/latest/sandbox/index.html (accessed on 19 January 2025).
  38. Tucker, C.J. Red and Photographic Infrared Linear Combinations for Monitoring Vegetation. Remote Sens. Environ. 1979, 8, 127–150. [Google Scholar] [CrossRef]
  39. Haboudane, D.; Miller, J.R.; Tremblay, N.; Zarco-Tejada, P.J.; Dextraze, L. Integrated Narrow-Band Vegetation Indices for Prediction of Crop Chlorophyll Content for Application to Precision Agriculture. Remote Sens. Environ. 2002, 81, 416–426. [Google Scholar] [CrossRef]
  40. Baret, F.; Guyot, G. Potentials and Limits of Vegetation Indices for LAI and APAR Assessment. Remote Sens. Environ. 1991, 35, 161–173. [Google Scholar] [CrossRef]
  41. Gitelson, A.; Merzlyak, M. Remote Sensing of Chlorophyll Concentration in Higher Plant Leaves. Adv. Space Res. 1998, 22, 689–692. [Google Scholar] [CrossRef]
  42. Thenkabail, P. Biophysical and Yield Information for Precision Farming from Near-Real-Time and Historical Landsat TM Images. Int. J. Remote Sens. 2003, 24, 2879–2904. [Google Scholar] [CrossRef]
  43. Shibayama, M.; Sakamoto, T.; Takada, E.; Inoue, A.; Morita, K.; Takahashi, W.; Kimura, A. Continuous Monitoring of Visible and Near-Infrared Band Reflectance from a Rice Paddy for Determining Nitrogen Uptake Using Digital Cameras. Plant Prod. Sci. 2009, 12, 293–306. [Google Scholar] [CrossRef]
  44. Chalker-Scott, L. Environmental Significance of Anthocyanins in Plant Stress Responses. Photochem. Photobiol. 1999, 70, 1–9. [Google Scholar] [CrossRef]
  45. Huete, A.R. A Soil-Adjusted Vegetation Index (SAVI). Remote Sens. Environ. 1988, 25, 295–309. [Google Scholar] [CrossRef]
  46. Zarco-Tejada, P.; Gonzalez-Dugo, V.; Berni, J.A.J. Fluorescence, Temperature and Narrow-Band Indices Acquired from a UAV Platform for Water Stress Detection Using a Micro-Hyperspectral Imager and a Thermal Camera. Remote Sens. Environ. 2012, 117, 322–337. [Google Scholar] [CrossRef]
  47. Delegido, J.; Verrelst, J.; Alonso, L.; Moreno, J. Evaluation of Sentinel-2 Red-Edge Bands for Empirical Estimation of Green LAI and Chlorophyll Content. Sensors 2011, 11, 7063–7081. [Google Scholar] [CrossRef] [PubMed]
  48. Yilmaz, M.T.; Hunt, E.R.; Jackson, T.J. Remote Sensing of Vegetation Water Content from Equivalent Water Thickness Using Satellite Imagery. Remote Sens. Environ. 2008, 112, 2514–2522. [Google Scholar] [CrossRef]
  49. Ghulam, A.; Li, Z.-L.; Qin, Q.; Yimit, H.; Wang, J. Estimating Crop Water Stress with ETM+ NIR and SWIR Data. Agric. For. Meteorol. 2008, 148, 1679–1695. [Google Scholar] [CrossRef]
  50. Xiao, X.; Boles, S.; Frolking, S.; Li, C.; Babu, J.Y.; Salas, W.; Moore, B. Mapping Paddy Rice Agriculture in South and Southeast Asia Using Multi-Temporal MODIS Images. Remote Sens. Environ. 2006, 100, 95–113. [Google Scholar] [CrossRef]
  51. Ceccato, P.; Flasse, S.; Tarantola, S.; Jacquemoud, S.; Grégoire, J.-M. Detecting Vegetation Leaf Water Content Using Reflectance in the Optical Domain. Remote Sens. Environ. 2001, 77, 22–33. [Google Scholar] [CrossRef]
  52. Hatfield, J.L.; Gitelson, A.A.; Schepers, J.S.; Walthall, C.L. Application of Spectral Remote Sensing for Agronomic Decisions. Agron. J. 2008, 100, S-117–S-131. [Google Scholar] [CrossRef]
  53. Stournaras, S.; Arvanitis, K.; Loukatos, D.; Kalatzis, N. Crop Identification by Machine Learning Algorithm and Sentinel-2 Data. Chem. Proc. 2022, 10, 20. [Google Scholar] [CrossRef]
  54. Pettorelli, N.; Vik, J.O.; Mysterud, A.; Gaillard, J.-M.; Tucker, C.J.; Stenseth, N.C. Using the Satellite-Derived NDVI to Assess Ecological Responses to Environmental Change. Trends Ecol. Evol. 2005, 20, 503–510. [Google Scholar] [CrossRef] [PubMed]
  55. Gao, B. NDWI—A Normalized Difference Water Index for Remote Sensing of Vegetation Liquid Water from Space. Remote Sens. Environ. 1996, 58, 257–266. [Google Scholar] [CrossRef]
  56. Small, C. The Landsat ETM+ Spectral Mixing Space. Remote Sens. Environ. 2004, 93, 1–17. [Google Scholar] [CrossRef]
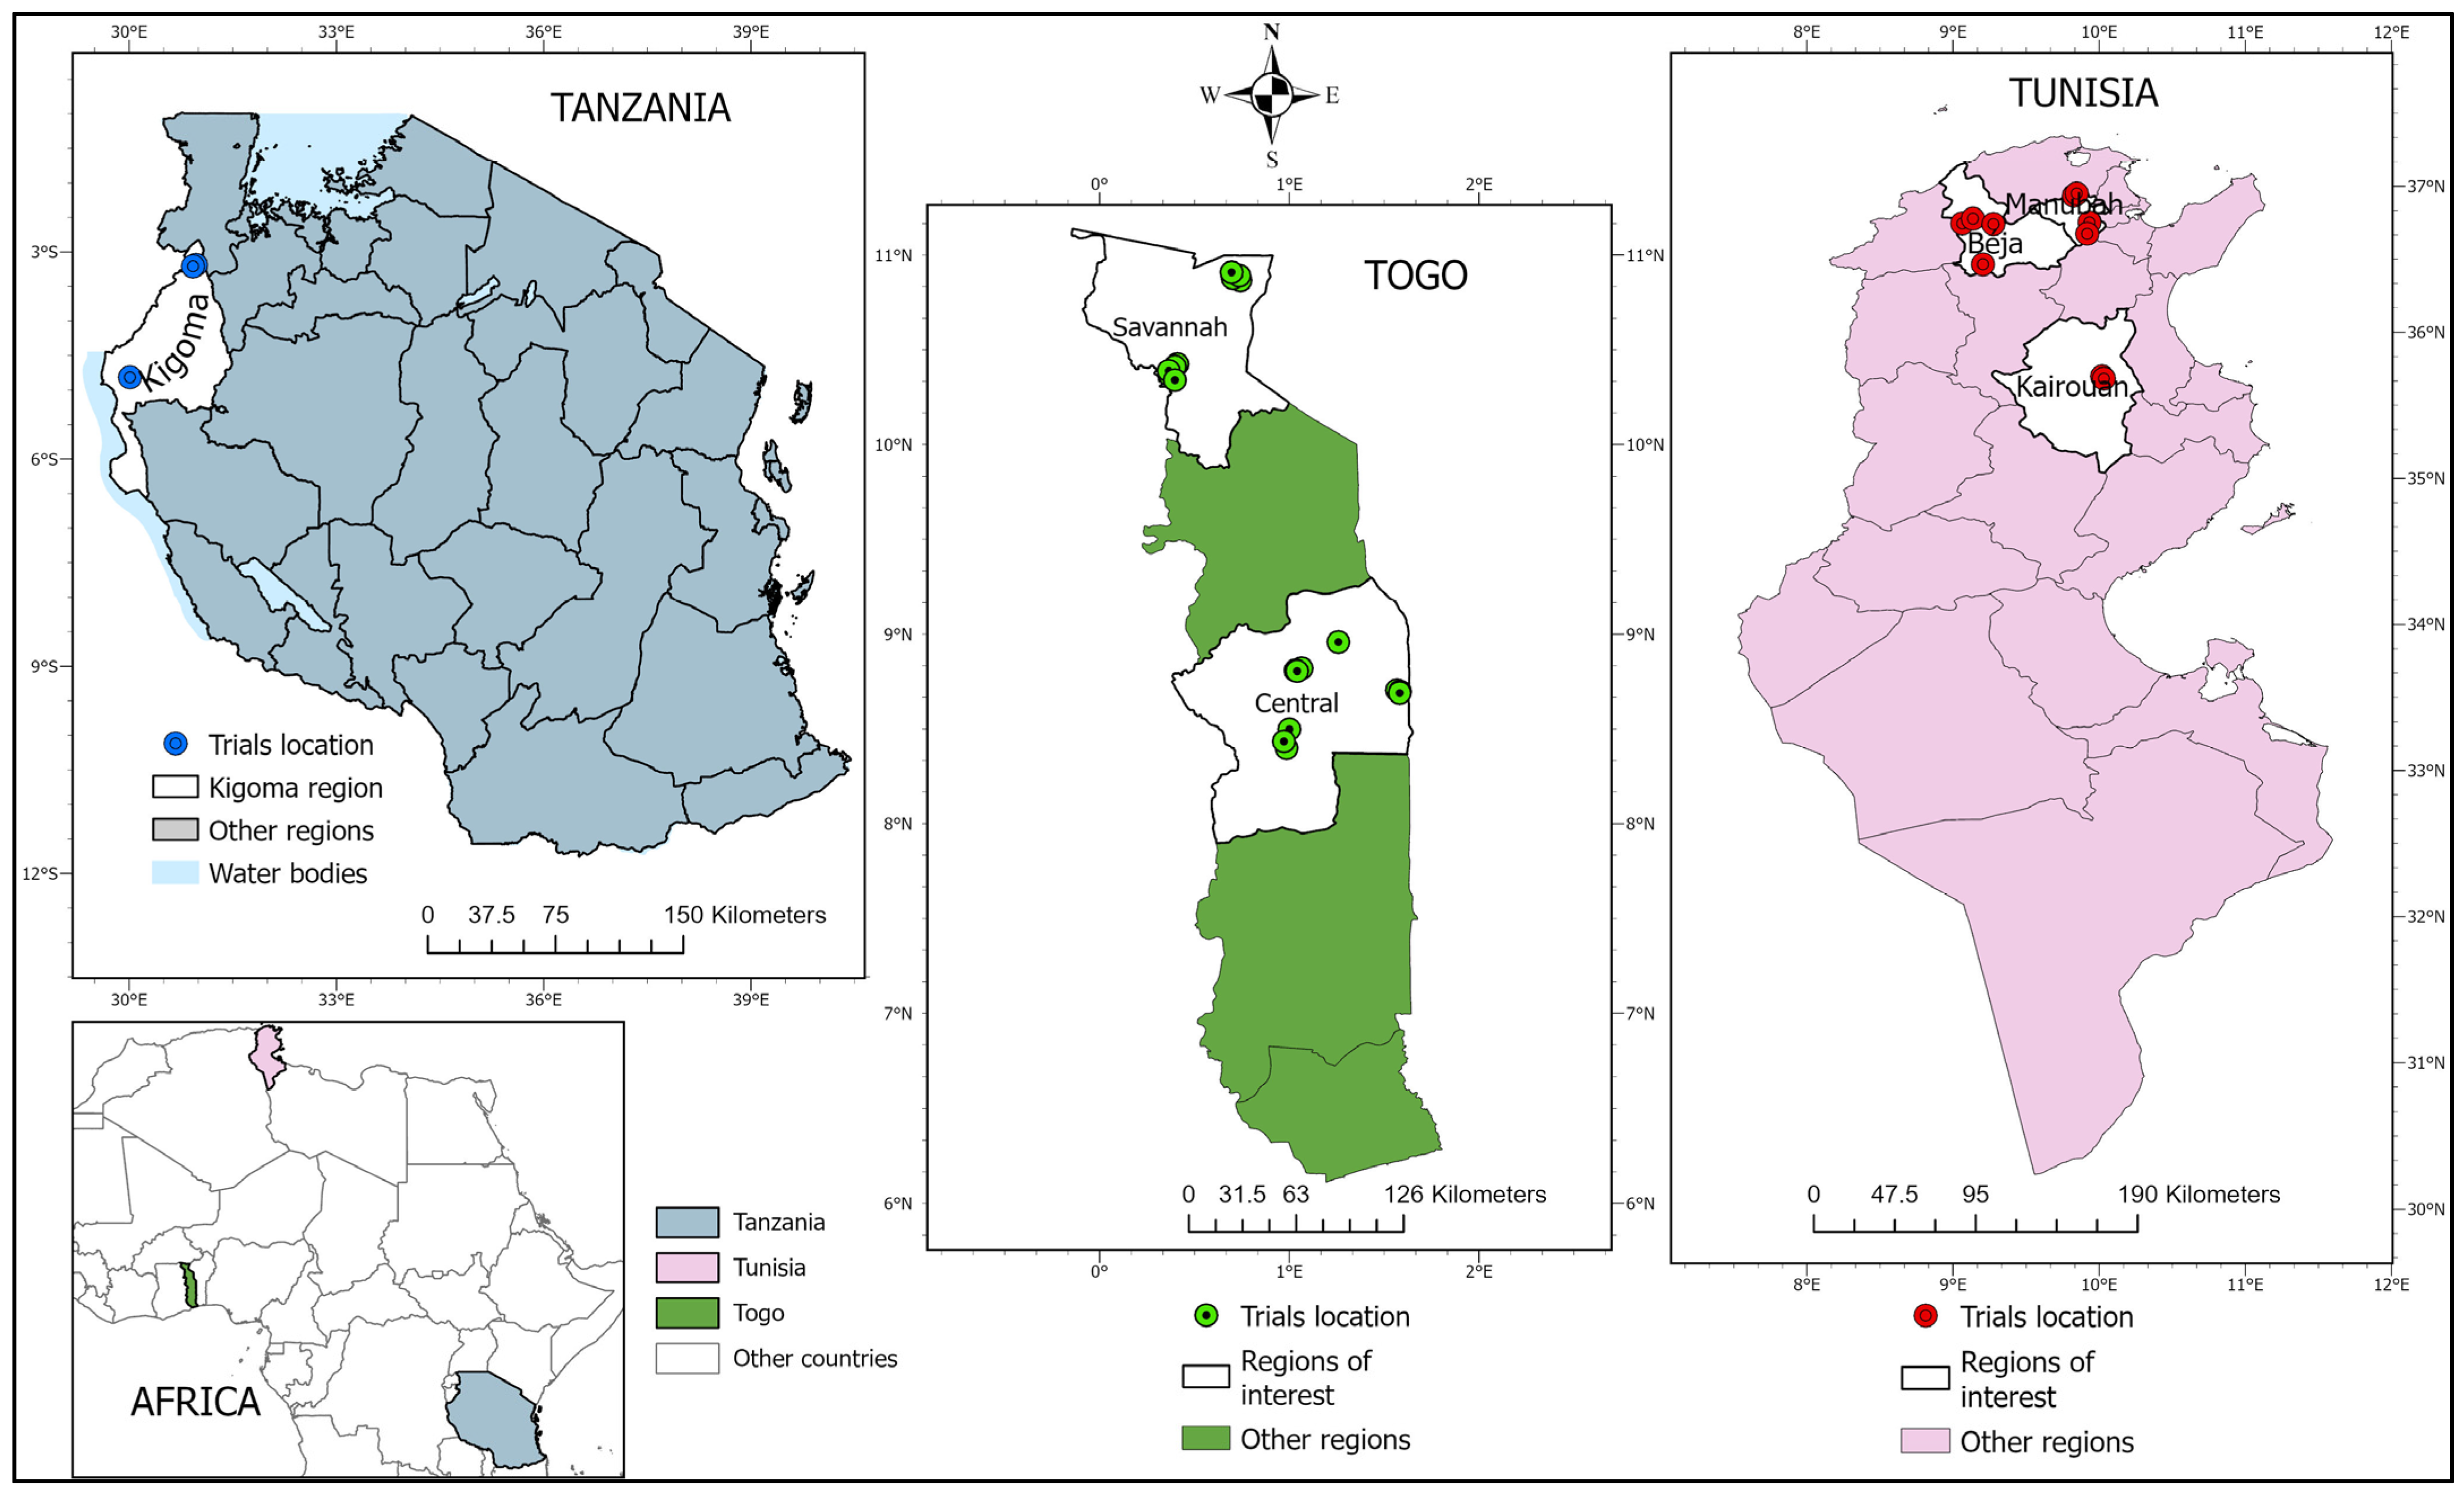
Figure 1. Study site locations in Tanzania, Togo, and Tunisia, Africa.
Remotesensing 17 03135 g001
Figure 2. Spectral reflectance curves derived from Sentinel-2 imagery collected during late-vegetative to early reproductive development stages for maize, rice, and wheat under improved management practices across multiple smallholder (1 ha or less) farms in Africa.
Remotesensing 17 03135 g002
Figure 3. Maize spectral reflectance curves following improved management practices (IPs) and traditional farmer practices (FPs) in Togo in 2021 (a) and 2022 (b) and regional differences in 2021 (c) and 2022 (d). Images were collected during the early reproductive growth stages (R1–R2) of maize. Reported reflectance data are averaged over all 20 sites used in the study.
Remotesensing 17 03135 g003
Figure 4. Wheat spectral reflectance curves following improved management practices (IPs) and traditional farmer practices (FPs) in Tunisia in 2021–2022 (a) and regional differences. (b) Images were collected during the late vegetative to early reproductive growth stages (F5–F7) of wheat. Reported reflectance data are averaged over all 20 sites used in the study.
Remotesensing 17 03135 g004
Figure 5. Rice spectral reflectance curves following improved management practices (IPs) and traditional farmer practices (FPs) in Tanzania in 2023. Images were collected during the early reproductive growth stages (PI) of rice. Reported reflectance data are averaged over all eight sites used in the study.
Remotesensing 17 03135 g005
Table 1. Average grain yield for countries included in the study.
Countries Average Yield FP Average Yield IP Yield Gap
---------------------------------------- kg ha−1 --------------------------------
Tanzania3452 A4585 B1133
Togo 20212144 A4402 B2258
Togo 20222323 A4663 B2340
Tunisia2016 A2200 A184
†—Tanzania: rice, 2023; Togo: maize; Tunisia: wheat; 2021–2022, ‡—FP: traditional farmer management practices, ¶—IP: improved management practices. Means in a row followed by different letters are significantly different at p < 0.05.
Disclaimer/Publisher’s Note: The statements, opinions and data contained in all publications are solely those of the individual author(s) and contributor(s) and not of MDPI and/or the editor(s). MDPI and/or the editor(s) disclaim responsibility for any injury to people or property resulting from any ideas, methods, instructions or products referred to in the content.