Article

Integrating UAS Remote Sensing and Edge Detection for Accurate Coal Stockpile Volume Estimation

1
Department of Food, Agricultural and Biological Engineering, The Ohio State University, Columbus, OH 43210, USA
2
Department of Food, Agricultural and Biological Engineering, The Ohio State University, Wooster, OH 44691, USA
*
Author to whom correspondence should be addressed.
Remote Sens. 2025, 17(18), 3136; https://doi.org/10.3390/rs17183136
Submission received: 10 July 2025 / Revised: 1 September 2025 / Accepted: 8 September 2025 / Published: 10 September 2025

Abstract

Highlights

What are the main findings?
  • UAS-based SfM with interpolated DTMs achieved ~2% error compared to LiDAR.
  • Automated boundary detection enhanced accuracy in stockpile volume estimation.
What is the implication of the main finding?
  • SfM–intDTM provides a cost-effective and scalable alternative to conventional surveying methods.
  • The method supports both precise and regional monitoring and is adaptable to quarrying, agriculture, and forestry.

Abstract

Accurate stockpile volume estimation is essential for industries that manage bulk materials across various stages of production. Conventional ground-based methods such as walking wheels, total stations, Global Navigation Satellite Systems (GNSSs), and Terrestrial Laser Scanners (TLSs) have been widely used, but often involve significant safety risks, particularly when accessing hard-to-reach or hazardous areas. Unmanned Aerial Systems (UASs) provide a safer and more efficient alternative for surveying irregularly shaped stockpiles. This study evaluates UAS-based methods for estimating the volume of coal stockpiles at a storage facility near Cadiz, Ohio. Two sensor platforms were deployed: a Freefly Alta X quadcopter equipped with a Real-Time Kinematic (RTK) Light Detection and Ranging (LiDAR, active sensor) and a WingtraOne UAS with Post-Processed Kinematic (PPK) multispectral imaging (optical, passive sensor). Three approaches were compared: (1) LiDAR; (2) Structure-from-Motion (SfM) photogrammetry with a Digital Surface Model (DSM) and Digital Terrain Model (DTM) (SfM–DTM); and (3) an SfM-derived DSM combined with a kriging-interpolated DTM (SfM–intDTM). An automated boundary detection workflow was developed, integrating slope thresholding, Near-Infrared (NIR) spectral filtering, and Canny edge detection. Volume estimates from SfM–DTM and SfM–intDTM closely matched LiDAR-based reference estimates, with Root Mean Square Error (RMSE) values of 147.51 m3 and 146.18 m3, respectively. The SfM–intDTM approach achieved a Mean Absolute Percentage Error (MAPE) of ~2%, indicating strong agreement with LiDAR and improved accuracy compared to prior studies. A sensitivity analysis further highlighted the role of spatial resolution in volume estimation. While RMSE values remained consistent (141–162 m3) and the MAPE below 2.5% for resolutions between 0.06 m and 5 m, accuracy declined at coarser resolutions, with the MAPE rising to 11.76% at 10 m. This emphasizes the need to balance the resolution with the study objectives, geographic extent, and computational costs when selecting elevation data for volume estimation. Overall, UAS-based SfM photogrammetry combined with interpolated DTMs and automated boundary extraction offers a scalable, cost-effective, and accurate approach for stockpile volume estimation. The methodology is well-suited for both the high-precision monitoring of individual stockpiles and broader regional-scale assessments and can be readily adapted to other domains such as quarrying, agricultural storage, and forestry operations.

1. Introduction

Stockpile volume estimation is crucial for managing bulk material in industries that rely on stockpiles at various stages of production. Traditional volume measurement approaches can be broadly categorized into ground-based geometric methods, terrestrial surveying techniques, and aerial photogrammetric methods, each with distinct operational principles and limitations.
Ground-based geometric methods, such as the trapezoidal and cross-sectioning methods [1], assume regular geometric shapes and depend on ideal mathematical models for volume calculation [2]. The trapezoidal method divides stockpiles into geometric sections and calculates volume using standard geometric formulas, while cross-sectioning involves measuring stockpile profiles at regular intervals and integrating areas between sections [2,3]. These methods require the collection of three-dimensional points with appropriate distribution and density for accurate volume calculation [4]. However, stockpile surfaces often do not conform to regular geometric shapes, rendering these mathematical models inadequate for accurately representing their true forms [5].
Terrestrial surveying methods, including total stations, Global Navigation Satellite Systems (GNSSs), and terrestrial laser scanning (TLS), offer improved accuracy by directly measuring the surface topography without geometric assumptions [6]. Total stations provide high-precision point measurements but require extensive field time and dense survey networks for adequate surface representation. GNSS-based approaches enable rapid data collection across large areas, but may suffer from signal obstruction and multipath effects in industrial environments [6]. TLS systems generate high-density point clouds with millimeter-level accuracy and have proven effective for stockpile monitoring in mining operations, with reported volume estimation accuracies within 2–5% [7]. However, these ground-based methods pose significant safety risks for employees, especially when inspecting hard-to-reach or hazardous areas, which necessitate increasing the number of reference points and improving estimation accuracy [6]. Additionally, these approaches are labor-intensive, time-consuming, and may be impractical for the frequent monitoring of large-scale stockpile inventories.
Conventional airborne photogrammetry using manned aircraft has been employed for stockpile volume estimation since the 1980s, particularly in quarrying and open-pit mining operations. Light aircraft equipped with small-format aerial cameras offer advantages in terms of safety and spatial coverage compared to ground-based methods [8]. Early applications demonstrated the feasibility of aerial approaches for volume estimation, though these systems were limited by a relatively coarse spatial resolution, high operational costs, complex flight planning requirements, and dependency on specialized photogrammetric expertise [8]. Furthermore, conventional airborne systems often struggled with the precise boundary delineation required for accurate stockpile volume calculations and were less suitable for frequent, routine monitoring due to logistical constraints.
In recent years, Unmanned Aerial Systems (UASs) have emerged as a transformative technology that addresses many of the limitations of conventional methods while combining the advantages of aerial coverage with improved accessibility, flexibility, and cost-effectiveness. UAS-based aerial surveying has become a popular, fast, and safe alternative for monitoring stockpiles with irregular geometry, offering several key advantages: (1) enhanced safety by eliminating personnel exposure to hazardous environments, (2) rapid data acquisition with flexible deployment schedules, (3) high-spatial-resolution imagery and elevation data, (4) cost-effective operation compared to manned aircraft, and (5) the capability for frequent monitoring and change detection. This approach has been successfully adopted across various industries, including mining [1,9], quarrying [4,10], construction site monitoring [11], and agriculture and forestry [12,13]. The high versatility, flexibility, and adaptability of UAS platforms, combined with advances in sensor miniaturization and data processing algorithms, make them ideal for site-scale remote sensing applications [14].
Achieving high precision in volume estimation with UAS data requires accurate spatial referencing, typically obtained through ground control points (GCPs) or GNSS-tagged imagery. However, using GCPs poses significant safety risks due to unstable ground and hazardous environments in mining areas. Additionally, GCP implementation is time-consuming and requires careful planning for establishing natural or artificial targets with appropriate visibility and accessibility. A safer alternative involves using UASs with GNSS receivers for real-time positional information [15,16]. Differential GNSS solutions, such as Real-Time Kinematic (RTK) or Post-Processed Kinematic (PPK) corrections, further enhance positional accuracy and often use continuously operating reference stations (CORSs) instead of a base station [17,18]. The integration of RTK/PPK enables the production of highly detailed and precise outputs without the need for GCPs [19]. However, in the absence of GCPs, careful camera calibration is essential to minimize systematic errors and ensure the geometric integrity of the resulting 3D models [20].
Various types of sensors can be mounted on UASs to capture terrain data. For instance, airborne Light Detection and Ranging (LiDAR) is an advanced remote sensing technology capable of providing detailed 3D information about the Earth’s surface. When mounted on a UAS, it employs a laser scanner to emit pulses of light toward the ground, which then reflect to the sensor. The time it takes for the laser pulses to return is used to calculate the distance, and when combined with data from a GNSS receiver and an inertial measurement unit (IMU), this information generates detailed 3D point clouds. Airborne LiDAR is instrumental in various applications, including topographic mapping [21], forestry [22], urban planning [23], coastal studies [24], archaeology, and environmental monitoring [25]. While recent advances have made UAS-borne LiDAR sensors significantly lighter and more affordable compared to earlier generations, they still tend to be heavier and more expensive than the typical optical sensors used on UAS platforms. Even compact units such as the Velodyne VLP-16 (~830 g) [26] weigh more than many RGB or multispectral cameras (<500 g) [27], and the cost of LiDAR units remains several times higher than that of most imaging payloads. These factors can still limit flight time and maneuverability, especially for smaller multirotor platforms or large-area surveys [28].
UAS-based photogrammetry with the Structure-from-Motion (SfM) technique is a more cost-effective and versatile alternative for generating high-resolution elevation models and orthomosaics [29]. These systems are generally lighter, allowing for longer flight times and greater coverage per flight. Unlike traditional photogrammetry, SfM does not require prior knowledge of the 3D position of the camera or multiple GCPs, as it reconstructs the position, orientation, and geometry through the automatic matching of features in a series of overlapping images [30].
Both UAS-based SfM photogrammetry and LiDAR contribute to generating Digital Surface Models (DSMs) and Digital Terrain Models (DTMs), which are essential for accurate volume calculations. DSMs capture the Earth’s surface, including structures and vegetation, while DTMs represent the bare Earth’s surface. Comparing DSMs with DTMs allows for the precise determination of stockpile volumes by isolating elevation changes. However, there are notable differences between the DSM/DTM products derived from SfM and those from LiDAR. SfM photogrammetry reconstructs surfaces based on image features, which can be less effective in areas with dense vegetation, as the method captures only the visible canopy surface. In contrast, LiDAR actively measures distances with laser pulses, allowing partial penetration through both high and low vegetation. This capability enables more accurate ground point detection and generally simplifies and improves point cloud classification for DTM generation in vegetated environments.
Over the years, numerous studies have considered stockpile volume estimation using photogrammetry and LiDAR. For example, Amaglo conducted an aerial survey using a customized Matrice 600 Pro UAS equipped with a Velodyne Ultra Puck 3D LiDAR to scan and estimate stockpile volumes [7]. The results were compared with those from TLS and UAS photogrammetry. TLS required three times the capture time of both photogrammetry and LiDAR, while the LiDAR processing time was only half that of the other methods. Furthermore, the volume estimates from TLS differed from those obtained with LiDAR and photogrammetry by approximately 0.7% and 3%, respectively. Similarly, Forte et al. employed a UAS equipped with a LiDAR sensor, integrating an onboard IMU and Global Positioning System (GPS) with LiDAR data and known environmental factors for real-time altitude correction [31].
More recent comparative studies have further demonstrated the reliability of UAS-based approaches for stockpile and earthwork monitoring. Mora et al. reported that photogrammetry using off-the-shelf small UAS equipment achieved accuracy within 2% of TLS-based stockpile volume estimates [32]. In contrast, Kuinkel et al. observed higher variability, reporting a Mean Absolute Percentage Error (MAPE) of 11.9% relative to the actual volume for a landfilled fly ash stockpile, highlighting the sensitivity of photogrammetric accuracy to stockpile characteristics and site conditions [33]. Ajayi and Ajulo found that UAS–SfM photogrammetry was not only more accurate (MAPE = 2.3%), but also more cost-effective than conventional total station surveys (MAPE = 2.9%) in estimating earthwork volumes [34].
While these studies highlight the potential of UAS-based photogrammetry and LiDAR for stockpile monitoring, several challenges remain—particularly in achieving cost-effective and scalable solutions for larger geographic areas. UAS imagery can provide high-resolution top and base surface information, making it well-suited for site-scale volume estimation. However, its application to regional-scale (e.g., watershed-level) studies is limited by flight time, battery life, and operational costs. As a result, there is a need to utilize publicly available, coarser-resolution elevation datasets, which typically include only the top surface and lack base surface data [35,36]. This limitation significantly reduces their utility for volume estimation, especially in historical mining contexts. Therefore, exploring alternative techniques for generating base surface information from these publicly available datasets is crucial for accurate volume estimation on a regional scale.
To address these challenges, this study proposes an integrated and automated approach that combines UAS photogrammetry, interpolation-based base surface modeling, and edge detection techniques to enable accurate and scalable volume estimation. The specific objectives of this study are as follows:
  • To develop an automated edge detection approach using slope raster for precise stockpile boundary delineation;
  • To evaluate the accuracy of coal stockpile volume estimates derived from the UAS photogrammetric approach in comparison to industry-standard LiDAR;
  • To assess interpolation techniques for generating representative base surface information to enable volume estimation in cases where base surface data is unavailable.

2. Methodology

2.1. Study Area

To estimate the volume of coal stockpiles, UAS data were collected from a coal storage facility, operated by CCU Coal and Construction LLC (Coshocton, OH, USA), near Cadiz in Harrison County, Ohio. This facility spans an area of approximately 70,000 m2 and is located between 80°0′25″–81°0′17″ west longitude and 40°12′56″–40°13′4″ north latitude (Figure 1). At this site, bituminous coal from the CCU Sexton Strip mine [37] is stockpiled and processed.
The storage area includes raw coal stockpiles, a hydraulic crusher, material handling equipment, and crushed coal stockpiles. Large chunks of raw coal from active mining operations are initially stored in large raw coal stockpiles. Using material handling equipment, the raw coal is transported to the hydraulic crusher, which breaks it down into smaller pieces (Figure 1d). These smaller, crushed coal pieces are then stockpiled before being transported to coal-fired power plants. The storage facility had six coal stockpiles in total: three for raw coal and three for crushed coal.

2.2. Overview of Methodology

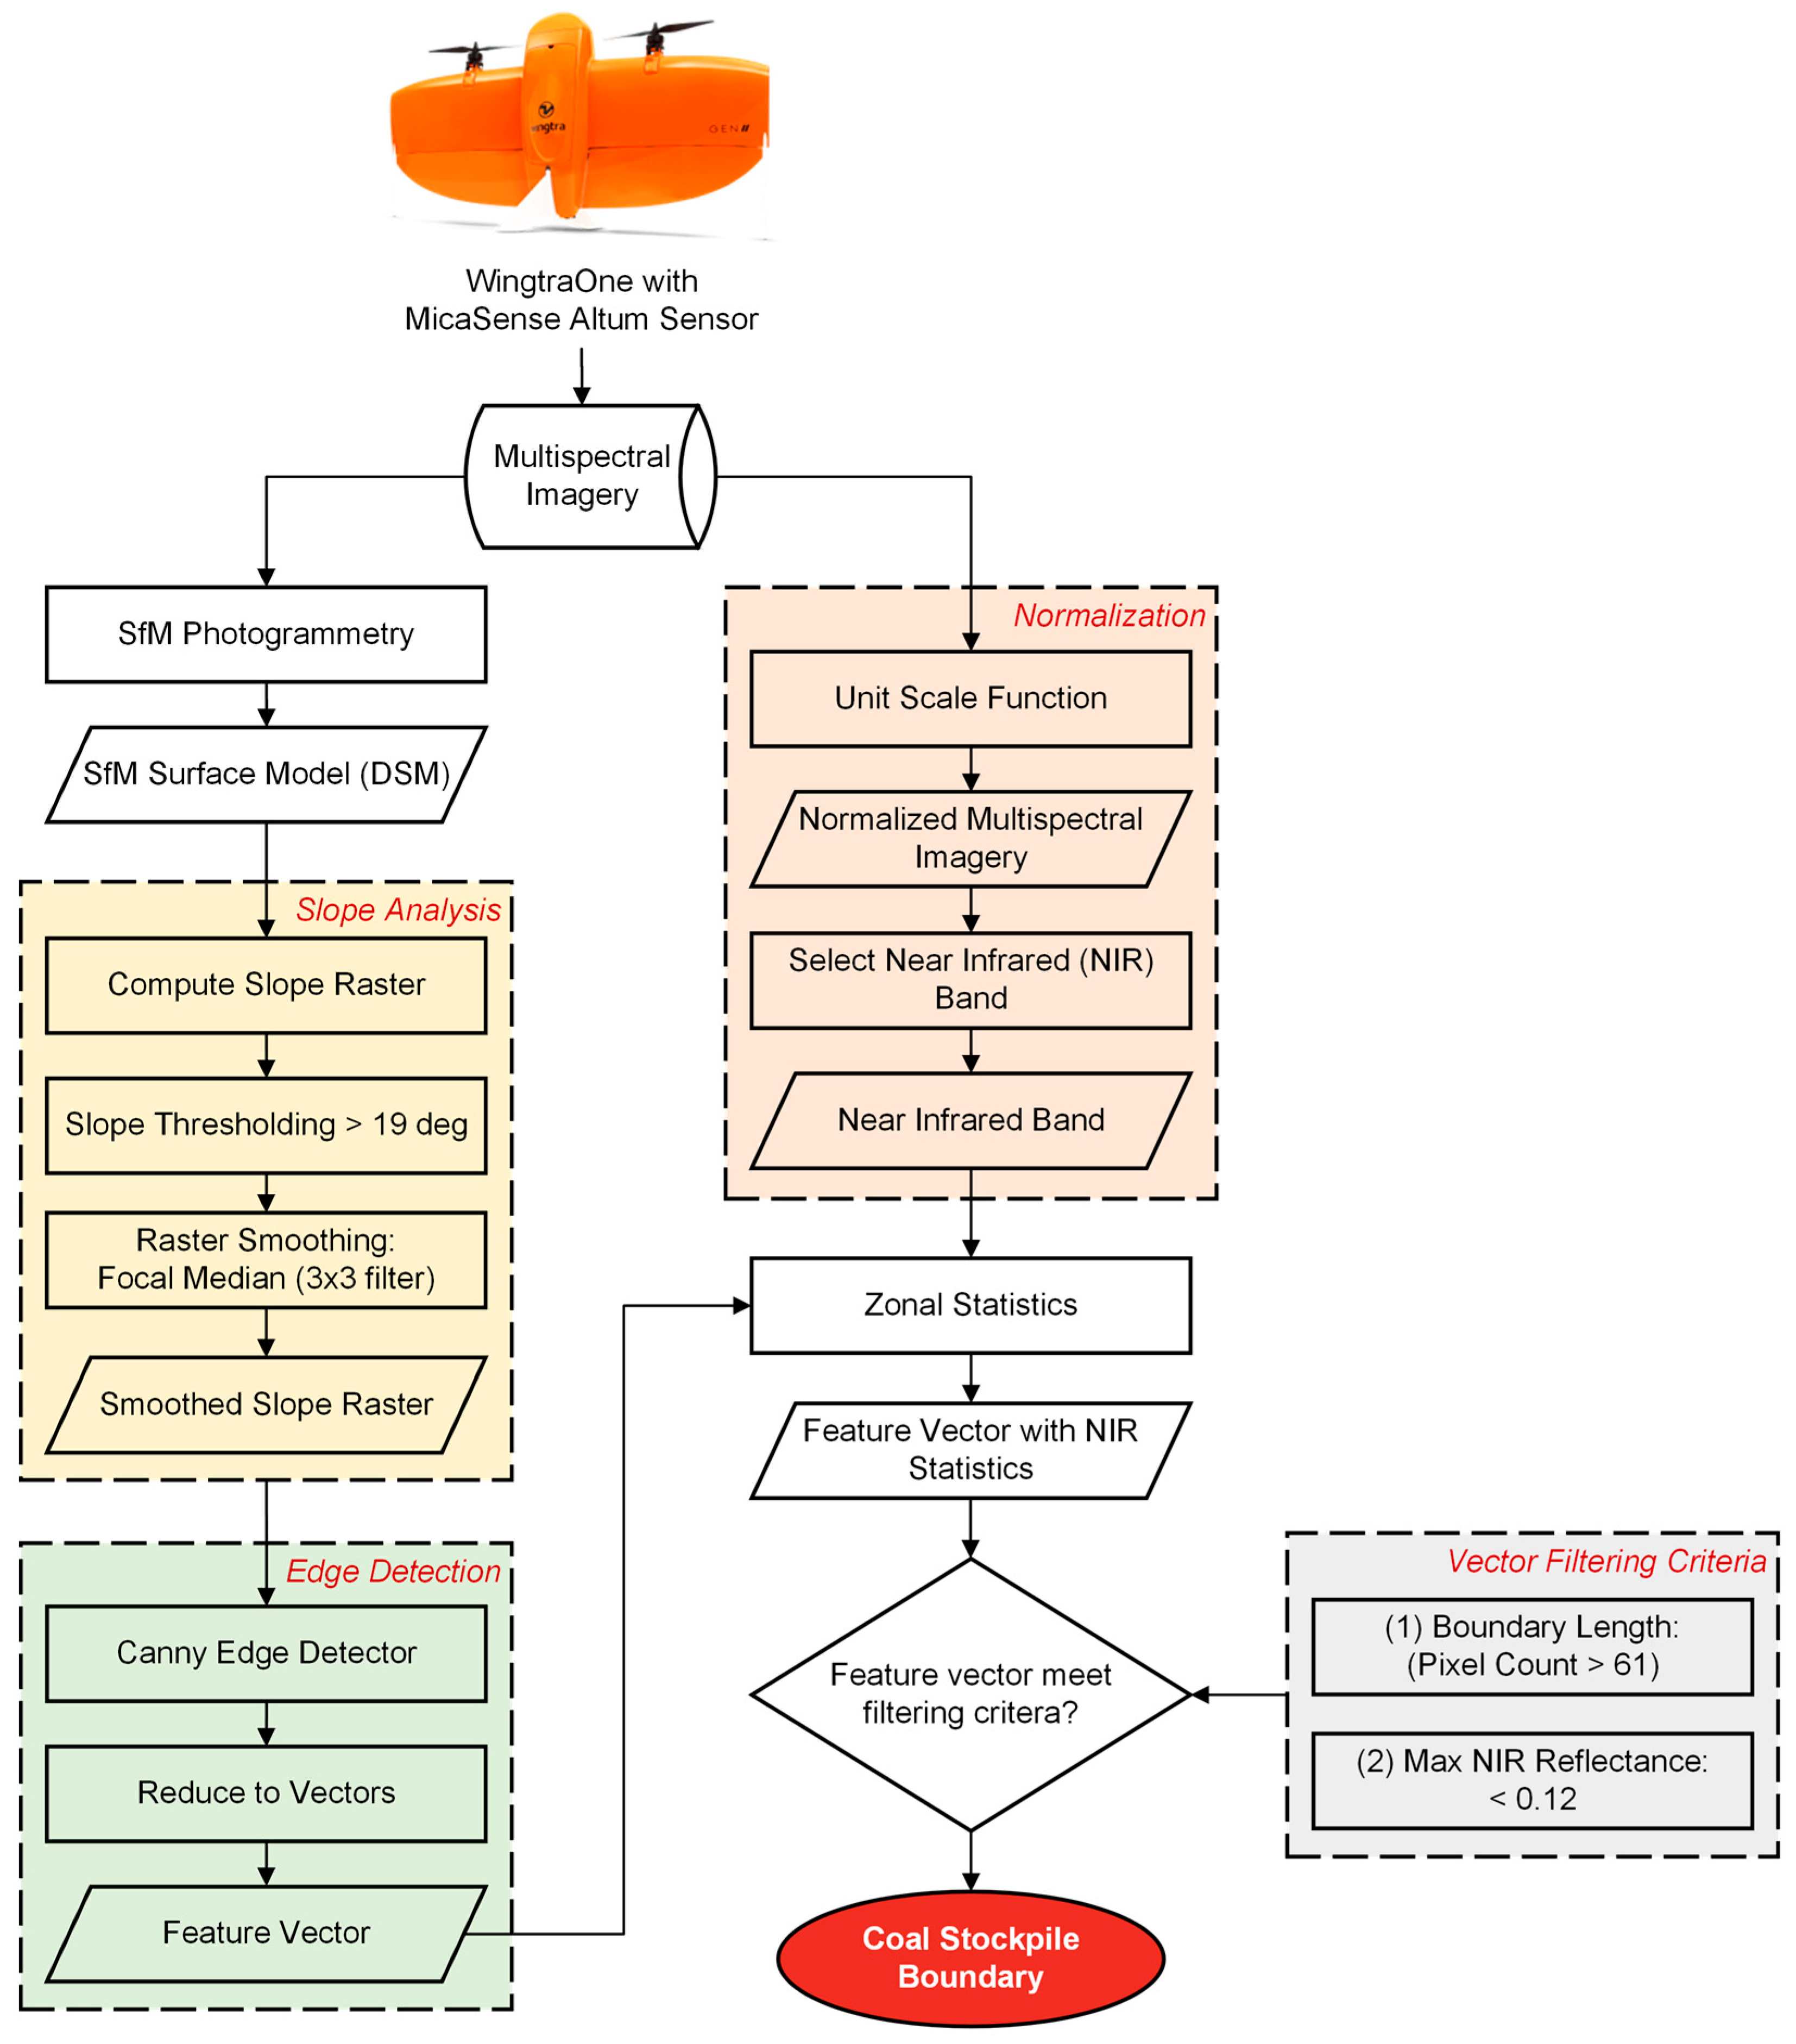
This study examined the efficacy of three volume estimation approaches integrated with an automated boundary detection technique. The workflow begins with automated stockpile boundary delineation using edge detection algorithms applied to a slope raster derived from an elevation model (Figure 2). The boundary delineation workflow combines topographic information from SfM-derived DSMs with spectral information from multispectral imagery to automatically identify coal stockpile boundaries. Specifically, slope thresholding (>19°) is used to isolate steep-sided stockpiles, followed by focal median filtering to reduce noise. Canny edge detection is then applied to extract boundary features. Finally, two filtering criteria are used to remove false positives: the minimum boundary length and a maximum Near-Infrared (NIR) reflectance threshold (<0.12), derived from multispectral imagery. This multi-step process eliminates the need for manual digitization and ensures objective, consistent, and reproducible boundary identification across all stockpiles.
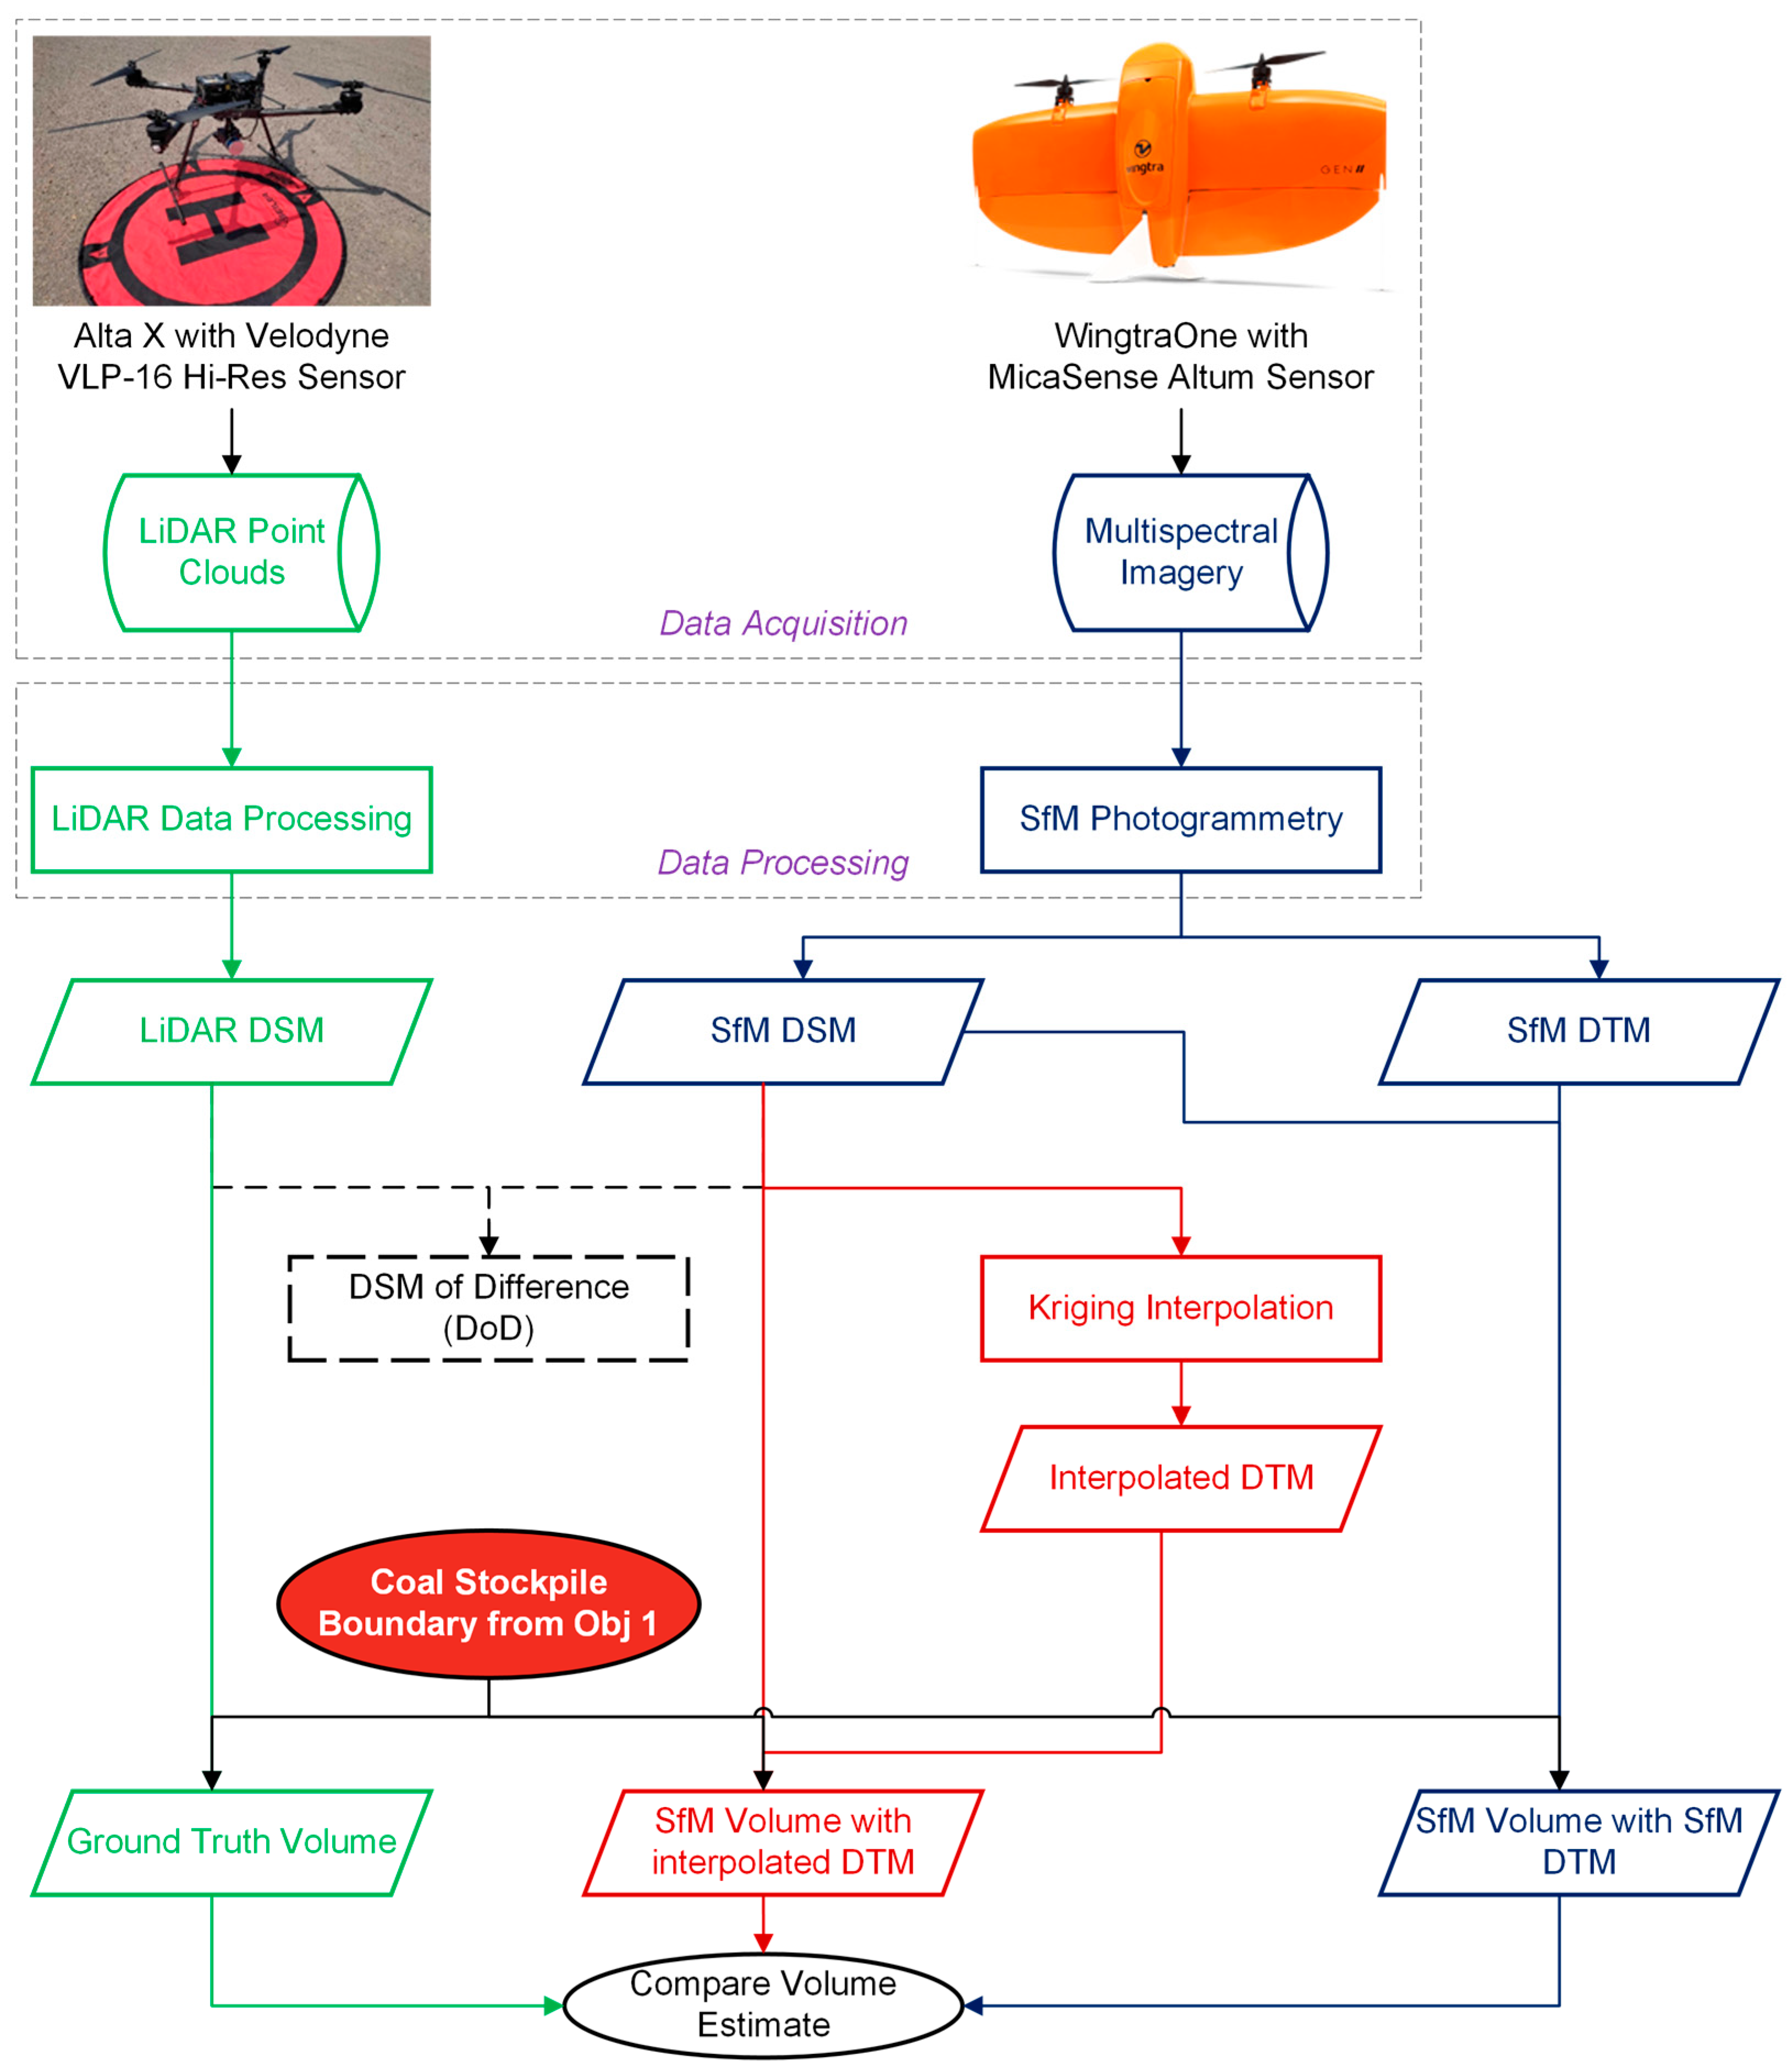
Following boundary detection, volume estimates are calculated using three distinct approaches (Figure 3). The volume estimates obtained from the DSM derived from the LiDAR point cloud were treated as the benchmark, referred to as the “LiDAR” estimate. The relative accuracy of the other two approaches was then evaluated against this benchmark. The first alternative approach, referred to as “SfM–DTM”, used both the DSM and DTM generated through SfM photogrammetry. In the second approach, referred to as “SfM–intDTM”, the same DSM from SfM photogrammetry was used, but adapted for scenarios where a DTM was unavailable. In this case, kriging interpolation was applied to the DSM to create a representative DTM for accurate volume estimation.
This study also investigates how the spatial resolution affects the accuracy of volume estimates. Higher-resolution elevation data, while potentially more accurate, also increases the number of computational demands. Therefore, it is essential to evaluate these trade-offs, especially when scaling these automated approaches for regional-scale analyses, where the processing efficiency becomes critical.

2.3. Data Acquisition

In this study, two distinct UAS platforms were used to collect complementary remote sensing datasets for stockpile characterization: LiDAR-based 3D structural information and high-resolution multispectral imagery. The use of separate platforms was necessary due to the specialized nature of the sensors—LiDAR sensors require a UAS with a high payload capacity and power management, whereas multispectral imaging requires a platform optimized for long flight times, stability, and radiometric calibration.
For LiDAR data acquisition, a Freefly Alta X (Freefly Systems, Woodinville, WA, USA) quadcopter (Figure 4, left), equipped with an RTK module along with a Velodyne VLP-16 Hi-Res (Velodyne Lidar, San Jose, CA, USA) sensor, was used. The Alta X was chosen for its ability to support heavy payloads and maintain stable flight during low-altitude surveys. The technical specifications of the Alta X UAS and Velodyne VLP-16 Hi-Res sensor are provided in Tables S1 and S2 (Supplementary Materials), respectively.
The LiDAR flight was conducted at an altitude of 44 m above ground at a speed of 4 m/s to ensure high point density and ground coverage. The UAS was flown in a grid pattern to maintain 80% side overlap. The VLP-16 Hi-Res sensor features 16 channels and has a measurement range of up to 100 m with a typical accuracy of ±3 cm for capturing 3D point clouds. The single return mode, which captures the strongest return, was used to reduce the noise from multiple returns. It operates with low power consumption (~8 watts) and weighs approximately 830 g.
During the survey, the RTK module on the UAS received GNSS signals from satellites and real-time correction data from the Freeport (FREO) CORS station operated by the Ohio Department of Transportation (ODOT). This significantly reduced the number of positional errors and achieved centimeter-level accuracy [19].
For multispectral data acquisition, the State-of-the-Art vertical take-off and landing (VTOL) WingtraOne (Wingtra AG, Zurich, Switzerland) UAS (Figure 4, right) was utilized. The PPK technique, integrated into the WingtraHub platform, enhanced the geolocation accuracy with horizontal and vertical accuracies of 0.02 m and 0.03 m, respectively. In this study, mission planning utilized the WingtraPilot software version 2.0 (Wingtra AG, Zurich, Switzerland) with side and front overlaps set at 70%. The flight altitude was maintained at 120 m above ground level, yielding a ground sampling distance (GSD) of 6.63 cm. The WingtraOne UAS was equipped with the MicaSense Altum (MicaSense, Seattle, WA, USA) sensor for collecting multispectral data. The detailed technical specifications of the WingtraOne UAS and MicaSense Altum sensor are provided in Tables S3 and S4 (Supplementary Materials), respectively.

2.4. Data Processing

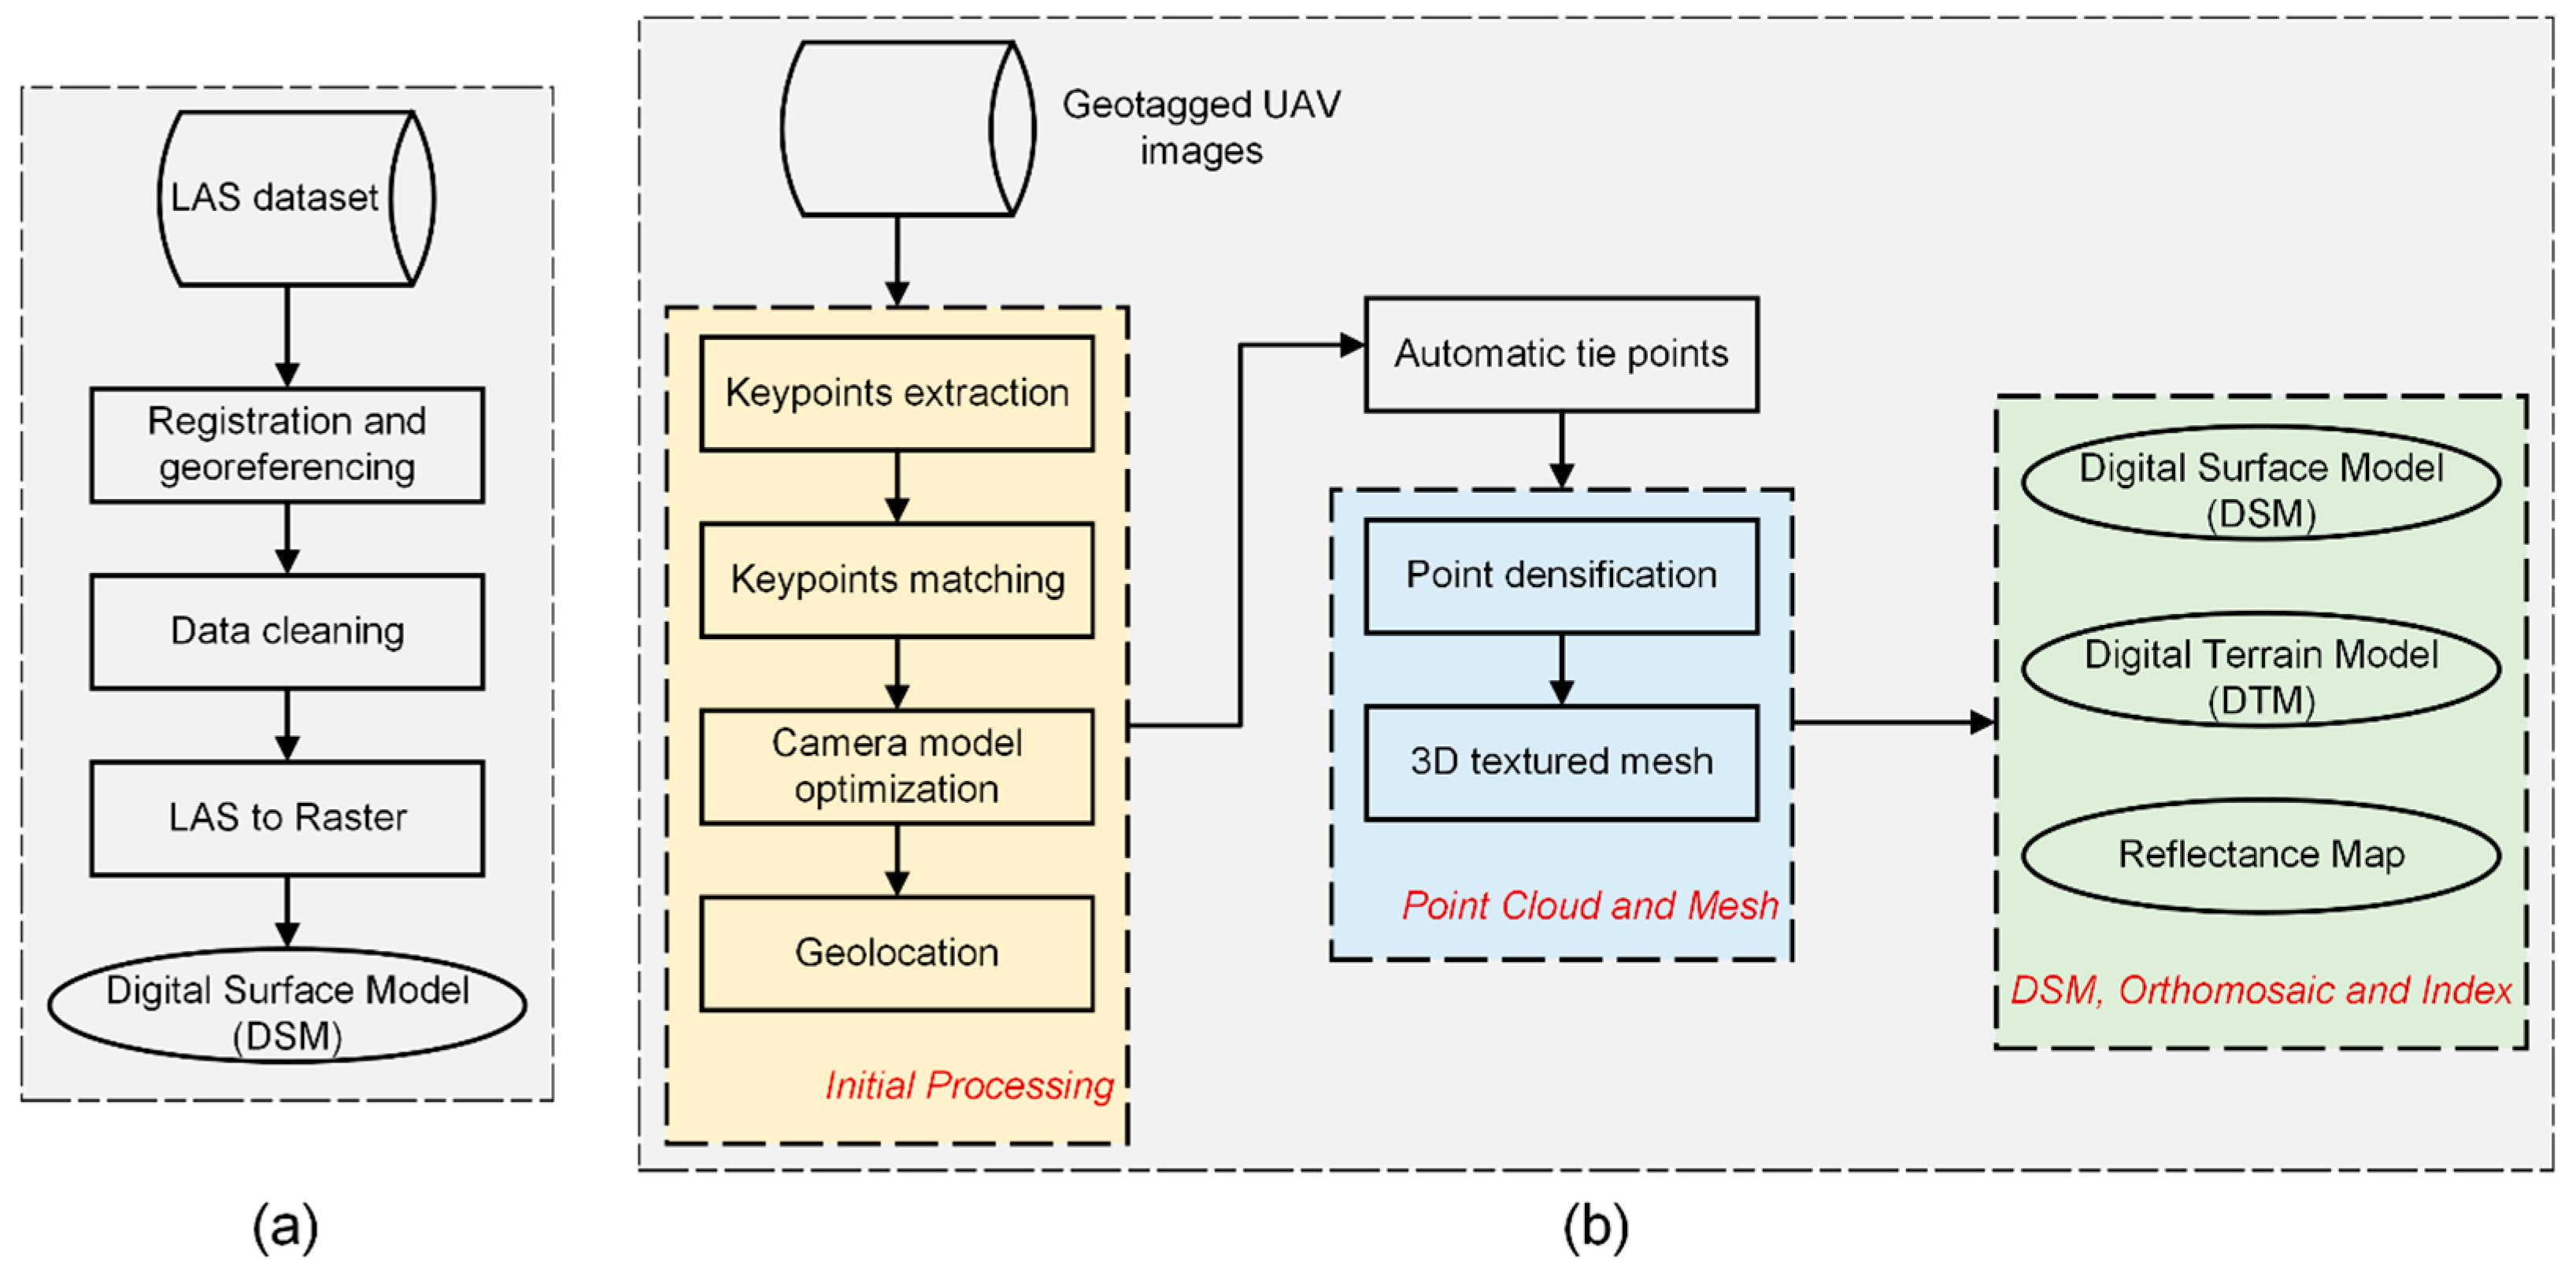
Initially, the LAS (LASer file format) dataset, comprising pointers to LAS files and surface constraints, was created in ArcGIS Pro version 3.0.0 (Esri, Redlands, CA, USA) [38]. The average point density of the LAS dataset was 247.44 points/m2. The “LAS Dataset to Raster” function was then used to generate the georeferenced 0.06 m-resolution DSM for the coal stockpiles. The detailed workflow for obtaining the DSM from LiDAR point clouds is illustrated in Figure 5a.
Similarly, the image processing workflow in Pix4D Mapper version 4.7.5 (Pix4D, Prilly, Switzerland) [39] was utilized for the SfM photogrammetry task (Figure 5b). Initially, geotagged UAS images were imported into the software for initial processing. This involved extracting the key points from each image, which served as the reference points for subsequent analysis. Pix4D’s key point matching algorithms then identified the corresponding points between overlapping images, facilitating accurate alignment and reconstruction. Simultaneously, the software optimized the camera model parameters to ensure the precise calibration and alignment of the images in 3D space. Subsequently, Pix4D generated a dense point cloud representing the surface geometry and constructed the DSM, DTM, and orthomosaics from this data. The spatial resolutions of the DSM, DTM, and orthomosaics obtained from SfM photogrammetry were 0.06 m, 0.32 m, and 0.06 m, respectively. The spatial resolutions of the DSM and orthomosaics were both set to 0.06 m, corresponding to the average GSD of the input imagery. In contrast, the DTM was generated at a coarser resolution of 0.32 m, as determined by Pix4D’s default settings (5 × GSD) for DTM interpolation from the filtered point cloud, which balances terrain smoothing with computational efficiency.

2.5. Stockpile Boundary Delineation

The automated boundary detection process involved several key steps implemented through an integrated workflow combining slope analysis, spectral analysis, and edge detection techniques (Figure 2). Prior to boundary detection, the SfM-derived DSM was clipped to focus on the coal stockpile storage area, reducing the computational overhead and eliminating irrelevant terrain features outside the area of interest. The workflow then performed slope analysis, in which a slope raster was computed from the SfM-derived DSM, followed by slope thresholding (>19°) to identify areas with significant terrain changes. The >19° threshold was determined empirically by analyzing slope histograms of the study area and selecting the value that best separated the steep flanks of coal stockpiles from the surrounding flat ground. A focal median filter (3 × 3 kernel) was then applied for raster smoothing to reduce noise while preserving edge characteristics [40].
Simultaneously, the multispectral imagery was normalized using a unit scale function. The NIR band was then selected for its effectiveness in distinguishing vegetation and metallic objects, such as vehicles and equipment, from mineral surfaces. The zonal statistics were computed to extract the NIR reflectance values corresponding to the slope-identified areas, with the maximum NIR reflectance value used as the representative statistic for each zone. This generates feature vectors that combine both topographic (slope) and spectral (NIR maximum) information.
The edge detection component uses a Canny edge detector applied to the smoothed slope raster to identify abrupt terrain gradients [41]. In this step, a gradient magnitude threshold of 0.7 is used to determine which pixels are considered edge features, while a Gaussian filter with a sigma value of 1.5 is applied before detection to suppress noise and enhance meaningful edges.
The detected edge features are then converted to a vector format, creating feature vectors that represent potential boundary segments. These vectors are filtered based on two criteria: (1) a minimum length constraint (pixel count > 61) to remove small and noisy segments, and (2) a maximum NIR reflectance threshold (<0.12) to exclude vegetation and man-made structures. The 61-pixel length threshold corresponds to a physical length of approximately 61 m and was chosen based on the smallest continuous boundary segment observed in manually digitized stockpiles. Segments shorter than this length were found to represent noise or minor surface irregularities rather than the true stockpile boundaries. Segments that satisfy both criteria are classified as coal stockpile boundaries, enabling the automated, objective, and repeatable delineation of stockpile areas.
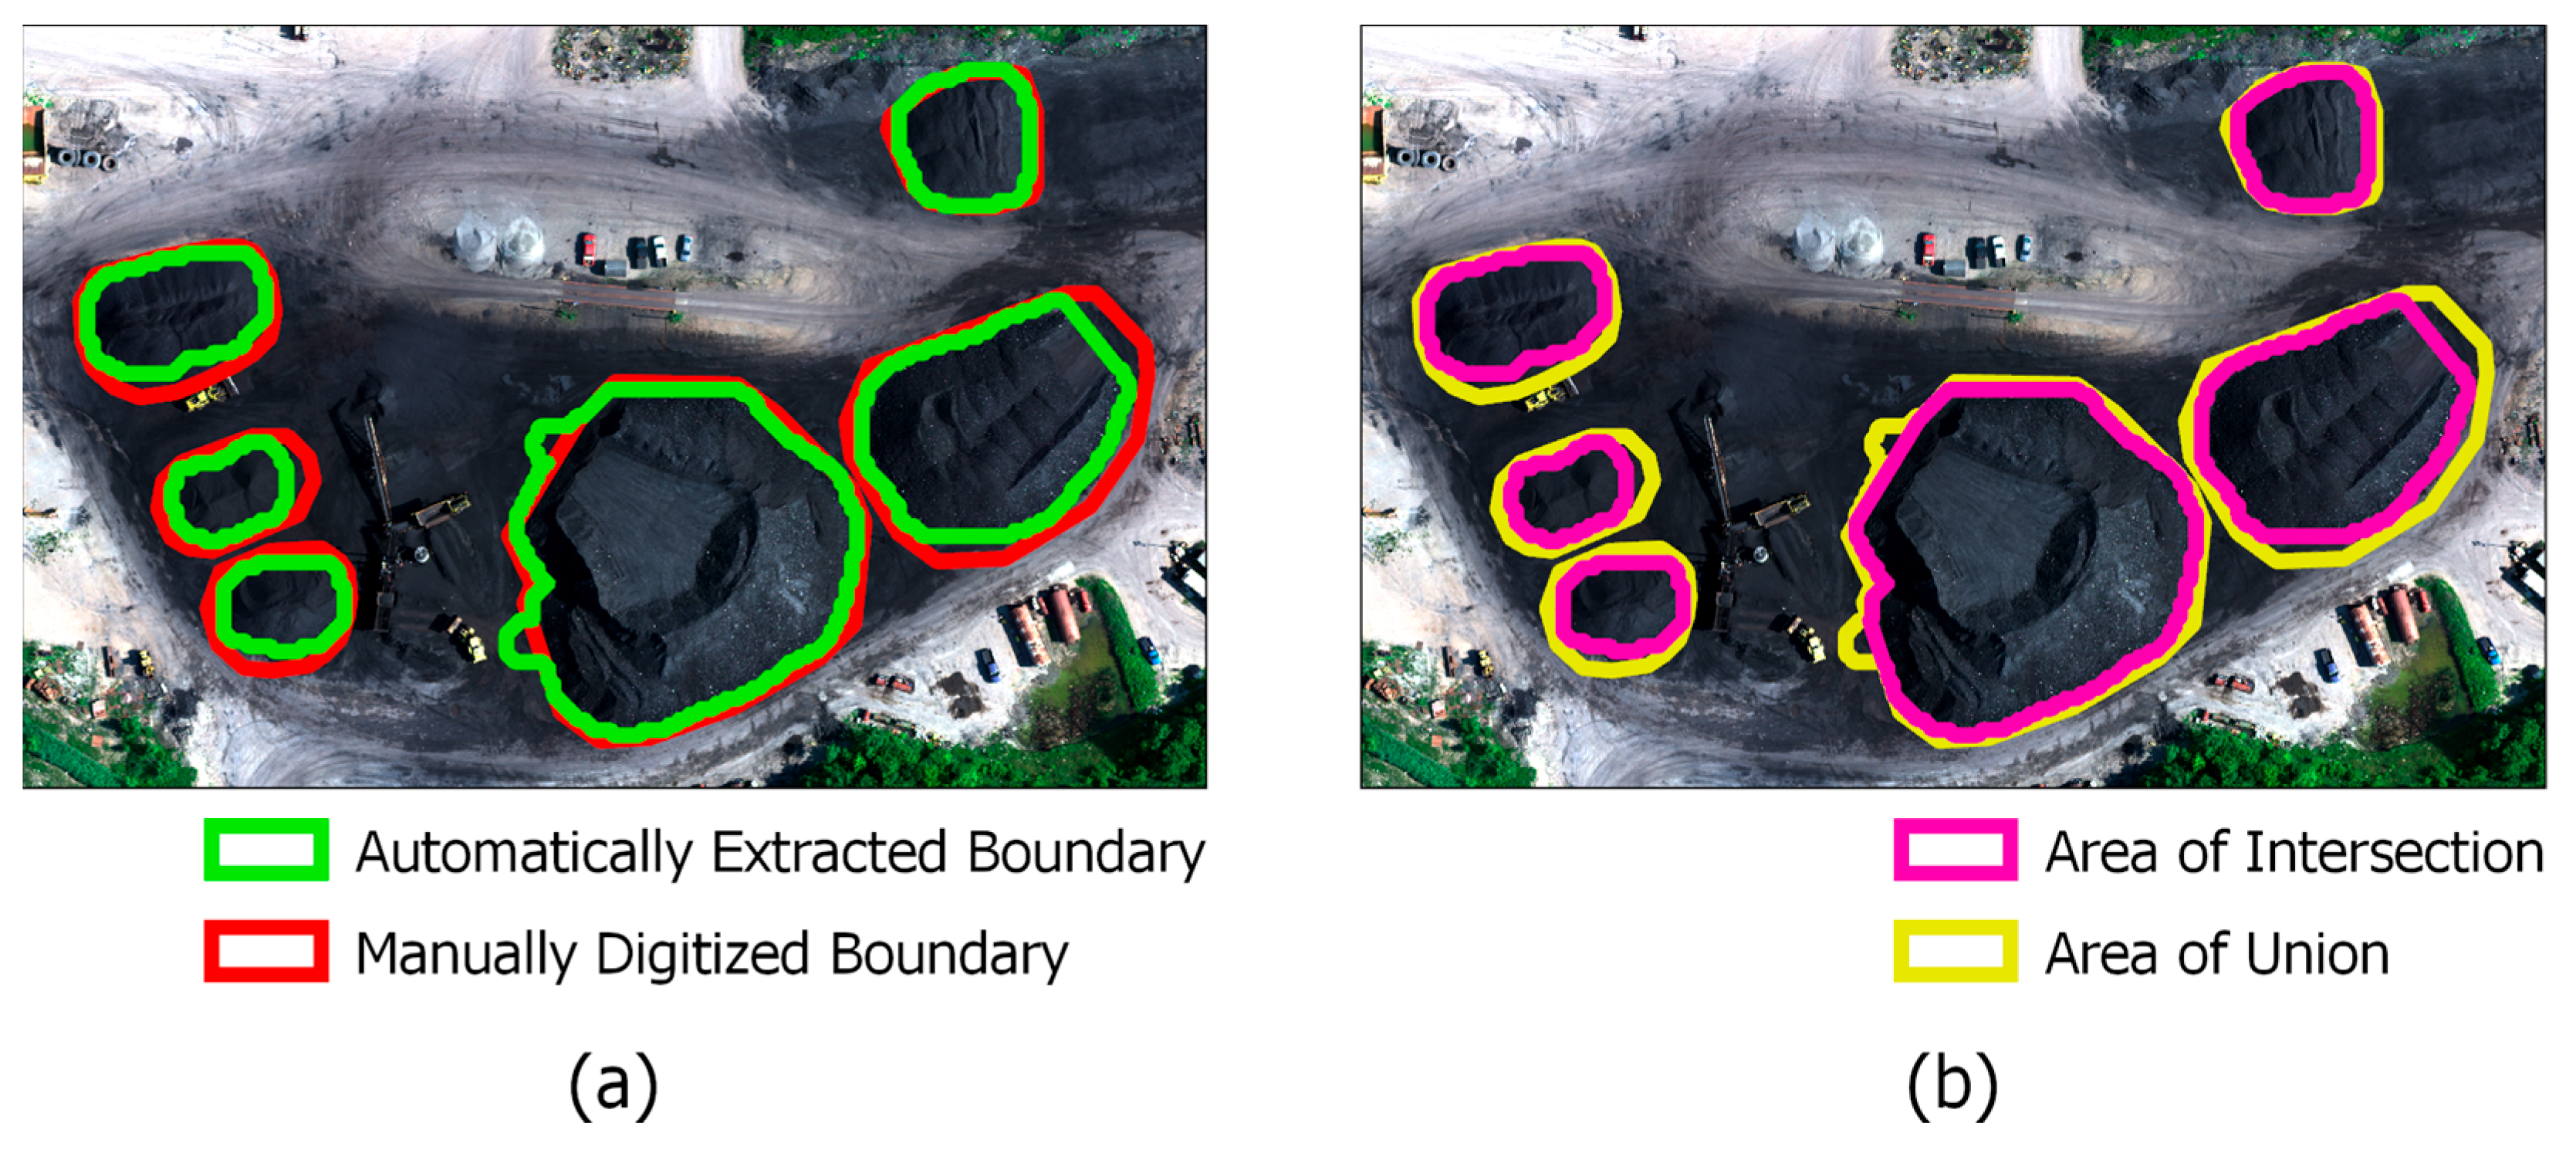
The accuracy of the delineated boundaries was evaluated using the Intersection over Union (IoU) metric, calculated with manually digitized stockpile boundaries as the reference. The IoU quantifies the spatial overlap between automated and reference polygons, providing an objective measure of the boundary extraction workflow.

2.6. DSM of Difference (DoD)

The DSM of Difference (DoD) was utilized to compare the 3D surface models generated from SfM photogrammetry against those from LiDAR and visualize the spatial differences across the target stockpiles. This comparison enables a pixel-by-pixel evaluation of the elevation discrepancies and spatial accuracy between the two datasets. In ArcGIS Pro, the SfM-derived DSM was subtracted from the LiDAR-derived DSM using the Raster Calculator tool, resulting in a DoD raster where each pixel value represents the vertical difference between the two models. Positive values indicate areas where the LiDAR surface was higher than the SfM model, while negative values suggest the opposite. The DoD analysis provides a detailed spatial visualization of where and how much the two datasets deviate, which is particularly valuable in stockpile mapping applications. It helps to assess the relative accuracy, detect systematic bias, and identify potential inconsistencies in volume estimates. As such, the DoD analysis supports the validation of SfM-based approaches and their suitability for stockpile volume assessment when compared to the more established LiDAR method.

2.7. Generating a Representative DTM for Coal Stockpiles Using Kriging Interpolation

Kriging interpolation was performed in ArcGIS Pro to predict spatial patterns from a set of observed points. Initially, a 1 m buffer (side type: full) was created around the detected coal stockpile boundary to extract the terrain elevation of the base surface from the DSM. Subsequently, ordinary kriging was applied using a spherical semivariogram model to configure the kriging parameters. The spherical semivariogram model was selected as it is commonly used for modeling spatial patterns with a clearly defined range and gradual spatial autocorrelation, which is typical in natural terrain surfaces such as coal stockpile bases. Preliminary empirical semivariogram fitting indicated that the spherical model provided the best balance between model simplicity and goodness of fit for our terrain elevation data. The final parameters resulting from this analysis were a partial sill of 5.71 and a major range of 101.51. These parameters resulted in the creation of a DTM with a spatial resolution of 0.06 m. These parameters were selected to accurately capture the spatial variability of the terrain elevation, ensuring precise volume estimation of the coal stockpiles. To ensure a consistent basis for comparing volume estimates, the spatial resolution of all other DSMs and DTMs was resampled to 0.06 m.

2.8. Statistical Analysis

The stockpile volume was calculated pixel by pixel using DSM and DTM layers with Equation (1) [42].
Volume = GSD × GSD × ∑(DSM − DTM)
In this equation, (DSM − DTM) is the elevation difference for each pixel within the delineated stockpile boundary. The pixel-wise differences were summed and multiplied by the pixel area (GSD2) to compute the total volume in cubic meters.
Since the study area comprised only six coal stockpiles, comparisons between the benchmark and alternative approaches were based on six observation pairs. The non-parametric Wilcoxon signed-rank test [43], which does not assume normality, was employed for statistical significance testing. The null hypothesis of the Wilcoxon signed-rank test assumes that the median of the paired differences is zero.

2.9. Evaluation Metrics

In addition to significance testing, the relative accuracy of the volume estimates using alternative SfM approaches compared to the benchmark LiDAR estimate was evaluated using the following statistical indicators.
C C C = 2 S X Y S X 2 + S Y 2 + X ¯ Y ¯ 2
R 2 = i = 1 m ( X i X ¯ ) ( Y i Y ¯ ) 2 i = 1 m X i X ¯ 2 i = 1 m Y i Y ¯ 2
R M S E = 1 m i = 1 m Y i X i 2
M A P E = 1 m i = 1 m Y i X i Y i × 100
Here, X i and Y i represent the benchmark volume estimate and alternative volume estimates, respectively. X ¯ and Y ¯ denote their respective averages and m is the number of data points. S X 2 and S Y 2 are the variances of X and Y , respectively. S X Y is their covariance.
Lin’s Concordance Correlation Coefficient (CCC) evaluates both precision and accuracy to measure the agreement between two methods, with values closer to 1 indicating stronger concordance [44]. The coefficient of determination (R2) indicates the proportion of variance in the benchmark LiDAR estimate explained by the alternative approaches. The Root Mean Square Error (RMSE) provides a measure of the model’s performance, where a lower RMSE signifies higher accuracy. Similarly, the MAPE quantifies the average magnitude of errors, regardless of their direction. The RMSE emphasizes larger errors, while the MAPE focuses on the average absolute percentage difference. Together, the RMSE and MAPE offer insights into the variation and magnitude of estimation errors.

3. Results and Discussion

3.1. Stockpile Boundary Delineation

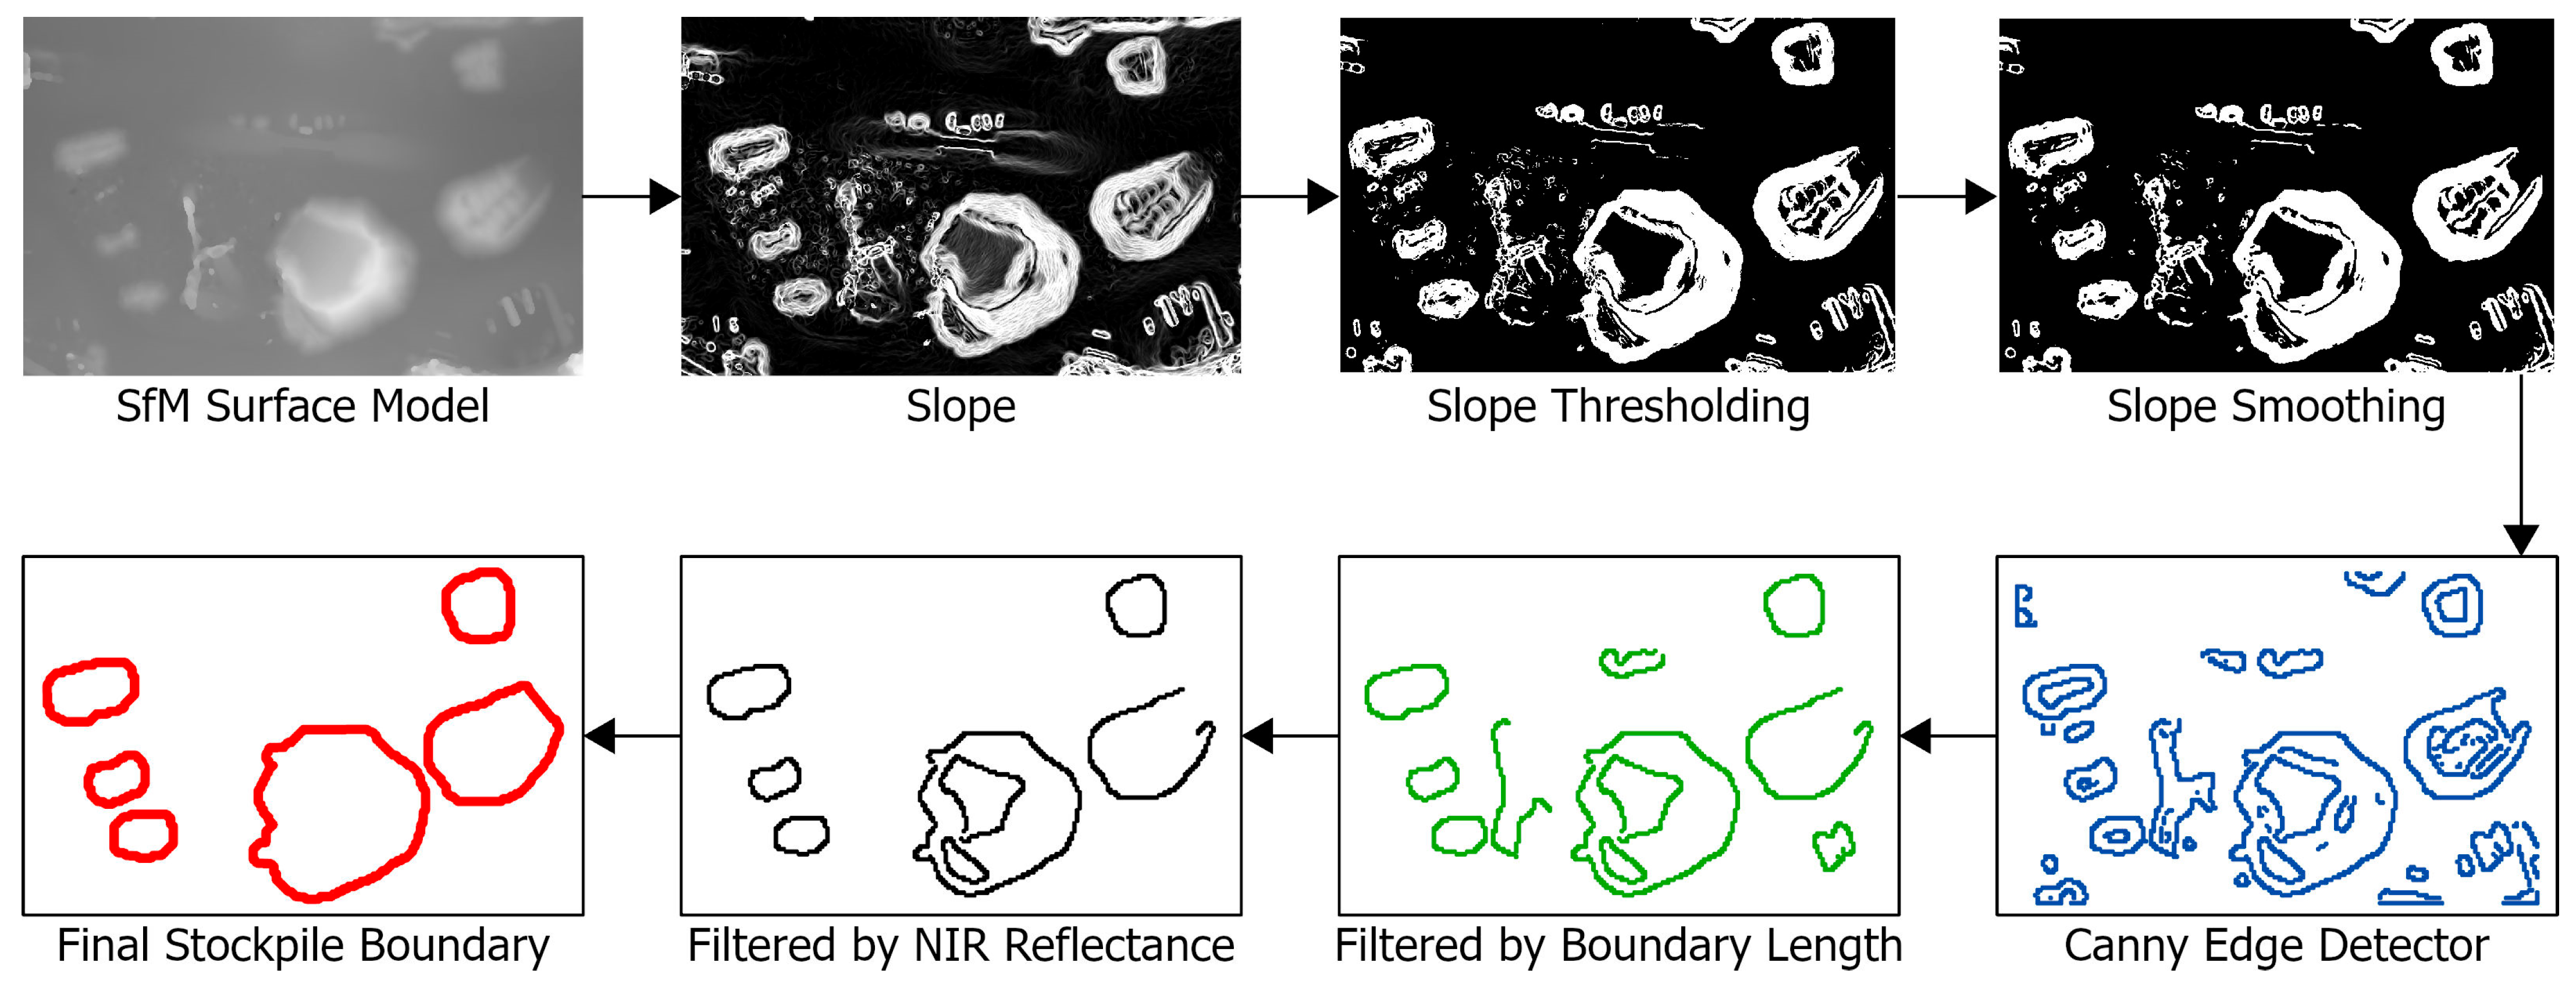
Figure 6 illustrates the sequential outputs of the stockpile boundary delineation workflow. The initial slope analysis successfully identified prominent terrain features by computing the slope gradients from the SfM-derived DSM. Areas with slopes exceeding 19 degrees were retained, effectively highlighting regions with significant terrain changes corresponding to potential stockpile locations. The subsequent application of a focal median filter (3 × 3 kernel) enhanced the separation between high-relief stockpile regions and the surrounding flat terrain, while reducing noise artifacts. The Canny edge detection algorithm, applied to the smoothed slope raster, effectively captured distinct boundary edges around the identified stockpile areas. The conversion of the detected edges to the vector format enabled the application of two critical filtering criteria. First, the minimum length constraint successfully removed small, fragmented segments and noise artifacts that could introduce errors in boundary definition. Second, NIR reflectance-based filtering effectively eliminated non-stockpile features, including vegetation, vehicles, and other metallic structures, ensuring that only coal stockpile boundaries were retained in the final output.
The accuracy of the final delineated boundaries was assessed against manually digitized boundaries using the IoU metric (Figure 7, Table 1). The IoU values ranged from 0.65 to 0.94, indicating a generally high level of agreement between the automatically extracted and manually digitized boundaries. The highest accuracy (IoU = 0.94) was achieved for a large raw coal stockpile (Stockpile #1), while lower IoU values were observed for smaller and more irregularly shaped crushed coal stockpiles (e.g., Stockpile #5, IoU = 0.65). These variations in accuracy are likely influenced by differences in stockpile geometry and boundary clarity in the imagery. It should be noted, however, that the manual digitization process is inherently subjective, as operators may interpret stockpile boundaries differently—particularly in areas where the edges are indistinct—which could have influenced the reported accuracy values. Overall, the delineation method demonstrated robust performance across different stockpile sizes and types.

3.2. 3D Representation of Coal Stockpiles

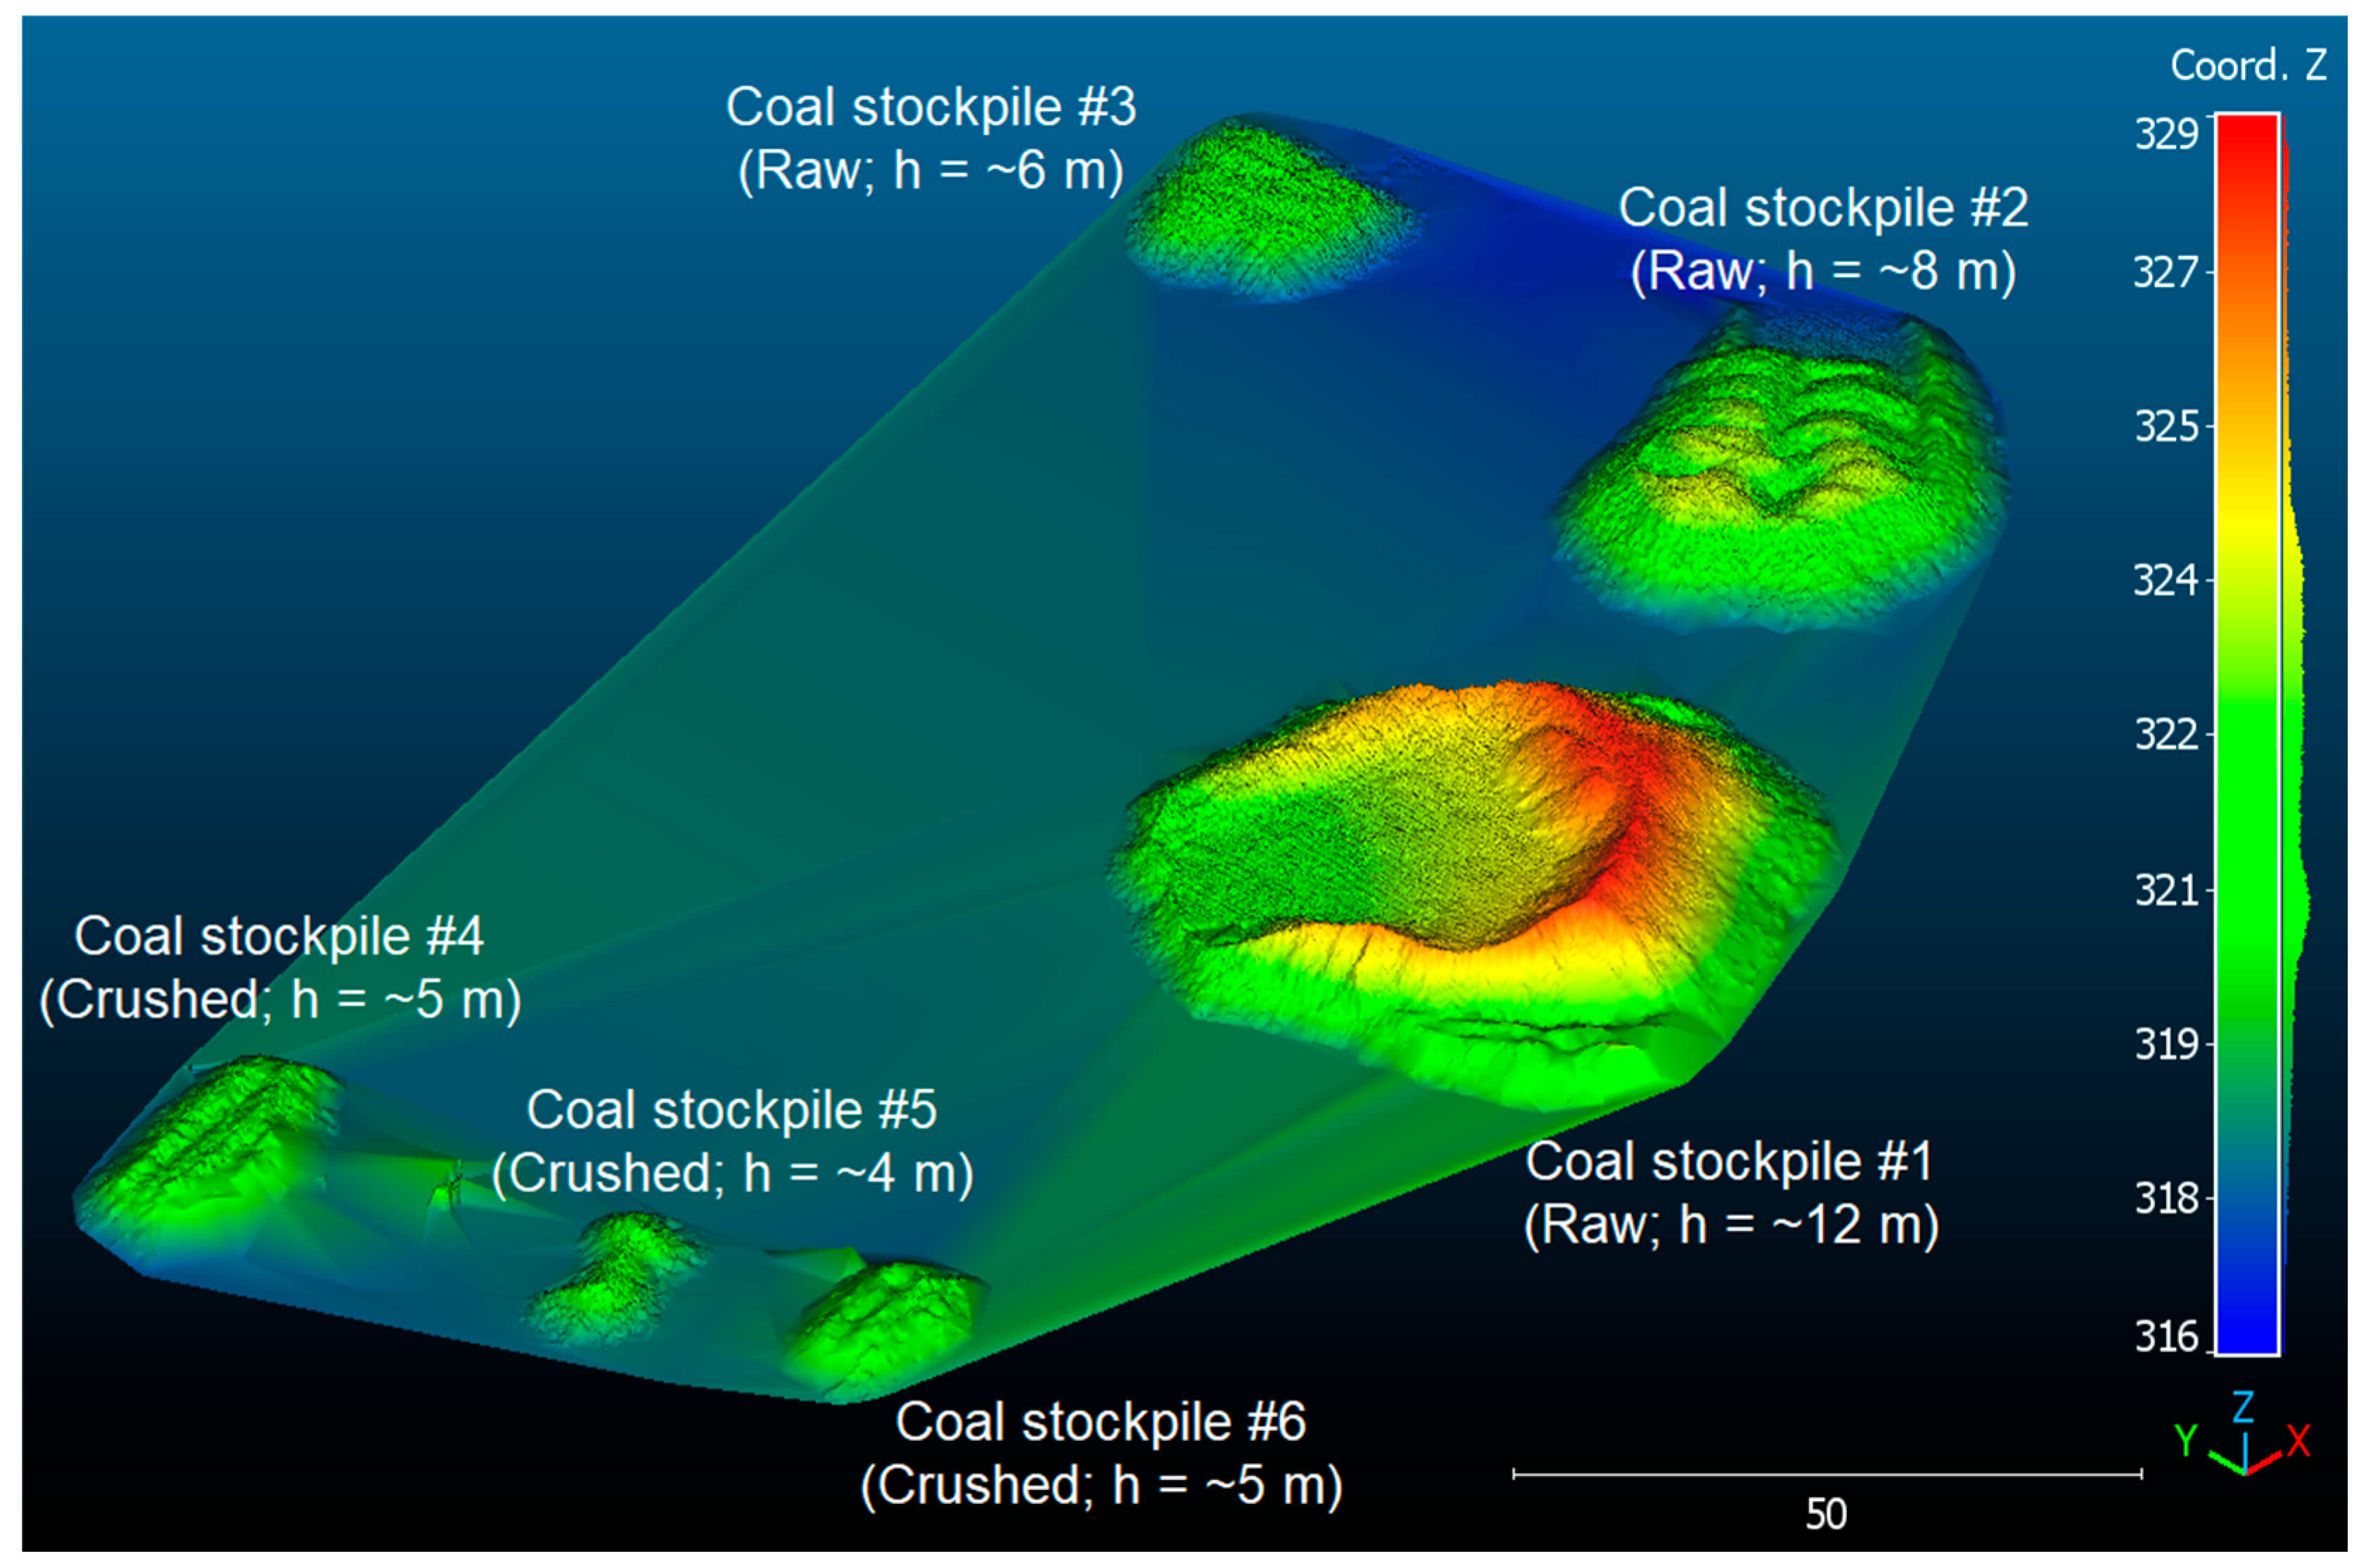
The raw coal stockpiles in the study area exhibited larger dimensions and heights due to the nature of coal mining operations (Figure 8). Raw coal stockpiles ranged in height from 6 to 12 m, whereas crushed coal stockpiles averaged approximately 5 m in height.

3.3. DSM of Difference (DoD)

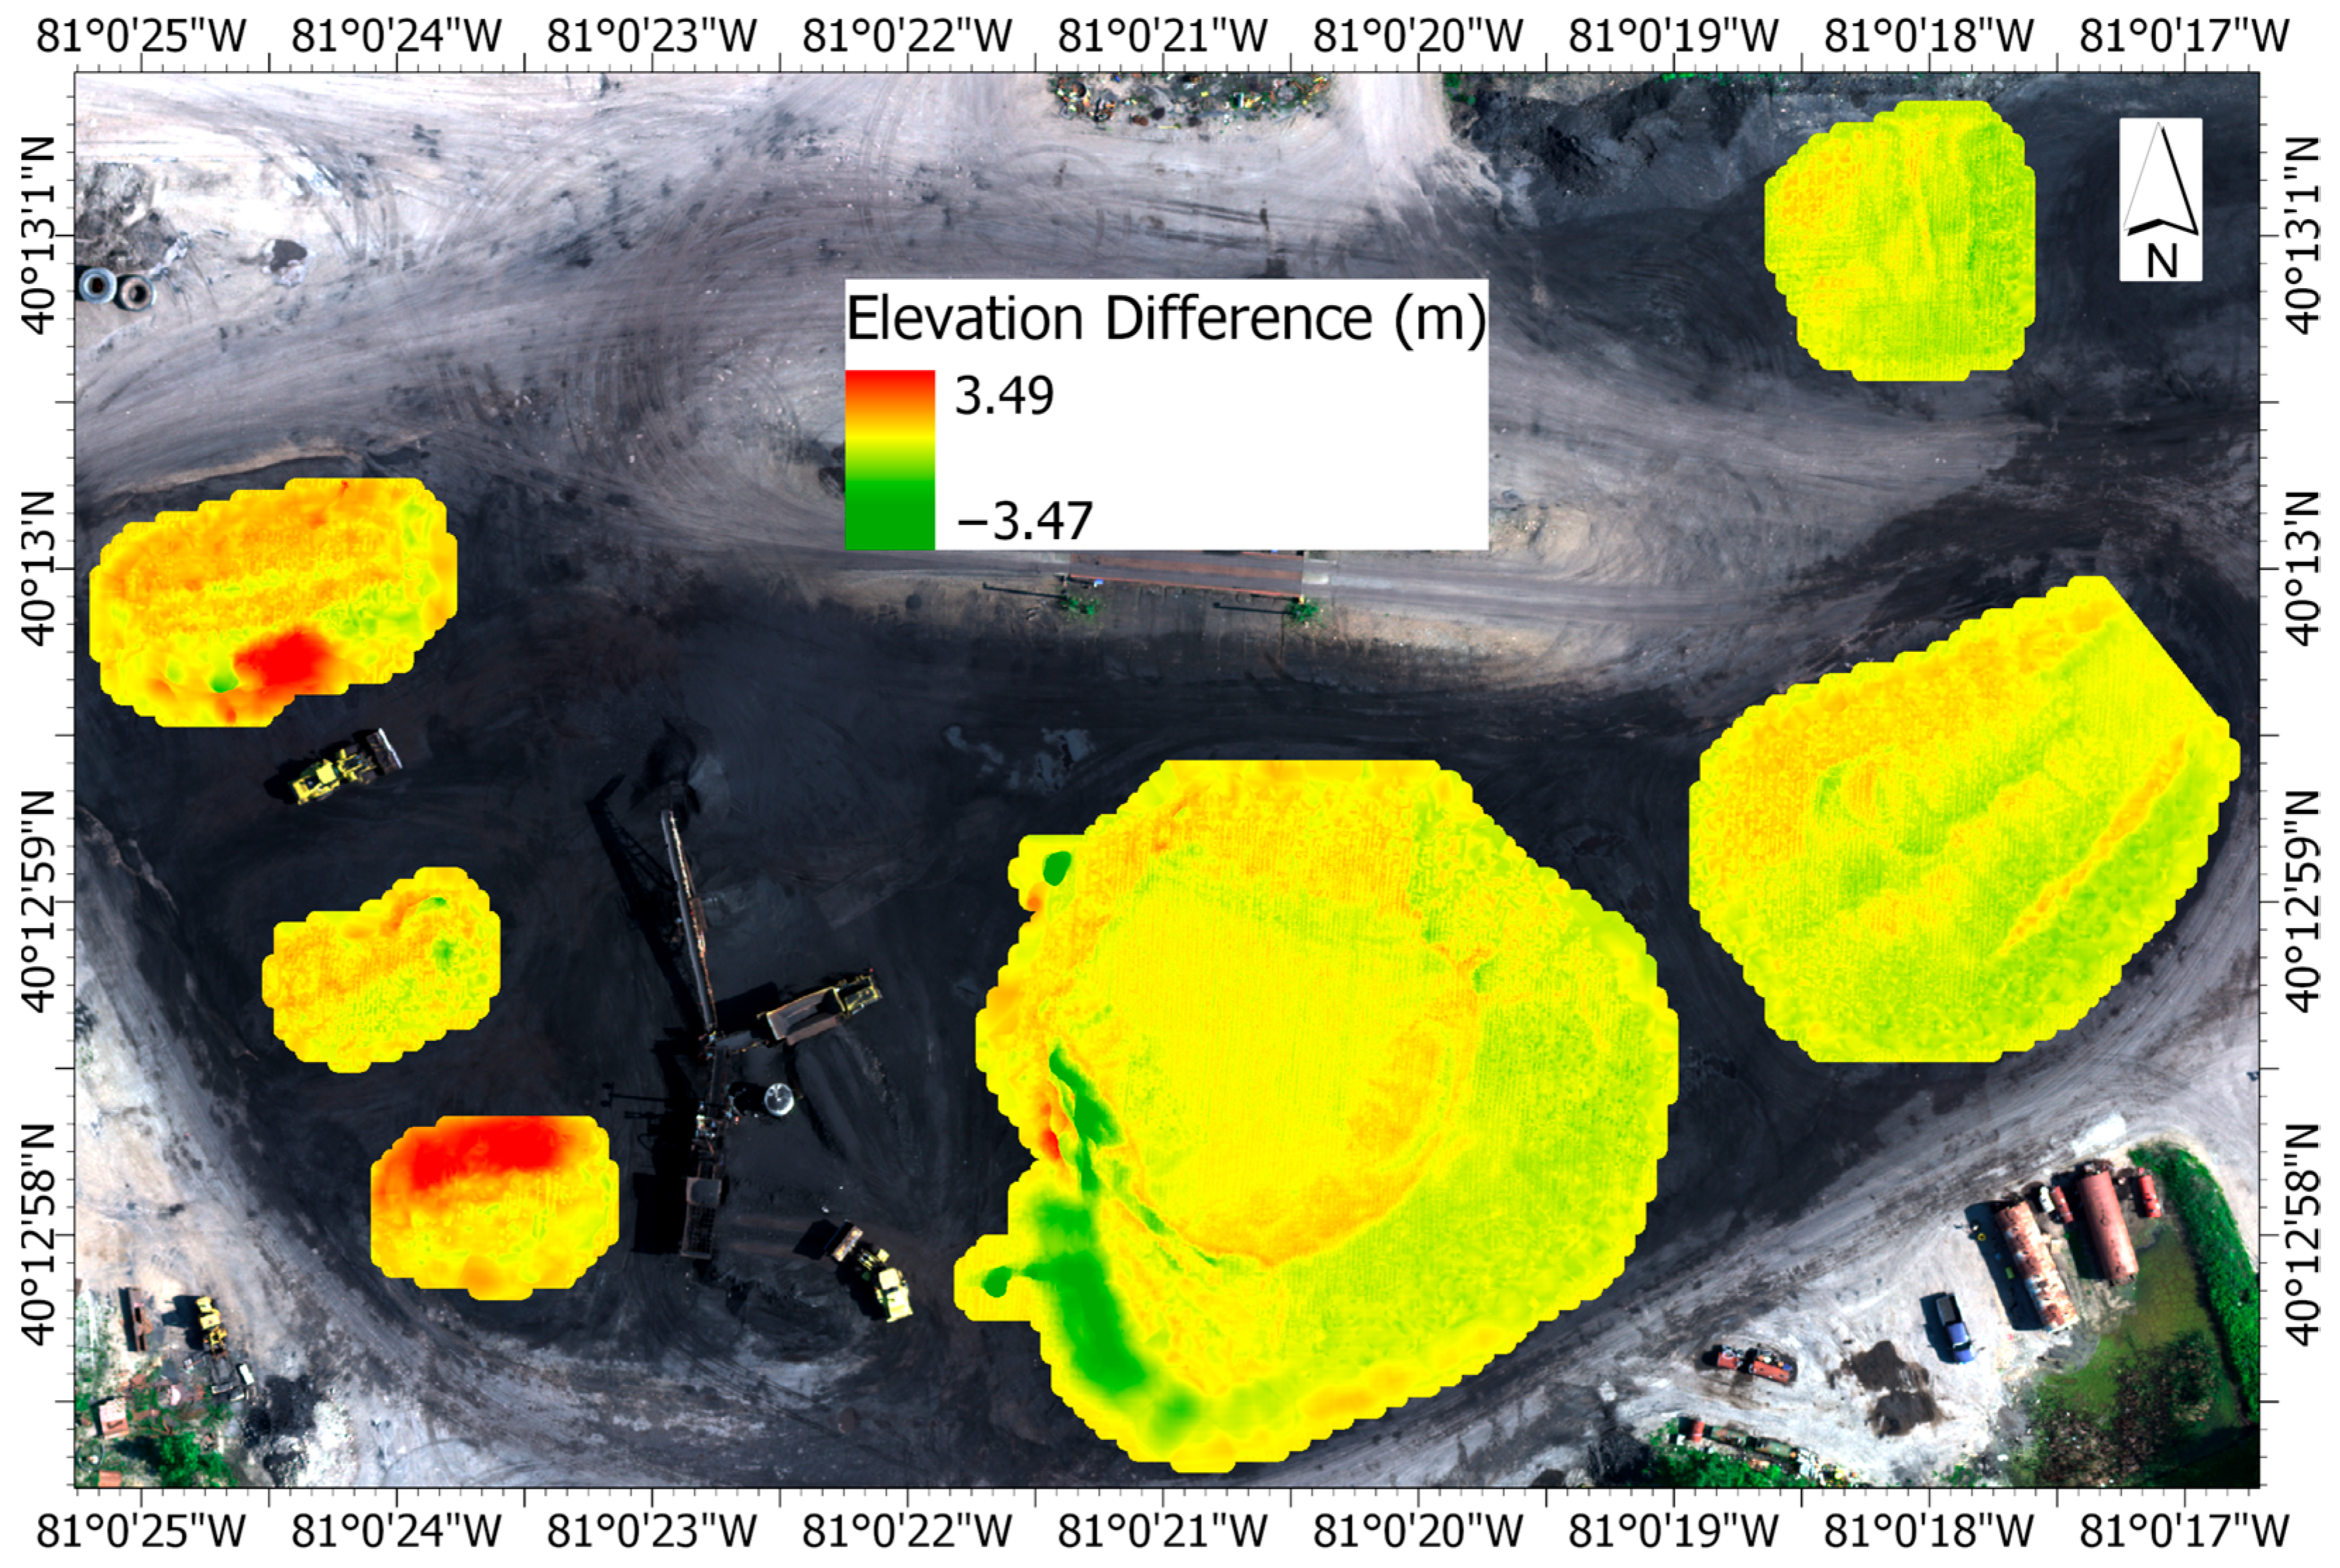
In comparison to LiDAR, SfM photogrammetry underestimated the surface elevation of coal stockpiles by 0.80 m (Figure 9). The dark green and dark red areas, shown in Figure 9, highlight the sections of the coal stockpiles influenced by the hydraulic crusher. During the aerial survey of the coal stockpile storage area, the hydraulic crusher was actively processing raw coal from stockpile #1 and redistributing it to stockpiles #4, #5, and #6. Since the WingtraOne UAS completed its flight earlier than the Alta X UAS, the temporal sequence of the crusher’s operation was evident in the DoD. Negative values in the DoD indicate areas impacted by the crusher in stockpile #1, while positive differences were observed in stockpiles #4, #5, and #6. These dynamic changes within stockpiles might have introduced uncertainty into volume estimates when employing different estimation approaches. These differences can further be attributed to a combination of sensor and methodological factors. Both LiDAR and SfM photogrammetry reconstruct the surface where measurements are performed; however, they differ in their underlying principles and potential sources of error. LiDAR estimates the surface elevation by measuring the time delay between the emitted laser pulses and their return after reflecting off the surface, which produces a point cloud with a defined footprint for each measurement. In contrast, SfM photogrammetry calculates the XYZ coordinates of homologous points by matching features across multiple overlapping images taken from different angles and times. While both methods yield DSMs, the accuracy and reliability of the results can be affected by differences in sensor specifications (e.g., aperture, resolution, or focal length), flight altitude, point density, and lighting conditions [45]. In our case, the WingtraOne UAS (SfM) operated at a flight altitude of 120 m with a multispectral camera, whereas the Alta X UAS (LiDAR) flew at 44 m with a LiDAR sensor, potentially influencing the observed elevation differences.

3.4. Difference in Terrain Elevation Across Different Approaches

On average, the elevation error in the DTM derived from SfM photogrammetry was 0.78 m, slightly less than the 0.85 m for the DTM generated from kriging interpolation. These errors were more pronounced in the smaller crushed coal stockpiles compared to the larger raw coal stockpiles. Figures S1 and S2 (Supplementary Materials) illustrate the mean elevation errors in DTMs generated from LiDAR compared to those from SfM photogrammetry and kriging interpolation.
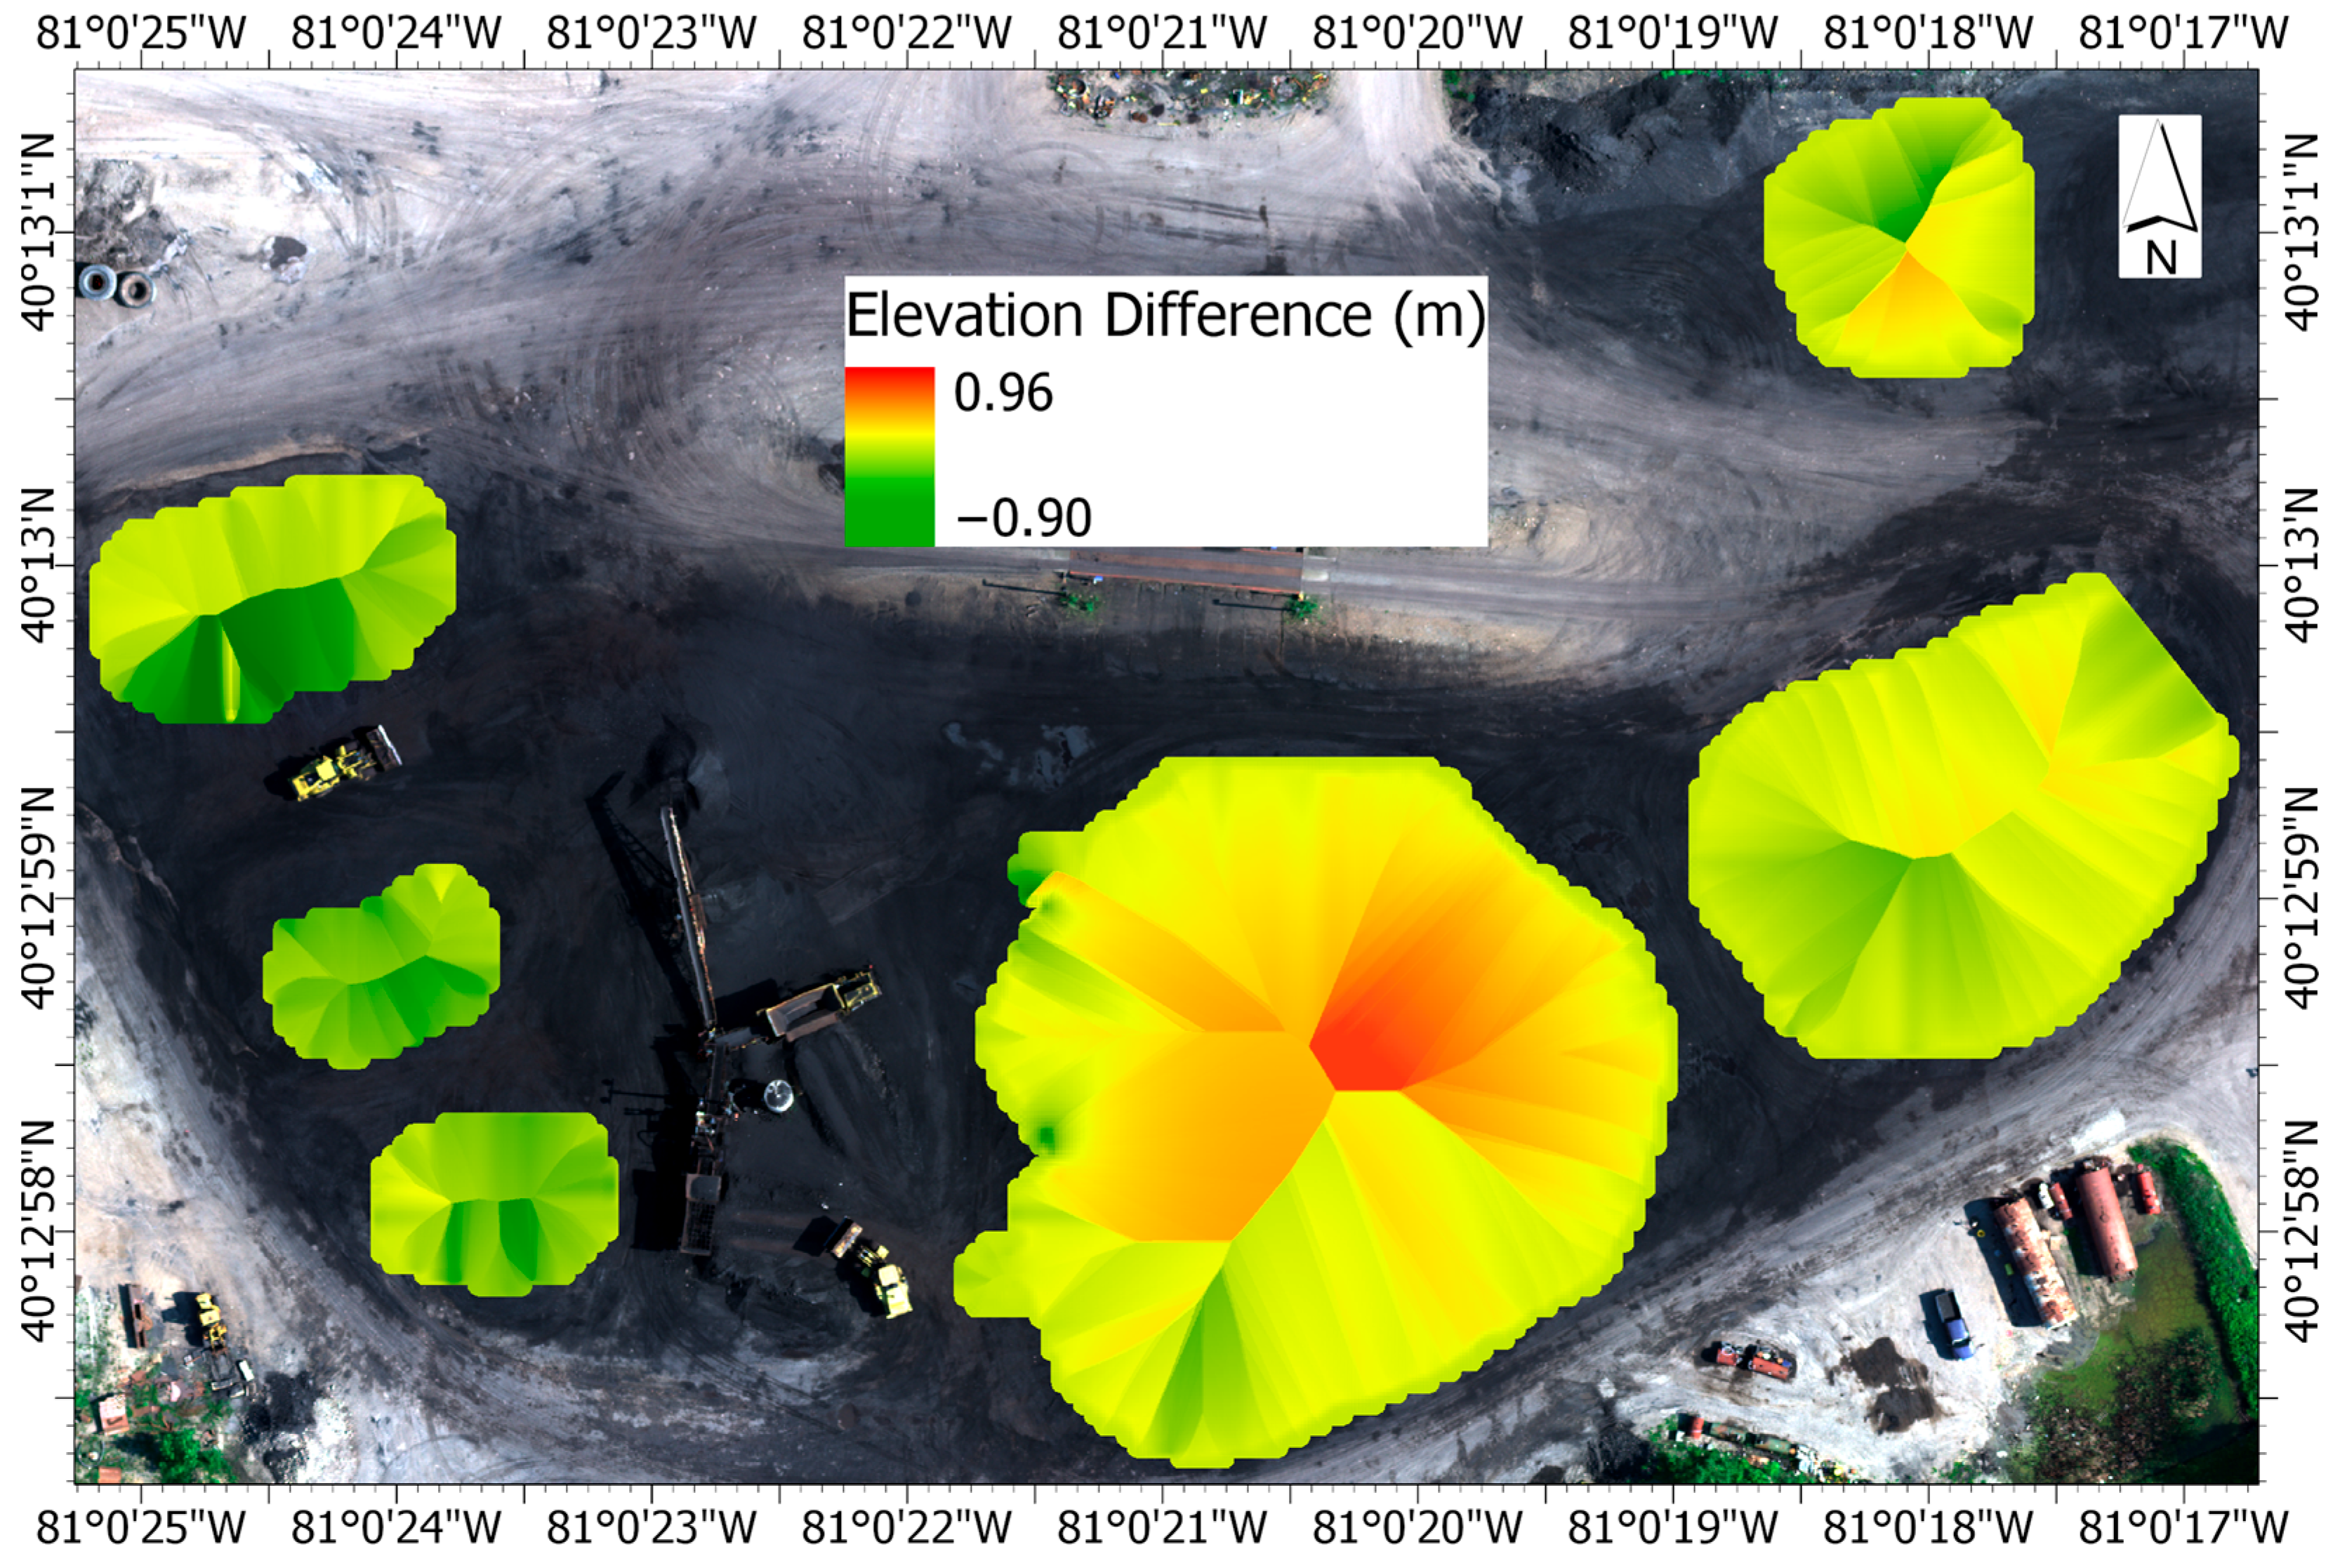
In contrast, the mean elevation error in DTMs derived from SfM photogrammetry and kriging interpolation was minimal, averaging 0.07 m (Figure 10). Smaller crushed coal stockpiles exhibited a slight negative elevation difference, suggesting a minor underestimation in elevation with kriging interpolation. Conversely, the elevation differences between the two DTMs were nearly zero for the majority of pixels in larger raw coal stockpiles. It is important to note that this study is focused more on comparing the accuracy of volume estimates across different approaches, focusing on the relative accuracy of the elevation difference raster (DSM—DTM), and less on the absolute accuracy of individual elevation models. Oftentimes, apparent positive and negative deviations of the terrain models from the surface models mutually compensate each other [46].

3.5. Relative Accuracy of Volume Estimates

The volume of six stockpiles in the study area, measured using three different approaches: LiDAR, SfM–DTM, and SfM–intDTM, is shown in Table 2. In general, raw coal stockpiles exhibited larger volumes compared to crushed coal stockpiles. For raw coal stockpiles, the LiDAR values were typically slightly lower or close to SfM–intDTM. For the crushed stockpiles, the measurements vary more, with SfM–intDTM generally producing lower volume estimates compared to the other methods. Overall, there are minor differences in volume estimates across these approaches for each stockpile.
The Wilcoxon signed-rank test (Table S5—Supplementary Materials) revealed no statistically significant differences between the compared methods (LiDAR vs. SfM–DTM, LiDAR vs. SfM–intDTM, and SfM–DTM vs. SfM–intDTM). The comparison metrics between these three approaches (Table 3) indicated strong consistency across methods. The high R2 values (>99.97%) demonstrated a near-perfect correlation between these approaches. This suggests that the volume estimates from both the SfM–DTM and SfM–intDTM approaches explain most of the variance in the LiDAR-based estimates. Similarly, Lin’s CCC values (>0.99) confirmed an almost perfect agreement between the methods, indicating not only a strong correlation, but also minimal deviation from the 1:1 line. Together, the R2 and CCC results reinforce that the volume estimates derived from these approaches are both highly correlated and in near-perfect agreement.
The RMSE was lowest for the LiDAR vs. SfM–intDTM comparison and highest for SfM–DTM vs. SfM–intDTM, with volume estimates differing by 147.51 m3 and 146.18 m3 for SfM–DTM and SfM–intDTM, respectively, compared to LiDAR. The MAPE values were all below 9%, with the lowest error between LiDAR and SfM–intDTM (2.06%) and the highest between SfM–DTM and SfM–intDTM (8.68%). It is important to note that the MAPE can be disproportionately affected by small actual volumes, leading to high percentage errors even for minor absolute discrepancies.
The notably lower MAPE for SfM–intDTM compared to SfM–DTM when benchmarked against LiDAR likely reflects the effect of kriging interpolation in smoothing local surface irregularities and mitigating the noise inherent to raw SfM reconstructions. SfM–DTM surfaces can retain artifacts such as small undulations, voids, or misclassified ground points, particularly around stockpile edges. These localized deviations increase the number of percentage-based errors when compared to LiDAR. On the contrary, the kriging-interpolated DTM incorporates spatial autocorrelation and uses surrounding elevation information to produce a more generalized base surface, reducing the influence of such local artifacts. As a result, although both SfM approaches effectively minimize large errors, the interpolated DTM yields volume estimates that more closely match the LiDAR benchmark in relative terms.
When comparing the volume estimates of SfM–DTM and SfM–intDTM, the kriging-interpolated DTM differed by 8.68% from the SfM photogrammetry-based DTM. Although the MAPE was relatively low (<9%), the higher RMSE of 289.58 m3 suggests that SfM–intDTM can be more prone to larger absolute errors compared to the SfM–DTM approach. Importantly, while both SfM-derived methods demonstrated strong agreement with the LiDAR benchmark, their direct comparison revealed notable differences, indicating that they are not fully interchangeable across all scenarios.
Prior studies have shown varying degrees of accuracy in volume estimation. For instance, Amaglo reported that volume estimates from TLS differed from those obtained with LiDAR and photogrammetry by 0.7% and 3%, respectively [7]. Mora et al. demonstrated that photogrammetry using off-the-shelf UAS equipment was within 2% of TLS-based stockpile volume estimation [32]. Conversely, Kuinkel et al. reported a MAPE of 11.9% relative to the actual volume for a landfilled fly ash stockpile [33]. Likewise, Ajayi and Ajulo found UAS–SfM photogrammetry to be more accurate (MAPE = 2.3%) and economical than conventional ground-based total station surveys (MAPE = 2.9%) for earthwork volume estimation [34]. Machine learning-enhanced interpolation methods have also shown promise, though they often require extensive computational resources and training datasets [47].
In this study, the SfM–intDTM approach yielded a MAPE of approximately 2%, which is consistent with or better than the values reported in prior studies. This suggests strong agreement between the estimated volumes—derived by comparing the SfM-generated DSM and a kriging-interpolated DTM—and the reference LiDAR measurements. Our results compare favorably with other geostatistical interpolation approaches, where kriging has been shown to outperform inverse distance weighting and spline methods for spatial data reconstruction in mining applications [48]. Although minor discrepancies may have resulted from coal displacement, due to hydraulic crushing between the two UAS surveys (see Section 3.2), the low MAPE validates the effectiveness and reliability of the proposed method for accurate stockpile volume estimation.
When contextualized against other advanced methods, the accuracy of our SfM–intDTM approach remains highly competitive. LiDAR-based walking and aerial photogrammetry have demonstrated volumetric errors around 1–2% relative to actual volumes [6]. In indoor drone-based systems, a multi-drone setup with lightweight 1D LiDAR sensors achieved an average volumetric error of 1.3%, while a single-drone actuator configuration incurred a 4.4% error [49]. Simulation studies further show that even a drone-mounted single-point LiDAR can realize errors as low as 0.8% ± 1.1%, versus 1.8% ± 1.7% (2D LiDAR) and 0.9% ± 1.0% (3D LiDAR) [50]. Compared to these approaches, our method achieves similar or better accuracy using only photogrammetric data, underlining its practicality and cost-effectiveness.
Similar to prior studies, we have demonstrated that UAS technologies offer accurate volume estimates by providing both the top and base surface information for stockpiles. However, their application can be costly on a regional scale. For regional-scale studies, there is a need to leverage publicly available elevation datasets that include only the top surface information of stockpiles [35,36]. The accuracy with which the base surface information of stockpiles is derived can significantly impact the overall accuracy of volume estimates more than the accuracy of the top surface [51]. We think that the proposed kriging-based interpolation approach can provide reasonably representative base surface information compared to the LiDAR estimates (RMSE of 146.18 m3 and MAPE of 2.06%), thereby offering a practical alternative for regional volumetric studies.

3.6. Effect of Spatial Resolution on Statistical Error Metrics

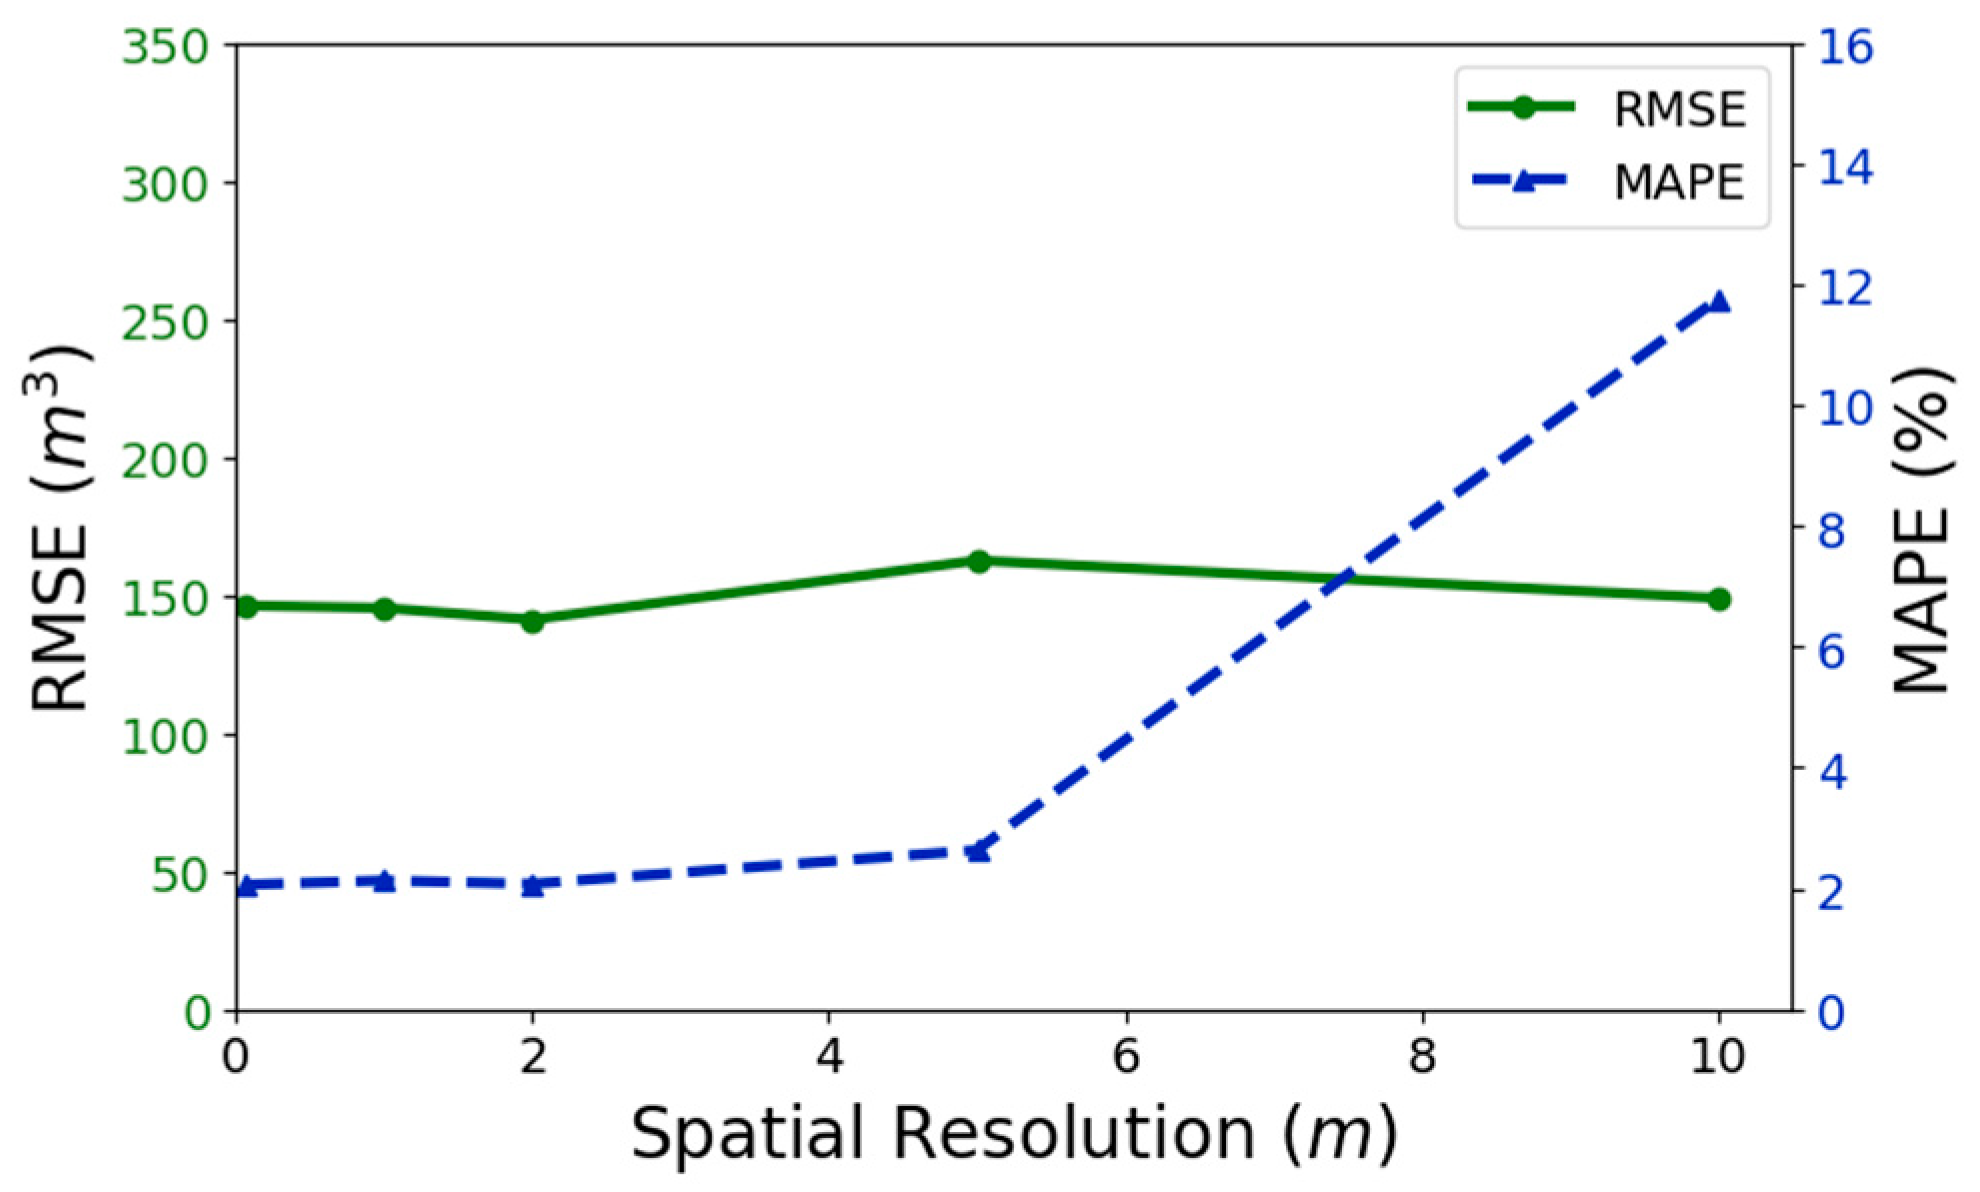
The accuracy of volume estimates across six coal stockpiles, derived using the SfM–intDTM approach at varying spatial resolutions, was evaluated using the RMSE and MAPE metrics (Figure 11). The RMSE values remained relatively consistent across spatial resolutions from 0.06 m to 10 m, fluctuating modestly between approximately 141 m3 and 162 m3. In contrast, the MAPE remained low and stable (below 2.5%) across resolutions from 0.06 m to 5 m, but exhibited a sharp increase at 10 m, rising to 11.76%. While the number of statistical errors may increase slightly with coarser-resolution elevation data, such data can still be suitable for regional-scale studies that prioritize relative trends over absolute estimates.
From a practical standpoint, resolutions between 0.06 m and 0.5 m are the most appropriate for the high-precision monitoring of individual stockpiles, reconciliation of the inventory at active facilities, and regulatory reporting, where minimizing small volumetric discrepancies is essential. Moderate resolutions of 1 m to 5 m offer a balance between accuracy and efficiency, making them well-suited for medium- to large-scale stockpiles or operational contexts where detecting the relative changes is more important than absolute precision. Coarser resolutions (around 10 m) may serve well in regional-scale inventories or long-term monitoring efforts, where broader spatial trends take precedence over fine-scale accuracy. Therefore, selecting an appropriate spatial resolution for the elevation raster in volumetric studies requires careful consideration of factors such as the geographic extent of the study area, the cost of acquiring high-resolution data, and the computational resources available for processing.

4. Future Works

In this study, we exclusively used images with a nadir perspective for coal stockpile volume estimation. Although the evaluation metrics suggested reasonably good performance across all three approaches, incorporating oblique images taken from various angles may potentially yield even better results, especially on steep slopes, as suggested by [52]. Future research could also benefit from the additional exploration of interpolation methods to further enhance the accuracy and applicability of UAS-based volume estimation techniques.

5. Conclusions

Unmanned Aerial Systems (UASs) have emerged as a practical and accurate alternative to conventional GNSS and Terrestrial Laser Scanning (TLS) methods for stockpile volume estimation. This study evaluated and compared three approaches for estimating coal stockpile volumes: (1) LiDAR-based reference volumes, (2) DSM and DTM from Structure-from-Motion (SfM) photogrammetry (SfM–DTM), and (3) DSM from SfM combined with a kriging-interpolated DTM (SfM–intDTM). A key component of this integrated workflow was the implementation of an automated stockpile boundary detection method that incorporated slope analysis, spectral filtering, and Canny edge detection. Despite differences in how the terrain models were derived, statistical analysis revealed no significant differences in volume estimates among these approaches, confirming their comparable performance.
The SfM–intDTM approach achieved a Mean Absolute Percentage Error (MAPE) of approximately 2%, demonstrating strong agreement with LiDAR-based reference volumes and having as good as or better results than those reported in previous studies. This approach offers a practical solution for regional-scale volumetric studies, particularly when the top surface elevation of stockpiles is obtained from publicly available digital elevation models and the base surface information is limited.
Sensitivity analysis further demonstrated that the spatial resolution of the elevation raster can influence the accuracy of volume estimates. The RMSE remained relatively stable (141–162 m3) and the MAPE stayed below 2.5% across resolutions from 0.06 m to 5 m. However, at a 10 m resolution, the MAPE increased sharply to 11.76%, underscoring the importance of selecting an appropriate spatial resolution for accurate volume estimation.
Overall, this study confirms that UAS-based SfM photogrammetry, when paired with interpolated DTMs and automated boundary extraction, provides a cost-effective, scalable, and accurate solution for stockpile volume estimation. The proposed methods can be applied beyond coal stockpiles to other types of materials such as those found in quarries, agricultural storage facilities, sawmills, and forest residue operations.

Supplementary Materials

The following supporting information can be downloaded at: https://www.mdpi.com/article/10.3390/rs17183136/s1. Figure S1: Elevation difference between LiDAR-derived and SfM-derived terrain models (mean error = 0.78 m); Figure S2: Elevation difference between LiDAR-derived and kriging-interpolated terrain models (mean error = 0.85 m); Table S1: Technical specifications of Freefly’s Alta X UAS; Table S2: Technical specifications of Velodyne VLP-16 Hi-Res sensor [26]; Table S3: Technical specifications of WingtraOne UAS; Table S4: Technical specifications of MicaSense Altum sensor [27]; Table S5: Summary of test statistics of volume estimate comparison across three approaches.

Author Contributions

Conceptualization, S.D., A.M., A.S. and S.K.; methodology, S.D. and S.K.; software, S.D.; validation, S.D. and S.K.; data curation, S.D.; writing—original draft preparation, S.D. and S.K.; writing—review and editing, S.D., A.M., A.S. and S.K.; funding acquisition, A.M., A.S. and S.K. All authors have read and agreed to the published version of the manuscript.

Funding

This research was funded by the U.S. Department of Energy, National Energy Technology Laboratory, under Award Number DE-FE0032204.

Data Availability Statement

The datasets used and/or analyzed during the current study are available from the corresponding author upon reasonable request.

Acknowledgments

The authors would like to acknowledge Mark Bolin for his assistance with the UAS data collection. We would also like to pay special regard to CCU Coal and Construction LLC for permitting us to survey their coal mining site.

Conflicts of Interest

The authors declare no conflicts of interest.

Abbreviations

CCCConcordance Correlation Coefficient
CORSContinuously Operating Reference Station
DSMDigital Surface Model
DTMDigital Terrain Model
DoDDSM of Difference
FREOFreeport
GNSSGlobal Navigation Satellite System
GPSGlobal Positioning System
GCPGround Control Point
GSDGround Sampling Distance
IMUInertial Measurement Unit
IoUIntersection over Union
LiDARLight Detection and Ranging
MAPEMean Absolute Percentage Error
NIRNear-Infrared
ODOTOhio Department of Transportation
PPKPost-Processed Kinematic
RTKReal-Time Kinematic
RMSERoot Mean Square Error
SfMStructure-from-Motion
TLSTerrestrial Laser Scanning
UASUnmanned Aerial System
VTOLVertical Take-off and Landing

References

  1. Cao, D.; Zhang, B.; Zhang, X.; Yin, L.; Man, X. Optimization Methods on Dynamic Monitoring of Mineral Reserves for Open Pit Mine Based on UAV Oblique Photogrammetry. Measurement 2023, 207, 112364. [Google Scholar] [CrossRef]
  2. He, H.; Chen, T.; Zeng, H.; Huang, S. Ground Control Point-Free Unmanned Aerial Vehicle-Based Photogrammetry for Volume Estimation of Stockpiles Carried on Barges. Sensors 2019, 19, 3534. [Google Scholar] [CrossRef]
  3. Mantey, S.; Aduah, M.S. Comparative Analysis of Stockpile Volume Estimation Using UAV and GPS Techniques. Ghana Min. J. 2021, 21, 1–10. [Google Scholar] [CrossRef]
  4. Vacca, G. UAV Photogrammetry for Volume Calculations. A Case Study of an Open Sand Quarry. In Computational Science and Its Applications—ICCSA 2022 Workshops; Gervasi, O., Murgante, B., Misra, S., Rocha, A.M.A.C., Garau, C., Eds.; Lecture Notes in Computer Science; Springer International Publishing: Cham, Switzerland, 2022; Volume 13382, pp. 505–518. ISBN 978-3-031-10591-3. [Google Scholar]
  5. Liu, J.; Hasheminasab, S.M.; Zhou, T.; Manish, R.; Habib, A. An Image-Aided Sparse Point Cloud Registration Strategy for Managing Stockpiles in Dome Storage Facilities. Remote Sens. 2023, 15, 504. [Google Scholar] [CrossRef]
  6. Alsayed, A.; Nabawy, M.R.A. Stockpile Volume Estimation in Open and Confined Environments: A Review. Drones 2023, 7, 537. [Google Scholar] [CrossRef]
  7. Amaglo, W.Y. Volume Calculation Based on LiDAR Data; KTH Royal Institute of Technology: Stockholm, Sweden, 2021. [Google Scholar]
  8. Aber, J.S.; Marzolff, I.; Ries, J.B. Small-Format Aerial Photography: Principles, Techniques and Geoscience Applications; Elsevier Science: Amsterdam, The Netherlands; London, UK, 2010; ISBN 978-0-444-53260-2. [Google Scholar]
  9. Saratsis, G.; Xiroudakis, G.; Exadaktylos, G.; Papaconstantinou, A.; Lazos, I. Use of UAV Images in 3D Modelling of Waste Material Stock-Piles in an Abandoned Mixed Sulphide Mine in Mathiatis—Cyprus. Mining 2023, 3, 79–95. [Google Scholar] [CrossRef]
  10. Rohizan, M.H.; Ibrahim, A.H.; Abidin, C.Z.C.; Ridwan, F.M.; Ishak, R. Application of Photogrammetry Technique for Quarry Stockpile Estimation. IOP Conf. Ser. Earth Environ. Sci. 2021, 920, 012040. [Google Scholar] [CrossRef]
  11. Yin, H.; Tan, C.; Zhang, W.; Cao, C.; Xu, X.; Wang, J.; Chen, J. Rapid Compaction Monitoring and Quality Control of Embankment Dam Construction Based on UAV Photogrammetry Technology: A Case Study. Remote Sens. 2023, 15, 1083. [Google Scholar] [CrossRef]
  12. Pourreza, M.; Moradi, F.; Khosravi, M.; Deljouei, A.; Vanderhoof, M.K. GCPs-Free Photogrammetry for Estimating Tree Height and Crown Diameter in Arizona Cypress Plantation Using UAV-Mounted GNSS RTK. Forests 2022, 13, 1905. [Google Scholar] [CrossRef]
  13. Näsi, R.; Mikkola, H.; Honkavaara, E.; Koivumäki, N.; Oliveira, R.A.; Peltonen-Sainio, P.; Keijälä, N.-S.; Änäkkälä, M.; Arkkola, L.; Alakukku, L. Can Basic Soil Quality Indicators and Topography Explain the Spatial Variability in Agricultural Fields Observed from Drone Orthomosaics? Agronomy 2023, 13, 669. [Google Scholar] [CrossRef]
  14. Dronova, I.; Kislik, C.; Dinh, Z.; Kelly, M. A Review of Unoccupied Aerial Vehicle Use in Wetland Applications: Emerging Opportunities in Approach, Technology, and Data. Drones 2021, 5, 45. [Google Scholar] [CrossRef]
  15. Tomaštík, J.; Mokroš, M.; Surový, P.; Grznárová, A.; Merganič, J. UAV RTK/PPK Method—An Optimal Solution for Mapping Inaccessible Forested Areas? Remote Sens. 2019, 11, 721. [Google Scholar] [CrossRef]
  16. Eker, R.; Alkan, E.; Aydin, A. A Comparative Analysis of UAV-RTK and UAV-PPK Methods in Mapping Different Surface Types. Eur. J. For. Eng. 2021, 7, 12–25. [Google Scholar] [CrossRef]
  17. Hofmann-Wellenhof, B.; Lichtenegger, H.; Wasle, E. GNSS—Global Navigation Satellite Systems: GPS, GLONASS, Galileo, and More; Springer: Wien, Austria; New York, NY, USA, 2008; ISBN 978-3-211-73012-6. [Google Scholar]
  18. Leandro, R.; Landau, H.; Nitschke, M.; Glocker, M.; Seeger, S.; Chen, X.; Deking, A.; BenTahar, M.; Zhang, F.; Ferguson, K.; et al. RTX Positioning: The Next Generation of Cm-Accurate Real-Time GNSS Positioning. In Proceedings of the 24th International technical Meeting of the Satellite Division of the Institute of Navigation (ION GNSS 2011), Portland, OR, USA, 20–23 September 2011; pp. 1460–1475. [Google Scholar]
  19. Famiglietti, N.A.; Cecere, G.; Grasso, C.; Memmolo, A.; Vicari, A. A Test on the Potential of a Low Cost Unmanned Aerial Vehicle RTK/PPK Solution for Precision Positioning. Sensors 2021, 21, 3882. [Google Scholar] [CrossRef]
  20. Wang, Z.; Shi, L.; Li, J.; Dai, W.; Lu, W.; Li, M. The Synergistic Effects of GCPs and Camera Calibration Models on UAV-SfM Photogrammetry. Drones 2025, 9, 343. [Google Scholar] [CrossRef]
  21. Shidiq, I.P.A.; Wibowo, A.; Kusratmoko, E.; Indratmoko, S.; Ardhianto, R.; Prasetyo Nugroho, B. Urban Forest Topographical Mapping Using UAV LIDAR. IOP Conf. Ser. Earth Environ. Sci. 2017, 98, 012034. [Google Scholar] [CrossRef]
  22. Hu, T.; Sun, X.; Su, Y.; Guan, H.; Sun, Q.; Kelly, M.; Guo, Q. Development and Performance Evaluation of a Very Low-Cost UAV-Lidar System for Forestry Applications. Remote Sens. 2020, 13, 77. [Google Scholar] [CrossRef]
  23. Elamin, A.; El-Rabbany, A. UAV-Based Multi-Sensor Data Fusion for Urban Land Cover Mapping Using a Deep Convolutional Neural Network. Remote Sens. 2022, 14, 4298. [Google Scholar] [CrossRef]
  24. Lin, Y.-C.; Cheng, Y.-T.; Zhou, T.; Ravi, R.; Hasheminasab, S.; Flatt, J.; Troy, C.; Habib, A. Evaluation of UAV LiDAR for Mapping Coastal Environments. Remote Sens. 2019, 11, 2893. [Google Scholar] [CrossRef]
  25. Trepekli, K.; Balstrøm, T.; Friborg, T.; Fog, B.; Allotey, A.N.; Kofie, R.Y.; Møller-Jensen, L. UAV-Borne, LiDAR-Based Elevation Modelling: A Method for Improving Local-Scale Urban Flood Risk Assessment. Nat. Hazards 2022, 113, 423–451. [Google Scholar] [CrossRef]
  26. Velodyne LiDAR Puck: Real-Time 3D LiDAR Sensor. Available online: https://pdf.directindustry.com/pdf/velodynelidar/vlp-16-datasheets/182407-676097.html (accessed on 12 August 2025).
  27. MicaSense Altum and DLS 2 Integration Guide. Available online: https://support.micasense.com/hc/article_attachments/360073921173 (accessed on 12 August 2025).
  28. Mohsan, S.A.H.; Khan, M.A.; Noor, F.; Ullah, I.; Alsharif, M.H. Towards the Unmanned Aerial Vehicles (UAVs): A Comprehensive Review. Drones 2022, 6, 147. [Google Scholar] [CrossRef]
  29. Štroner, M.; Urban, R.; Seidl, J.; Reindl, T.; Brouček, J. Photogrammetry Using UAV-Mounted GNSS RTK: Georeferencing Strategies without GCPs. Remote Sens. 2021, 13, 1336. [Google Scholar] [CrossRef]
  30. Westoby, M.J.; Brasington, J.; Glasser, N.F.; Hambrey, M.J.; Reynolds, J.M. ‘Structure-from-Motion’ Photogrammetry: A Low-Cost, Effective Tool for Geoscience Applications. Geomorphology 2012, 179, 300–314. [Google Scholar] [CrossRef]
  31. Forte, M.; Neto, P.; Thé, G.; Nogueira, F. Altitude Correction of an UAV Assisted by Point Cloud Registration of LiDAR Scans. In Proceedings of the 18th International Conference on Informatics in Control, Automation and Robotics, Paris, France, 6–8 July 2021; SCITEPRESS—Science and Technology Publications: Setúbal, Portugal, 2021; pp. 485–492. [Google Scholar]
  32. Mora, O.E.; Chen, J.; Stoiber, P.; Koppanyi, Z.; Pluta, D.; Josenhans, R.; Okubo, M. Accuracy of Stockpile Estimates Using Low-Cost sUAS Photogrammetry. Int. J. Remote Sens. 2020, 41, 4512–4529. [Google Scholar] [CrossRef]
  33. Kuinkel, M.S.; Zhang, C.; Liu, P.; Demirkesen, S.; Ksaibati, K. Suitability Study of Using UAVs to Estimate Landfilled Fly Ash Stockpile. Sensors 2023, 23, 1242. [Google Scholar] [CrossRef]
  34. Ajayi, O.G.; Ajulo, J. Investigating the Applicability of Unmanned Aerial Vehicles (UAV) Photogrammetry for the Estimation of the Volume of Stockpiles. Quaest. Geogr. 2021, 40, 25–38. [Google Scholar] [CrossRef]
  35. Dhakal, S. Mapping and Volume Estimation of Waste Coal in Abandoned Mine Lands Using Remote Sensing and Geospatial Techniques. Master’s Thesis, The Ohio State University, Columbus, OH, USA, 2024. [Google Scholar]
  36. Dhakal, S.; Shah, A.; Khanal, S. Monitoring Historical Waste Coal Piles Using Image Classification and Change Detection Algorithms on Satellite Images. Remote Sens. 2025, 17, 3041. [Google Scholar] [CrossRef]
  37. GEM Wiki. CCU Sexton Strip Mine; Global Energy Monitor (GEM): San Francisco, CA, USA, 2024. [Google Scholar]
  38. Esri. ArcGIS Pro Version 3.0.0: The World’s Leading Desktop GIS Software; Esri: Redlands, CA, USA, 2024. [Google Scholar]
  39. Pix4D Mapper Version 4.7.5; The Leading Photogrammetry Software for Professional Drone Mapping; Pix4D: Lausanne, Switzerland, 2024.
  40. Sharma, M.; Paige, G.B.; Miller, S.N. DEM Development from Ground-Based LiDAR Data: A Method to Remove Non-Surface Objects. Remote Sens. 2010, 2, 2629–2642. [Google Scholar] [CrossRef]
  41. McIlhagga, W. The Canny Edge Detector Revisited. Int. J. Comput. Vis. 2011, 91, 251–261. [Google Scholar] [CrossRef]
  42. Lee, K.; Lee, W.H. Earthwork Volume Calculation, 3D Model Generation, and Comparative Evaluation Using Vertical and High-Oblique Images Acquired by Unmanned Aerial Vehicles. Aerospace 2022, 9, 606. [Google Scholar] [CrossRef]
  43. Wilcoxon, F.; Katti, S.; Wilcox, R.A. Critical Values and Probability Levels for the Wilcoxon Rank Sum Test and the Wilcoxon Signed Rank Test; Selected Tables in Mathematical Statistics; American Cyanamid: Pearl River, NY, USA, 1970; Volume 1. [Google Scholar]
  44. Lin, L.I.-K. A Concordance Correlation Coefficient to Evaluate Reproducibility. Biometrics 1989, 45, 255. [Google Scholar] [CrossRef]
  45. Torkan, M.; Janiszewski, M.; Uotinen, L.; Baghbanan, A.; Rinne, M. High-Resolution Photogrammetry to Measure Physical Aperture of Two Separated Rock Fracture Surfaces. J. Rock Mech. Geotech. Eng. 2024, 16, 2922–2934. [Google Scholar] [CrossRef]
  46. Julge, K.; Ellmann, A.; Köök, R. Unmanned Aerial Vehicle Surveying for Monitoring Road Construction Earthworks. Balt. J. Road Bridge Eng. 2019, 14, 1–17. [Google Scholar] [CrossRef]
  47. Kim, J.; Lee, Y.; Lee, M.-H.; Hong, S.-Y. A Comparative Study of Machine Learning and Spatial Interpolation Methods for Predicting House Prices. Sustainability 2022, 14, 9056. [Google Scholar] [CrossRef]
  48. Razas, M.A.; Hassan, A.; Khan, M.U.; Emad, M.Z.; Saki, S.A. A Critical Comparison of Interpolation Techniques for Digital Terrain Modelling in Mining. J. S. Afr. Inst. Min. Metall. 2023, 123, 53–62. [Google Scholar] [CrossRef]
  49. Alsayed, A.; Bana, F.; Arvin, F.; Quinn, M.K.; Nabawy, M.R.A. Experimental Evaluation of Multi- and Single-Drone Systems with 1D LiDAR Sensors for Stockpile Volume Estimation. Aerospace 2025, 12, 189. [Google Scholar] [CrossRef]
  50. Alsayed, A.; Nabawy, M.R.A. Indoor Stockpile Reconstruction Using Drone-Borne Actuated Single-Point LiDARs. Drones 2022, 6, 386. [Google Scholar] [CrossRef]
  51. Tucci, G.; Gebbia, A.; Conti, A.; Fiorini, L.; Lubello, C. Monitoring and Computation of the Volumes of Stockpiles of Bulk Material by Means of UAV Photogrammetric Surveying. Remote Sens. 2019, 11, 1471. [Google Scholar] [CrossRef]
  52. Rossi, P.; Mancini, F.; Dubbini, M.; Mazzone, F.; Capra, A. Combining Nadir and Oblique UAV Imagery to Reconstruct Quarry Topography: Methodology and Feasibility Analysis. Eur. J. Remote Sens. 2017, 50, 211–221. [Google Scholar] [CrossRef]
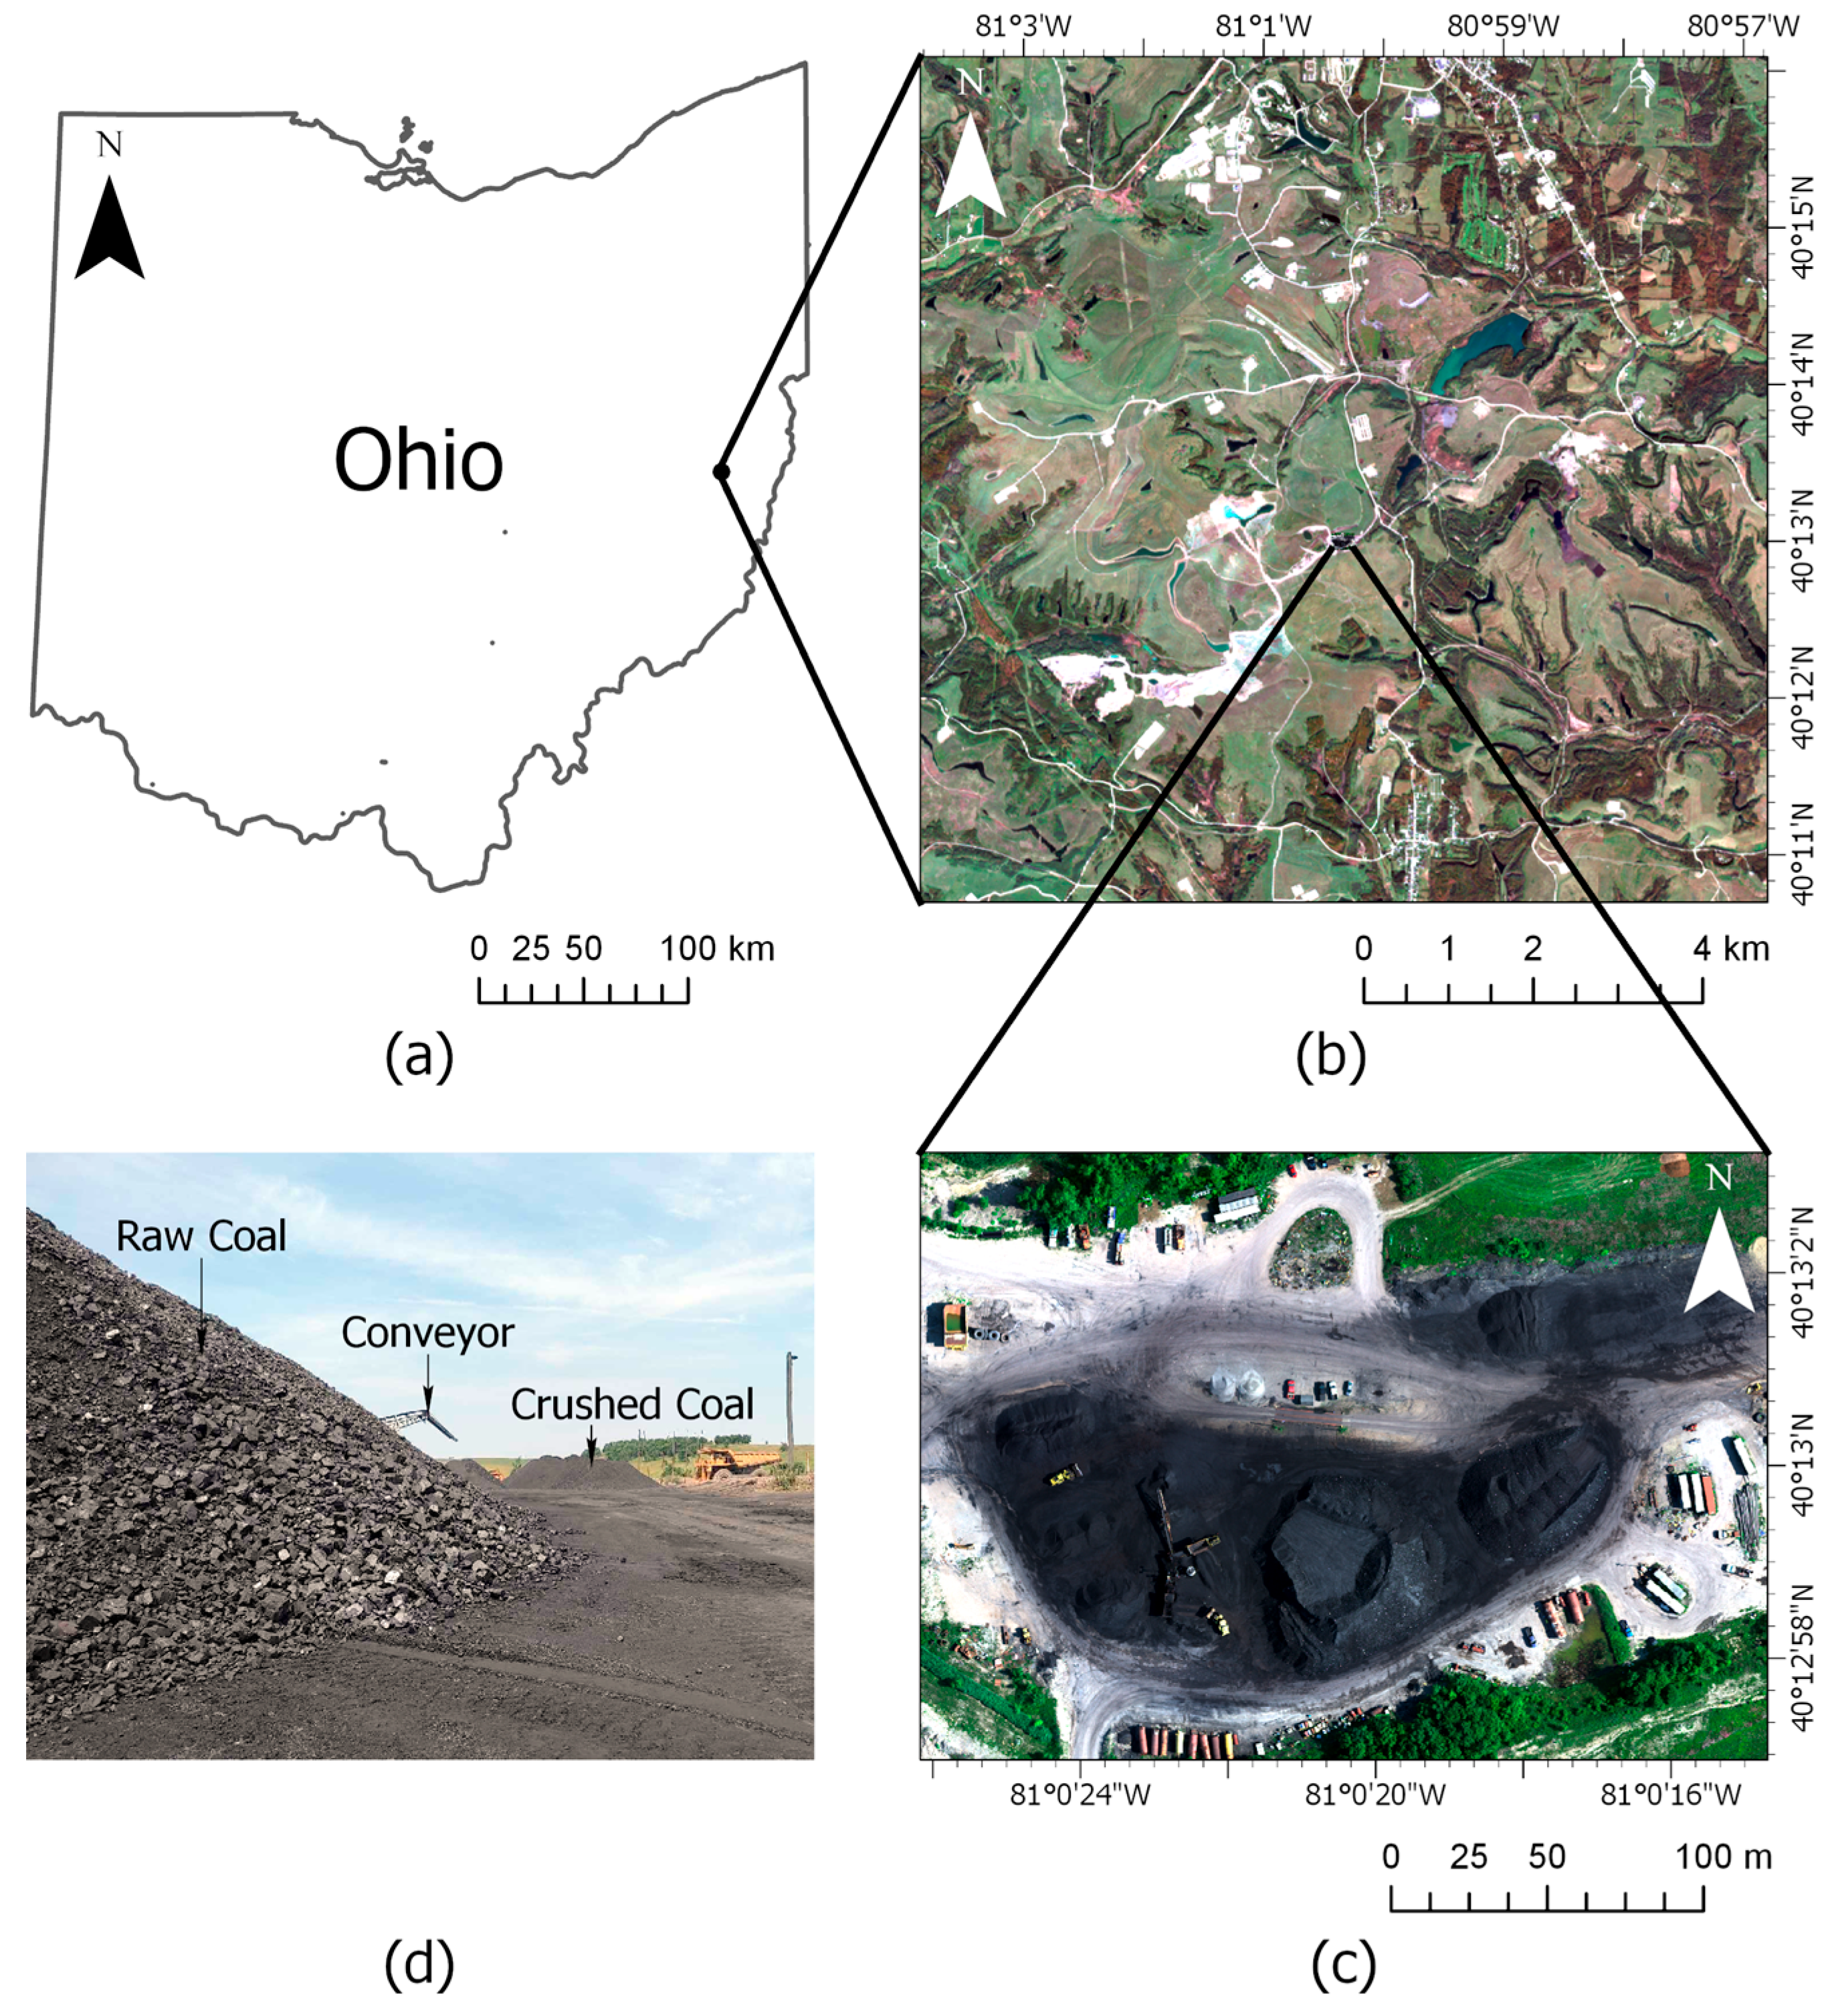
Figure 1. Location of the study area, including (a) the Ohio state boundary, (b) true color composite Sentinel-2 satellite image of a surface coal mine in Harrison County, (c) true color composite UAS image of the coal stockpile storage area captured through a multispectral camera, and (d) raw and crushed coal stockpiles. In (b), bright white areas indicate active surface coal mining regions. The coal extracted from the mining region in (b) is transported to the storage area in (c).
Remotesensing 17 03136 g001
Figure 2. Automated coal stockpile boundary detection workflow integrating slope analysis, spectral analysis, and edge detection techniques.
Remotesensing 17 03136 g002
Figure 3. Overview of the integrated methodology for coal stockpile volume estimation. The workflow compares three volume estimation approaches: (1) LiDAR, (2) SfM photogrammetry using both DSM and DTM (SfM–DTM), and (3) SfM photogrammetry with kriging-interpolated DTM for scenarios lacking base surface data (SfM–intDTM). Colors and line styles are used to distinguish the LiDAR (green), SfM photogrammetry (blue), and interpolation (red) processes.
Remotesensing 17 03136 g003
Figure 4. Freefly’s Alta X (left) and WingtraOne (right).
Remotesensing 17 03136 g004
Figure 5. Workflow for (a) LiDAR data processing (b) SfM photogrammetry in Pix4D Mapper.
Remotesensing 17 03136 g005
Figure 6. Stockpile boundary delineation using the Canny edge detector.
Remotesensing 17 03136 g006
Figure 7. Comparison of stockpile boundaries for accuracy assessment (a) automatically extracted (green) and manually digitized (red) stockpile boundaries, and (b) areas of intersection (magenta) and union (yellow) used for accuracy evaluation.
Remotesensing 17 03136 g007
Figure 8. Three-dimensional representation of coal stockpiles using LiDAR point clouds. Height (h) is in “m”.
Remotesensing 17 03136 g008
Figure 9. Three-dimensional elevation difference between LiDAR-derived and SfM-derived surface models (mean error = 0.80 m).
Remotesensing 17 03136 g009
Figure 10. Elevation difference between SfM-derived and kriging-interpolated terrain models (mean error = 0.07 m).
Remotesensing 17 03136 g010
Figure 11. Difference in volume estimates (in RMSE and MAPE) across six coal stockpiles, derived using elevation raster at varying spatial resolutions.
Remotesensing 17 03136 g011
Table 1. Accuracy of the delineated stockpile boundary.
Stockpile #TypeArea of Intersection (m2)Area of Union (m2)IoU
1Raw3219.33436.50.94
2Raw1625.32084.90.78
3Raw542.2599.10.91
4Crushed621.2817.00.76
5Crushed302.1462.30.65
6Crushed338.1505.90.67
Table 2. Volume estimates using three approaches.
Stockpile #TypeVolume (m3)Difference in Volume (%)
LiDARSfM–DTMSfM–intDTMLiDAR vs. SfM–DTMLiDAR vs. SfM–intDTM
1Raw12,706.1812,370.6813,062.752.64−2.81
2Raw4319.384299.994329.780.45−0.24
3Raw892.96869.17871.762.662.37
4Crushed1028.221131.781009.41−10.071.83
5Crushed267.56330.04261.72−23.352.18
6Crushed383.84433.00372.58−12.812.93
Note: LiDAR estimates reflect volume calculations derived from 3D point clouds obtained using a LiDAR sensor. SfM–DTM estimates were derived using both DSM and DTM generated from SfM photogrammetry. SfM–intDTM estimates utilized the DSM from SfM photogrammetry and a DTM generated through interpolation.
Table 3. Comparison metrics for volume estimates with different approaches.
MetricsLiDAR vs. SfM–DTMLiDAR vs. SfM–intDTMSfM–DTM vs. SfM–intDTM
CCC0.99940.99950.9979
R299.990%99.994%99.978%
RMSE (m3)147.51146.18289.58
MAPE (%)8.66%2.06%8.68%
Disclaimer/Publisher’s Note: The statements, opinions and data contained in all publications are solely those of the individual author(s) and contributor(s) and not of MDPI and/or the editor(s). MDPI and/or the editor(s) disclaim responsibility for any injury to people or property resulting from any ideas, methods, instructions or products referred to in the content.