Article

Assessing the Performance of GNSS-IR for Sea Level Monitoring During Hurricane-Induced Storm Surges

1
School of Geodesy and Geomatics, Wuhan University, Wuhan 430079, China
2
GNSS Research Center, Wuhan University, Wuhan 430079, China
3
State Key Laboratory of Precision Geodesy, Innovation Academy for Precision Measurement Science and Technology, CAS, Wuhan 430079, China
4
Beijing FreeDo Technology Co., Ltd., Beijing 100176, China
5
The Third Surveying and Mapping Institute of Guizhou Province, Guiyang 550004, China
*
Author to whom correspondence should be addressed.
Remote Sens. 2025, 17(18), 3132; https://doi.org/10.3390/rs17183132
Submission received: 30 July 2025 / Revised: 1 September 2025 / Accepted: 5 September 2025 / Published: 9 September 2025
(This article belongs to the Special Issue Advanced Multi-GNSS Positioning and Its Applications in Geoscience)

Abstract

With the intensification of extreme climate change, hurricanes are becoming increasingly frequent, and coastal regions are often impacted by hurricane-induced storm surges. While GNSS-IR (Global Navigation Satellite System–Interferometric Reflectometry) has been widely used for sea level monitoring, its application in extreme weather events such as storm surges remains limited. This study focuses on GNSS-IR-based storm surge monitoring and investigates six hurricane events using data from two GNSS stations (CALC and FLCK) located in the Gulf of Mexico. The monitoring accuracy and effectiveness are systematically evaluated. Results indicate that GNSS-IR achieves a sea level accuracy of approximately 7 cm under non-storm surge conditions. Compared with the FLCK station, the CALC station has a wider field of water reflection and higher precision observation results. This further confirms that an open environment is a prerequisite for ensuring the accuracy of GNSS-IR measurements. However, accuracy degrades significantly during storm surges, reaching only a decimeter-level precision. Multi-GNSS observations notably improve temporal resolution, with valid observation periods covering 83% to 97% of the total time, compared with only 40% to 60% for single-system observations. Moreover, dynamic sea level variations are closely correlated with hurricane trajectories, which affects GNSS-IR measurement accuracy to some extent. The GPS L2 band is particularly sensitive, likely due to the complex surface-reflected condition caused by hurricanes. Despite reduced accuracy during storm surges, GNSS-IR remains capable of capturing dynamic sea level changes effectively, demonstrating its potential as a valuable supplement to the existing observation networks for extreme weather monitoring.

1. Introduction

Storm surges are characterized by significant abnormal rises in sea level, primarily driven by strong cyclonic systems such as hurricanes, under the combined influence of low atmospheric pressure and intense wind fields [1]. These extreme events are often accompanied by heavy rainfall, high waves, and coastal flooding, posing severe threats to coastal infrastructure, ecosystems, and human life and property. In 2005, Hurricane Katrina made landfall in Louisiana, U.S., causing extensive damage and displacing approximately 657,000 people due to flooding [2]. In August 2020, Hurricane Laura, a Category 4 storm, struck southwestern Louisiana, resulting in at least 77 fatalities and over USD 10 billion in economic losses [3]. Against the backdrop of global climate change and ongoing relative sea level rise, low-lying coastal regions around the world are expected to face more frequent and destructive storm surges in the coming decades, potentially placing hundreds of millions of people at risk [4,5]. The continuous, accurate, and reliable monitoring of anomalous sea level variations during storm surges is not only a fundamental observational basis for current storm surge research, but also a critical prerequisite for analyzing and assessing their hazard mechanisms and impacts.
Conventional sea level monitoring techniques primarily include tide gauges and satellite radar altimetry. Tide gauges can provide high-accuracy measurements of sea surface height, but their construction and maintenance are expensive, hindering large-scale deployment. Moreover, traditional tide gauges are typically installed near the waterline and are susceptible to structural damage or operational failures during extreme weather events such as storm surges, often resulting in data interruptions [6,7,8]. While satellite radar altimetry offers high measurement accuracy and broad spatial coverage over open oceans, its performance near coastlines is substantially degraded, and it struggles to capture the rapid changes in sea surface height that occur during storm surge events [9,10]. A single measurement technique inevitably has inherent limitations and cannot fully reveal the characteristics of sea level changes at different spatial and temporal scales.
GNSS is currently widely used in earth science research, including crustal deformation, disaster monitoring, hydrological assessment, and many other fields [11]. The GNSS Interferometric Reflectometry (GNSS-IR) technique was first introduced by Larson in 2008, offering a novel approach for sea level monitoring by utilizing GNSS signals reflected from the water surface [12]. The GNSS-IR technique determines water level variations by analyzing the Signal-to-Noise Ratio (SNR) signals to calculate the vertical distance from the reflecting surface to the antenna phase center [13]. Löfgren et al. (2014) improved the inversion method by incorporating tidal models based on data from five global sites and investigated the characteristics and patterns of long-term sea level change [14]. Since then, researchers have expanded the application of GNSS-IR to various water bodies, including seas [15], rivers [16], lakes [17], and reservoirs [18]. These results demonstrate that GNSS-IR can achieve a high retrieval accuracy under stable water level conditions. Under different water conditions, there are significant differences in measurement accuracy. For example, in calm water bodies such as reservoirs, the GNSS can achieve millimeter-level accuracy in long-term, water level observation sequences [19]. In pumped-storage power stations, when water levels change very rapidly, accuracy can only be maintained at around 30 cm [20]. In sea level monitoring, due to varying tidal movement amplitudes among different stations, measurement accuracy ranges from the centimeter level to decimeter level [21,22]. Collectively, these studies indicate that factors such as sea surface fluctuations, their amplitude, and rate of change can all influence the GNSS-IR measurement accuracy. However, most existing studies have focused on calm hydrological conditions, while under extreme events such as typhoons, tsunamis, and storm surges, the accuracy of the GNSS-IR inevitably faces substantially different challenges.
In recent years, the application of GNSS-IR in hydrological monitoring has continued to expand, and researchers have progressively carried out experiments and evaluations on water level monitoring under extreme conditions. Peng et al. (2019) used GPS data at the HKQT and HKPC stations in Hong Kong to retrieve the sea surface height during a storm surge event [23]. Since then, numerous studies have further investigated the applicability of GNSS-IR under extreme sea level conditions across various regions [24,25,26], progressively expanding its scope of application. Multi-GNSS GNSS-IR studies have demonstrated that the technique can effectively capture abnormal sea level variations caused by events such as storm surges and tsunamis, serving as a valuable supplement to traditional coastal hazard early warning systems [27]. Owing to the widespread global distribution of GNSS stations, integrating observations from multiple stations enables the GNSS-IR to detect spatial variations in sea level within the same region during storm surges, which overcomes the spatial limitations of conventional tide gauges [28]. Moreover, GNSS-IR can be utilized for tsunami inference, offering a potential alternative to traditional seafloor monitoring equipment [29]. These findings indicate the high adaptability of GNSS-IR technology during extreme sea level events. However, these studies were conducted at different sites with varying measurement accuracies and storm surge intensities, making it difficult to comprehensively assess how GNSS-IR accuracy responds to extreme water level changes. Results based on a single site or event may be influenced by case-specific variability and thus lack broader representativeness. Although previous research has preliminarily confirmed the feasibility of GNSS-IR during storm surge events, a systematic evaluation of its stability remains lacking—particularly with respect to its applicability and robustness under varying storm surge intensities, tracks, and site-specific environmental conditions.
To analyze the accuracy and reliability of GNSS-IR in monitoring abnormal water levels, this study selected two continuously operating GNSS stations (CORS) located along the Gulf of Mexico coast in the United States. By analyzing six typical storm surge events between 2017 and 2024, we assessed the monitoring capabilities and robustness of GNSS-IR under extreme conditions in the Gulf region and comprehensively analyzed the spatiotemporal evolution of water level anomalies caused by hurricane movements. This study systematically evaluates the sea level monitoring performance and accuracy of GNSS-IR under varying oceanic conditions and further explores its potential applications in monitoring and assessing extreme climate events.

2. Data and Methods

2.1. Study Area and GNSS Datasets

This study selects two nearshore GNSS stations with favorable observation environments and GNSS-IR reflection conditions: the CALC (ID: 10121) station located on the southern coast of Louisiana, U.S. and the FLCK (ID: 10411) station along the central coast of Florida, U.S. (Figure 1). For the CALC station, it equipped with a Trimble Alloy GNSS receiver (Trimble Inc., Sunnyvale, CA, USA), and a Trimble TRM115000.00 antenna (Trimble Inc., Sunnyvale, CA, USA). For the FLCK station, it equipped with a Leica GR50 GNSS receiver (Leica Geosystems AG, Heerbrugg, Switzerland), and a LEIAR20 LEIM antenna (Leica Geosystems AG, Heerbrugg, Switzerland). The CALC station is surrounded by open terrain with no obstructions, and its proximity to the sea provides ideal GNSS reflection surfaces. Therefore, GNSS data selection for this site is limited to an azimuth range of 0–360° and an elevation angle range of 10–30°. CALC is a continuously operating GNSS reference station jointly established by the U.S. National Oceanic and Atmospheric Administration (NOAA) and UNAVCO. The FLCK station is located near some non-water reflective surfaces such as docks. To reduce interference from these structures, the GNSS data selection at FLCK is restricted to an azimuth range of 60–330° and an elevation angle range of 5–30°. These two stations can receive signals from GPS, GLONASS, and Galileo systems. Both stations are co-located with NOAA tide gauges (CALC: Station ID 8768094, FLCK: Station ID 8727520), which provide measured tide level data and wind speed observations at six-minute intervals. The tide gauge data were obtained from the official NOAA Tides & Currents website (https://tidesandcurrents.noaa.gov/stationhome.html?id=8768094 for the CALC station and https://tidesandcurrents.noaa.gov/stationhome.html?id=8727520 for the FLCK station). The vertical antenna heights relative to the long-term mean sea level are 12.6 m for CALC and 10.2 m for FLCK, and the GNSS observation data have a sampling interval of 30 s.

2.2. Hurricane Datasets

To systematically evaluate the adaptability and robustness of GNSS-IR technology under storm surge conditions, this study selected six representative hurricane events occurring between 2017 and 2024, with each station experiencing three storm surge events. Hurricane information was obtained from the NOAA National Hurricane Center (https://www.nhc.noaa.gov (accessed on 26 July 2025)), and the detailed overview is presented in Table 1. Figure 1 summarizes the trajectories of these six hurricanes to illustrate their spatial relationship with the GNSS stations, along with onsite photographs of the two stations (image source: https://geodesy.noaa.gov (accessed on 26 July 2025)). These six hurricane events vary significantly in terms of spatial distribution (Figure 1), with maximum wind speeds ranging from 130 km/h to 286 km/h. This significant variability ensures a more comprehensive and objective testing and evaluation study.

2.3. Methods

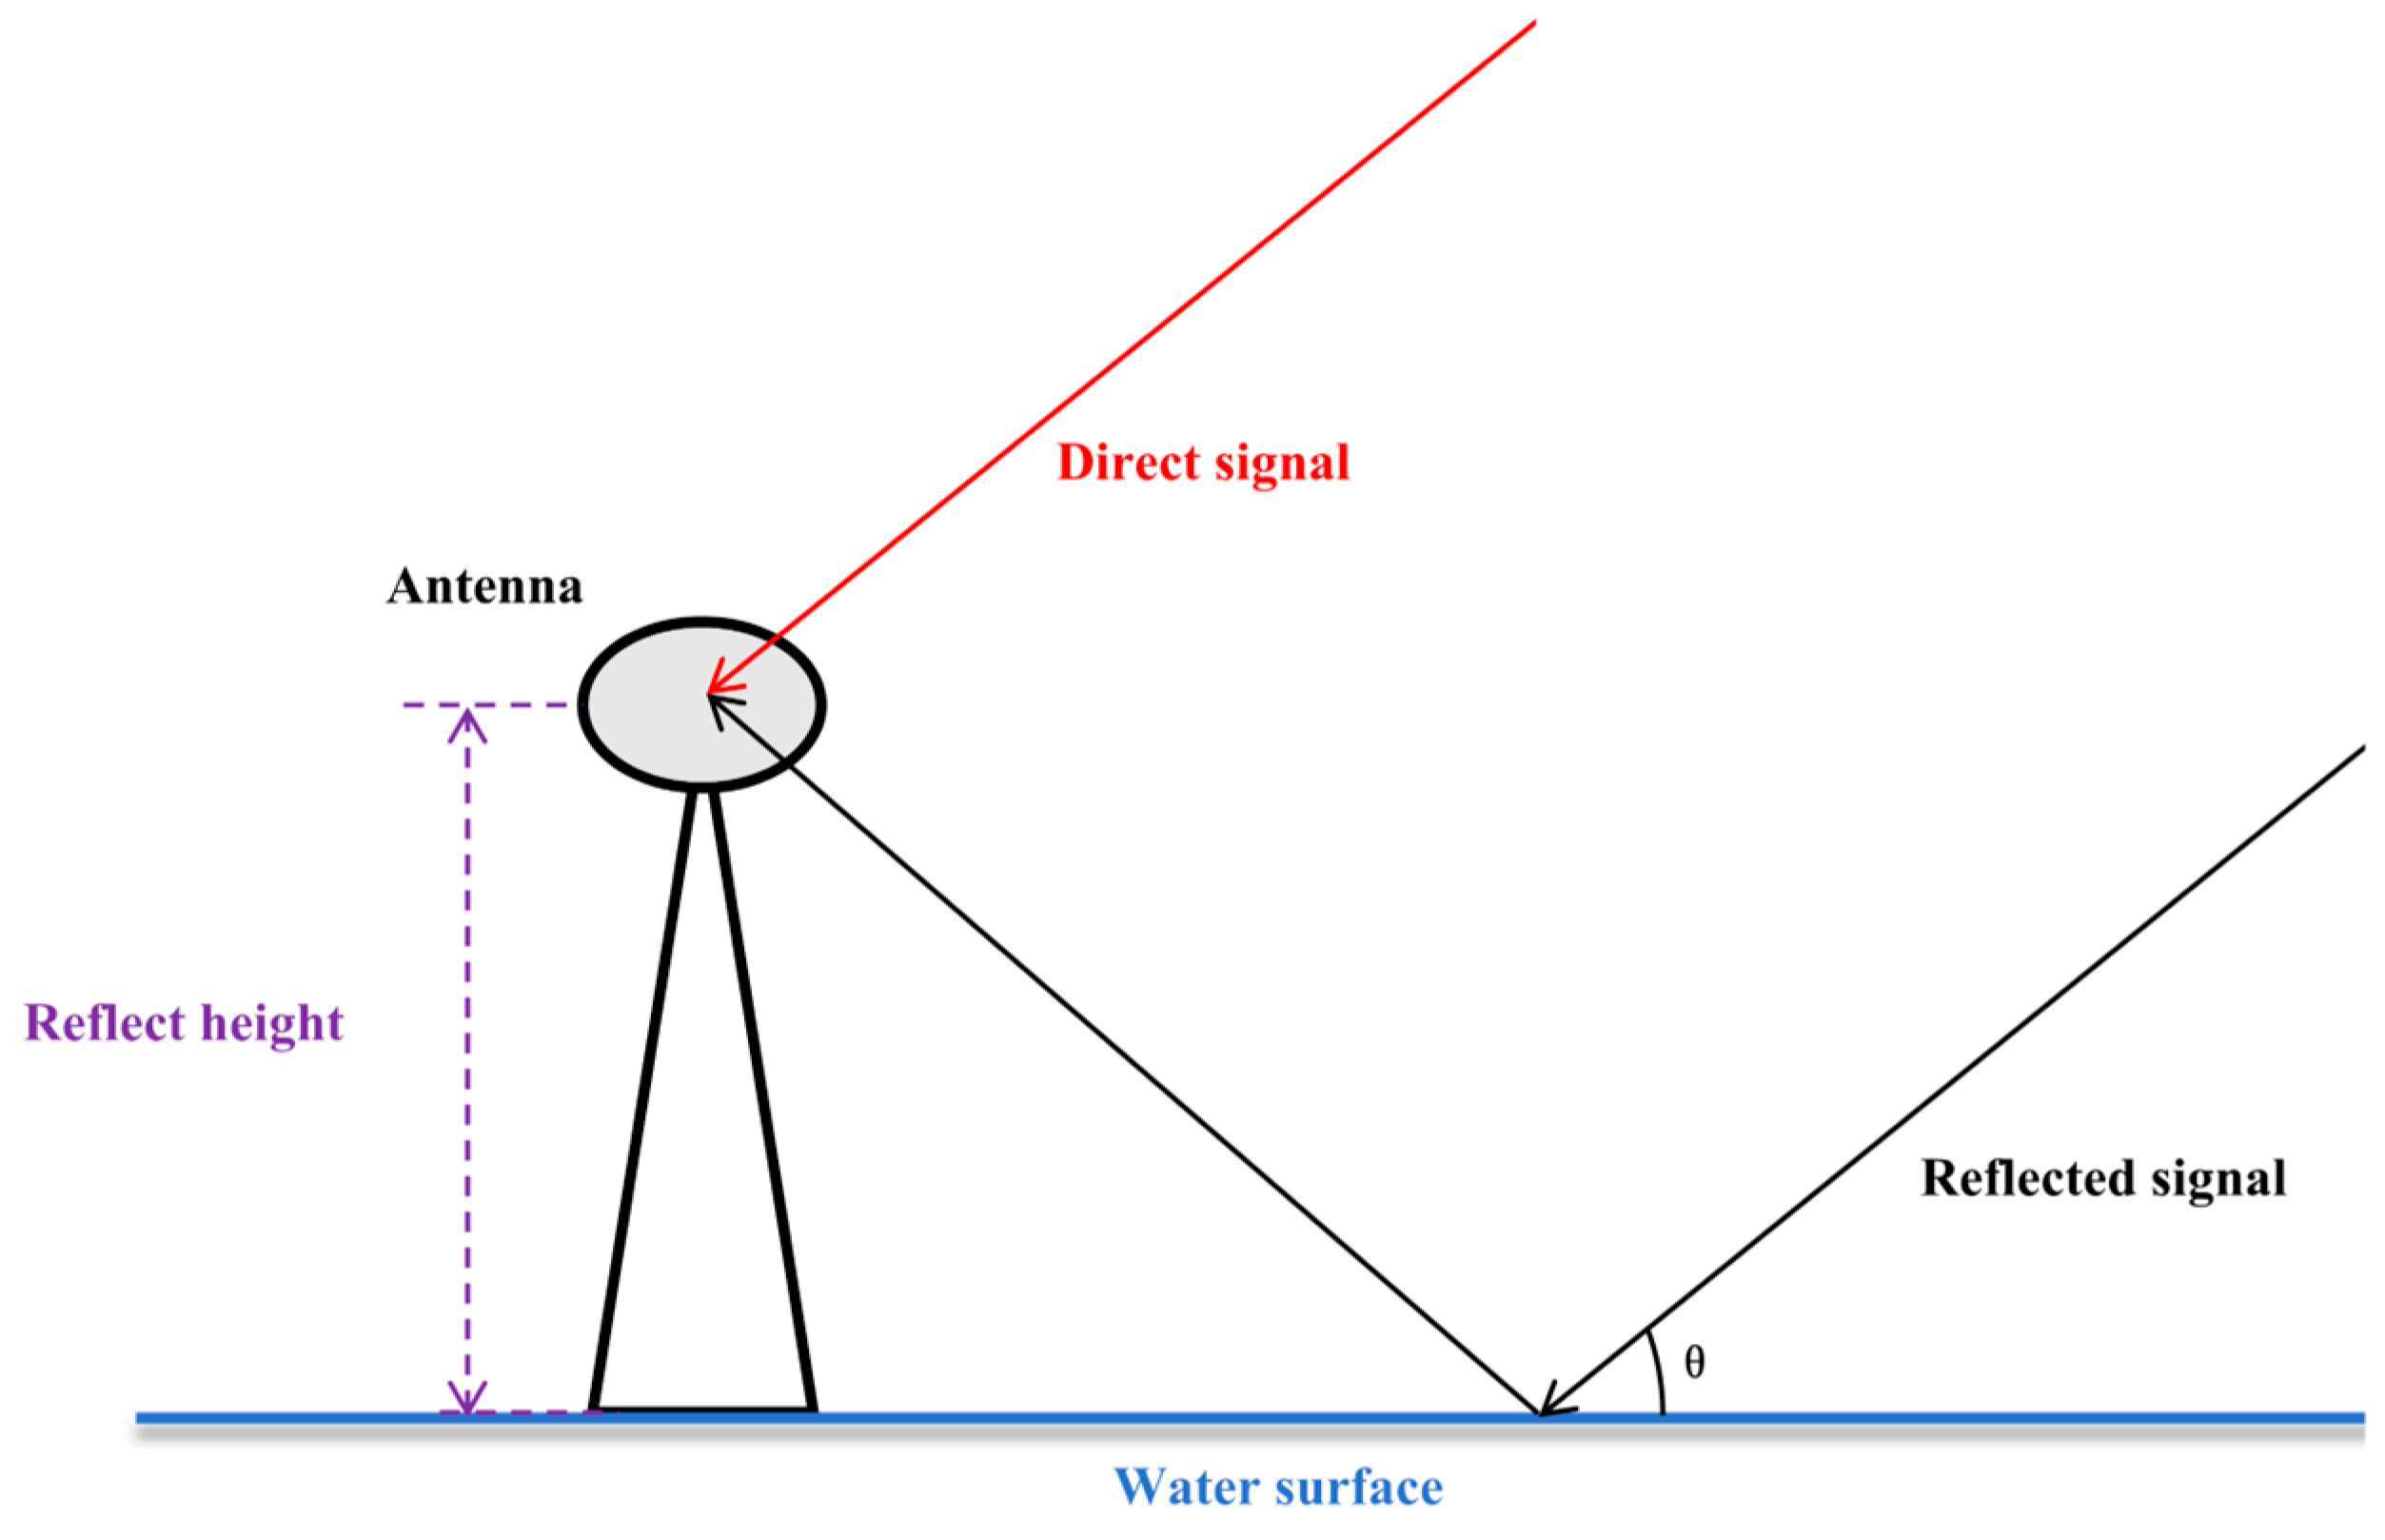
The GNSS receiver simultaneously receive direct signals from satellites as well as indirect signals reflected off surfaces such as the ground and water. These two types of signals interfere and superimpose at the receiver, resulting in multipath effects [12]. This phenomenon is illustrated in Figure 2. The multipath interference effect manifests in GNSS observation data as periodic oscillations in the Signal-to-Noise Ratio (SNR). Since the direct signal strength is typically much stronger than that of the reflected signal, a low-order polynomial is commonly fitted to the original SNR data to model and remove the trend component. In this study, a uniform second-order polynomial was applied to obtain the detrended SNR (DSNR). This process yields the DSNR, which facilitates the effective extraction and analysis of the periodic features associated with the reflected signals. After detrending, the DSNR exhibits clear periodic oscillations [30]:
D S N R = 2 A d A m cos ψ = A cos 2 π λ · 2 h sin θ + ψ 0
where θ is the satellite elevation angle corrected for tropospheric delay using the Ulich model [31]:
Δ θ = 10 6 N cos θ sin θ + 0.00175 tan 87.5 θ , θ = θ + Δ θ
By defining t = 2 s i n θ , f = 2 h / λ , the equation can be rewritten as
D S N R = A cos π · f t + ψ 0
Equations (1) and (3) indicate that the oscillation frequency of the reflected signal is directly related to the effective reflection height h, defined as the vertical distance from the reflecting surface to the phase center of the GNSS antenna. This relationship is expressed as f = 2 h / λ , where λ is the signal wavelength.
To extract the dominant frequency f , spectral analysis of the DSNR was performed using the Lomb–Scargle Periodogram. The high-frequency cutoff was dynamically estimated based on the Nyquist frequency, determined by the satellite arc length and the number of samples within the arc, and further scaled by a prescribed maximum reflector height to avoid an excessively wide search range. To exclude spurious peaks while retaining as much data as possible during storm surge conditions, a minimum peak-to-noise ratio threshold of 2 was imposed. Additionally, candidate peaks were restricted to the range of the long-term relative mean sea level at each station (CALC: 12.6 m, FLCK: 10.2 m). During calm periods, this range was set to ±2.5 m, while during storm surge conditions, it was expanded to ±5 m.
We evaluate the feasibility of GNSS-IR for storm surge monitoring and examine its retrieval accuracy during such events. Two coastal GNSS stations on the Gulf of Mexico—CALC and FLCK—were selected for a series of retrieval experiments covering multiple representative storm surges from 2017 to 2024. For the CALC station, signals within an elevation angle range of 10–30° and an azimuth range of 0–360° were utilized, whereas for FLCK the elevation angle range was set to 5–30° and the azimuth range to 60–330°. To ensure the robustness of these estimates, we applied a three times median absolute deviation (3 MAD) filter and performed outlier rejection using a 4 h moving window. Multi-GNSS integration was performed by simply concatenating results from different constellations without weighting to maximize temporal coverage. This quality control procedure yielded a continuous GNSS-IR sea surface height time series. The retrieved heights were then compared against contemporaneous tide gauge measurements to assess both accuracy and trend consistency.

3. Results of GNSS-IR-Based Storm Surge Monitoring

3.1. Identification and Monitoring of Storm Surge Events

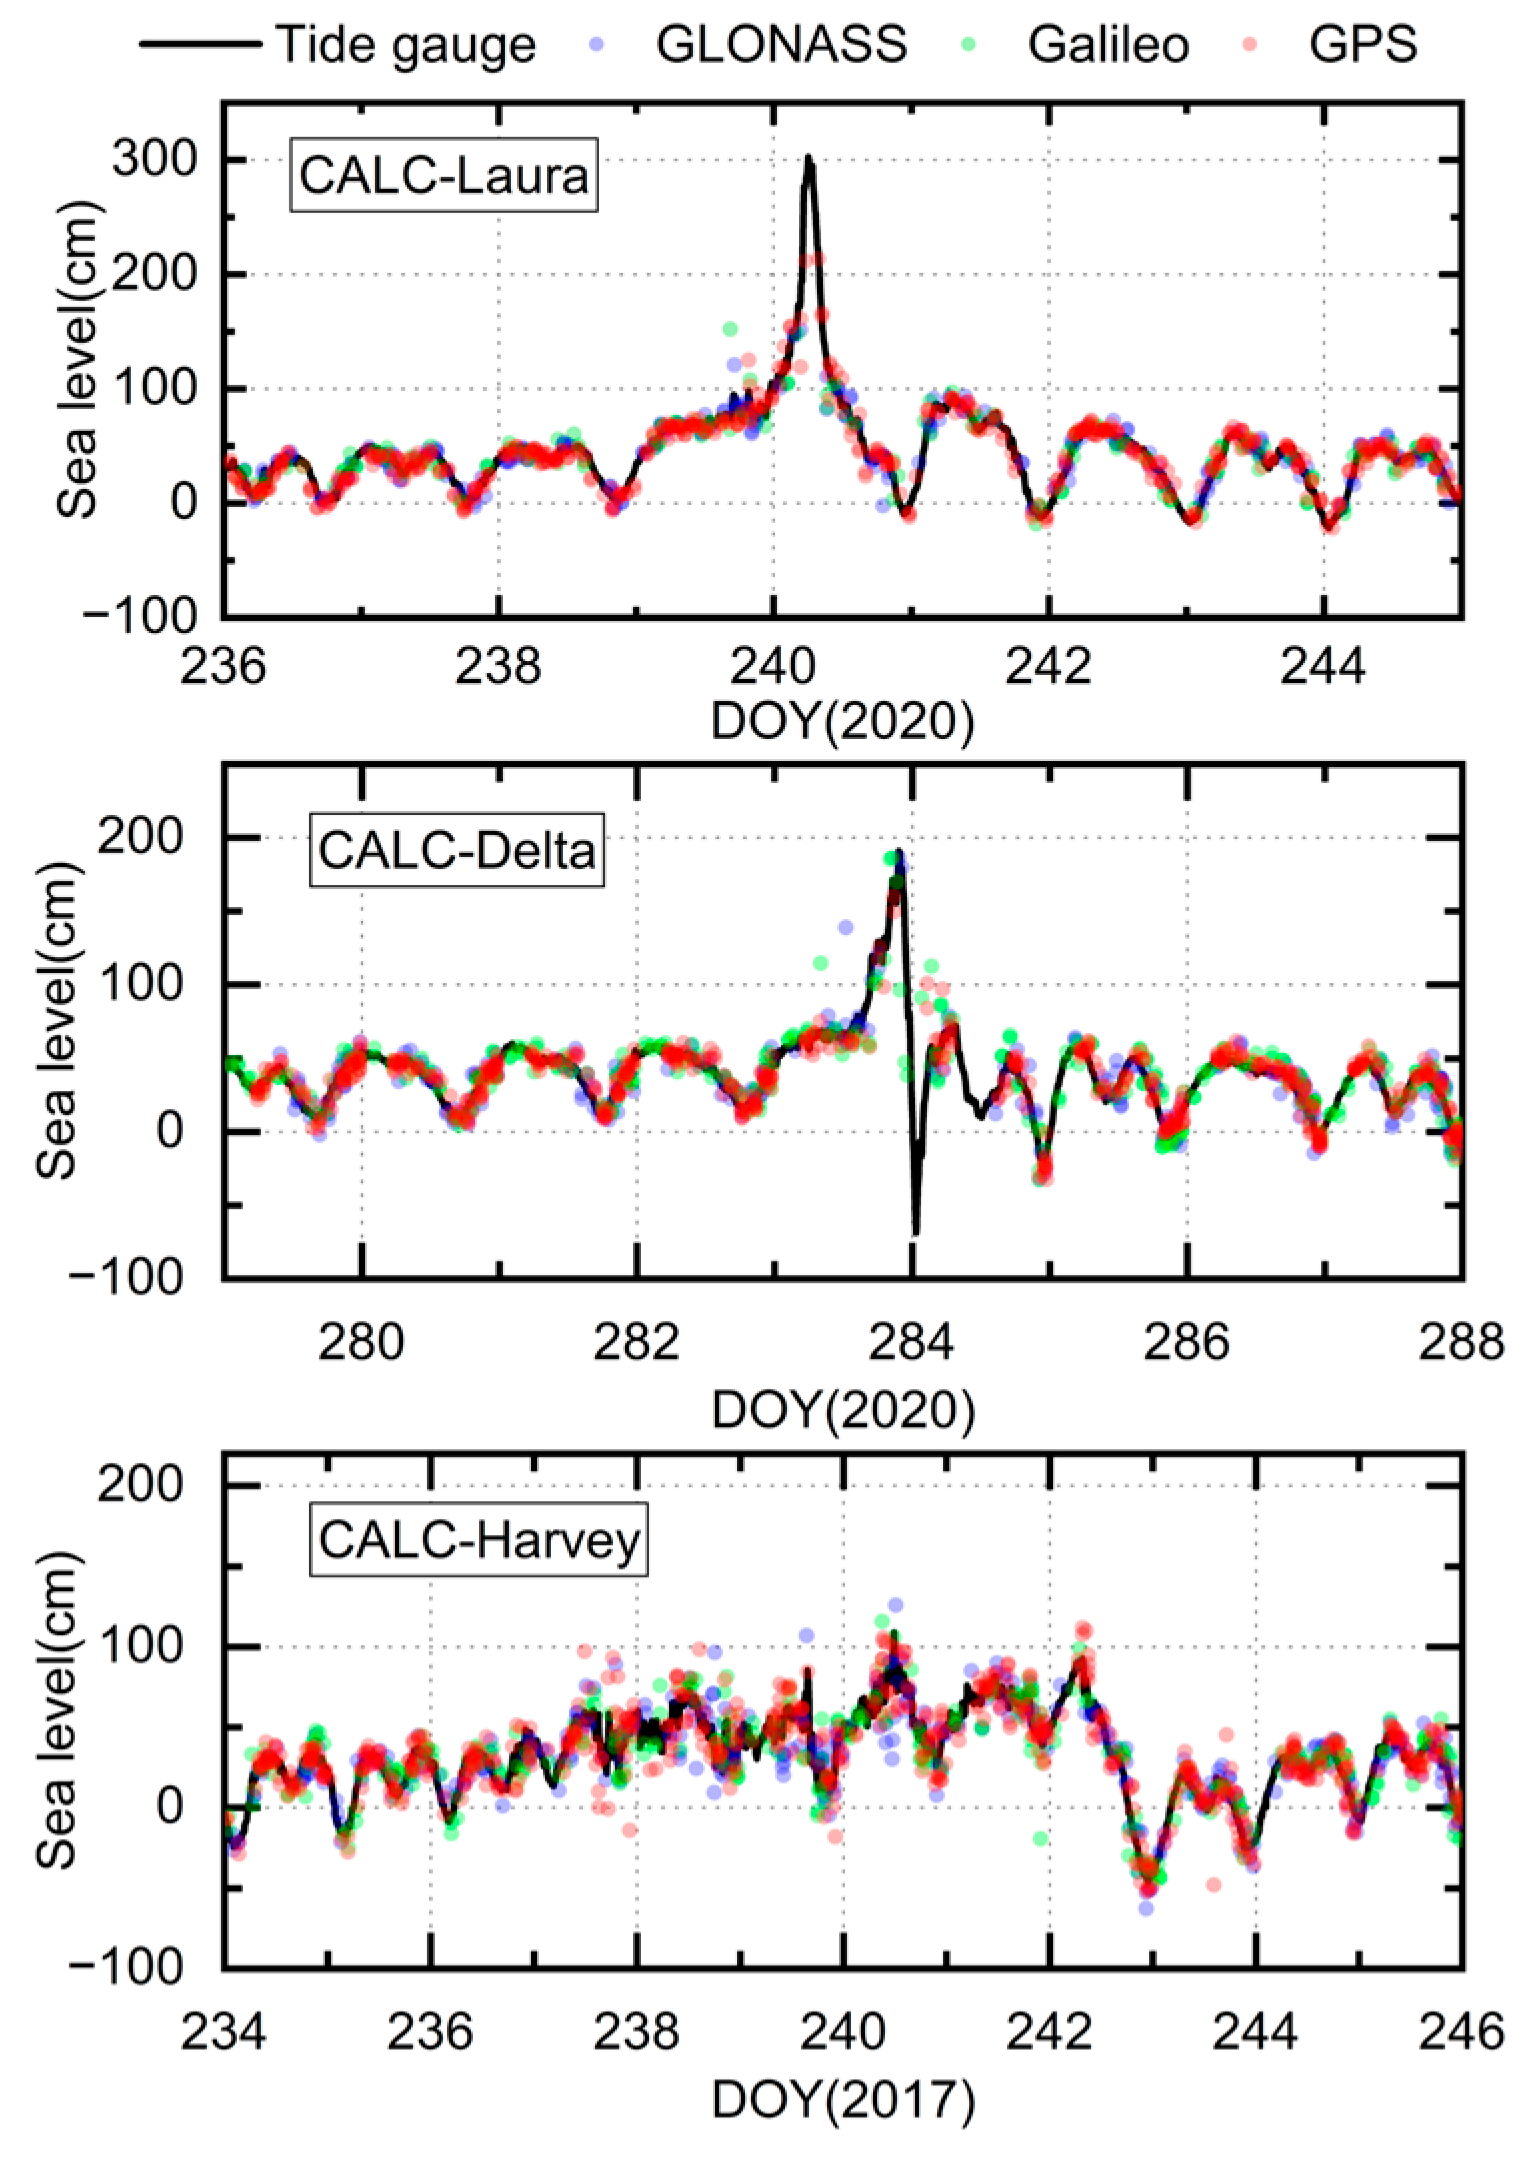
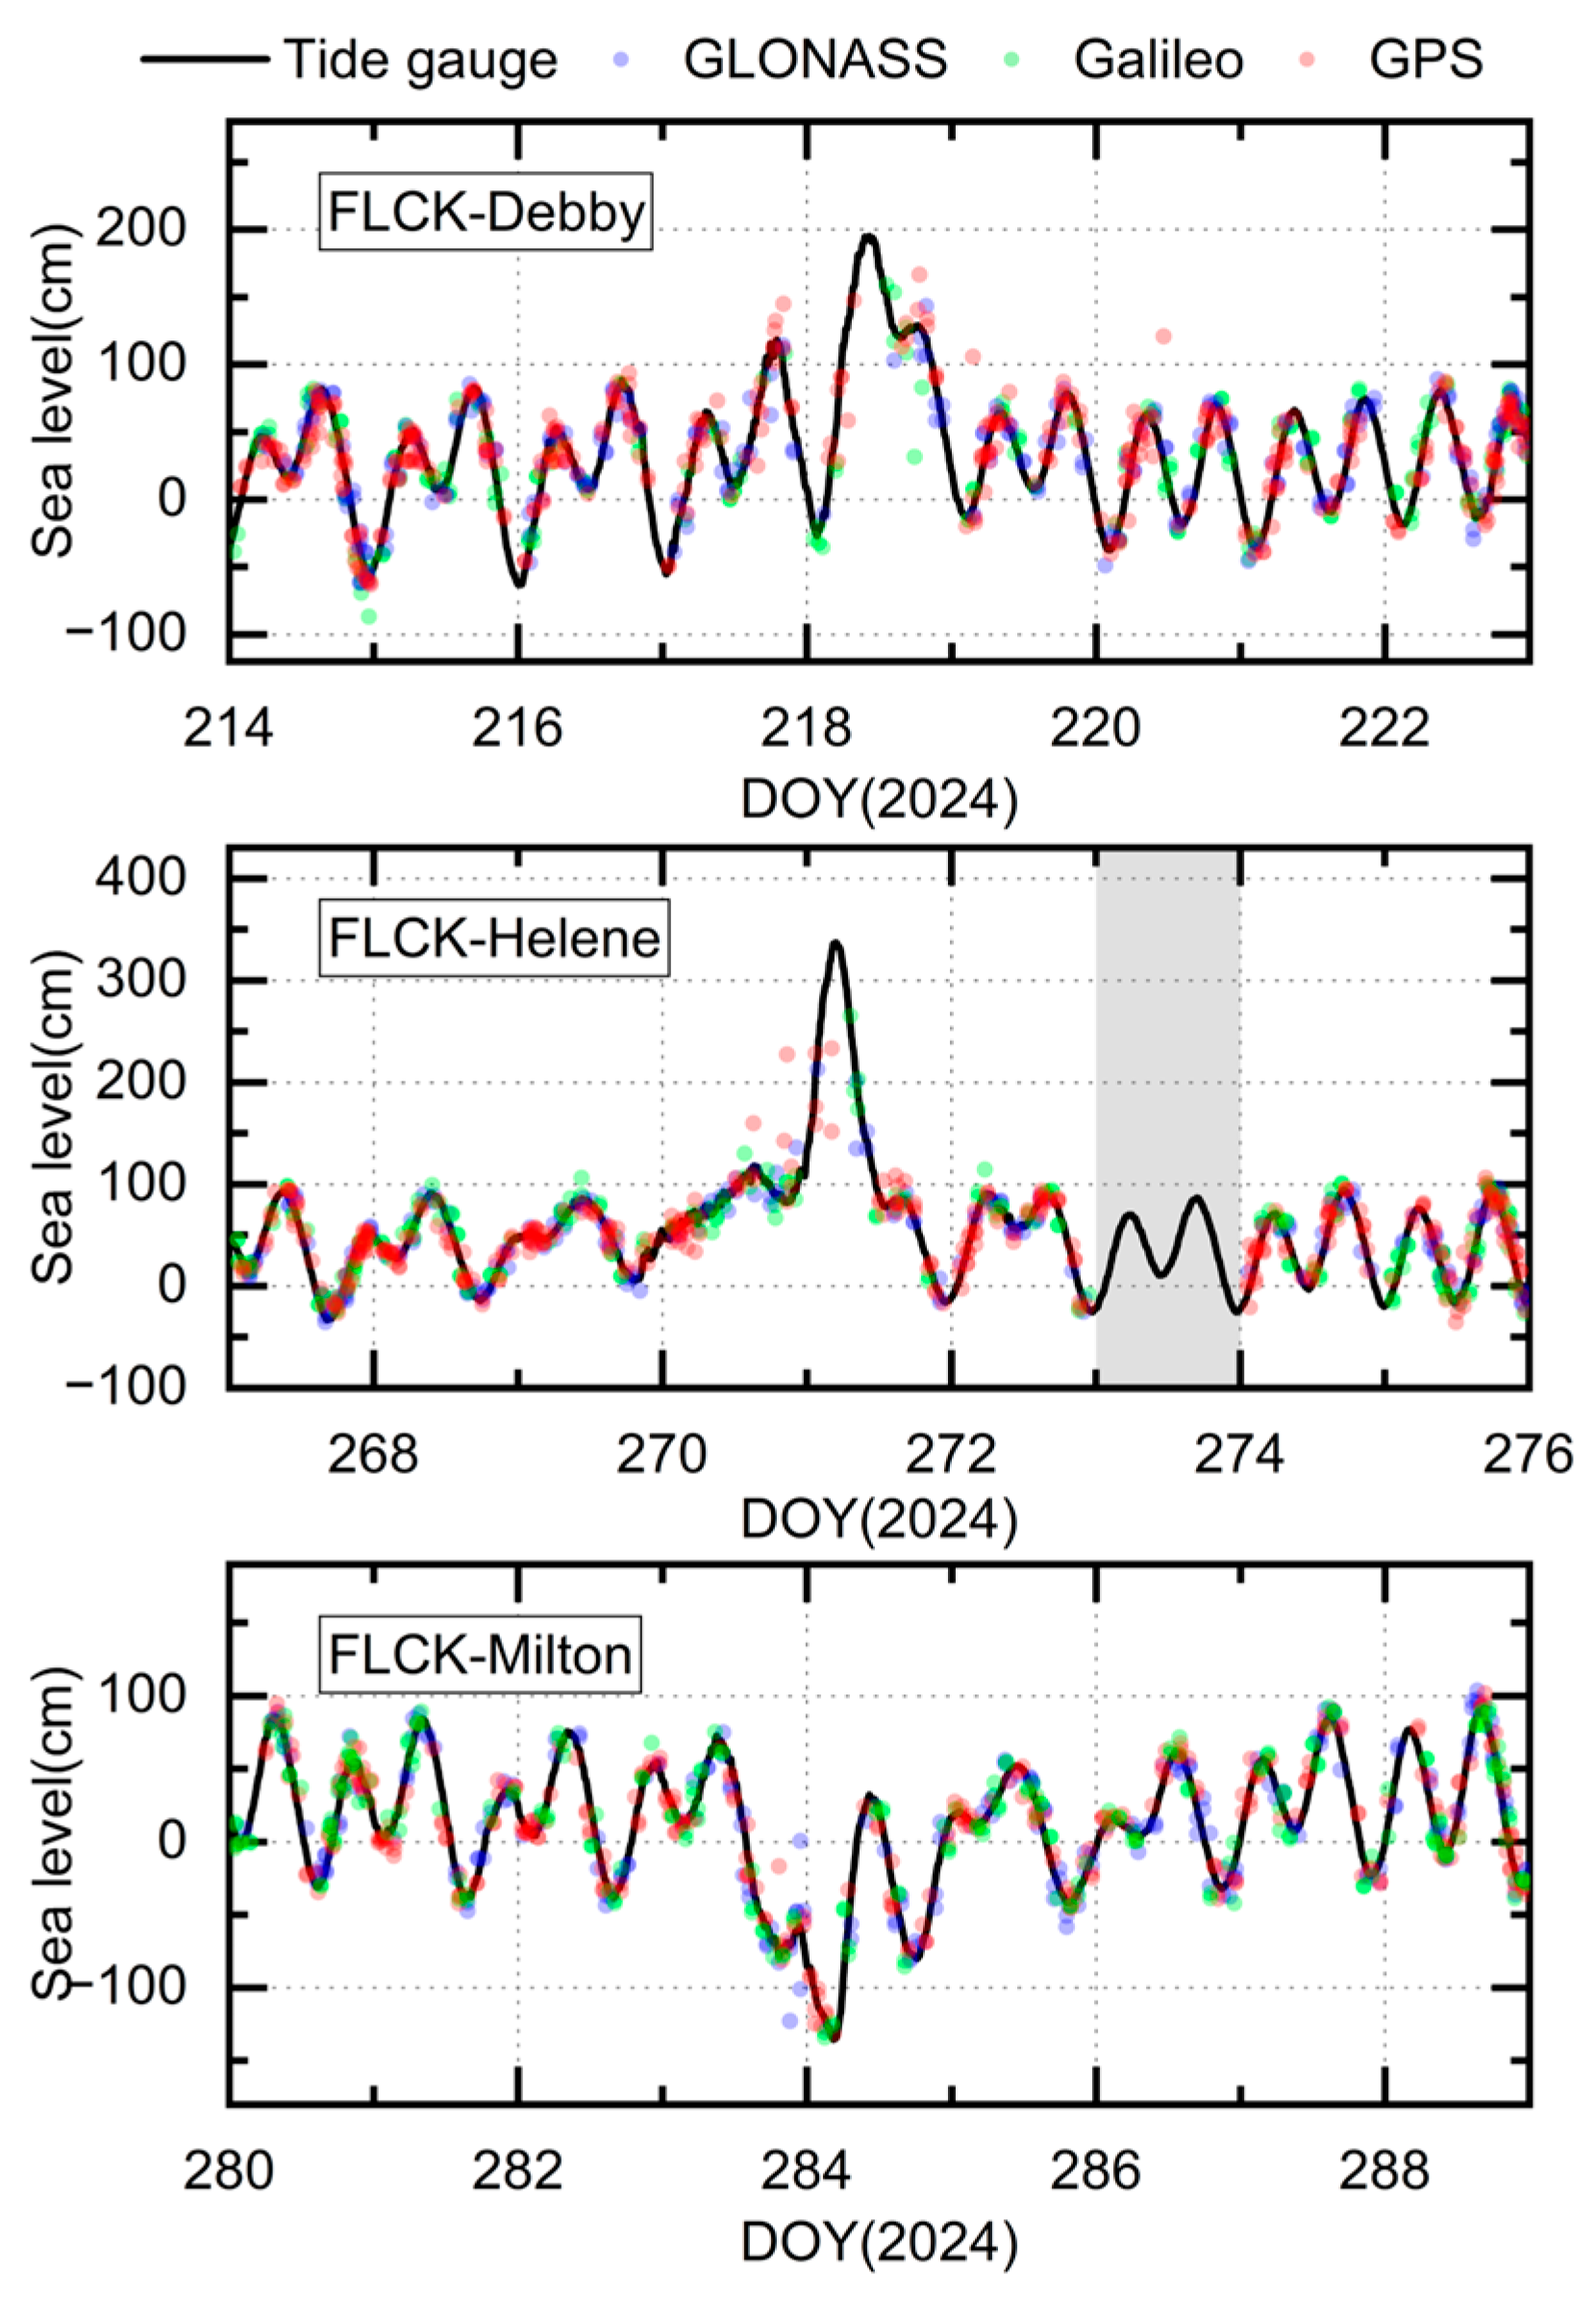
Figure 3 and Figure 4 present a comparison between GNSS-IR-retrieved sea surface height (SSH) retrievals and tide gauge measurements across multiple storm surge events. Except for a data gap at FLCK on DOY 273–274 (2024), the dataset is complete. Overall, the results demonstrate that GNSS-IR effectively captures rapid water level fluctuations associated with storm surge episodes. During relatively calm periods, water level variations are slow and consistent. Under such conditions, all three satellite constellations—GPS, GLONASS, and Galileo—can effectively capture key oscillation features. The retrieved sea surface heights show a strong agreement with tide gauge data, indicating that GNSS-IR enables high-accuracy, continuous water level monitoring under stable meteorological conditions.
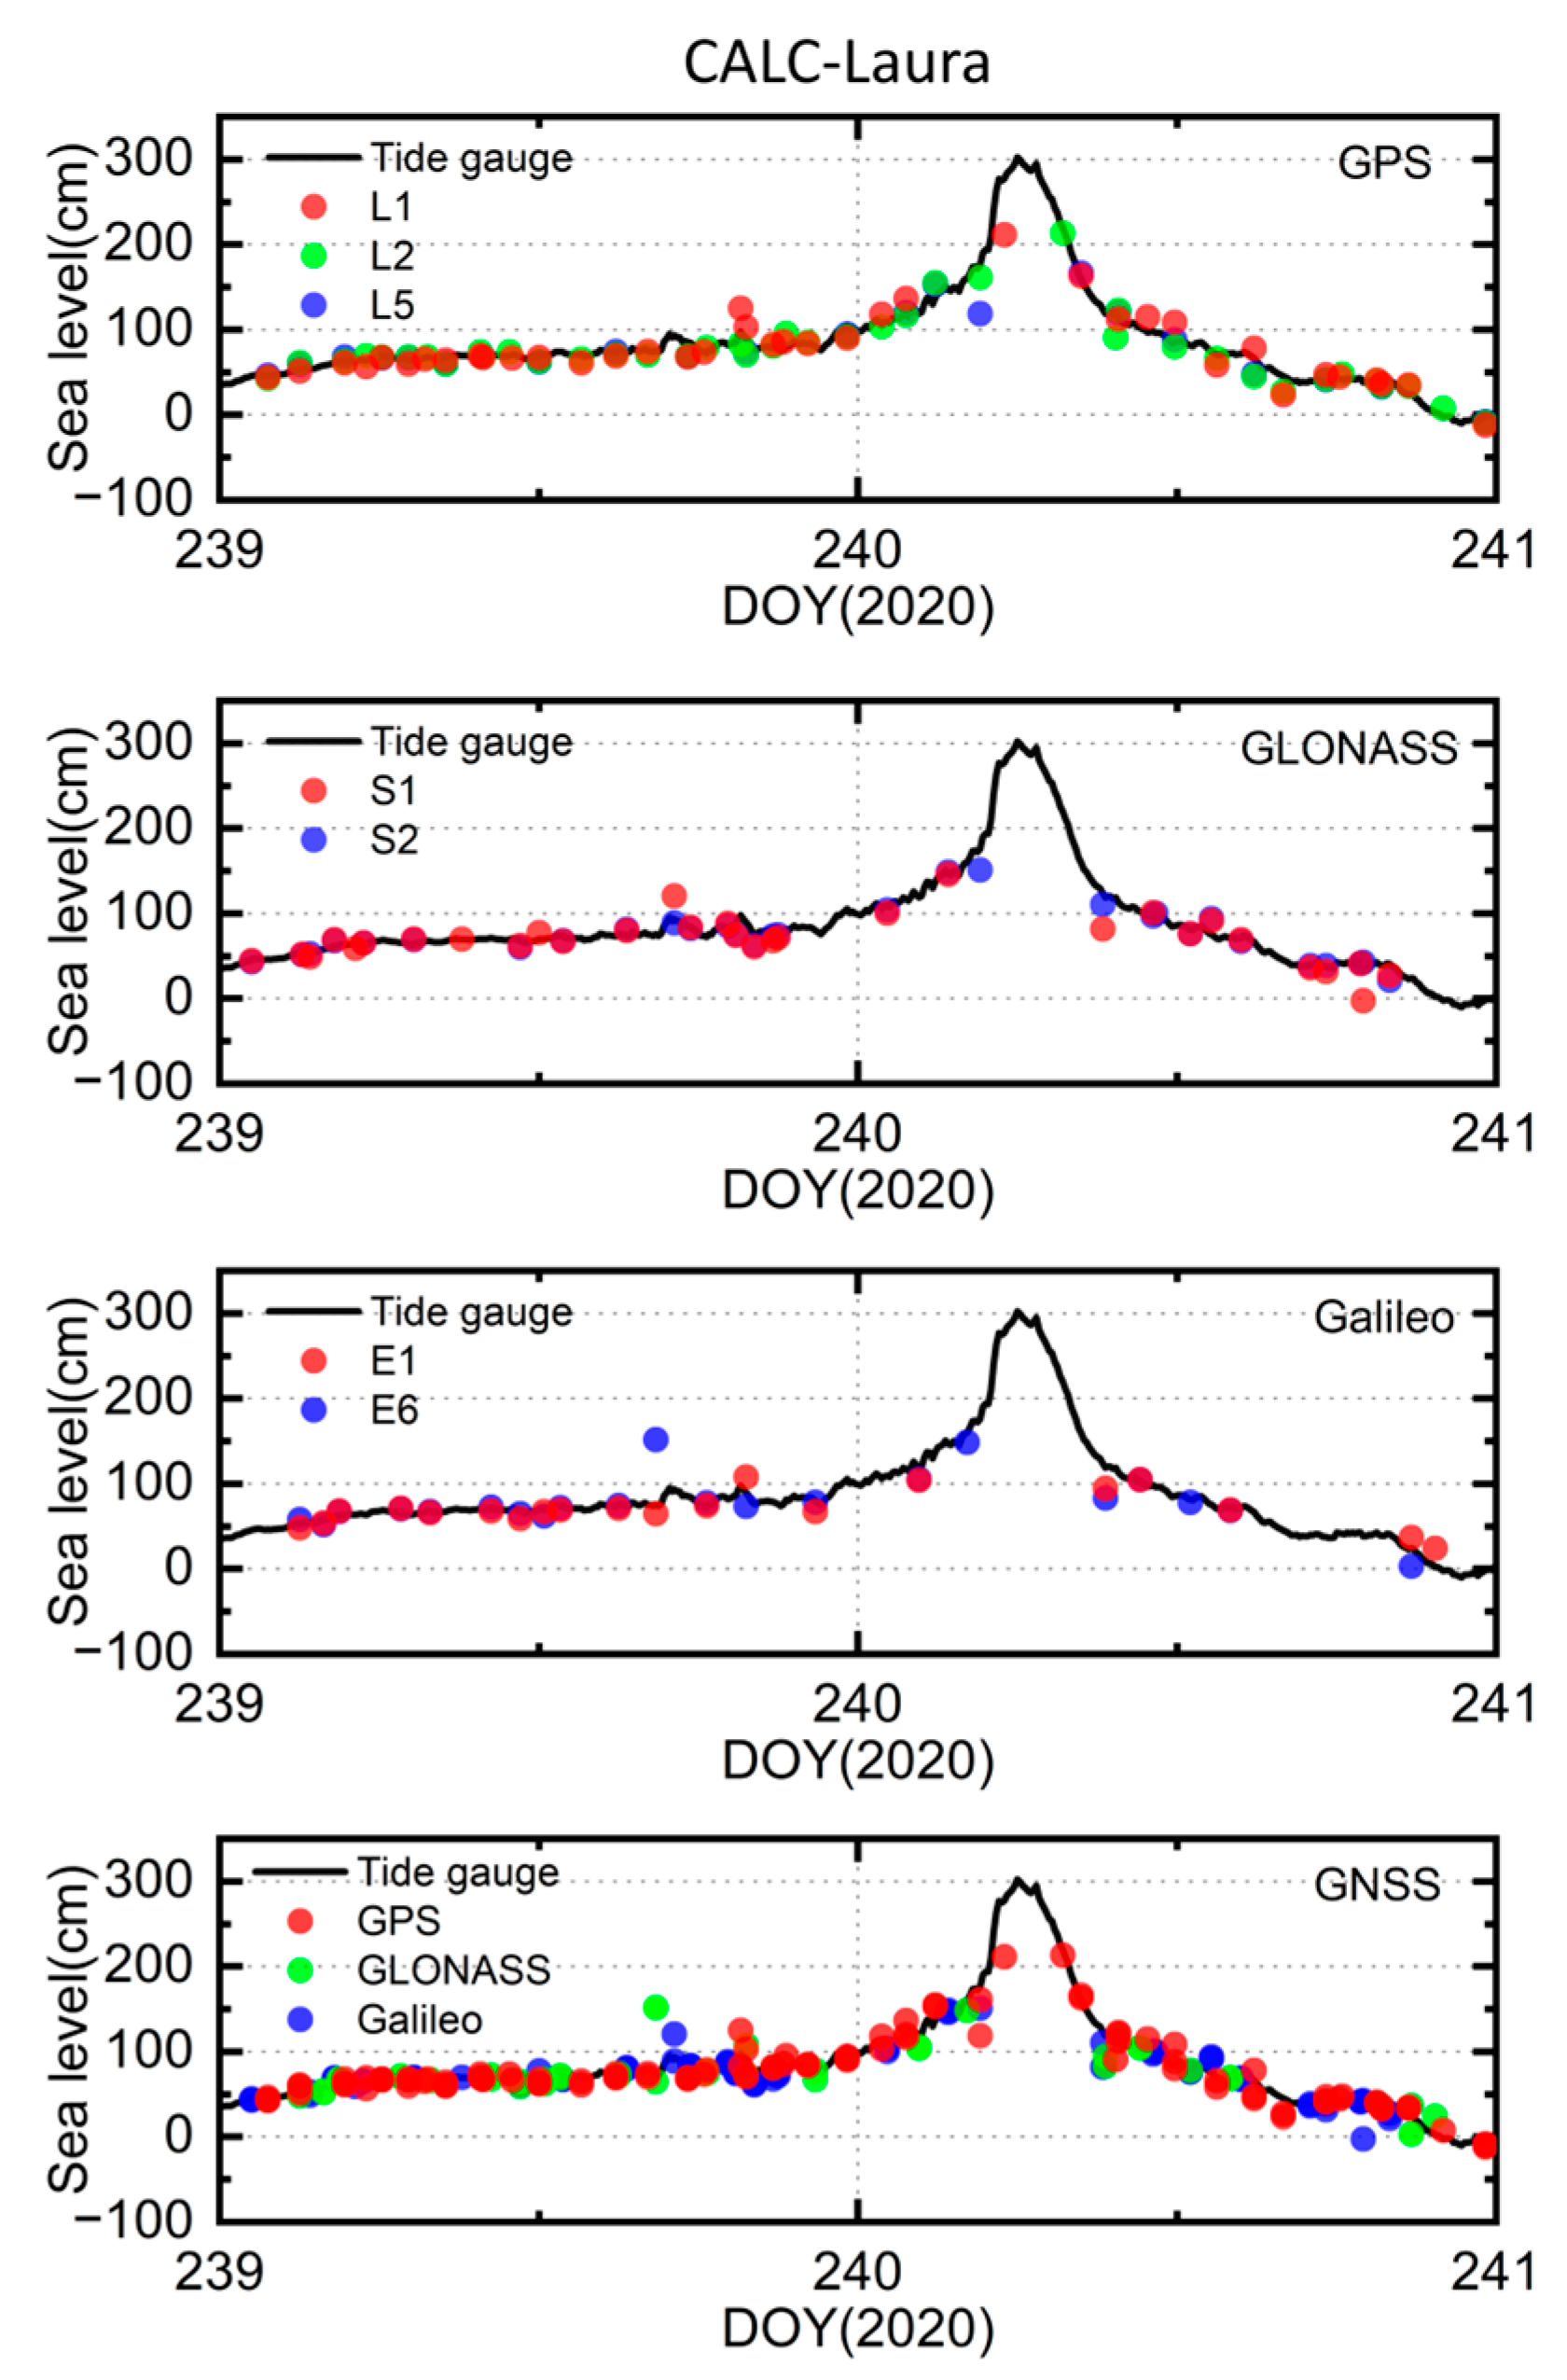
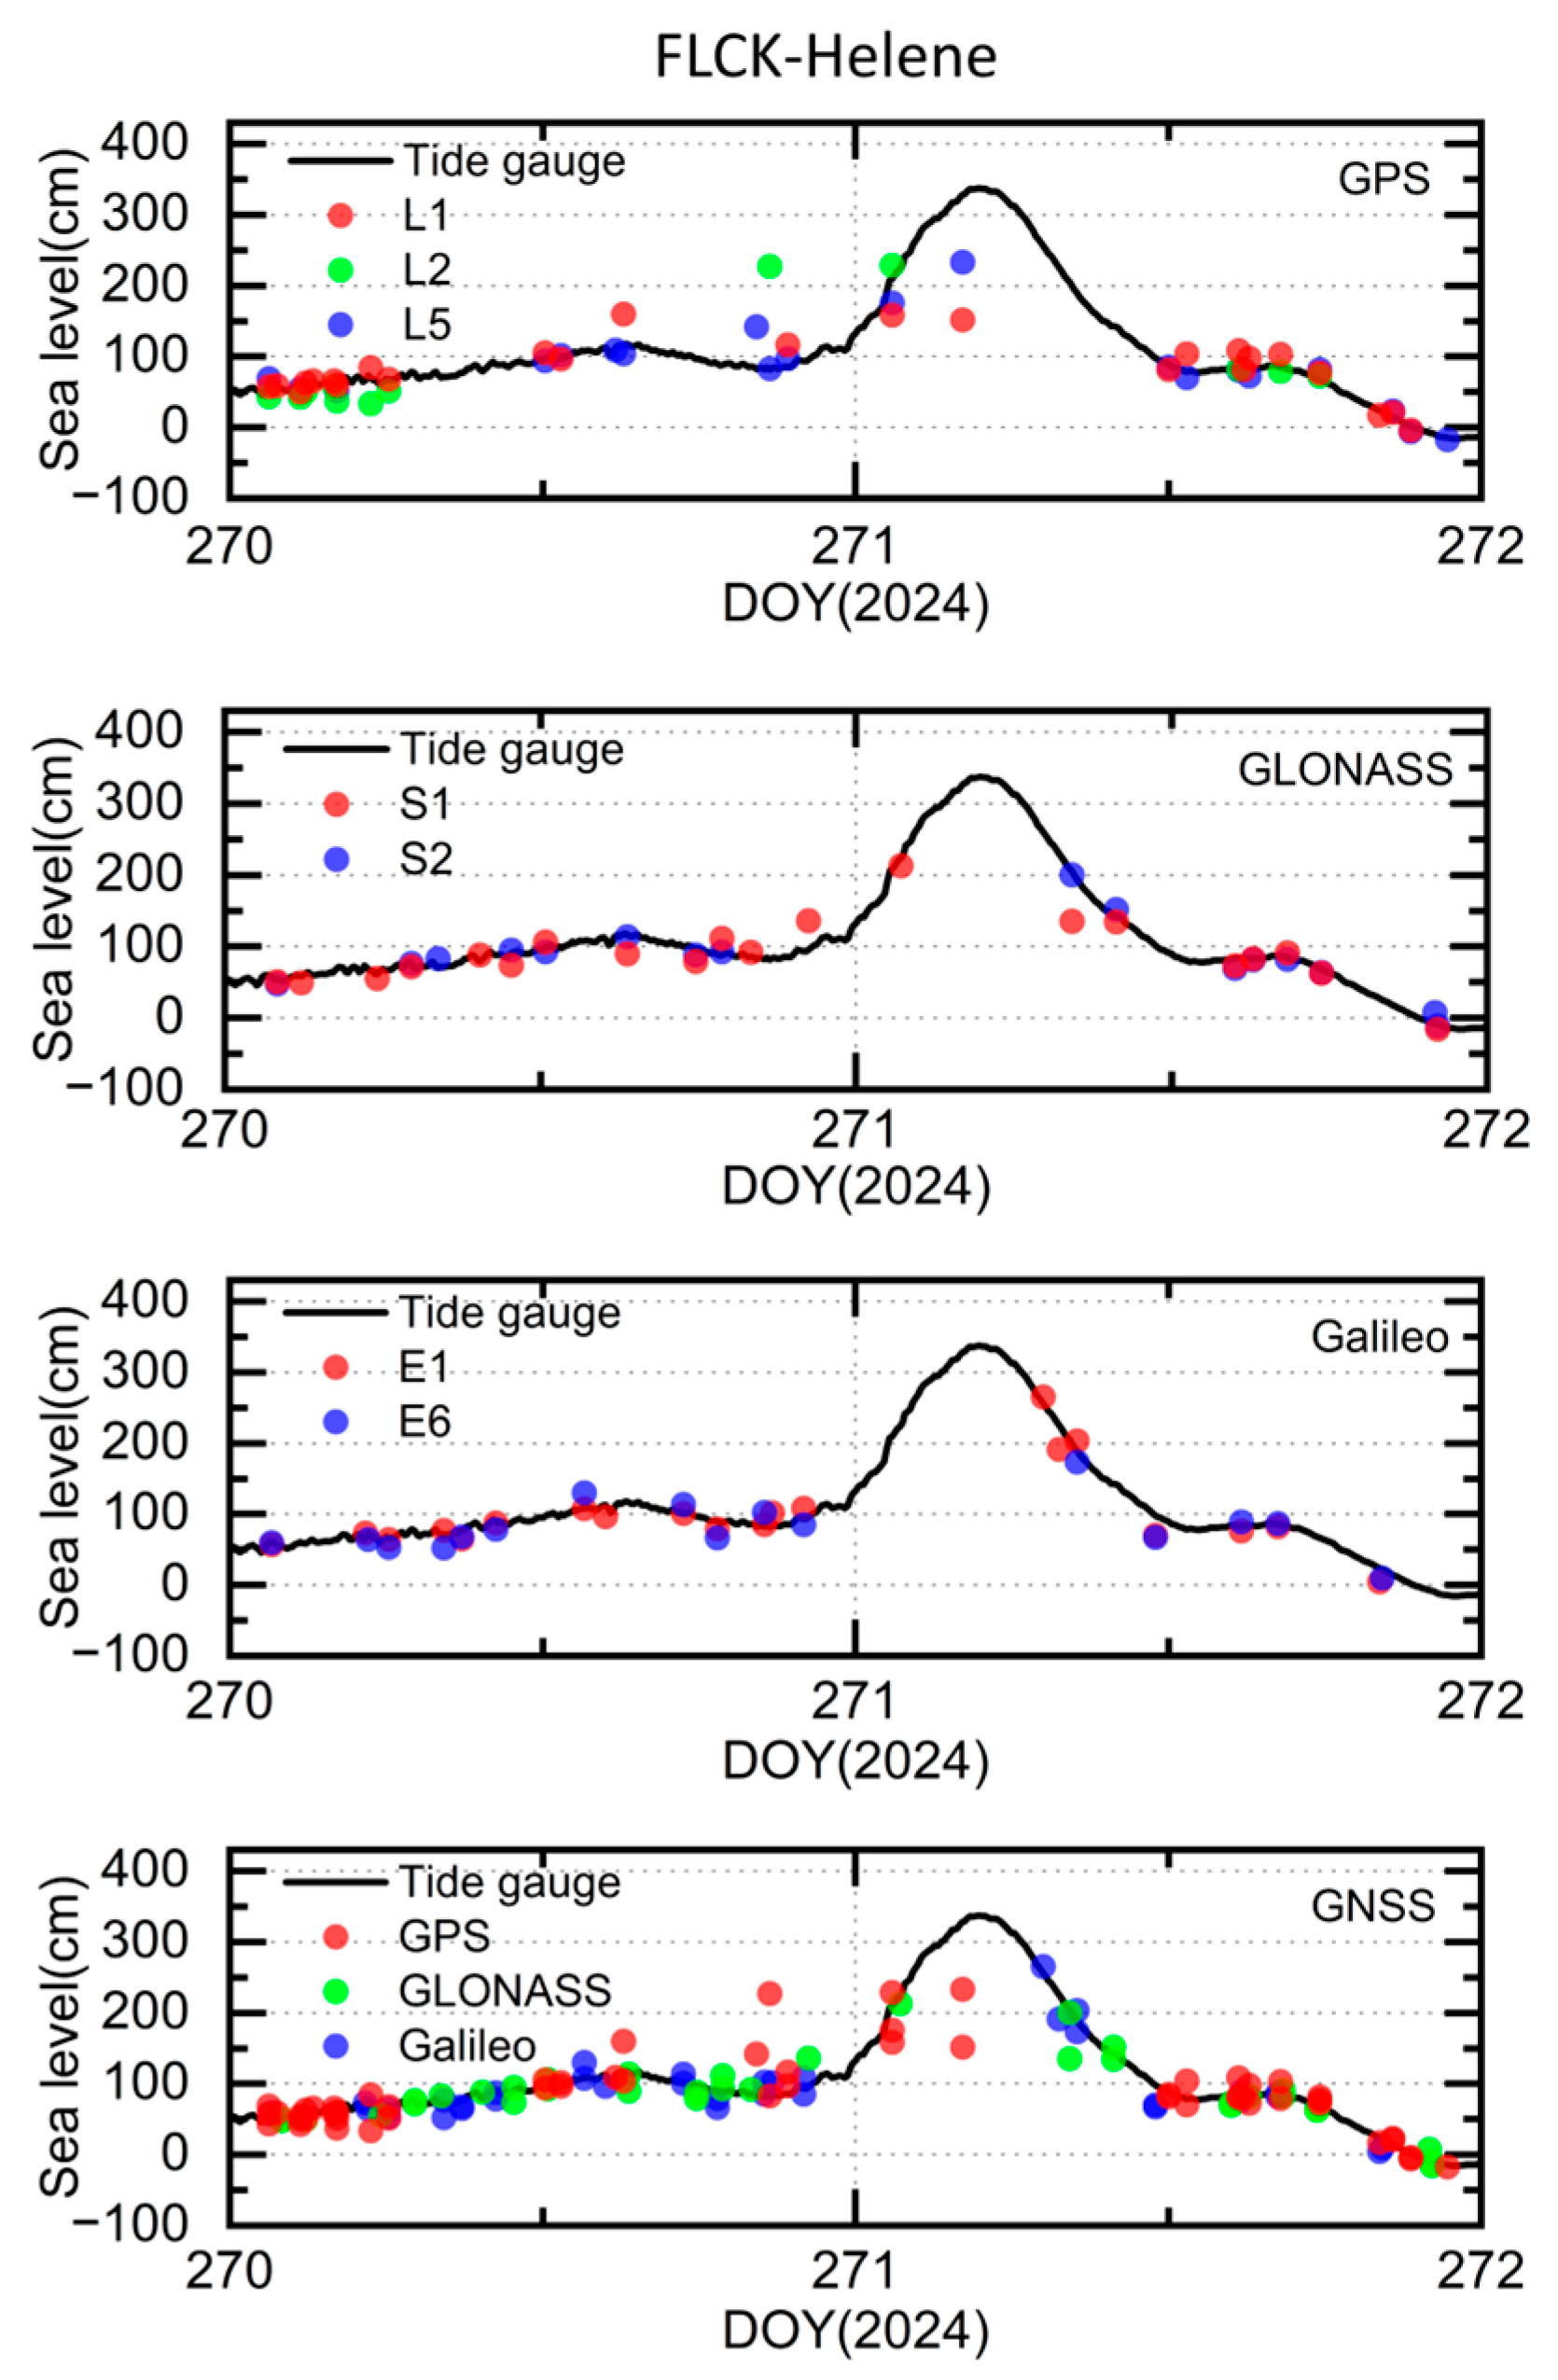
In contrast, during peak storm surge conditions, water levels become highly irregular, rising or falling sharply over short time spans. In these cases, more outliers appear compared to calm periods. Despite the increased overall retrieval error under extreme conditions, most GNSS-IR estimates still remain close to the actual tide levels, confirming the method’s ability to track major water level fluctuations even during extreme events. To further evaluate the retrieval performance of different GNSS constellations under storm surge conditions, two representative events—Hurricane Laura and Hurricane Helene—were selected. For each event, a two-day observation window covering the peak storm surge impact was analyzed. Sea surface height retrievals from GPS, GLONASS, and Galileo and the integration of multiple GNSS systems were compared with collocated tide gauge records. The results are shown in Figure 5 and Figure 6.
In Figure 5 and Figure 6, the black solid line represents the observed sea surface heights recorded by NOAA tide gauges, while colored scatter points correspond to GNSS-IR retrievals from different frequency bands across the three satellite constellations. Among the single GNSS systems, GPS contributes the highest number of observations, whereas other systems show relatively limited coverage. This difference is less noticeable under calm conditions but becomes more pronounced during the peak phases of storm surges when significant fluctuations occur and valid observations become sparse. The integration of multiple GNSS systems can partially mitigate this issue by increasing observational density, thereby enhancing the monitoring of abnormal sea level changes. At the CALC station, GPS-based retrievals closely track the entire storm surge process, with only occasional larger deviations. Meanwhile, at the FLCK station, the Galileo system successfully identified an extreme water level peak of approximately 250 cm. All three GNSS systems demonstrate high retrieval accuracy when water levels remain below 150 cm, further confirming the applicability of GNSS-IR under extreme water level conditions. We evaluated the sea level inversion accuracy and numbers of results of individual GNSS systems and single-frequency bands during the main impact periods of two typical storm surge events, Hurricane Laura and Hurricane Helene, and further assessed the overall performance after multi-system integration (Table 2). During the main impact periods of storm surges, the RMSEs of most single-frequency GNSS signals remained below 20 cm, indicating a generally good inversion accuracy. During Hurricane Laura, the three GPS bands at the CALC station demonstrated a stable inversion performance, with RMSEs ranging from 10.39 to 15.18 cm. Especially, both the L1 and L2 bands produced more than 40 valid observations, indicating both high accuracy and strong reliability. The GLONASS system also maintained a high level of accuracy, with RMSEs below 20 cm and slightly lower, but still enough, valid results (over 30 points). Due to the limited number of satellites, the Galileo system yielded fewer inversion results and relatively higher RMSEs. In contrast, during Hurricane Helene, the inversion accuracy at the FLCK station declined, with the GPS L2 band being particularly affected—its RMSE reached 51.59 cm with only 13 valid results, suggesting that the signal quality or reflectivity may have been severely disrupted. Under the same conditions, the GLONASS and Galileo systems still maintained a relatively better inversion performance, with RMSEs of 21.42 cm and 15.53 cm, respectively, and a reasonable number of results. This indicates that different GNSS systems exhibit varying levels of resilience under extreme environmental conditions.
After multi-system fusion, the number of valid GNSS-IR inversion results increased significantly. The fused RMSEs were 13.61 cm (205 points) at CALC and 28.59 cm (130 points) at FLCK. These results indicate that at CALC, fused multi-system GNSS-IR observations can achieve high-precision sea level monitoring. Although accuracy at FLCK was lower, given that water levels during Hurricane Helene exceeded 3 m, an RMSE of 28.59 cm remains within an acceptable range. The results in both accuracy and data volume after fusion demonstrate that multi-system GNSS-IR fusion contributes to more stable and continuous sea level monitoring during storm surge events, showing a strong adaptability and robustness. Overall, GNSS-IR exhibits a robust and transferable performance across different regions and storm surge events. Whether over extended calm periods or short-duration extreme events, it reliably tracks sea level fluctuations, underscoring its practical potential for storm surge monitoring.

3.2. Assessment of GNSS-IR Retrieval Accuracy During Storm Surges

Table 3 presents the root mean square errors (RMSE, cm) of GNSS-IR sea surface height retrievals for GPS, GLONASS, and Galileo across six storm surge events. This comparison highlights notable variations in retrieval accuracy among different GNSS constellations, frequency bands, and monitoring stations during storm surges. Considering differences among systems and frequency bands, the GPS constellation demonstrates a superior overall retrieval performance. Specifically, the L1 frequency band maintains an RMSE of about 10 cm across multiple events, indicating good stability. Although the L2 band achieves high accuracy at the CALC station, significant error increases occur at the FLCK station during the Debby and Milton events. Notably, the RMSE reached 95.26 cm during Hurricane Milton, suggesting that environmental factors may severely degrade L2 band accuracy in certain conditions. The L5 band shows excellent precision and stability in available events, with the lowest RMSE of 5.48 cm observed during the Delta event. Due to Hurricane Harvey occurring in 2017, when the CALC station did not yet support GPS L5 signal reception, L5 data for that period is unavailable. For the GLONASS system, the S1 and S2 bands exhibit a stable performance, with RMSE generally near 10 cm. The S2 band achieved the lowest RMSE in the table—6.06 cm—during the Laura event. In contrast, the Galileo system’s E1 and E6 bands have slightly higher errors, with the RMSE mostly between 11 and 14 cm.
From a site-specific perspective, the CALC station is located in an open area surrounded by water, providing favorable observation conditions (Figure 1b). As a result, its retrievals consistently show a lower RMSE. In contrast, the FLCK station is located near non-water reflective surfaces such as piers (Figure 1c), which contribute to a higher RMSE during certain storm surge events (e.g., Hurricane Milton). This suggests that the performance of the GNSS-IR at FLCK may be more susceptible to environmental interference. GNSS-IR retrieval accuracy is jointly influenced by the GNSS system, frequency band, station environment, and specific event characteristics. Future studies could explore weighted multi-constellation and multi-frequency fusion strategies that assign appropriate weights to frequency bands based on historical event data at each station, aiming to enhance the stability and reliability of GNSS-IR monitoring under complex storm surge conditions.

4. Discussion

4.1. The Impact of Hurricane Migration

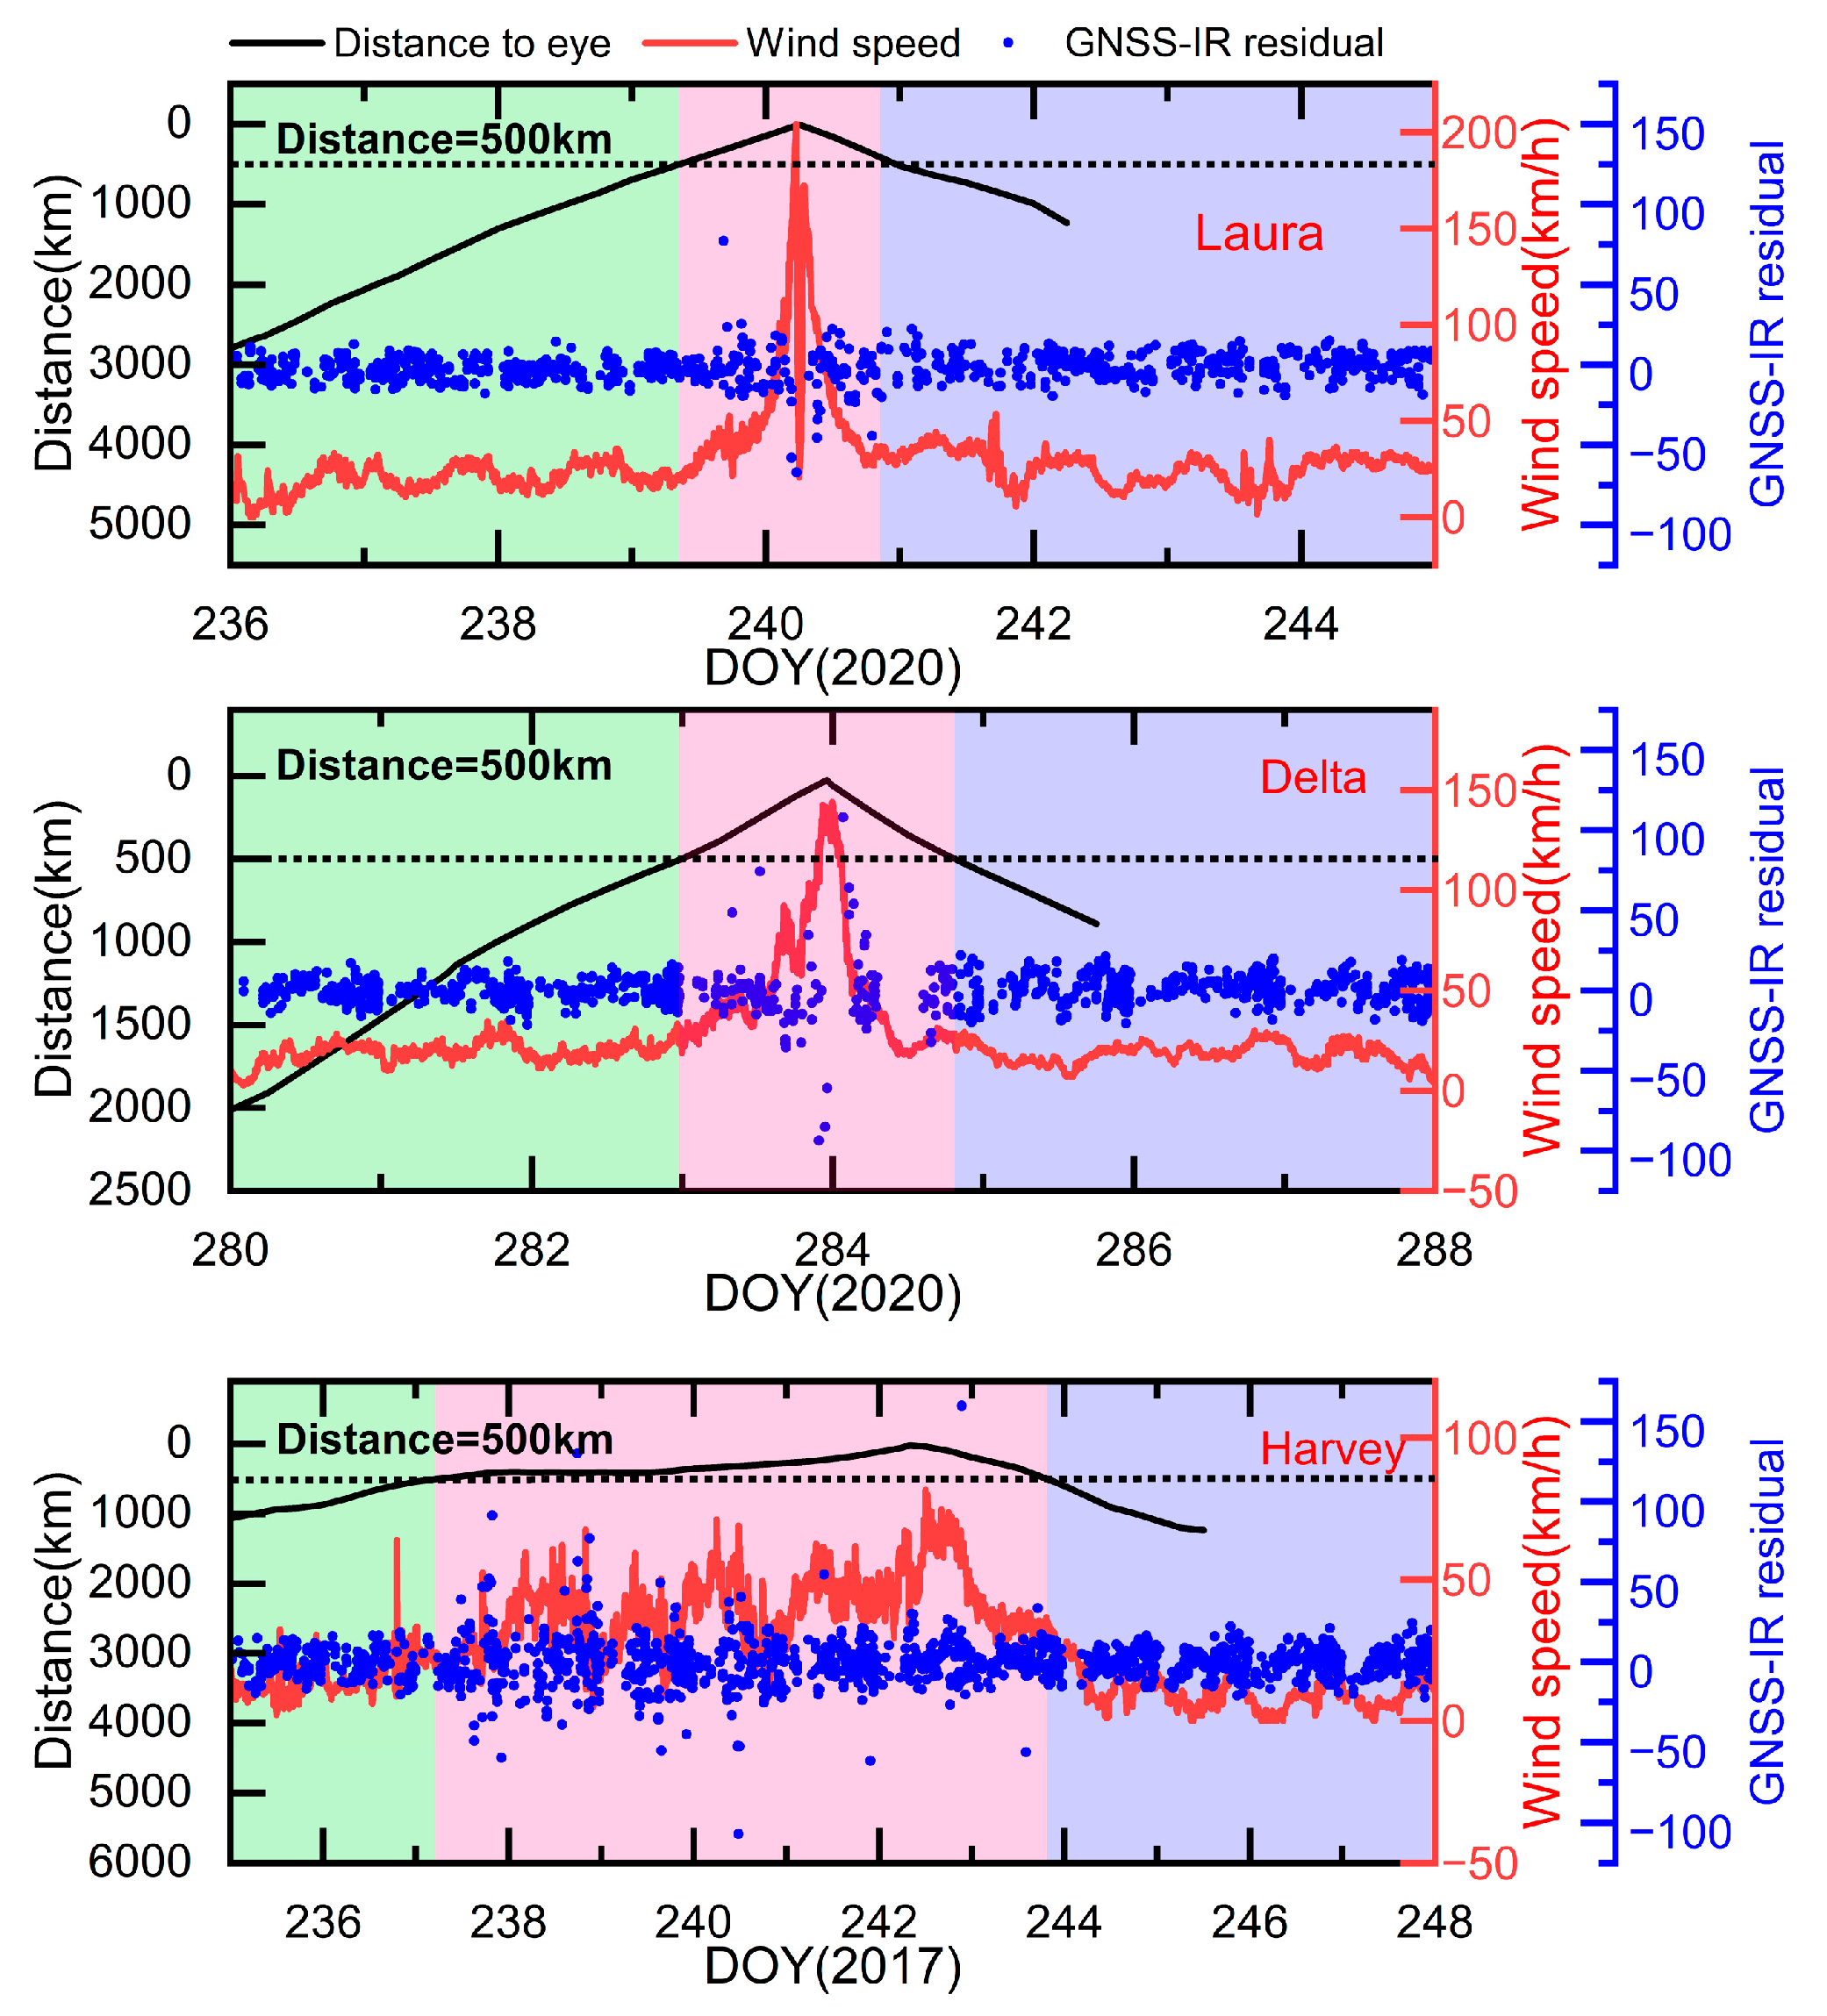
The six storm surge events were categorized into three stages—before, during, and after the storm surge—based on the distance between the hurricane eye and the GNSS station. These stages correspond to the light green, light red, and light blue shaded areas in Figure 7 and Figure 8, respectively. Using this classification, Figure 7 and Figure 8 present a statistical visualization showing how GNSS-IR retrieval deviations vary with sea surface wind speed and the distance from the hurricane eye. In the plots, the black solid line shows the distance between the hurricane eye and the GNSS station, the red curve represents sea surface wind speed, and the blue scatter points indicate the deviation of the GNSS-IR-retrieved sea surface height from tide gauge observations.
During the period before the storm surge, the hurricane remains far from the station, and local wind speeds are relatively low and stable. Under these conditions, GNSS-IR retrievals show limited deviation, with most values confined within ±25 cm, indicating a good overall accuracy. As the storm enters its main impact phase, with the hurricane approaching within 500 km, wind speeds rise sharply and become highly variable. At the same time, GNSS-IR retrieval errors increase significantly, often exceeding ±50 cm, and become more scattered. After the storm surge, as the hurricane moves away and the wind weakens, the sea surface reflection environment gradually stabilizes. As a result, GNSS-IR retrieval deviations become smaller again and begin to converge. We conducted a comprehensive assessment of hurricane impacts across 300, 500, and 700 km ranges (Figures S1 and S2). We found that a 500 km radius can encompass and represent the entire storm surge cycle. The 300 km radius captures only the most intense phase of the storm surge, while the 700 km radius includes periods partially unaffected by the storm surge.
By combining the distance from the eye of the storm and changes in GNSS-IR measurement accuracy, we can identify the specific impact of the spatial movement of such extreme events on local areas. This impact can represent the threat posed by hurricane events to coastal areas, particularly in terms of changes in the storm surge amplitude. We selected 500 km as the boundary for the assessment process, which clearly shows the different degrees of impact on water levels and indicates the deterioration of sea surface reflection/scattering conditions.
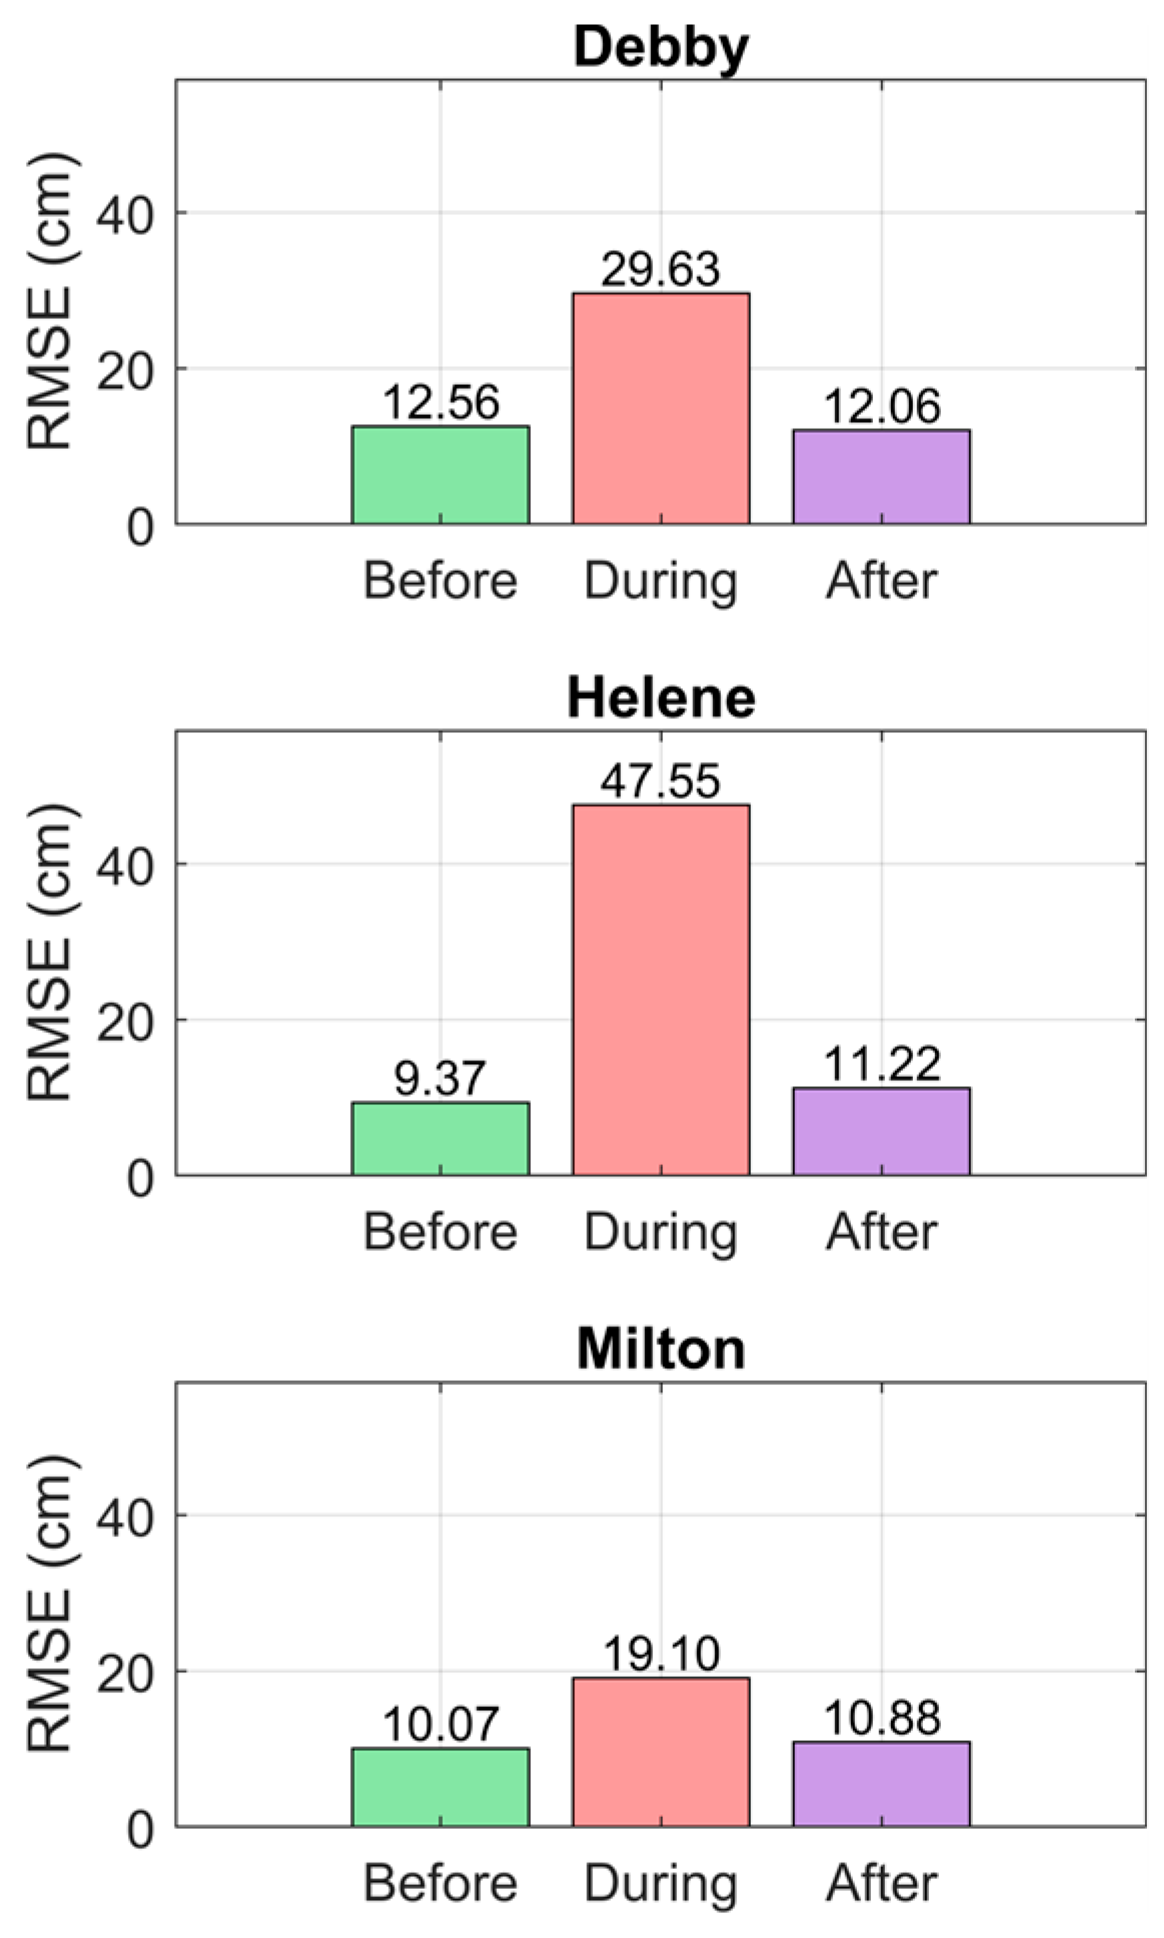
The multi-system GNSS retrieval accuracy during each phase of the six storm surge events is summarized in Figure 9 and Figure 10. Bar charts illustrate the RMSE of GNSS across different time periods. The error level during the storm surge phase stands out as substantially higher than in the periods before or after. At the CALC station, the RMSE stays below 9 cm before and after the surge but rises above 15 cm during the storm (Figure 9). At the FLCK station, retrieval errors in the pre- and post-surge periods are generally higher than those at CALC but remain within 13 cm (Figure 10). A particularly large error is observed during Hurricane Helene, where the RMSE reaches 47.55 cm, likely due to a combination of intense wind fluctuations, poor reflection conditions, and fewer visible satellites. We also compiled accuracy statistics for a single system (GPS, Galileo, and Glonass) during storm surge periods and non-storm surge periods (calm period) across six hurricane events (Tables S1–S6). These findings clearly indicate that the GNSS-IR performance is strongly affected by hurricane movement. As the hurricane eye moves closer to the station, increasing wind intensity disrupts the reflection environment, which leads to greater signal degradation and larger retrieval errors. When the hurricane passes and local conditions stabilize, retrieval accuracy improves accordingly. The observed variation highlights the close link between the GNSS-IR error, sea surface condition, and hurricane migration.

4.2. Evaluation of Temporal Coverage in GNSS-IR Retrievals

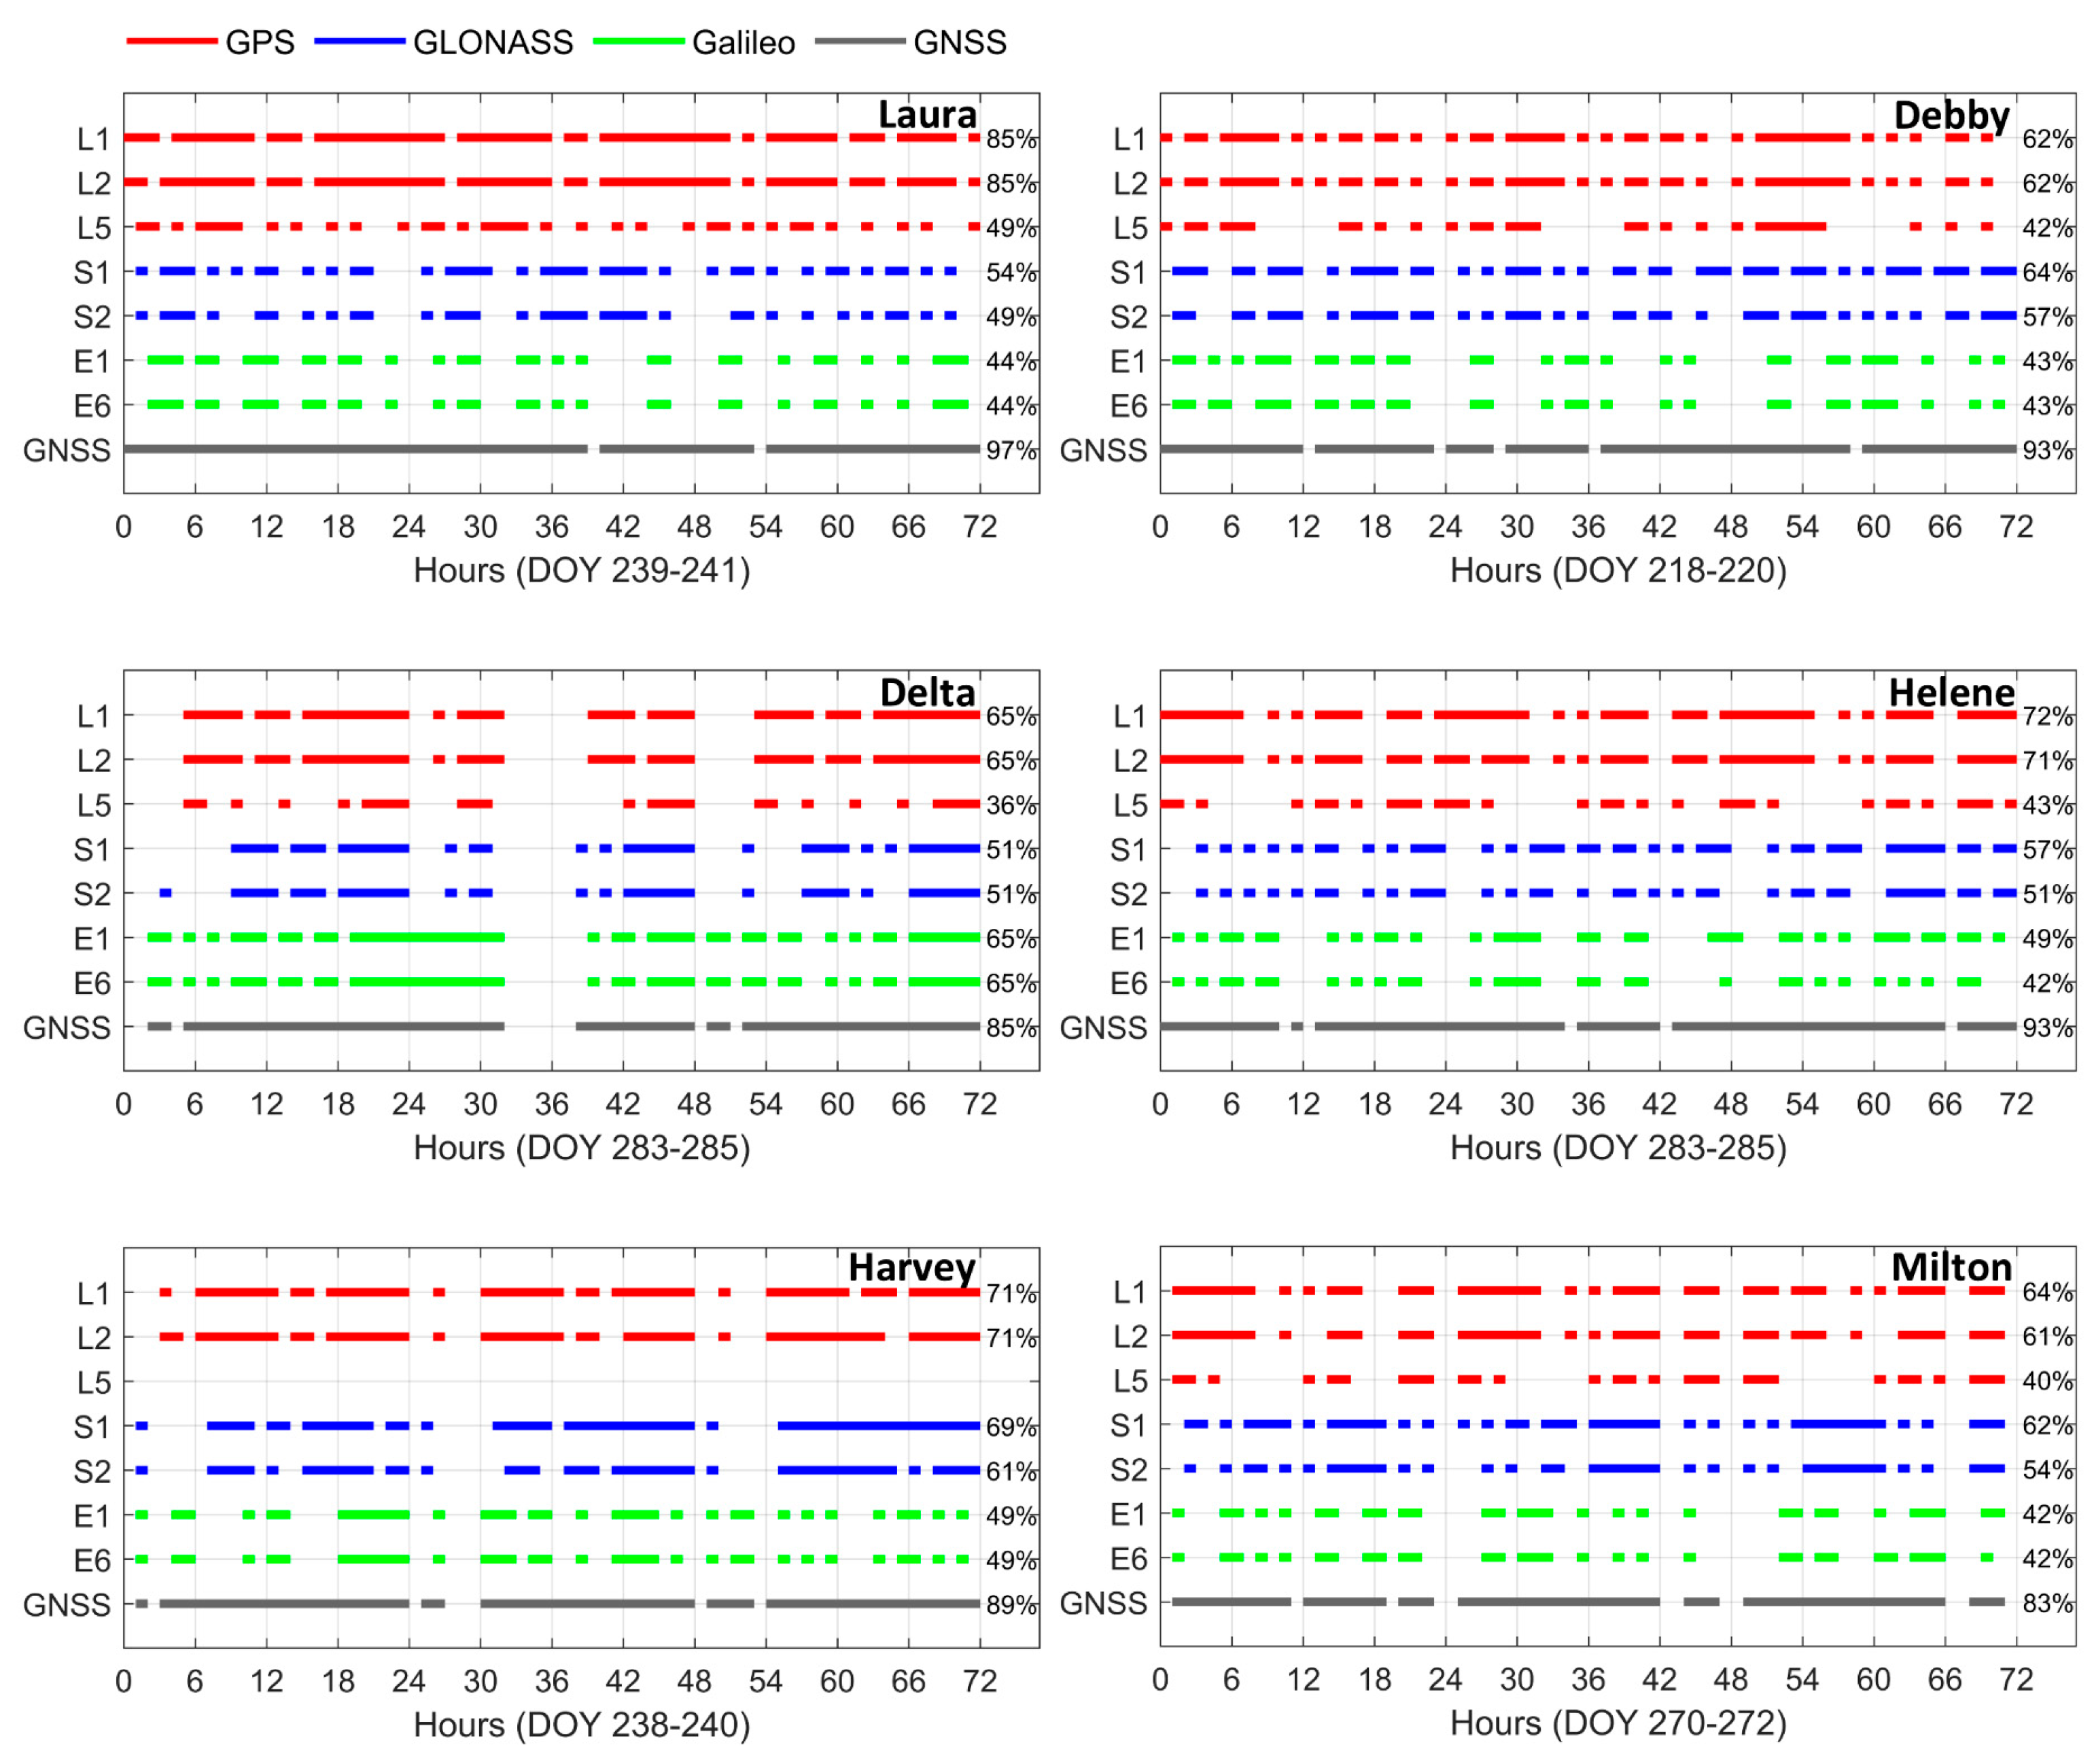
This section presents an analysis of the availability and continuity of GNSS-IR retrievals from multiple systems and frequency bands during the storm surge impact periods. To assess the temporal resolution of GNSS-IR observation sequences, we conducted a statistical analysis using one-hour intervals. For example, within the 0–1 h interval, we determined whether valid observations existed (i.e., the number of observations was greater than or equal to one). If valid observations were present, we concluded that observation coverage existed. For each of the six selected storm surge events, the effective retrieval durations were computed for all frequency bands of GPS, GLONASS, and Galileo over the primary 2-day impact period. Subsequently, time coverage rates were derived for each frequency band to evaluate their applicability and continuity in storm surge monitoring. Figure 11 illustrates the temporal distribution of retrieval results across different GNSS systems and frequency bands for each storm surge event. Overall, the GPS system exhibits higher time coverage than the other systems, benefiting from its larger number of satellites. In particular, the L1 and L2 bands achieve hourly coverage rates ranging between 60% and 80%. The GLONASS system generally attains coverage rates of 50% to 60% across its frequency bands, slightly lower than the GPS. Due to a more limited number of operational satellites, Galileo shows a relatively lower single-frequency coverage, typically between 40% and 50% in most events.
Combining multi-system and multi-frequency retrievals significantly improves temporal coverage. The aggregated data indicate that the overall time coverage during storm surge periods commonly exceeds 85%, with Hurricane Laura reaching as high as 97%. These results suggest that GNSS-IR technology, when integrating data from multiple GNSS systems and frequency bands, can provide near-continuous monitoring of storm surge processes on an hourly timescale. The integration of multiple GNSS systems not only significantly increases the spatial and temporal density of water level observations but also enhances the robustness and practicality of the GNSS-IR approach under extreme weather conditions.

4.3. Analysis of Factors Affecting GNSS-IR Monitoring Accuracy

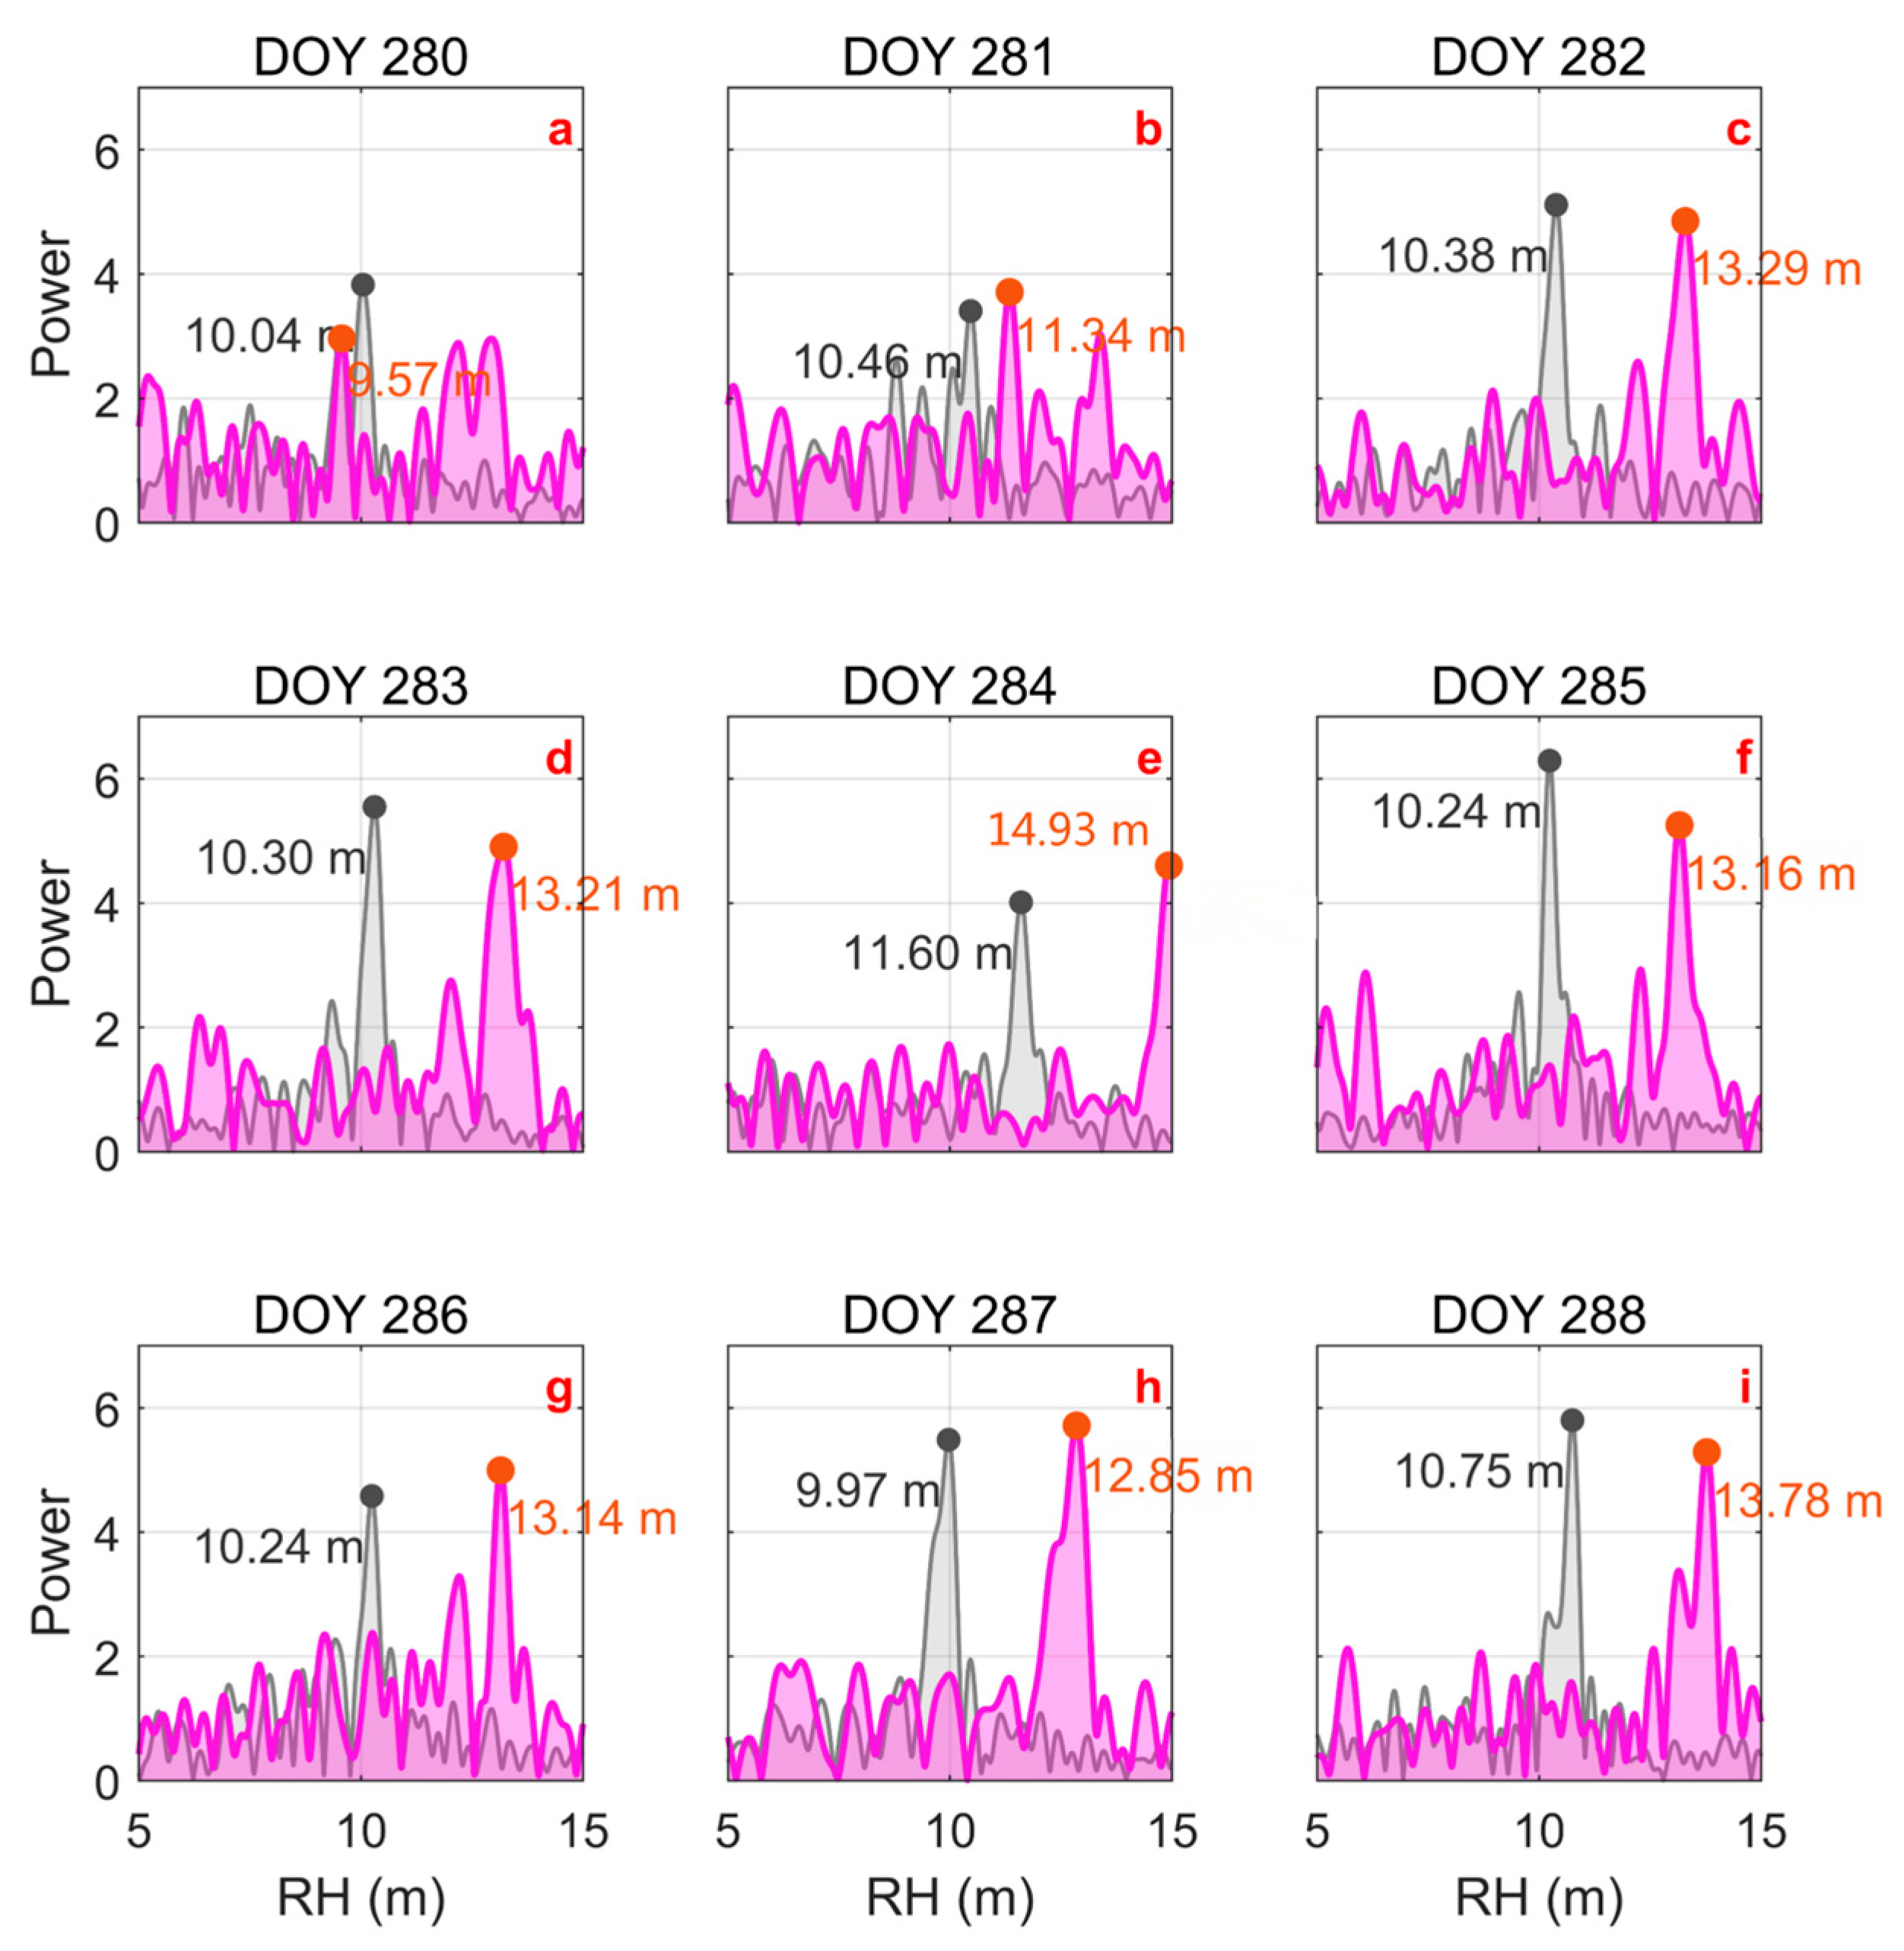
Table 3 reveals a significant anomaly in the retrieval accuracy of the GPS L2 frequency band at the FLCK station, particularly during Hurricane Milton, where the RMSE exceeds 90 cm—far above the typical error range. To investigate the source of this error, a detailed analysis of the Lomb–Scargle Periodogram (LSP) results for the L2 band was conducted. Taking Hurricane Helene as an example, Figure 12 presents the retrieved reflector heights (RH, in meters) and corresponding spectral analysis results for the G08 satellite during DOY 280–288, with the L1 band shown as a gray curve and the L2 band as a purple curve. The figure shows that the L2 band exhibits multiple peaks exceeding two in several time intervals, with incorrect peaks often dominating as the primary peak, leading to a pronounced overestimation. For a systematic investigation, the difference between the primary frequency retrieval heights of the L2 and L1 bands at FLCK was calculated. The results showed that the L2-derived heights were generally lower than those from L1, with most differences concentrated around −2.70 m, indicating the presence of a systematic bias in the L2-band retrievals. Considering the actual environment of the FLCK station, the surrounding area includes not only the sea surface but also hard structures such as piers, resulting in a complex reflecting surface. In this specific case, G08, which passes through a specific space quadrant every consecutive day, as a result, produces similar outstanding reflected signals during particular minute spans of the day (this is clearly shown by Figure 12). This setting may increase the likelihood and intensity of the “double peak phenomenon” in the L2 band [32]. Additionally, sea surface conditions become more complex and unstable during storm surges, leading to a significantly degraded reflection quality. These combined factors may contribute to the reduced accuracy of L2-band retrievals.

5. Conclusions

This study focused on two typical coastal GNSS stations, CALC and FLCK, and analyzed GNSS-IR sea surface height retrievals during six representative storm surge events in the Gulf of Mexico. The applicability of GNSS-IR technology under storm surge conditions was validated, with an in-depth discussion on retrieval accuracy, spatiotemporal coverage, and site environment adaptability. The main conclusions are as follows:
  • GNSS-IR technology enables the effective monitoring of sea surface height during storm surge events. By integrating data from multiple GNSS systems and frequency bands, the spatiotemporal resolution and overall accuracy of the retrievals can be significantly improved. Specifically, the time coverage rate exceeds 83% with multi-GNSS integration. In calm conditions, the root mean square error (RMSE) of sea level retrievals can reach ~7 cm. During storm surge periods, however, the accuracy degrades markedly to the decimeter level, and can exceed 30 cm under peak surge conditions, especially when the hurricane eye is close. In addition, the site environment (water-reflected condition) is a key factor, which dominates the worse precision of the FLCK site.
  • Storm surge processes have a pronounced impact on GNSS-IR retrieval accuracy, particularly when the hurricane eye approaches or passes near the station. The decrease in accuracy closely correlates with the hurricane’s migration path and sea surface reflection/scattering conditions.
  • GNSS-IR technology demonstrates high temporal coverage in tide level monitoring. The temporal coverage rate is defined as the percentage of 1 h intervals containing at least one valid sea level retrieval. For a single satellite navigation system, this coverage typically ranges from 40% to 60%. By integrating multiple systems, the overall coverage can be increased to over 85%, as shown in Figure 11, which demonstrates that GNSS-IR has the capability to conduct the continuous monitoring of daily tidal variations and observe extreme events such as storm surges.
  • At the FLCK station, the GPS L2 frequency band exhibits a generally poor retrieval accuracy with systematic bias, likely related to the complex non-water reflective environment around the site and the L2 signal’s susceptibility to interference.
The application of GNSS-IR technology is becoming increasingly widespread, covering multiple scenarios such as rivers, oceans, lakes, and reservoirs. Our research has demonstrated the feasibility and reliability of GNSS-IR technology under extreme weather conditions. In the future, GNSS can make more contributions to hydrological and ocean monitoring, providing data support and technical services for global climate change monitoring and research.

Supplementary Materials

The following supporting information can be downloaded at: https://www.mdpi.com/article/10.3390/rs17183132/s1. Figure S1: Relationship between GNSS-IR retrieval bias and the distance between the hurricane eye and the CALC station, evaluated within three distance thresholds: 300 km, 500 km, and 700 km. Dashed lines indicate ±10 cm, ±20 cm, and ±30 cm error margins. Figure S2: Relationship between GNSS-IR retrieval bias and the distance between the hurricane eye and the FLCK station, evaluated within three distance thresholds: 300 km, 500 km, and 700 km. Dashed lines indicate ±10 cm, ±20 cm, and ±30 cm error margins. Table S1: Performance Metrics of GNSS-IR for Hurricane Laura: Number of Observations (Num), Root Mean Square Error (RMSE, cm), Systematic Error (Bias, cm), Mean Absolute Error (MAE, cm), Pearson Correlation Coefficient (R), and Nash–Sutcliffe Efficiency (NSE). Table S2: Performance Metrics of GNSS-IR for Hurricane Delta: Num, RMSE (cm), Bias (cm), MAE (cm), R, and NSE under Calm and Storm Conditions (same metrics as Table S1). Table S3: Performance Metrics of GNSS-IR for Hurricane Harvey: Num, RMSE (cm), Bias (cm), MAE (cm), R, and NSE under Calm and Storm Conditions (same metrics as Table S1). Table S4: Performance Metrics of GNSS-IR for Hurricane Debby: Num, RMSE (cm), Bias (cm), MAE (cm), R, and NSE under Calm and Storm Conditions (same metrics as Table S1). Table S5: Performance Metrics of GNSS-IR for Hurricane Helene: Num, RMSE (cm), Bias (cm), MAE (cm), R, and NSE under Calm and Storm Conditions (same metrics as Table S1). Table S6: Performance Metrics of GNSS-IR for Hurricane Milton: Num, RMSE (cm), Bias (cm), MAE (cm), R, and NSE under Calm and Storm Conditions (same metrics as Table S1).

Author Contributions

Conceptualization and methodology, K.L.; software and validation, R.Z.; resources and data curation, X.W. and T.X.; writing—original draft preparation, R.Z. and K.L.; writing—review and editing, Q.C. and Z.L.; visualization, R.Z. and X.C. All authors have read and agreed to the published version of the manuscript.

Funding

This research is funded by the Natural Science Foundation of Wuhan [grant No. 2024040701010029], the Postdoctor Project of Hubei Province [grant No. 2024HBBHCXB060], the Open Fund of Technology Innovation Center for Geohazard Monitoring and Risk Early Warning, Ministry of Natural Resources [grant No. TICGM-2024-01], and the Basic Science Center Project of the National Natural Science Foundation of China [grant No. 42388102]. This research also is supported by National Key Research and Development Program of China [grant No. 2024YFC3810502] and State Key Laboratory of Geodesy and Earth’s Dynamics, Innovation Academy for Precision Measurement Science and Technology, Chinese Academy of Sciences [grant No. SKLPG2025-5-1].

Data Availability Statement

The GPS GLONASS and Galileo observations are available at ftp://igs.gnsswhu.cn/pub/gps/data/daily/ (accessed on 26 August 2025). The water level at CALC and FLCK are available at https://tidesandcurrents.noaa.gov/waterlevels.html (accessed on 26 August 2025). The wind data at CALC and FLCK are available at https://tidesandcurrents.noaa.gov/met.html (accessed on 26 August 2025). The locations of eyes of hurricanes are available at https://www.nhc.noaa.gov/data/hurdat/hurdat2-1851-2024-040225.txt (accessed on 26 August 2025).

Acknowledgments

We thank the NOAA for providing water level, wind speed, and locations of eyes of hurricanes that we used in this research.

Conflicts of Interest

Author Xue Wang was employed by the company Beijing FreeDo Technology Co., Ltd. The remaining authors declare that the research was conducted in the absence of any commercial or financial relationships that could be construed as a potential conflict of interest.

References

  1. Muis, S.; Verlaan, M.; Winsemius, H.; Aerts, J.C.J.H.; Ward, P.J. A global reanalysis of storm surges and extreme sea levels. Nat. Commun. 2016, 7, 11969. [Google Scholar] [CrossRef] [PubMed]
  2. Gabe, T.; Falk, G.; McCarty, M.; Mason, V.W. Hurricane katrina: Social-demographic characteristics of impacted areas. In CRS Report for Congress; CRS: Boca Raton, FL, USA, 2005; Available online: https://sgp.fas.org/crs/misc/RL33141.pdf (accessed on 4 September 2025).
  3. Eley, E.N.; Subrahmanyam, B.; Trott, C.B. Ocean–Atmosphere Interactions during Hurricanes Marco and Laura. Remote Sens. 2021, 13, 1932. [Google Scholar] [CrossRef]
  4. Nicholls, R.J.; Lincke, D.; Hinkel, J.; Brown, S.; Vafeidis, A.T.; Meyssignac, B.; Hanson, S.E.; Merkens, J.-L.; Fang, J. A global analysis of subsidence, relative sea-level change and coastal flood exposure. Nat. Clim. Change 2021, 11, 338–342. [Google Scholar] [CrossRef]
  5. Wang, J.; Gao, W.; Xu, S.; Yu, L. Evaluation of the combined risk of sea level rise, land subsidence, and storm surges on the coastal areas of Shanghai, China. Clim. Change 2012, 115, 537–558. [Google Scholar] [CrossRef]
  6. Ablain, M.; Cazenave, A.; Larnicol, G.; Balmaseda, M.; Cipollini, P.; Faugère, Y.; Fernandes, M.J.; Henry, O.; Johannessen, J.A.; Knudsen, P.; et al. Improved sea level record over the satellite altimetry era (1993–2010) from the climate change initiative project. Ocean. Sci. 2015, 11, 67–82. [Google Scholar] [CrossRef]
  7. Lagmay, A.M.F.; Agaton, R.P.; Bahala, M.A.C.; Briones, J.B.L.T.; Cabacaba, K.M.C.; Caro, C.V.C.; Dasallas, L.L.; Gonzalo, L.A.L.; Ladiero, C.N.; Lapidez, J.P.; et al. Devastating storm surges of typhoon haiyan. Int. J. Disaster Risk Reduct. 2015, 11, 1–12. [Google Scholar] [CrossRef]
  8. Zhang, G.; Kuang, C.; Chen, C. Research on GNSS-R Storm Surge Monitoring Based on Non-Linear Fitting Method. J. Geod. Geodyn. 2025, 45, 500–505, 531. [Google Scholar] [CrossRef]
  9. Vignudelli, S.; Birol, F.; Benveniste, J.; Fu, L.-L.; Picot, N.; Raynal, M.; Roinard, H. Satellite Altimetry Measurements of Sea Level in the Coastal Zone. Surv. Geophys. 2019, 40, 1319–1349. [Google Scholar] [CrossRef]
  10. Birol, F.; Fuller, N.; Lyard, F.; Cancet, M.; Niño, F.; Delebecque, C.; Fleury, S.; Toublanc, F.; Melet, A.; Saraceno, M.; et al. Coastal applications from nadir altimetry: Example of the X-TRACK regional products. Adv. Space Res. 2017, 59, 936–953. [Google Scholar] [CrossRef]
  11. Liu, K.; Wen, Y.; Zeng, J.; Li, Z.; Xu, C. Rapid early afterslip characteristics of the 2010 moment magnitude (Mw) 8.8 Maule earthquake determined with sub-daily GPS solutions. Satell. Navig. 2024, 5, 23. [Google Scholar] [CrossRef]
  12. Larson, K.M.; Small, E.E.; Gutmann, E.; Bilich, A.; Axelrad, P.; Braun, J. Using GPS multipath to measure soil moisture fluctuations: Initial results. GPS Solut. 2008, 12, 173–177. [Google Scholar] [CrossRef]
  13. Larson, K.M.; Löfgren, J.S.; Haas, R. Coastal Sea Level Measurements Using a Single Geodetic GPS Receiver. Adv. Space Res. 2013, 51, 1301–1310. [Google Scholar] [CrossRef]
  14. Löfgren, J.S.; Haas, R.; Scherneck, H.-G. Sea level time series and ocean tide analysis from multipath signals at five GPS sites in different parts of the world. J. Geodyn. 2014, 80, 66–80. [Google Scholar] [CrossRef]
  15. Chen, L.; Chai, H.; Zheng, N.; Wang, M.; Xiang, M. Feasibility and performance evaluation of low-cost GNSS devices for sea level measurement based on GNSS-IR. Adv. Space Res. 2023, 72, 4651–4662. [Google Scholar] [CrossRef]
  16. Cahyadi, M.; Bawasir, A.; Susilo; Arief, S. Analysis of Water Level Monitoring using GNSS Interferometric Reflectometry in River Waters. IOP Conf. Ser. Earth Environ. Sci. 2023, 1276, 012020. [Google Scholar] [CrossRef]
  17. Holden, L.D.; Larson, K.M. Ten years of Lake Taupō surface height estimates using the GNSS interferometric reflectometry. J. Geod. 2021, 95, 74. [Google Scholar] [CrossRef]
  18. Wang, P.; Tu, R.; Wang, X.; Han, J.; Zhang, J.; Cheng, F.; Lu, X. GNSS-IR water level monitoring for complex environments: Application to Kalabeily Reservoir in Xinjiang, China. Adv. Space Res. 2025, 75, 7035–7048. [Google Scholar] [CrossRef]
  19. Wang, X.; He, X.; Xiao, R.; Song, M.; Jia, D. Millimeter to centimeter scale precision water-level monitoring using GNSS reflectometry: Application to the south-to-north water diversion project, China. Remote Sens. Environ. 2021, 265, 112645. [Google Scholar] [CrossRef]
  20. Shan, Q.; Chen, Q.; Liu, Y.; Jiang, W.; Liu, K.; Zhou, X. The potential of GNSS-IR for monitoring daily water level fluctuations up to 15 m. Measurement 2025, 249, 117053. [Google Scholar] [CrossRef]
  21. Wang, X.; Zhang, Q.; Zhang, S. Sea level estimation from SNR data of geodetic receivers using wavelet analysis. GPS Solut. 2019, 23, 6. [Google Scholar] [CrossRef]
  22. Zhang, S.; Liu, K.; Liu, Q.; Zhang, C.; Zhang, Q.; Nan, Y. Tide variation monitoring based improved GNSS-MR by empirical mode decomposition. Adv. Space Res. 2019, 63, 3333–3345. [Google Scholar] [CrossRef]
  23. Peng, D.; Hill, E.M.; Li, L.; Switzer, A.D.; Larson, K.M. Application of GNSS interferometric reflectometry for detecting storm surges. GPS Solut. 2019, 23, 47. [Google Scholar] [CrossRef]
  24. Vu, P.L.; Ha, M.C.; Frappart, F.; Darrozes, J.; Ramillien, G.; Dufrechou, G.; Gegout, P.; Morichon, D.; Bonneton, P. Identifying 2010 xynthia storm signature in GNSS-R-based tide records. Remote Sens. 2019, 11, 782. [Google Scholar] [CrossRef]
  25. Wang, X.; He, X.; Shi, J.; Chen, S.; Niu, Z. Estimating sea level, wind direction, significant wave height, and wave peak period using a geodetic GNSS receiver. Remote Sens. Environ. 2022, 279, 113135. [Google Scholar] [CrossRef]
  26. Zhang, T.; Wang, X. Tide inversion based on GNSS-IR and analysis of barometric correlation under meteorological forcing. GNSS World China 2025, 50, 70–78. [Google Scholar] [CrossRef]
  27. Larson, K.M.; Lay, T.; Yamazaki, Y.; Cheung, K.F.; Ye, L.; Williams, S.D.P.; Davis, J.L. Dynamic sea level variation from GNSS: 2020 Shumagin earthquake tsunami resonance and Hurricane Laura. Geophys. Res. Lett. 2021, 48, e2020GL091378. [Google Scholar] [CrossRef]
  28. Chai, H.; Chen, K. Facilitated interferometric reflectometry evaluation and its application in monitoring three typhoon storm surges in hong kong with multi-GNSS constellation. GPS Solut. 2024, 28, 99. [Google Scholar] [CrossRef]
  29. Li, L.; Qiu, Q.; Ye, M.; Peng, D.; Hsu, Y.-J.; Wang, P.; Shi, H.; Larson, K.M.; Zhang, P. Island-based GNSS-IR network for tsunami detecting and warning. Coast. Eng. 2024, 190, 104501. [Google Scholar] [CrossRef]
  30. Bilich, A.; Larson, K.M. Mapping the GPS multipath environment using the signal-to-noise ratio (SNR). Radio Sci. 2007, 42, RS6003. [Google Scholar] [CrossRef]
  31. Feng, P.; Haas, R.; Elgered, G. A novel tropospheric error formula for ground-based GNSS interferometric reflectometry. IEEE Trans. Geosci. Remote Sens. 2023, 61, 5802918. [Google Scholar] [CrossRef]
  32. Wang, X.; Song, M.; He, X. Simulation and Correction of Double-Peak Errors in GPS L2P(Y) Signals for GNSS-IR Applications. IEEE Geosci. Remote Sens. Lett. 2025, 22, 3001205. [Google Scholar] [CrossRef]
Figure 1. Station distributions and hurricane tracks of the experiment in Figure (a) and photographs of CALC and FLCK in Figure (b,c).
Remotesensing 17 03132 g001
Figure 2. The GNSS direct and reflected signals are received by the antenna and undergo interference.
Remotesensing 17 03132 g002
Figure 3. Comparison between GNSS-IR-retrieved sea surface heights and tide gauge observations at the CALC station during hurricanes Laura, Delta, and Harvey. The black lines represent tide gauge measurements, while the colored dots denote GNSS-IR retrievals.
Remotesensing 17 03132 g003
Figure 4. Comparison between GNSS-IR-retrieved sea surface heights and tide gauge observations at the FLCK station during hurricanes Debby, Helene, and Milton. The black lines represent tide gauge measurements, while the colored dots denote GNSS-IR retrievals.
Remotesensing 17 03132 g004
Figure 5. Comparison between GNSS-IR-retrieved sea surface heights from GPS, GLONASS, Galileo, and GNSS and tide gauge measurements at the CALC station during the peak periods (DOY 239–241) of Hurricane Laura.
Remotesensing 17 03132 g005
Figure 6. Comparison between GNSS-IR-retrieved sea surface heights from GPS, GLONASS, Galileo, and GNSS and tide gauge measurements at the FLCK station during the peak periods (DOY 270–272) of Hurricane Helene.
Remotesensing 17 03132 g006
Figure 7. Variations in GNSS-IR retrieval deviations at the CALC station during three storm surge events in relation to wind speed and the distance between the hurricane eye and the station.
Remotesensing 17 03132 g007
Figure 8. Variations in GNSS-IR retrieval deviations at the FLCK station during three storm surge events in relation to wind speed and the distance between the hurricane eye and the station.
Remotesensing 17 03132 g008
Figure 9. Root mean square error (RMSE) of GNSS-IR-retrieved sea surface heights in three different periods across three storm surge events at the CALC station.
Remotesensing 17 03132 g009
Figure 10. Root mean square error (RMSE) of GNSS-IR-retrieved sea surface heights in three different periods across three storm surge events at the FLCK station.
Remotesensing 17 03132 g010
Figure 11. Temporal coverage of GNSS-IR retrievals during storm surge impact periods.
Remotesensing 17 03132 g011
Figure 12. Comparison of Lomb–Scargle Periodogram (LSP) results for GPS L2 and L1 bands at FLCK station during DOY 280–288 in 2024, using satellite G08 as an example, from Figure (ai) is the LSP result from DOY280 to DOY288. The dominant frequencies for each band are labeled to identify the corresponding reflection heights (RH) of the sea surface reflected signals.
Remotesensing 17 03132 g012
Table 1. General information on the six hurricanes provided by NOAA.
HurricaneTimeMaximum Wind SpeedThe Closest Distance to the Station
LauraAugust 2020240 km/h<10 km (CALC)
DeltaOctober 2020222 km/h≈30 km (CALC)
HarveyAugust 2017213 km/h<20 km (CALC)
DebbyAugust 2024130 km/h≈80 km (FLCK)
HeleneSeptember 2024222 km/h≈110 km (FLCK)
MiltonOctober 2024286 km/h≈200 km (FLCK)
Table 2. GNSS-IR sea level inversion accuracy and numbers of results for individual signals and multi-system fusion during the main impact periods of Hurricanes Laura and Helene.
SystemBandHurricane LauraHurricane Helene
RMSE (cm)NumRMSE (cm)Num
GPSL114.904039.5225
L210.394151.5913
L515.182227.2320
GLONASSS114.863121.4220
S28.24307.7016
GalileoE111.032015.5316
E619.832113.7720
GNSS---13.6120528.59130
Table 3. RMSE (cm) of GNSS-IR sea level retrievals relative to tide gauge observations across different frequency bands and storm surge events.
SystemBandLauraDeltaHarveyDebbyHeleneMilton
GPSL17.588.3513.4014.6517.9410.20
L27.207.4711.9840.6024.5595.26
L57.525.48---11.5615.7011.71
GLONASSS17.7411.1613.8312.3012.0210.98
S26.067.539.7113.599.7113.27
GalileoE19.4313.0712.1613.2113.0011.48
E69.6014.0111.6416.4313.0812.78
GNSS---7.9210.0512.2518.7115.6731.61
Disclaimer/Publisher’s Note: The statements, opinions and data contained in all publications are solely those of the individual author(s) and contributor(s) and not of MDPI and/or the editor(s). MDPI and/or the editor(s) disclaim responsibility for any injury to people or property resulting from any ideas, methods, instructions or products referred to in the content.