Article

Temporal Analysis of Reservoirs, Lakes, and Rivers in the Euphrates–Tigris Basin from Multi-Sensor Data Between 2018 and 2022

by
Omer Gokberk Narin
1,2,
Roderik Lindenbergh
2,* and
Saygin Abdikan
3
1
Department of Geomatics Engineering, Afyon Kocatepe University, Afyonkarahisar 03100, Türkiye
2
Department of Geoscience and Remote Sensing, Delft University of Technology, 2600GA Delft, The Netherlands
3
Department of Geomatics Engineering, Hacettepe University, Ankara 06800, Türkiye
*
Author to whom correspondence should be addressed.
Remote Sens. 2025, 17(16), 2913; https://doi.org/10.3390/rs17162913
Submission received: 9 July 2025 / Revised: 12 August 2025 / Accepted: 18 August 2025 / Published: 21 August 2025
(This article belongs to the Special Issue Multi-Source Remote Sensing Data in Hydrology and Water Management)

Abstract

Monitoring freshwater resources is essential for assessing the impacts of drought, water management and global warming. Spaceborne LiDAR altimeters allow researchers to obtain water height information, while water area and precipitation data can be obtained using different satellite systems. In our study, we examined 5 years (2018–2022) of data concerning the Euphrates–Tigris Basin (ETB), one of the most important freshwater resources of the Middle East, and the water bodies of both the ETB and the largest lake of Türkiye, Lake Van. A multi-sensor study aimed to detect and monitor water levels and water areas in the water scarcity basin. The ATL13 product of the Ice, Cloud, and Land Elevation Satellite-2 (ICESat-2) was used to determine water levels, while the normalized difference water index was applied to the Sentinel-2 optical imaging satellite to monitor the water area. Variations in both water level and area may be related to the time series of precipitation data from the ECMWF Reanalysis v5 (ERA5) product. In addition, our results were compared with global HydroWeb water level data. Consequently, it was observed that the water levels in the region decreased by 5–6 m in many reservoirs after 2019. It is noteworthy that there was a decrease of approximately 14 m in the water level and 684 km2 in the water area between July 2019 and July 2022 in Lake Therthar.

1. Introduction

The state of water resources in a basin is an important indicator of environmental change and the impact of climate change in a region. Urbanization and industrialization will cause more intense water crises with an increase in climate change. Therefore, countries that share rivers and suffer from drought are expected to be more likely to experience these conflicts [1]. As declared by the United Nations, Sustainable Development Goal (SDG) 6 focuses on the management of water and sanitation, and the SDG needs to be considered when assessing global challenges in Agenda 2030. Specifically, three indicators related to water source management are water stress level (SDG 6.4.2), transboundary cooperation (SDG 6.5.2), and changes in ecosystems connected to water over time (SDG 6.6.1).
The Euphrates–Tigris Basin (ETB) is one of the most important transboundary basins that provides freshwater resources in the Middle East. The ETB, which is exposed to water scarcity, is formed by two transboundary river systems [2,3,4]. The region is historically called Mesopotamia, and the earliest civilizational developments have been identified here. Disputes in the basin have continued ever since among riparian countries owing to hydropolitics [2,5]. Both the Tigris and Euphrates originate in eastern Türkiye and are discharged into the Persian Gulf. The transboundary basin is distributed across six countries (Iraq, Türkiye, Iran, Syria, Saudi Arabia, and Jordan) and has experienced a decrease in precipitation and droughts [6,7,8]. Millions of people living in Türkiye, Iraq, Syria, and Iran rely on the ETB for their agricultural water needs. Furthermore, electricity is produced by numerous hydroelectric power plants that use rivers [9]. Water resources in the ETB provide important biodiversity [10]. Thus, the ETB has an impact on a regional scale, both economically and environmentally. However, due to political conflicts in the region, it can be very difficult to collect local data in the region [9] which, therefore, makes it challenging to assess the state of water resources in the ETB.
Therefore, it is important to monitor rivers, reservoirs, and lakes in the ETB using satellite technology. It is a proven technique for monitoring and determining the water heights of rivers, lakes, and reservoirs with high accuracy using satellite altimeter systems [11]. GEOSAT (1986–1988), ERS-1 (1991–1996), and Topex/Poseidon (1992–2005) radar altimetry satellites, whose missions began in the late 1980s and the early 1990s, were the first examples of altimeter missions. With the development of technology and an increase in the number of satellites, more data are being collected worldwide. In addition, the collected data have started to be made available free of charge via web services by institutions and organizations. Examples of these services include HydroWeb [11] and the Database for Hydrological Time Series of Inland Waters (DAHITI) [12]. In addition to these web services, the performance of satellite altimeter data has also been investigated in previous studies. Phan, et al. [13] examined the change in 154 Tibetan lakes between 2003 and 2009 using Ice, Cloud, and Land Elevation Satellite-1 (ICESat-1) data. They stated that there was an average annual increase of 0.20 m in the lake levels of the Tibet region. Lao, et al. [14] used Ice, Cloud, and Land Elevation Satellite-2 (ICESat-2) (ATL13) data from the Mekong River to investigate how natural and anthropogenic factors affect the water level. Hydrological station data and ICESat-2 data were compared, and the water height was determined with a high precision of 0.24 m root mean square error (RMSE). They stated that ICESat-2 (ATL13) products could be used to determine river water levels. Narin and Abdikan [15] conducted a multi-temporal analysis of the water levels of nine lakes and dams in Türkiye using ICESat-2 (ATL13) data. They compared ICESat-2 data and ground station data and concluded that the RMSE value varied below 1 m and the coefficient of determination (R2) value varied between 0.28 and 0.99. They stated that it is possible to examine the long-term behavior of lakes and dams using ICESat-2 (ATL13) data. Although ground truth data were largely lacking for the area in this study, many studies using ICESat-2 ATL13 data reported accuracies at the decimeter level [14,15,16,17].
Satellite altimetry may not always provide the spatial and temporal coverage required to monitor the state of the water in a basin. In addition to the water level, changes in the water area can also be monitored. Spectral satellite systems have been used to monitor the areas of lakes and reservoirs [18,19,20]. Sekertekin, et al. [21] compared two water indices, namely the normalized difference water index (NDWI) and the modified normalized difference water index (MNDWI) derived from Sentinel-2 bands. They concluded that the NDWI yielded better results than the MNDWI. Karaman [22] compared Sentinel-2 and Landsat-8 images for studying Salda Lake in Türkiye. The shoreline of the lake was measured using GPS as reference data and satellite image acquisition. As a result, it was stated that the NDWI provided better results for water area extraction using a threshold method. Khalaf [23] estimated the surface area of the Hamrin Reservoir in the ETB using monthly Landsat 8 OLI/TIRS satellite images and generated NDWI-based maps between October 2019 and September 2020. Additionally, the water level corresponding to the water area was examined. As a result, the water area decreased by approximately 124 km2, whereas the water level decreased by approximately 5 m. Cloud platforms, such as Google Earth Engine (GEE), are popular for the efficient long-term analysis of water bodies. Through the GEE platform, various cataloged data, including optical, SAR, topography, and land cover, can be processed on the cloud without the need to download them, and the results can be obtained in a free manner [24]. Several studies have been conducted using this platform [25,26,27]. Remote sensing data from the ETB were analyzed. Al-Taei, Alesheikh and Darvishi Boloorani [4] studied spatiotemporal land use land cover (LULC) change mapping over the ETB using Landsat data for two decades. Jumaah, et al. [28] and Khalaf [23] analyzed the changes in Hamrin Lake in Iraq using Sentinel-2 and Landsat data, respectively. The results indicate a decrease in the water surface level over time, and Jumaah, Ameen and Kalantar [28] analyzed the relationship between annual low precipitation and a decrease in lake surface area. Torun and Gündüz [29] extracted the spatial changes during the three decades of the Karakaya Reservoir on the Euphrates using Landsat. Erdem, et al. [30] studied the largest lake, Lake Van, in eastern Türkiye. They used land surface temperature and LULC maps derived from Landsat data. They also concluded that the drought levels increased. Albarakat, et al. [31] used low-resolution remote sensing and field data to determine spatial changes in marshlands in Iraq. Ozkaya and Zerberg [7] analyzed 40 years of drought over the Northern Tigris Basin, Türkiye, using ground station data. They noticed the importance of long-period station data for water management.
This study aims to monitor water bodies in the entire ETB using multi-source remote sensing data for long-term integrated analysis. Although some lakes and reservoirs in the ETB have been examined individually, our study is the first to simultaneously analyze both the water levels and lake areas of reservoirs and natural lakes for the entire basin. Türkiye’s largest lake, Lake Van, which is in the direct vicinity of the ETB, was also included in our study. In addition, the effects of precipitation on the water level and area changes were examined. The results of our study were compared with the HydroWeb global data. The main objectives of this study were (1) to assess the performance of ICESat-2 in water level analysis of transboundary rivers in the ETB, (2) to monitor the ETB by combining multi-temporal ICESat-2 data for water levels and Sentinel-2 data for water surface area, and (3) to examine the dynamics and current situation of the ETB.

2. Materials and Methods

2.1. Study Area

Our study area consists of the Euphrates–Tigris Basin (ETB), which includes the Van and Erçek lakes (Figure 1). The ETB has a sub-tropical Mediterranean climate with dry summers and wet winters [6]. The Euphrates and Tigris Rivers, which originate in Türkiye, pass through Syria, Iran, and Iraq. They join and form the Shatt al-Arab River in Iraq, which discharges into the Persian Gulf. Their basins are characterized by high relief in the northern and eastern regions and lowland deltas in the South and West (Figure 1). The Euphrates and Tigris Rivers are approximately 3000 km and 1900 km long, respectively [6]. The basin includes several natural bodies of water and reservoirs. In the part of ETB located within Türkiye, the Southeastern Anatolia Project (GAP) (northern part of the study area) is stimulating rural development by irrigating agricultural lands and the Turkish economy with river driven hydroelectric power plants [32]. Atatürk Dam, the largest reservoir in Türkiye, is located on the Euphrates River and ranks 11th in the world in terms of capacity [33]. It has been active since 1992 and provides drinking water to Şanlıurfa Province and irrigation for agricultural areas. Keban Dam, the second largest dam in Türkiye, and Karakaya Dam are located on the Euphrates River. Keban was the first dam constructed on the river and has been operational since the mid-70s. Ilisu Dam has been relatively new and operational since 2020 in the Turkish part of the Tigris. The Tabqa Dam on the Euphrates River is the largest dam in Syria and forms Lake Assad. Mosul Dam on the Euphrates is the largest dam structure in Iraq, and together with the Haditha Dam on the Tigris River, it provides approximately 75% of the energy supply of Iraq [34].

2.2. Datasets

2.2.1. ICESat-2

In our study, ICESat-2 was used to determine the water heights. ICESat-2 is a LiDAR satellite system developed by the National Aeronautics and Space Administration (NASA) to study Earth’s cryosphere, clouds, land surface, and water levels. ICESat-2 was launched in 2018 and uses a photon LiDAR system to measure the Earth’s surface elevation along profiles, divided into so-called strong and weak beams, consisting of more and less signal strength, respectively. The Advanced Topographic Laser Altimeter System (ATLAS), the main instrument in ICESat-2, is a highly accurate laser system. The ATLAS detects the height of the surface, the height of water bodies, and the elevation of ice by detecting individual photons and distinguishing reflected signal photons from background photons from the Earth [35]. The ICESat-2 satellite has a temporal resolution of 91 days [36]. For this study, we used the ATL-013 product from the ICESat-2 mission. ATL-013 is a Level 3A product that provides inland water surface heights (EGM-96), including notable heights of rivers, lakes, and reservoirs [37].

2.2.2. Sentinel-2

Sentinel-2 images were used to detect the surface areas of the water bodies. Sentinel-2 twin satellites were developed under the Copernicus Program operated by the European Space Agency (ESA) [38]. Sentinel-2 satellites observe the Earth’s surface at 10 m, 20 m, and 60 m resolutions with 13 different spectral bands, providing valuable data for many applications [39]. With Sentinel-2 data available free of charge and with a 5-day revisit time, continuous data are available for monitoring dynamic processes [40]. The download and processing of Sentinel-2 data were performed at GEE.
The cloud-based GEE platform (https://developers.google.com/earth-engine/, accessed on 12 February 2023) was used for the processing. GEE provides access to a large database of geographic datasets, such as satellite images, climate data, elevation data, and land cover data. These platform are used to enable users’ analysis of topics, such as land use/land cover change [41] and surface water extraction [42].

2.2.3. Meteorological Data

In our study, the “https://app.climateengine.org/climateEngine” (accessed on 4 April 2023) platform, which links to the GEE platform and provides various climate data, was used for the meteorological analysis. This platform is a web-based tool for freely processing, analyzing, and visualizing climate data [43]. We used daily ECMWF Reanalysis v5 (ERA5) Land data for the long-term precipitation analysis. ERA5 is a Reanalysis combined model developed by ECMWF that provides global meteorological data, such as precipitation, temperature, evaporation and wind [44,45].

2.2.4. HydroWeb Data

We compared our obtained water heights and surface areas with global HydroWeb data. The HydroWeb service has been integrating radar altimeter data since 1992. It provides free access to the heights of major lakes, reservoirs, and rivers worldwide. In addition, it presents the surface areas and volumes of many lakes and reservoirs as obtained from MODIS, ASAR, Landsat, Cbers, and radar altimeter data [11]. The water levels provided by HydroWeb have been compared with in situ data in numerous articles in the literature. These comparisons have found accuracy between 3 cm and 80 cm based on RMSE [11,46,47]. In our study, data on common areas were downloaded using HydroWeb (https://hydroWeb.theia-land.fr/?lang=en&, accessed on 1 May 2023). The HydroWeb service was chosen for comparison purposes because it uses alternative satellite data rather than ICESat-2 satellite altimeter data.

2.3. Methodology

2.3.1. Obtaining Lake, Reservoir, and River Levels

After determining the boundaries of the study area, the study focused on lakes and reservoirs larger than 75 km2, because ICESat-2 data can make approximately 2 observations per year between 1 and 10 km2, approximately 4.2 observations per year between 10 and 100 km2, and approximately 12.3 observations per year between 100 and 1000 km2 [16]. (Figure 1). In addition, locations were chosen to determine the river water level over the Euphrates and Tigris Rivers (Figure 1). A total of thirteen locations were selected; seven over the Euphrates River (clusters 1–7), five over the Tigris River (clusters 9–13), and one after the two rivers converged (cluster 8). Each location consists of a flat stretch of river (approximately 1 km long on the river). While selecting these river locations, attention was paid to ensuring that the riverbed was flat and overlapped with the ICESat-2 orbit. In this study, all available ICESat-2 ATL-013 data from September 2018 to the end of 2022 were examined. The web service “https://openaltimetry.org/” (accessed on 8 December 2022) was used while downloading the ATL-013 data [48]. After the ICESat-2 data were downloaded, strong beams were selected, and the median height was determined for the ATL-013 beam profile heights intersecting the river area. The distribution of ICESat-2 points used in the study is given in Appendix A Figure A1.
The study used the trend obtained from daily values for the relationship between precipitation with water area. If more than one pixel was within the boundaries of the water body, the values were averaged; otherwise, the pixel closest to the water body was selected.
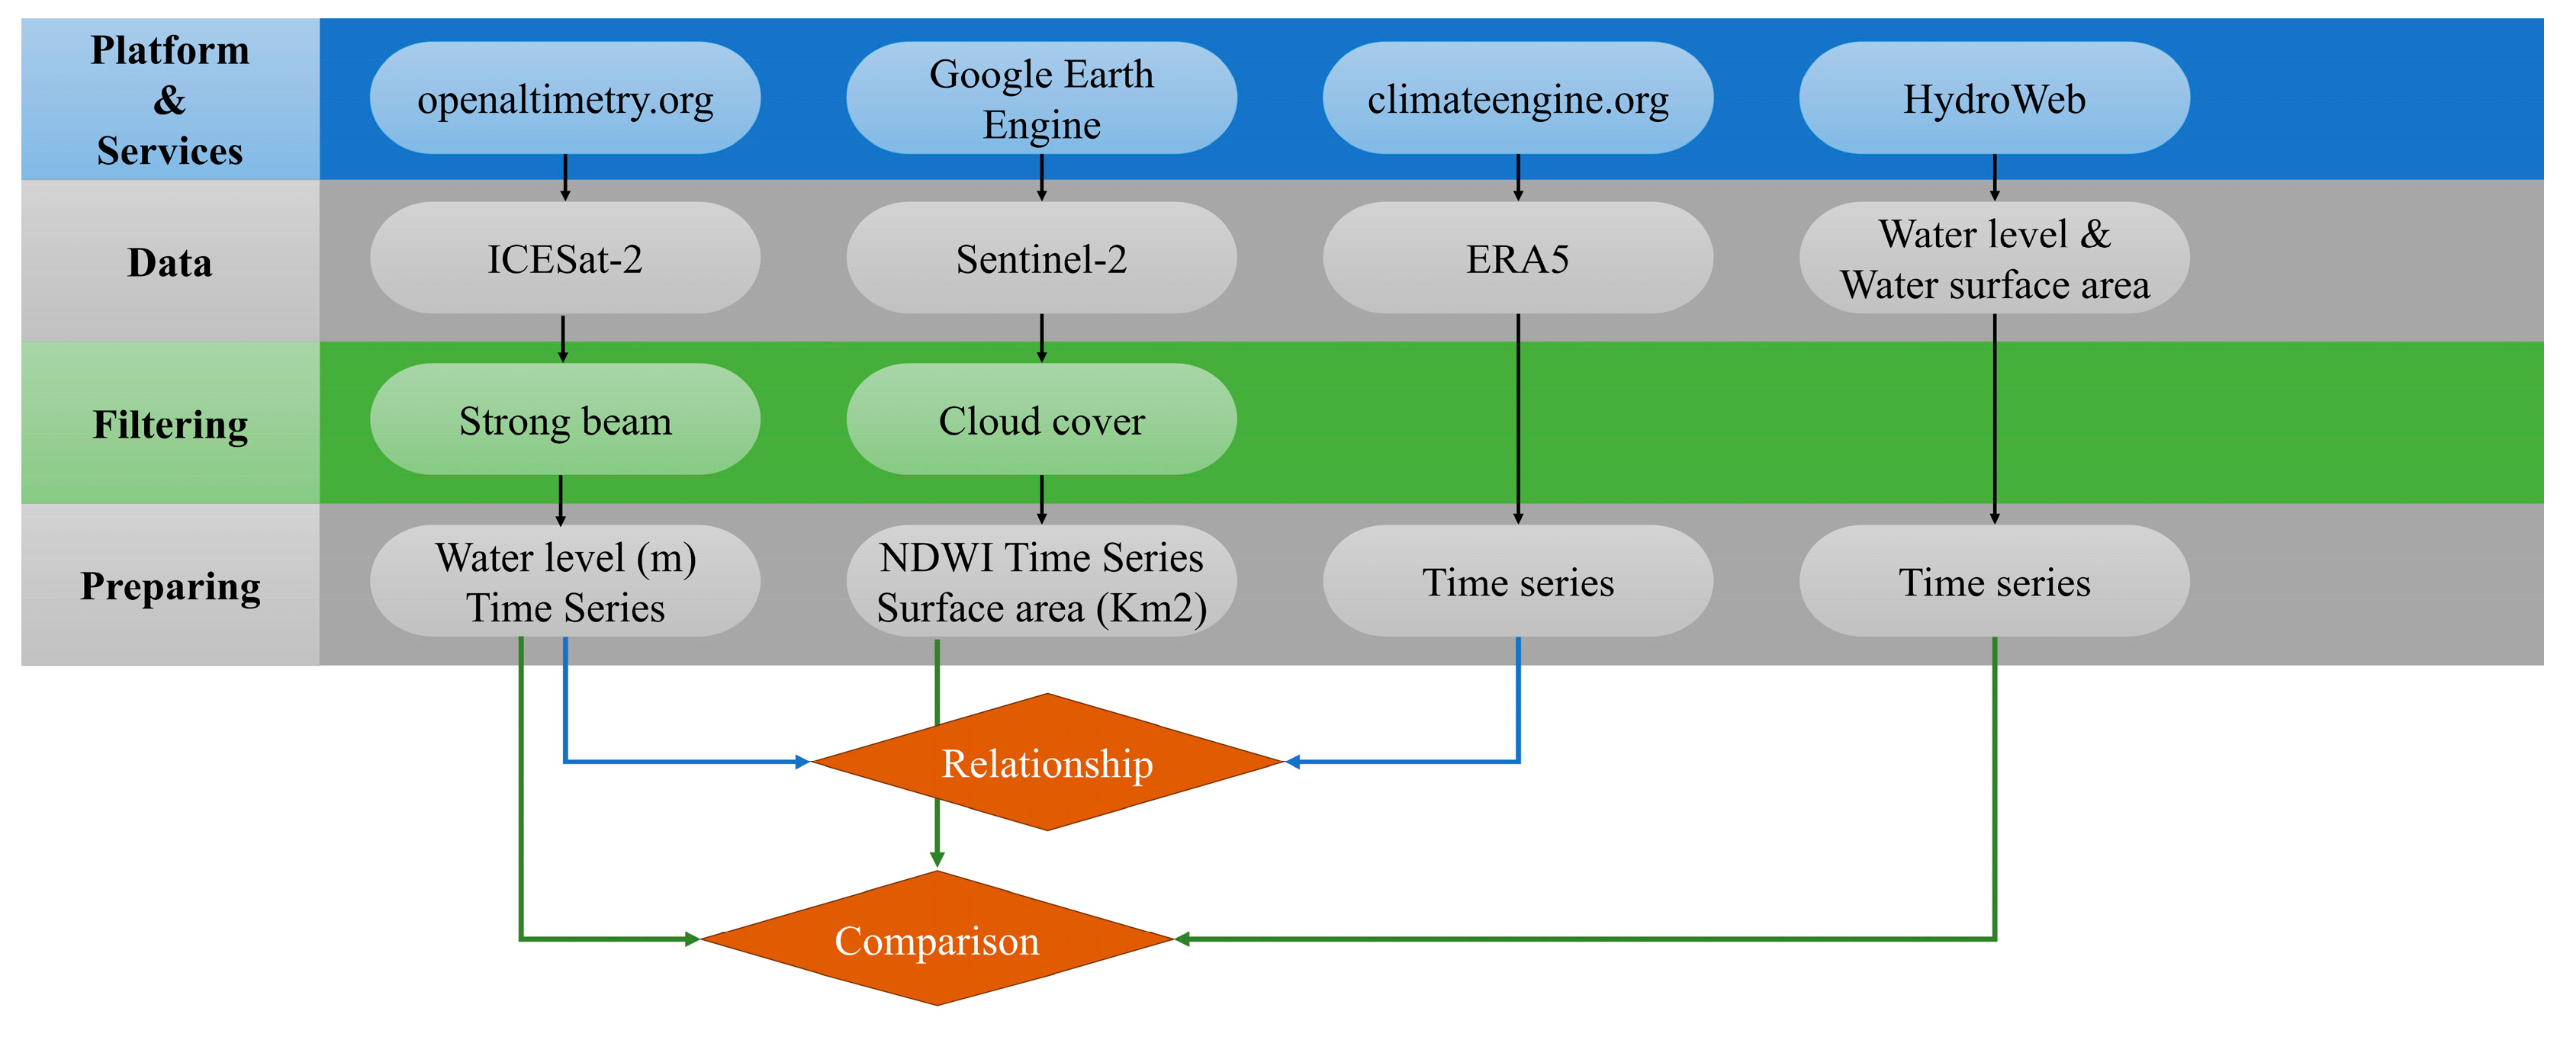
The resulting value was reported as the water height at the time of the ICESat-2 overpass. The flowchart is shown in Figure 2.
The following water heights and corresponding measurement times were determined as follows:
  • Water levels of lakes, reservoirs, and rivers were monitored (Section 3.1).
  • We investigated whether the water levels changed naturally or anthropogenically (Section 3.1).
  • Meteorological data and their relationship with the water area were examined (Section 3.3).
  • The monitoring performance of lakes, reservoirs, and rivers using ICESat-2 was investigated (Section 4.1).

2.3.2. Obtaining Lake and Reservoir Areas

In our study, Sentinel-2 data were used to determine lake and reservoir areas. The “COPERNICUS/S2_SR_HARMONIZED” data from the GEE catalog are used as a source for Sentinel-2 data. All cloudless images between 1 January 2018 and 31 December 2022 were used within the scope of this study. The normalized difference water index (NDWI), which is widely used in the literature, was used to calculate the lake and reservoir areas [21,27,49,50]. The NDWI equation is given by McFeeters [51] as follows:
N D W I = G r e e n N I R G r e e n + N I R
Sentinel-2 band 3 corresponds to the green wavelength and band 8 corresponds to the NIR wavelength. After the index images were obtained, pixels with values greater than 0 were classified as water areas, whereas pixels with values below 0 were classified as non-water areas [47,51,52,53].

3. Results

3.1. Water Level Changes in Lakes, Reservoirs, and Rivers

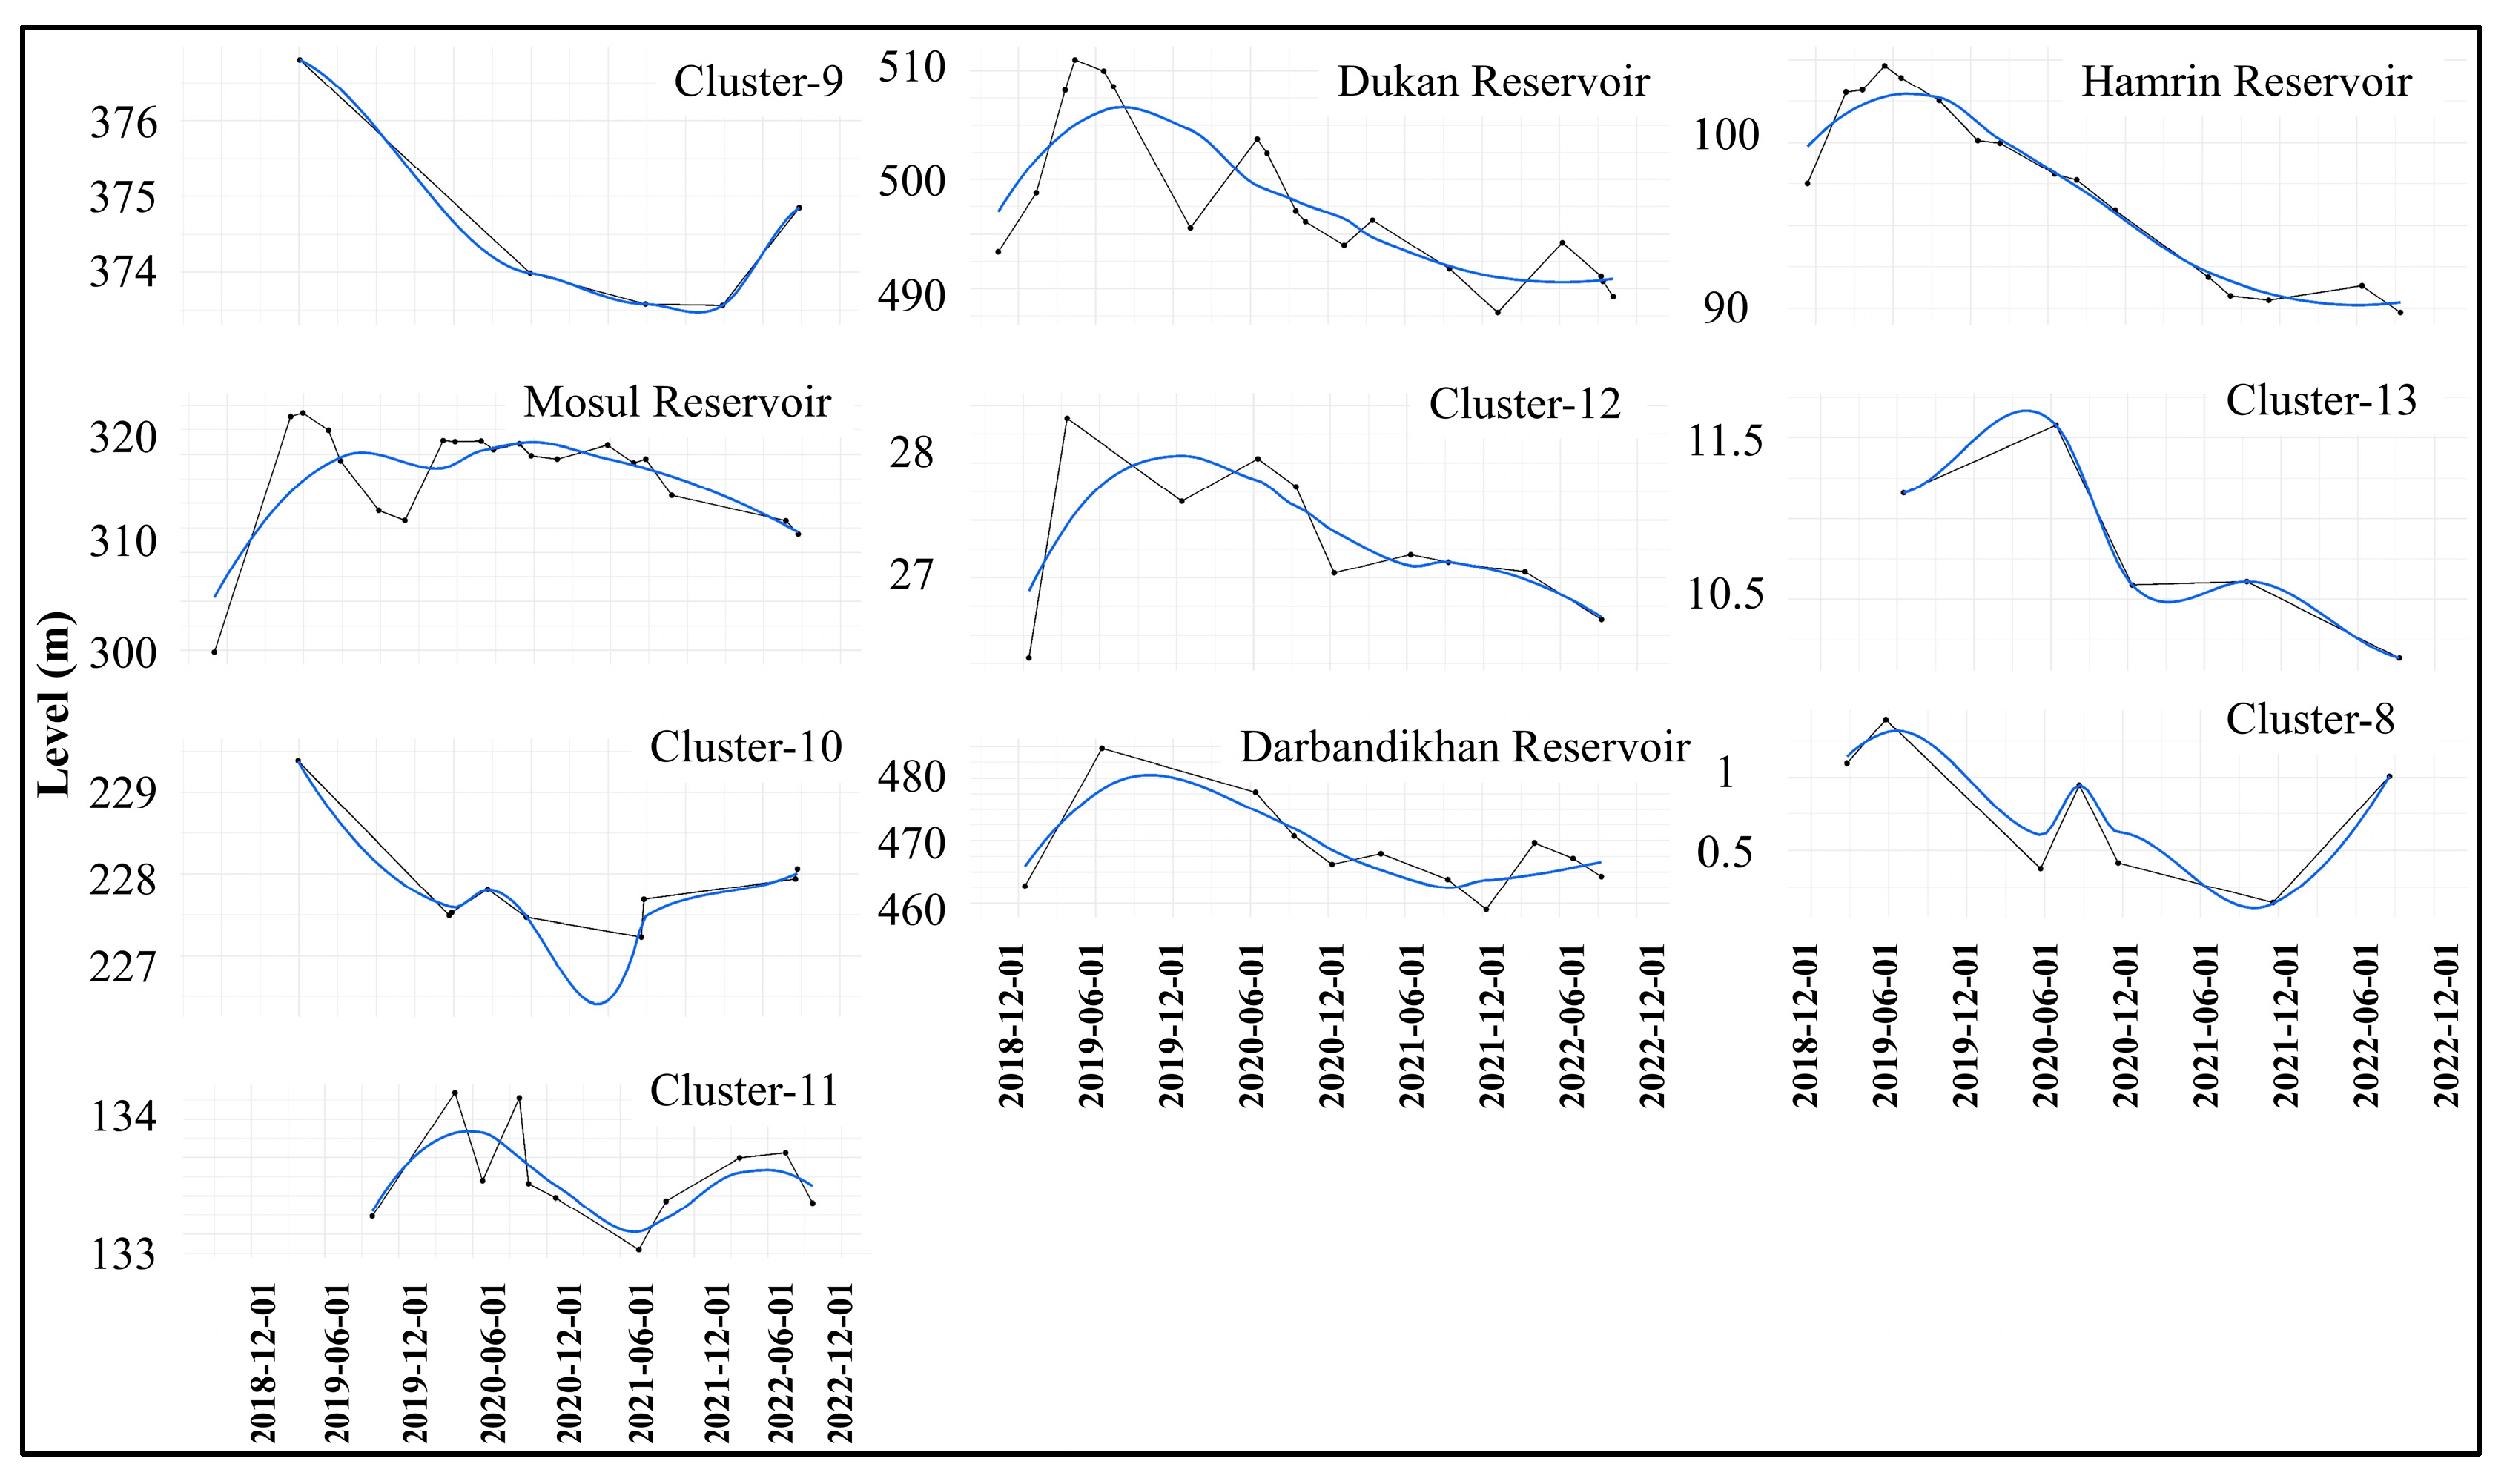
In our study, time series of water levels of six lakes, nine reservoirs, and thirteen river locations were created from September 2018 to the end of 2022. River locations and reservoirs along the Euphrates (Figure 3), Tigris (Figure 4), and lakes (Figure 5) were analyzed independently to investigate the effect of the dams built on the river on the water level along the two rivers in the created time series. Five reservoirs of the Euphrates were considered in this study (Figure 1). While the water levels of the Keban and Atatürk Reservoirs reached their lowest levels in December and January, they reached their highest levels in May and June, respectively (Figure 3). Melting snow and rain in spring increase the water level in May and June, while water is collected from dams for irrigation of agriculture in summer. Water levels at the reservoirs and clusters on the Euphrates River, namely Keban, Karaağaç, Atatürk, and Cluster-1, have been observed to have fallen by between 4 m and 6 m (Figure 3 and Table S1 in Supplementary Material). Although the trend of the water level at Assad Reservoir is similar to the water levels near the Keban and Atatürk dams, no regular increase or decrease (seasonal or anthropogenic) has been detected in different years (Figure 3). Civil war and political instability may affect the management of water sources [5,54]. The highest water level in the Assad Reservoir at 304.22 m was reached on 23 June 2019, while the lowest water level at 297.89 m was reached on 10 October 2022. Between 17 October 2018, and 9 October 2022, the water level remained approximately constant (Table S1 in Supplementary Material). Cluster-4, Hadithah Reservoir, and Cluster-6 show similar trends (Figure 3). Between 26 February 2019 and 20 February 2022, the water level of Cluster-4 increased by approximately 3 m, but the Cluster-6 water level has remained constant. (Table S1 in Supplementary Material). Hadithah Reservoir has the highest water level at 146.22 m on 30 April 2021, and the lowest water level at 122.98 m on 26 December 2018. Although the water level of the Hadithah Reservoir was stable in 2020, it decreased by 17 m between 1 September 2019 and 19 September 2019 (Table S1 in Supplementary Material). The water levels of Cluster-5, Cluster-6, and Cluster-7 did not change significantly between 2019 and 2022 (Table S1 in Supplementary Material).
Four reservoirs and five river locations in the Tigris River were investigated (Figure 1). All reservoirs on the Tigris showed a similar trend (Figure 4). The water level of the reservoirs, which increased until August 2019, decreased thereafter (Figure 4). Cluster-9, Cluster-10, and Cluster-11 show a trend opposite to that of the Mosul Reservoir (Figure 4). Along with the increase in the water level of the Mosul Reservoir, a decrease was observed, especially for Cluster-10 and Cluster-11. However, there was not much increase or decrease in water levels in the cluster areas located on the Tigris River (Table S2 in Supplementary Material). The Dukan reservoir showed a decrease of approximately 4 m, while the Mosul reservoir and Darbandikhan reservoir showed decreases of approximately 7.5 m and 6.5 m, respectively. However, the Hamrin Reservoir experienced a decrease of approximately 13 m in water level between 12 September 2022 and 18 September 2019. A decrease of approximately −1 m to −2 m was observed in Clusters 9, 10, and 13, while the water level remained constant in Clusters 11 and 12. (Table S2 in Supplementary Material).
There were six lakes in the study area (Figure 1). The trends in the Van and Erçek lakes were similar (Figure 5). On the other hand, although the trend is decreasing for both the Van and Erçek lakes, there has been no significant change in water level over 4 years (Table S3 in Supplementary Material). In addition, when analyzed seasonally, the highest water levels occurred in May−June, whereas the lowest water levels were observed in December−January (Figure 5). Lake Van reached its highest water level of 1648.25 m on 28 May 2019 and its lowest water level of 1646.99 m on 20 September 2022 (Table S3 in Supplementary Material). The trend in water level at Hazar Lake is increasing, and the level has increased by 2 m (Figure 5, Table S3 in Supplementary Material). Lakes Therthar, Habbaniyah, and Razazah appear to have a similar trend. The water levels of all three lakes increased within three years, but it was observed that the water level decreased again (Figure 5). Lake Therthar had the highest water level at 58.43 m on 21 July 2019, and its minimum water level was 42.57 m on 19 November 2018 (Table S3 in Supplementary Material). Habbaniyah Lake reached its highest water level of 50.18 m on 26 February 2020 and its lowest water level of 42.32 m on 29 November 2018 (Table S3 in Supplementary Material). Razazah Lake rose to 21.85 m on 15 June 2020 as its highest water level and declined to its minimum water level of 18.53 m on 18 December 2018 (Table S3 in Supplementary Material).

3.2. Water Area Changes of Lakes and Reservoirs

In our study, time series of the surface areas of six lakes and nine reservoirs were created from 2018 to the end of 2022. The NDWI time series produced from Sentinel-2 data were used. Areas calculated for the same month in the most distant years were used to assess the area change (Figure 6). Our reason for choosing the same months was to minimize both seasonal effects (such as precipitation and evaporation) and anthropogenic effects (such as water use on agricultural land). By selecting long years, we aimed to maximize the time period for our analysis and minimize short-term fluctuations.
It was observed that the Keban Reservoir experienced a continuous decrease in surface area between 12 June 2019 and 13 November 2022 (Table S4 in Supplementary Material). Between 12 June 2019 and 11 June 2022, an area decrease of approximately −116 km2 (−18%) was observed (Figure 6). The Karakaya Reservoir showed an increase of approximately 49 km2 (25%) in its surface area until June 2019, followed by a decrease (Table S4 in Supplementary Material). An area decrease of −0.69 km2 was determined for the Karakaya Reservoir (Figure 6). Similarly, the Atatürk Reservoir expanded by 80 km2 in surface area until June 2019. The highest area values are observed every year in June (Table S4 in Supplementary Material). The Atatürk Reservoir had an area decrease of approximately −56 km2 (−7%) between 27 June 2019 and 26 June 2022 (Table S4 in Supplementary Material). Assad Reservoir reached its largest area at 794.24 km2 on 8 March 2020, while its smallest area at 657.51 km2 was obtained on 9 October 2021 (Table S4 in Supplementary Material). Between 27 June 2018 and 26 June 2022, it expanded by 28 km2 (%4) (Figure 6). From 4 June 2019 to 5 June 2020, Hadithah Reservoir expanded its surface area by approximately 125 km2. It had its widest surface area of 464.52 km2 on 1 April 2021 and its smallest area of 136.3 km2 on 2 December 2022 (Table S4 in Supplementary Material). The surface area of the Hadithah Reservoir expanded by 50.52 km2 (25%) between 13 March 2019 and 15 March 2022 (Figure 6).
The surface area of the Mosul Reservoir, located on the Tigris River, expanded by approximately 87 km2 (38%) from 21 June 2018 to 21 June 2019. At the same time, it reached its widest surface area of 314.32 km2 on 21 June 2019 and its smallest area of 120.14 km2 on 7 January 2018 (Table S5 in Supplementary Material). The surface area of the Mosul Reservoir expanded by 22.95 km2 (10%) in 4 years (between 21 June 2018 and 20 June 2022) (Figure 6). From 17 May 2018 to 17 May 2019, the Dukan Reservoir expanded by approximately 47 km2 (22%). On 17 May 2019, its largest surface area was 255.11 km2, and on 24 November 2022, its narrowest surface area was 131.97 km2 (Table S5 in Supplementary Material). The Dukan Reservoir shrank by 38.00 km2 (−18%) between 21 June 2018 and 20 June 2022 (Figure 6). Darbandikhan Reservoir reached its largest area of 80.35 km2 on 29 May 2019 (Table S5 in Supplementary Material). It declined by 35 km2 (−44%) between 18 June 2019 and 17 June 2022 (Figure 6). Hamrin Reservoir reached its largest limits with 281.05 km2 on 24 April 2019 (refer to Table S5 in Supplementary Material). It decreased by −229 km2 (−82%) in the following three years between 18 June 2019 and 17 June 2022 (Figure 6).
Among the lakes in the study area, Lake Van had the largest surface area of 3579,05 km2 on 30 May 2019, (Table S6 in Supplementary Material). There was a 17.78 km2 (−0.5%) drop in the surface area between 29 June 2018 and 18 June 2022, (Figure 6). The surface area of Erçek Lake exceeded 130 km2 during the first three months of each year. On other dates the surface area was ~110 km2 (Table S6 in Supplementary Material). In addition, there was a decrease of ~ 3 km2 between 29 June 2018, and 28 June 2022 (Figure 6). Habbaniyah Lake reached its largest surface area of 380.11 km2 on 17 January 2020 and the narrowest surface area of 150.76 km2 on 23 October 2022 (Table S6 in Supplementary Material). Between 5 August 2019 and 4 August 2022, a decline of 108.57 km2 (−40%) occurred (Figure 6). Hazar Lake always reaches its yearly largest area in June. It reached its largest area of 79.52 km2 on 26 June 2020 and its narrowest area of 78.09 km2 on 25 September 2018 (Table S6 in Supplementary Material). Between 22 June 2018 and 21 June 2022, there was an expansion of approximately 1 km2 (1%) in the water surface area (Figure 6).

3.3. Relationship Between Precipitation and Water Area

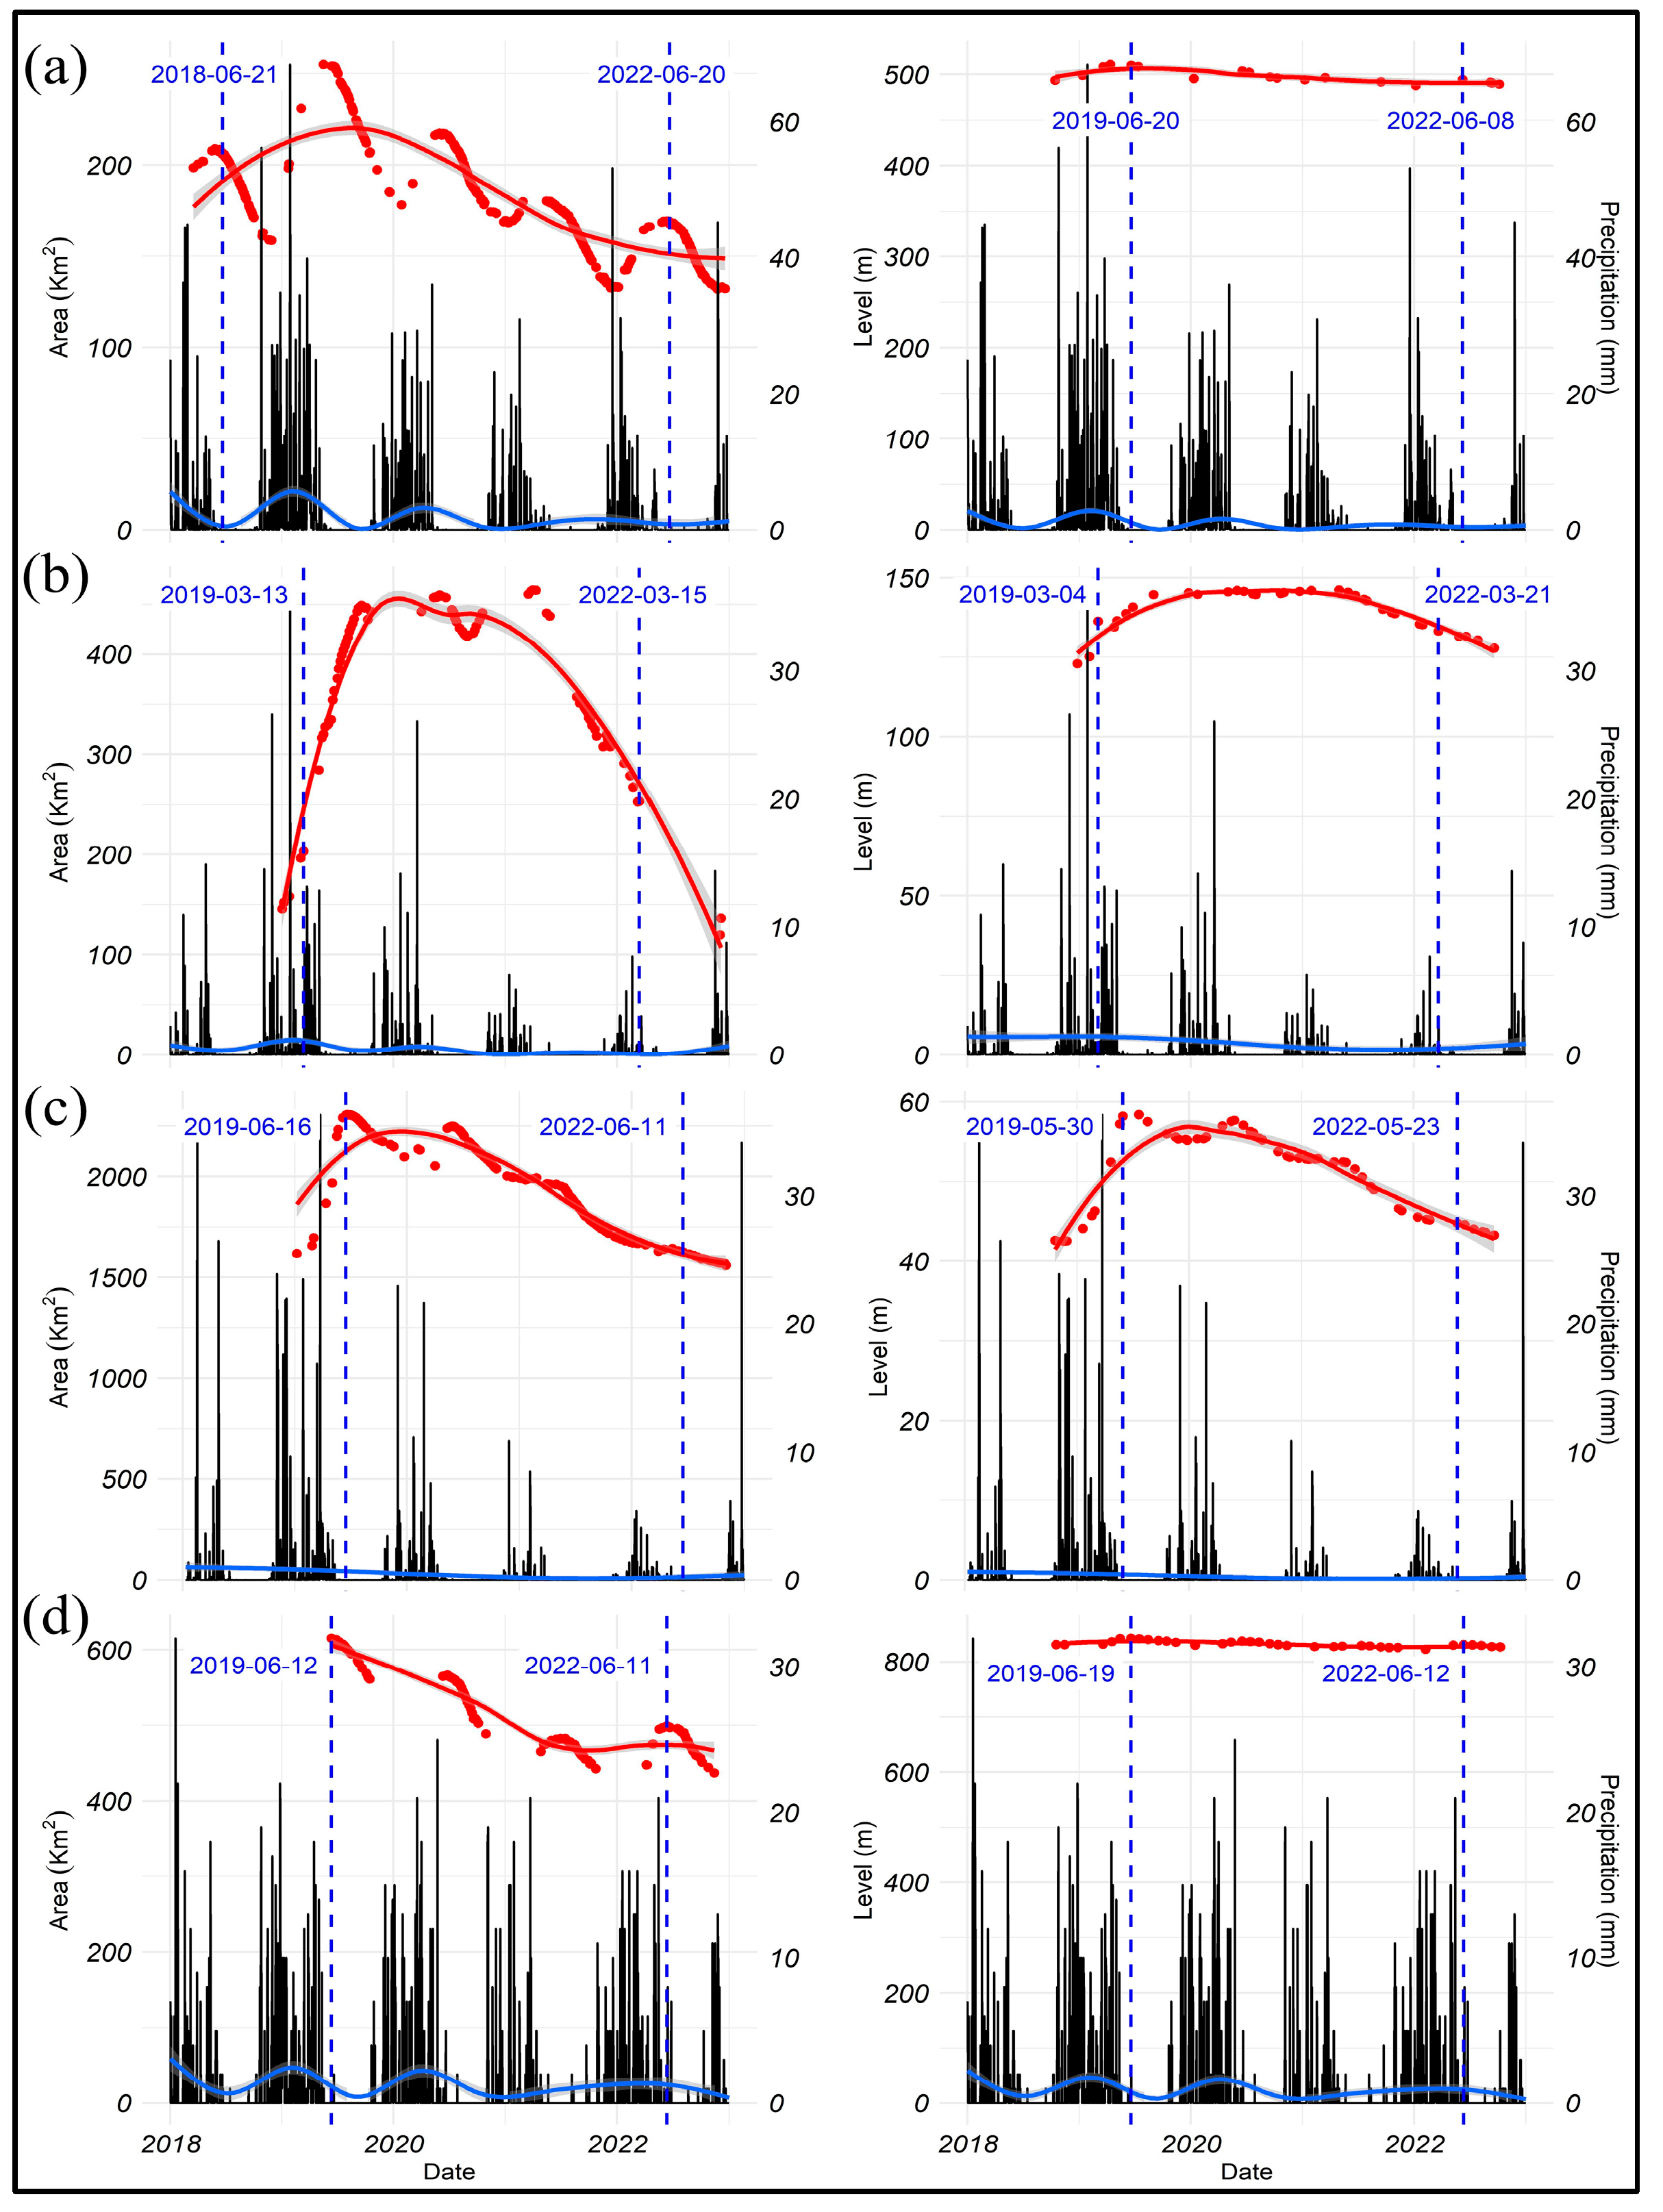
The relationship between precipitation data obtained from ERA5 and the water area in the study area was examined (Figure S1 in Supplementary Material). Figure 7 shows the precipitation, level, and area graphs of the lakes and dams analyzed in the study. Precipitation affects the water area and level in two different ways. The first is the annual increase and decrease in water level and area (Figure 6). The water level and area increase with a delay of 1 to 3 months after the rainy season. Studies have previously determined this delay in water level [55,56]. From the results, it is concluded that the water level and the areas decrease with the decrease in precipitation (Figure 6). It is also seen that the water level and water areas are directly related. Rainfall in mountainous regions varies significantly from year to year, resulting in large variations in the flow rate of the Tigris and Euphrates rivers and drought and flood conditions throughout [57]. The extreme precipitation is also noticed in Figure 7, and an increase is obtained in Hadithah Reservoir and Therthar Lake with ICESAT-2 data. Darvishi Boloorani, et al. [58] studied the period between 2000 and 2022 over the ETB and concluded that drought periods from 2008 to 2012 and 2021 to 2022 caused an increase in dust events. For the long-term analysis (2000–2022), it is reported that the water area declined. The previous studies presented that the water level change is affected by declining trends of underground water, which is caused by the withdrawal of underground water and drought [59]. In our study area, agricultural lands are also irrigated with water supplied from reservoirs and lakes. It is thought that with the decrease in rain, the water needs of agricultural lands increase, and this reduces the water level in reservoirs and lakes drastically. To better understand the effect of precipitation or climate data on lakes and reservoirs, parameters, such as evaporation and temperature, should be examined in detail.

4. Discussion

4.1. Performance of ICESat-2 Altimetry for Water Level Trend Assessment in Lakes, Reservoirs, and Rivers

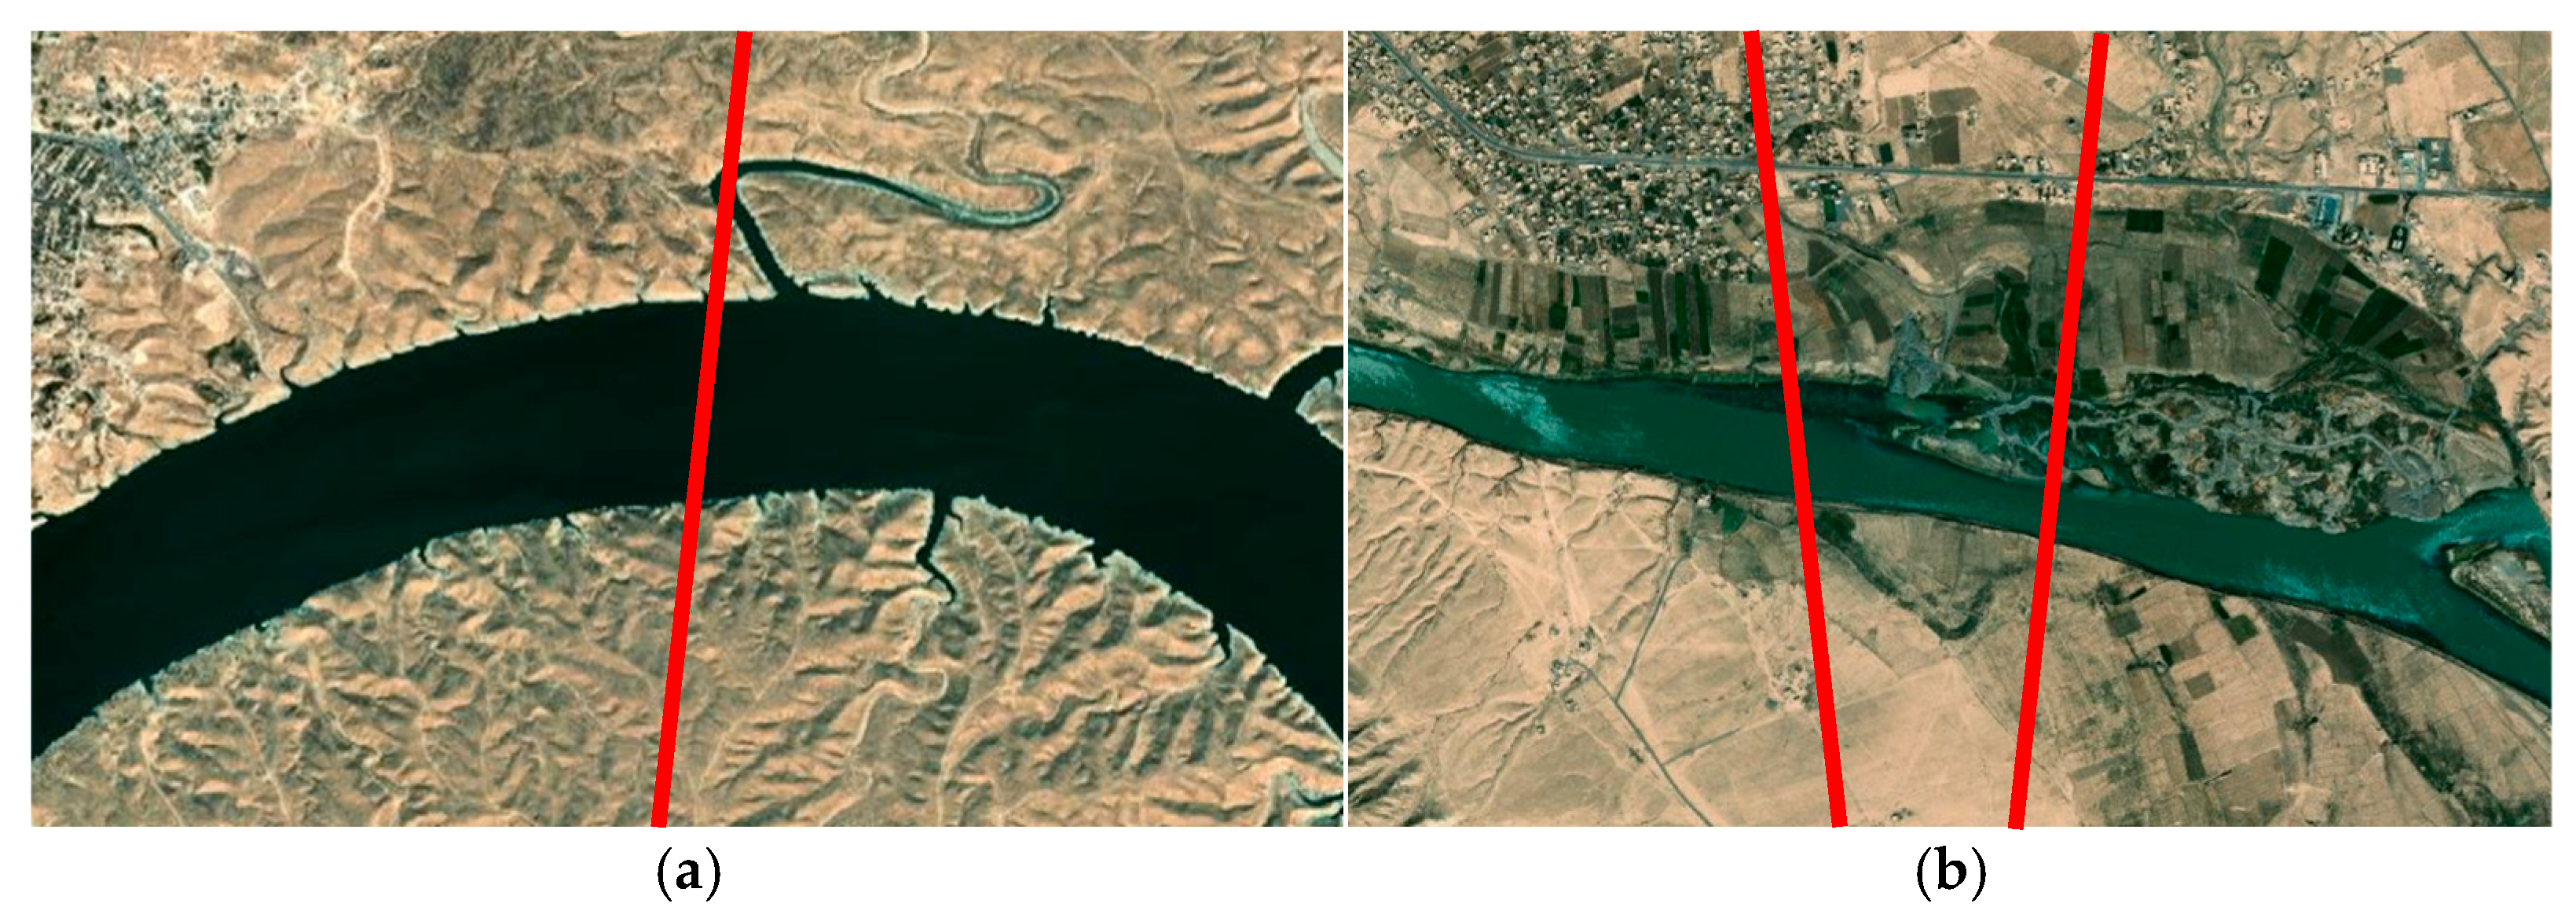
In this section, the success of ICESat-2 in collecting data from the study area is assessed. While combining ICESat-2 data into clusters, care was taken to ensure that the riverbed was flat and that the distance between the 2 ICESat-2 beams was not more than 250 m. The number of different passes per cluster area varied between 4 and 11 (Figure 8). Here, the number of passes increases if the direction of the river is perpendicular to the ICESat-2 orbit or if there are points on the river where two orbits overlap (Figure 9). Cluster-11 was the cluster where we could collect the most data with 11 passes, while for Cluster-2, we could collect only 4 passes (Figure 8). Although a water level trend over 4 years was not determined, a 3-year water level difference for November could be observed despite having only four passes. The fact that we were able to estimate the water level on the same date in different years for Clusters 1, 4, 5, 7, 8, 9, 10, 11, and 12 shows that ICESat-2 was successful in determining the trend of water levels in the river (Tables S1 and S2 in Supplementary Material). The passes mentioned here represent the number of days from which the data can be collected. In a study examining the Upper Brahmaputra River, two years of ICESat-2 data were collected. It has been stated that there are 127 passes in different locations over the river, with a maximum of 6 repeated passes in 1 area [60]. In a study using ICESat-2 on the Mekong River, it was stated that there were at least 4 and at most 14 passes between October 2018 and April 2021 in areas where hydrological stations were located [14].
Lakes and reservoirs larger than 75 km2 were selected in our study area. However, the surface areas of the Hamrin and Darbandikhan Reservoirs decrease over time (Table 1). Lake Van is the largest lake in the study area, and most of the data were collected from Lake Therthar (Figure 8). Although 12 orbits passed over Lake Van, much of the data could not be used because of differences in water levels on similar or recent dates due to the size of the lake. The water levels in the large reservoirs were taken from places close to the dam embankment of their reservoirs. Given this constraint, a maximum of 54 passes were collected for Therthar Lake, whereas at least 16 passes were collected for the Hamrin and Karakaya Reservoirs, and Ercek Lake (Figure 8). In a study conducted over nine lakes and reservoirs in western Türkiye, inland waters between 1 km2 and 501 km2 were examined between November 2018 and September 2019. Between 4 and 12 passes of data can be collected for inland waters [15]. van Gent [60] examined 621 lakes in the Tibetan Plateau, upper Brahmaputra, and Nam Co Basin for two years. It is stated that 168 of the 448 lakes smaller than 0.5 km2 had one pass, while 11 of them had more than 4 passes. Of the 167 lakes between 0.5 km2 and 50 km2, there was a single pass for 125, at least 4 passes for 47 of them, and 8 passes for 8. It is stated that all of the lakes of 50 km2 and above have at least 4 passes and 5 of them have at least 8 passes. Both these studies stated that the water level could be determined from ICESat-2 data, even if time series could not be created for some small lakes. Because we worked for a longer period and considered lakes and reservoirs of larger areas, we had the opportunity to collect more passes and analyze the time series.
For the Hamrin Reservoir, it is possible to compare three different sources of water levels (Table 1). In addition to our estimates and results from HydroWeb, water heights are also available from official departments, [23]. The maximum difference in water levels between Khalaf [23] and our study was 30 cm (Table 1).

4.2. Performance of Water Area Detection from Sentinel-2 Imagery for Lakes and Reservoirs

In this section, the contribution of Sentinel-2 and a comparison of its results with those of studies conducted in similar fields are examined. Sentinel-2A/B was used in this study. When using these two satellites together at the equator under cloud-free conditions, the revisit time was five days. For this reason, satellite images could be sufficiently collected over the five years considered (Table 2). Over Mosul Reservoir, we could calculate the largest number of areas with 313 passes. Moreover, areas could be estimated for the Assad, Darbandikhan, Hadithah, Mosul, and Therthar water bodies from the first month of 2018 to the last month of 2022 (Table 2). Furthermore, for all water bodies except Atatürk, Van, Keban, and Hadithah, the water area could be estimated every 15 days on average (1825 days/120 data numbers = 15.2). Unlike water height data, data collection over bodies with large surface areas was hampered by cloudiness (Figure S7 in Supplementary Material). This is especially true for Keban and Hadithah. In the Keban Reservoir, there were 44 ICESat-2 passes (Figure 8), while 95 reservoir areas could be estimated using Sentinel-2A/B (Table 2). Similarly, for the Hadithah Reservoir, there were 35 ICESat-2 passes (Figure 8), while 90 reservoir areas could be estimated (Table 2). There are studies by others on surface area changes in the Mosul, Hamrin, and Karakaya Reservoirs. Torun and Gündüz [29] analyzed area changes in the Karakaya Reservoir using Landsat data from 1990, 2000, 2010, and 2019. In a comparative analysis using maximum likelihood, an artificial neural network (ANN), a support vector machine (SVM), and a method using decision trees, the SVM and decision trees gave the best result with 0.89 overall accuracies on 31 August 2019. In our study, we estimated the area of Karakaya Reservoir at 226.07 km2 as a common day on 31 August 2019 (Table S4 in Supplementary Material), which is close to the results of Torun and Gündüz [29] who found 227.88 km2 with the SVM and 221.72 km2 with decision trees. Al-Obaidi and Al-Timimi [61] applied unsupervised classification to the Mosul Reservoir and produced a surface area by applying the NDWI to Landsat data. They analyzed the changes in surface areas for April on 5-year intervals between 2000 and 2020. In 2020, they estimated the surface area to be 295 km2. In our study, Sentinel-2 images for April 2020 were not obtained. However, on 14 May 2020, the water area was estimated as 293.69 km2 (Table S5 in Supplementary Material). Jumaah, Ameen and Kalantar [28] conducted a change analysis of the Hamrin Reservoir between 2018 and 2022 using Sentinel-2 satellite images and the SVM method. They estimated the water surface area to be 39 km2 on 19 December 2022. Our study indicated a similar result of the water surface area of 41.74 km2 on 19 December 2022 (Table S5 in Supplementary Material). Khalaf [23] estimated the surface area of the Hamrin Reservoir using NDWI applied to Landsat-8 imagery. The differences between this study and Khalaf [23] study range between 0.99 km2 and −17.7 km2 in surface area (Table 3). The correlation between the water areas in the two studies was 0.97.

4.3. Comparison of Water Level and Water Area Changes with HydroWeb Data

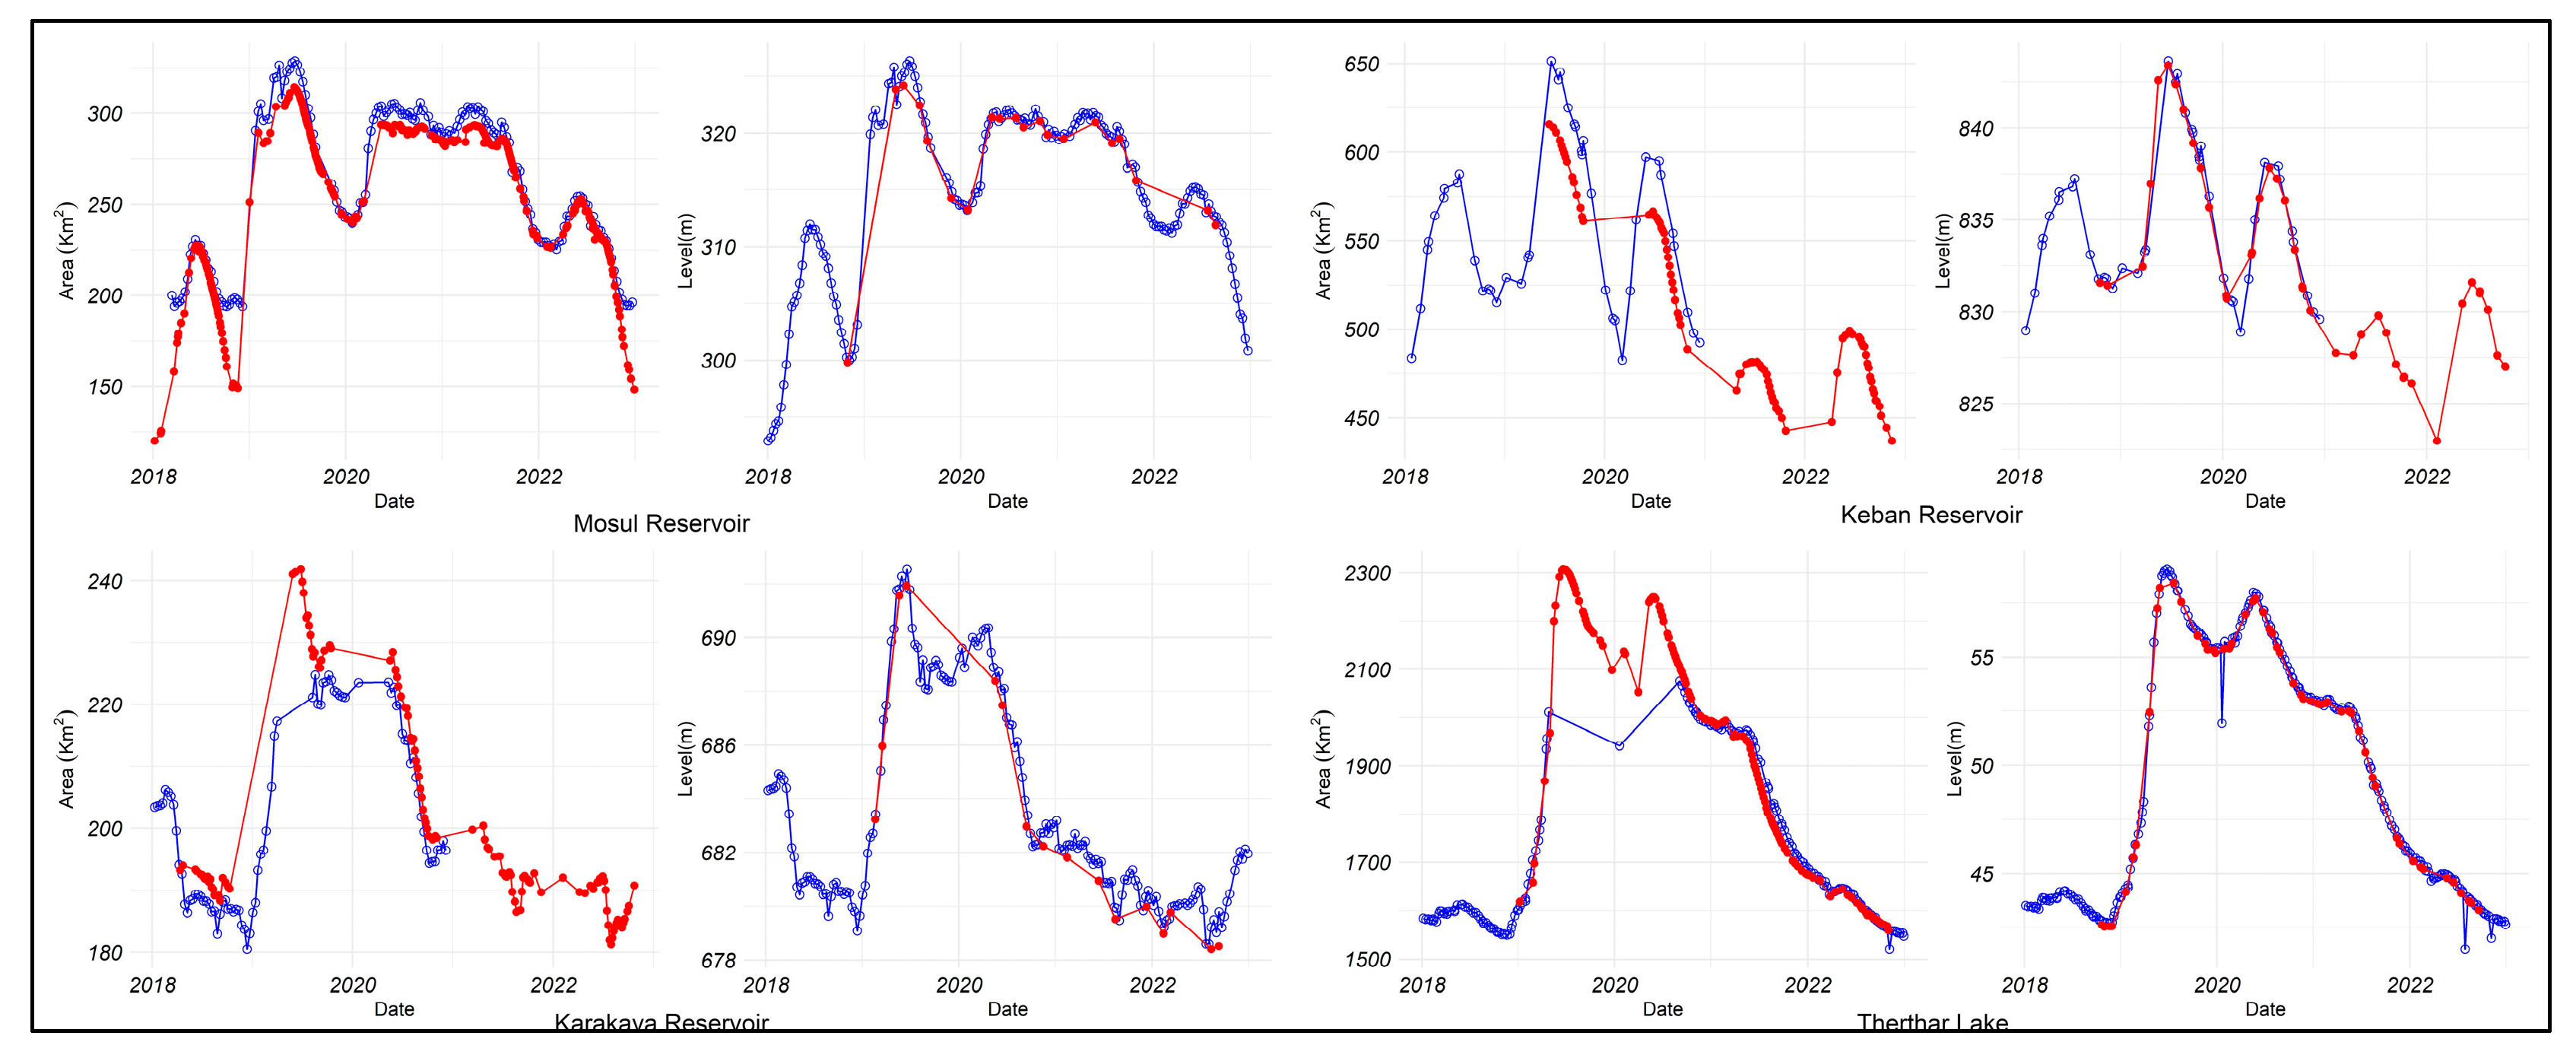
Here, we discuss water height and water area data obtained from the global HydroWeb data. HydroWeb combines data from multiple satellites, as explained in Section 2.2.4 Here, the consistency between the ICESat-2 data and HydroWeb data, which have been hydrological data providers for years, was examined. The lakes and reservoirs considered in Figure 10 were chosen because HydroWeb provides not only the water level but also water information for these water bodies. Water heights estimated by ICESat-2 and the water heights in the HydroWeb largely coincide (Figure 10). Some outliers were observed in the HydroWeb heights obtained for Lake Therthar (Figure 10). In addition, Khalaf [23] results for the Hamrin Reservoir agree with the results of HydroWeb and our study. Because the HydroWeb database uses more than one satellite, the amount of data is generally large (Table 1). However, there was a data gap in the Keban Reservoir in the HydroWeb database. In areas with such data outages, the HydroWeb time series can be continued quickly using the methodology presented in this study. Likewise, the gaps between the data can be filled with ICESat-2 data.
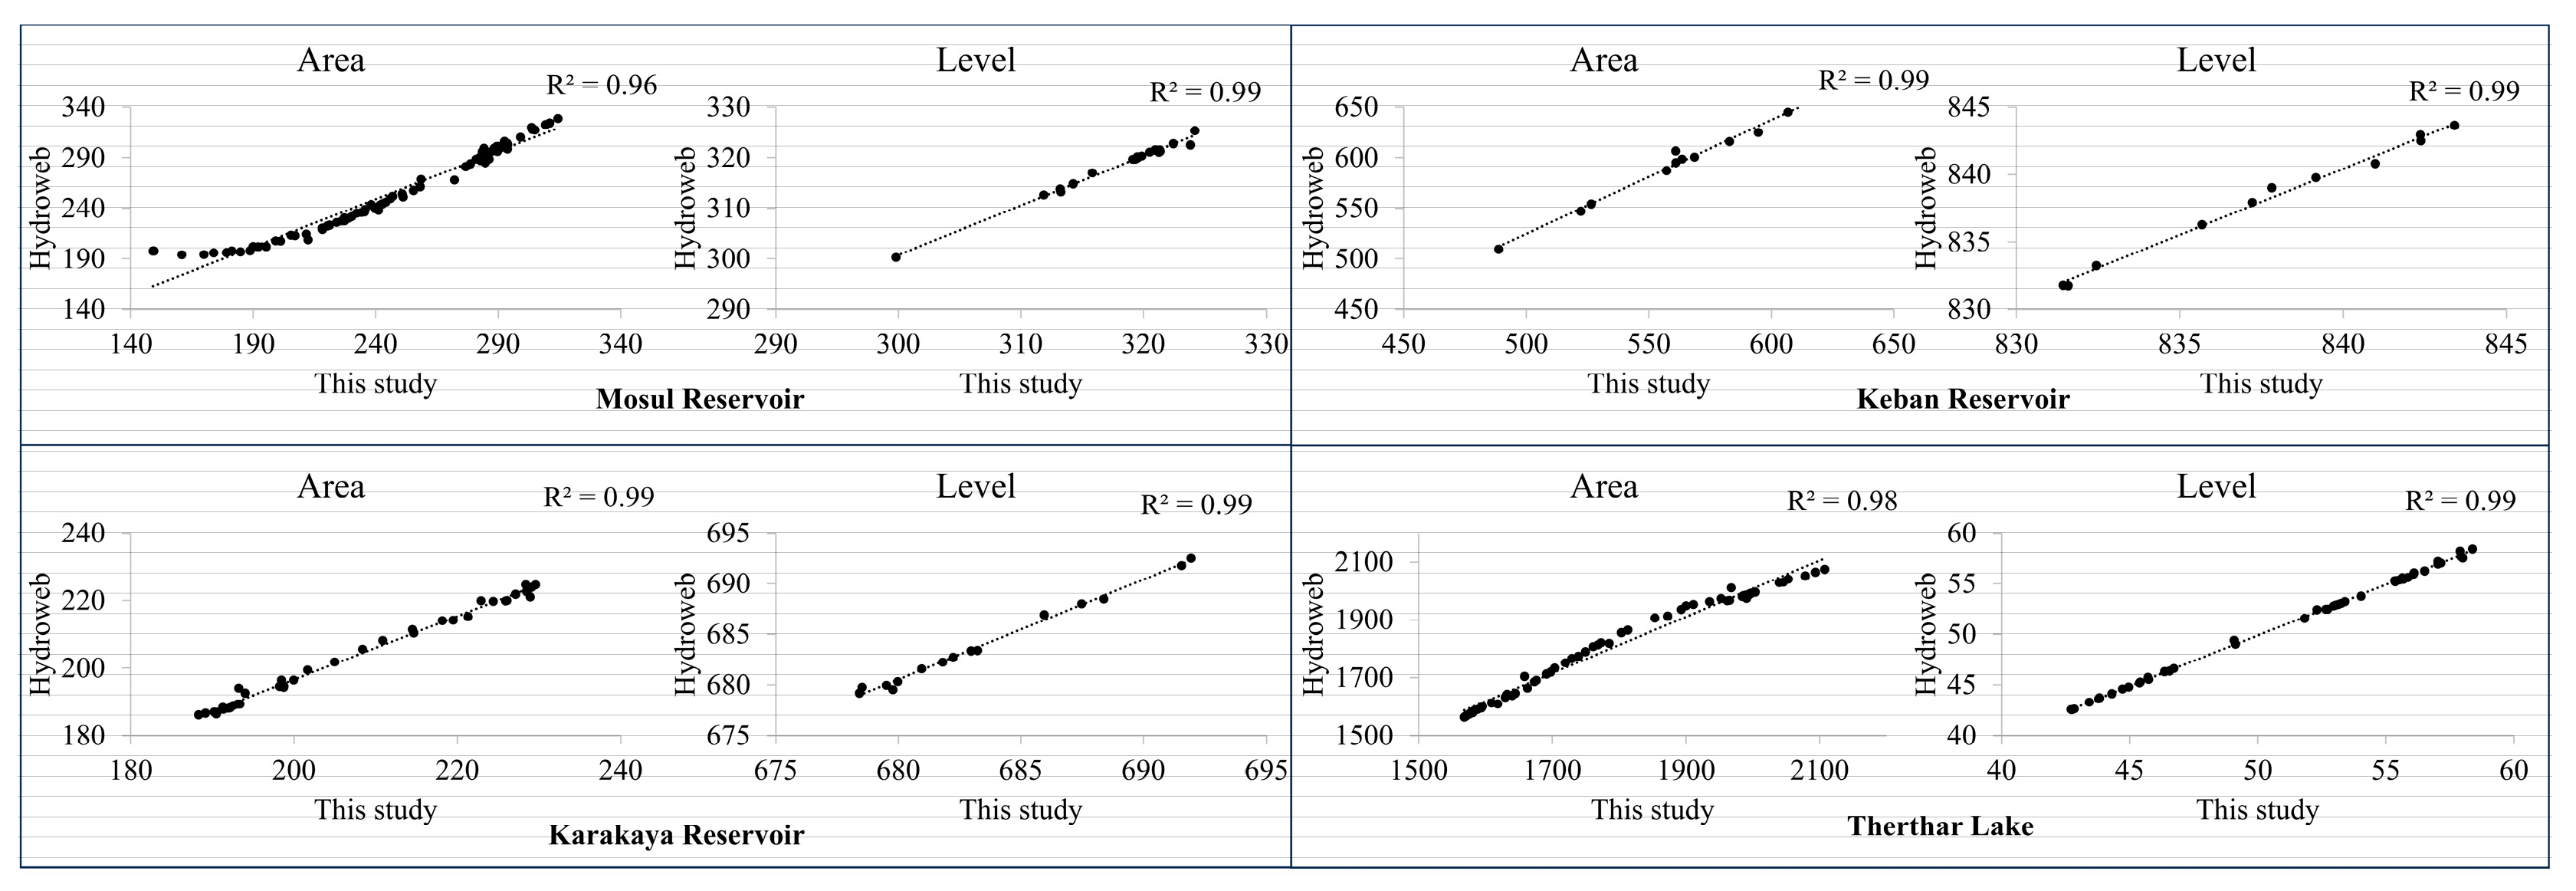
After determining the same dates (±7 days) for the results of our study and the HydroWeb results, the relationship between the two data points was analyzed. A high R2 value (99%) was found between the HydroWeb and the water levels obtained in our study. In the water areas, R2 was between 96% and 99% (Figure 11).
Area comparison is slightly more complicated than water level comparison because results obtained with satellites with different spatial resolutions may cause mixed-pixel problems. These problems are less common when high-resolution satellite images are used for land use/land cover classification [62,63]. When the areas estimated from HydroWeb were assessed, we examined whether they showed a similar trend (Figure 10). There was no spatial difference in Lake Therthar (Figure 10). However, there were area differences between the two data sources for the reservoirs. The reason for this is that dam reservoirs, in general, do not have such clear boundaries as natural lakes, as the heads of the reservoirs often gradually transforms into the feeding river. Consequently, the particular methods used for boundary determination may significantly affect the results of an area comparison. For the same Lake Therthar, Torun and Gündüz [29] reported an area of 227.88 km2 with an SVM and 221.72 km2 with decision trees on 31 August 2019. HydroWeb reports a water area of 220.07 km2 on 28 August 2019, which is close to our result of 226.07 km2.
Al-Obaidi and Al-Timimi [61] reported an area of 295 km2 for Mosul Reservoir in April 2020, which is close to the 296.6 km2 in HydroWeb on 15 April 2020, and the 293.69 km2 from our study on 14 May 2020, as we could not find a cloudless image in April.

5. Limitations of the Study

The water height and surface area of lakes and rivers in the ETB basin changed between 2018 and 2023. The geomorphological features and landscape could not be considered due to the lack of in situ data and fieldwork in the region. However, geomorphological effects can be examined and discussed by applying the proposed methodology to different regions.
It was not possible to compare the ICESat-2 water level with in situ measurements (owing to civil wars in many parts of the study area) for validation. However, it was compared with the results obtained for only one or two lakes that were recently studied.
Because Sentinel-2 is an optical imaging satellite, it is affected by cloud cover. This causes data loss in the water surface area determination. For this reason, Sentinel-1 satellites or different RADAR satellites are preferred over Sentinel-2 satellites. In Lake Van, the largest lake of the study, water surface area determination was very limited because of cloudiness in the Sentinel-2 data compared to other lakes (Table 2).

6. Conclusions

In this study, it was shown that lakes, reservoirs, and rivers in the Euphrates–Tigris Basin could be effectively monitored between 2018 and 2023 with relatively new ICESat-2 ATL13 LiDAR altimetry data. We also compared our results with those in the literature in Section 4.1 (Table 1). A decrease in the water level was observed in all areas in the study area, especially after 2019. The Sentinel-2 satellite was successful in collecting temporal data for monitoring the water area, which was another subject of this study. In addition, it can be seen that the results we compared with other studies in the literature in Section 4.2 are similar. When the results of the study were examined, there were decreases in water level or area, especially in the Therthar Lake (~590 km2 decreased in water area) and Keban (~5 m decrease in water level), Atatürk (~6 m decrease in water level), and Harmin dams (~13 m decrease in water level). In addition, when we checked the study area, the reservoirs on the northern side of the Euphrates River showed an area decrease, while an increase was observed on the southern side. It turns out that ICESat-2 ATL13 data and Sentinel-2 are directly applicable for monitoring inland waters in the Euphrates–Tigris Basin. With the decrease in freshwater resources, monitoring, protecting, and taking precautions for these resources and reservoirs have become an important issue. The study showed compatible results when compared to previous studies and global HydroWeb data. On the other hands the methodology has limitations due to long temporal resolution of ICESat-2 data. Therefore, it does not pass frequently over small lakes, and the correlation between the water surface area and water level changes of rivers, lakes, and reservoirs was not examined. Another drawback is the thresholding for the water area extraction. Other thresholding methods can be tested to improve the accuracy. Nonetheless, ICESat-2, Sentinel-2, and ERA5 are important freely available data sources for basin observations. In particular, the methodology used was found to be applicable in areas where ground-based monitoring is limited.

Supplementary Materials

The following supporting information can be downloaded at: https://www.mdpi.com/article/10.3390/rs17162913/s1, Figure S1: Graphs show the relationship between the areas of lakes and reservoirs in the study area and rainfall. Red Dot shows calculated water areas and levels, red line shows trends of water areas and levels, Black columns show daily precipitation amounts, blue line shows precipitation trend; Table S1: Water heights of reservoirs and cluster areas on the Euphrates River calculated with ICESat-2. Water heights are given in m; Table S2: Water heights of reservoirs and cluster areas on the Tigris River calculated with ICESat-2. Water heights are given in m; Table S3: Water heights of the lakes in the study area calculated with ICESat-2. Water heights are given in m; Table S4: Surface areas of the reservoirs on the Euphrates River calculated with Sentinel-2. Areas are given in km2; Table S5: Surface areas of reservoirs on the Tigris River calculated with Sentinel-2. Areas are given in km2; Table S6: Surface areas of the lakes in the study area calculated with Sentinel-2. Areas are given in km2.

Author Contributions

Conceptualization, O.G.N. and R.L.; methodology, O.G.N. and R.L.; software, O.G.N.; validation, all the authors; formal analysis, all the authors; investigation, all the authors; resources, O.G.N. and S.A.; data curation, O.G.N.; writing—original draft preparation, all the authors; writing—review and editing, all the authors; visualization, O.G.N.; supervision, R.L. All authors have read and agreed to the published version of the manuscript.

Funding

This research received no external funding.

Data Availability Statement

The datasets used in the current study are available from the corresponding author upon a reasonable request.

Acknowledgments

The European Space Agency (ESA) distributes Sentinel-2 satellite imagery free of charge. Thus, the authors thank the ESA for providing satellite imagery. NASA distributes ICESat-2 satellite altimetry data free of charge. The authors thank NASA for providing satellite altimetry data.

Conflicts of Interest

The authors declare no conflicts of interest.

Abbreviations

The following abbreviations are used in this manuscript:
ETBEuphrates–Tigris basin
ICESat-2Ice, Cloud, and Land Elevation Satellite-2
NDWINormalized difference water index
ERA5ECMWF Reanalysis v5
DAHITIDatabase for Hydrological Time Series of Inland Waters
ICESat-1Ice, Cloud, and Land Elevation Satellite-1
RMSERoot mean square error
R2Coefficient of determination
MDNWIModified normalized difference water index
GEEGoogle Earth Engine
LULCLand use land cover
SDGSustainable Development Goal
GAPSoutheastern Anatolia Project
NASANational Aeronautics and Space Administration
ATLASAdvanced Topographic Laser Altimeter System
ESAEuropean Space Agency

Appendix A

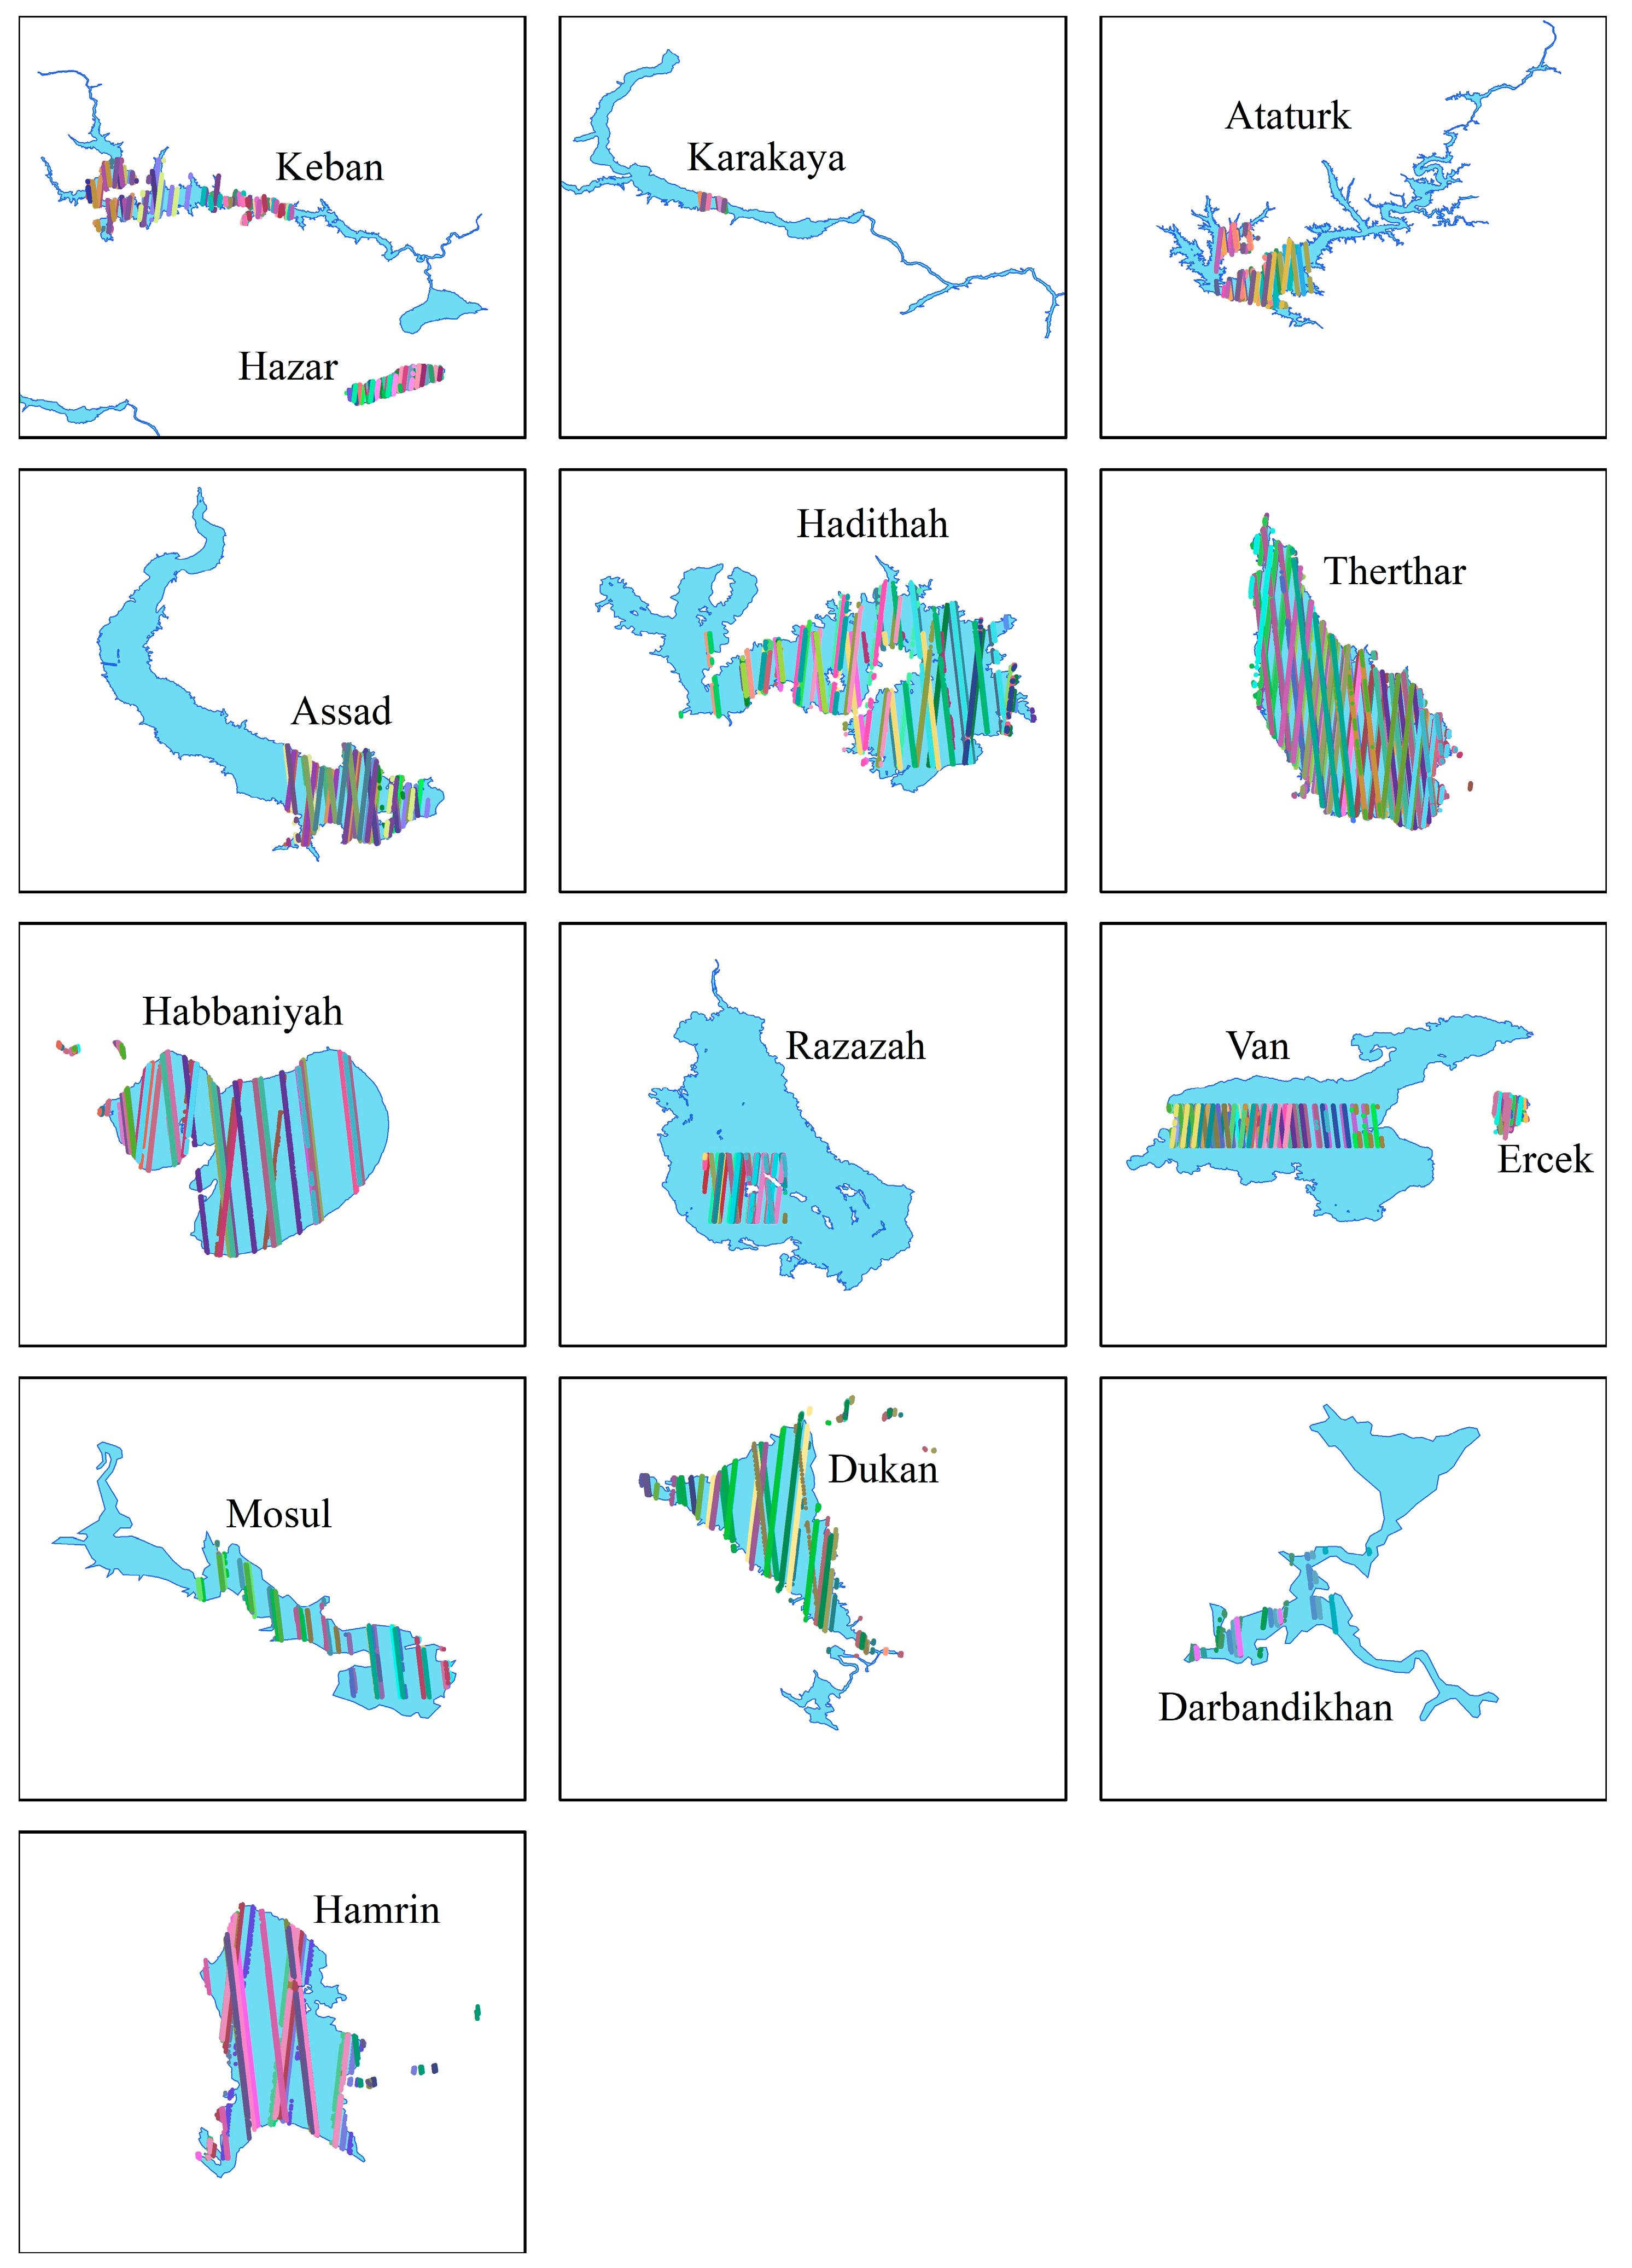
Figure A1. The distribution of ICESat-2 beams used in the study. Each colour represents ICESat-2 ground tracks from different dates.
Remotesensing 17 02913 g0a1

References

  1. World Economic, F. Global Risks 2015: Tenth Edition; World Economic Forum: Geneva, Switzerland, 2015. [Google Scholar]
  2. El-Fadel, M.; Sayegh, Y.E.; Ibrahim, A.A.; Jamali, D.; El-Fadl, K. The Euphrates–Tigris Basin: A Case Study in Surface Water Conflict Resolution. J. Nat. Resour. Life Sci. Educ. 2002, 31, 99–110. [Google Scholar] [CrossRef]
  3. Voss, K.A.; Famiglietti, J.S.; Lo, M.; de Linage, C.; Rodell, M.; Swenson, S.C. Groundwater depletion in the Middle East from GRACE with implications for transboundary water management in the Tigris-Euphrates-Western Iran region. Water Resour. Res. 2013, 49, 904–914. [Google Scholar] [CrossRef]
  4. Al-Taei, A.I.; Alesheikh, A.A.; Darvishi Boloorani, A. Land Use/Land Cover Change Analysis Using Multi-Temporal Remote Sensing Data: A Case Study of Tigris and Euphrates Rivers Basin. Land 2023, 12, 1101. [Google Scholar] [CrossRef]
  5. Kibaroglu, A.; Schmandt, J.; Ward, G. Engineered rivers in arid lands: Searching for sustainability in theory and practice. Water Int. 2017, 42, 241–253. [Google Scholar] [CrossRef]
  6. Food; Agriculture Organization of the United, N. Euphrates–Tigris River Basin. Available online: https://www.fao.org/aquastat/en/countries-and-basins/transboundary-river-basins/euphrates-tigris (accessed on 8 July 2025).
  7. Ozkaya, A.; Zerberg, Y. A 40-Year Analysis of the Hydrological Drought Index for the Tigris Basin, Turkey. Water 2019, 11, 657. [Google Scholar] [CrossRef]
  8. Daher, J. Water Scarcity, Mismanagement and Pollution in Syria; 929466323X; European University Institute: Fiesole, Italy, 2022. [Google Scholar]
  9. Kavvas, M.L.; Chen, Z.Q.; Anderson, M.L.; Ohara, N.; Yoon, J.Y.; Xiang, F. A study of water balances over the Tigris–Euphrates watershed. Phys. Chem. Earth Parts A/B/C 2011, 36, 197–203. [Google Scholar] [CrossRef]
  10. Bachmann, A.; Tice, V.; Al-Obeidi, L.A.; Kilıç, D.T. Tigris-Euphrates River ecosystem: A status report. In Mesopotamia Water Forum; Save The Tigris Foundation: The Hague, The Netherlands, 2019; pp. 6–8. Available online: https://www.savethetigris.org/wp-content/uploads/2019/03/Paper-Challenge-C-Ecosystem-FINAL-to-be-published-1.pdf (accessed on 8 July 2025).
  11. Crétaux, J.F.; Arsen, A.; Calmant, S.; Kouraev, A.; Vuglinski, V.; Bergé-Nguyen, M.; Gennero, M.C.; Nino, F.; Abarca Del Rio, R.; Cazenave, A.; et al. SOLS: A lake database to monitor in the Near Real Time water level and storage variations from remote sensing data. Adv. Space Res. 2011, 47, 1497–1507. [Google Scholar] [CrossRef]
  12. Schwatke, C.; Dettmering, D.; Bosch, W.; Seitz, F. DAHITI—An innovative approach for estimating water level time series over inland waters using multi-mission satellite altimetry. Hydrol. Earth Syst. Sci. 2015, 19, 4345–4364. [Google Scholar] [CrossRef]
  13. Phan, V.H.; Lindenbergh, R.; Menenti, M. ICESat derived elevation changes of Tibetan lakes between 2003 and 2009. Int. J. Appl. Earth Obs. Geoinf. 2012, 17, 12–22. [Google Scholar] [CrossRef]
  14. Lao, J.; Wang, C.; Nie, S.; Xi, X.; Wang, J. Monitoring and Analysis of Water Level Changes in Mekong River from ICESat-2 Spaceborne Laser Altimetry. Water 2022, 14, 1613. [Google Scholar] [CrossRef]
  15. Narin, O.G.; Abdikan, S. Multi-temporal analysis of inland water level change using ICESat-2 ATL-13 data in lakes and dams. Environ. Sci. Pollut. Res. 2023, 30, 15364–15376. [Google Scholar] [CrossRef]
  16. Ryan, J.C.; Smith, L.C.; Cooley, S.W.; Pitcher, L.H.; Pavelsky, T.M. Global Characterization of Inland Water Reservoirs Using ICESat-2 Altimetry and Climate Reanalysis. Geophys. Res. Lett. 2020, 47, e2020GL088543. [Google Scholar] [CrossRef]
  17. Han, W.; Huang, C.; Gu, J.; Hou, J.; Zhang, Y.; Wang, W. Water Level Change of Qinghai Lake from ICESat and ICESat-2 Laser Altimetry. Remote Sens. 2022, 14, 6212. [Google Scholar] [CrossRef]
  18. Du, Y.; Zhang, Y.; Ling, F.; Wang, Q.; Li, W.; Li, X. Water Bodies’ Mapping from Sentinel-2 Imagery with Modified Normalized Difference Water Index at 10-m Spatial Resolution Produced by Sharpening the SWIR Band. Remote Sens. 2016, 8, 354. [Google Scholar] [CrossRef]
  19. Kaplan, G.; Avdan, U. Object-based water body extraction model using Sentinel-2 satellite imagery. Eur. J. Remote Sens. 2017, 50, 137–143. [Google Scholar] [CrossRef]
  20. Sarp, G.; Ozcelik, M. Water body extraction and change detection using time series: A case study of Lake Burdur, Turkey. J. Taibah Univ. Sci. 2017, 11, 381–391. [Google Scholar] [CrossRef]
  21. Sekertekin, A.; Cicekli, S.Y.; Arslan, N. Index-Based Identification of Surface Water Resources Using Sentinel-2 Satellite Imagery. In Proceedings of the 2018 2nd International Symposium on Multidisciplinary Studies and Innovative Technologies (ISMSIT), Ankara, Turkey, 19–21 October 2018; pp. 1–5. [Google Scholar]
  22. Karaman, M. Comparison of thresholding methods for shoreline extraction from Sentinel-2 and Landsat-8 imagery: Extreme Lake Salda, track of Mars on Earth. J. Environ. Manag. 2021, 298, 113481. [Google Scholar] [CrossRef]
  23. Khalaf, A.B. Using remote sensing and geographic information systems to study the change detection in temperature and surface area of Hamrin Lake. Baghdad Sci. J. 2022, 19, 1130. [Google Scholar] [CrossRef]
  24. Gorelick, N.; Hancher, M.; Dixon, M.; Ilyushchenko, S.; Thau, D.; Moore, R. Google Earth Engine: Planetary-scale geospatial analysis for everyone. Remote Sens. Environ. 2017, 202, 18–27. [Google Scholar] [CrossRef]
  25. Chang, M.; Li, P.; Li, Z.; Wang, H. Mapping Tidal Flats of the Bohai and Yellow Seas Using Time Series Sentinel-2 Images and Google Earth Engine. Remote Sens. 2022, 14, 1789. [Google Scholar] [CrossRef]
  26. Chen, J.; Kang, T.; Yang, S.; Bu, J.; Cao, K.; Gao, Y. Open-Surface Water Bodies Dynamics Analysis in the Tarim River Basin (North-Western China), Based on Google Earth Engine Cloud Platform. Water 2020, 12, 2822. [Google Scholar] [CrossRef]
  27. Kandekar, V.U.; Pande, C.B.; Rajesh, J.; Atre, A.A.; Gorantiwar, S.D.; Kadam, S.A.; Gavit, B. Surface water dynamics analysis based on sentinel imagery and Google Earth Engine Platform: A case study of Jayakwadi dam. Sustain. Water Resour. Manag. 2021, 7, 44. [Google Scholar] [CrossRef]
  28. Jumaah, H.J.; Ameen, M.H.; Kalantar, B. Surface Water Changes and Water Depletion of Lake Hamrin, Eastern Iraq, Using Sentinel-2 Images and Geographic Information Systems. Adv. Environ. Eng. Res. 2023, 4, 006. [Google Scholar] [CrossRef]
  29. Torun, A.T.; Gündüz, H.İ. Comparison of Different Classification Algorithms for The Detection of Changes on Water Bodies; Karakaya Dam Lake. Turk. J. Geosci. 2020, 1, 27–34. [Google Scholar]
  30. Erdem, F.; Atun, R.; Yigit Avdan, Z.; Atila, I.; Avdan, U. Drought analysis of Van Lake Basin with remote sensing and GIS technologies. Egypt. J. Remote Sens. Space Sci. 2021, 24, 1093–1102. [Google Scholar] [CrossRef]
  31. Albarakat, R.; Lakshmi, V.; Tucker, C.J. Using Satellite Remote Sensing to Study the Impact of Climate and Anthropogenic Changes in the Mesopotamian Marshlands, Iraq. Remote Sens. 2018, 10, 1524. [Google Scholar] [CrossRef]
  32. Ökten, Ş.; Çeken, H. Gap Projesi’nin Türkiye’nin Kirsal Kalkinma Politikalari İçindeki Yeri ve Önemi. Tarım Ekon. Derg. 2008, 14, 13–22. [Google Scholar]
  33. Yavaşoğlu, H.H.; Kalkan, Y.; Tiryakioğlu, İ.; Yigit, C.O.; Özbey, V.; Alkan, M.N.; Bilgi, S.; Alkan, R.M. Monitoring the deformation and strain analysis on the Ataturk Dam, Turkey. Geomat. Nat. Hazards Risk 2018, 9, 94–107. [Google Scholar] [CrossRef]
  34. von Lossow, T. The Rebirth of Water as a Weapon: IS in Syria and Iraq. Int. Spect. 2016, 51, 82–99. [Google Scholar] [CrossRef]
  35. Neuenschwander, A.L.; Magruder, L.A. Canopy and Terrain Height Retrievals with ICESat-2: A First Look. Remote Sens. 2019, 11, 1721. [Google Scholar] [CrossRef]
  36. Neumann, T.; Brenner, A.; Hancock, D.; Robbins, J.; Saba, J.; Harbeck, K.; Gibbons, A.; Lee, J.; Luthcke, S.; Rebold, T. ATLAS/ICESat-2 L2A Global Geolocated Photon Data, Version 3; NASA National Snow and Ice Data Center Distributed Active Archive Center: Boulder, CO, USA, 2021. [Google Scholar]
  37. Jasinski, M.; Stoll, J.; Hancock, D.; Robbins, J.; Nattala, J.; Morison, J.; Jones, B.; Ondrusek, M.; Pavelsky, T.; Parrish, C.; et al. ATLAS/ICESat-2 L3A Inland Water Surface Height, Version 2; NASA National Snow and Ice Data Center Distributed Active Archive Center: Boulder, CO, USA, 2019. [Google Scholar] [CrossRef]
  38. Drusch, M.; Del Bello, U.; Carlier, S.; Colin, O.; Fernandez, V.; Gascon, F.; Hoersch, B.; Isola, C.; Laberinti, P.; Martimort, P.; et al. Sentinel-2: ESA’s Optical High-Resolution Mission for GMES Operational Services. Remote Sens. Environ. 2012, 120, 25–36. [Google Scholar] [CrossRef]
  39. Phiri, D.; Simwanda, M.; Salekin, S.; Nyirenda, V.R.; Murayama, Y.; Ranagalage, M. Sentinel-2 Data for Land Cover/Use Mapping: A Review. Remote Sens. 2020, 12, 2291. [Google Scholar] [CrossRef]
  40. Narin, O.G.; Abdikan, S. Monitoring of phenological stage and yield estimation of sunflower plant using Sentinel-2 satellite images. Geocarto Int. 2022, 37, 1378–1392. [Google Scholar] [CrossRef]
  41. Nasiri, V.; Deljouei, A.; Moradi, F.; Sadeghi, S.M.M.; Borz, S.A. Land Use and Land Cover Mapping Using Sentinel-2, Landsat-8 Satellite Images, and Google Earth Engine: A Comparison of Two Composition Methods. Remote Sens. 2022, 14, 1977. [Google Scholar] [CrossRef]
  42. Li, J.; Peng, B.; Wei, Y.; Ye, H. Accurate extraction of surface water in complex environment based on Google Earth Engine and Sentinel-2. PLoS ONE 2021, 16, e0253209. [Google Scholar] [CrossRef]
  43. Huntington, J.L.; Hegewisch, K.C.; Daudert, B.; Morton, C.G.; Abatzoglou, J.T.; McEvoy, D.J.; Erickson, T. Climate Engine: Cloud Computing and Visualization of Climate and Remote Sensing Data for Advanced Natural Resource Monitoring and Process Understanding. Bull. Am. Meteorol. Soc. 2017, 98, 2397–2410. [Google Scholar] [CrossRef]
  44. Muñoz-Sabater, J.; Dutra, E.; Agustí-Panareda, A.; Albergel, C.; Arduini, G.; Balsamo, G.; Boussetta, S.; Choulga, M.; Harrigan, S.; Hersbach, H.; et al. ERA5-Land: A state-of-the-art global reanalysis dataset for land applications. Earth Syst. Sci. Data 2021, 13, 4349–4383. [Google Scholar] [CrossRef]
  45. Jiang, Q.; Li, W.; Fan, Z.; He, X.; Sun, W.; Chen, S.; Wen, J.; Gao, J.; Wang, J. Evaluation of the ERA5 reanalysis precipitation dataset over Chinese Mainland. J. Hydrol. 2021, 595, 125660. [Google Scholar] [CrossRef]
  46. Duan, Z.; Bastiaanssen, W.G.M. Estimating water volume variations in lakes and reservoirs from four operational satellite altimetry databases and satellite imagery data. Remote Sens. Environ. 2013, 134, 403–416. [Google Scholar] [CrossRef]
  47. Muala, E.; Mohamed, Y.A.; Duan, Z.; Van der Zaag, P. Estimation of Reservoir Discharges from Lake Nasser and Roseires Reservoir in the Nile Basin Using Satellite Altimetry and Imagery Data. Remote Sens. 2014, 6, 7522–7545. [Google Scholar] [CrossRef]
  48. Khalsa, S.J.S.; Borsa, A.; Nandigam, V.; Phan, M.; Lin, K.; Crosby, C.; Fricker, H.; Baru, C.; Lopez, L. OpenAltimetry—Rapid analysis and visualization of Spaceborne altimeter data. Earth Sci. Inform. 2022, 15, 1471–1480. [Google Scholar] [CrossRef]
  49. Gautam, V.K.; Gaurav, P.K.; Murugan, P.; Annadurai, M. Assessment of Surface Water Dynamicsin Bangalore Using WRI, NDWI, MNDWI, Supervised Classification and K-T Transformation. Aquat. Procedia 2015, 4, 739–746. [Google Scholar] [CrossRef]
  50. Özelkan, E. Water Body Detection Analysis Using NDWI Indices Derived from Landsat-8 OLI. Pol. J. Environ. Stud. 2020, 29, 1759–1769. [Google Scholar] [CrossRef]
  51. McFeeters, S.K. The use of the Normalized Difference Water Index (NDWI) in the delineation of open water features. Int. J. Remote Sens. 1996, 17, 1425–1432. [Google Scholar] [CrossRef]
  52. Acharya, T.D.; Subedi, A.; Lee, D.H. Evaluation of Water Indices for Surface Water Extraction in a Landsat 8 Scene of Nepal. Sensors 2018, 18, 2580. [Google Scholar] [CrossRef]
  53. Acharya, T.D.; Subedi, A.; Yang, I.T.; Lee, D.H. Combining Water Indices for Water and Background Threshold in Landsat Image. Proceedings 2018, 2, 143. [Google Scholar]
  54. Al-Muqdadi, S.W.H. Developing Strategy for Water Conflict Management and Transformation at Euphrates–Tigris Basin. Water 2019, 11, 2037. [Google Scholar] [CrossRef]
  55. Liu, C.; Hu, R.; Wang, Y.; Lin, H.; Zeng, H.; Wu, D.; Liu, Z.; Dai, Y.; Song, X.; Shao, C. Monitoring water level and volume changes of lakes and reservoirs in the Yellow River Basin using ICESat-2 laser altimetry and Google Earth Engine. J. Hydro-Environ. Res. 2022, 44, 53–64. [Google Scholar] [CrossRef]
  56. Iwaki, M.; Yamashiki, Y.; Toda, T.; Jiao, C.; Kumagai, M. Estimation of the Average Retention Time of Precipitation at the Surface of a Catchment Area for Lake Biwa. Water 2021, 13, 1711. [Google Scholar] [CrossRef]
  57. Abdelmohsen, K.; Sultan, M.; Save, H.; Abotalib, A.Z.; Yan, E.; Zahran, K.H. Buffering the impacts of extreme climate variability in the highly engineered Tigris Euphrates river system. Sci. Rep. 2022, 12, 4178. [Google Scholar] [CrossRef]
  58. Darvishi Boloorani, A.; Soleimani, M.; Papi, R.; Nasiri, N.; Neysani Samany, N.; Mirzaei, S.; Al-Hemoud, A. Assessing the role of drought in dust storm formation in the Tigris and Euphrates basin. Sci. Total Environ. 2024, 921, 171193. [Google Scholar] [CrossRef] [PubMed]
  59. Chao, N.; Luo, Z.; Wang, Z.; Jin, T. Retrieving Groundwater Depletion and Drought in the Tigris-Euphrates Basin Between 2003 and 2015. Ground Water 2018, 56, 770–782. [Google Scholar] [CrossRef] [PubMed]
  60. van Gent, S.N.T. Water Surface Heights in the Upper Brahmaputra and Nam Co Basin with ICESat-2; Delft University of Technology: Delft, The Netherlands, 2021. [Google Scholar]
  61. Al-Obaidi, M.A.; Al-Timimi, Y.K. Change detection in mosul dam lake, north of iraq using remote sensing and gis techniques. Iraqi J. Agric. Sci. 2022, 53, 38–47. [Google Scholar] [CrossRef]
  62. Suwanprasit, C.; Srichai, N. Impacts of spatial resolution on land cover classification. Proc. Asia-Pac. Adv. Netw. 2012, 33, 39. [Google Scholar] [CrossRef]
  63. Mishra, V.N.; Prasad, R.; Kumar, P.; Gupta, D.K.; Dikshit, P.K.S.; Dwivedi, S.B.; Ohri, A. Evaluating the effects of spatial resolution on land use and land cover classification accuracy. In Proceedings of the 2015 International Conference on Microwave, Optical and Communication Engineering (ICMOCE), Odisha, India, 18–20 December 2015; pp. 208–211. [Google Scholar]
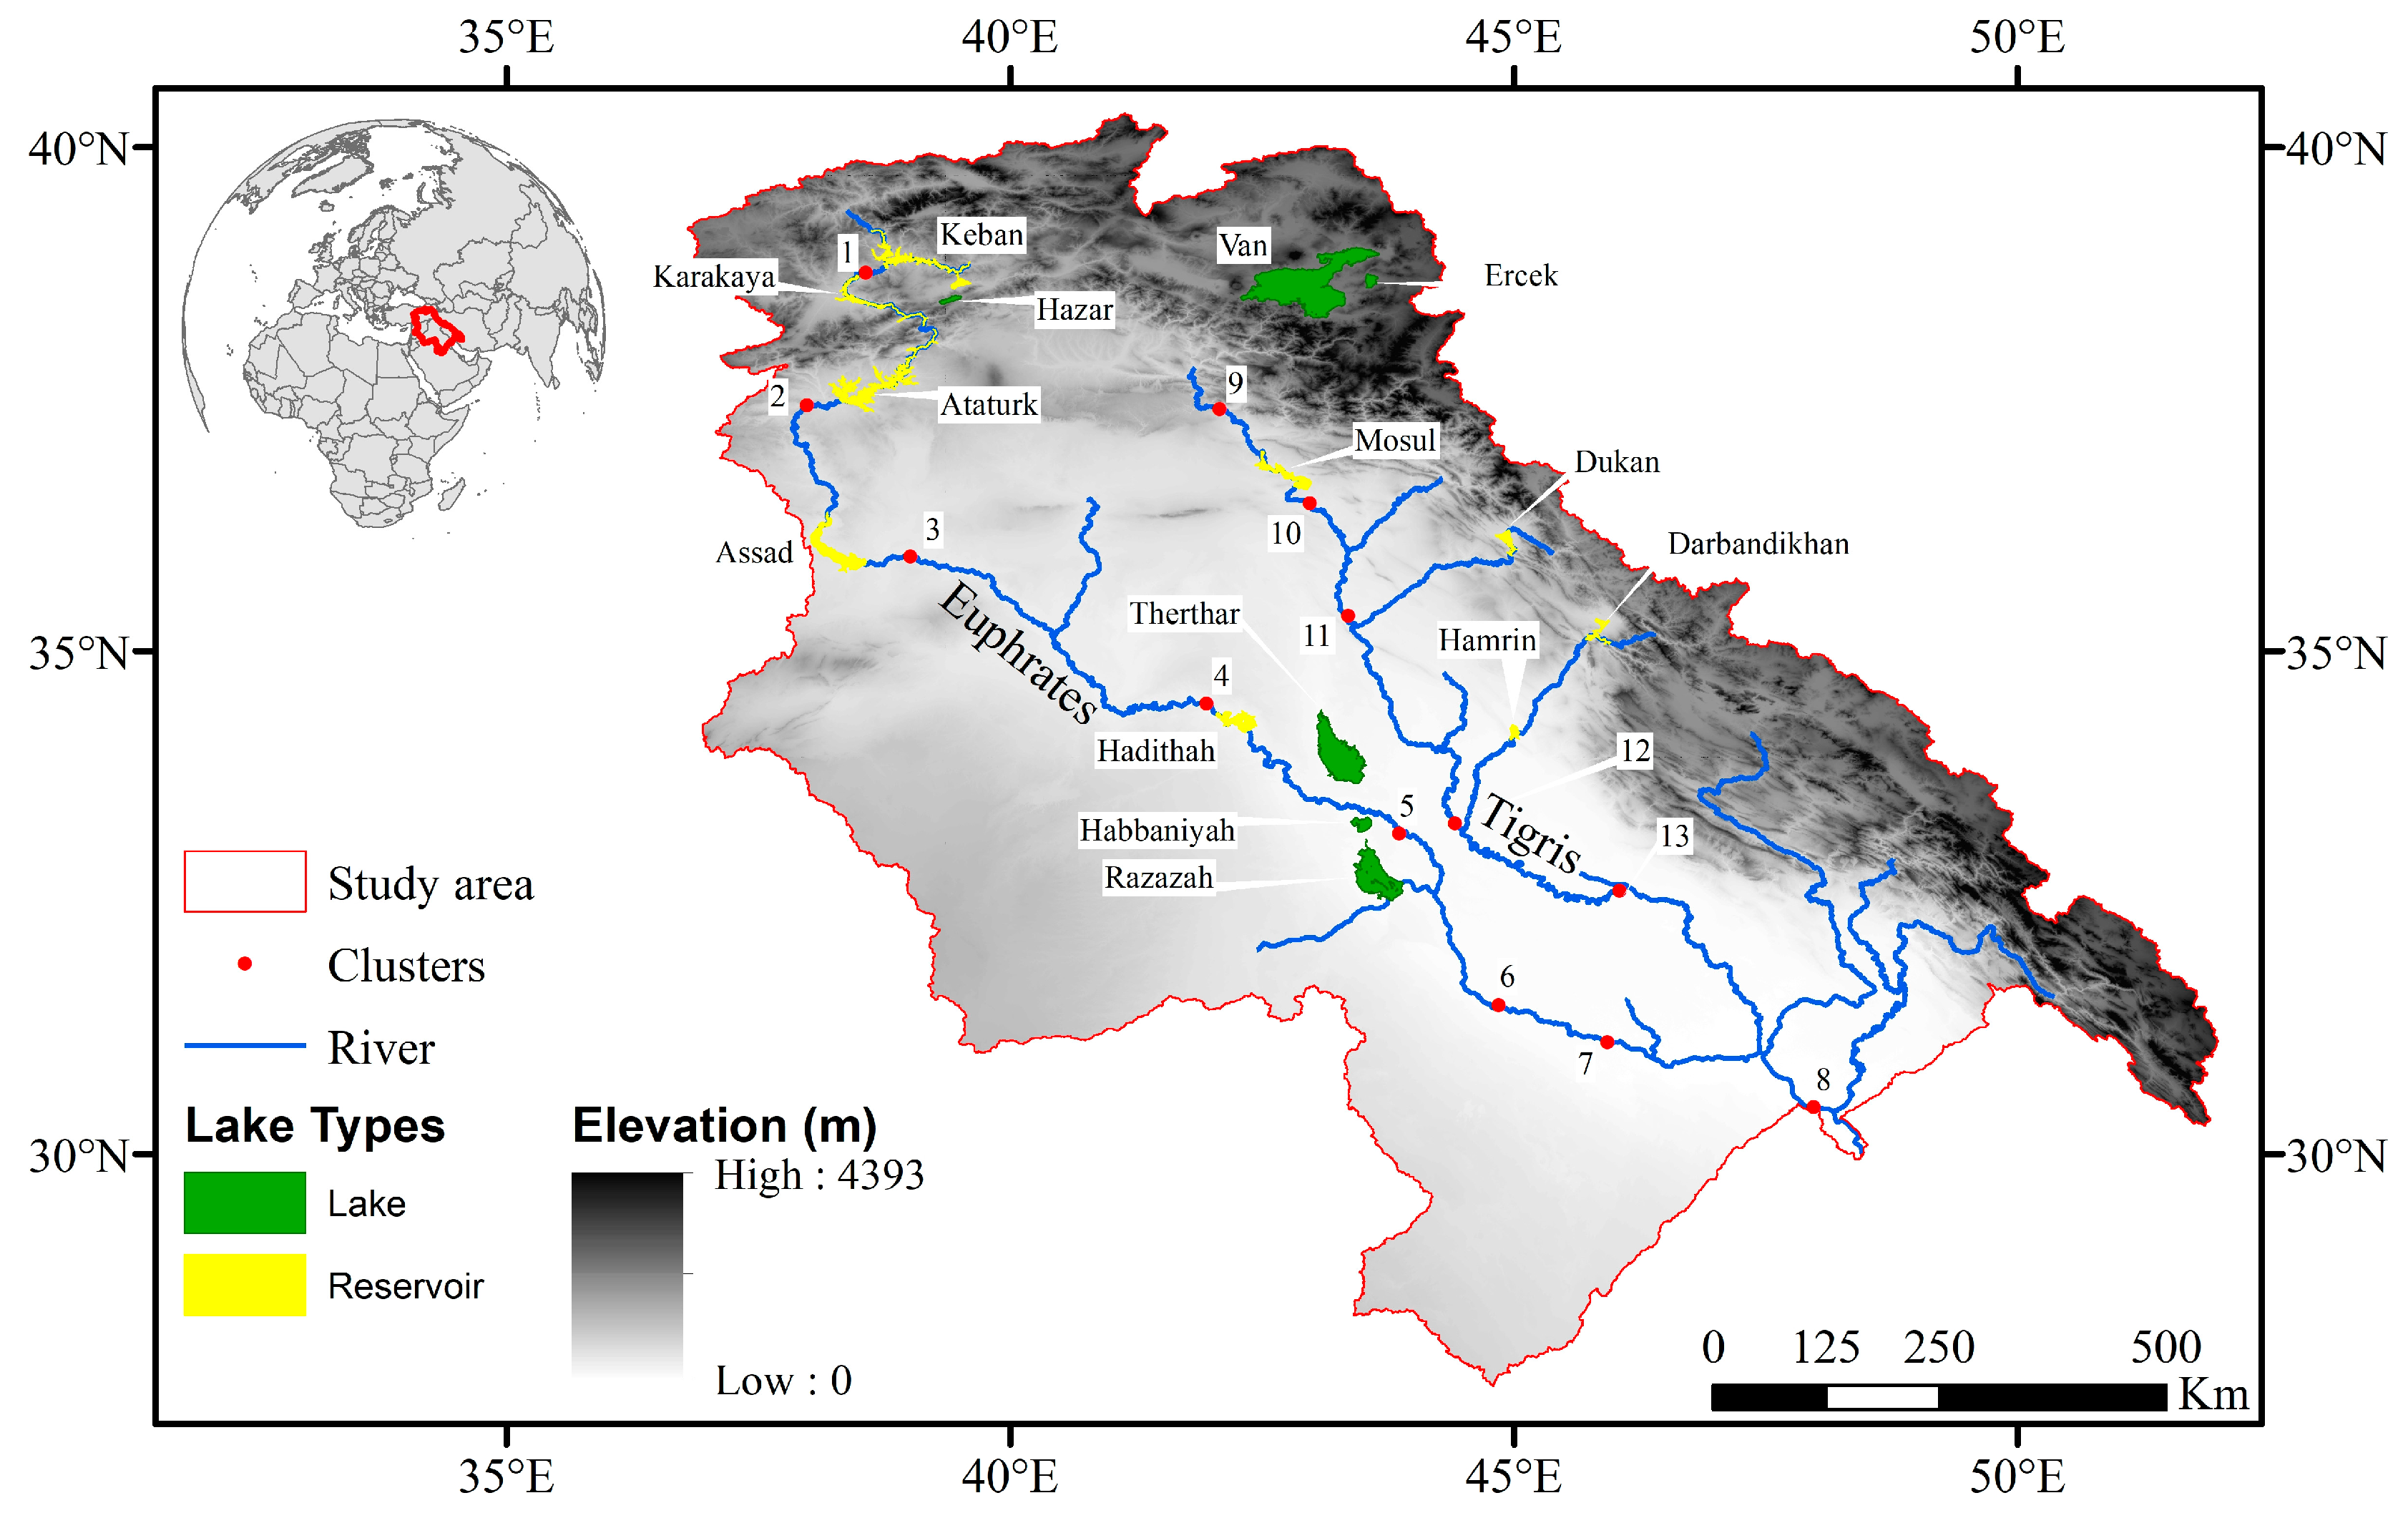
Figure 1. The study area consists of the Euphrates–Tigris basin, in addition to the endorheic basins of Lake Van and Lake Ercek. Clusters represent areas selected for determining water levels in rivers.
Remotesensing 17 02913 g001
Figure 2. The flowchart of the study.
Remotesensing 17 02913 g002
Figure 3. Time series and trends of the water level at different locations along the Euphrates River. The black dots represent the water heights detected by ICESat-2 and the blue line represents trends.
Remotesensing 17 02913 g003
Figure 4. Time series and trends of water levels at different locations along the Tigris River. The black dots represent the water heights detected by ICESat-2 and the blue line represents the trend.
Remotesensing 17 02913 g004
Figure 5. Time series and trends of water levels of six natural lakes in the study area. The black dots represent the water levels detected by ICESat-2 and the blue line represents the trend.
Remotesensing 17 02913 g005
Figure 6. Changes in lake and reservoir area in the Euphrates–Tigris basin. Top: water bodies colored by area change.
Remotesensing 17 02913 g006
Figure 7. Shows the precipitation level and water surface area graphs of selected lakes and dams. The red dots indicate the calculated water areas and levels, the red lines show the trends of the water areas and levels, the black columns show the daily precipitation amounts, and the blue lines show the precipitation trend. (a) Dukan Reservoir, (b) Hadithah Reservoir, (c) Therthar Lake, and (d) Keban Reservoir.
Remotesensing 17 02913 g007
Figure 8. The number of passings of ICESat-2 per lake, reservoir, and river cluster in four years.
Remotesensing 17 02913 g008
Figure 9. (a) Area with a single pass for Cluster-4. (b) Area with two passes for Cluster-11. Red lines are ICESat-2 ground track.
Remotesensing 17 02913 g009
Figure 10. Water level and water area variations for selected lakes and reservoirs obtained from HydroWeb (blue dots) and from this study (red dots).
Remotesensing 17 02913 g010
Figure 11. Graph showing the relationship between the HydroWeb data and the results of this study.
Remotesensing 17 02913 g011
Table 1. Water level comparisons of our study and HydroWeb with Khalaf [23] for the Hamrin Reservoir.
Our StudyHydroWebKhalaf [23] StudyDifferences
DateLevel (m)DateLevel (m)DateLevel (m) *OurHydroWeb
18 December 2019100.13110 December 201910018 December 2019100.403−0.27−0.40
9 February 202099.9692 February 202099.884 February 2020100.276−0.31−0.40
17 June 202098.10116 June 202097.9811 June 202098.398−0.30−0.42
8 August 202097.7329 August 202097.6114 August 202097.872−0.14−0.26
* Official departments.
Table 2. Date, data number, and area information of lakes and reservoirs in the study area as a result of the joint use of Sentinel-2A/B imagery.
Lake/ReservoirFirst DateLast DateNr. of DatesMean Area (km2)Min. Area (km2)Max. Area (km2)
Assad8 January 201828 December 2022179731.94657.52794.24
Atatürk18 May 20183 November 2022118755.24698.73805.86
Darbandikhan19 January 201929 December 202214248.9632.6880.35
Dukan18 March 201819 December 2022259181.80131.97255.11
Ercek2 April 201830 December 2022204112.04106.04144.76
Habbaniyah16 February 20192 December 2022120275.26150.76380.11
Hadithah2 January 20195 December 202290371.57119.66464.52
Hamrin15 December 201829 December 2022169126.0121.57281.05
Hazar7 February 201813 November 202212979.0078.0979.52
Karakaya13 April 201824 October 2022120201.29181.23241.87
Keban12 June 201913 November 202295511.76425.93615.72
Mosul7 January 201830 December 2022313254.41120.14314.32
Razazah28 December 20182 December 2022142379.03158.26616.56
Therthar7 January 20192 November 20221391939.741559.142307.26
Van29 June 201813 July 2022173571.193557.453579.05
Table 3. Comparison of water area estimated by Khalaf (2022) and our study for the Hamrin Reservoir.
Our StudyKhalaf’s (2022) StudyDifference
DateArea (km2)DateArea (km2)
10 November 2019258.8315 October 2019264.617−5.784
20 November 2019233.5916 November 2019232.5950.992
20 December 2019229.5118 December 2019226.8022.707
4 January 2020210.193 January 2020206.5583.627
3 February 2020225.894 February 2020212.77413.118
23 May 2020182.8223 March 2020200.519−17.699
No dataNo data8 April 2020196.512No data
13 May 2020 185.8310 May 2020174.83310.994
12 June 2020174.9511 June 2020159.53515.415
12 July 2020171.4613 July 2020154.56216.901
16 August 2020158.6314 August 2020152.1866.443
20 September 2020141.4215 September 2020140.2021.222
Disclaimer/Publisher’s Note: The statements, opinions and data contained in all publications are solely those of the individual author(s) and contributor(s) and not of MDPI and/or the editor(s). MDPI and/or the editor(s) disclaim responsibility for any injury to people or property resulting from any ideas, methods, instructions or products referred to in the content.