Abstract
As coastal tidal flats—ecosystems of high ecological significance and socio-economic value—face accelerating degradation driven by climate change and intensified anthropogenic disturbances, there is an urgent need for efficient, automated, and scalable monitoring solutions. Traditional monitoring approaches are constrained by high implementation costs and limited spatial coverage, whereas remote sensing—particularly multispectral satellite imagery such as Sentinel-2—has emerged as a primary and widely adopted tool for large-scale environmental observation. Building upon recent advancements in cloud computing and WebGIS technologies, this study presents a web-based, interactive tidal flat extraction system implemented on Alibaba’s AI Earth platform. The system integrates multiple water indices (NDWI, mNDWI, and IWI) with a machine learning algorithm (Random Forest), and is deployed through a user-friendly interface developed using Vue.js and Leaflet, enabling flexible parameter configuration and real-time visualization of extraction results. Its front-end/back-end decoupled architecture enables non-programming users to conduct large-scale tidal flat mapping, thereby substantially lowering the technical barriers to coastal tidal flat monitoring and management in China.
1. Introduction
Wetlands are among Earth’s most essential ecosystems, often referred to as the “planetary kidneys” for their indispensable roles in regulating the hydrological cycle, mitigating climate change, sustaining biodiversity, and purifying water quality [1]. Among these ecosystems, coastal tidal flats function as critical transitional zones between terrestrial and marine environments, providing substantial ecological and socio-economic benefits through wave energy dissipation, shoreline stabilization, groundwater recharge, and the provision of vital habitats [2]. In China, the Second National Wetland Resources Survey reported approximately 57,960 km2 of coastal tidal flats, representing about 11% of the country’s total wetland area [3]. However, these ecologically significant areas are undergoing rapid degradation driven by the combined impacts of climate change–induced sea-level rise [4] and intensive anthropogenic activities, such as land reclamation and port development [5], thereby underscoring the urgent need for advanced monitoring solutions to inform and support conservation efforts.
The limitations of traditional wetland monitoring approaches–replying primarily on field surveys and aerial photography [6] have become increasingly evident, constrained by high operational costs and limited spatial coverage. This shift has contributed to the growing prominence of satellite-based remote sensing, particularly through the utilization of multispectral imagery from platforms such as Landsat [7] and Sentinel-2 [8]. These datasets have proven indispensable for assessing wetland dynamic, owing to their temporal consistency, global coverage, and spectral discrimination capabilities [9,10,11,12,13,14]. Notable advancements in this field include the work of Kaplan et al., who achieved high-precision wetland classification (Kappa = 0.95) in Turkey’s Sakarbasi Wetland by integrating Sentinel-2 imagery with NDVI and NDWI indices [15], as well as the study by Wang et al., which provided a comprehensive analysis of China’s coastal tidal flat dynamics from 1986 to 2016 using Landsat imagery [16]. Further contributing to this progress, Chen et al. generated a 10 m-resolution map of China’s coastal tidal flats for the year 2020 using Sentinel-2 imagery [17], while the Wetland Area and Dynamics for Methane Modeling (WAD2M) global wetland dataset, developed by Zhang’s team [18], has substantially advanced standardized, multi-scale wetland research. In recent years, machine learning techniques have been increasingly employed in wetland classification, owing to their capacity to process high-dimensional datasets and adapt to heterogeneous landscape conditions. Among these methods, Random Forest has been widely recognized for its robustness to noise, low sensitivity to parameter tuning, and strong capability to effectively process diverse spectral and textural features [19,20]. Moreover, studies have demonstrated that integrating physically interpretable indices—such as the Normalized Difference Water Index (NDWI) and its modified form (mNDWI)—with Random Forest classification can enhance both accuracy and generalization, particularly in optically complex environments such as coastal tidal flats [21,22].
The advent of cloud computing technologies has catalyzed a paradigm shift in remote sensing workflows. Among these platforms, Google Earth Engine (GEE) [23] stands out as a representative example, leveraging distributed computing to process extensive archives of Landsat and MODIS imagery, thereby enabling a broad spectrum of environmental monitoring applications. By harnessing distributed computing capabilities to process vast collections satellite datasets including Landsat and MODIS imagery, GEE has facilitated groundbreaking applications in monitoring surface water dynamics [24] and mapping agricultural land [25,26,27,28]. The platform’s potential for large-scale ecological monitoring was further exemplified by Hird et al., who developed a wetland mapping system in Canada that integrated GEE with LiDAR data [29]. However, practical challenges arise for users in mainland China, where GEE’s overseas server deployment leads to substantial data access latency and poses compliance concerns, thereby considerably limiting its domestic adoption.
In response to these limitations, and to better address regional remote sensing needs, Alibaba DAMO Academy launched the AI Earth platform [30]. This innovative platform integrates multi-source remote sensing datasets, including Landsat and Sentinel-2 archives, and provides comprehensive image processing and intelligent analysis capabilities, such as image classification, object detection, and change detection. The platform’s flexible access via a Python SDK and Web API, combined with superior network stability, localized services, and native Chinese language support, offers distinct advantages over GEE for Chinese researchers. Particularly noteworthy is its seamless integration with Alibaba Cloud’s computing infrastructure and Object Storage Service (OSS), enabling end-to-end management of the analytical workflow— from data acquisition to processing, storage, and visualization. Furthermore, AI Earth lowers the barrier to remote sensing analysis by offering an intuitive graphical user interface and configurable algorithm modules, thereby making advanced geospatial analysis accessible to users without programming expertise.
The ongoing evolution of WebGIS technologies has further accelerated the shift in remote sensing systems toward lightweight, platform-oriented architectures. Compared with traditional on-premises GIS solutions, browser/server (B/S) architectures provide greater flexibility and scalability for managing remote sensing data, orchestrating algorithm services, and visualizing results [31]. This architectural shift has already proven successful across multiple domains, including precision agriculture, urban planning [32], and watershed monitoring [33]. A representative example is the RiceMapEngine system, which leverages GEE’s capabilities to produce high-precision rice paddy maps through time-series NDVI analysis while remaining accessible to users without programming expertise [25].
Building on recent technological advancements, this study focuses on tidal flats as critical components of coastal ecosystems, playing fundamental roles in shoreline management, ecological restoration, and resource monitoring. However, important gaps persist: traditional wetland monitoring approaches replying on field surveys and aerial photography are costly and spatially constrained; multispectral satellite-based methods—while offering consistent, large-scale coverage—can still encounter spectral confusion in complex coastal environments with dynamic water–land boundaries. Furthermore, many existing open-source tools—such as Google Earth Engine–based mapping platforms [15,21,25] and regional Chinese approaches that typically reply on single-algorithm workflows—either provide limited spatial coverage or lack standardized, scalable pipelines suitable for nationwide, long-term operations, with localization and compliance constraints further complicating deployment in mainland China.
To address these methodological and operational gaps, this study focuses on tidal flats as critical components of coastal tidal flat systems that play fundamental roles in shoreline management, ecological restoration, and resource monitoring. We present the development of a web-based remote sensing extraction system specifically de-signed for national-scale tidal flat monitoring. By harnessing the robust computational capabilities of the AI Earth platform, our system integrates multiple tidal flat extraction algorithms and water body indices within an intelligent workflow that incorporates Vue.js and Leaflet technologies for interactive visualization. Specifically designed to meet the needs of researchers, resource managers, and ecological monitoring personnel who may lack extensive programming skills, the system implements a comprehensive “data as a service, algorithms as a service, results as visualization” paradigm. This approach provides practical, low-threshold technical support for coastal tidal flat monitoring in China while maintaining scientific rigor and operational efficiency.
2. Methods
The methodological framework of this national-scale tidal flat monitoring system integrates three synergistic components: (1) a cloud-based computational infrastructure, (2) multi-algorithm extraction methodologies, and (3) interactive visualization modules. This integrated approach tackles critical challenges in large-scale wetland mapping, including data volume management, processing efficiency, and result interpretability.
2.1. Platforms and Data
The system’s operational efficacy relies on the coupling of advanced cloud computing resources with standardized Earth observation datasets. The AI Earth platform was selected as the computational backbone for its proven capability in handling petabyte-scale geospatial analyses, while Sentinel-2 Level-2A surface reflectance products serve as the primary data source, ensuring consistent spectral characterization of tidal dynamics.
2.1.1. AI Earth Platform
This study employs the AI Earth platform (https://engine-aiearth.aliyun.com), a cloud-based remote sensing analysis environment developed by Alibaba DAMO Academy. The platform offers comprehensive geospatial data processing capabilities by integrating multi-source satellite datasets—including the complete Landsat and Sentinel-2 archives—with machine learning algorithms for large-scale analysis.
The platform’s architecture provides three key technical advantages for tidal flat monitoring: (1) a distributed computing infrastructure that enables efficient processing of nationwide datasets, (2) standardized API interfaces supporting both programmatic access and preconfigured analytical functions, and (3) automated pipelines for data retrieval, preprocessing, and product generation. Collectively, these capabilities address the computational challenges inherent in large-scale coastal tidal flat mapping.
Within our implementation, the platform performs three critical functions. First, it manages the acquisition and preprocessing of Sentinel-2 imagery through its DataCube service, applying radiometric calibration and atmospheric correction. Second, it executes the core tidal flat extraction algorithms via its Algorithm Service, supporting both threshold-based and machine learning approaches. Third, it enables result storage and visualization through integration with cloud-based storage solutions.
The platform’s analytical toolkit includes specialized functions for image classification, change detection, and feature extraction, all accessible through well-documented RESTful APIs. This design allows our system to retain flexibility in algorithm selection while ensuring consistent processing across different study areas. The combination of computational scalability and methodological versatility renders the platform particularly well-suited for operational coastal monitoring applications.
2.1.2. Sentinel-2 Data
The study employs Sentinel-2 Level-2A (L2A) surface reflectance products from the European Space Agency (ESA), generated through atmospheric correction of Level-1C top-of-atmosphere imagery. These products provide 13 spectral bands spanning the visible to shortwave infrared range, with spatial resolutions of 10 m (bands 2, 3, 4, 8), 20 m (bands 5–7, 8A, 11, and 12), and 60 m (bands 1, 9, and 10). The radiometric consistency and reduced atmospheric interference make the surface reflectance values particularly suitable for tidal flat extraction.
Sentinel-2 L2A data serve as the primary data source for this study due to their combination of high spatial resolution, multispectral capability, and a 5-day revisit cycle. The green (band 3), near-infrared (band 8), and shortwave infrared (bands 11–12) bands are particularly valuable for calculating water indices, including the Normalized Difference Water Index (NDWI) [34], Modified NDWI (mNDWI) [35], and Improved Water Index (IWI) [36], which enhance the discrimination of tidal flats from other land cover types. The included quality assessment masks, particularly the Scene Classification Layer, facilitate automated detection of cloud shadows during preprocessing.
All Sentinel-2 L2A data used in this study were obtained from the ESA Copernicus Open Access Hub (https://browser.dataspace.copernicus.eu/) and Alibaba Cloud’s AI Earth platform. The dataset spans multiple years to support long-term coastal tidal flat monitoring; however, the present analysis focuses exclusively on the years 2020 and 2024 to provide representative temporal snapshots for comparative assessment. The data retrieval process applied spatial, temporal, and cloud-cover filters to ensure optimal image quality. For 2020, applying a cloud-cover threshold of less than 60% yielded 6901 scenes covering the entire Chinese coastline; for 2024, under the same threshold (<60%), a total of 6572 scenes were obtained. The monthly distribution of these scenes (Figure 1) illustrates the temporal availability of usable imagery in both years, highlighting seasonal variations that could influence tidal flat detection performance.
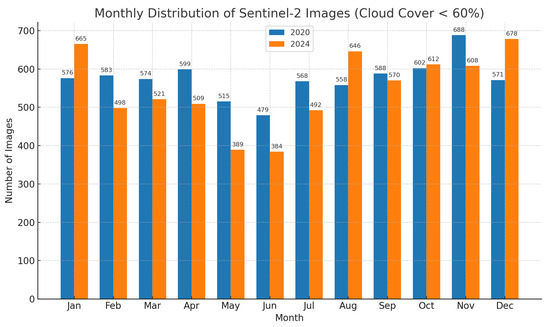
Figure 1.
Monthly Distribution of Sentinel-2 Images in 2020 and 2024.
2.1.3. Vector Data
The study incorporates two categories of authoritative vector datasets to support coastal zone analysis: (1) hierarchical administrative boundaries for China (provincial, municipal, and county levels; 2024 edition) and (2) digitized coastline data from official sources. These datasets serve as foundational geographic references for both spatial analysis and the jurisdictional management of tidal flat resources. The administrative boundary data enable three critical functions: (a) spatial delineation of analysis units, (b) hierarchical aggregation of tidal flat statistics, and (c) comparative assessment across administrative regions.
All vector datasets were obtained from the Tianditu Geospatial Public Service Platform (https://www.tianditu.gov.cn/), China’s national geospatial data infrastructure maintained by the Ministry of Natural Resources. This source ensures both temporal relevance, with quarterly updates, and compliance with national mapping standards (GB/T 20257.1-2017 [37]).
The system incorporates a dynamic buffering tool that generates variable-width coastal zones (default: 5 km landward and 15 km seaward) based on user-defined parameters. This functionality supports customized analytical scenarios while ensuring topological consistency with the underlying vector datasets. Automated area calculations within these buffers incorporate tidal flat extent data to generate statistically robust outputs for change analysis and management applications.
2.2. System Architecture Design
The system architecture adopts a conventional front-end/back-end separation design, organized into four primary layers (Figure 2): the Presentation Layer, Application Layer, Business Logic Layer, and Data Access Layer. This layered architecture enables the complete web-based execution of coastal tidal flat extraction and visualization processes at national scales through standard browser interfaces.
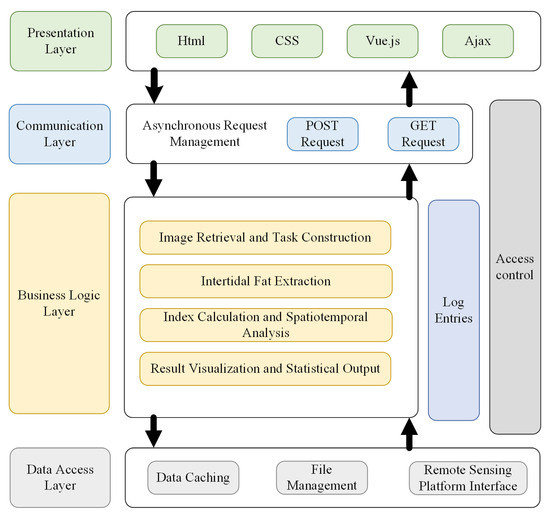
Figure 2.
Four-tier system architecture of the national-scale coastal tidal flat extraction platform. Arrows indicate data flow, and colors distinguish different functional layers.
The Presentation Layer is implemented using the Vue.js framework [38], integrating conventional web components with geospatial visualization elements. This layer incorporates functional modules for task creation, parameter configuration, layer management, and result display. Map rendering is implemented using the Leaflet library [39], supporting interactive operations such as region-of-interest delineation, temporal range selection, and algorithm parameter configuration.
The Application Layer manages client-side logic and state, employing client-side routing mechanisms to enable seamless navigation between functional modules. Vuex-based state management ensures consistent synchronization of user inputs across interface components, including dataset selection, temporal ranges, index type, and user-uploaded samples. Client-server interaction is facilitated through standard Ajax mechanisms, with well-encapsulated GET and POST requests used for task configuration submission and result retrieval. The Vuex [40] state management system maintains synchronization of all critical parameters—including dataset selections, temporal ranges, index types, and user-uploaded samples—ensuring data consistency throughout the processing workflow.
The Business Logic Layer is developed using the Django framework [41], providing a complete set of RESTful API interfaces [42] for front-end integration. This layer handles essential functions such as task parameter parsing and validation, request routing, access control, operation logging, and execution status monitoring. The core processing modules encompass the complete tidal flat analysis workflow, from image retrieval and index calculation to spatial analysis and statistical computation. The system implements asynchronous task execution using thread pooling mechanisms to ensure responsive performance during concurrent operations.
The Data Access Layer integrates local database storage with remote processing platform connectivity. Structured data management is implemented using PostgreSQL with PostGIS [43] extension for storing task metadata, user information, and spatial extents. Remote sensing processing is delegated to the AI Earth platform via its Python SDK, which handles image retrieval, preprocessing, and classification tasks. During system initialization, authenticated connections are established to ensure secure and coordinated execution of multi-user requests [44].
User interactions with the front-end interface—including spatial delineation, parameter configuration, and algorithm selection—are systematically translated into standardized back-end requests. These requests invoke corresponding processing functions, such as the compute_index operation which automatically assembles the appropriate spectral band combinations based on the selected water indices. The tidal flat extraction module integrates multiple classification approaches, including Otsu thresholding and Random Forest algorithms, with adaptive parameterization to accommodate diverse coastal environments and varying analysis requirements.
This architecture has demonstrated strong performance in supporting nationwide coastal tidal flat monitoring, effectively balancing interactive responsiveness with computational throughput for large-scale geospatial analyses. The design maintains a rigorous separation of concerns while ensuring seamless integration between components, providing a robust foundation for both operational monitoring and research applications.
2.3. Tidal Flat Satellite Remote Sensing Extraction Algorithm
This study focuses on unvegetated tidal flats, excluding intertidal areas with substantial vegetation cover, such as mangroves and saltmarshes.
The tidal flat extraction system implements two independent and alternative classification approaches on the Alibaba Cloud AI Earth platform, as illustrated in Figure 3. The first approach applies empirical water indices with adaptive thresholding, whereas the second employs a supervised Random Forest classifier. This dual-method architecture offers flexibility to accommodate diverse application scenarios through an interactive algorithm selection interface.
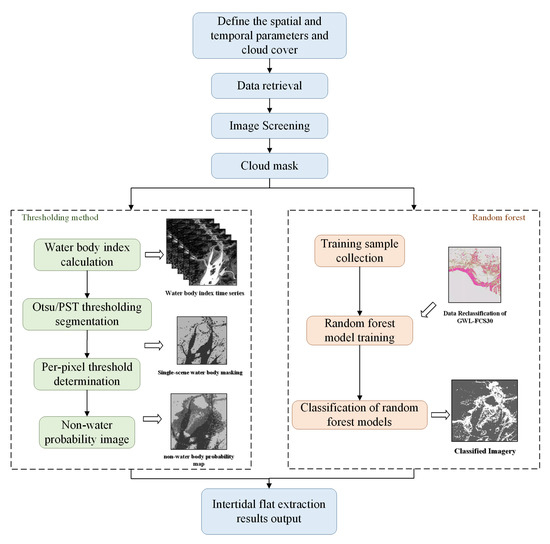
Figure 3.
Workflow of tidal flat extraction combining thresholding (green) and Random Forest (orange) methods, with shared preprocessing steps (blue). Arrows indicate the sequential flow of data processing.
Both classification approaches share a standardized preprocessing workflow. The system automatically retrieves Sentinel-2 imagery based on user-specified parameters, including the region of interest, temporal range, and maximum cloud-cover percentage. Cloud masking is performed using the MSK_CLDPRB band to remove contaminated pixels, followed by spatial cropping to the study area boundaries and conversion to surface reflectance values. An automated quality control procedure evaluates each image based on valid pixel coverage and water area proportion, excluding those that do not meet predetermined quality thresholds.
The water index method combines multiple spectral indices, including the Modified Normalized Difference Water Index (mNDWI), with optimized thresholding techniques. The Random Forest approach performs supervised classification using training samples representative of diverse coastal environments. Users can select either method through the system interface, after which all subsequent processing is automatically executed by the platform. This integrated workflow ensures consistent and reliable tidal flat extraction while accommodating diverse user requirements and varying environmental conditions.
2.3.1. Thresholding Method for Water Body Extraction
Following preprocessing, the system calculates three key water indices for each processed image: the Normalized Difference Water Index (NDWI), Normalized Difference Vegetation Index (NDVI), the Modified Normalized Difference Water Index (mNDWI), and Improved Water Index (IWI). These indices are mathematically derived from specific band combinations of the Sentinel-2 imagery, as formally defined in Table 1. The indices are designed to enhance the spectral separability between tidal flats and adjacent land cover types by exploiting distinct reflectance characteristics in the visible and infrared wavelengths.

Table 1.
Mathematical formulations of the spectral indices employed in this study.
The thresholding process offers two independent algorithms—Otsu and Peak Start Threshold (PST)—either of which can be selected to convert continuous index values into binary water/non-water classifications. These methods are implemented as separate options rather than being combined within a single workflow. The Otsu method, a global thresholding technique, automatically determines the optimal separation point by maximizing inter-class variance in the histogram distribution. While effective in many coastal environments, this method has limitations in complex landscapes where the assumption of a bimodal histogram distributions may not hold.
To address this limitation, the system implements an alternative Peak Start Threshold (PST) method, designed to improve classification in heterogeneous coastal zones. The PST approach is based on NDVI histogram analysis from Sentinel-2 imagery, supported by UAV hyperspectral validation. In typical coastal NDVI histograms, three distinct peaks are often observed: (i) low values for water bodies, (ii) medium values for bare tidal flats, and (iii) high values for vegetated land. PST selects the starting point of the main land-related peak (ii) closest to zero NDVI as the water–land threshold, as the “low-value valley” between peaks (i) and (ii) corresponds to shoreline and transition zones confirmed by UAV observations. This thresholding strategy enables robust separation even where water and land classes overlap spectrally, with detailed methodological considerations reserved for a dedicated technical publication.
The temporal analysis component aggregates classification results from multiple images within the specified time window to generate a probability surface. This “Non-Water Body Occurrence Probability Map” quantifies the persistence of exposed tidal flats by assigning a percentage value (0–100%) to each pixel, thereby providing a robust metric for assessing tidal flat stability and characterizing seasonal variation patterns. The resulting probability surface constitutes a valuable intermediate product, supporting both quantitative change detection analyses and the intuitive visualization of tidal flat dynamics.
2.3.2. Random Forest Classification Algorithm
The Random Forest classification approach employs the tidal flat class (ID: 187, Tidal flat) from the GWL_FCS30 [45] global wetland product as reference training data. The selected GWL_FCS30 dataset, which has an overall accuracy of 86.44%, is temporally consistent with the Sentinel-2 classification imagery, thereby eliminating potential temporal mismatches between the training samples and the target data. The implementation adopts a standardized supervised classification workflow within the AI Earth platform environment. Sentinel-2 multispectral imagery for the specified region of interest is spatially co-registered with the training dataset, from which representative samples are systematically derived.
The sample dataset is divided into training (80%) and validation (20%) subsets using stratified random sampling to preserve the proportional representation of each class. The platform’s built-in Random Forest classifier is subsequently trained using default hyperparameters (50 decision trees, Gini impurity criterion), and its performance is evaluated using standard accuracy assessment metrics, including overall accuracy, producer’s accuracy, and confusion matrix analysis.
Following model training and validation, the classifier is applied to produce binary tidal flat classification maps, where
- Class 1: Tidal flat areas.
- Class 0: Non-tidal flat areas.
The classification outputs are visualized within the web interface as overlays on true-color base imagery, facilitating immediate visual inspection and preliminary quality assessment. For subsequent analysis, the output products can be exported to the platform’s data storage system while preserving all original spatial resolution and associated attribute information. This capability facilitates subsequent time-series analysis and inter-regional comparisons, while ensuring full compatibility with other geospatial processing and analytical tools provided within the platform.
2.4. System Functional Modules
The system integrates three core functional modules, interconnected through unified data interfaces, to establish a seamless and complete processing workflow.
The Tidal Flat Remote Sensing Extraction Module offers comprehensive data processing capabilities, allowing users to define study areas via multiple approaches, including administrative boundary selection, vector file upload, and interactive region delineation. This module integrates key parameters such as temporal range, cloud cover threshold, water index selection, and algorithm configuration to execute tidal flat extraction. The system automates the entire workflow from data retrieval to result generation via the AI Earth platform, while simultaneously providing real-time feedback on processing status.
The Spatial Results Visualization Module provides a suite of interactive display capabilities designed to facilitate the analysis and interpretation of tidal flat distribution patterns. These functionalities include single-data image visualization, multi-temporal comparison, and swipe-based interactive tools, enabling users to examine spatial variations in tidal flat extent across different time periods. All visualization modes preserve geographic coordinate consistency, ensuring that spatial interpretations remain accurate and reliable across different display configurations.
The Statistical Chart Analysis Module fulfills quantitative assessment requirements by providing a suite of analytical and visualization capabilities. It produces interannual change curves to reveal long-term trends, generates annual comparison charts for period-to-period evaluations, and compiles spatial stratification statistics based on user-defined zoning schemes. All statistical results can be exported in standard formats, including PDF for reporting purposes and CSV for subsequent numerical analysis, thereby facilitating data sharing and collaborative research. These modules operate synergistically to support the entire workflow, from data acquisition through to final output generation.
2.5. System Interface Design
The map display panel (Figure 4A) functions as an interactive visualization canvas, presenting Sentinel-2 imagery as the base layer, overlaid with relevant vector boundaries and user-defined regions of interest. This spatial framework supports three complementary methods for defining regions of interest (ROIs): (1) administrative boundary selection via hierarchical dropdown menus (province → city → county), (2) manual delineation using polygon, rectangle, or circular drawing tools, and (3) vector file upload in standard formats (GeoJSON, Shapefile), with automatic coordinate system transformation to ensure accurate spatial alignment.
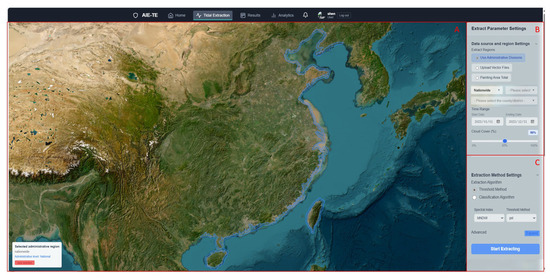
Figure 4.
User interface for tidal flat extraction task configuration ((A) Map view; (B) ROI selection; (C) Algorithm parameters).
The parameter configuration panel (Figure 4B,C) presents a logically grouped set of controls for:
- -
- Temporal parameters (start/end date selectors)
- -
- Data quality thresholds (cloud cover percentage slider)
- -
- Spectral index selection (radio button group)
- -
- Algorithm-specific settings (dynamic form rendering)
Notably, the cloud cover threshold function integrates both the standard MSK_CLDPRB band-based assessment and supplementary visual inspection tools, enabling users to preview the effective analysis area and make necessary adjustments prior to task submission. The algorithm configuration interface dynamically adjusts to user selections; for instance, choosing the thresholding method prompts the display of relevant index options and threshold adjustment controls, whereas selecting the Random Forest classifier reveals training sample management tools.
The system ensures state consistency across interface components through reactive data binding, whereby spatial selections automatically update parameter constraints (e.g., available image dates) and, conversely, parameter adjustments immediately reflect in the spatial context. This design minimizes user errors while preserving flexibility in analysis configuration, a feature particularly valuable for comparative studies requiring multiple parameter sets. Real-time feedback mechanisms—such as dynamically displaying the numbers of available images based on current filters—further enhance the user experience during task setup.
2.6. Validation Framework and Methods
The validation of the system’s operational performance and classification accuracy was designed to comprehensively evaluate its applicability and stability across different temporal phases and diverse geomorphological contexts. The evaluation framework consisted of two spatial levels:
National-scale validation (2020 & 2024)—covering 14 coastal provinces, municipalities, and autonomous regions along China’s eastern seaboard, namely Liaoning, Hebei, Tianjin, Shandong, Jiangsu, Zhejiang, Fujian, Guangdong, Guangxi, Hainan, Taiwan, Shanghai, Hong Kong, and Macau (Figure 5). The standardized belt-shaped study area extended 5 km inland and 15 km offshore from the coastline. All available Sentinel-2 Level-2A scenes from the respective years with cloud cover below 60% were used in the analysis. Accuracy assessment was conducted using an independent set of 8000 random validation points (4000 tidal flat and 4000 non-tidal flat) proportionally distributed across the national coastal extent. Classification performance was quantified using User’s Accuracy (UA), Producer’s Accuracy (PA), Overall Accuracy (OA), and the Kappa coefficient, calculated separately for 2020 and 2024 to enable direct interannual comparison.
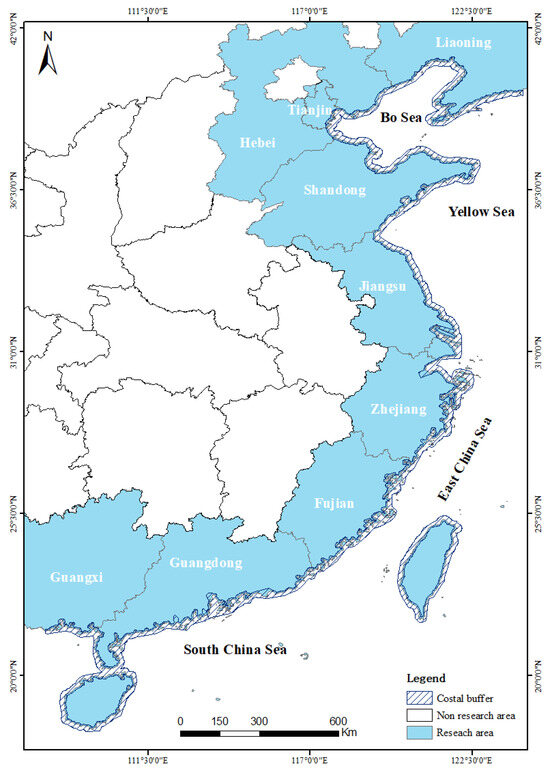
Figure 5.
Study areas covering 14 coastal provinces in China (5 km landward and 15 km seaward buffers from the coastline).
Local-scale validation and interannual area comparison—conducted in two representative bays in Zhejiang Province, Hangzhou Bay and Yueqing Bay, selected for their complex coastal geomorphology and diverse environmental conditions. The analysis utilized 165 Sentinel-2 scenes for Hangzhou Bay and 241 scenes for Yueqing Bay, all with cloud cover below 60%. Accuracy metrics (UA, PA, OA, Kappa) were computed for 2020, and a comparative analysis of tidal flat extent between 2020 and 2024 was carried out to quantify local-scale spatial changes.
Validation reference datasets—For both spatial scales, all validation points were cross-checked using high-resolution Google Earth imagery, Jilin-1 satellite data, and Sentinel-2 imagery from the same annual period to ensure temporal consistency and reduce classification uncertainty.
3. Results
This section presents the classification results produced by the proposed tidal flat extraction system, along with their accuracy evaluations at both national and local scales. The results also encompass inter-method comparisons, as well as visualization and statistical analysis outputs.
3.1. Validation of National Tidal Flat Extraction Results
3.1.1. National-Scale Accuracy Assessment
Based on the accuracy assessment using 8000 independent random validation samples nationwide (4000 tidal flat and 4000 non–tidal flat points), the system demonstrated comparable classification performance in 2020 and 2024, both maintaining a high level of accuracy (Table 2). In 2020, the user’s accuracy (UA) and producer’s accuracy (PA) for the tidal flat class were 98.70% and 96.99%, respectively, with an overall accuracy (OA) of 96.74% and a Kappa coefficient of 0.935. For 2024, the UA, PA, and OA were 98.81%, 97.06%, and 97.06%, respectively, with a Kappa coefficient of 0.939. The numbers of false positives (FP) and false negatives (FN) remained low in both years.
Table 2.
Confusion matrices for tidal flat classification in 2020 and 2024.
3.1.2. Provincial-Level Accuracy Assessment
Building on the national-scale results, provincial-level classification accuracies for 2020 were calculated from the independent set of 8000 validation points. These results revealed spatial variations among provinces, with some regions achieving consistently high accuracy across all strata, while others showed reduced accuracy in zones with complex shoreline morphology or higher turbidity (Figure 6).
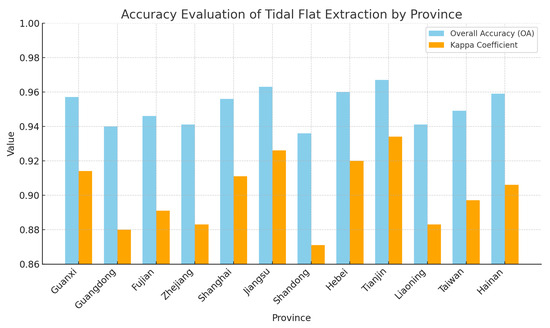
Figure 6.
Overall Accuracy (OA) and Kappa coefficients of tidal flat extraction across China’s coastal provinces.
Overall, the classification results across provinces demonstrate high accuracy, with Producer’s Accuracy (PA) values ranging from 92.48% (Shandong) to 96.85% (Tianjin), and User’s Accuracy (UA) between 94.57% and 96.57%. The Overall Accuracy (OA) remains above 93% for all provinces, with the highest observed in Tianjin (96.71%). Kappa coefficients consistently exceed 0.87, indicating strong agreement beyond chance. These results reflect the robustness of the classification method across different coastal regions, despite varying environmental and spectral conditions. Notably, provinces such as Tianjin, Jiangsu, and Guanxi exhibit particularly high consistency between reference and predicted data, underscoring the method’s reliability in diverse coastal settings.
3.2. Verification of Key Tidal Flat Extraction Results in Zhejiang Province’s Key Bay Area
3.2.1. Local-Scale Classification Accuracy
While the national-scale assessment offers a comprehensive overview of classification performance, additional local-scale validations were carried out in representative coastal environments to evaluate the system’s applicability under complex geomorphological features and intensive anthropogenic influences. For this purpose, two representative bays in Zhejiang Province—Hangzhou Bay and Yueqing Bay—were selected as local-scale case study sites.
Figure 7 illustrates the extraction results for Hangzhou Bay and Yueqing Bay. The system successfully delineated multi-scale morphological units and precisely identified secondary tidal flats. The local-scale classification achieved an accuracy of 96.60% (Kappa = 0.905) for Hangzhou Bay and 96.33% (Kappa = 0.916) for Yueqing Bay.
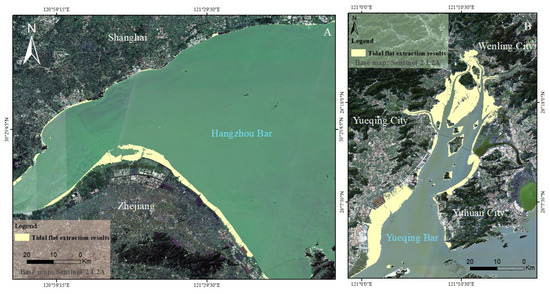
Figure 7.
Tidal flat extraction results in (A) Hangzhou Bay and (B) Yueqing Bay, Zhejiang Province (2020 Sentinel-2 data).
Spatial distribution analysis in Hangzhou Bay demonstrates that the system effectively captured the multi-level structural characteristics of tidal flats, accurately delineating typical morphological units such as nearshore small mudflats, estuarine extension zones, and outer sediment deposition belts. In Yueqing Bay, the system accurately extracted secondary tidal flats resulting from artificial reclamation and degraded aquaculture, demonstrating high-fidelity spatial detail and strong boundary discrimination capabilities.
3.2.2. Inter-Method Classification Difference Analysis
To assess the spatial consistency between the thresholding method and the Random Forest classification, difference maps were generated for both bays, and pixel-level statistical analysis was conducted using representative sample points. The analysis revealed that in Hangzhou Bay, 2,435,539 pixels exhibited consistent classifications between the two methods, whereas 214,990 pixels showed discrepancies, indicating a relatively high level of spatial agreement. In Yueqing Bay, out of a total of 1,327,788 pixels, approximately 90% (1,195,099 pixels) were consistently classified by both methods. The classification accuracy of Random Forest reached 95.68% in Hangzhou Bay and 95.23% in Yueqing Bay, confirming its generally reliable but comparatively weaker performance than thresholding in these estuarine environments.
A comprehensive analysis of the Hangzhou Bay and Yueqing Bay results indicates that the Random Forest (RF) outputs underperform the threshold-based method in these two bays, with discrepancies concentrated in typical land–water transition zones. In Hangzhou Bay, large areas of turbid water near the Qiantang River Estuary (Figure 8A) were misclassified due to the lower accuracy of the GWL_FCS30 product used for training. The inherited “tidal flat” samples from GWL_FCS30 contained classification errors, leading to both overestimation and omission of tidal flats in this estuarine region.
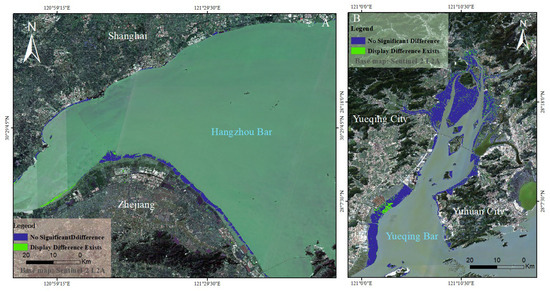
Figure 8.
Spatial distribution of classification differences between the thresholding method and the Random Forest classification for Hangzhou Bay (A) and Yueqing Bay (B).
In Yueqing Bay, most differences are located around the seawall and along tidal-flat edges (Figure 8B), where intensive aquaculture produces a complex mosaic of shallow ponds. The GWL_FCS30-derived training samples in these areas also included mislabeled features, causing RF to misclassify aquaculture ponds as tidal flats more frequently than the thresholding approach. Consequently, while both methods achieve high overall accuracy, RF yields lower accuracy than the thresholding method in these bay areas due to the training-label bias originating from GWL_FCS30.
3.2.3. Comparative Analysis of Hangzhou Bay and Yueqing Bay Between 2020 and 2024
A comparative assessment of the coastal wetland extraction results for 2020 and 2024 reveals distinct spatial–temporal variation patterns in Hangzhou Bay and Yueqing Bay (Figure 9 and Figure 10). In Hangzhou Bay, the stable tidal flat area was the largest, reaching 139.90 km2, accounting for the dominant proportion of the bay’s total tidal flat extent. The newly formed tidal flats covered approximately 101.12 km2, markedly exceeding the lost tidal flat area of 48.78 km2, indicating a net expansion trend. This expansion may be attributed to intensified sediment deposition, hydrodynamic alterations in the estuary, and the combined effects of land reclamation and other anthropogenic activities.
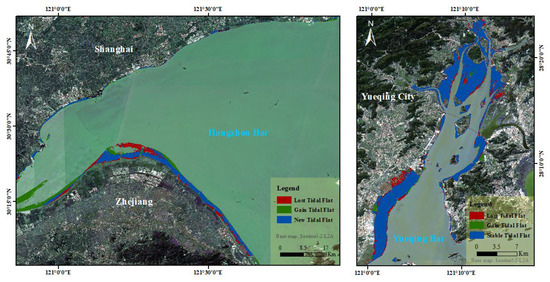
Figure 9.
Spatial distribution of tidal flat changes (stable, gain, and loss) in Hangzhou Bay and Yueqing Bay between 2020 and 2024.
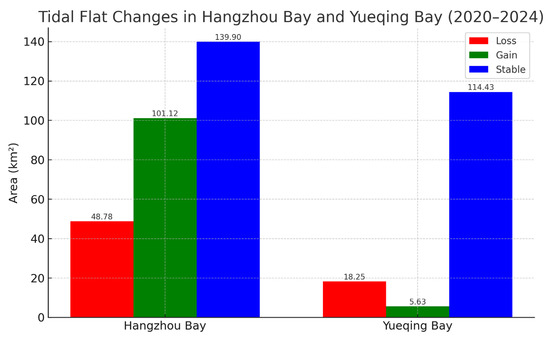
Figure 10.
Statistical comparison of tidal flat changes (stable, gain, and loss) in Hangzhou Bay and Yueqing Bay between 2020–2024.
In contrast, Yueqing Bay exhibited relatively higher stability during the study period. Its stable tidal flat area measured 114.43 km2, while newly formed tidal flats accounted for only 5.63 km2, and lost tidal flats covered 18.25 km2, reflecting a slight net contraction. The comparatively low level of change may be related to the bay’s semi-enclosed hydrodynamic environment and reduced human disturbance.
Overall, the dynamics of tidal flat change were more pronounced in Hangzhou Bay than in Yueqing Bay, suggesting that the morphological evolution of these tidal flat systems responds differently to both natural and anthropogenic drivers. These findings provide valuable insights into region-specific coastal wetland response mechanisms and offer scientific support for targeted conservation and management strategies.
3.3. Visualization and Statistical Analysis of Results
The system offers an integrated visualization and analysis interface for presenting tidal flat extraction results (Figure 11). Extraction outputs are visualized as semi-transparent overlays on base satellite imagery, with customizable rendering modes and interactive pixel value histograms that illustrate the probability distributions of tidal flat exposure. A swipe tool enables side-by-side comparison between the original imagery and processed results, supporting intuitive visual assessment of methodological performance and temporal changes.
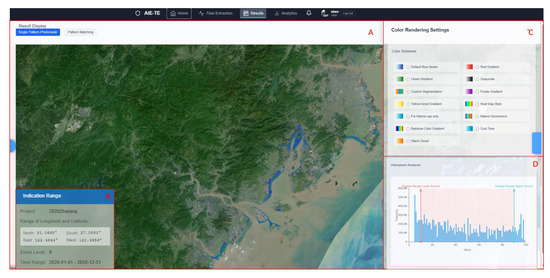
Figure 11.
Visualization of tidal flat extraction results ((A) Probability mask overlay; (B) Project Information Panel; (C) Layer control panel; (D) Pixel value histogram).
Quantitative analysis tools produce temporal trend graphs and provincial comparison bar charts, with interactive linkage between visualizations and spatial views—selecting a specific time point in a graph dynamically updates the map to display the corresponding spatial distribution (Figure 12). Analytical outputs can be exported in publication-ready image and CSV formats, facilitating subsequent reporting, dissemination, and in-depth analysis.
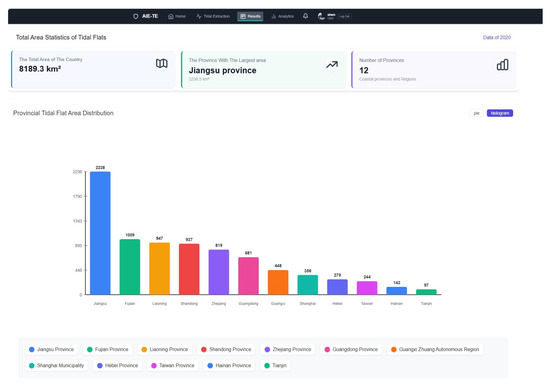
Figure 12.
Bar chart of tidal flat areas by coastal province in 2020 (based on Sentinel-2 extraction results).
4. Discussion
Although the system was specifically developed and validated for China’s coastal tidal flats, its modular architecture and methodological framework render it inherently adaptable for application to other intertidal environments. This flexibility enables the workflow to be readily extended to a variety of coastal ecosystems, including mangroves, saltmarshes, and estuarine mudflats. By modifying training datasets, selecting appropriate spectral indices, and optimizing index thresholds, the system can be effectively adapted to tropical, temperate, and even polar coastal regions, thereby supporting comparative analyses across diverse geographic and climatic contexts.
Limitations and Improvement Strategies—Despite the system’s strong performance, several limitations persist, particularly in highly turbid waters and complex aquaculture areas where spectral overlap between tidal flats and adjacent water bodies remains a challenge. As the current implementation relies solely on Sentinel-2 optical imagery, scenes with excessive cloud coverage are inevitably excluded, reducing temporal data availability and continuity. Furthermore, when employing the Random Forest (RF) method, the reliance on tidal-flat training samples from the GWL_FCS30 global wetland product (ID: 187) introduces potential classification bias. Since GWL_FCS30 is derived from Landsat imagery, whose revisit cycle is 16 days (5 days with multiple satellites), the temporal resolution is lower than Sentinel-2 (3–5 days). This longer revisit interval reduces the number of available images for a given time window, limiting the ability to capture both high- and low-tide conditions within that period. As a result, GWL_FCS30 may omit certain tidal flats present in underrepresented tidal stages, leading to omission errors in training labels and subsequent RF misclassifications in dynamic tidal environments such as Hangzhou Bay and aquaculture zones like Yueqing Bay.
To address these gaps, the quality and diversity of training data should be improved by cleaning label noise in GWL_FCS30-derived samples, supplementing them with manually validated examples from estuarine and aquaculture environments, and incorporating multi-temporal coverage that captures a full range of tidal stages. In addition, integrating multi-source datasets (e.g., Sentinel-1 SAR, Landsat-8/9 OLI, and high-resolution commercial imagery) can provide complementary spectral, spatial, and temporal information, improving water–land discrimination under varied environmental and weather conditions. Combining adaptive spectral index ensembles with improved thresholding algorithms could further reduce spectral confusion in tidal transition zones. Moreover, advanced deep learning approaches and integration with long-term coastal hydrodynamic datasets could enhance both classification stability and understanding of sediment transport, shoreline dynamics, and habitat evolution, providing a stronger scientific basis for evidence-driven coastal management strategies.
5. Conclusions
This study developed a national-scale tidal flat monitoring system on the AI Earth cloud platform, integrating modular workflows for multi-temporal data retrieval, spectral index computation, classification, and geospatial analytics. The distributed architecture (Vue.js/Leaflet front-end, Django RESTful back-end, PostgreSQL/PostGIS, AI Earth SDK) ensures cloud-native, low-latency processing and compliance with domestic data regulations.
The framework provides spectral thresholding (Otsu, Peak Start Threshold) with Random Forest classification trained on GWL_FCS30, while temporal aggregation produces probability surfaces for stability assessment. Validation with 8000 random samples across 14 provinces yielded OAs of 96.74% (Kappa = 0.935) in 2020 and 97.06% (Kappa = 0.939) in 2024. Local-scale validation achieved 96.60% (Kappa = 0.905) in Hangzhou Bay and 96.33% (Kappa = 0.916) in Yueqing Bay, with errors mainly in turbid estuaries and aquaculture zones.
Beyond accuracy, the system offers multi-temporal visualization, automated statistics, and standardized outputs, supporting both research and decision-making. Overall, the results show consistent >96% OA, highlighting robustness across diverse coastal environments and providing a practical framework for wetland conservation.
Author Contributions
Conceptualization, S.S. and Q.S.; methodology, S.S.; software, S.S.; validation, Q.S., P.C. and W.G.; investigation, Q.S., H.L. and P.C.; resources, B.Z.; data curation, Z.Y.; writing—original draft preparation, S.S.; writing—review and editing, Q.S.; visualization, H.L.; supervision, Z.Y.; project administration, B.Z. All authors have read and agreed to the published version of the manuscript.
Funding
This research was funded by [The Global Change and Air-Sea Interaction Project of China] grant number [JC-YGFW-YGJZ].
Data Availability Statement
Data is contained within the article: The original contributions presented in this study are included in the article. Further inquiries can be directed to the corresponding author.
Conflicts of Interest
The authors declare no conflict of interest.
Correction Statement
This article has been republished with a minor correction to the Data Availability Statement. This change does not affect the scientific content of the article.
Abbreviations
The following abbreviations are used in this manuscript:
| NDVI | Normalized Difference Vegetation Index |
| NDWI | Normalized Difference Water Index |
| WAD2M | Wetland Area and Dynamics for Methane Modeling |
| GEE | Google Earth Engine |
| MODIS | Moderate Resolution Imaging Spectroradiometer |
| SDK | Software Development Kit |
| API | Application Programming Interface |
| OSS | Object Storage Service |
| mNDWI | Modified Normalized Difference Water Index |
| IWI | Improved spectral Water Index |
| PST | Peak Start Threshold |
| ROI | Region of Interest |
| GWL_FCS30 | Global Wetland Fine Classification System at 30m |
| OA | Overall Accuracy |
References
- Schmidt, K.S.; Skidmore, A.K. Spectral discrimination of vegetation types in a coastal wetland. Remote Sens. Environ. 2003, 85, 92–108. [Google Scholar] [CrossRef]
- Zhi, L.; Li, X.; Bai, J.; Liu, Y.; Zhang, X. Integrating ecological and socioeconomic networks using nitrogen metabolism in the Yellow River Delta, China. Resour. Conserv. Recycl. 2020, 162, 105012. [Google Scholar] [CrossRef]
- Wu, F. Results of the second national wetland resources survey. China For. 2014, 2, 16–17. (In Chinese) [Google Scholar]
- Salimi, S.; Almuktar, S.A.; Scholz, M. Impact of climate change on wetland ecosystems: A critical review of experimental wetlands. J. Environ. Manag. 2021, 286, 112160. [Google Scholar] [CrossRef]
- Li, X.W.; Zhi, L.H.; Ma, T.T.; Liu, Z.L.; Cui, B.S.; Shao, D.D.; Cao, Y.; Mu, Y.L. Constructing the ecological security pattern of China’s coastal wetlands based on ‘Three-Line Integration’. Bull. Chin. Acad. Sci. 2023, 38, 123–133. (In Chinese) [Google Scholar]
- Ozesmi, C.L. Marshes prograding in Oregon: Aerial photographs. Science 1964, 146, 1575–1578. [Google Scholar] [CrossRef]
- Roy, D.P.; Wulder, M.A.; Loveland, T.R.; Woodcock, C.E.; Allen, R.G.; Anderson, M.C.; Helder, D.; Irons, J.R.; Johnson, D.M.; Kennedy, R.; et al. Landsat-8: Science and product vision for terrestrial global change research. Remote Sens. Environ. 2014, 145, 154–172. [Google Scholar] [CrossRef]
- Phiri, D.; Simwanda, M.; Salekin, S.; Nyirenda, V.R.; Murayama, Y.; Ranagalage, M. Sentinel-2 data for land cover/use mapping: A review. Remote Sens. 2020, 12, 2291. [Google Scholar] [CrossRef]
- Ozesmi, S.L.; Bauer, M.E. Satellite remote sensing of wetlands. Wetl. Ecol. Manag. 2002, 10, 381–402. [Google Scholar] [CrossRef]
- Rokni, K.; Ahmad, A.; Selamat, A.; Hazini, S. Water feature extraction and change detection using multitemporal Landsat imagery. Remote Sens. 2014, 6, 4173–4189. [Google Scholar] [CrossRef]
- Segarra, J.; Buchaillot, M.L.; Araus, J.L.; Kefauver, S.C. Remote sensing for precision agriculture: Sentinel-2 improved features and applications. Agronomy 2020, 10, 641. [Google Scholar] [CrossRef]
- Malenovský, Z.; Rott, H.; Cihlar, J.; Schaepman, M.E.; García-Santos, G.; Fernandes, R.; Berger, M. Sentinels for science: Potential of Sentinel-1, -2, and -3 missions for scientific observations of ocean, cryosphere, and land. Remote Sens. Environ. 2012, 120, 91–101. [Google Scholar] [CrossRef]
- Johansen, R.A.; Reif, M.K.; Saltus, C.L.; Pokrzywinski, K.L. A broadscale assessment of Sentinel-2 imagery and the Google Earth Engine for the nationwide mapping of chlorophyll a. Sustainability 2024, 16, 2090. [Google Scholar] [CrossRef]
- Berger, K.; Machwitz, M.; Kycko, M.; Kefauver, S.C.; Van Wittenberghe, S.; Gerhards, M.; Verrelst, J.; Atzberger, C.; van der Tol, C.; Damm, A.; et al. Multi-sensor spectral synergies for crop stress detection and monitoring in the optical domain: A review. Remote Sens. Environ. 2022, 280, 113198. [Google Scholar] [CrossRef] [PubMed]
- Kaplan, G.; Avdan, U. Mapping and monitoring wetlands using Sentinel-2 satellite imagery. ISPRS Ann. Photogramm. Remote Sens. Spat. Inf. Sci. 2017, 4, 271–277. [Google Scholar] [CrossRef]
- Wang, X.; Xiao, X.; Zou, Z.; Chen, B.; Ma, J.; Dong, J.; Doughty, R.B.; Zhong, Q.; Qin, Y.; Dai, S.; et al. Tracking annual changes of coastal tidal flats in China during 1986–2016 through analyses of Landsat images with Google Earth Engine. Remote Sens. Environ. 2020, 238, 110987. [Google Scholar] [CrossRef]
- Chen, Y.; Tian, J.; Song, J.; Chen, W.; Zhou, B.; Qu, X.; Zhang, L. Developing a new index with time series Sentinel-2 for accurate tidal flats mapping in China. Sci. Total. Environ. 2025, 958, 178037. [Google Scholar] [CrossRef]
- Zhang, Z.; Fluet-Chouinard, E.; Jensen, K.; McDonald, K.; Hugelius, G.; Gumbricht, T.; Carroll, M.; Prigent, C.; Bartsch, A.; Poulter, B. Development of the global dataset of wetland area and dynamics for methane modeling (WAD2M). Earth Syst. Sci. Data 2021, 13, 2001–2023. [Google Scholar] [CrossRef]
- Belgiu, M.; Drăguţ, L. Random forest in remote sensing: A review of applications and future directions. ISPRS J. Photogramm. Remote Sens. 2016, 114, 24–31. [Google Scholar] [CrossRef]
- Li, X.; Gong, P.; Liang, L. A 30-year (1984–2013) record of annual urban dynamics of Beijing City derived from Landsat data. Remote Sens. Environ. 2015, 166, 78–90. [Google Scholar] [CrossRef]
- Du, Y.; Zhang, Y.; Ling, F.; Wang, Q.; Li, W.; Li, X. Water bodies’ mapping from Sentinel-2 imagery with modified normalized difference water index at 10-m spatial resolution produced by sharpening the SWIR band. Remote Sens. 2016, 8, 354. [Google Scholar] [CrossRef]
- Qiao, C.; Luo, J.; Sheng, Y.; Shen, Z.; Zhu, Z.; Ming, D. An adaptive water extraction method from remote sensing image based on NDWI. J. Indian Soc. Remote Sens. 2012, 40, 421–433. [Google Scholar] [CrossRef]
- Gorelick, N.; Hancher, M.; Dixon, M.; Ilyushchenko, S.; Thau, D.; Moore, R. Google Earth Engine: Planetary-scale geospatial analysis for everyone. Remote Sens. Environ. 2017, 202, 18–27. [Google Scholar] [CrossRef]
- Pekel, J.F.; Cottam, A.; Gorelick, N.; Belward, A.S. High-resolution mapping of global surface water and its long-term changes. Nature 2016, 540, 418–422. [Google Scholar] [CrossRef]
- Yu, Z.; Di, L.; Shrestha, S.; Zhang, C.; Guo, L.; Qamar, F.; Mayer, T.J. Ricemapengine: A Google Earth Engine-based web application for fast paddy rice mapping. IEEE J. Sel. Top. Appl. Earth Obs. Remote Sens. 2023, 16, 1486–1498. [Google Scholar] [CrossRef]
- Xu, R.G.; Qiao, G.; Wu, Y.J.; Cao, Y.J. Extraction of rivers and lakes on Tibetan Plateau based on Google Earth Engine. ISPRS Arch. Photogramm. Remote Sens. Spat. Inf. Sci. 2019, 42, 1797–1801. [Google Scholar] [CrossRef]
- Wang, D.; Xu, H.; Shi, Y.; Ding, Z.; Deng, Z.; Liu, Z.; Xu, X.; Lu, Z.; Wang, G.; Cheng, Z.; et al. The groundwater potential assessment system based on cloud computing: A case study in islands region. Comput. Commun. 2021, 178, 83–97. [Google Scholar] [CrossRef]
- Yalew, S.G.; Van Griensven, A.; van der Zaag, P. AgriSuit: A web-based GIS-MCDA framework for agricultural land suitability assessment. Comput. Electron. Agric. 2016, 128, 1–8. [Google Scholar] [CrossRef]
- Hird, J.N.; DeLancey, E.R.; McDermid, G.J.; Kariyeva, J. Google Earth Engine, open-access satellite data, and machine learning in support of large-area probabilistic wetland mapping. Remote Sens. 2017, 9, 1315. [Google Scholar] [CrossRef]
- Xu, H.; Man, Y.; Yang, M.; Wu, J.; Zhang, Q.; Wang, J. Analytical Insight of Earth: A Cloud-Platform of Intelligent Computing for Geospatial Big Data. arXiv 2023, arXiv:2312.16385. [Google Scholar] [CrossRef]
- Vinueza-Martinez, J.; Garcia-Castro, A.; Alvarez-Alvarado, M.S. Geographic Information Systems (GISs) Based on WebGIS Architecture: Bibliometric Analysis of the Current Status and Research Trends. Sustainability 2024, 16, 6439. [Google Scholar] [CrossRef]
- Şener, M.; Arslanoğlu, M.C. Morphometric analysis in Google Earth Engine: An online interactive web-based application for global-scale analysis. Environ. Model. Softw. 2023, 162, 105640. [Google Scholar] [CrossRef]
- Rafli, M.F.; Nugraha, A.; Shaliza, A.Z.; Zainuddin, S.Z.; Safiqurrohman, F.A.; Kirana, K.H.; Dharmawan, I.A. CitarumView: A Google Earth Engine-based application for Citarum River monitoring. IOP Conf. Ser. Earth Environ. Sci. 2023, 1266, 012011. [Google Scholar] [CrossRef]
- McFeeters, S.K. The use of the Normalized Difference Water Index (NDWI) in the delineation of open water features. Int. J. Remote Sens. 1996, 17, 1425–1432. [Google Scholar] [CrossRef]
- Xu, H. Modification of normalized difference water index (NDWI) to enhance open water features in remotely sensed imagery. Int. J. Remote Sens. 2006, 27, 3025–3033. [Google Scholar] [CrossRef]
- Tang, W.; Zhao, C.; Lin, J.; Jiao, C.; Zheng, G.; Zhu, J.; Pan, X.; Han, X. Improved spectral water index combined with Otsu algorithm to extract muddy coastline data. Water 2022, 14, 855. [Google Scholar] [CrossRef]
- GB/T 20257. 1-2017; Cartographic Symbols for National Fundamental Scale Maps—Part 1: Specification for Cartographic Symbols for 1:500 1:1 000 1:2 000 Topographic Maps. Standardization Administration of China (SAC): Beijing, China, 2017.
- Hanchett, E.; Listwon, B. Vue.js in Action; Simon and Schuster: New York, NY, USA, 2018. [Google Scholar]
- Balla, D.; Gede, M. Beautiful thematic maps in Leaflet with automatic data classification. ISPRS Arch. Photogramm. Remote Sens. Spat. Inf. Sci. 2024, 48, 3–10. [Google Scholar] [CrossRef]
- Piastou, M. Comprehensive Performance and Scalability Assessment of Front-End Frameworks: React, Angular, and Vue.js. World J. Adv. Eng. Technol. Sci. 2024, 9, 366–376. [Google Scholar] [CrossRef]
- Sharma, M.; Khan, M.S.; Singh, J. Python & Django the Fastest Growing Web Development Technology. In Proceedings of the 2024 IEEE 1st Karachi Section Humanitarian Technology Conference (KHI-HTC), Tandojam, Pakistan, 8–9 January 2024; IEEE: New York, NY, USA, 2024; pp. 1–6. [Google Scholar]
- Ehsan, A.; Bezemer, C.P.; Hassan, A.E. RESTful API testing methodologies: Rationale, challenges, and solution directions. Appl. Sci. 2022, 12, 4369. [Google Scholar] [CrossRef]
- Makris, A.; Tserpes, K.; Spiliopoulos, G.; Zissis, D.; Anagnostopoulos, D. MongoDB vs PostgreSQL: A comparative study on performance aspects. GeoInformatica 2021, 25, 243–268. [Google Scholar] [CrossRef]
- Likaj, X.; Khodayari, S.; Pellegrino, G. Where we stand (or fall): An analysis of CSRF defenses in web frameworks. In Proceedings of the 24th International Symposium on Research in Attacks, Intrusions and Defenses, San Sebastian, Spain, 6–8 October 2021; pp. 1–16. [Google Scholar]
- Zhang, X.; Liu, L.; Zhao, T.; Chen, X.; Lin, S.; Wang, J.; Mi, J.; Liu, W. GWL_FCS30: Global 30 m wetland map with fine classification system using multi-sourced and time-series remote sensing imagery in 2020. Earth Syst. Sci. Data Discuss. 2022, 2022, 1–31. [Google Scholar] [CrossRef]
Disclaimer/Publisher’s Note: The statements, opinions and data contained in all publications are solely those of the individual author(s) and contributor(s) and not of MDPI and/or the editor(s). MDPI and/or the editor(s) disclaim responsibility for any injury to people or property resulting from any ideas, methods, instructions or products referred to in the content. |
© 2025 by the authors. Licensee MDPI, Basel, Switzerland. This article is an open access article distributed under the terms and conditions of the Creative Commons Attribution (CC BY) license (https://creativecommons.org/licenses/by/4.0/).