Article

The Dynamic Monitoring of River-Ice Thickness on the Qinghai–Tibet Plateau: Four-Dimensional Structure-from-Motion Photogrammetry

1
School of Civil and Hydraulic Engineering, Lanzhou University of Technology, Lanzhou 730050, China
2
State Key Laboratory of Ecological Safety and Sustainable Development in Arid Lands, Northwest Institute of Eco-Environment and Resources, Chinese Academy of Sciences, Lanzhou 730000, China
3
University of Chinese Academy of Sciences, Beijing 100049, China
*
Author to whom correspondence should be addressed.
Remote Sens. 2025, 17(16), 2887; https://doi.org/10.3390/rs17162887
Submission received: 8 July 2025 / Revised: 4 August 2025 / Accepted: 18 August 2025 / Published: 19 August 2025
(This article belongs to the Special Issue Application of Remote Sensing in Snow and Ice Monitoring)

Abstract

River-ice, a significant element of the cryosphere, plays a crucial role in hydrological processes. However, the effectiveness of current river-ice monitoring techniques on the Qinghai–Tibet Plateau is limited due to the complex interplay of environmental and topographical factors in this extensively ice-covered region. To overcome the inadequacies of traditional monitoring approaches in plateau settings, this research introduces a 4D-SfM photogrammetry method for river-ice monitoring. Experimental measurements of river-ice thickness were conducted on the upper reaches of the Heihe River in the Qilian Mountains during the freezing period of 2023–2024. The study evaluated accuracy variations across three different shooting distances: close-range (0.5 m–1.5 m), mid-range (3 m–10 m), and long-range (25 m–60 m). In this study, 4D-SfM photogrammetry not only accurately represents the nonlinear processes of river-ice formation and melting but also sensitively detects abrupt changes in thickness. Between 6 February and 4 April 2024, river-ice underwent a cumulative melt of 77.8 cm, followed by a cumulative growth of 72.2 cm between 26 November and 26 December 2024. Notably, between 24 and 25 December 2024, 4D-SfM photogrammetry successfully captured an extreme event in which river-ice thickness surged by approximately 30 cm. Measurement accuracy decreased with increasing shooting distance, as indicated by an increase in RMSE from 0.43 cm to 3.97 cm. Additionally, factors such as image brightness and ice surface irregularities significantly impact measurement precision. Moreover, the measurement area expanded from 11.38 m2 to 2642 m2 with increased shooting distances. Therefore, achieving a balance between shooting distance and measurement accuracy is essential when employing 4D-SfM photogrammetry for river-ice monitoring. This study provides a valuable resource for utilizing 4D-SfM photogrammetry to monitor river-ice thickness on the Qinghai–Tibet Plateau.

1. Introduction

River-ice constitutes a fundamental component of the cryosphere in middle- and high-latitude regions, significantly influencing hydrological processes and regional climate dynamics [1,2,3]. Climate change has precipitated substantial reductions in global river-ice coverage and shortened freezing periods [4,5], resulting in rapid spring warming that accelerates ice ablation and fragmentation [6,7,8]. The accelerated ablation mobilizes ice fragments downstream, where they accumulate in narrow or curved river sections, forming ice jams that impede flow [9,10]. A catastrophic failure of these ice dams triggers devastating floods, causing substantial economic losses and safety hazards for downstream communities [11,12]. Consequently, comprehensive monitoring programs have been established in river reaches with high discharge and ice-jam susceptibility, including the Saint Lawrence River in Canada [13] and the Ningxia-Inner Mongolia reach of the Yellow River in China [14,15].
Although these monitoring efforts are mainly focused on low-altitude river systems that are prone to catastrophic ice-jam floods, river-ice formation in the Plateau region is shaped by the combined effects of high-altitude conditions, intense solar radiation, and a continental climate, resulting in a unique freezing mechanism. Therefore, even though these rivers have limited flow and a lower likelihood of ice-jam flooding [16], studying their river-ice can still provide valuable insights into local climate variability and hydrological changes [17]. The Qinghai–Tibet Plateau, recognized for its exceptional climate sensitivity [18,19], exhibits extensive river-ice coverage throughout winter [20]. However, challenging terrain, harsh conditions, and inadequate infrastructure have resulted in limited monitoring programs and critically sparse datasets [21]. The plateau’s extreme environment—characterized by high altitude, intense solar radiation, and pronounced diurnal temperature variations—creates distinctive ice formation and ablation patterns that diverge substantially from those of conventional river systems. Understanding these processes remains essential for elucidating regional climate responses and forecasting hydrological transformations under sustained global warming. However, the effective characterization of these unique ice dynamics requires appropriate monitoring methodologies that can operate reliably under extreme plateau conditions.
Nevertheless, the intricate meteorological conditions and insufficient infrastructure in high-altitude regions pose certain limitations to the current methods of monitoring river-ice thickness.The existing methods are categorized into contact and non-contact approaches [22,23]. Contact methods (e.g., manual drilling [24], ultrasonic sounding [25], and ground-penetrating radar [24]) provide centimeter-scale precision but are constrained by limited spatial coverage, safety risks, and potential errors in dynamic environments due to substrate heterogeneity [26]. Non-contact methods include synthetic aperture radar (SAR), optical remote sensing, unmanned aerial vehicle structure-from-motion (UAV-SfM), airborne light detection and ranging(LiDAR), unmanned aerial vehicle-based ground-penetrating radar (UAV-GPR), and hanging ground-penetrating radar (H-GPR). While SAR provides continuous data acquisition, multipath scattering in mountainous terrain limits accuracy to 0.1 m–0.3 m [3]. Optical remote sensing suffers from cloud cover, topographic shadows, and snow accumulation, creating substantial data gaps during winter. UAV-SfM and airborne LiDAR offer superior resolution but encounter operational constraints in high-altitude environments, including reduced flight endurance, compromised global navigation satellite system (GNSS) accuracy, and atmospheric interference [25]. The existing methodologies struggle to achieve the optimal integration of accuracy, spatial coverage, temporal continuity, and environmental adaptability, which are required for plateau river-ice monitoring [27].
Four-dimensional structure-from-motion (4D-SfM) photogrammetry presents a promising solution for addressing these constraints. This technique delivers exceptional spatiotemporal resolution, particularly suited for cryospheric observations in extreme environments. Ground-based photogrammetric approaches have shown success in cryospheric applications. Piermattei et al. achieved an accuracy comparable to airborne LiDAR while capturing complex glacier dynamics across 2.1 km2 [28]. Franioli et al. developed the ICEpy4D toolkit, integrating time-lapse photography with computer vision algorithms for comprehensive glacier monitoring [29]. Filhol et al. successfully reconstructed snow cover processes using synchronized multi-camera systems, achieving meter-scale resolution [30]. Most relevant to this study, Liu et al. demonstrated centimeter-level precision in snowpack monitoring at Bayi Glacier under conditions analogous to plateau river environments [27], successfully tracking winter snow sublimation processes [31]. Given the thermodynamic similarities between river-ice and snow/glacier processes, this technique shows considerable promise for river-ice applications.
However, critical knowledge gaps persist regarding 4D-SfM optimization for river-ice monitoring. Photogrammetric accuracy depends fundamentally on image quality, which correlates strongly with acquisition distance—affecting ground sampling distance (GSD) and spatial resolution. Previous studies have established that closer distances improve accuracy. Domingo et al. showed that enhanced resolution substantially improves 3D model accuracy [32], Seifert et al. found that minimal flight altitudes yield superior precision [33], and Nguyen et al. quantified a significant accuracy degradation as altitude increased from 50 to 250 m [34]. While these studies established general distance–accuracy relationships for UAV photogrammetry, the specific quantitative influence of shooting distance on 4D-SfM accuracy for river-ice applications remains uncharacterized—representing a significant barrier to operational implementation.
To address these knowledge gaps, this study systematically evaluated 4D-SfM photogrammetry viability for river-ice thickness monitoring in the Qinghai–Tibet Plateau and investigated quantitative relationships between shooting distance and measurement precision. Our experimental design employed three distinct shooting distances within identical monitoring areas across two temporal periods—an extended campaign from November 2023 to April 2024 and an intensive study from November to December 2024. This research investigates the viability of 4D-SfM photogrammetry for plateau river-ice monitoring and assesses how shooting distance affects measurement precision under Qinghai–Tibet Plateau conditions.

2. Materials and Methods

2.1. Study Area

The study area is situated in the upper Heihe River region, adjacent to the Qilian Alpine Ecology and Hydrology Research Station, NIEER, CAS (99.88°E, 38.27°N, 2998 m a.s.l.), within the Qilian Mountain National Nature Reserve on the northeastern edge of the Qinghai–Tibet Plateau (Figure 1). In the study area, the CR1000 instrument was used to monitor data such as air temperature and wind speed. Additionally, the CR300 instrument was used to measure data such as solar radiation and ice surface albedo.
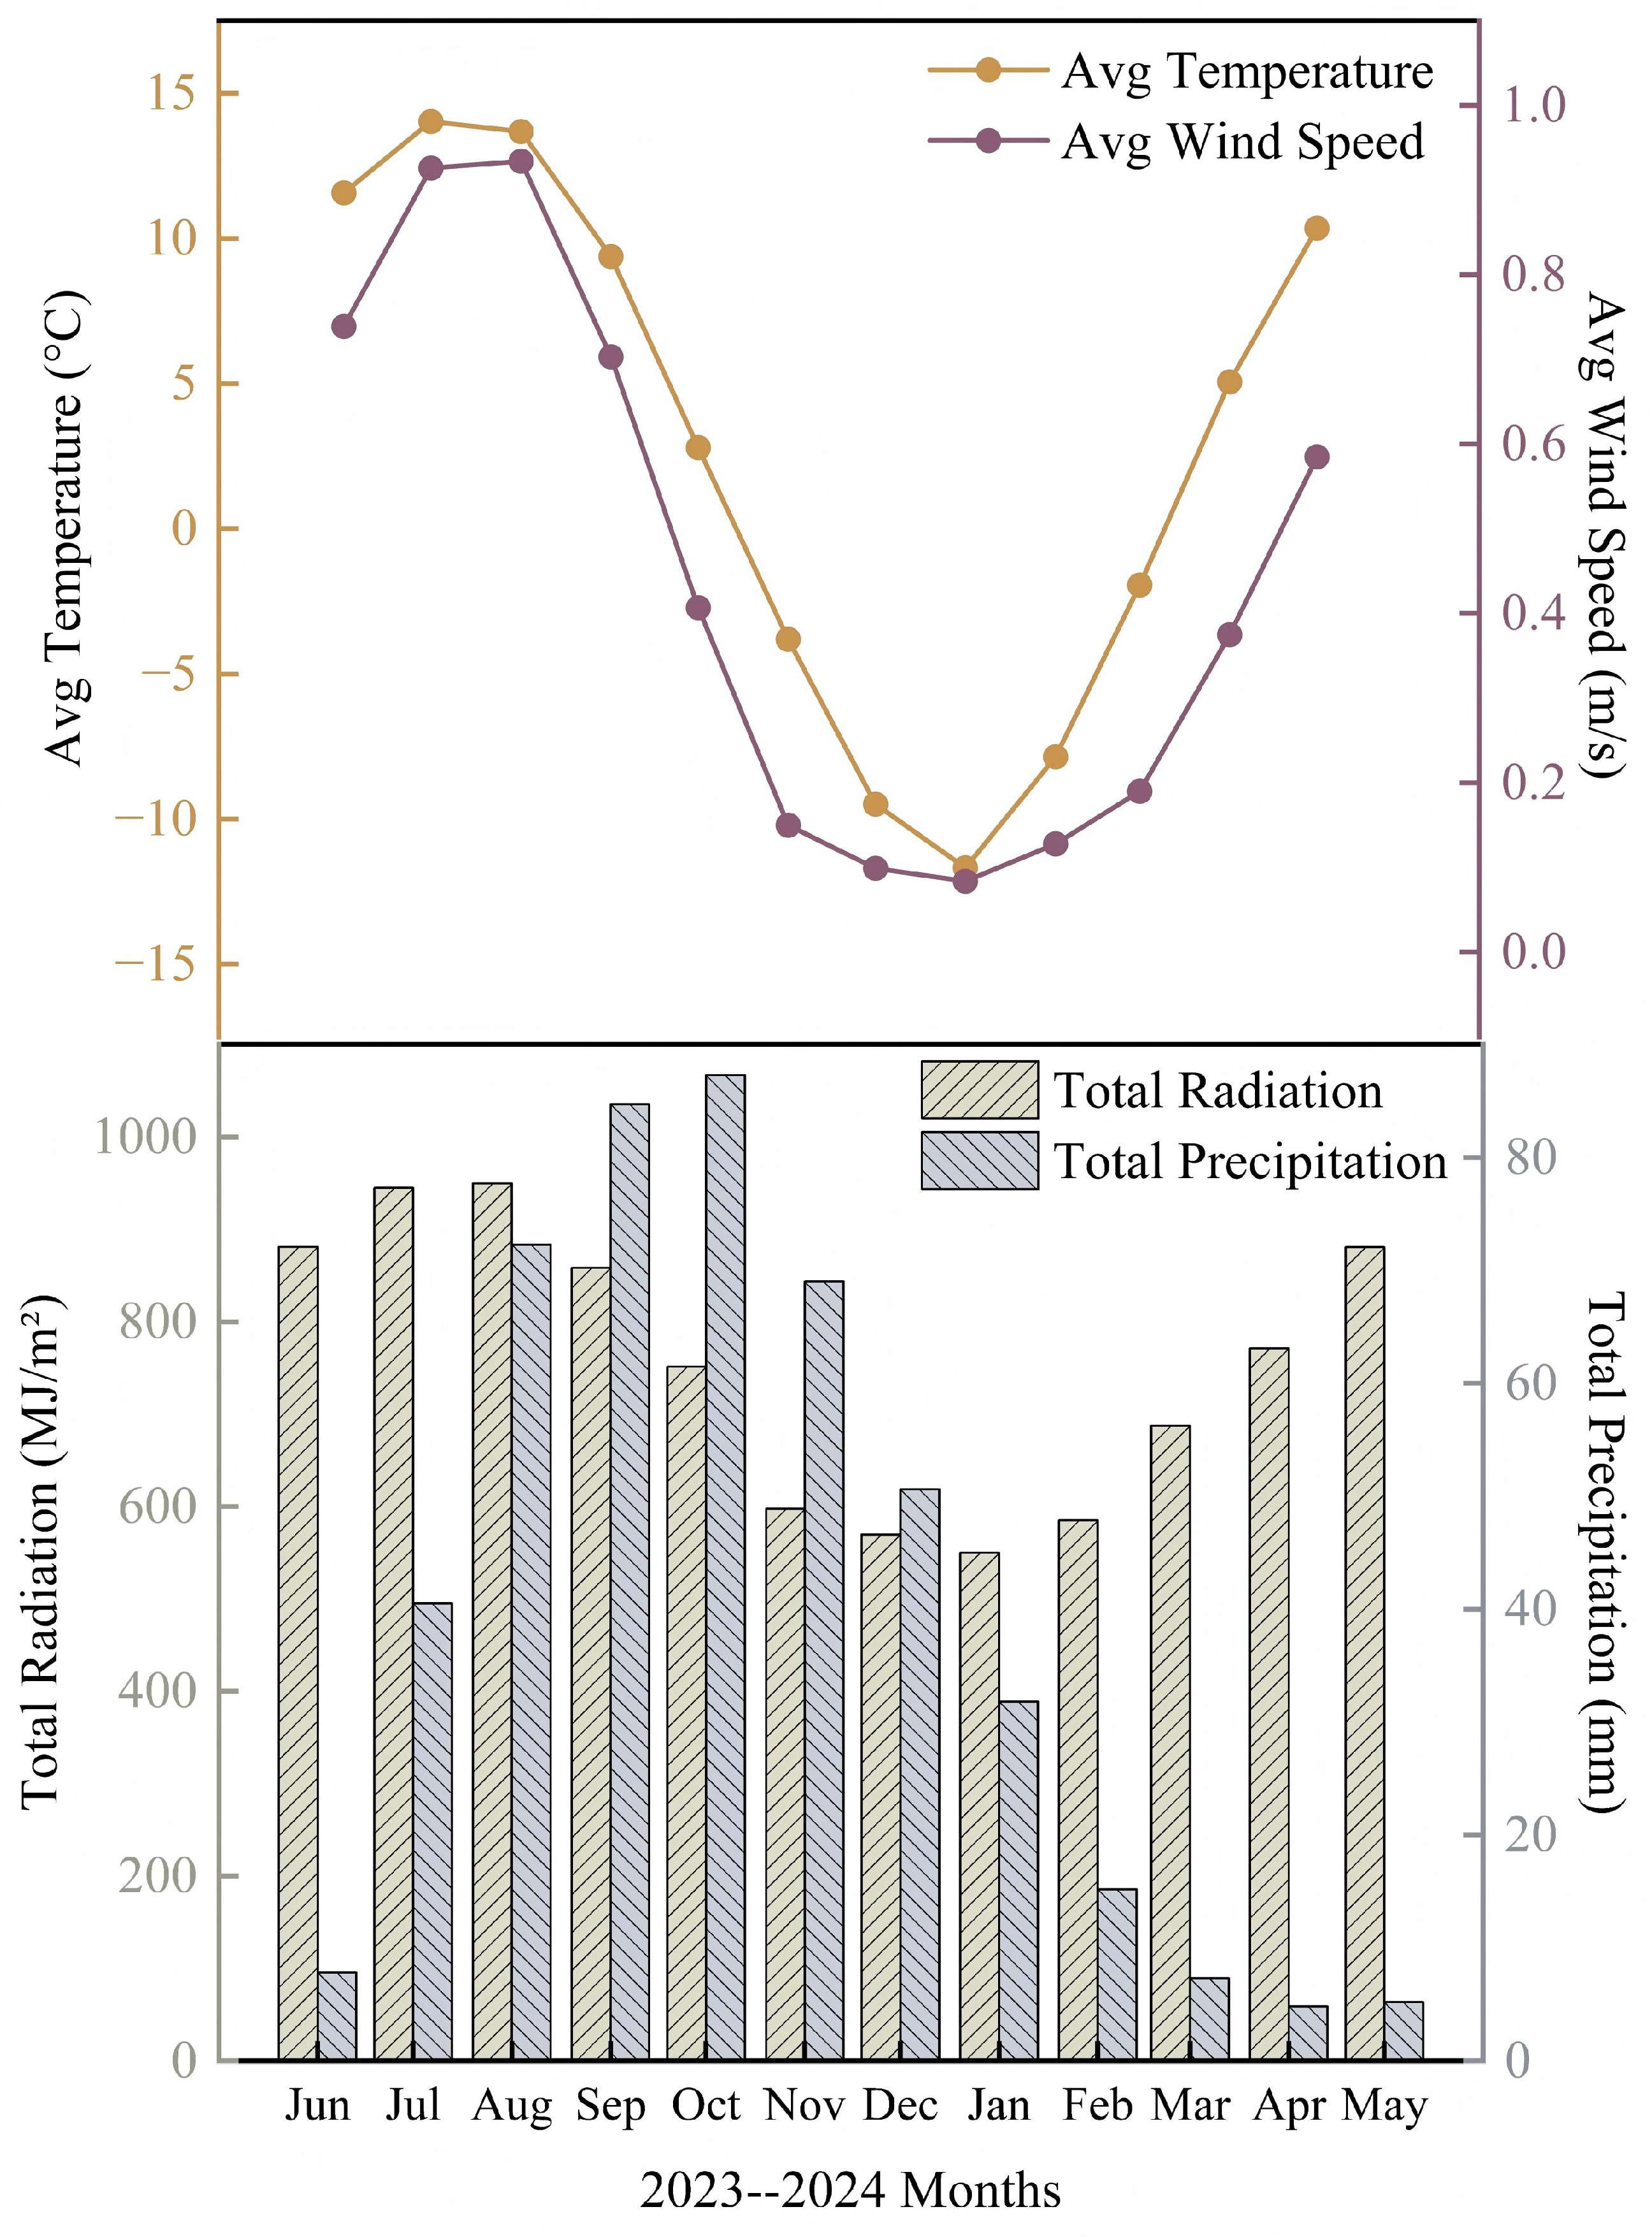
In the study area, from 2023 to 2024, mean air temperature, wind speed, total radiation, and total precipitation all displayed clear seasonal cycles (Figure 2). The wind speed mirrored this pattern, peaking at roughly 1.0 m/s in June–August, decreasing to 0.5–0.7 m/s in September–October, dropping further to 0.1–0.2 m/s in November–January, before rebounding to around 0.6 m/s from February to May. The monthly total radiation was highest in midsummer (July–September) at approximately 900–950 MJ/m2 and was lowest in winter (November–February), at 550–600 MJ/m2. Precipitation was concentrated in July–October, with maximum monthly totals of 75–85 mm in September–October and decreasing to 30–65 mm in November–January. In general, the area is characterized by moderate, temperate summers; abundant autumn rainfall; and relatively dry winters and springs.
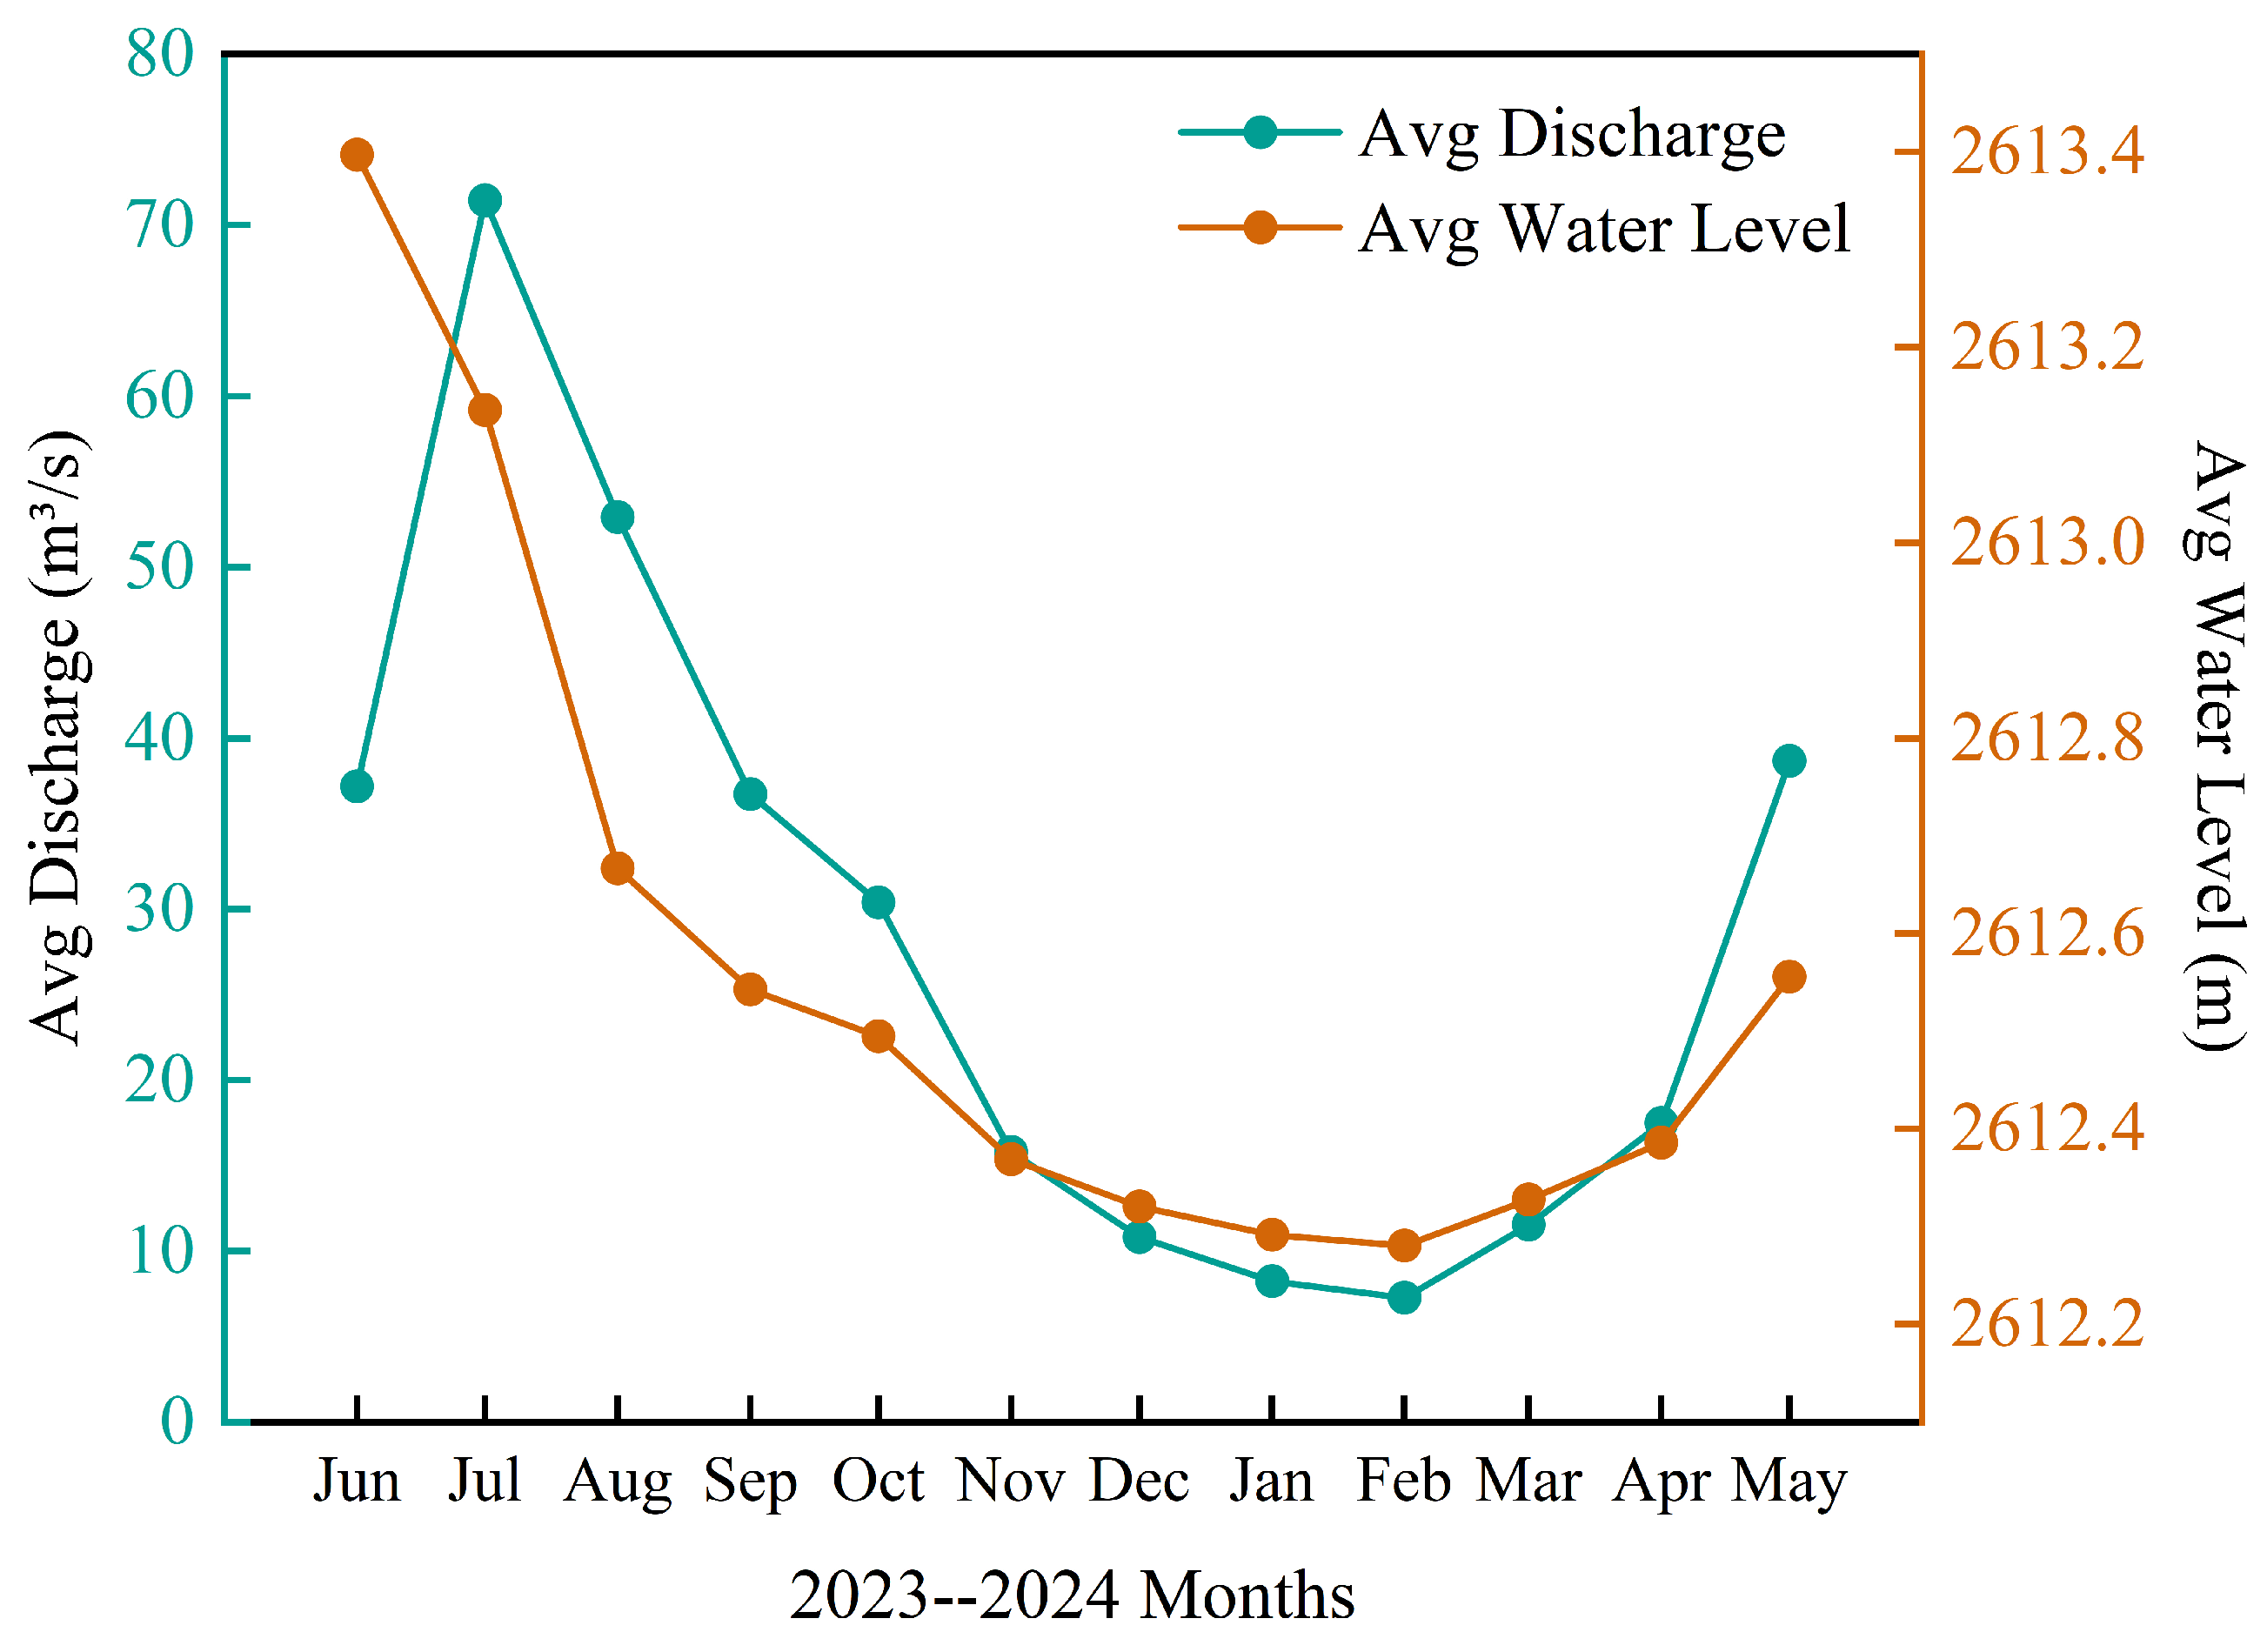
Hydrological data obtained from the Zhamashike Hydrological Station, situated approximately 20 km from the study area, indicate that the discharge and water level of the upper reaches of the Heihe River exhibit the characteristic hydrological patterns of a plateau river: “high flow in summer and low flow in winter, with a rebound in spring.” As illustrated in Figure 3, from May to October, both the discharge and the water level in the upper reaches of the Heihe River were relatively elevated and exhibited significant fluctuations. In contrast, from November to the following April, both the discharge and the water level were reduced and tended to stabilize. Specifically, the water level reached a peak of approximately 2613.4 m in June, while the discharge attained its maximum at approximately 72 m3/s in July. In contrast, both the discharge and the water level reached their nadir in January, with the discharge declining below 8 m3/s and the water level being approximately 2612.2 m.

2.2. Shooting Strategies and Equipment

Three distinct photogrammetric acquisition modes were employed to monitor river-ice formation and melting processes from 2023 to 2024. These modes included close-range (0.5–1.5 m) from November to December 2023, mid-range (3–10 m) from February to April 2024, and long-range (25–60 m) from November to December 2024. A unified 4D structure-from-motion (SfM) photogrammetric system was utilized across all modes (Figure 4), which was adapted from the configuration proposed by Liu et al. [27] to ensure scalability and consistency in dynamic ice reconstructions.
For the long-range mode, the horizontal platform was tilted at an incline and raised to facilitate sufficient image overlap and expanded spatial coverage per acquisition, addressing the baseline limitations inherent to distant SfM setups. Image collection adhered to a uniform protocol in all modes, involving a 7 × 7 grid of photographs captured in a lawnmower pattern between 9:00 and 10:00 a.m. daily, under optimal lighting, in order to maximize reconstruction fidelity. Optimal lighting conditions were prioritized during intervals with diffuse sunlight, namely, 1–3 h post-sunrise or pre-sunset on clear days, as well as at around midday on cloudy or overcast days, to circumvent vignetting from insufficient light or overexposure to harsh rays, thus safeguarding critical textural details that are vital for robust SfM point cloud generation. The resulting digital images were archived on the camera’s SD card for offline processing and analysis.
The system employed Canon 1100D cameras (Canon Inc., Tokyo, Japan) paired with an 18 mm prime lens, selected for its optimal focal length that maintained a consistent depth-of-field and minimized optical distortions on low-contrast cryogenic surfaces, thereby improving feature detection and matching accuracy, as demonstrated in prior cold-region photogrammetry studies [35]. To guarantee reliable performance amid harsh winter conditions, the camera was housed in a protective box lined with foam materials for cold protection, effectively shielding it against thermal shocks that could degrade the sensor functionality and battery efficiency during prolonged exposure. Standardized camera settings were applied, featuring an aperture of f/3.5 for equilibrated light capture and edge sharpness, a shutter speed of 1/320 s to counteract blur from fluid river motions, and an ISO of 100 to suppress noise under variable illumination, all of which were managed via manual (M) mode to afford precise adjustments in unpredictable environmental lighting.
To ensure the stable operation of the monitoring equipment, the device was powered by a combination of solar panels and high-capacity batteries. When there is ample sunlight, the solar panels not only provide reliable power for the camera and mobile platform but also store surplus electricity in the batteries, which serve as supplementary power sources during low-light conditions. The total cost of the entire system was approximately RMB 10,000, offering a high level of cost-effectiveness.

2.3. Selection of Control Points

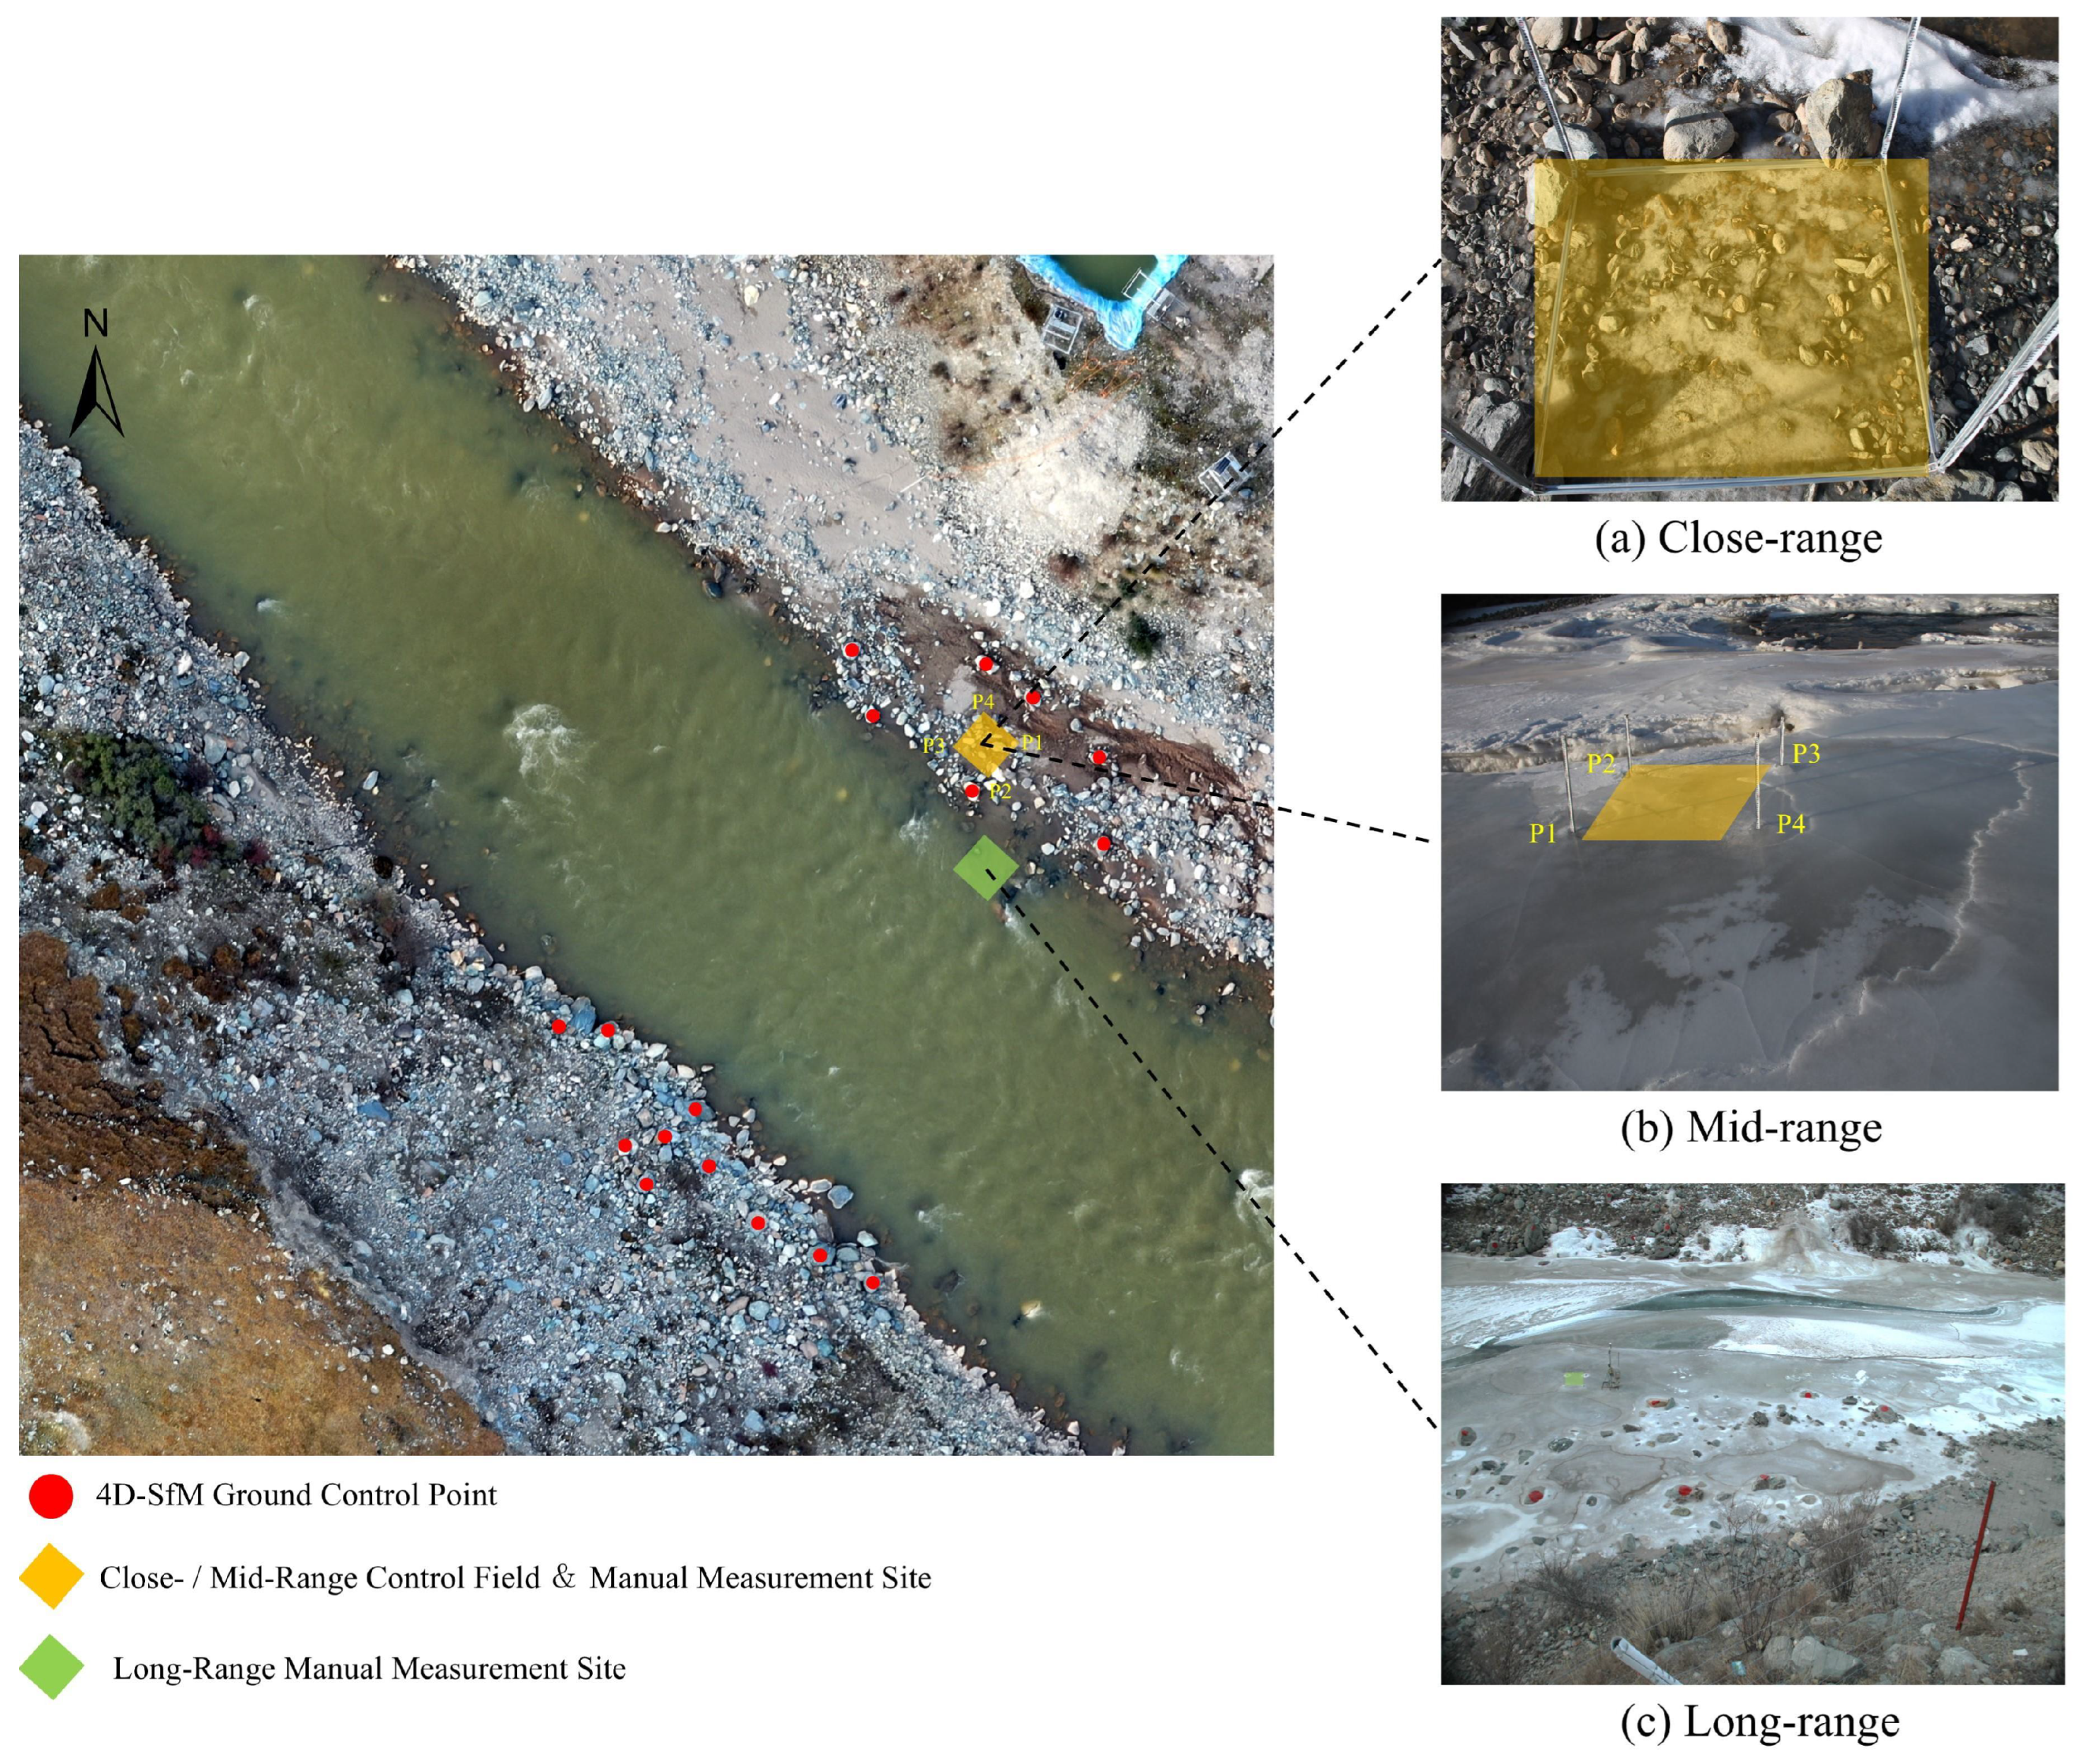
For close-range and mid-range modes, a standardized control field was established using an aluminum-alloy cubic frame with graduated scales measuring 121 cm × 101.5 cm × 120 cm (length × width × height) (Figure 5a–c). Control points were positioned strategically on each of the four scales based on observed variations in river-ice thickness. The primary control point on each scale was established at the nearest integer graduation mark to the ice surface, while the secondary control point was positioned 10 cm above the primary reference point.
For the long-range mode, the extended monitoring range necessitated the establishment of a distributed control field encompassing both riverbanks of the study channel (Figure 5c). Control points were established based on the camera’s field of view, with 15–20 large boulders being evenly distributed along both sides of the river channel and painted red to ensure comprehensive spatial coverage of the survey area.

2.4. Photo Processing

Photogrammetric processing was performed using Agisoft Metashape Pro software (2.2.1 (build 19937)) according to a standardized workflow, which included Align Photos, Import and mark GCPs, Build Mesh, Build Texture, Build Dense Cloud, Build DEM, and Orthomosaic (Figure 6).
Control point selection protocols differed according to acquisition mode. In the close-range and mid-range modes, control points were established on the four vertical edges of the aluminum alloy reference frame. The primary control point on each edge was positioned at the nearest integer graduation mark to the ice surface, and the secondary control point was located 10 cm above the primary reference. The coordinate system was defined with X and Y, corresponding to the frame’s length and width, respectively, while Z corresponded to the graduated scale readings. For long-range mode, the control points were marked in red. Their three-dimensional coordinates were obtained from the study area’s DEM and DOM data collected on 1 October 2024, using a DJI Matrice 350 RTK equipped with a Zenmuse L2 LiDAR payload. All processing parameters beyond control point establishment were set to the software’s default configuration settings.

2.5. Manual Measurement Methods

A complementary manual measurement approach was implemented, whereby graduated poles placed along the riverbank were photographed by trail cameras during the concurrent operation of the 4D-SfM photogrammetric system. Each pole was equipped with a calibrated scale, with its zero reference line being aligned horizontally with the riverbank elevation. Daily ice thickness measurements were derived by identifying the scale reading at the interface between the ice surface and the graduated pole, thereby providing independent validation of the photogrammetric measurements.

2.6. Calculation of River-Ice Thickness

The river-ice thickness was obtained using the difference in elevation values extracted using ArcMap software (10.8.0). The formula for calculating river-ice thickness varies by region. The following formula is used in relation to shore ice [35]:
I i c e = D E M b i D E M g
where I i c e is the thickness of the river-ice; D E M b i is the elevation of the ice surface at a point on the bank; and D E M g is the elevation of the ground at that point. The formula for calculating the thickness of ice in a river is as follows [36]:
I i c e = D E M r i D E M r b d
where D E M r i is the elevation of the ice surface at a point in the river; D E M r b is the elevation of the riverbed at that point; and d is the depth of the water at that point.

2.7. Image Brightness Value Calculation Method

To quantitatively assess the influence of image brightness on 4D-SfM photogrammetric accuracy across different acquisition distances, a standardized brightness calculation methodology was implemented. The acquired river-ice images were imported into MATLAB R2023a and converted to grayscale format using the rgb2gray function. Grayscale luminance values (Y) were calculated according to the ITU-R BT.601 standard through the following weighted average formula [37]:
Y = 0.299 R + 0.587 G + 0.114 B
Next, the average brightness value of each image was obtained by summing the gray values of all pixels within the image area and dividing by the total number of pixels, as follows:
Y ¯ = 1 N i = 1 N Y i
where N is the total number of pixels in the image; Y i is the gray value of the i-th pixel.

2.8. Precision Evaluation

To verify the accuracy of 4D-SfM photogrammetry, in this study, the manual measurement results were u sed as a reliable basis and were fitted with the photogrammetry results. The coefficient of determination R 2 , root mean square error ( R M S E ), absolute error ( A E ), and percentage accuracy relative to 55 cm ( R E _ 55 cm) were used as the accuracy evaluation indexes, with the following formulas:
R 2 = 1 i = 1 n I i c e I i c e 2 i = 1 n I i c e I i c e ¯ 2
R M S E = 1 n i = 1 n I i c e I i c e 2
A E = I i c e I i c e
R E _ 55 cm   = A E 55 × 100 %
where n is the number of days; I i c e is the river-ice thickness from manual measurements; I i c e is the river-ice thickness from 4D-SfM photogrammetry; and I i c e ¯ is the mean river-ice thickness from manual measurements.

3. Results

3.1. Assessment of River-Ice Thickness Accuracy Under Three Distance Modes

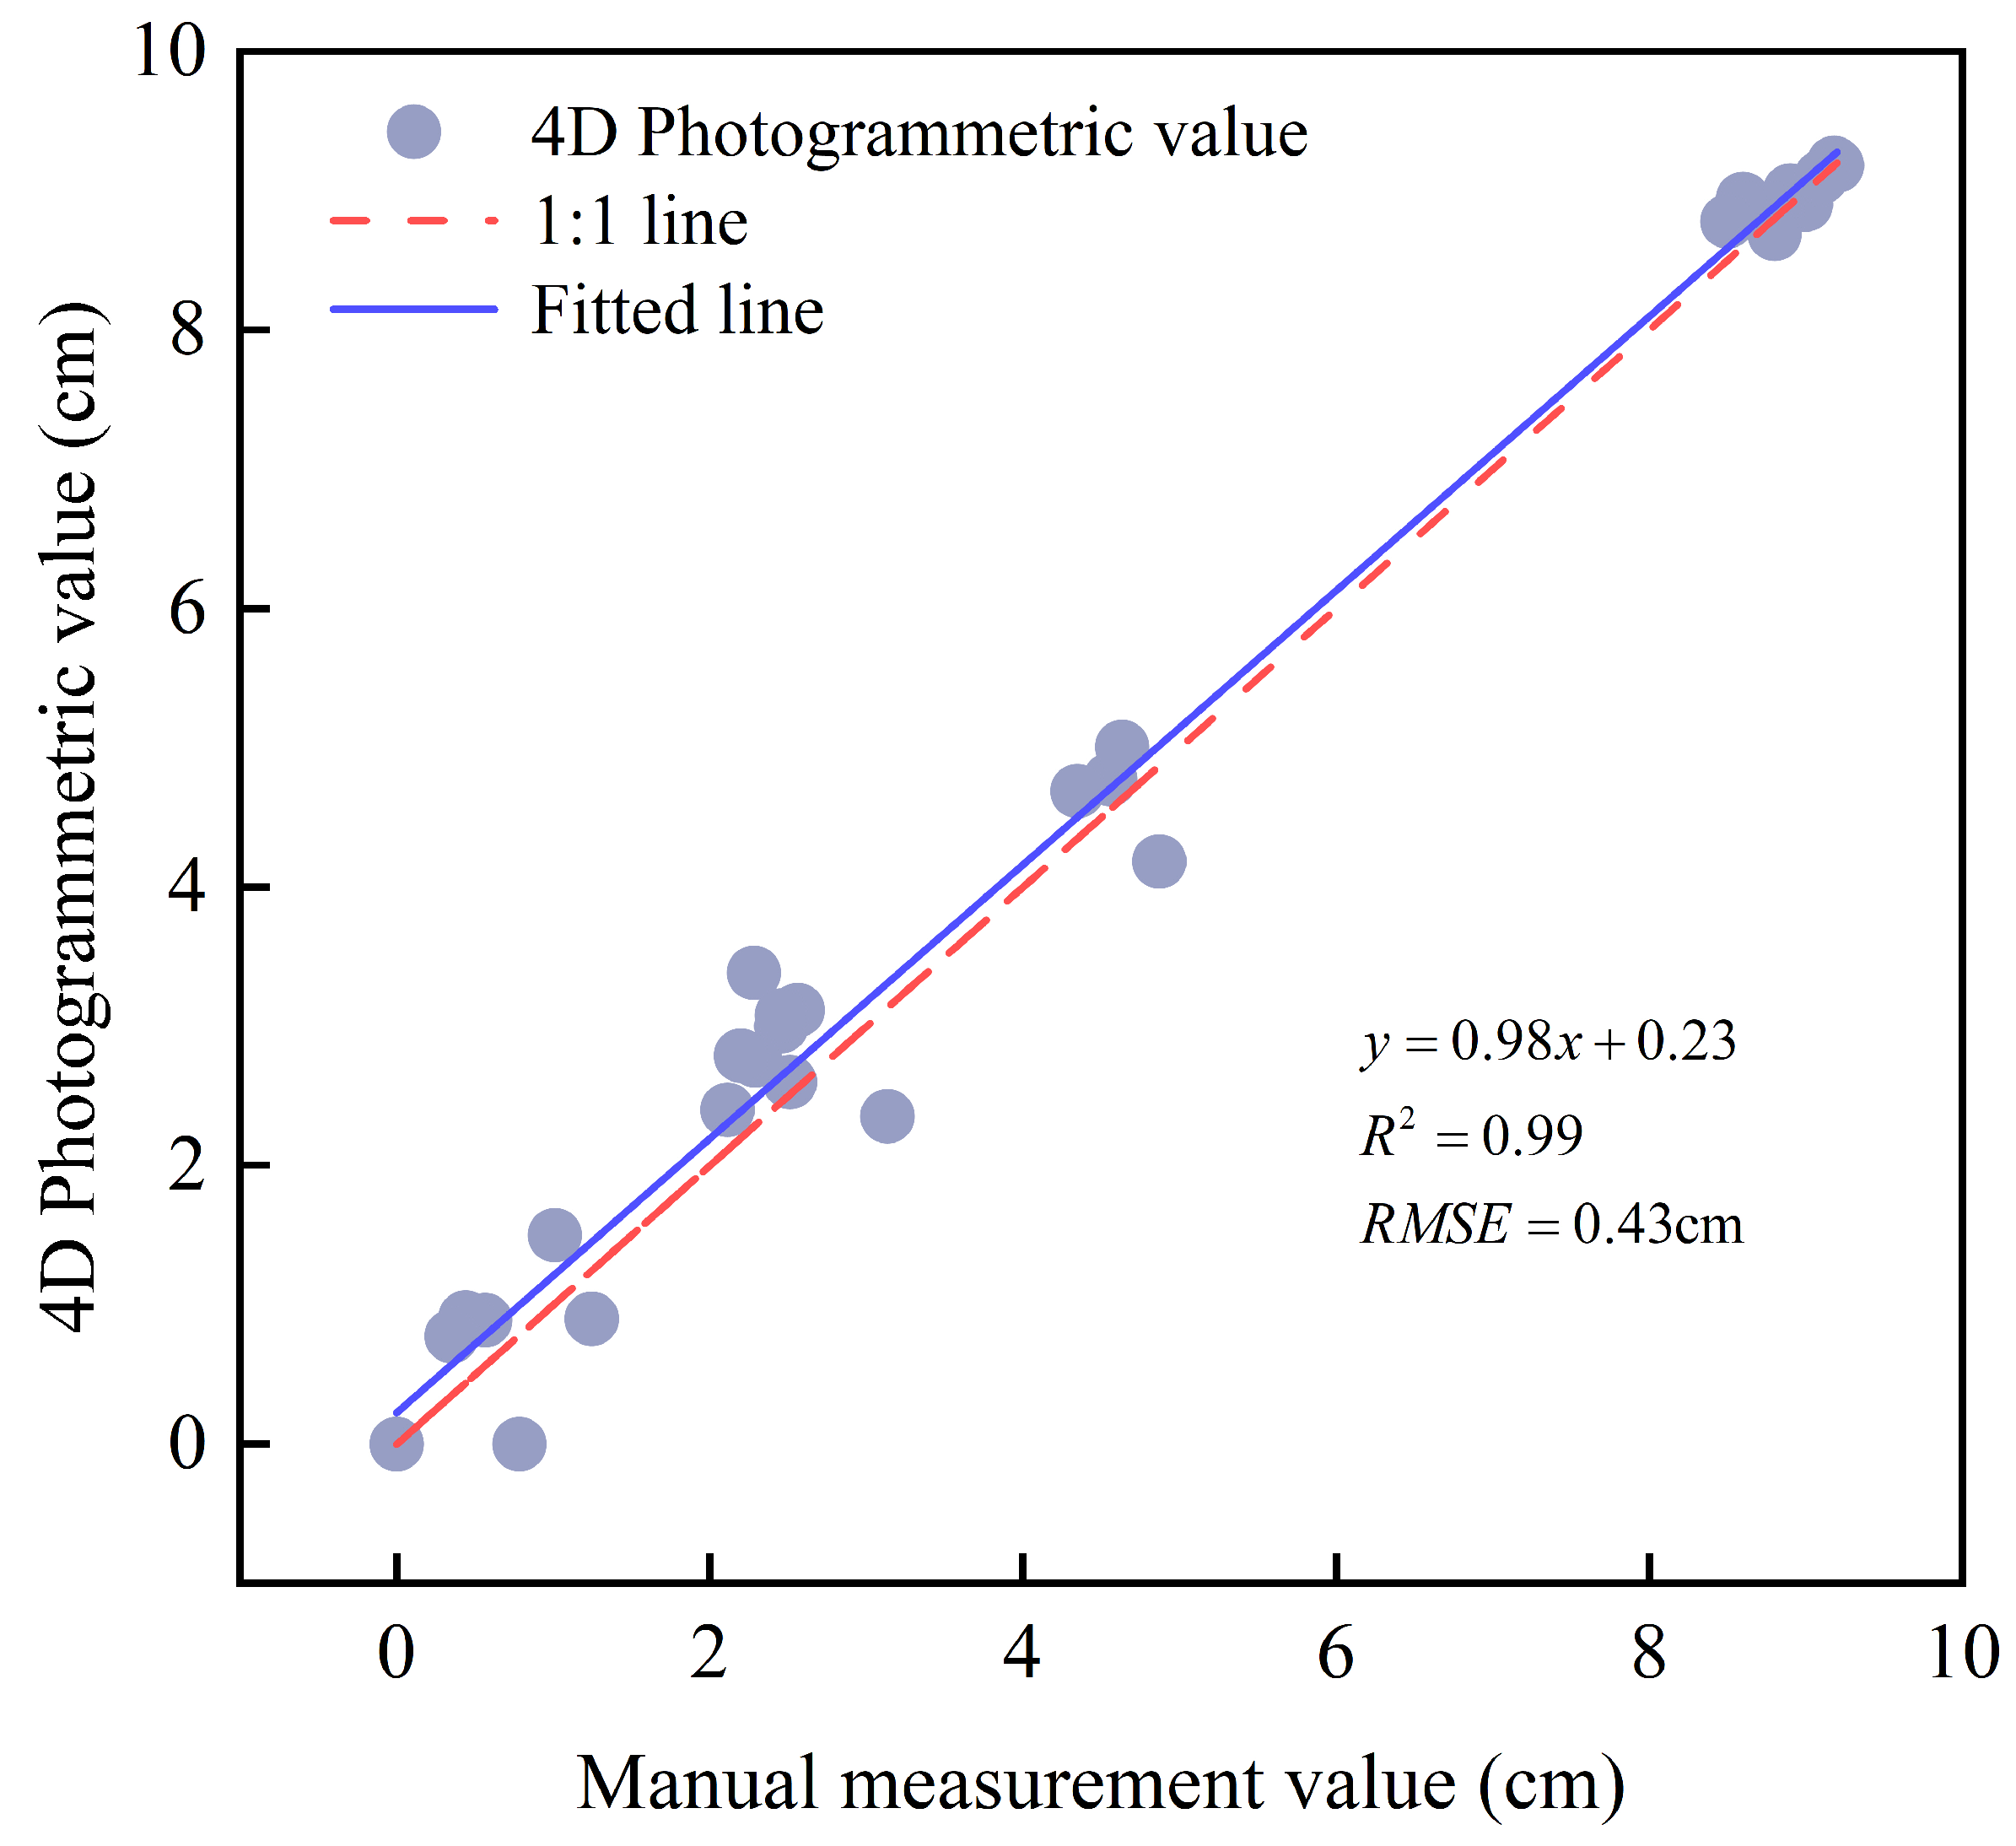
Figure 7 shows the excellent agreement between 4D-SfM photogrammetric and manual reference measurements for the close-range mode. The near-unity slope (0.98) and minimal intercept (0.23 cm) indicate a negligible systematic bias in the river-ice thickness measurements. The low RMSE (0.43 cm) confirms minimal random error. The scatter plot reveals a greater dispersion in measurements for thin ice (0 cm–8 cm) compared with thicker ice (>8 cm). Overall, these results demonstrate that the close-range mode achieves sub-centimeter accuracy with linear response characteristics and minimal offset, confirming its reliability for precise river-ice thickness monitoring.
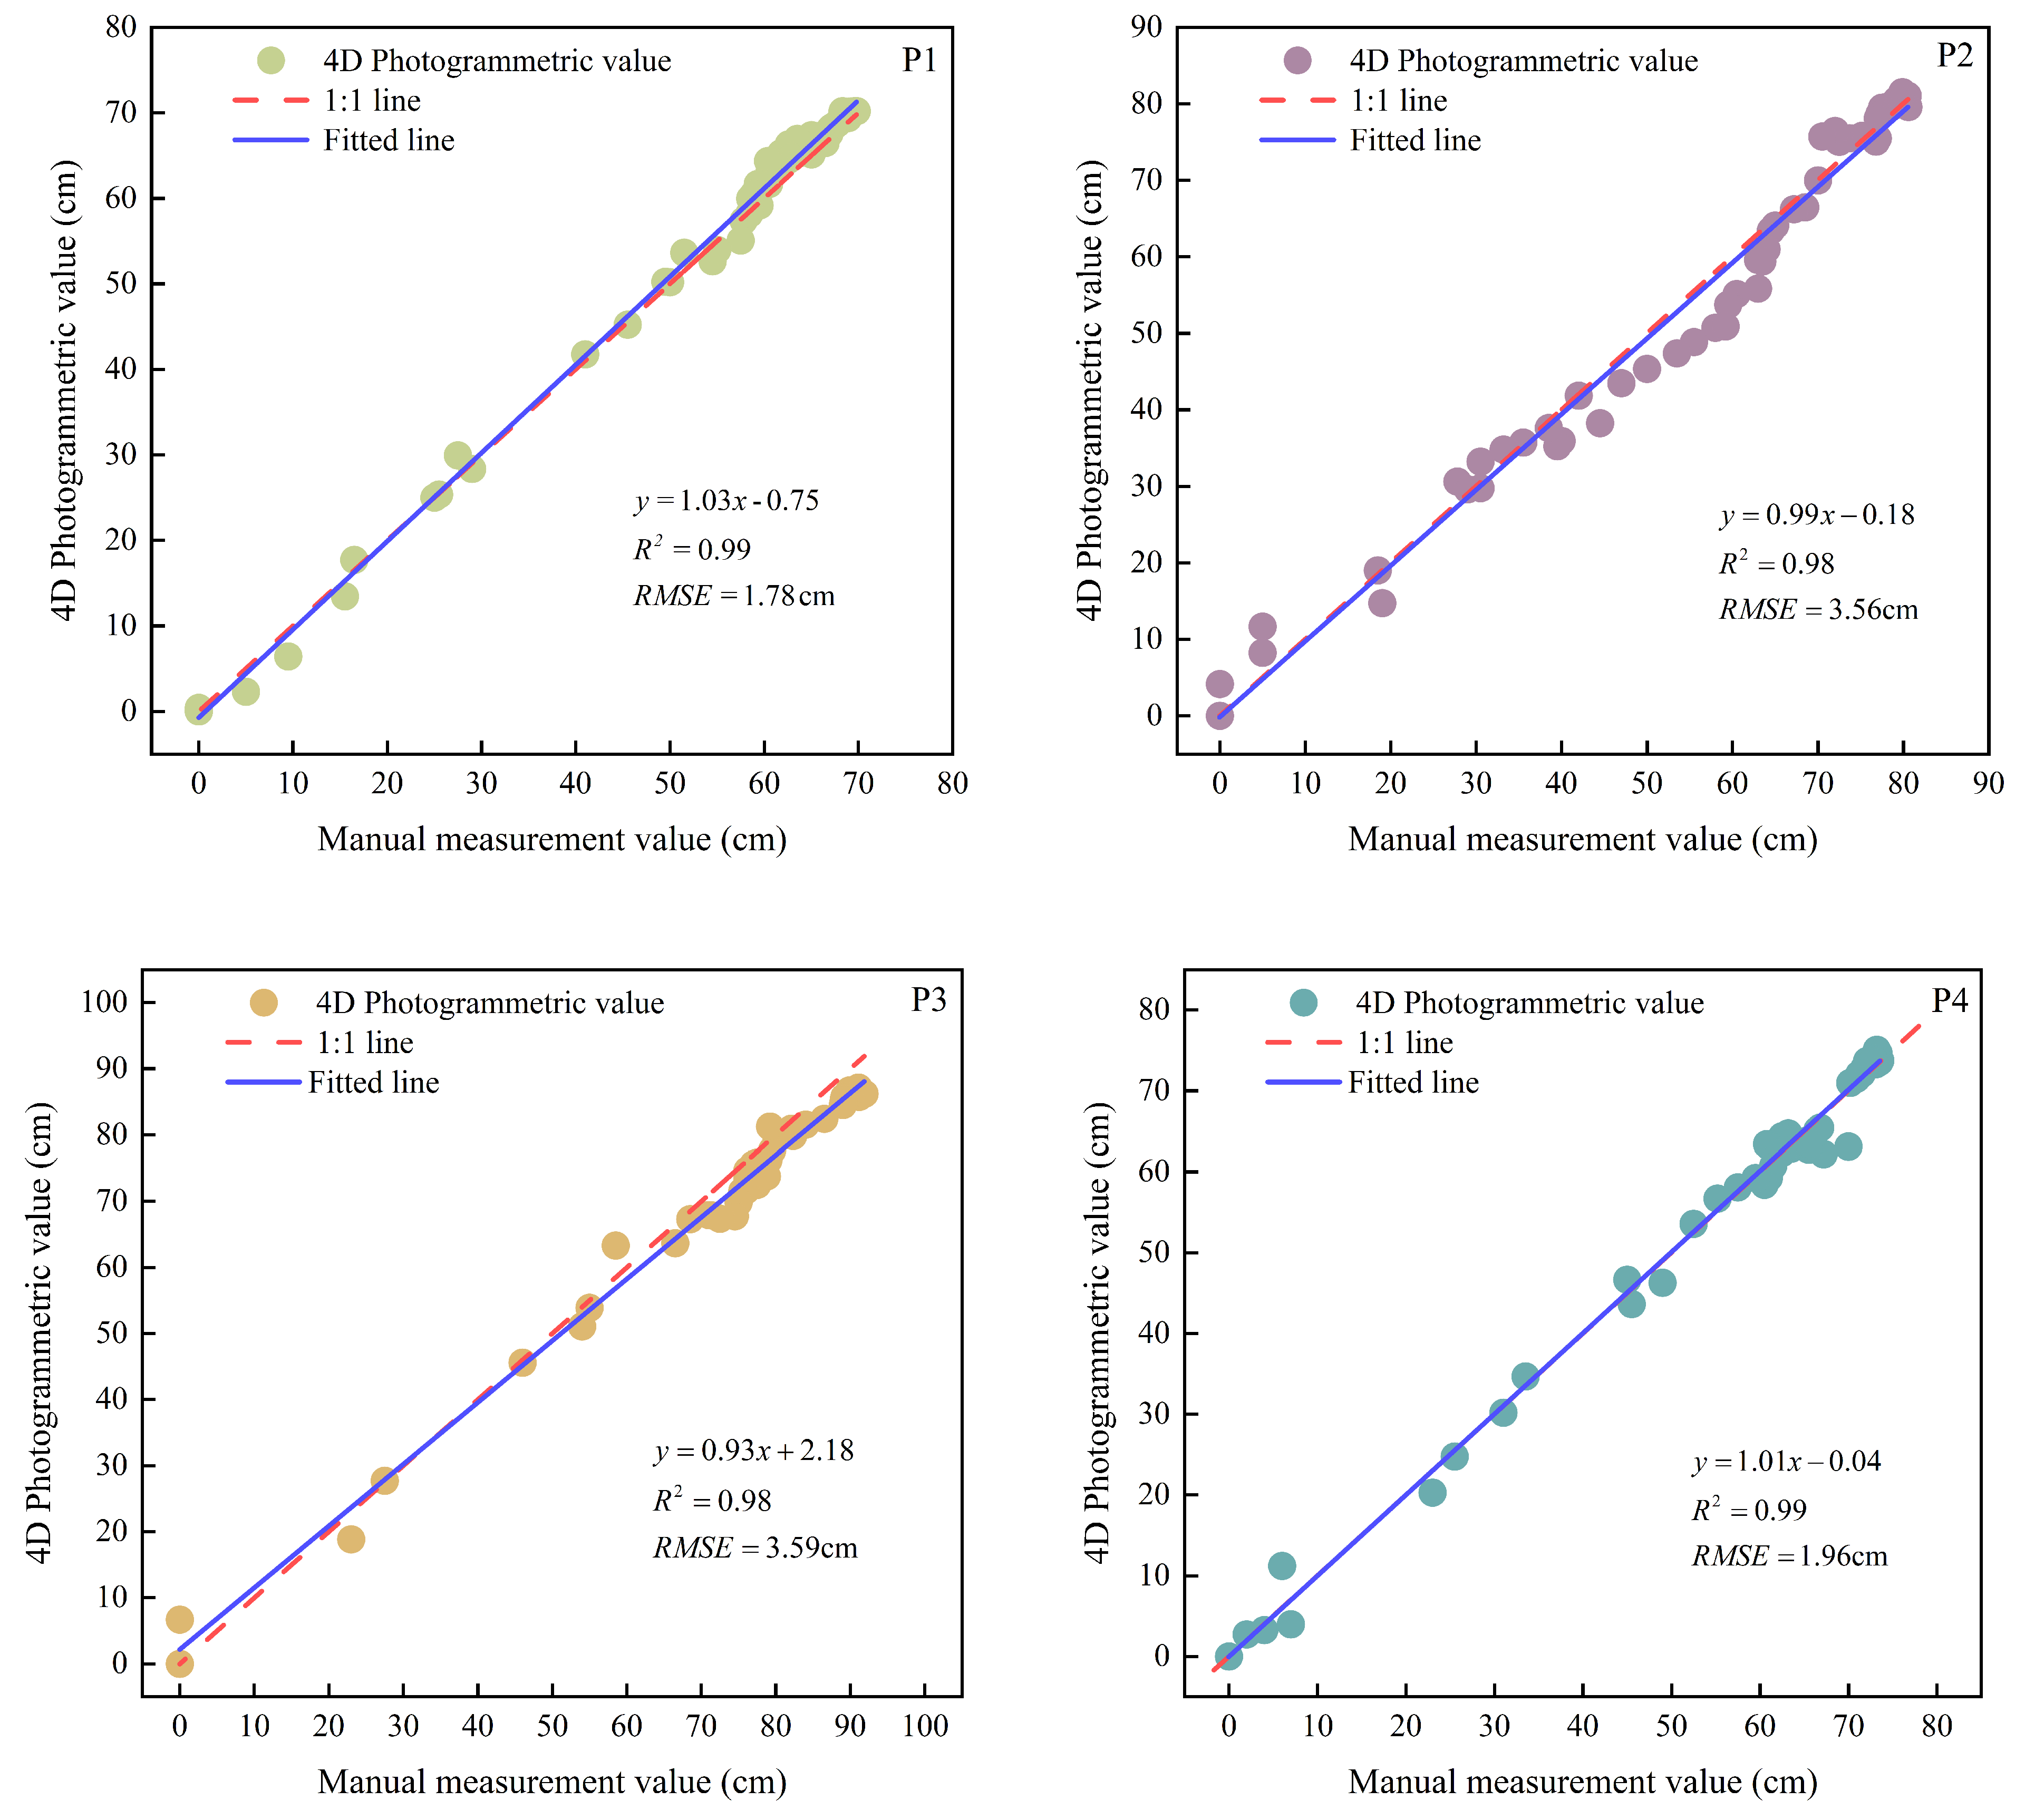
Figure 8 shows the correlation between 4D-SfM photogrammetric measurements and manual reference values across the four mid-range observation points (P1–P4). All four points exhibited strong linear relationships ( R 2 = 0.98–0.99), which were characterized by near-unity slopes and negligible intercepts, confirming that the method accurately captured variations in ice thickness. Specifically, P1 and P4 demonstrated a superior performance with minimal systematic bias and optimal measurement accuracy.
In contrast, P2 and P3 displayed higher RMSEs, indicating reduced measurement precision at these locations. This performance degradation was attributed to spatial positioning effects (Figure 5b), where P2 and P3 were located at greater distances from the camera, resulting in increased image distortion. Furthermore, the proximity of P2 and P3 to the river channel exposed these points to enhanced hydraulic scouring, which created irregular ice-surface topography, generated blind spots, and compromised photogrammetric precision.
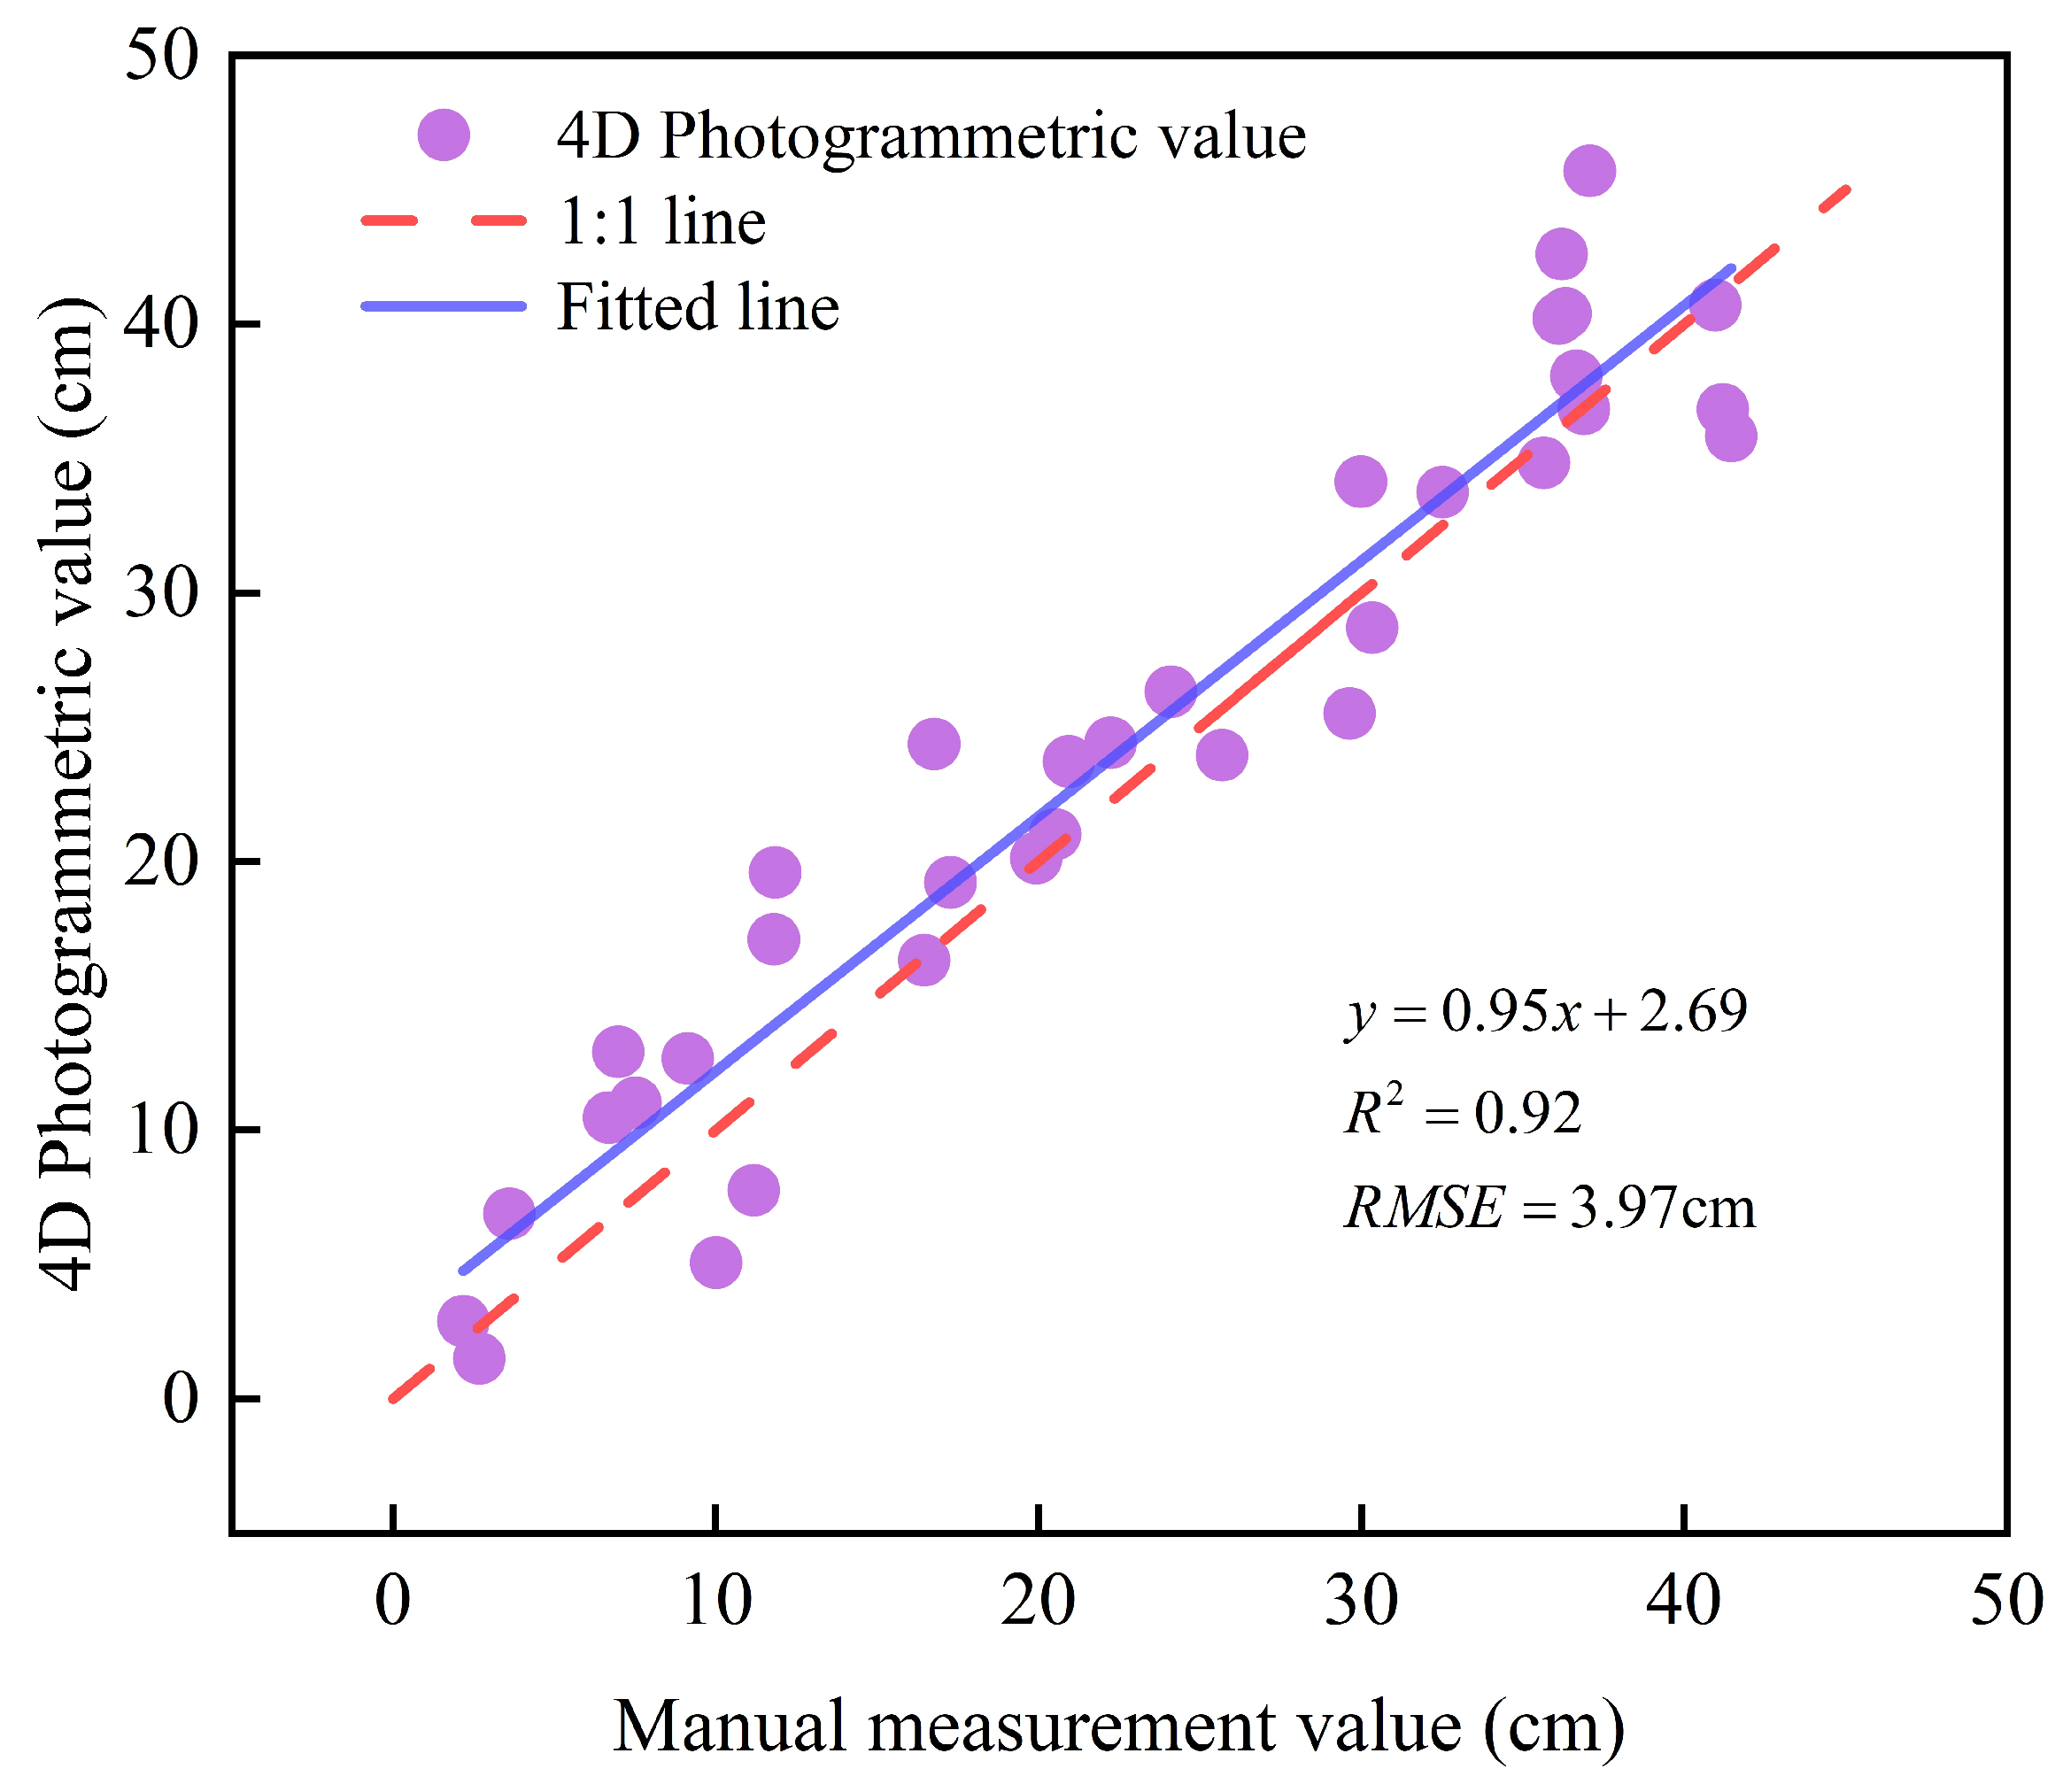
An analysis of the long-range mode revealed a strong correlation ( R 2 = 0.92 ) between the 4D-SfM photogrammetric measurements and manual reference measurements, confirming their viability for assessing river-ice thickness at extended distances (Figure 9). However, precision declined markedly compared with shorter-range configurations. The regression equation displayed substantial systematic bias, as the intercept (2.69 cm) exceeded the slope (0.95), leading to the consistent overestimation of ice thickness relative to the ideal 1:1 line. The increased RMSE (3.97 cm) and greater scatter around the regression line indicated the pronounced propagation of random errors at longer distances, underscoring the inherent limitations of long-range photogrammetric acquisition.
Our analysis identified an inverse correlation between shooting distance and precision in the 4D-SfM-based assessment of river-ice thickness. Close-range measurements achieved sub-centimeter accuracy, mid-range measurements delivered acceptable precision despite spatial variability, and long-range measurements maintained sufficient accuracy for broader monitoring purposes. Optimal monitoring protocols should balance spatial coverage requirements with distance-dependent precision constraints to ensure that measurement accuracy meets application-specific thresholds.

3.2. Analysis of Error Distribution and Influencing Factors

Absolute error analysis, coupled with three-dimensional visualization, was conducted to comprehensively characterize the accuracy and spatial error distribution patterns of 4D-SfM photogrammetry across different measurement ranges (Figure 10). Close-range and mid-range configurations demonstrated superior performance, with absolute errors primarily falling within the range of 0 cm–2 cm. In contrast, long-range measurements showed a substantial decline in accuracy, as evidenced by elevated absolute errors and increased variance, confirming the inverse relationship between measurement distance and precision. These findings quantitatively demonstrate the critical influence of photogrammetric distance on measurement reliability.
The effect of ice thickness was visualized using a bubble chart with color mapping, as shown in Figure 10, which shows that the measurement accuracy varies significantly depending on the stage of river-ice development and ice thickness level. In close-range modes (Figure 10a), ice zones with a thickness of 0-8 cm predominantly exhibited medium-sized green or yellow bubbles interspersed with occasional large purple or blue bubbles, indicating moderate to high absolute errors (0.5–1 cm). In contrast, the thicker ice regions (>8 cm) were characterized by small orange and yellow bubbles, reflecting lower errors (<0.5 cm). This distribution highlights that under close-range modes, thicker ice demonstrates reduced measurement errors compared with thinner ice. This is attributable to the structural instability and irregular surfaces of nascent river-ice during the early formation phases, which impede robust feature detection in structure-from-motion workflows.
In mid-range modes (Figure 10b), thicker ice zones (60–80 cm) displayed dense clusters of small- to medium-sized green, yellow, and orange bubbles, signifying lower errors (0.3–0.8 cm). Conversely, thinner ice areas (0–60 cm) were dominated by medium- to large-sized blue, green, and purple bubbles, indicating elevated errors (up to 1.3 cm) that intensified with accelerating melt rates. These patterns illustrate how measurement errors escalate in tandem with river-ice ablation processes, as thinner, degrading ice introduces surface complexities, such as cracks and melt pools, that degrade photogrammetric reconstruction fidelity. In contrast, long-range modes (Figure 10c) consistently showed high absolute errors across all ice thicknesses (with 10–50 cm thicknesses yielding 2–8 cm errors, primarily represented by large purple bubbles lacking any systematic color gradient linked to thickness). This indicates that in the long-distance mode, there is no significant relationship between river-ice thickness and measurement accuracy.
We employed fixed camera parameters (aperture, shutter speed, and ISO) throughout the river-ice monitoring campaign to maintain consistent acquisition conditions. Under these standardized settings, image quality depended primarily on ambient illumination, resulting in systematic brightness variations across the dataset [38,39]. In close-range mode, image brightness is mainly concentrated between 40 and 60 units, with smaller bubble sizes. As brightness increases, the color transitions primarily from green to red, reflecting the fact that due to enhanced local contrast, the absolute error remains very small (<0.5 cm) even under limited illumination. For mid-range mode, image brightness is mainly concentrated between 60 and 120 units, and there is a denser cluster of medium-sized bubbles. The colors include a mix of yellow, green, and occasional blue, indicating moderate error (up to around 1 cm). At this stage, although increased brightness reduces error, the greater distance begins to introduce subtle geometric distortion. In contrast, long-range mode images, despite having a higher brightness (120–150 units), display larger bubbles, with tones ranging from purple to blue, indicating a significant increase in error (about 2–8 cm).
In conclusion, within the tested illumination range (40–160 brightness units), as well as within the lighting range tested (40–160 brightness units), an increase in image brightness can enhance measurement accuracy to a certain degree. However, extending the photogrammetric distance substantially increased both error magnitude and variance, even under enhanced illumination. These results demonstrate that photogrammetric distance is the primary determinant of measurement precision, with illumination exerting a secondary but quantifiable effect on overall accuracy.

3.3. Spatial Distribution of River-Ice Thickness

By going beyond point-based thickness measurements obtained through manual methods, 4D-SfM photogrammetry enabled comprehensive spatial analysis through the generation of DEMs, facilitating the continuous mapping of river-ice thickness across channel areas. Figure 11 illustrates that DEMs generated at three photogrammetric ranges exhibit systematic, scale-dependent relationships between spatial coverage and reconstruction accuracy.
The close-range configuration produced the most spatially constrained coverage (11.38 m2) and achieved the highest reconstruction accuracy. Figure 11a shows the detailed resolution of riverbank pebble topography and ice-surface microtopography. This enhanced level of detail resulted from the inverse relationship between acquisition distance and pixel resolution, whereby a reduced field of view enabled the superior capture of surface microfeatures.
The mid-range configuration expanded spatial coverage to 33.37 m2—approximately three times that of the close-range setup—although reconstruction accuracy declined in complex topographic areas, where processing algorithms applied surface smoothing to fill data gaps (Figure 11b). The reduced measurement precision observed at points P2 and P3, relative to P1 and P4, confirmed degraded accuracy in these regions, which was attributed to terrain-induced occlusion effects that produced insufficient data density for reliable reconstruction.
The long-range configuration achieved extensive spatial coverage (2642 m2), providing comprehensive channel-scale mapping with clear delineation between the river channel and riverbank zones; however, surface characteristics were smoothed, reflecting reduced resolution (Figure 11c). Although the long-range acquisition effectively captured macroscale terrain variations with enhanced vertical-range representation, measurement precision decreased owing to reduced photogrammetric intersection angles and diminished geometric strength.
The analysis revealed a fundamental trade-off between spatial coverage and reconstruction accuracy in 4D-SfM digital elevation modeling. Close-range setups achieved higher precision for detailed microtopographic analyses within limited areas, whereas long-range acquisitions provided comprehensive spatial coverage for macroscale river-ice distribution assessments. This scale-dependent performance underscores the need for strategic acquisition planning to align measurement objectives with appropriate photogrammetric configurations.

3.4. Temporal Variations in River-Ice Thickness and Distribution of Relative Percentage Accuracy

Figure 12 shows the variation pattern of river-ice thickness at different shooting distances, as well as the distribution of percentage accuracy R E _ 55 cm relative to the average thickness (55 cm). Overall, the R E _ 55 cm remains below 5 % for both close- and mid-range configurations, indicating that 4D-SfM photogrammetry achieves exceptional accuracy at these distances. In contrast, the long-range R E _ 55 cm values predominantly range between 0 % and 10 % , with some measurements exceeding 10 % . Furthermore, the long-range error exhibits significant fluctuations, suggesting that while long-distance monitoring can still attain acceptable accuracy, its precision is inherently less stable. This variability likely arises from reduced spatial resolution and increased sensitivity to environmental factors (e.g., lighting and atmospheric conditions) at greater distances.
Figure 12a shows that during the initial formation phases, close-range temporal analysis revealed oscillatory behavior in ice thickness, with variations ranging from 0 cm to 5 cm. These fluctuations reflect the inherent instability of thin ice formations under dynamic thermal and hydraulic conditions, where temperature variations and flow-regime changes significantly affected structural integrity. Photogrammetric measurements showed strong agreement with manual reference data, with only minor deviations of 0.5 cm–1 cm occurring at temporal extrema, confirming the method’s reliability under dynamic ice conditions.
The mid-range monitoring results (Figure 12b) showed nonlinear ablation dynamics, with photogrammetric and manual measurements exhibiting excellent correlation. Ice thickness followed exponential decay characteristics, as described by the relationship y = 77.60 1.42 e x 13.86 , with a strong predictive capability ( R 2 = 0.98 ). Notably, the ablation process exhibited two distinct temporal phases—gradual thickness reduction occurred between 6 February and 15 March, followed by accelerated melting through 4 April. This biphasic ablation pattern indicates seasonal energy-balance evolution. During the initial period, limited solar radiation input due to low sun angles and reduced daylight hours, combined with a high surface albedo from residual snow cover reflecting most incident radiation [40], maintained sub-threshold energy conditions for significant melting despite near-freezing temperatures. The total radiant energy absorbed was insufficient to provide the heat required for substantial melting [41]. Subsequently, increasing solar elevation, extended photoperiods, and sustained warming created positive energy-balance conditions that accelerated melting.
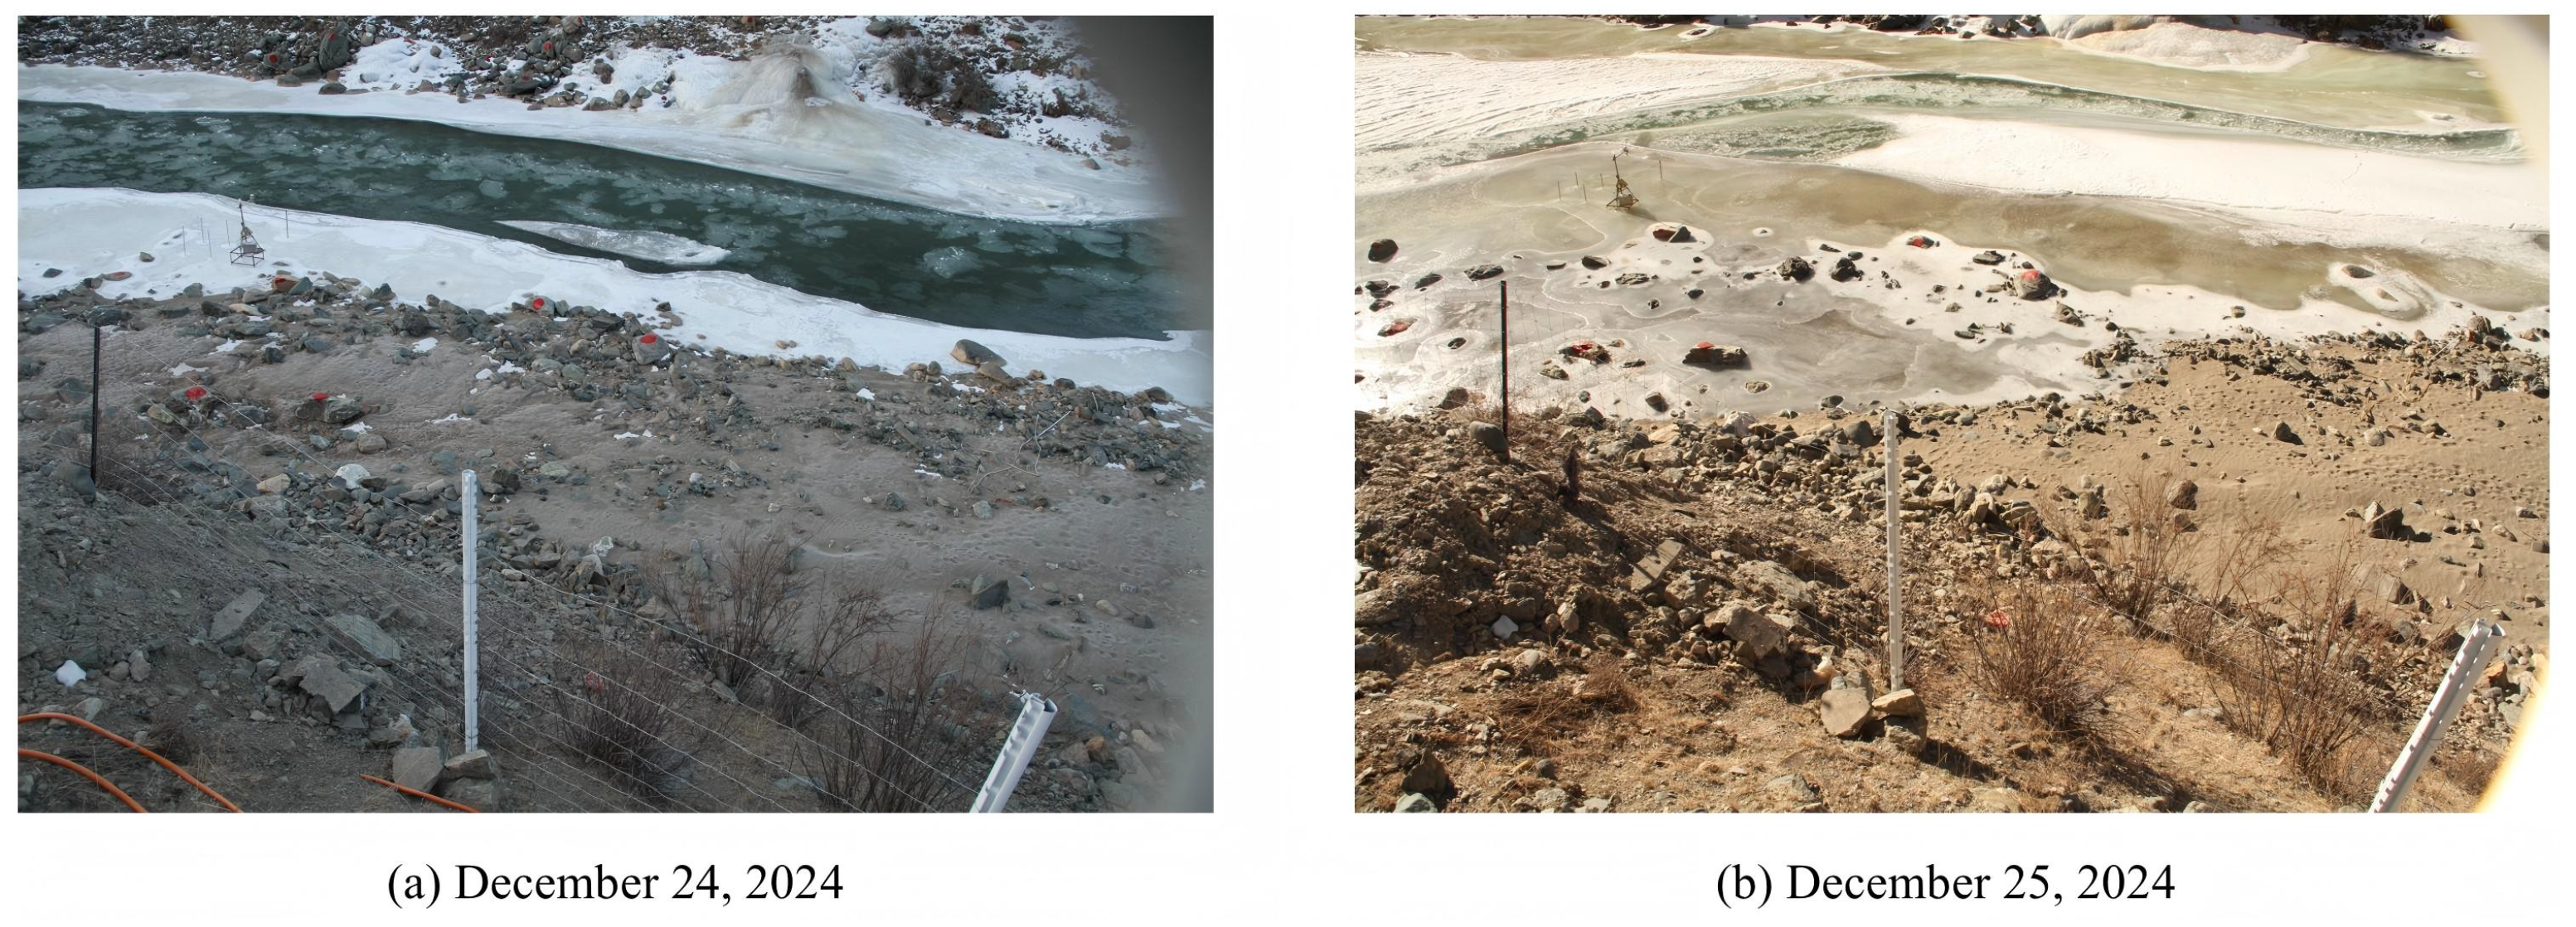
Despite increased measurement uncertainty, long-range monitoring successfully captured ice formation dynamics, showing trend agreement between methods (Figure 12c). Ice formation followed exponential growth patterns, as described by y = 15.09 e x 23.50 11.12 , with a good model performance ( R 2 = 0.90 ). The formation dynamics progressed steadily from 21 November to 24 December, followed by a striking 30 cm thickness increase on 25 December. This abrupt increase may be caused by upstream ice-jam formation that restricted flow capacity, causing rapid water level increases and subsequent icing processes (aufeis formation) on adjacent bank areas under sustained sub-zero conditions [42,43]. This hydraulic ice formation mechanism produced the observed 30 cm thickness increment independent of atmospheric thermal processes.
Overall, these results show that 4D-SfM photogrammetry successfully captured river-ice thickness trends across all three measurement ranges. While close-range and mid-range configurations achieved optimal precision, long-range measurements exhibited increased uncertainty, although trends remained statistically significant. The temporal analysis revealed that ice thickness evolution followed nonlinear patterns during both the formation and ablation phases, reflecting the complex interactions between meteorological forcing and hydrological processes. These findings indicate that accurate river-ice monitoring requires consideration of multiple environmental drivers beyond simple thermal conditions.

3.5. The Development Process of Different Types of River-Ice

As a river-ice monitoring method with high temporal resolution, 4D photogrammetry enables the continuous monitoring of the development processes of different river-ice types by generating DOM images. In this study, the formation processes of both shore ice and anchor ice within the study area were monitored.
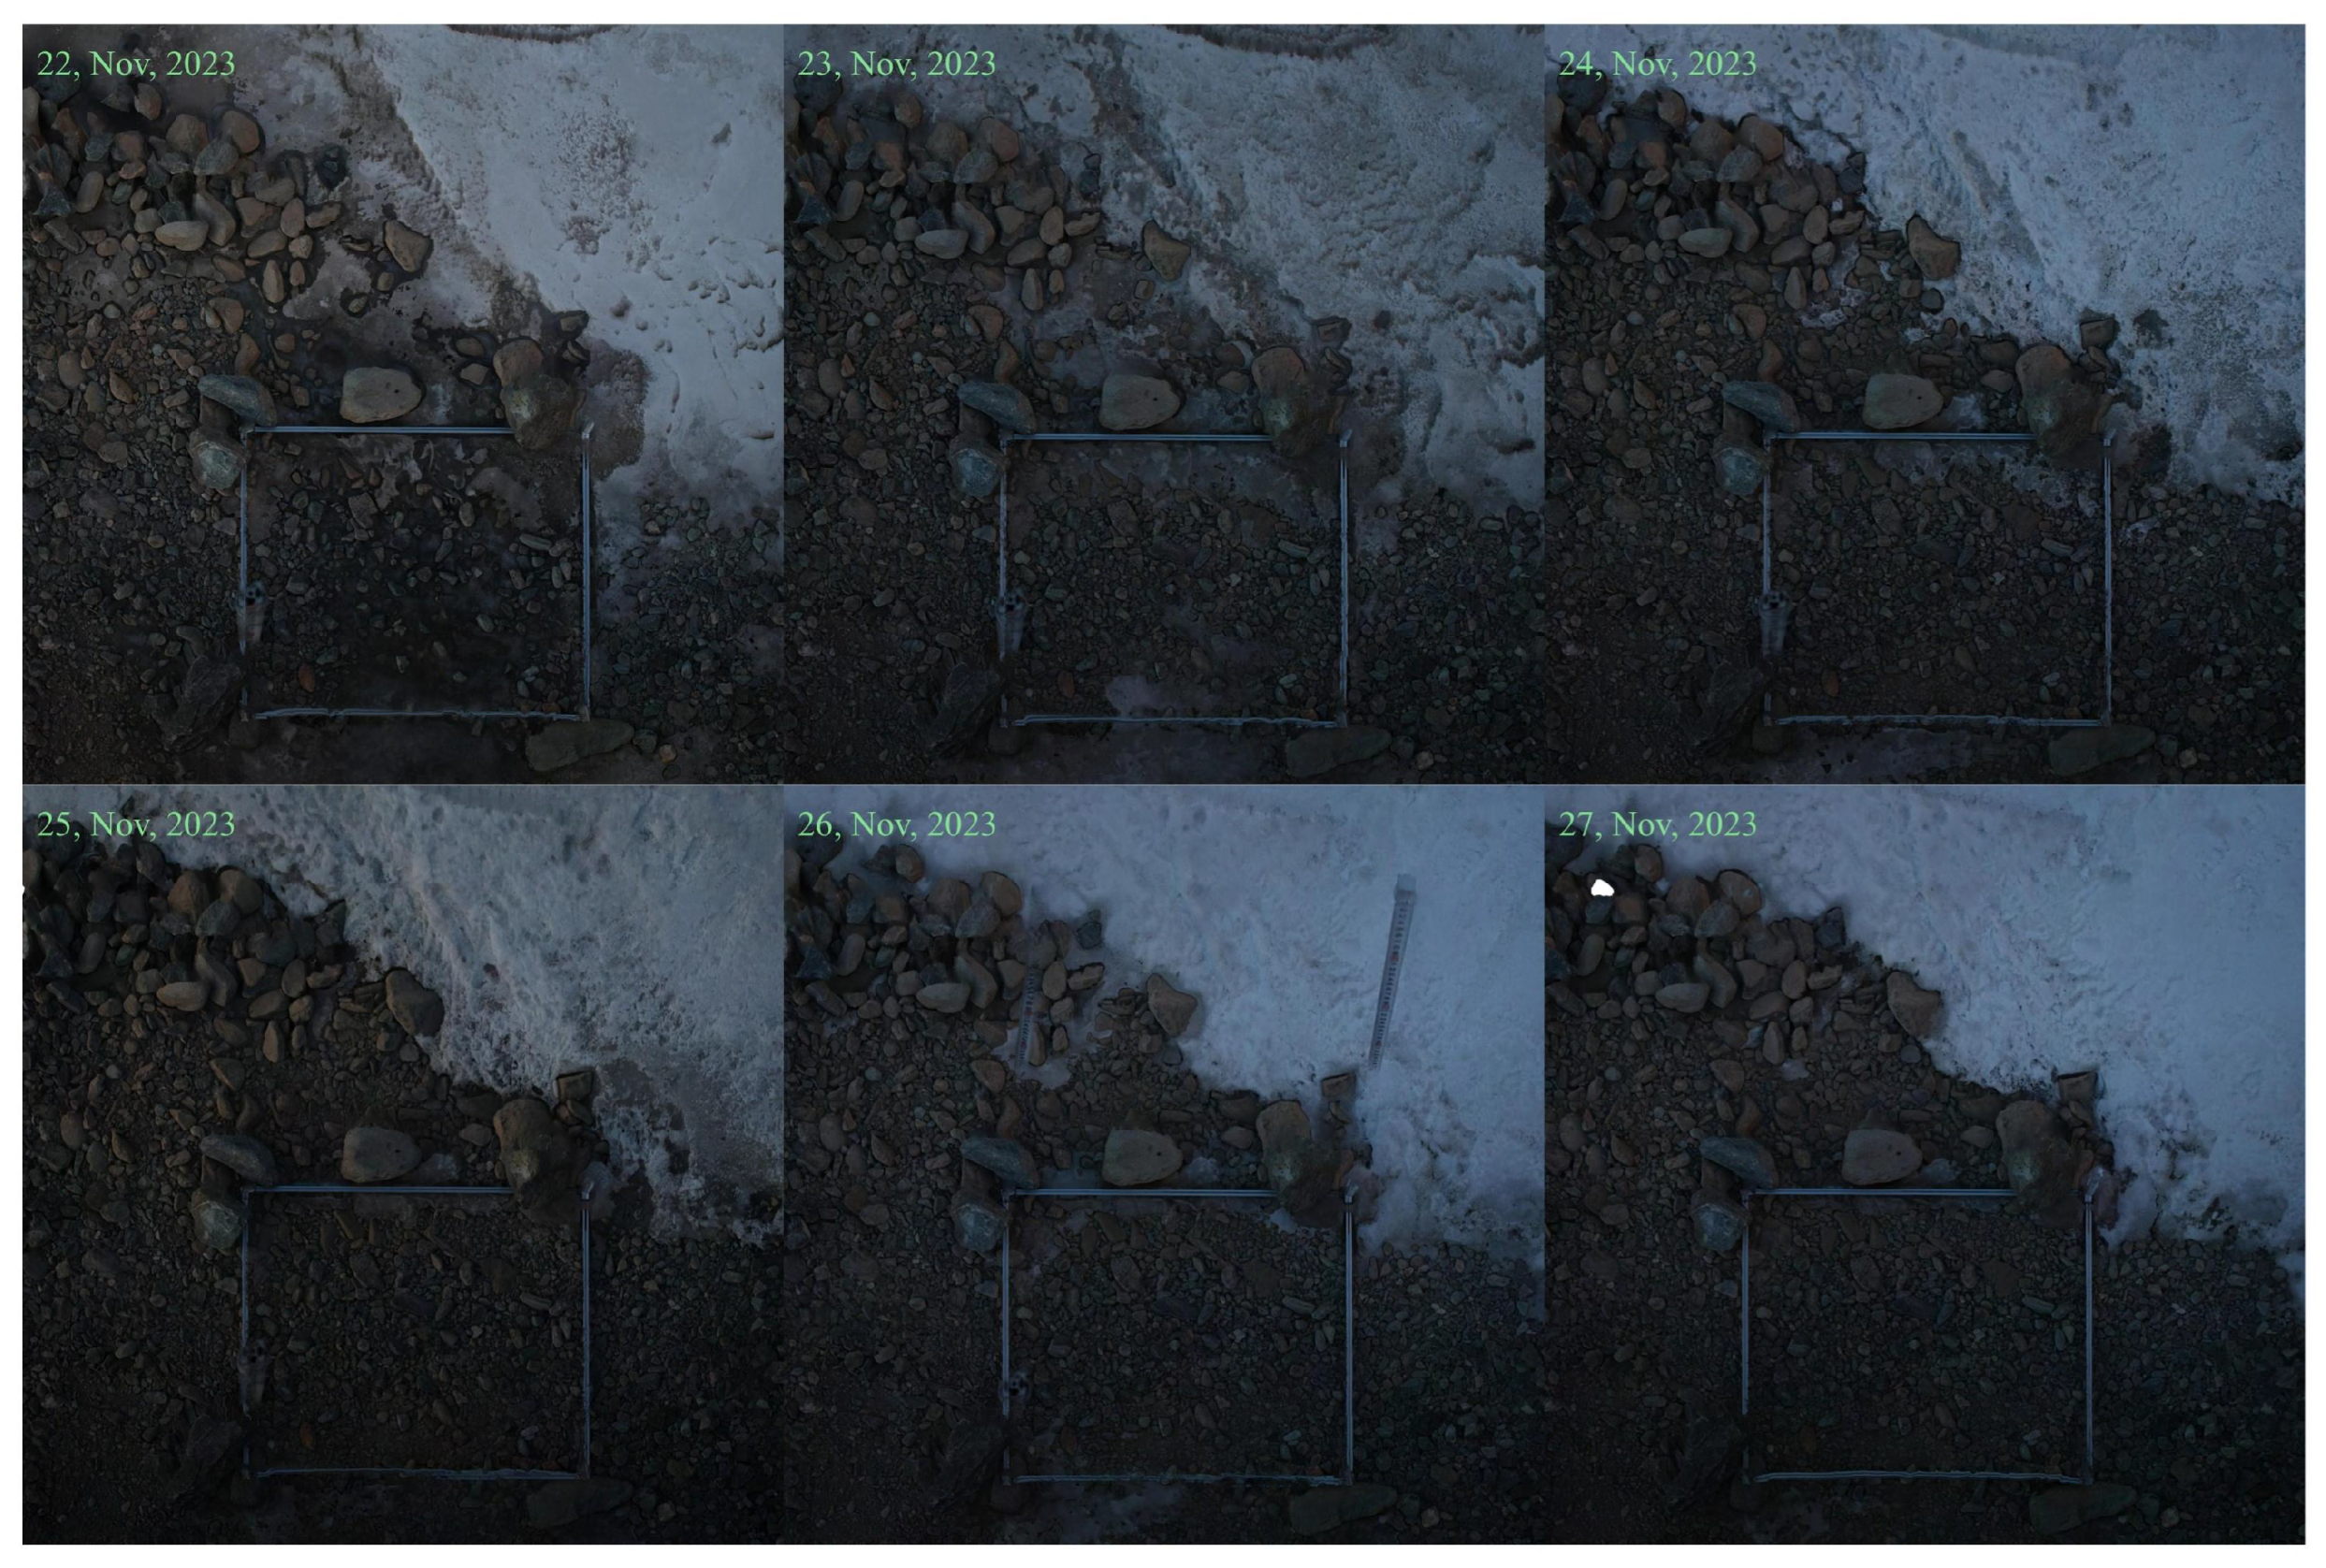
Figure 13 shows the development of shore ice from 22 to 27 November 2023. On 22 November, a thin layer of ice first appeared along the riverbank, with a relatively smooth surface characteristic, as is to be expected of newly formed ice. As temperatures continued to drop, the extent of the shore ice gradually increased from 23 to 24 November. Due to the significant temperature difference between day and night in the Qilian Mountains, the ice layer thickened rapidly at night and partially melted during the day, resulting in an irregular surface structure. The pebbles on both sides of the riverbank were gradually covered by the ice, forming a typical composite structure of shore ice and riverbed. During the period from 25 to 27 November, the thickness of the ice layer further increased, the ice surface became smoother, and the shore ice structure grew denser, indicating that stable shore ice had begun to form.
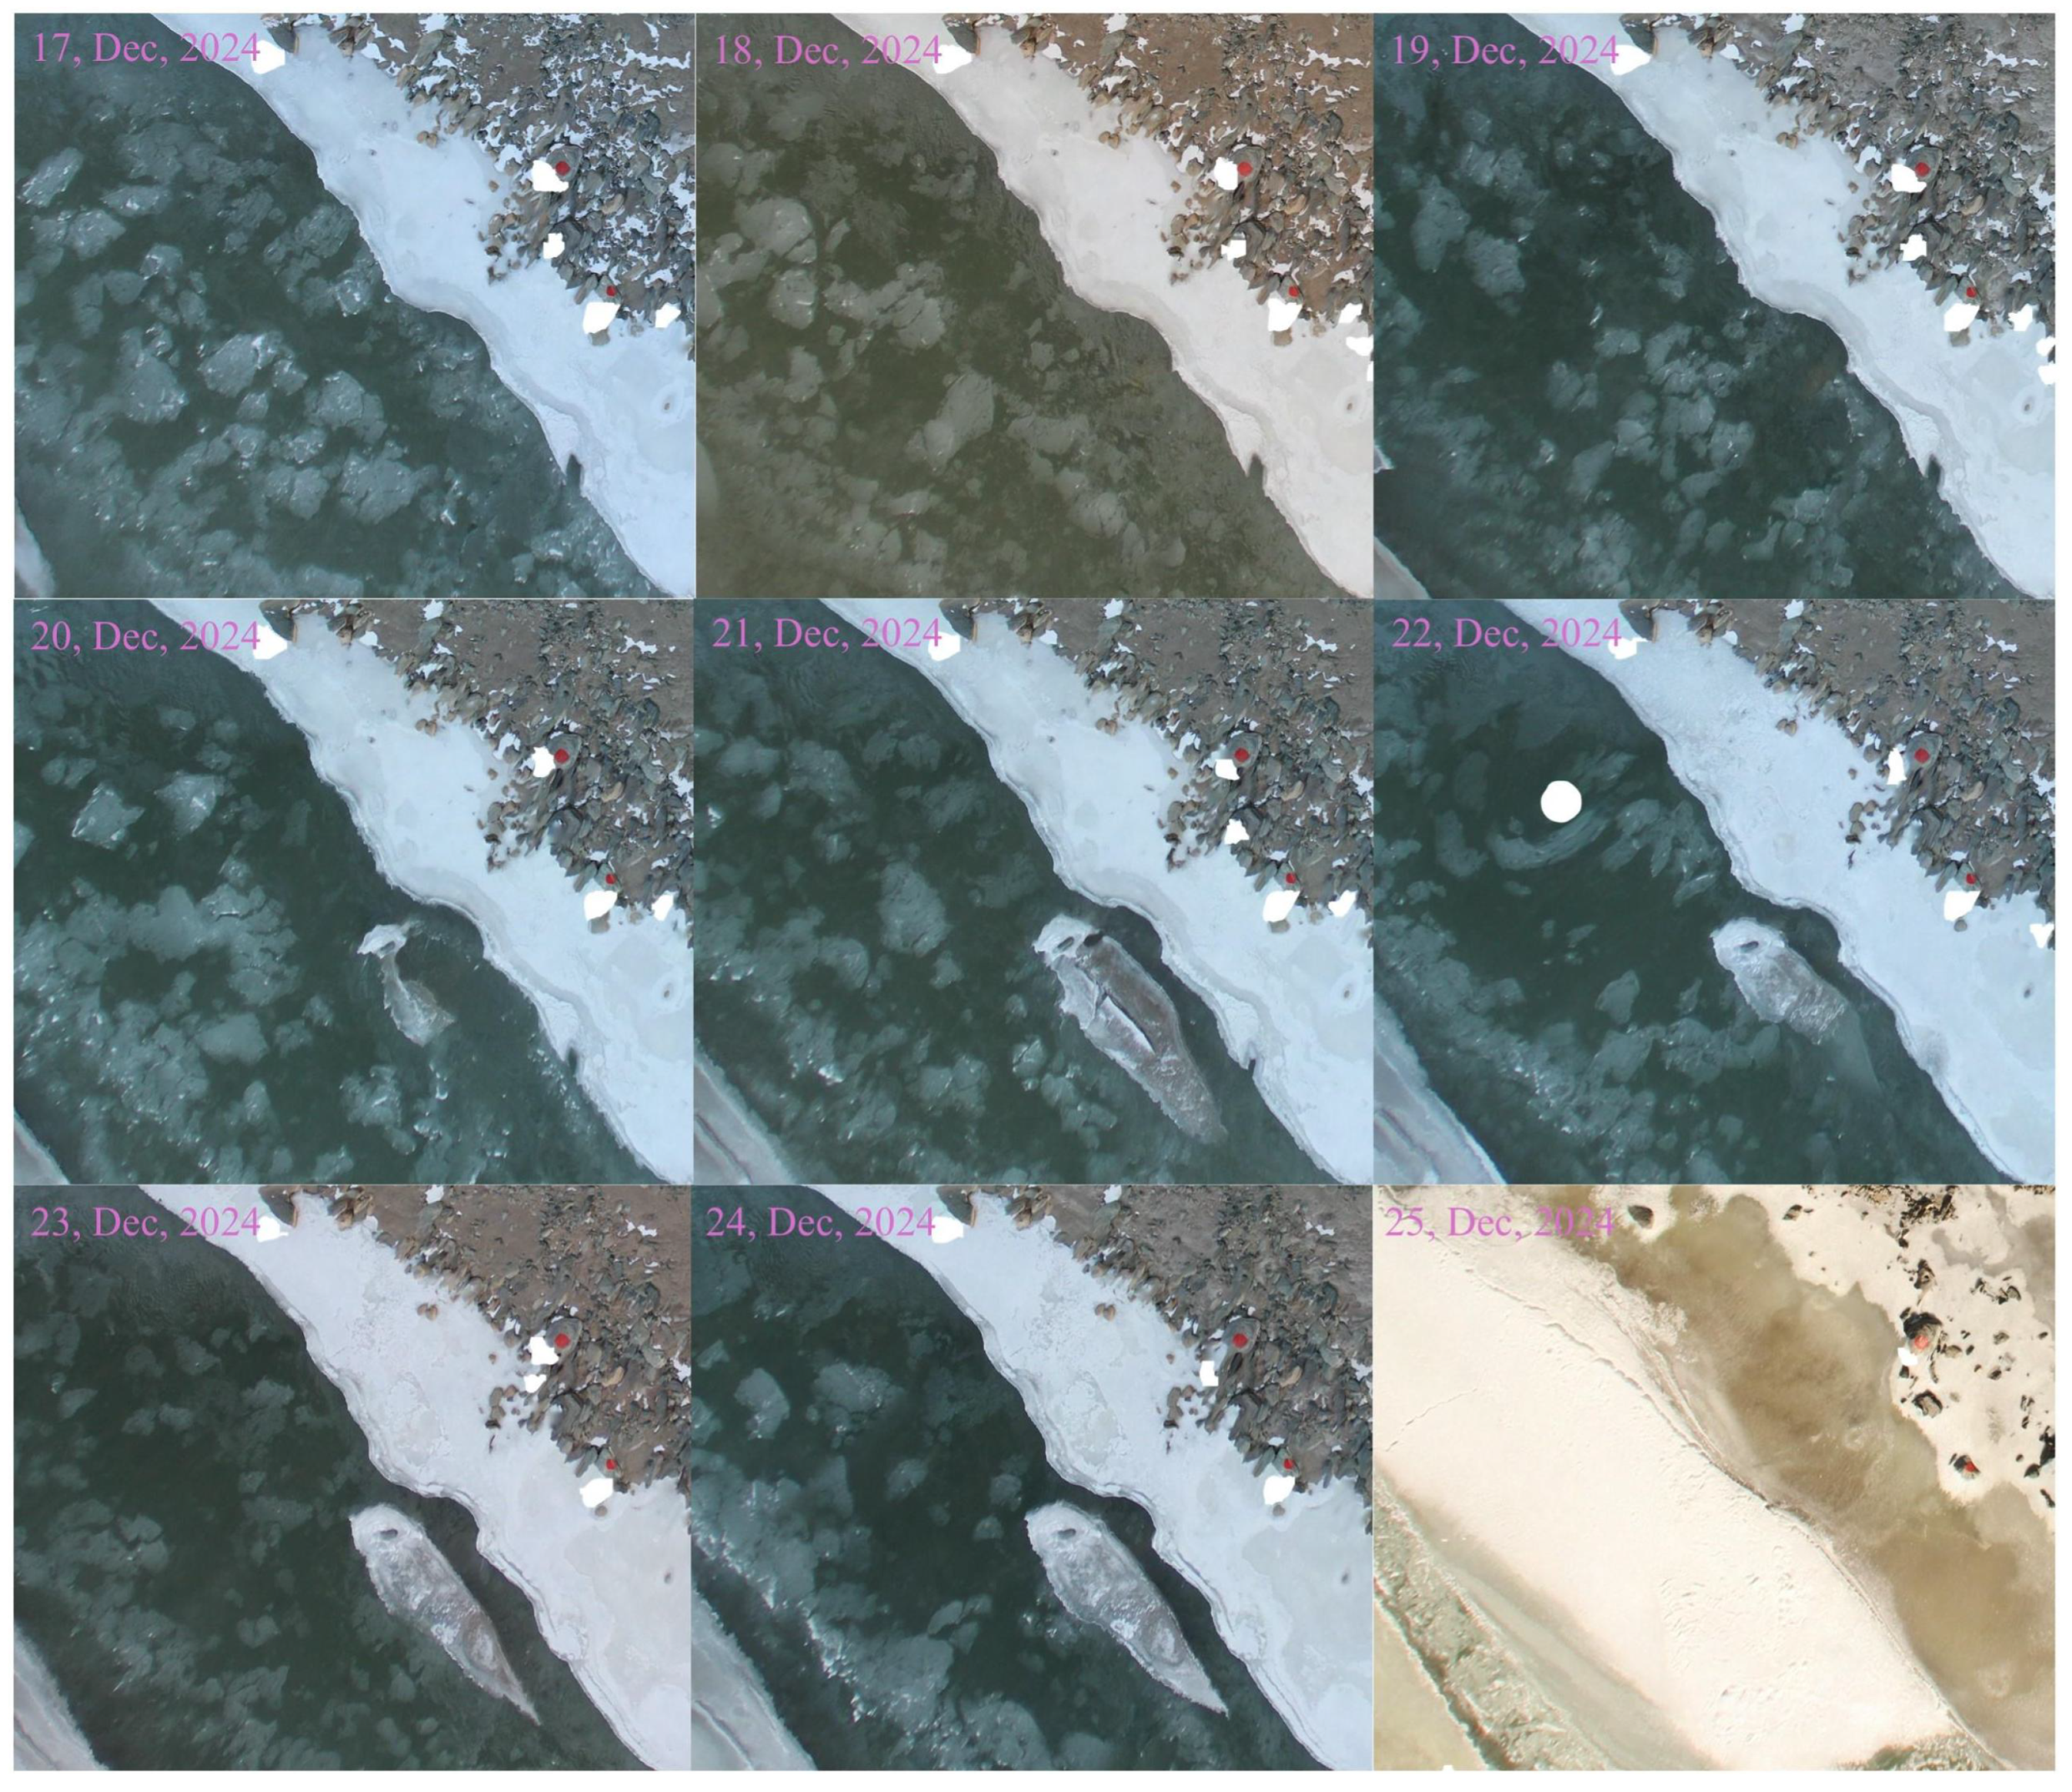
Figure 14 shows the development process of anchor ice from 17 to 25 December 2024. From 17 to 19 December 2024, which is the initial stage, drifting ice predominates in the river channel. On 20 December, the initial formation of anchor ice can be seen on the river channel. Between 21 and 24 December, the area of anchor ice gradually increases and the river’s flow cross-section shows a decreasing trend. However, on 25 December, an event occurred downstream that caused the river water level to rise. Water overflowing from the river channel rapidly froze due to low temperatures. As a result, the ice thickness increased sharply and the flow cross-section decreased suddenly, causing the original anchor ice structure to disappear.

4. Discussion

4.1. Analysis of Factors Affecting 4D-SfM Photogrammetric Accuracy

Our results demonstrated a strong inverse relationship between shooting distance and photogrammetric accuracy, which was primarily driven by the corresponding increase in GSD. The GSD values increased substantially from 0.053 cm/ p i x in close-range mode to 0.075 cm/ p i x in mid-range mode and 1.79 cm/ p i x in long-range mode. This finding indicates that greater camera-to-surface distances cause individual pixels to represent larger ice surface areas, thereby reducing spatial resolution. As a consequence, the loss of fine-scale surface detail impairs feature-matching algorithms [44,45], leading to increased noise and reconstruction errors in 3D model generation. Collectively, these effects ultimately degrade overall model accuracy and reliability [46]. This relationship between shooting distance and accuracy holds important implications for optimizing the photogrammetric monitoring of river-ice.
Despite apparent increases in overall image brightness at greater shooting distances, 4D-SfM measurement accuracy declined significantly, indicating that brightness alone was insufficient to compensate for spatial resolution losses. This counterintuitive relationship could be attributed to two complementary mechanisms. Initially, extended shooting distances increased the atmospheric path length, which resulted in enhanced light scattering interactions with aerosol particles and water vapor [47]. Additionally, greater distances reduced the relative proportion of ice surface within the camera’s field of view, thereby allowing increased background elements (riverbanks and water bodies) to contribute to overall image brightness without improving ice surface detail resolution [48]. These findings demonstrate that GSD-related resolution losses fundamentally limit 4D-SfM accuracy regardless of ambient lighting conditions, thus establishing shooting distance as the primary determinant of measurement precision.
DEM accuracy exhibited marked deterioration in regions of high ice surface undulation, revealing fundamental limitations in the SfM-based reconstruction of complex topography. Pronounced surface undulations created variable shooting angles that, when combined with shadows and specular reflections from water surfaces, generated discontinuous point clouds with significant data gaps. Agisoft Metashape Pro addressed these discontinuities through least squares or polynomial interpolation algorithms [49], which estimated missing elevation values based on surrounding planar surfaces. However, this interpolation approach systematically underestimated both depression depth and edge sharpness, as it could not accurately reconstruct the complex three-dimensional geometry of undulated surfaces. Consequently, DEMs generated in these challenging areas provided an inadequate representation of true ice thickness variability, particularly within depressed regions where accurate measurement was often most critical [50].
However, several limitations should be noted regarding the broader applicability of these findings. The present study was constrained by the topographical conditions on both sides of the river channel and did not account for the impact of shooting height and camera angle on the accuracy of river-ice measurements. It is well-established that different shooting heights [51] and angles [52] can significantly influence the coverage area and ground resolution of images, which, in turn, affects the accuracy of the DEM. Therefore, future work should integrate the optimization of the distance, height with the angle between the camera and the river-ice surface in order to enhance measurement precision. This integrated approach will be essential for establishing standardized protocols to optimize measurement accuracy across diverse riverine environments and ice conditions.

4.2. Analysis of Extreme River-Ice Events and Evaluation of the Capture Capability of 4D-SfM Photogrammetry

This study found that during the monitoring period from 24 to 25 December 2024, the 4D-SfM photogrammetry device successfully captured a sudden increase of 30 cm in the river-ice thickness. Moreover, field photographs clearly show a significant expansion in river-ice coverage and a marked reduction in the flowing water cross-sectional area. To explain this unusual phenomenon, we analyzed two driving factors of river-ice: meteorological and hydrological conditions. Relevant studies indicate that the formation of river-ice is closely related to heat transfer between ice and air [53]; changes in meteorological conditions often have a significant impact on this process [54]. Considering the lag effect in river-ice formation [55], we collected meteorological data from the study area for the period from 21 to 25 December 2024, as well as hydrological data recorded at the Zhamaishike Hydrological Station, located approximately 20 km downstream from the study area (Table 1).
However, a comparative analysis of the meteorological data during this period showed that the daily changes in air temperature and wind speed before and after the sudden increase were not significant, indicating that no severe cold wave occurred during this time frame [7]. After ruling out meteorological factors and considering the reduction in downstream flow and water level on 25 December (Figure 15), we inferred that this sudden increase in river-ice thickness may be associated with an ice-jam downstream [56]. Specifically, the formation of an ice-jam relatively close to the downstream area caused the water levels in the study area to rise [56,57]. Combined with low temperatures, this led to the rapid freezing of overflow water on top of the existing ice surface, resulting in the formation of approximately 30 cm of superimposed ice [57].
The precise capture of this sudden river-ice thickening event benefited from the high temporal resolution of the 4D-SfM photogrammetry method [58]. Compared to common river-ice monitoring approaches, satellite remote sensing often has a long revisit cycle, introducing uncertainty in determining the timing of ice-jams or dam formation [3]. Meanwhile, aerial equipment, such as drones, can usually survey ice-jams only after they have already formed [59]. However, it is important to acknowledge that due to the limited spatial coverage of the 4D-SfM photogrammetry system employed, this monitoring effort was unable to pinpoint the exact location or dimensions of the ice-jam. To address this issue, the future deployment of monitoring instruments along both banks should include an evaluation mechanism to specifically select river segments prone to ice-jams and narrow stretches for focused monitoring.

4.3. Comparison Between 4D-SfM Photogrammetric Techniques and Conventional River-Ice Thickness Measurement Methods

To comprehensively evaluate the effectiveness of 4D-SfM photogrammetry for river-ice thickness determination, this study presents a systematic comparison with traditional measurement techniques (Table 2). The comparison reveals that conventional methods typically exhibit inherent trade-offs between measurement accuracy and spatial coverage, with most techniques being constrained by weather dependency and manual operation requirements. In contrast, the 4D-SfM photogrammetric approach combines the advantages of both contact and non-contact methodologies, achieving the precision of contact methods while maintaining the comprehensive spatial coverage of non-contact techniques. The aluminum alloy frame with integrated scale serves as a critical component exemplifying this integration, functioning both as a control field for photogrammetric processing and as a direct measurement tool for calibration data generation. This dual functionality enables both photogrammetric accuracy validation and data gap interpolation, ensuring continuous monitoring coherence. The monitoring system’s streamlined design, characterized by minimal mechanical complexity and low failure rates, features robust image storage capabilities. This configuration eliminates the need for permanent field personnel deployment, requiring only periodic maintenance to sustain continuous and reliable river-ice thickness monitoring operations.
Despite these advantages, the 4D-SfM photogrammetric method presents several operational limitations that warrant consideration. Snowfall events significantly compromise control point marking accuracy, as snow accumulation on control points typically requires 2–3 days for complete melting, introducing substantial positional deviations during this period. The harsh climatic conditions of the Qinghai–Tibet Plateau necessitate preventive lubrication and maintenance protocols for the mobile camera platform in order to ensure reliable operation and prevent mechanical failures. Furthermore, while previous research established that control point quantity and spatial distribution critically influence UAV-SfM photogrammetric accuracy [60], the specific impact of these parameters on river-ice thickness measurements using 4D-SfM tilted photogrammetry remain inadequately characterized. Future research priorities should focus on developing snow mitigation strategies for photogrammetric processing and conducting systematic investigations of control point optimization to enhance measurement accuracy under challenging environmental conditions.
Table 2. Integrated assessment of typical river-ice thickness measurement techniques.
MethodAccuracyCoverageCostDifficultyData ProcessingAdaptabilityReal TimeTemporal ResolutionScalabilityComplementarity
Drilling [24]±1 cmPointLow (hand tools)Low (manual)Low (no)High (not limited by visibility)NoSingle (on-site)Low (labor-intensive)Calibrate other methods
Ultrasonic [25]±2 cmPoint /LineMedium (requires probe)Low (probe setup below water)Medium (auto logging, some filtering)Medium (snow cover )YesContinuous (sec–min)Medium (multiple transects)Complement GPR/SfM
GPR [24]±6.2 cmContinuous TransectHigh (antenna, software)Medium (stable platform needed)Medium (signal processing)Medium (ice–water effect)PartialPeriodicMedium (along track)Combine with drilling, SAR
SAR [61]RMSE 10.9–25.8 cmKilometer-scale reachLow (open data)None (automatic acquisition)Medium (image backscatter)Medium (terrain effects)No6–12 days revisitHigh (global)Validate GPR, combine large -scale demand
UAV-SfM [36]RMSE 3–9 cmHundred-meter reachMedium (drone + GCP)Medium (flight planning and calibration)High (SfM reconstruction, large data)Low (lighting, weather)NoEpisodic (flight-based)Medium (multi-UAV)LiDAR/GPR validation, high spatial detail
Airborne LiDAR [3]±10 cm (vertical)FlightlineHigh (LiDAR, platform upkeep)Medium (aircraft or rotorcraft)Medium (point cloud registration)Medium (snow–ground)NoEpisodic (flight)Medium (extend via flightlines)SfM/GPR fusion, enhance depth
Optical Satellite [62]RMSE 7–18 cmKilometer-scale reachLow (no build, license only)None (auto acquisition)Low (DSM generation only)Low (cloud, low light)No5–16 days revisitHigh (multi-constellation)Combine SAR/UAV for high resolution
4D-SfMRMSE 0.43–3.97 cmRiver cross-sectionLow (camera and rig)Low (shore-based at fixed points)High (4D-SfM reconstruction)High (not limited by weather)NoContinuous (daily)Medium (adjust flight path)SfM/GPR fusion, improve precision

5. Conclusions

This study systematically analyzes the differences in the accuracy and spatial coverage of river-ice thickness measurements at varying shooting distances in the Qinghai–Tibet Plateau region based on 4D-SfM photogrammetry technology. The main conclusions are as follows:
1.
Measurement accuracy gradually decreases as the shooting distance increases. Specifically, the RMSE at close range (0.5–1.5 m) is 0.43 cm; the RMSE for mid-range (3–10 m) applications is 1.78–3.59 cm; and the RMSE for long-range (25–60 m) applications is 3.97 cm.
2.
Although ice thickness, ice surface undulation, and image brightness influence the results of 4D-SfM photogrammetry to some extent, their impact is less significant than that of shooting distance on measurement accuracy.
3.
The survey area increases with shooting distance—the area at close range is 11.38 m2; at mid range, it is 33.37 m2; and at long range, it is 2642 m2.
4.
The 4D-SfM photogrammetry is capable of not only illustrating the developmental processes of shore ice and anchor ice, but also effectively capturing extreme events characterized by sudden changes in river-ice thickness, owing to its high spatiotemporal resolution.
5.
All three shooting distances can effectively reflect the nonlinear variation trend in river-ice thickness.
In summary, 4D-SfM photogrammetry has promising application prospects in the Qinghai–Tibet Plateau region. In practical applications, it is important to balance the relationship between shooting distance, measurement accuracy, and coverage area. The appropriate measurement scheme should be selected according to different scenarios (such as narrow river sections or river bends) to better meet the needs of river-ice thickness monitoring.

Author Contributions

Conceptualization: Y.F. and J.L.; methodology: J.L. and Y.F.; software: Y.Z.; validation: Y.Z. and J.L.; formal analysis: Y.Z. and Z.L.; investigation: J.L. and Y.Z.; writing—original draft preparation: Y.F. and Y.Z.; writing—review and editing: J.L. and Y.Z.; visualization: X.A., Z.L. and L.W.; supervision: R.C., X.A. and Y.F.; project administration: R.C. and J.L.; funding acquisition: J.L. and R.C. All authors have read and agreed to the published version of the manuscript.

Funding

This work was supported by the National Natural Science Foundation of China (Grant Nos. 42471519 and 42271154), as well as by the Northwest Institute of Eco-Environment and Resources of the Chinese Academy of Sciences open experimental platform foundation (SJ202414).

Data Availability Statement

The data are available by contacting the author—Junfeng Liu.

Conflicts of Interest

The authors declare no conflicts of interest.

References

  1. Li, H.; Li, H.; Wang, J.; Hao, X. Advances in Remote Sensing of River Ice. Adv. Earth Sci. 2020, 35, 1041–1051. [Google Scholar]
  2. Kang, S.; Xu, Y.; You, Q.; Pepin, N.; Flügel, W.-A.; Yao, T. Review of Climate and Cryospheric Change in the Qinghai–Tibet Plateau. Environ. Res. Lett. 2010, 5, 015101. [Google Scholar] [CrossRef]
  3. Zakharova, E.; Frolova, N.; Kouraev, A.; Agafonova, S.; Duguay, C. River ice Phenology and Thickness from Satellite Altimetry: Potential for Ice Bridge Road Operation and Climate Studies. Cryosphere 2021, 15, 5387–5407. [Google Scholar] [CrossRef]
  4. Hallerbäck, S.; Aghakouchak, A.; Love, C.; Persson, M.; Stensen, K.; Huning, L.S.; Gustafsson, D. Climate Warming Shortens Ice Durations and Alters Freeze and Break-up Patterns in Swedish Water Bodies. Cryosphere 2022, 16, 2493–2503. [Google Scholar] [CrossRef]
  5. Yang, X.; Pavelsky, T.M.; Allen, G.H. The Past and Future of Global River Ice. Nature 2020, 577, 69–73. [Google Scholar] [CrossRef]
  6. Lesack, L.F.W.; Hicks, F.E.; Forbes, D.L.; Marsh, P. Local Spring Warming Drives Earlier River-ice Breakup in a Large Arctic Delta. Geophys. Res. Lett. 2014, 41, 1560–1567. [Google Scholar] [CrossRef]
  7. Burrell, B.C.; Beltaos, S.; Turcotte, B. Effects of Climate Change on River Ice Processes and Ice Jams. Int. J. River Basin Manag. 2021, 21, 421–441. [Google Scholar] [CrossRef]
  8. Cao, X.; Wu, P.; Zhou, S.; Sun, J.; Han, Z. Tracing the Origin and Geochemical Processes of Dissolved Sulphate in a Karst-Dominated Wetland Catchment Using Stable Isotope Indicators. J. Hydrol. 2018, 562, 210–222. [Google Scholar] [CrossRef]
  9. Chen, P.; Cao, G.; Cheng, T.; Wang, J. Accumulation and Evolution of Ice Jams Influenced by Different Ice Discharge: An Experimental Analysis. Front. Earth Sci. 2023, 10, 1054040. [Google Scholar] [CrossRef]
  10. Zhao, S.-X.; Szydlowski, M.; Li, C.; Li, W.; Kolerski, T.; Wu, Y.-J.; Shi, X.-H.; Quan, Q.; Wang, W.-J.; Zhao, S.-N. Freeze-Up Ice Jam Formation in the River Bend, a Case Study on the Inner Mongolia Reach of Yellow River. Crystals 2021, 11, 631. [Google Scholar] [CrossRef]
  11. Ghoreishi, M.; Das, A.; Lindenschmidt, K.-E. Advancement in Ice-Jam Flood Risk Management: Integrating Dynamic Adaptive Behavior by an Agent-Based Modeling in Fort McMurray, Canada. J. Hydrol. 2024, 635, 131236. [Google Scholar] [CrossRef]
  12. Das, A.; Reed, M.; Lindenschmidt, K.-E. Sustainable Ice-Jam Flood Management for Socio-Economic and Socio-Ecological Systems. Water 2018, 10, 135. [Google Scholar] [CrossRef]
  13. Chave, R.A.J.; Dupuis, L.; Fissel, D.B.; Dumont, S.; Lemon, D.D. Real-Time Measurements of Ice Draft and Velocity in the St. Lawrence River. Inst. Electr. Electron. Eng. 2004, 3, 1629–1633. [Google Scholar]
  14. Wu, C.-G.; Jin, J.-L.; Zhou, Y.-L.; Wei, Y.-M.; Huang, Q.; Liu, L. Comprehensive Evaluation of Ice Disaster Risk of the Ningxia–Inner Mongolia Reach in the Upper Yellow River. Nat. Hazards 2014, 75, 179–197. [Google Scholar] [CrossRef]
  15. Su, T.; Huang, H.Q.; Zhou, Y.Y. Effect of Hydrological Processes, Water Temperature and River Channel Geometry Changes on Ice Floods in the Ningxia-Inner Mongolia Reach of the Yellow River. Resour. Sci. 2016, 38, 948–955. [Google Scholar]
  16. Gao, H.; Ding, Y.; Duan, Z.; Wang, J.; Pan, X.; Yang, Y. Permafrost Hydrology of the Qinghai–Tibet Plateau: A Review of Processes and Modeling. Front. Earth Sci. 2021, 8, 576838. [Google Scholar] [CrossRef]
  17. Han, W.; Hou, J.; Huang, C.; Duan, H.; Gu, J. Lake Phenology of Freeze-Thaw Cycles Using Random Forest: A Case Study of Qinghai Lake. Remote Sens. 2020, 12, 4098. [Google Scholar] [CrossRef]
  18. Li, M.; Ren, W.; Zhu, Z.; Wang, Y. Predicting Gross Primary Productivity under Future Climate Change for the Qinghai–Tibet Plateau Based on Convolutional Neural Networks. Remote Sens. 2024, 16, 3723. [Google Scholar] [CrossRef]
  19. Zhong, L.; Ma, Y.; Xue, Y.; Piao, S. Climate Change Trends and Impacts on Vegetation Greening Over the Qinghai–Tibet Plateau. J. Geophys. Res. Atmos. 2019, 124, 7540–7552. [Google Scholar] [CrossRef]
  20. Li, H.; Li, H.; Wang, J.; Hao, X. Monitoring High-Altitude River Ice Distribution at the Basin Scale in the Northeastern Qinghai–Tibet Plateau from a Landsat Time-Series Spanning 1999–2018. Remote Sens. Environ. 2020, 247, 111915. [Google Scholar] [CrossRef]
  21. Pang, X.; Li, H.; Ren, H.; Yang, Y.; Zhao, Q.; Liu, Y.; Hao, X.; Niu, L. Machine Learning-Enhanced River Ice Identification in the Complex Qinghai–Tibet Plateau. Remote Sens. 2025, 17, 1889. [Google Scholar] [CrossRef]
  22. Zakharov, I.; Puestow, T.; Khan, A.A.; Briggs, R.; Barrette, P. Review of River Ice Observation and Data Analysis Technologies. Hydrology 2024, 11, 126. [Google Scholar] [CrossRef]
  23. Jin, H.; Chen, J.; Wei, Q.; Yao, X.; Yu, Z.; Zhou, S.; Zhang, Y. Ice Thickness Assessment of Non-Freshwater Lakes in the Qinghai–Tibet Plateau Based on Unmanned Aerial Vehicle-Borne Ice-Penetrating Radar: A Case Study of Qinghai Lake and Gahai Lake. Remote Sens. 2024, 16, 959. [Google Scholar] [CrossRef]
  24. Lynch, M.; Briggs, R.; English, J.; Khan, A.A.; Khan, H.; Puestow, T. Operational Monitoring of River Ice on the Churchill River, Labrador. In Proceedings of the 21st Workshop on the Hydraulics of Ice Covered Rivers, Saskatoon, SK, Canada, 29 August–1 September 2021; Volume 29. [Google Scholar]
  25. Zhang, H.; Li, H.; Li, H. Monitoring the Ice Thickness in High-Order Rivers on the Tibetan Plateau with Dual-Polarized C-Band Synthetic Aperture Radar. Remote Sens. 2022, 14, 2591. [Google Scholar] [CrossRef]
  26. Mermoz, S.; Van Der Sanden, J.J.; Chokmani, K.; Bernier, M.; Pottier, E.; Allain-Bailhache, S. Retrieval of River Ice Thickness From C-Band PolSAR Data. IEEE Trans. Geosci. Remote Sens. 2014, 52, 3052–3062. [Google Scholar] [CrossRef]
  27. Liu, J.; Chen, R.; Ding, Y.; Han, C.; Ma, S. Snow Process Monitoring Using Time-Lapse Structure-from-Motion Photogrammetry with a Single Camera. Cold Reg. Sci. Technol. 2021, 190, 103355. [Google Scholar] [CrossRef]
  28. Piermattei, L.; Carturan, L.; Tarolli, P.; Vettore, A.; Pfeifer, N.; Dalla Fontana, G.; De Blasi, F. Suitability of Ground-Based SfM–MVS for Monitoring Glacial and Periglacial Processes. Earth Surf. Dyn. 2016, 4, 425–443. [Google Scholar] [CrossRef]
  29. Ioli, F.; Gaspari, F.; Pinto, L.; Nex, F.; Barbieri, F. ICEPY4D: A Python Toolkit for Advanced Multi-Epoch Glacier Monitoring with Deep-Learning Photogrammetry. Int. Arch. Photogramm. Remote Sens. Spat. Inf. Sci. 2023, XLVIII-1/W2-2023, 1037–1044. [Google Scholar] [CrossRef]
  30. Filhol, S.; Sutter, G.; Burkhart, J.F.; Perret, A.; Girod, L.; Schuler, T.V. Time-Lapse Photogrammetry of Distributed Snow Depth During Snowmelt. Water Resour. Res. 2019, 55, 7916–7926. [Google Scholar] [CrossRef]
  31. Liu, J.; Chen, R.; Ma, S.; Han, C.; Ding, Y.; Guo, S.; Wang, X. The Challenge of Monitoring Snow Surface Sublimation in Winter Could Be Resolved with Structure-from-Motion Photogrammetry. J. Hydrol. 2024, 630, 130733. [Google Scholar] [CrossRef]
  32. Domingo, D.; Kachamba, D.; Næsset, E.; Ørka, H.O.; Gobakken, T. Effects of UAV Image Resolution, Camera Type, and Image Overlap on Accuracy of Biomass Predictions in a Tropical Woodland. Remote Sens. 2019, 11, 948. [Google Scholar] [CrossRef]
  33. Seifert, E.; Van Aardt, J.; Vogt, H.; Seifert, T.; Seifert, S.; Kunneke, A.; Drew, D. Influence of Drone Altitude, Image Overlap, and Optical Sensor Resolution on Multi-View Reconstruction of Forest Images. Remote Sens. 2019, 11, 1252. [Google Scholar] [CrossRef]
  34. Quoc Long, N.; Goyal, R.; Van Chung, P.; Van Canh, L.; Bui, X.-N.; Xuan Cuong, C.; Ngoc Quy, B.; Khac Luyen, B. Influence of Flight Height on the Accuracy of UAV-Derived Digital Elevation Model at Complex Terrain. Inżynieria Miner. 2020, 45, 179–187. [Google Scholar] [CrossRef]
  35. Liu, J.; Ma, S.; Chen, R. Exploring the Optimal 4D-SfM Photogrammetric Models at Plot Scale. Remote Sens. 2023, 15, 2269. [Google Scholar] [CrossRef]
  36. Rødtang, E.; Alfredsen, K.; Juárez, A. Drone Surveying of Volumetric Ice Growth in a Steep River. Front. Remote Sens. 2021, 2, 767073. [Google Scholar] [CrossRef]
  37. Bezryadin, S.; Bourov, P.; Ilinih, D. Brightness Calculation in Digital Image Processing. In Proceedings of the International Symposium on Technologies for Digital Photo Fulfillment, Las Vegas, NV, USA, 5 March 2007; pp. 10–15. [Google Scholar]
  38. Rangelov, D.; Waanders, S.; Waanders, K.; Van Keulen, M.; Miltchev, R. Impact of Camera Settings on 3D Reconstruction Quality: Insights from NeRF and Gaussian Splatting. Sensors 2024, 24, 7594. [Google Scholar] [CrossRef]
  39. Debevec, P.E.; Malik, J. Recovering High Dynamic Range Radiance Maps from Photographs. In Proceedings of the Association for Computing Machinery; Association for Computing Machinery: New York, NY, USA, 2023; pp. 643–652, ISBN 9798400708978. [Google Scholar]
  40. Fukś, M. Changes in River Ice Cover in the Context of Climate Change and Dam Impacts: A Review. Aquat. Sci. 2023, 85, 113. [Google Scholar] [CrossRef]
  41. De Rham, L.; Prowse, T.; Beltaos, S.; Dibike, Y.; Peters, D.; Bonsal, B. A Canadian River Ice Database from the National Hydrometric Program Archives. Earth Syst. Sci. Data 2020, 12, 1835–1860. [Google Scholar] [CrossRef]
  42. Das, A.; Rokaya, P.; Lindenschmidt, K.-E. Modelling Climatic Impacts on Ice-Jam Floods: A Review of Current Models, Modelling Capabilities, Challenges and Future Prospects. Environ. Rev. 2021, 29, 378–390. [Google Scholar] [CrossRef]
  43. Kolerski, T. Assessment of the Ice Jam Potential on Regulated Rivers and Reservoirs with the Use of Numerical Model Results. Cold Reg. Sci. Technol. 2021, 191, 103372. [Google Scholar] [CrossRef]
  44. Fraser, B.T.; Congalton, R.G. Issues in Unmanned Aerial Systems (UAS) Data Collection of Complex Forest Environments. Remote Sens. 2018, 10, 908. [Google Scholar] [CrossRef]
  45. Smith, M.W.; Carrivick, J.L.; Quincey, D.J. Structure from Motion Photogrammetry in Physical Geography. Prog. Phys. Geogr. Earth Environ. 2015, 40, 247–275. [Google Scholar] [CrossRef]
  46. Javadnejad, F.; Olsen, M.J.; Slocum, R.K.; Gillins, D.T.; Parrish, C.E. Dense Point Cloud Quality Factor as Proxy for Accuracy Assessment of Image-Based 3D Reconstruction. J. Surv. Eng. 2020, 147, 04020021-1. [Google Scholar] [CrossRef]
  47. Mazur, A.; Kacprzak, M.; Kotlarz, J.; Kubiak, K.; Skocki, K. The Influence of Atmospheric Light Scattering on Reflectance Measurements during Photogrammetric Survey Flights at Low Altitudes over Forest Areas. For. Res. Pap. 2018, 79, 59–68. [Google Scholar] [CrossRef]
  48. Omali, T.U. Impacts of Sensor Spatial Resolution on Remote Sensing Image Classification. Glob. Sci. J. 2018, 6, 63–68. [Google Scholar]
  49. Li, L.; Nearing, M.A.; Nichols, M.H.; Polyakov, V.O.; Guertin, D.P.; Cavanaugh, M.L. The Effects of DEM Interpolation on Quantifying Soil Surface Roughness Using Terrestrial LiDAR. Soil Tillage Res. 2020, 198, 104520. [Google Scholar] [CrossRef]
  50. Habib, M. Evaluation of DEM Interpolation Techniques for Characterizing Terrain Roughness. CATENA 2020, 198, 105072. [Google Scholar] [CrossRef]
  51. Mulverhill, C.; Coops, N.C.; Tompalski, P.; Bater, C.W.; Dick, A.R. The utility of terrestrial photogrammetry for assessment of tree volume and taper in boreal mixedwood forests. Ann. For. Sci. 2019, 76, 83. [Google Scholar] [CrossRef]
  52. Zheng, F.; Wackrow, R.; Meng, F.-R.; Lobb, D.; Li, S. Assessing the Accuracy and Feasibility of Using Close-Range Photogrammetry to Measure Channelized Erosion with a Consumer-Grade Camera. Remote Sens. 2020, 12, 1706. [Google Scholar] [CrossRef]
  53. Ashton, G.D. River and Lake Ice Thickening, Thinning, and Snow Ice Formation. Cold Reg. Sci. Technol. 2011, 68, 3–19. [Google Scholar] [CrossRef]
  54. Thellman, A.; Jankowski, K.; Hayden, B.; O’Sullivan, A. The Ecology of River Ice. J. Geophys. Res. Biogeosci. 2021, 126, e2021JG006275. [Google Scholar] [CrossRef]
  55. Graf, R. Estimation of the Dependence of Ice Phenomena Trends on Air and Water Temperature in Rivers. Water 2020, 12, 3494. [Google Scholar] [CrossRef]
  56. Rokaya, P.; Lindenschmidt, K.-E.; Pietroniro, A.; Clark, M. Modelling of Ice Jam Floods under Past and Future Climates: A Review. J. Hydrol. X 2022, 15, 100120. [Google Scholar] [CrossRef]
  57. Turcotte, B.; Dubnick, A.; McKillop, R.; Ensom, T. Icing and aufeis in cold regions I: The origin of overflow. Can. J. Civ. Eng. 2024, 51, 93–108. [Google Scholar] [CrossRef]
  58. Mallalieu, J.; Carrivick, J.L.; Quincey, D.J.; Smith, M.W.; James, W.H.M. An integrated Structure-from-Motion and time-lapse technique for quantifying ice-margin dynamics. J. Glaciol. 2017, 63, 937–949. [Google Scholar] [CrossRef]
  59. Alfredsen, K.; Haas, C.; Tuhtan, J.A.; Zinke, P. Brief Communication: Mapping River Ice Using Drones and Structure from Motion. Cryosphere 2018, 12, 627–633. [Google Scholar] [CrossRef]
  60. Gindraux, S.; Boesch, R.; Farinotti, D. Accuracy Assessment of Digital Surface Models from Unmanned Aerial Vehicles’ Imagery on Glaciers. Remote Sens. 2017, 9, 186. [Google Scholar] [CrossRef]
  61. Royer, A.; Langlois, A.; Jutras, S.; Roy, A. Review Article: Performance Assessment of Radiation-Based Field Sensors for Monitoring the Water Equivalent of Snow Cover (SWE). Cryosphere 2021, 15, 5079–5098. [Google Scholar] [CrossRef]
  62. Mandlburger, G.; Hauer, C.; Pfeifer, N.; Wieser, M. Topo-Bathymetric LiDAR for Monitoring River Morphodynamics and Instream Habitats—A Case Study at the Pielach River. Remote Sens. 2015, 7, 6160–6195. [Google Scholar] [CrossRef]
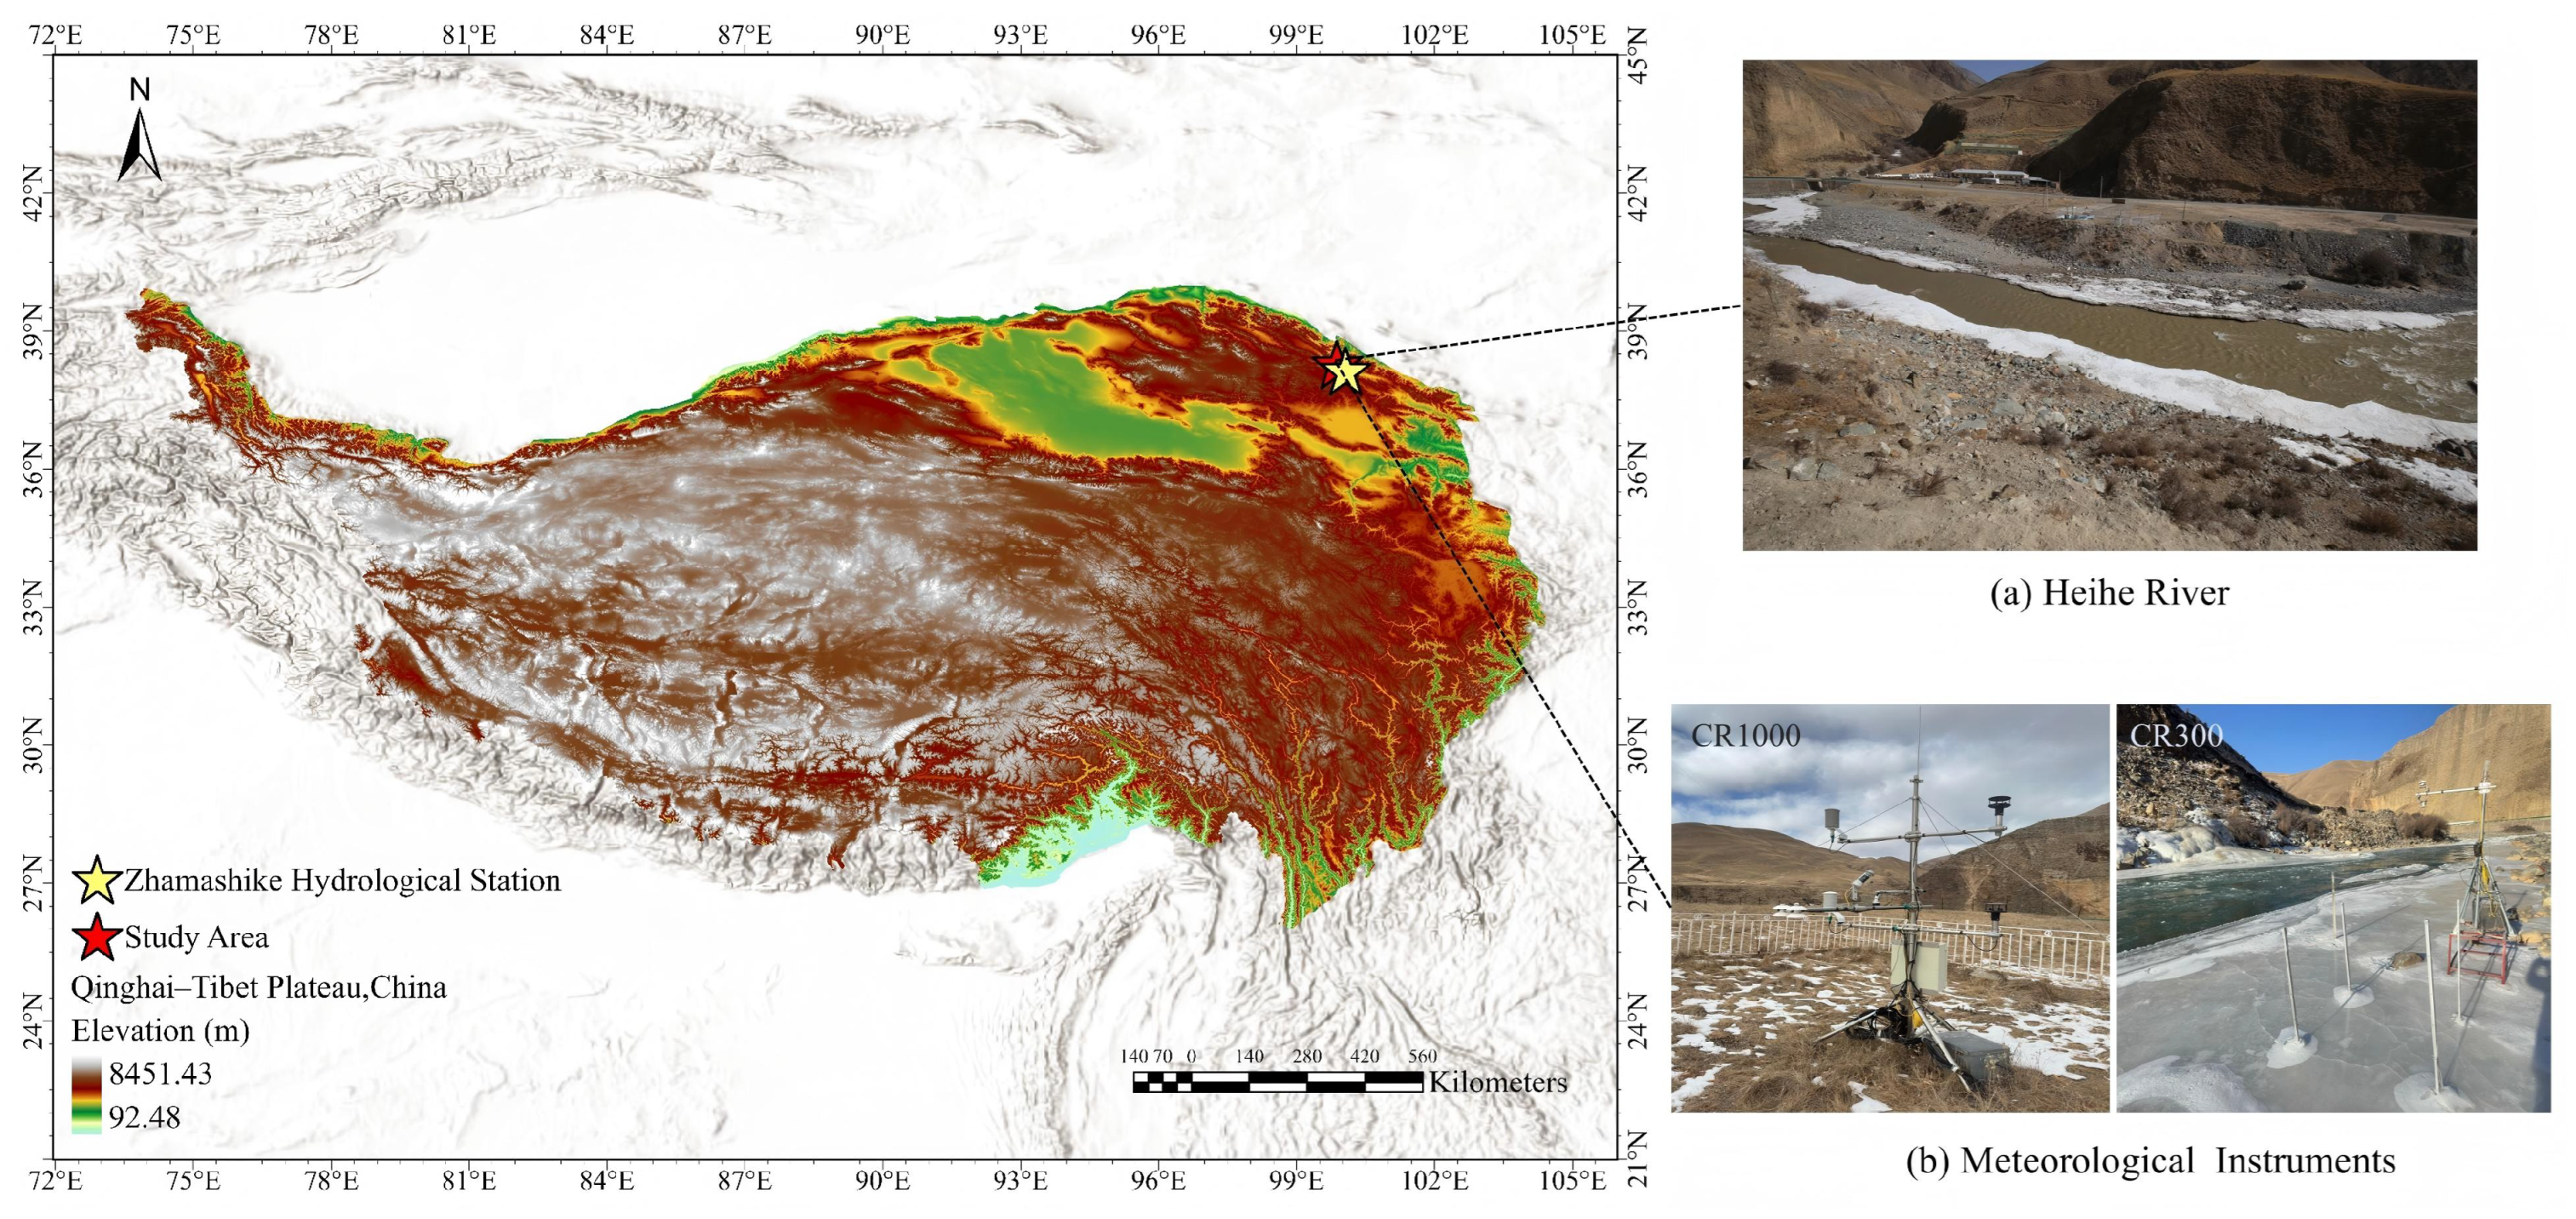
Figure 1. A map showing an overview of the regional study area.
Remotesensing 17 02887 g001
Figure 2. June 2023 to May 2024 monthly meteorological data variation chart of the study area.
Remotesensing 17 02887 g002
Figure 3. June 2023 to May 2024 monthly variation chart of mainstream hydrology in the upper reaches of the Heihe River.
Remotesensing 17 02887 g003
Figure 4. Schematic of shooting strategies for three distance modes.
Remotesensing 17 02887 g004
Figure 5. Distribution of 4D-SfM photogrammetric control field and manually measured points at different shooting distances.
Remotesensing 17 02887 g005
Figure 6. The 4D-SfM photogrammetry workflow chart.
Remotesensing 17 02887 g006
Figure 7. Analysis of 4D-SfM photogrammetric accuracy in close-range mode.
Remotesensing 17 02887 g007
Figure 8. Analysis of 4D-SfM photogrammetric accuracy in mid-range mode.
Remotesensing 17 02887 g008
Figure 9. Analysis of 4D-SfM photogrammetric accuracy in long-range mode.
Remotesensing 17 02887 g009
Figure 10. Bubble distribution charts of absolute errors at different shooting distances.
Remotesensing 17 02887 g010
Figure 11. Comparison of DEM and DOM outputs from three shooting distance modes.
Remotesensing 17 02887 g011
Figure 12. River-ice thickness variation during three shooting modes.
Remotesensing 17 02887 g012
Figure 13. Shore ice development process on 22–27 November 2023.
Remotesensing 17 02887 g013
Figure 14. Anchor ice development process on 17–25 December 2024.
Remotesensing 17 02887 g014
Figure 15. Field photographs of river-ice on 24–25 December 2024.
Remotesensing 17 02887 g015
Table 1. Meteorological and hydrological parameters in the research area from 21 to 25 December 2024.
DataTemperature ℃Wind Speed m/sRiver Discharge m3/sRiver Stage m
21 December 2024−14.241.4112.32613.34
22 December 2024−13.021.2912.32613.34
23 December 2024−13.401.6012.32613.34
24 December 2024−14.101.5912.32613.34
25 December 2024−11.792.2012.12613.31
Disclaimer/Publisher’s Note: The statements, opinions and data contained in all publications are solely those of the individual author(s) and contributor(s) and not of MDPI and/or the editor(s). MDPI and/or the editor(s) disclaim responsibility for any injury to people or property resulting from any ideas, methods, instructions or products referred to in the content.