Abstract
Snow cover, as a critical component of the cryosphere, serves as a vital water resource for arid regions in Northwest China. The Qilian Mountains (QLM), situated on the northeastern margin of the Tibetan Plateau, function as an important ecological barrier and water conservation area in western China. This study presents the first high-resolution historical snow cover product developed specifically for the QLM, utilizing a multi-level snow classification algorithm tailored to the complex topography of the region. By employing Landsat satellite data from 1986–2024, we constructed a comprehensive 39-year snow cover dataset at a resolution of 30 m. A dual adaptive cloud masking strategy and spatial interpolation techniques were employed to effectively address cloud contamination and data gaps prevalent in mountainous regions. The spatiotemporal characteristics and driving mechanisms of snow cover changes in the QLM were systematically analyzed using Sen–Theil trend analysis and Mann–Kendall tests. The results reveal the following: (1) The mean annual snow cover extent in the QLM was 15.73% during 1986–2024, exhibiting a slight declining trend (−0.046% yr−1), though statistically insignificant (p = 0.215); (2) The snowline showed significant upward migration, with mean elevation and minimum elevation rising at rates of 3.98 m yr−1 and 2.81 m yr−1, respectively; (3) Elevation-dependent variations were observed, with significant snow cover decline in high-altitude (>5000 m) and low-altitude (2000–3500 m) regions, while mid-altitude areas remained relatively stable; (4) Comparison with MODIS data demonstrated good correlation (r = 0.828) but revealed systematic differences (RMSE = 12.88%), with MODIS showing underestimation in mountainous environments (Bias: −8.06%). This study elucidates the complex response mechanisms of the QLM snow system under global warming, providing scientific evidence for regional water resource management and climate change adaptation strategies.
1. Introduction
Snow is cryospheric moisture’s main reservoir [1]. It is estimated that over one-sixth of the global population depends on glaciers and seasonal snow as essential sources of water [2]. The high mountains on the mainland serve as an ecological barrier and a base for vital water sources [3]. Alpine regions are crucial for storing and recharging ice and snowmelt. Seasonal snow cover in high-latitude and high-altitude areas of both hemispheres is susceptible to changing climate [4]. Global warming’s effects on the cryosphere are becoming more pronounced, significantly affecting mountain hydrological processes and water resources through accelerated glaciation and increased runoff from snowmelt [5].
Worldwide, approximately 78% of mountain snow cover is experiencing a decline, with some extreme cases showing a reduction in snow duration by up to 43 days and a decrease in snow cover area by as much as 13% [6]. Snow phenology is experiencing significant changes in drylands in Asia [4]. Western China’s alpine regions, especially glacier, snow, and frozen soil basins, play a critical role in regional water supply under global warming [5].
The Qilian Mountains (QLM), located on the northeastern margin of the Tibetan Plateau, play a crucial role in ensuring water resources and ecological security for northwest China and the Qinghai–Tibet Plateau [7]. With the ability to capture and retain atmospheric water vapor, the QLM forms permanent glaciers and seasonal snow cover that sustain numerous river basins, providing essential water supplies for the Hexi Corridor and the Qaidam Basin [3,8,9,10]. However, there is mounting evidence of a pronounced decline in snowfall across East Asian high-mountain regions, including the QLM [11,12,13,14,15]. Investigating changes in snow cover is vital for assessing and protecting the regional ecological environment [16], predicting water resource availability, and guiding effective management strategies [17,18,19]. Moreover, snow cover serves as a key indicator of climate change, closely reflecting variations in temperature and precipitation patterns [20,21,22]. Monitoring these changes offers valuable data to support global climate change research.
Current research on snow cover change monitoring in the QLM primarily relies on Moderate Resolution Imaging Spectroradiometer (MODIS) data [23,24,25,26,27]. MODIS possesses multi-temporal daily observation capabilities, providing time-series data for monitoring dynamic changes while enabling global-scale remote sensing observations suitable for large-scale environmental monitoring, making it widely applied in global climate change research. However, using MODIS to monitor snow cover changes in the QLM has several limitations, including the effects of complex topography that cause image shadowing and reduce accuracy, in addition to a limited 500 m resolution that restricts observational capacity in small-scale areas. Furthermore, the MODIS/Terra satellite, launched in 2000, lacks historical snow cover monitoring capabilities. In contrast, Landsat satellites typically provide 30 m spatial resolution, enabling more detailed snow cover change detection. The Landsat series has been providing data since 1972, allowing users to access multi-decadal time-series datasets (effective imagery suitable for QLM snow monitoring begins from 1986). Although Landsat has a longer revisit cycle, it proves highly valuable for analyzing snow cover change trends in the QLM and their relationships with climate change. Furthermore, multiple studies have confirmed that compared to Landsat, MODIS tends to underestimate snow cover extent in mountainous regions, exhibiting lower accuracy and greater errors [28,29,30,31,32]. The QLM lacks fine-scale studies on long-term snow cover changes, highlighting the urgency of this research. As climate change accelerates, snow cover variations threaten regional water security and ecosystem stability, making it crucial to understand these dynamics for effective management.
This study aims to address the following key scientific questions: (1) Develop a Landsat-based snow monitoring algorithm suitable for the QLM; (2) Generate long-term continuous time-series snow cover data for the QLM spanning 1986–2024; (3) Investigate the mechanisms by which climate change influences snow cover in the QLM. Current snow monitoring in the QLM is limited by sparse ground observations, coarse MODIS resolution, and cloud interference in Landsat data. To address these limitations, this study presents the first high-resolution historical snow cover product developed specifically for the QLM, utilizing a multi-level snow classification algorithm tailored to the complex topography of the region. By employing Landsat satellite data from 1986–2024, we constructed a comprehensive 39-year snow cover dataset at a resolution of 30 m. A dual adaptive cloud masking strategy and spatial interpolation techniques were employed to effectively address cloud contamination and data gaps prevalent in mountainous regions. This research will provide scientific evidence for regional sustainable development and assist in addressing potential future environmental challenges.
2. Methods
2.1. Study Area and Data
This study focuses on the QLM as the research area (Figure 1). The QLM, located in northwestern China, represents a significant mountain range on the northeastern margin of the Tibetan Plateau, recognized as a crucial ecological security barrier and water conservation area in western China, playing an extremely important role in regional ecological environments [32,33,34]. Geologically, the formation of the QLM is closely related to the uplift of the Tibetan Plateau, having experienced multiple tectonic movements and geomorphological evolution since the Cenozoic Era, resulting in the current high-elevation terrain with extensive distribution of glaciers, grasslands, and forests [35,36,37]. Climatically, the QLM is situated at the convergence zone of the East Asian summer monsoon and westerlies, making it sensitive to climate variations. The mean annual temperature has shown a significant increasing trend since 1979, with varying warming rates across different elevation zones [33,38].
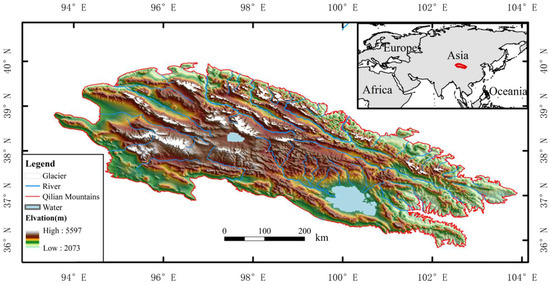
Figure 1.
Study area.
The study area boundaries were defined based on preprocessed vector data that underwent precise georeferencing and boundary optimization to ensure the spatial integrity and accuracy of the research region. The data sources employed a multi-sensor long-term time-series combination strategy to achieve continuous snow monitoring from 1986–2024: Landsat 5 TM data for 1986–April 1999, Landsat 7 ETM+ data for May 1999–2012, Landsat 8 OLI data for 2013–2020, and both Landsat 8 OLI and Landsat 9 OLI-2 data for 2021–2024 to enhance temporal coverage density. All Landsat data utilized the latest available Collection Level-2 surface reflectance products to ensure radiometric consistency and geometric accuracy across different sensors. The study period begins in 1986 because there are no suitable images available before this date.
For ETM+ SLC-off images acquired after 2003, the scan line corrector failure created systematic data gaps as diagonal stripes [39]. To address this issue, this study applied the spatial interpolation and data gap-filling methodology described in Section 2.6. The process involved the following steps: (1) identifying and masking SLC-off striped gaps based on pixel quality flags; (2) applying spatial interpolation to estimate missing pixel values using neighboring valid pixels; and (3) utilizing multi-temporal compositing to fill remaining gaps with information from temporally adjacent Landsat acquisitions. This approach enabled effective integration of SLC-off images into the multi-temporal snow mapping framework while maintaining spatial continuity and classification accuracy.
Topographic variables including elevation, slope, and aspect were derived from the Shuttle Radar Topography Mission (SRTM) Digital Elevation Model (DEM) at 30 m resolution: USGS/SRTMGL1_003 [40] accessed through the Google Earth Engine platform [41]. The DEM data were clipped to the study area extent, and terrain derivatives were computed using standard algorithms.
To compare the differences in snow monitoring results between MODIS and Landsat, this study will employ the widely utilized NASA MOD10A1 daily snow cover product as the data source https://modis-snow-ice.gsfc.nasa.gov/?c=MOD10A1 (accessed on 16 July 2025). This product, provided by the MODIS sensor, offers global snow cover observational data at a resolution of 500 m. The MOD10A1 generally exhibits high accuracy under clear sky conditions, with reported values ranging from 86% to 97% based on validation against ground observations and high-resolution satellite imagery [42,43,44,45].
Regarding data acquisition strategy, an extended temporal window approach was adopted, extending 15 days before and after the standard monthly range, with a cloud cover threshold set at 85%. This strategy significantly increased opportunities for effective data acquisition in the complex mountainous environment of the QLM, providing sufficient observational foundation for long-term time-series snow change analysis.
2.2. Cloud Masking Strategy
Cloud cover represents the primary obstacle limiting Landsat satellite imagery applications, particularly in mountainous regions where cloud occurrence is frequently elevated. To address cloud contamination, researchers have developed various cloud detection and removal methods [39,46,47,48,49], which can effectively reconstruct continuous cloud-free Landsat imagery and improve data utilization rates. Nevertheless, the regional adaptability of existing cloud detection and removal algorithms remains limited, especially in complex mountainous environments such as the QLM, where strict cloud identification criteria often result in excessive filtering of already scarce valid observation data, further exacerbating data availability constraints.
To address the data scarcity problem caused by traditional strict cloud masking in the complex mountainous environment of the QLM, this study designed a dual adaptive cloud masking strategy based on the QA_PIXEL quality assessment band from Landsat Collection Level-2 products, where this band can identify high-confidence cloud pixels using CFMask [50,51]. This strategy dynamically selects cloud masking parameters of varying strictness according to data availability, balancing data quality and quantity. The lenient cloud mask function exclusively masks definite cloud pixels identified by bit 3 and cloud shadow pixels identified by bit 4 in the QA_PIXEL band, while preserving dilated cloud and cirrus pixels identified by bits 1 and 2. This strategy achieves a data retention rate of approximately 65–75%, suitable for situations with relatively abundant data and high quality requirements. The conservative cloud mask function adopts even more permissive criteria, masking only high-confidence cloud pixels identified by bit 3 while completely preserving boundary pixels including cloud shadows, dilated clouds, and cirrus clouds, achieving data retention rates of 75–85%. This approach is particularly suitable for winter months in high-altitude regions like the QLM where data are extremely scarce.
Compared to traditional strict cloud masking that simultaneously masks all cloud-related pixels (bits 1–4) with data retention rates of only 30–50%, this study’s dual strategy, combined with an 85% cloud cover threshold setting (significantly relaxed compared to the conventional 30% standard), can increase monthly available imagery in the QLM region from 1–2 images under strict masking to 3–4 images (winter) and 7–8 images (summer), improving overall data coverage by 20–25%. This provides a more abundant and continuous observational data foundation for long-term time-series snow monitoring in the region. The strategy prioritizes conservative mask data to maximize data retention rates, automatically switching to lenient mask data when conservative mask data are insufficient, ultimately generating monthly composite images through median compositing algorithms (Figure 2a,b).
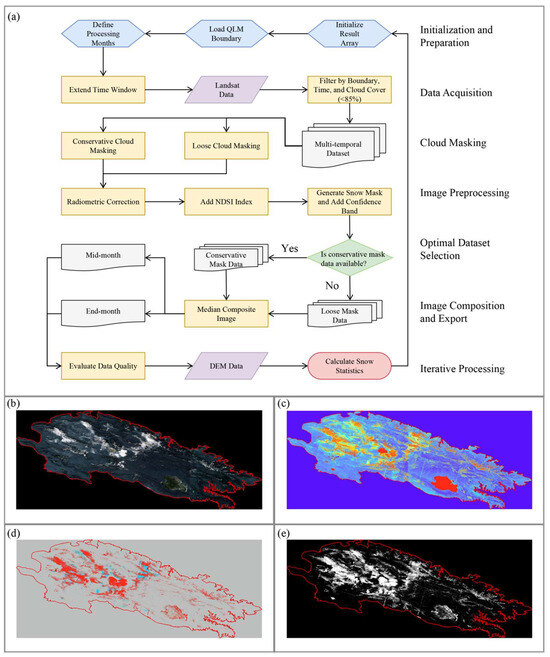
Figure 2.
Image processing workflow and example outputs for mid-January 2024. (a) Complete image processing workflow diagram; (b) RGB composite image suitable for visual interpretation; (c) Normalized Difference Snow Index (NDSI) distribution; (d) snow classification confidence map, with red indicating high confidence and blue indicating medium confidence; (e) binary snow cover distribution, with white representing snow-covered areas and black representing snow-free areas.
2.3. Radiometric Correction and Spectral Index Calculation
Data preprocessing employed standard surface reflectance conversion algorithms to perform radiometric correction on optical bands of Landsat Collection 2 Level-2 products. The conversion formula is shown in Equation (1):
where SR represents surface reflectance, DN denotes the digital number value, and the converted reflectance values are constrained to the physically reasonable range of 0–1 using a clamp function. The Normalized Difference Snow Index (NDSI) is calculated using the green band (, 0.53–0.59 μm) and the shortwave infrared band (, 1.57–1.65 μm), as shown in Equation (2):
This index can effectively distinguish snow cover from other land surface cover types, particularly demonstrating excellent snow cover identification capability in complex mountainous environments (Figure 2c).
2.4. Multi-Level Snow Classification Algorithm
Snow cover identification employs a three-tier confidence classification system based on NDSI and multi-band reflectance thresholds. The basic snow classification adopts reduced threshold parameters to adapt to complex mountainous terrain conditions, with discrimination criteria shown in Equation (3):
The medium confidence snow classification conditions are shown in Equation (4):
The high confidence snow classification adopts the most stringent threshold combination, as shown in Equation (5):
The final snow mask (Figure 2e) is generated by combining the three confidence levels through logical OR operation, as shown in Equation (6):
A quantified confidence image is simultaneously generated (Figure 2d), as shown in Equation (7), which provides uncertainty information for quality assessment:
2.5. Time-Series Construction and Composite Strategy
Temporal interval standardization is implemented based on image acquisition dates, dividing each month into mid-month intervals (8–22nd) and month-end intervals (1st–7th and 23rd–31st). The temporal interval discrimination formula is shown in Equation (8):
Monthly composite images are generated using median composite algorithms, with the calculation formula shown in Equation (9):
where Ii(x,y) represents the reflectance value of the i-th image at pixel (x,y). This method effectively suppresses the influence of outliers and noise while maintaining spectral feature stability.
2.6. Spatial Interpolation and Data Gap-Filling
To address data gaps in mountainous regions, focal statistics interpolation algorithms are employed for spatial gap-filling. First, the pixel availability mask is calculated, as shown in Equation (10):
where Count (x,y) represents the number of valid observations for pixel (x,y). For missing areas, focal mean calculation is performed using a circular kernel window with a 150 m radius, as shown in Equation (11):
where represents the kernel window weights, and pixels satisfying participate in the calculation. The final gap-filling result is achieved through conditional replacement, as shown in Equation (12):
Data quality assessment is implemented based on spatial coverage indicators, with the calculation formula shown in Equation (13):
where represents the valid pixel mask (0 or 1), denotes the pixel area (900 m2), and represents the total study area. The absolute area of valid data is simultaneously recorded, as shown in Equation (14):
This assessment framework assigns quantitative quality indicators to each composite image, enabling the study to select optimal images based on data coverage rates for subsequent analysis and providing a scientific basis for data quality control in time-series analysis.
2.7. Trend Analysis and Testing
The Sen–Theil trend analysis and Mann–Kendall test are commonly used quantitative methods in snow cover change studies, capable of effectively revealing spatio-temporal trends in snow cover and their significance. Multiple studies have demonstrated that these two non-parametric methods, when combined with remote sensing data, can accurately quantify the rate and direction of snow cover changes across different regions and elevation zones, while determining whether the trends are statistically significant [52,53,54,55,56].
2.8. Product Accuracy Evaluation
Data quality was evaluated by calculating the effective observation coverage rate, which reflects the range of data coverage that can reliably determine confidence in snow cover presence. This assessment ensures a reliable foundation for evaluating the accuracy of the Landsat dataset. Meanwhile, MODIS snow cover data is utilized as an auxiliary reference to assess the accuracy of the dataset. Pearson correlation coefficients and Spearman rank correlation coefficients are calculated to analyze the correlation between the two datasets. Additionally, Root Mean Square Error (RMSE) and Mean Absolute Error (MAE) are used to quantify prediction errors. Overall accuracy and Kappa statistics are assessed to measure the agreement between the datasets. Finally, user accuracy and producer accuracy for low and high snow cover are calculated to analyze the differences in identification capabilities.
3. Results
3.1. Spatiotemporal Characteristics of Snow Cover Extent
3.1.1. Overall Temporal Variability
Based on a 39-year semi-monthly time series analysis (1986–2024, n = 927), snow cover extent (SCE) in the QLM exhibited high spatiotemporal variability. The mean annual SCE was 15.73% (±11.72%), ranging from 0.16% to 55.12%. Sen–Theil trend analysis revealed a slight declining trend (−0.045614% yr−1), though Mann–Kendall non-parametric testing indicated this trend was not statistically significant (Z = 1.240, p = 0.215) (Figure 3a).
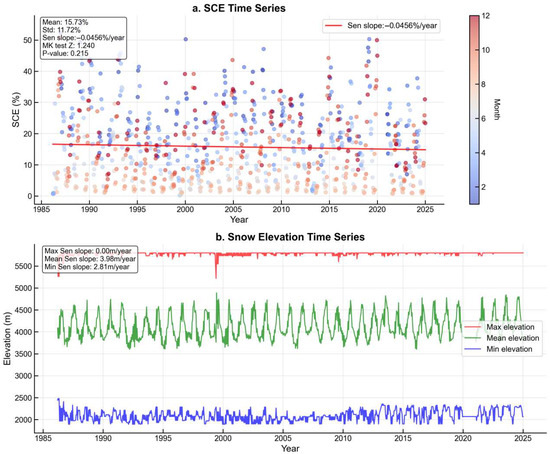
Figure 3.
Temporal variations of snow cover extent and elevation characteristics in the Qilian Mountains from 1986–2024. (a) Time series of overall snow cover extent (SCE) showing long-term trends and variability. (b) Time series of snow cover elevation characteristics, where blue represents the minimum elevation with snow presence, red represents the maximum elevation, and green represents the mean elevation of snow pixels.
Snow cover elevation parameters (representing elevation statistics within snow-covered areas) demonstrated differentiated temporal evolution patterns. Snow distribution ranged from 1893 to 5799 m elevation, with maximum snow cover elevation remaining relatively stable (5783 ± 43 m, Sen slope = 0.0000 m yr−1). In contrast, both mean and minimum snow cover elevation showed significant upward trends at rates of 3.9760 m yr−1 and 2.8143 m yr−1, respectively (both p < 0.001), indicating substantial snowline retreat (Figure 3b).
3.1.2. Elevation-Dependent Spatial Patterns
Elevation-dependent SCE analysis across eight altitudinal bands using semi-monthly data (n = 7072) revealed pronounced altitudinal heterogeneity in both magnitude and temporal trends. Mean SCE increased systematically with elevation from 3.87% in the 2000–2500 m band to 96.83% above 5500 m, demonstrating strong elevation dependency. Long-term trend analysis showed statistically significant declining patterns in lower elevations (2000–3500 m) and higher elevations (>5000 m), with Mann–Kendall τ values ranging from −0.101 to −0.205 (all p < 0.01). The 5000–5500 m band exhibited the steepest decline rate (−0.0095 per semi-monthly period), while mid-elevations (4000–5000 m) showed non-significant trends (p > 0.05), indicating relative stability in these intermediate altitudes. This elevation-dependent variability suggests heterogeneous climate sensitivity across the altitudinal gradient (Figure 4).
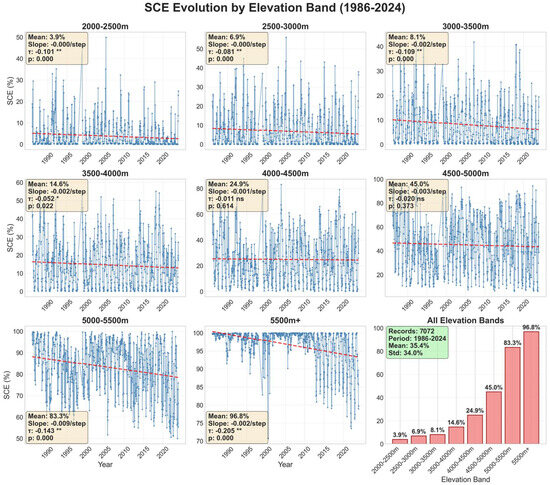
Figure 4.
Temporal trends and statistics of snow cover extent (SCE) across different elevation zones in the Qilian Mountains from 1986–2024. Snow cover extent time series and trend analysis for elevation zones ranging from 2000 m to 5500+ m with 500 m intervals, showing elevation-dependent variations in snow cover dynamics over the 39-year study period.* p < 0.05, ** p < 0.01 (Mann-Kendall test for trend significance).
3.2. Temporal Variability Patterns of Snow Cover
Snow cover distribution exhibited pronounced seasonal heterogeneity. Winter months (December–February) recorded the highest mean SCE of 26.2% ± 7.2%, followed by spring (March–May) and autumn (September–November) with moderate coverage of 18.2% ± 6.5% and 14.4% ± 6.3%, respectively. Summer months (June–August) showed minimal coverage at 4.6% ± 2.8%. Peak monthly SCE occurred in February (27.5% ± 10.0%), while the minimum was recorded in August (2.8% ± 3.4%) (Figure 5a).
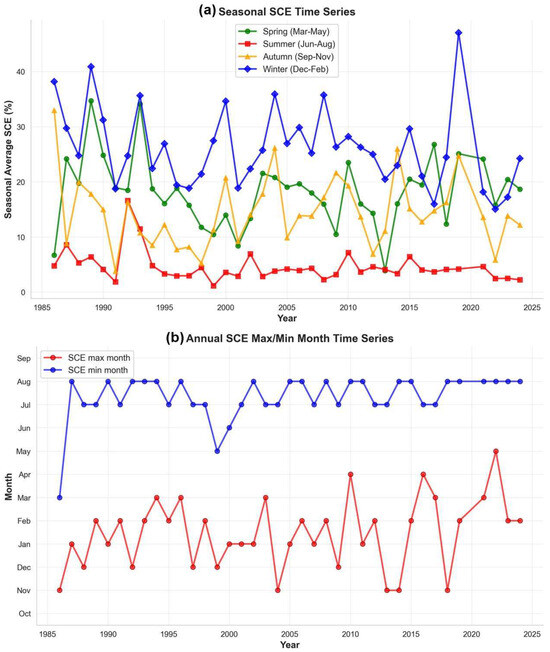
Figure 5.
Seasonal and phenological characteristics of snow cover extent (SCE) in the Qilian Mountains from 1986–2024. (a) Time series of seasonal snow cover extent variations showing long-term trends across different seasons. (b) Temporal variations in the timing of annual maximum and minimum snow cover extent, illustrating changes in snow phenology over the 39-year study period.
The timing of annual maximum SCE demonstrated a delayed trend, progressively shifting from November to later months, with the latest occurrence in May 2021. Conversely, annual minimum SCE timing remained relatively stable, predominantly occurring in July–August, except for an early occurrence in 1986 (Figure 5b).
Monthly SCE trends exhibited temporal heterogeneity across the annual cycle. Statistically significant declining trends (p < 0.05) were observed in January, July, August, and September, with Sen slopes of −0.2278% yr−1, −0.0443% yr−1, −0.0428% yr−1, and −0.0737% yr−1, respectively. Other months showed non-significant trends, though transitional periods (April–June, October–November) exhibited slight increasing tendencies (Figure 6).
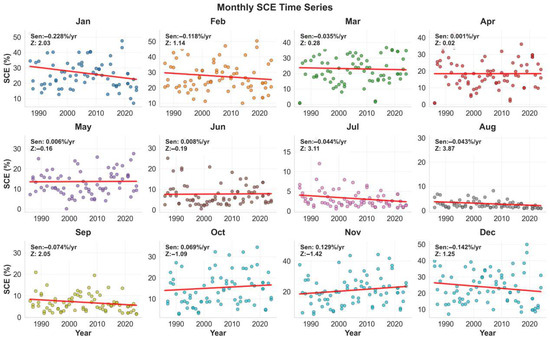
Figure 6.
Monthly snow cover extent (SCE) time series variations in the Qilian Mountains from 1986–2024. Individual long-term time series scatter plots for each of the 12 months showing temporal trends and statistical information of monthly snow cover extent over the 39-year study period.
4. Discussion
4.1. Data Quality Assessment
A total of 42,006 satellite images were utilized across 927 bi-weekly observation periods, with an average of 45.3 images per observation period to ensure detection accuracy, achieving an overall effective observation coverage rate of 82.5% (Figure 7). The study revealed a significant positive correlation between image quantity and observation effectiveness. Periods with lower effective observation coverage were primarily concentrated during transitional phases of sensor replacement, reflecting the challenges of technical continuity between different sensor systems. Particularly noteworthy is the significant difference in observation effectiveness before and after the Scan Line Corrector (SLC) failure of Landsat 7 ETM+. The quality difference between SLC-on and SLC-off images directly impacted detection accuracy throughout the entire ETM+ observation period, resulting in relatively poor observation performance during this era.
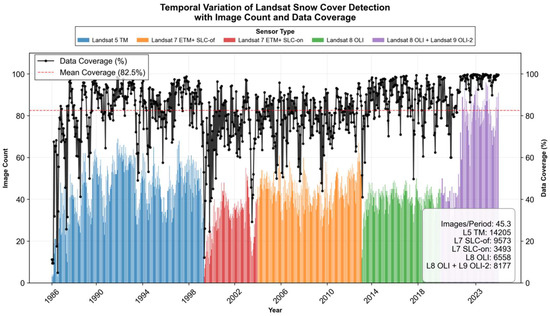
Figure 7.
Landsat sensor usage and data quality statistics for the Qilian Mountains snow cover analysis from 1986–2024. The figure displays the temporal distribution of different Landsat sensors used throughout the study period, time series of image quantities, data coverage rate variations over time, and related statistical information demonstrating the reliability and consistency of the multi-sensor dataset.
In contrast, the synergistic observation strategy employing dual sensors (Landsat 8 OLI and Landsat 9 OLI-2) implemented after 2021 significantly enhanced detection accuracy, achieving an average effective observation coverage rate of 93.40%. This fully demonstrates the technical advantages and broad application prospects of next-generation remote sensing sensors in snow cover identification. Except for 1986, when poor observation performance resulted from sparse TM image data availability, the TM, OLI, and OLI-2 sensors all exhibited excellent snow cover identification capabilities, providing reliable technical support for long-term snow cover monitoring.
4.2. Comparison with MODIS
In comparing the datasets with the MOD10A1 snow products, we selected a time range from 1 September 2000 to 31 December 2019. This decision was made because the quality of MODIS data prior to September 2000 exhibited significant fluctuations, while there was substantial data loss in the Landsat records in 2020. To ensure temporal continuity, we chose this specific time frame. The MOD10A1 product provides daily data, whereas our dataset comprises semi-monthly observations. In total, we identified 6933 data points, with a subset of 230 monthly observations, which yields a relatively large sample size that significantly enhances the robustness of the statistical analysis.
The statistical results demonstrate a strong relationship between the two datasets following the monthly averaging, as evidenced by a Pearson correlation coefficient of 0.8281 and a Spearman rank correlation coefficient of 0.9057, both statistically significant. This finding confirms that the variations in snow cover observed by MODIS and Landsat are consistent in the aggregated monthly data. However, systemic differences persist; Landsat captures a higher mean snow cover extent (16.10%) compared to MODIS (7.98%). This consistent bias of approximately −8.11% indicates that Landsat may be more sensitive to changes in actual snow coverage (Figure 8a).
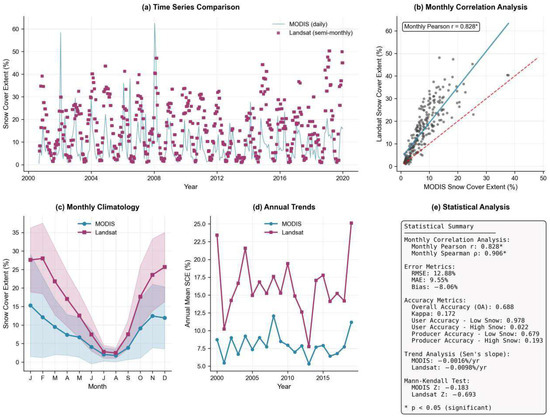
Figure 8.
Comprehensive comparison between MODIS and Landsat snow cover extent products in the Qilian Mountains (2000–2020). (a) Time series comparison showing MODIS daily and Landsat semi-monthly data. (b) Correlation analysis with scatter plot including 1:1 line and regression line. (c) Monthly climatology displaying mean values ± standard deviation. (d) Interannual trends showing annual means with significant trend lines. (e) Statistical summary of all key statistical metrics.
The linear regression analysis, revealing a slope of 1.58, supports the hypothesis that Landsat significantly enhances the observed values of snow extent reported by MODIS [30,57,58], with approximately 68.57% of Landsat’s variance explained by MODIS (Figure 8b).
Regarding error metrics, the Root Mean Square Error (RMSE) was observed to be 12.88%, and the Mean Absolute Error (MAE) was 9.55%, indicating a moderate level of prediction error and necessitating cautious interpretation of temporal trends. The overall accuracy of the analysis was calculated to be 0.688, alongside a Kappa statistic of 0.172, suggesting that the agreement between the datasets is only fair. The user accuracy for low snow cover was remarkably high at 0.978, whereas the user accuracy for high snow cover was much lower at 0.022. In terms of producer accuracy, low snow cover had a value of 0.679, while high snow cover was only 0.193 (Figure 8e). These metrics highlight the challenges in correctly identifying high snow cover and underline the disparities in detection capabilities between the two datasets.
Notably, both datasets exhibited negligible downward trends over the analyzed period; however, these trends were not statistically significant, indicating minimal evidence for long-term changes in snow cover during the study years (Figure 8e). Seasonal analysis revealed considerable variability in snow cover extents, with the highest averages occurring in winter (MODIS: 13.04%, Landsat: 27.03%) and minimal coverage during summer. Seasonal correlations were strongest in autumn (r = 0.870), suggesting that this period is particularly relevant for understanding snow dynamics. The annual correlation was moderate (r = 0.6975), indicating reasonable agreement between the long-term trends of both datasets; however, the discrepancies underscore potential challenges in data consistency (Figure 8c,d).
Furthermore, the quality assessment of the data showed an absence of extreme values (0% or 100% coverage), reflecting a high level of reliability. Nonetheless, the identification of 16 instances of significant discrepancies (exceeding 20%) emphasizes the need for cautious interpretation, particularly in contexts where snow cover is critical for hydrology and climate research (Figure 8a).
In conclusion, while MODIS and Landsat demonstrate a high degree of agreement and correlation, the persistent systematic bias and moderate accuracy highlight the necessity for ongoing calibration and validation of satellite snow cover products. These findings not only contribute to our understanding of snow dynamics but also provide valuable insights for refining remote sensing methodologies and their applications in climate science.
4.3. Mechanisms of Climate Change Impact on Snow Cover in the Qilian Mountains
From a long-term evolutionary perspective, SCE in the QLM showed a slight declining trend from 1986–2024, which is generally consistent with results reported by [59], though the magnitude of change was not significant. Notably, the authors of [4] demonstrated that SCE in the northeastern Tibetan Plateau exhibits an increasing trend, indicating that SCE in the QLM region displays complex variation patterns across different temporal scales. This temporal variability may be related to the non-linear characteristics of climate change, periodic variations in large-scale ocean–atmosphere interaction modes such as the Pacific Decadal Oscillation (PDO) and Atlantic Multidecadal Oscillation (AMO), as well as spatiotemporal reorganization of regional precipitation patterns [6,60,61,62,63,64].
However, from the perspective of vertical distribution characteristics, the snow line shows a significant upward trend, with different elevation zones exhibiting distinctly different variation patterns. High-elevation areas (>5000 m) demonstrate a significant declining trend in SCE, which is closely related to the warming effect in high-altitude regions caused by snow line rise [65], reflecting the sensitivity of alpine environments to climate warming responses. Similarly, low-elevation areas (2000–3500 m) also show a significant declining trend in snow cover, primarily controlled by the dual effects of critical temperature zone upward migration and precipitation phase transition.
The relationship between the rising snow line and climate feedback mechanisms is essential for comprehending the ongoing alterations in snow cover across the QLM. As the snow line ascends due to rising temperatures, the area of land remaining snow-covered during warmer months diminishes. This reduction leads to a decrease in albedo, enhancing solar absorption at the Earth’s surface and further raising local temperatures [66,67,68,69]—a classic example of the snow–albedo feedback loop. Concurrently, reports indicate that under the warming climate of the 21st century, summer snowfall in the QLM has sharply decreased, while rainfall has increased [65], exacerbating the reduction of snow cover in warmer months. Consequently, this positive feedback accelerates snowmelt and prompts additional modifications in the local hydrological regime. As snow cover decreases, the timing and intensity of water availability may also shift, affecting regional ecosystems and hydrology.
Significant changes in snow phenological characteristics further reinforce this mechanism. This study reports a significant decline in SCE during the months of July to September, which is largely due to a dramatic reduction in summer snowfall events. The observed delay in the peak occurrence of snow cover corroborates delayed trends in snow onset and termination previously reported by [24] for the QLM. With continued climate warming, summer snowfall days will likely approach disappearance, and precipitation is expected to transition almost entirely to rainfall [65].
This phenomenon of reduced snow cover establishes a close causal relationship with rising temperatures, with the effects of summer warming being particularly pronounced. Increased temperatures not only directly enhance snowmelt but also synchronize reductions in both SCE and snow depth by altering energy budget balances and precipitation phases [70]. This process creates a positive feedback mechanism that further accelerates the retreat of alpine snow systems.
5. Conclusions
This study successfully constructed a long-term, 30 m resolution snow cover dataset for the QLM using Landsat satellite data from 1986–2024. Innovative dual adaptive cloud masking strategies and multi-level snow classification algorithms facilitated high-precision monitoring and analysis of snow cover changes.
Key findings from the analysis of 927 semi-monthly observations over 39 years include the following:
- Significant Upward Trend of the Snow Line: The vertical distribution of snow cover revealed a pronounced rise in the snow line, with mean and minimum snow cover elevations increasing at rates of 3.98 m yr−1 and 2.81 m yr−1, respectively (p < 0.001).
- Reduction of Snow Cover in High and Low Elevations: Both high-elevation areas (>5000 m) and low-elevation zones (2000–3500 m) showed significant declines in SCE, demonstrating the sensitivity of these regions to climate warming, while mid-elevation areas (4000–5000 m) remained relatively stable, likely serving as vital storage for future snow resources.
- Comparison with MODIS Shows Systematic Underestimation: A systematic comparison with MODIS’s MOD10A1 products revealed a strong correlation between the two datasets (Pearson r = 0.8281, Spearman r = 0.9057). However, Landsat consistently captured a higher mean snow cover extent (16.10%) compared to MODIS (7.98%), indicating a systematic bias of approximately −8.11%. This discrepancy suggests that Landsat may be more sensitive to actual changes in snow coverage, especially in complex mountainous terrain. Error metrics indicated moderate prediction errors, highlighting the challenges in accurately identifying high snow cover, with the consistency for low snow cover recognition between the two products reaching 0.978, while recognition consistency for high summer snow cover was only 0.022.
These findings illustrate the non-linear response of the QLM snow system to climate change, characterized by the upward shift of the snow line and diminishing snow cover at both high and low elevations. The significant decline in summer snow cover reflects the combined effects of warming and changes in precipitation phases. The interaction between reduced snow cover and rising temperatures creates a feedback mechanism that further accelerates the retreat of snow systems.
In conclusion, while MODIS and Landsat exhibit a high degree of correlation, the persistent systematic bias and moderate accuracy underscore the need for ongoing calibration and validation of satellite snow cover products. These insights are crucial for refining remote sensing methodologies and enhancing their applications in climate science, particularly in understanding snow dynamics and their impacts on regional hydrology.
Author Contributions
Conceptualization, E.H. and G.Z.; methodology, E.H. and G.Z.; software, E.H.; validation, Y.W., Y.M. and Q.W. (Qingyang Wang); formal analysis, E.H.; investigation, E.H., Q.W. (Qinqin Wang), X.Q. and L.Z.; resources, R.L. and Y.J.; data curation, E.H.; writing—original draft preparation, E.H.; writing—review and editing, G.Z.; visualization, E.H.; supervision, G.Z.; project administration, G.Z.; funding acquisition, G.Z. All authors have read and agreed to the published version of the manuscript.
Funding
This research was funded by the following grants: National Natural Science Foundation of China (Grant Nos. 42371040, 41971036); Key Natural Science Foundation of Gansu Province (Grant No. 23JRRA698); Key Research and Development Program of Gansu Province (Grant No. 22YF7NA122); Cultivation Program of Major Key Projects of Northwest Normal University (Grant No. NWNU-LKZD-202302); Oasis Scientific Research Achievements Breakthrough Action Plan Project of Northwest Normal University (Grant No. NWNU-LZKX-202303); Gansu Provincial Basic Research Innovation Group Project (Grant No. 22JR5RA129); Western Light Young Scholars Program of the Chinese Academy of Sciences; 2024 Gansu Provincial Water Resources Science Experimental Research and Technology Promotion Project (Grant No. 24GSLK020).
Data Availability Statement
The original contributions presented in the study are included in the article, further inquiries can be directed to the corresponding author.
Conflicts of Interest
The authors declare no conflict of interest.
References
- Pulliainen, J.; Luojus, K.; Derksen, C.; Mudryk, L.; Lemmetyinen, J.; Salminen, M.; Ikonen, J.; Takala, M.; Cohen, J.; Smolander, T. Patterns and trends of Northern Hemisphere snow mass from 1980 to 2018. Nature 2020, 581, 294–298. [Google Scholar] [CrossRef]
- Barnett, T.P.; Adam, J.C.; Lettenmaier, D.P. Potential impacts of a warming climate on water availability in snow-dominated regions. Nature 2005, 438, 303–309. [Google Scholar] [CrossRef]
- Zhu, G.; Wang, L.; Liu, Y.; Bhat, M.A.; Qiu, D.; Zhao, K.; Sang, L.; Lin, X.; Ye, L. Snow-melt water: An important water source for Picea crassifolia in Qilian Mountains. J. Hydrol. 2022, 613, 128441. [Google Scholar] [CrossRef]
- Tang, Z.; Deng, G.; Hu, G.; Zhang, H.; Pan, H.; Sang, G. Satellite observed spatiotemporal variability of snow cover and snow phenology over high mountain Asia from 2002 to 2021. J. Hydrol. 2022, 613, 128438. [Google Scholar] [CrossRef]
- Yao, J.; Chen, Y.; Guan, X.; Zhao, Y.; Chen, J.; Mao, W. Recent climate and hydrological changes in a mountain–basin system in Xinjiang, China. Earth-Sci. Rev. 2022, 226, 103957. [Google Scholar] [CrossRef]
- Notarnicola, C. Hotspots of snow cover changes in global mountain regions over 2000–2018. Remote Sens. Environ. 2020, 243, 111781. [Google Scholar] [CrossRef]
- Sun, D.; Ji, Z.; Wang, Y.; Zhang, W. Assessment and forecasting of water ecological security and obstacle factor diagnosis in the Hexi Corridor of Northwest China. Sci. Rep. 2024, 14, 23507. [Google Scholar] [CrossRef]
- Li, Z.; Gui, J.; Wang, X.; Feng, Q.; Zhao, T.; Ouyang, C.; Guo, X.; Zhang, B.; Shi, Y. Water resources in inland regions of central Asia: Evidence from stable isotope tracing. J. Hydrol. 2019, 570, 1–16. [Google Scholar] [CrossRef]
- Liu, Z.; Wang, N.; Cuo, L.; Liang, L. Characteristics and attribution of spatiotemporal changes in Qilian Mountains’ runoff over the past six decades. J. Geophys. Res. Atmos. 2023, 128, e2023JD039176. [Google Scholar] [CrossRef]
- Gui, J.; Li, Z.; Feng, Q.; Cui, Q.; Xue, J. Contribution of cryosphere to runoff in the transition zone between the Tibetan Plateau and arid region based on environmental isotopes. Hydrol. Earth Syst. Sci. 2023, 27, 97–122. [Google Scholar] [CrossRef]
- Li, Y.; Chen, Y.; Wang, F.; He, Y.; Li, Z. Evaluation and projection of snowfall changes in High Mountain Asia based on NASA’s NEX-GDDP high-resolution daily downscaled dataset. Environ. Res. Lett. 2020, 15, 104040. [Google Scholar] [CrossRef]
- Li, Z.; Chen, Y.; Li, Y.; Wang, Y. Declining snowfall fraction in the alpine regions, Central Asia. Sci. Rep. 2020, 10, 3476. [Google Scholar] [CrossRef]
- Li, X.; Liu, X.; Zhao, K.; Zhang, X.; Li, L. Change in the potential snowfall phenology: Past, present, and future in the Chinese Tianshan mountainous region, Central Asia. Cryosphere 2023, 17, 2437–2453. [Google Scholar] [CrossRef]
- Dong, W.; Ming, Y. Seasonality and Variability of Snowfall to Total Precipitation Ratio over High Mountain Asia Simulated by the GFDL High-Resolution AM4. J. Clim. 2022, 35, 5573–5589. [Google Scholar] [CrossRef]
- Fallah, B.; Didovets, I.; Rostami, M.; Hamidi, M. Climate change impacts on Central Asia: Trends, extremes and future projections. Int. J. Climatol. 2024, 44, 3191–3213. [Google Scholar] [CrossRef]
- Bokhorst, S.; Pedersen, S.H.; Brucker, L.; Anisimov, O.; Bjerke, J.W.; Brown, R.D.; Ehrich, D.; Essery, R.L.; Heilig, A.; Ingvander, S. Changing Arctic snow cover: A review of recent developments and assessment of future needs for observations, modelling, and impacts. Ambio 2016, 45, 516–537. [Google Scholar] [CrossRef] [PubMed]
- Mankin, J.S.; Viviroli, D.; Singh, D.; Hoekstra, A.Y.; Diffenbaugh, N.S. The potential for snow to supply human water demand in the present and future. Environ. Res. Lett. 2015, 10, 114016. [Google Scholar] [CrossRef]
- Musselman, K.N.; Addor, N.; Vano, J.A.; Molotch, N.P. Winter melt trends portend widespread declines in snow water resources. Nat. Clim. Change 2021, 11, 418–424. [Google Scholar] [CrossRef]
- Siirila-Woodburn, E.R.; Rhoades, A.M.; Hatchett, B.J.; Huning, L.S.; Szinai, J.; Tague, C.; Nico, P.S.; Feldman, D.R.; Jones, A.D.; Collins, W.D. A low-to-no snow future and its impacts on water resources in the western United States. Nat. Rev. Earth Environ. 2021, 2, 800–819. [Google Scholar] [CrossRef]
- Wang, C.; Yang, K.; Li, Y.; Wu, D.; Bo, Y. Impacts of spatiotemporal anomalies of Tibetan Plateau snow cover on summer precipitation in eastern China. J. Clim. 2017, 30, 885–903. [Google Scholar] [CrossRef]
- Bednorz, E. Snow cover in eastern Europe in relation to temperature, precipitation and circulation. Int. J. Climatol. 2004, 24, 591–601. [Google Scholar] [CrossRef]
- Karl, T.R.; Groisman, P.Y.; Knight, R.W.; Heim, R.R., Jr. Recent variations of snow cover and snowfall in North America and their relation to precipitation and temperature variations. J. Clim. 1993, 6, 1327–1344. [Google Scholar] [CrossRef]
- Jiang, Y.; Ming, J.; Ma, P.; Wang, P.; Du, Z. Variation in the snow cover on the Qilian Mountains and its causes in the early 21st century. Geomat. Nat. Hazards Risk 2016, 7, 1824–1834. [Google Scholar] [CrossRef]
- Qi, Y.; Wang, H.; Ma, X.; Zhang, J.; Yang, R. Relationship between vegetation phenology and snow cover changes during 2001–2018 in the Qilian Mountains. Ecol. Indic. 2021, 133, 108351. [Google Scholar] [CrossRef]
- Deng, G.; Liu, X.G.; Shen, Q.K.; Zhang, T.C.; Chen, Q.H.; Tang, Z.G. Remote Sensing Data Assimilation to Improve the Seasonal Snow Cover Simulations Over the Heihe River Basin, Northwest China. Int. J. Climatol. 2024, 44, 5621–5640. [Google Scholar] [CrossRef]
- Deng, G.; Tang, Z.G.; Dong, C.Y.; Shao, D.H.; Wang, X. Development and Evaluation of a Cloud-Gap-Filled MODIS Normalized Difference Snow Index Product over High Mountain Asia. Remote Sens. 2024, 16, 192. [Google Scholar] [CrossRef]
- Tang, Z.G.; Wang, X.R.; Deng, G.; Wang, X.; Jiang, Z.L.; Sang, G.Q. Spatiotemporal variation of snowline altitude at the end of melting season across High Mountain Asia, using MODIS snow cover product. Adv. Space Res. 2020, 66, 2629–2645. [Google Scholar] [CrossRef]
- Crawford, C.J. MODIS Terra Collection 6 fractional snow cover validation in mountainous terrain during spring snowmelt using Landsat TM and ETM+. Hydrol. Process. 2015, 29, 128–138. [Google Scholar] [CrossRef]
- Huang, X.; Liang, T.; Zhang, X.; Guo, Z. Validation of MODIS snow cover products using Landsat and ground measurements during the 2001–2005 snow seasons over northern Xinjiang, China. Int. J. Remote Sens. 2011, 32, 133–152. [Google Scholar] [CrossRef]
- Muhammad, S.; Thapa, A. An improved Terra–Aqua MODIS snow cover and Randolph Glacier Inventory 6.0 combined product (MOYDGL06*) for high-mountain Asia between 2002 and 2018. Earth Syst. Sci. Data 2020, 12, 345–356. [Google Scholar] [CrossRef]
- Kuter, S.; Akyurek, Z.; Weber, G.-W. Retrieval of fractional snow covered area from MODIS data by multivariate adaptive regression splines. Remote Sens. Environ. 2018, 205, 236–252. [Google Scholar] [CrossRef]
- Xue, J.; Li, Z.X.; Feng, Q.; Li, Z.J.; Gui, J.; Li, Y.C. Ecological conservation pattern based on ecosystem services in the Qilian Mountains, northwest China. Environ. Dev. 2023, 46, 100834. [Google Scholar] [CrossRef]
- Wei, S.H.; Wang, X.J.; Wang, K.; Liu, L.Y.; Liang, B.B.; Zhao, W.Y. Rethinking spatiotemporal variations in air temperature over the Qilian Mountains, Western China, from 1979 to 2018. Atmos. Res. 2023, 286, 106671. [Google Scholar] [CrossRef]
- Yuan, X.; Jiao, L.; Che, X.C.; Wu, J.J.; Zhu, X.L.; Li, Q. Study on the water-carbon coupling coordination function on the eastern edge of the Qinghai-Tibet plateau. Ecol. Model. 2024, 487, 110572. [Google Scholar] [CrossRef]
- Du, K.; Yang, L.R.; Zhang, R.; Yue, L.P.; Guo, H.J.; Zhang, Y.X.; Li, J.X.; Gong, H.J. Cenozoic tectonics and landform evolution in the Qilian Mountains and adjacent areas. Int. Geol. Rev. 2020, 62, 585–597. [Google Scholar] [CrossRef]
- Huang, X.F.; Gao, R.; Li, W.H.; Xiong, X.S. Seismic reflection evidence of crustal duplexing and lithospheric underthrusting beneath the western Qilian Mountains, northeastern margin of the Tibetan Plateau. Sci. China-Earth Sci. 2021, 64, 96–109. [Google Scholar] [CrossRef]
- Sun, M.P.; Liu, S.Y.; Yao, X.J.; Guo, W.Q.; Xu, J.L. Glacier changes in the Qilian Mountains in the past half-century: Based on the revised First and Second Chinese Glacier Inventory. J. Geogr. Sci. 2018, 28, 206–220. [Google Scholar] [CrossRef]
- Li, Y.; Peng, S.M. Ecological and hydrologic evolution history in the sensitive zone of both East Asian summer monsoon and Westerly since the Last Glacial Maximum. J. Mt. Sci. 2023, 20, 1266–1281. [Google Scholar] [CrossRef]
- Crawford, C.J.; Manson, S.M.; Bauer, M.E.; Hall, D.K. Multitemporal snow cover mapping in mountainous terrain for Landsat climate data record development. Remote Sens. Environ. 2013, 135, 224–233. [Google Scholar] [CrossRef]
- JPL, NASA. NASA Shuttle Radar Topography Mission Global 1 arc Second; NASA Earthdata: Pasadena, CA, USA, 2013. Available online: https://earthdata.nasa.gov/ (accessed on 16 July 2025).
- Gorelick, N.; Hancher, M.; Dixon, M.; Ilyushchenko, S.; Thau, D.; Moore, R. Google Earth Engine: Planetary-scale geospatial analysis for everyone. Remote Sens. Environ. 2017, 202, 18–27. [Google Scholar] [CrossRef]
- Hall, D.K.; Riggs, G.A. Accuracy assessment of the MODIS snow products. Hydrol. Process. 2007, 21, 1534–1547. [Google Scholar] [CrossRef]
- Yang, J.; Jiang, L.; Ménard, C.B.; Luojus, K.; Lemmetyinen, J.; Pulliainen, J. Evaluation of snow products over the Tibetan Plateau. Hydrol. Process. 2015, 29, 3247–3260. [Google Scholar] [CrossRef]
- Liu, C.; Li, Z.; Zhang, P.; Zeng, J.Y.; Gao, S.; Zheng, Z.J. An Assessment and Error Analysis of MOD10A1 Snow Product Using Landsat and Ground Observations Over China During 2000–2016. IEEE J. Sel. Top. Appl. Earth Obs. Remote Sens. 2020, 13, 1467–1478. [Google Scholar] [CrossRef]
- Gascoin, S.; Hagolle, O.; Huc, M.; Jarlan, L.; Dejoux, J.F.; Szczypta, C.; Marti, R.; Sánchez, R. A snow cover climatology for the Pyrenees from MODIS snow products. Hydrol. Earth Syst. Sci. 2015, 19, 2337–2351. [Google Scholar] [CrossRef]
- Cao, R.; Chen, Y.; Chen, J.; Zhu, X.; Shen, M. Thick cloud removal in Landsat images based on autoregression of Landsat time-series data. Remote Sens. Environ. 2020, 249, 112001. [Google Scholar] [CrossRef]
- Chen, B.; Huang, B.; Chen, L.; Xu, B. Spatially and temporally weighted regression: A novel method to produce continuous cloud-free Landsat imagery. IEEE Trans. Geosci. Remote Sens. 2016, 55, 27–37. [Google Scholar] [CrossRef]
- Chen, Y.; Weng, Q.; Tang, L.; Zhang, X.; Bilal, M.; Li, Q. Thick clouds removing from multitemporal Landsat images using spatiotemporal neural networks. IEEE Trans. Geosci. Remote Sens. 2020, 60, 4400214. [Google Scholar] [CrossRef]
- Zhou, Y.N.; Wang, S.Y.; Wu, T.J.; Feng, L.; Wu, W.; Luo, J.C.; Zhang, X.; Yan, N.N. For-backward LSTM-based missing data reconstruction for time-series Landsat images. GIScience Remote Sens. 2022, 59, 410–430. [Google Scholar] [CrossRef]
- Wang, J.W.; Tang, Z.G.; Deng, G.; Hu, G.J.; You, Y.H.; Zhao, Y.C. Landsat Satellites Observed Dynamics of Snowline Altitude at the End of the Melting Season, Himalayas, 1991–2022. Remote Sens. 2023, 15, 2534. [Google Scholar] [CrossRef]
- Foga, S.; Scaramuzza, P.L.; Guo, S.; Zhu, Z.; Dilley, R.D.; Beckmann, T.; Schmidt, G.L.; Dwyer, J.L.; Hughes, M.J.; Laue, B. Cloud detection algorithm comparison and validation for operational Landsat data products. Remote Sens. Environ. 2017, 194, 379–390. [Google Scholar] [CrossRef]
- Desinayak, N.; Prasad, A.K.; El-Askary, H.; Kafatos, M.; Asrar, G.R. Snow cover variability and trend over the Hindu Kush Himalayan region using MODIS and SRTM data. Ann. Geophys. 2022, 40, 67–82. [Google Scholar] [CrossRef]
- Zhu, L.L.; Ma, G.Y.; Zhang, Y.Y.; Wang, J.G.; Tian, W.; Kan, X. Accelerated decline of snow cover in China from 1979 to 2018 observed from space. Sci. Total Environ. 2022, 814, 152491. [Google Scholar] [CrossRef]
- Thapa, S.; Li, B.; Fu, D.L.; Shi, X.F.; Tang, B.; Qi, H.; Wang, K. Trend analysis of climatic variables and their relation to snow cover and water availability in the Central Himalayas: A case study of Langtang Basin, Nepal. Theor. Appl. Climatol. 2020, 140, 891–903. [Google Scholar] [CrossRef]
- Azizi, A.H.; Akhtar, F. Analysis of spatiotemporal variation in the snow cover in Western Hindukush-Himalaya region. Geocarto Int. 2022, 37, 6602–6624. [Google Scholar] [CrossRef]
- Entezami, H.; Mojarrad, F.; Shahabi, H.; Ghaderpour, E. Spatiotemporal Variability in Snow and Land Cover in Sefid-Rud Basin, Iran. Sustainability 2024, 16, 9381. [Google Scholar] [CrossRef]
- Luan, W.B.; Zhang, X.L.; Xiao, P.F.; Wang, H.D.; Chen, S.Y. Binary and Fractional MODIS Snow Cover Mapping Boosted by Machine Learning and Big Landsat Data. IEEE Trans. Geosci. Remote Sens. 2022, 60, 4305714. [Google Scholar] [CrossRef]
- Stillinger, T.; Rittger, K.; Raleigh, M.S.; Michell, A.; Davis, R.E.; Bair, E.H. Landsat, MODIS, and VIIRS snow cover mapping algorithm performance as validated by airborne lidar datasets. Cryosphere 2023, 17, 567–590. [Google Scholar] [CrossRef]
- Li, X.; Wang, N.; Wu, Y. Automated glacier snow line altitude calculation method using landsat series images in the Google earth engine platform. Remote Sens. 2022, 14, 2377. [Google Scholar] [CrossRef]
- Notarnicola, C. Overall negative trends for snow cover extent and duration in global mountain regions over 1982–2020. Sci. Rep. 2022, 12, 13731. [Google Scholar] [CrossRef] [PubMed]
- Bernat, M.; Miles, E.S.; Kneib, M.; Fujita, K.; Sasaki, O.; Shaw, T.E.; Pellicciotti, F. Precipitation phase drives seasonal and decadal snowline changes in high mountain Asia. Environ. Res. Lett. 2025, 20, 064039. [Google Scholar] [CrossRef]
- Bharati, P.; Deb, P.; Hunt, K.M.R. Pacific Decadal Oscillation-driven interdecadal variability of snowfall over the Karakoram and the Western Himalayas. Weather Clim. Dyn. 2025, 6, 197–210. [Google Scholar] [CrossRef]
- Bahrami-Pichaghchi, H.; Aghelpour, P. An estimation and multi-step ahead prediction study of monthly snow cover area, based on efficient atmospheric-oceanic dynamics. Clim. Dyn. 2023, 60, 743–765. [Google Scholar] [CrossRef]
- Umirbekov, A.; Peña-Guerrero, M.D.; Müller, D. Regionalization of climate teleconnections across Central Asian mountains improves the predictability of seasonal precipitation. Environ. Res. Lett. 2022, 17, 055002. [Google Scholar] [CrossRef]
- Dou, M.Y.; Duan, K.Q.; Chen, R.; Li, L. Precipitation phase shift variations under a warming climate over the Qilian Mountain, China in the 21st century. J. Hydrol.-Reg. Stud. 2025, 57, 102151. [Google Scholar] [CrossRef]
- Alessandri, A.; Catalano, F.; De Felice, M.; van den Hurk, B.; Balsamo, G. Varying snow and vegetation signatures of surface-albedo feedback on the Northern Hemisphere land warming. Environ. Res. Lett. 2021, 16, 034023. [Google Scholar] [CrossRef]
- Peng, X.Q.; Frauenfeld, O.W.; Huang, Y.; Chen, G.Q.; Wei, G.; Li, X.J.; Tian, W.W.; Yang, G.S.; Zhao, Y.H.; Mu, C.C. The thermal effect of snow cover on ground surface temperature in the Northern Hemisphere. Environ. Res. Lett. 2024, 19, 044015. [Google Scholar] [CrossRef]
- Jing, W.Q.; Wang, J.F. A Dynamics of Surface Temperature Forced by Solar Radiation. Geophys. Res. Lett. 2023, 50, e2022GL101222. [Google Scholar] [CrossRef]
- Deng, G.; Tang, Z.G.; Hu, G.J.; Wang, J.W.; Sang, G.Q.; Li, J. Spatiotemporal Dynamics of Snowline Altitude and Their Responses to Climate Change in the Tienshan Mountains, Central Asia, during 2001–2019. Sustainability 2021, 13, 3992. [Google Scholar] [CrossRef]
- Zhao:, P.; He, Z.B.; Du, J. Implications of elevation-dependent warming to water resources over the Chinese Qilian Mountains. J. Water Clim. Change 2023, 14, 239–252. [Google Scholar] [CrossRef]
Disclaimer/Publisher’s Note: The statements, opinions and data contained in all publications are solely those of the individual author(s) and contributor(s) and not of MDPI and/or the editor(s). MDPI and/or the editor(s) disclaim responsibility for any injury to people or property resulting from any ideas, methods, instructions or products referred to in the content. |
© 2025 by the authors. Licensee MDPI, Basel, Switzerland. This article is an open access article distributed under the terms and conditions of the Creative Commons Attribution (CC BY) license (https://creativecommons.org/licenses/by/4.0/).