Article

SSGY: A Lightweight Neural Network Method for SAR Ship Detection

by
Fangliang He
,
Chao Wang
and
Baolong Guo
*
Institute of Intelligent Control and Image Engineering, Xidian University, Xi’an 710071, China
*
Author to whom correspondence should be addressed.
Remote Sens. 2025, 17(16), 2868; https://doi.org/10.3390/rs17162868
Submission received: 3 July 2025 / Revised: 14 August 2025 / Accepted: 15 August 2025 / Published: 18 August 2025

Abstract

Synthetic aperture radar (SAR) ship detection faces significant challenges due to complex marine backgrounds, diverse ship scales and shapes, and the demand for lightweight algorithms. Traditional methods, such as constant false alarm rate and edge detection, often underperform in such scenarios. Although deep learning approaches have advanced detection capabilities, they frequently struggle to balance performance and efficiency. Algorithms of the YOLO series offer real-time detection with high efficiency, but their accuracy in intricate SAR environments remains limited. To address these issues, this paper proposes a lightweight SAR ship detection method based on the YOLOv10 framework, optimized across several key modules. The backbone network introduces a StarNet structure with multi-scale convolutional kernels, dilated convolutions, and an ECA module to enhance feature extraction and reduce computational complexity. The neck network utilizes a lightweight C2fGSConv structure, improving multi-scale feature fusion while reducing computation and parameter count. The detection head employs a dual assignment strategy and depthwise separable convolutions to minimize computational overhead. Furthermore, a hybrid loss function combining classification loss, bounding box regression loss, and focal distribution loss is designed to boost detection accuracy and robustness. Experiments on the SSDD and HRSID datasets demonstrate that the proposed method achieves superior performance, with a parameter count of 1.4 million and 5.4 billion FLOPs, and it achieves higher AP and accuracy compared to existing algorithms under various scenarios and scales. Ablation studies confirm the effectiveness of each module, and the results show that the proposed approach surpasses most current methods in both parameter efficiency and detection accuracy.

1. Introduction

In recent years, the rapid development of synthetic aperture radar (SAR) technology has attracted widespread global attention. Its ability to provide high-resolution imaging in all weather conditions and at any time of day plays a crucial role in applications such as surface monitoring, disaster response, and maritime security [1,2,3]. With the growth of commercial space ventures and sustained investments from major international space agencies, systems such as the European Space Agency’s Sentinel-1 series have seen continuous upgrades. Additionally, companies such as Capella Space in the United States and ICEYE in Finland have launched multiple small SAR satellites, enabling more frequent and flexible image acquisition. China’s Gaofen series and the Jilin-1 SAR constellation are also expanding, generating vast amounts of image data for both global marine and terrestrial monitoring. In this context, SAR-based ship detection has become a critical technology for ensuring maritime traffic safety, conducting emergency search and rescue operations, and performing national defense early-warning tasks [4,5,6].
The complex ocean background and the diversity of ships make ship detection in SAR images challenging. Interferences such as side scatterers, sea clutter, and sea ice reflection differences often lead to false alarms [7]. At the same time, the differences in the size, shape, and attitude of ships make it difficult to summarize a unified feature model [8]. The speckle noise of SAR image reduces the clarity and contrast of the image and blurs the edge of the ship, especially for small ships, resulting in missed detection and inaccurate contour judgment [9,10,11,12]. Moreover, with the increasing volume of high-resolution remote sensing data, achieving rapid ship detection on resource-constrained satellite or airborne platforms has become one of the core challenges in current SAR research. Therefore, minimizing the computational and storage costs of the detection method without compromising detection accuracy is the main focus of this study [13].
To address the challenges mentioned above, researchers have conducted extensive investigations into SAR-based ship detection, which can currently be divided into two main categories: traditional target detection algorithms and deep-learning-based detection algorithms.
In the early stage of the development of SAR ship detection technology, traditional detection methods played a leading role [14]. The constant false alarm rate (CFAR) method dynamically adjusts the detection threshold according to the statistical characteristics of local background clutter to ensure a constant false alarm probability. With a uniform background, CFAR can effectively recognize ship targets [15,16]. However, when there are multiple strong interfering scatterers in the background, its detection performance is significantly reduced [17,18]. Edge detection methods, such as Sobel and Canny, recognize the ship contour by using the gray gradient change between the ship and the background [19,20,21]. However, the inherent speckle of SAR images often leads to a large number of false edges in the detection results. In addition, for ships with irregular contours or partial occlusion, it is difficult to extract edge information, which, in turn, reduces the detection accuracy. Although traditional detection algorithms are simple to implement, their accuracy and generalization are significantly limited when handling the complex and dynamic conditions in SAR images. This has driven the development of deep-learning-based detection algorithms.
Recent advances in deep learning, particularly in automatic feature extraction and complex pattern recognition, have revolutionized SAR ship detection [22,23,24]. Convolutional Neural Networks (CNNs), with their multi-layer convolution and pooling structures, effectively capture the shape features of ships in SAR images [25,26,27]. Fast R-CNN, a two-stage detection model [28], is applicable to SAR ship detection but suffers from anchor-box mechanisms that introduce numerous hyperparameters, complicating model tuning. Moreover, detection accuracy drops for unconventional ships whose shapes or sizes fall outside predefined anchor-box ranges. To address this, Fully Convolutional One-Stage (FCOS) detection is proposed [29], determining ship locations and sizes by measuring the distance from each pixel to the ship’s boundary [30]. While efficient, FCOS’s per-pixel processing demands high computational resources when applied to large-scale SAR images, resulting in longer detection times [31]. Additionally, the transformer architectures [32], with their self-attention mechanisms, excel at handling long-range dependencies and global context, achieving high accuracy in complex scenes. The RT-DETR method, introduced in 2024, employs an efficient mixed encoder and query selection for real-time applications, pushing DETR towards practical deployment [33]. Nevertheless, even considering only the prediction process during deployment, DETR’s efficiency still falls short. Additionally, applying a transformer to SAR-image-based ship detection tasks is challenged by the feature discrepancies between ship characteristics in SAR and optical images. SAR images often contain numerous small ship targets, which diminishes the advantage of transformers in capturing global features. In this context, the extraction of local features becomes critical, and thus, the performance improvement of transformers in SAR-image-based object detection is not significant compared to traditional CNNs.
The You Only Look Once (YOLO) series, a significant branch of object detection, attracts widespread attention due to its exceptional speed in detection [34,35]. YOLOv1 pioneers the division of input images into multiple grids, with each grid responsible for predicting object bounding boxes and class probabilities, significantly improving detection speed. YOLOv3 introduces a multi-scale detection mechanism, enabling effective detection of objects of various sizes [36]. YOLOv4 [37] and YOLOv5 [38] optimize network structures and training strategies, maintaining high speed while improving detection accuracy. YOLOv6 combines the EfficientRep Backbone and Rep-PAN Neck architecture to reduce computational load and increase inference speed [39], and its anchor-free mechanism significantly improves the detection of ships, particularly small targets. YOLOv7 further enhances the robustness of SAR image detection by introducing new activation functions, optimizing the backbone network, and applying advanced data augmentation strategies [40]. The adaptive anchor-box technique in YOLOv7, based on data-driven adjustments, improves ship detection accuracy under varying conditions. YOLOv8 introduces advanced feature extraction and fusion mechanisms, redesigns the backbone and neck structures to support multi-scale detection [41], and optimizes training strategies and loss functions to accelerate convergence and enhance detection accuracy, making it an ideal choice for real-time maritime ship monitoring.
Recent studies have further optimized YOLOv8 for lightweight ship detection. Li and Wang [42] proposed EGM-YOLOv8, which integrates Efficient Channel Attention (ECA), a lightweight GELAN–PANet fusion, and MPDIoU loss to improve recall and reduce parameters and computation, achieving a better balance between accuracy and efficiency for real-time maritime applications. Similarly, Gao et al. [43] introduced an improved YOLOv8n with DualConv, a Slim-neck using GSConv and VoVGSCSP, SEAM attention, and MPDIoU, significantly enhancing detection accuracy while maintaining a lightweight design on the SeaShips dataset.
However, the methods mentioned above are primarily designed for optical images, which rely on visible-light reflection and provide rich color and texture information. In contrast, SAR images are generated by centimeter-wave radar signal backscatter, exhibiting unique geometric distortions and multiplicative noise. Therefore, directly applying methods designed for optical images to ship detection in SAR images results in a decline in detection performance. Given these differences, many studies focus on developing ship detection methods specifically tailored for SAR images. These methods take into account the unique imaging mechanism and data characteristics of SAR and design a range of specialized neural network structures to enhance detection accuracy [44,45,46,47,48]. However, these methods often face challenges such as high computational complexity, slow prediction speeds, and difficulties in deployment on SAR platforms with limited computational power and storage capacity.
To address these challenges, this paper proposes a lightweight SAR-Star-GSConv-YOLOv10 (SSGY) neural network for ship detection in SAR images. The network is based on the YOLOv10 framework, with customized designs for key modules such as the backbone, neck, and loss function. This approach aims to reduce model parameters and computational complexity while improving detection accuracy and adaptability to ships of varying scenes and scales. Ultimately, the method supports reliable ship detection applications on resource-constrained SAR platforms. The specific contributions are as follows:
  • The multi-scale kernel StarNet network structure is designed and used as a backbone network. The convolution kernel size of the structure is different in different feature extraction stages, which enhances the feature extraction ability of the model for ships of different scales and effectively reduces the computational complexity. In addition, the extended convolution and efficient channel attention (ECA) modules are integrated to further improve the ability to detect ships in complex backgrounds.
  • A lightweight neck network based on GSConv is proposed, effectively reducing the high computational resource consumption of the classic YOLO neck. Particularly when handling multi-scale ship features in SAR images, this design reduces the number of parameters and computational load, significantly improving feature fusion efficiency and detection accuracy.
  • A composite loss function integrating detection loss, bounding box loss, and distribution focal loss (DFL) is proposed. This combination enables the model to better learn ship features in SAR images, improving detection accuracy and robustness. Furthermore, the detection head adopts a consistent dual assignment strategy and utilizes depthwise separable convolutions to reduce parameters and computational load, allowing training without the need for non-maximum suppression (NMS), thereby further optimizing model performance.
The organization of this paper is as follows: Section 2 introduces the YOLOv10 object detection algorithm and reviews related work on ship detection in SAR images. Section 3 provides a detailed description of the proposed SSGY network architecture, covering the overall framework, the enhanced StarNet backbone, the lightweight neck network, the detection head, and the loss function. Section 4 presents the experimental details, including the datasets used, experimental settings, ablation studies, and comparative experiments with other detection methods. Section 5 contains the discussion, and Section 6 concludes the paper.

2. Related Works

2.1. YOLOv10 Detection Algorithm

YOLOv10 represents the latest generation of end-to-end real-time object detection models within the YOLO series [49]. Its design philosophy aims to overcome the limitations of previous YOLO algorithms in terms of both performance and efficiency, pushing the boundaries of what is possible, as illustrated in Figure 1.
The traditional YOLO model uses a one-to-many label assignment strategy during training, which, while effective, relies on NMS during inference, thereby reducing efficiency. YOLOv10 integrates both one-to-many and one-to-one label assignment strategies, optimizing the backbone and neck networks jointly during training to enhance feedback and efficiency. During inference, only the one-to-one head is used, eliminating the need for NMS and reducing computational overhead, making it suitable for edge deployment. Experiments show that YOLOv10 achieves lower latency than YOLOv8-S while maintaining excellent detection performance. Additionally, YOLOv10 introduces a spatial channel decoupling downsampling module and an efficient PSA module, reducing computational cost and information loss while improving feature fusion. Overall, YOLOv10 is a reasonable and advantageous choice for SAR image ship detection.

2.2. Deep Learning Methods for SAR Image Ship Detection

Due to the feature differences between SAR and optical images, specialized neural network architectures are required for ship detection in SAR images. Xu et al. propose the Lite-YOLOv5 model, which integrates the L-CSP module, CSA module, and H-SPP for optimized feature extraction, while reducing computational overhead through network pruning and the HPBC strategy [6]. Guo et al. introduce the DSASFF module, which uses depthwise separable convolutions and multi-scale feature fusion to detect small ship targets, but it performs poorly on large-scale SAR images [44]. To address this, Huang et al. developed the CViTF network, which combines CNNs with visual transformers [50]. Lv et al. propose a two-step detection method based on feature projection and sparse matrix decomposition, leveraging SAR image strong scattering and low-order features [45]. Wang et al. introduce a dual-backbone network to extract both spatial- and frequency-domain features. While these methods show some success, the balance between precision and recall still requires improvement [46]. In 2024, Yasir et al. introduced ShipGeoNet, which integrates Mask R-CNN with the ViTDet backbone [47]. However, it heavily relies on high-quality SAR images and struggles to improve performance in low-resolution or complex maritime environments.
Although these methods perform well in SAR image object detection, the challenges of high model complexity and limited accuracy persist. This study aims to develop a lightweight model deployable on mobile platforms while ensuring detection accuracy.

3. Method

This section comprehensively shows the main modules and design ideas of the proposed SSGY network.

3.1. Overview of the SSGY Network Model Structure

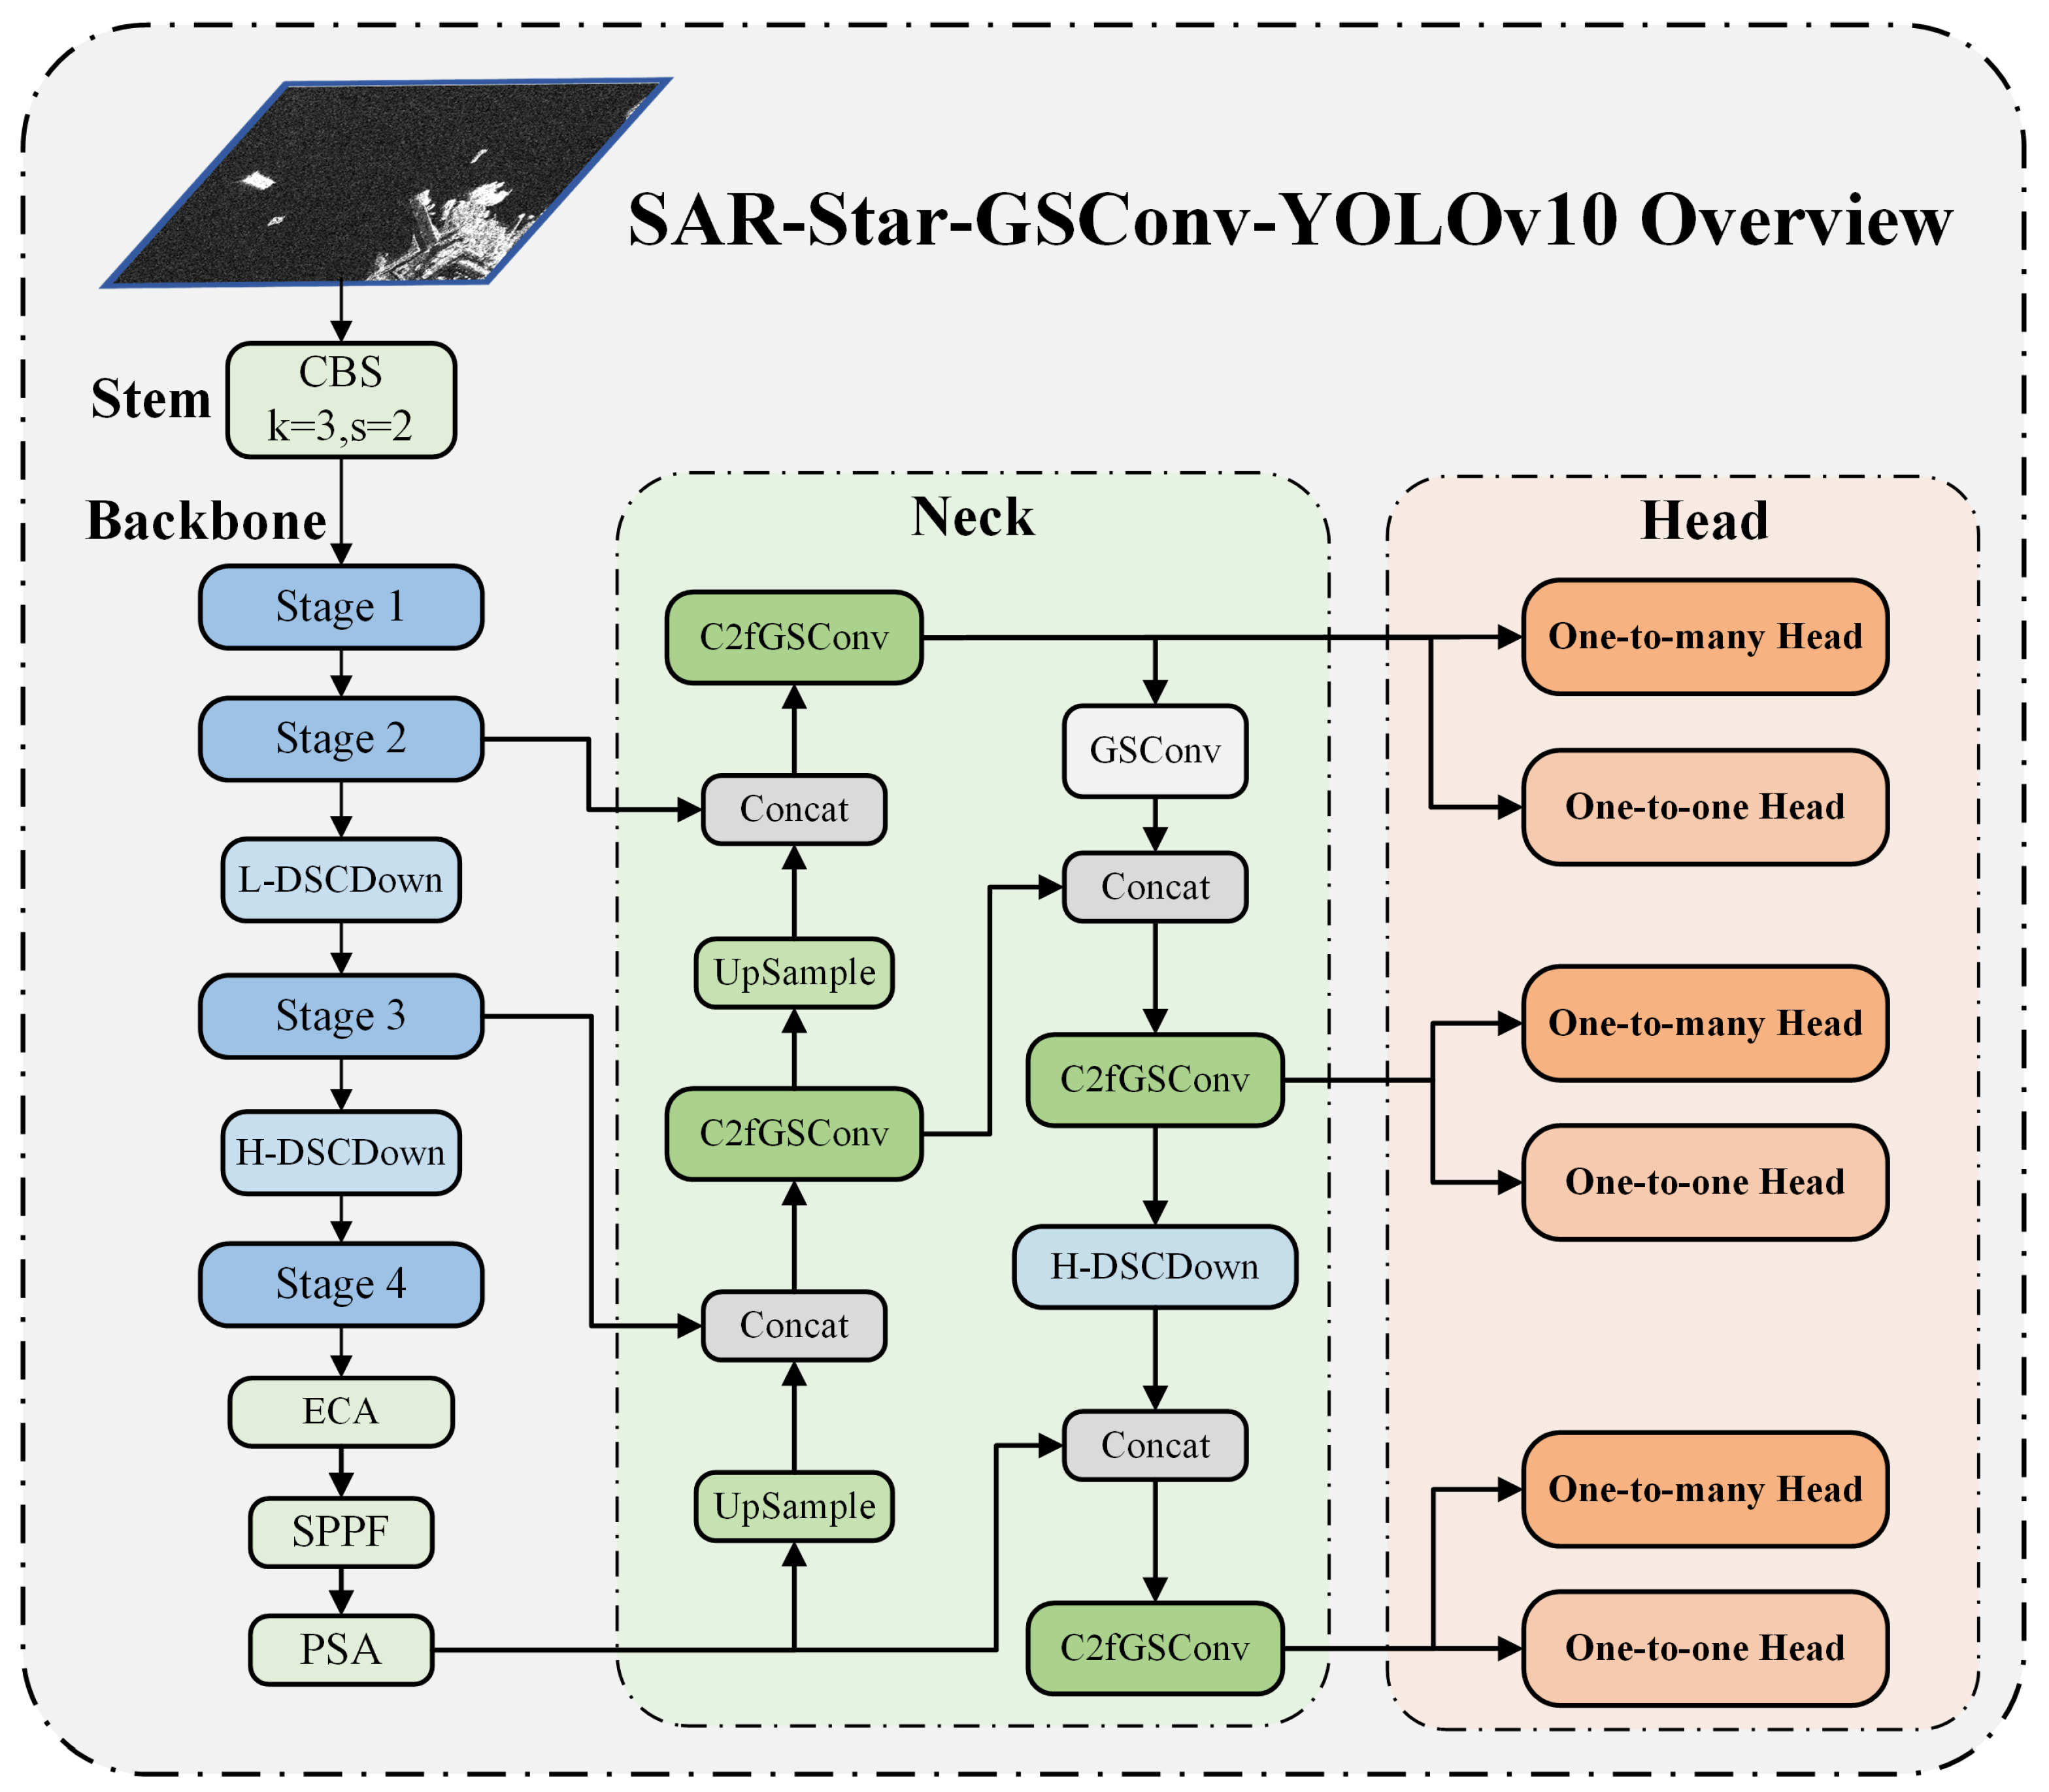
For SAR platforms with limited computational resources, such as those deployed on satellites or aircraft, this paper proposes the SAR-Star-GSConv-YOLOv10 network. The SSGY network is a lightweight neural network model specifically designed for ship target detection in SAR images. Within the YOLOv10 series, YOLOv10n distinguishes itself by having the fewest parameters and the fastest detection speed while maintaining high detection accuracy. Consequently, YOLOv10n is selected as the baseline framework for the network design. The overall architecture of the SAR-Star-GSConv-YOLOv10 network is illustrated in Figure 2.
Here, we briefly describe the SSGY network structure. (1) Input: Receives SAR single-look complex images, resizing them to 640 × 640 × 3 for network input. (2) Stem: Extracts initial features with a 3 × 3 convolution (stride 2, padding 1), followed by batch normalization and SiLU activation. (3) Backbone: Based on an improved StarNet, enhancing feature extraction to capture multi-level semantic information. (4) Neck: A lightweight GSConv-based module for multi-layer feature fusion tailored to SAR images. (5) Head: Uses an NMS head to directly output predictions, bypassing traditional NMS post-processing. (6) Loss Function: A composite loss function combining classification and bounding box regression tasks to guide model learning and improve detection accuracy. Next, we will provide a detailed introduction to the important modules involved in the SSGY network model.

3.2. StarNet Backbone Network Based on Multi-Scale Kernels

The main function of the backbone network in the detection model is to extract the target features of different scales in the input data. For ship detection tasks in SAR images, it is necessary to capture spatial information and object relationships, provide robust feature representation for subsequent modules, and support accurate target positioning.
As shown in Figure 2, the backbone network of YOLOv10 relies on feature extraction modules such as rank-guided block convolution, spatial channel decoupling downsampling, and C2fCIB. Although these modules combine linear and nonlinear operations, in SAR images, ship targets are greatly affected by complex background noise, clutter, and scatterers of different scales. As a result, the multi-layer convolution and feature fusion in the YOLOv10 backbone network cannot effectively capture subtle feature changes, and there is a high computational complexity. Although the spatial channel decoupling downsampling optimizes the downsampling process, the reduction of computational load is limited, and it is difficult to meet the requirements of real-time ship detection.
Therefore, a lightweight network structure based on StarNet is designed to mine multi-scale features from SAR images. The star operation typically refers to element-wise multiplication, which is used to fuse features from different subspaces [51]. A single-layer star operation is generally represented as follows:
W 1 T X + B 1 W 2 T X + B 2 ,
where W 1 and W 2 are weight matrices, X is the input feature, and B 1 and B 2 are bias terms. To simplify the analysis process, the bias terms can be disregarded, resulting in W 1 T X W 2 T X = i = 1 d + 1 j = 1 d + 1 w 1 i w 2 j x i x j . It can be observed that this operation maps the input from a computationally efficient low-dimensional space to an approximately d 2 2 -dimensional implicit feature space. This means that each element interacts with other elements through multiplication, causing the new nonlinear implicit dimensions to grow exponentially without increasing computational overhead. Therefore, this work constructs a backbone network based on star operations, aiming to map the features of ship targets in SAR images to a high-dimensional nonlinear feature space while achieving a lightweight backbone network design.
Based on the receptive field theory, we note that smaller convolution kernels in the lower layers help the network focus on local features, minimizing noise and irrelevant information while reducing computational complexity. The larger kernel in the higher level expands the receptive field, which helps to extract global features and semantic information, thereby improving the detection accuracy.
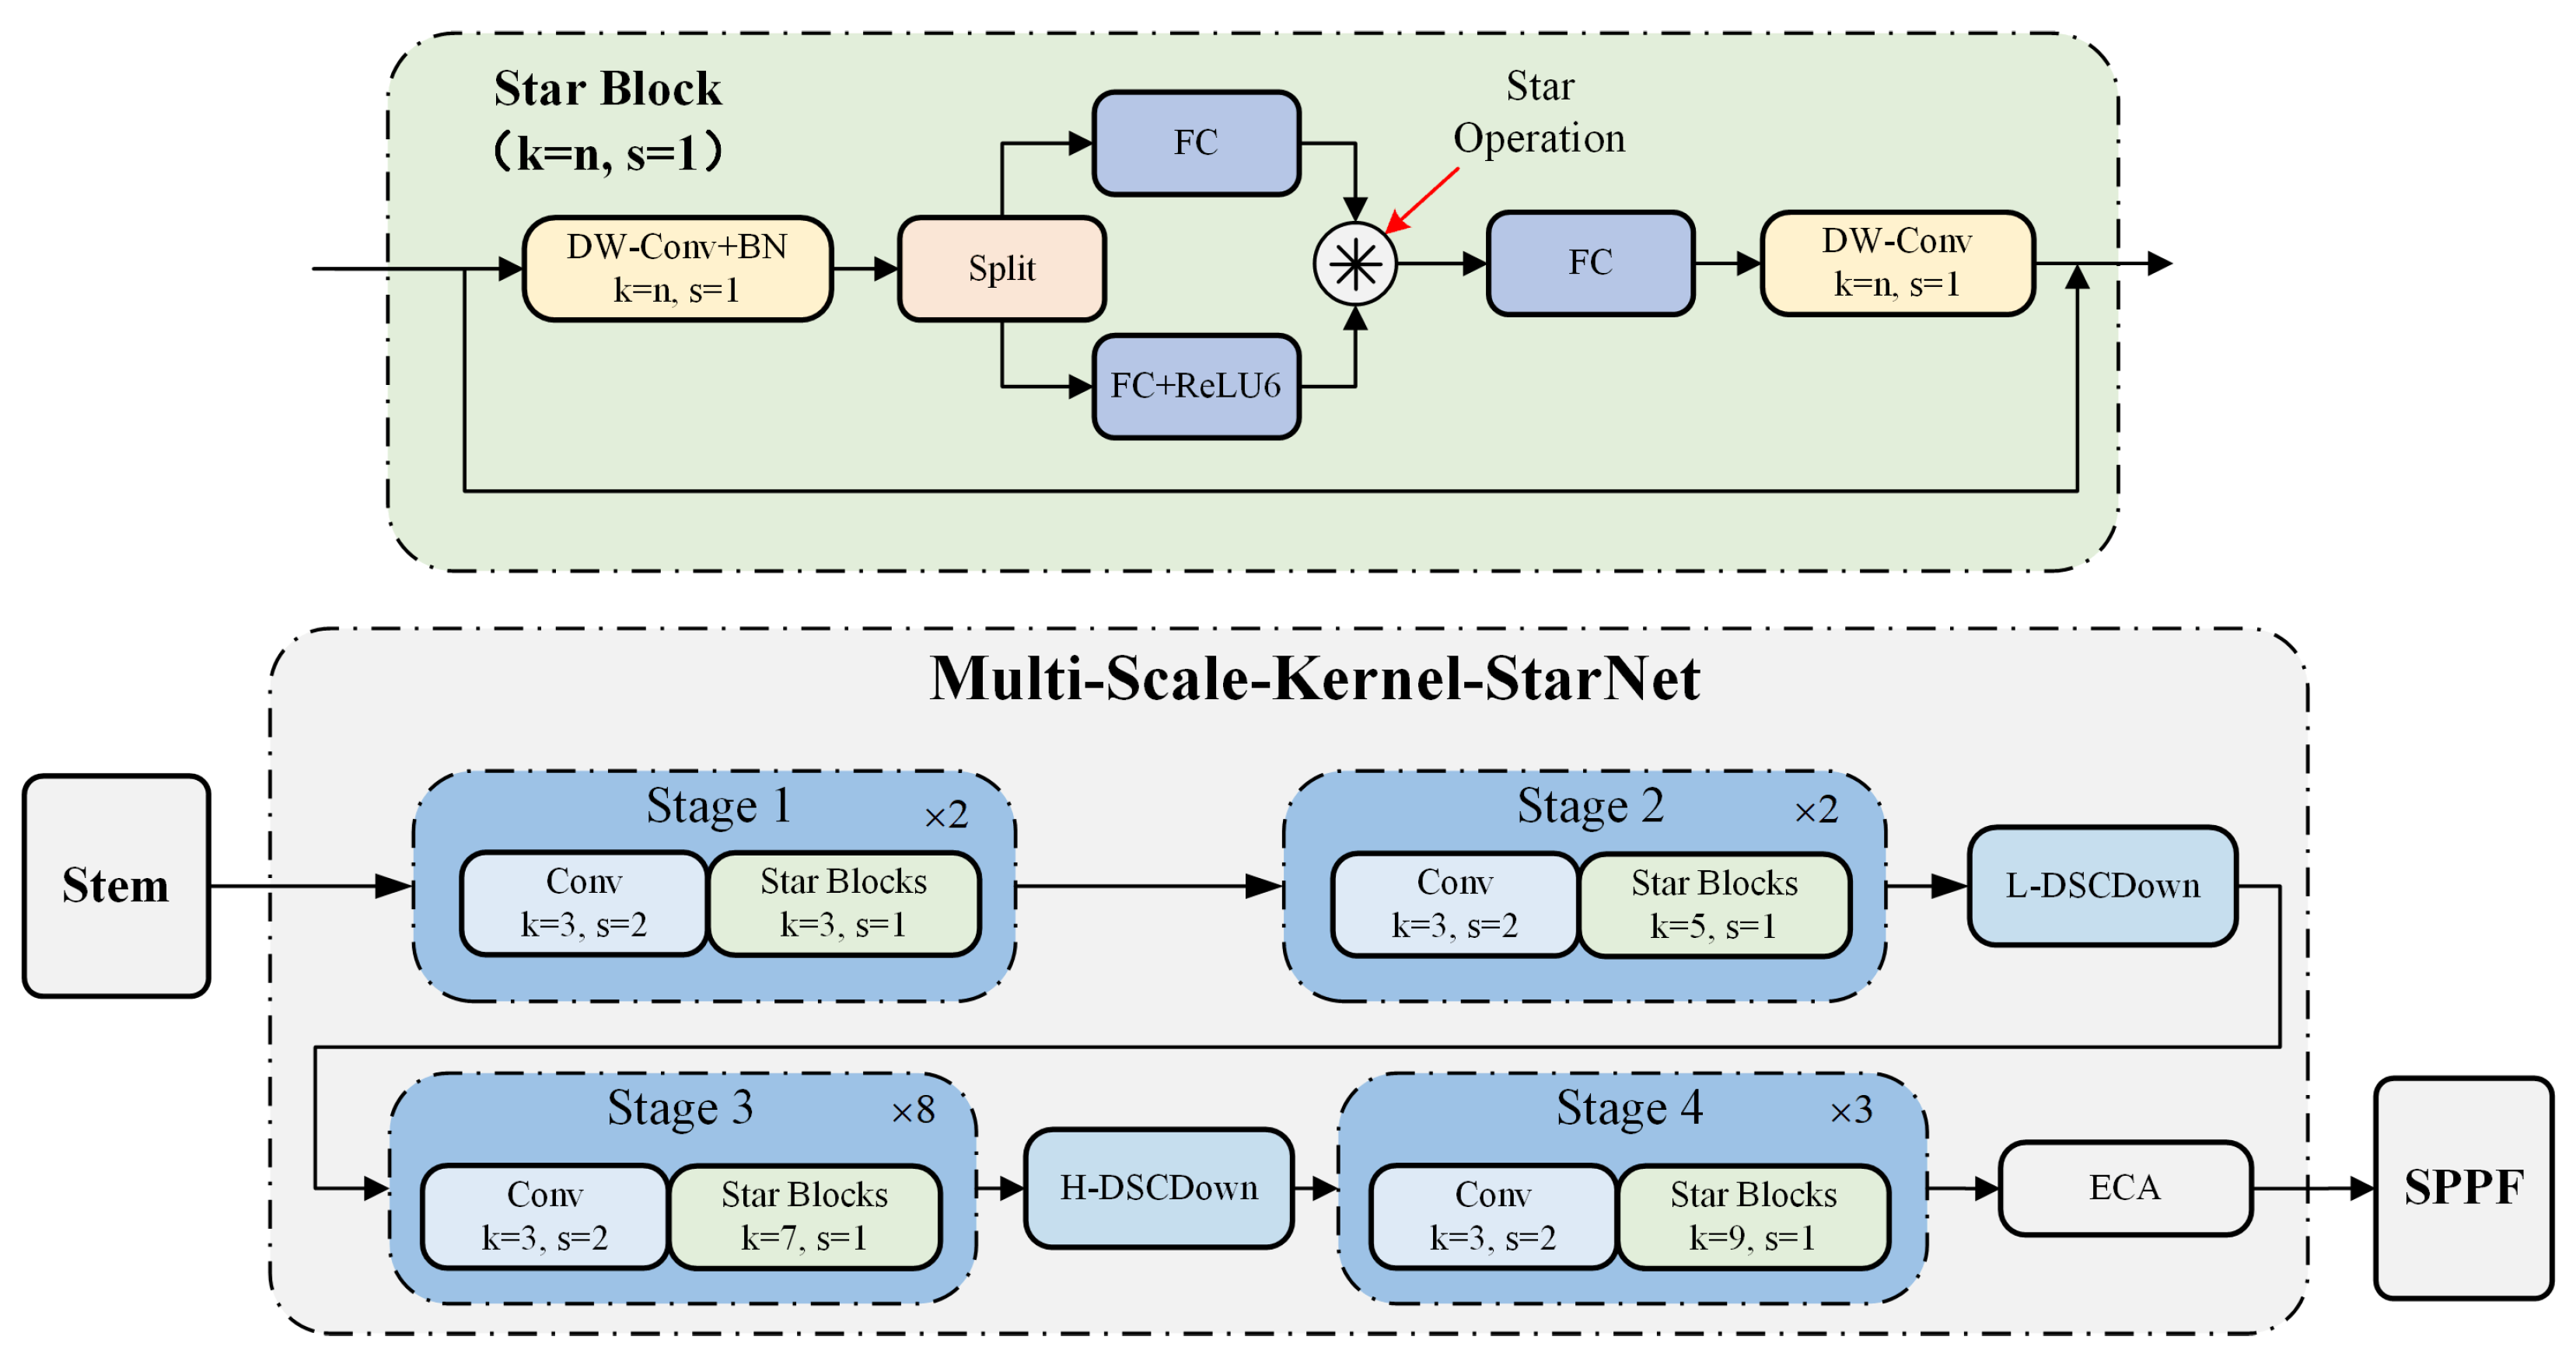
This paper proposes a flexible and lightweight multi-scale kernel StarNet (MSKS) as the backbone of SSGY, with its structure shown in Figure 3. For the lower-stage Star Blocks (Stages 1 and 2), we use smaller convolution kernels of size 3 × 3 and 5 × 5, stacked n times. The 3 × 3 kernel, commonly used in CNNs, excels at local feature extraction while maintaining low computational cost. The 5 × 5 kernel slightly expands the receptive field, capturing richer local feature combinations with minimal added computational load. For higher-level features (Stages 3 and 4), we employ 7 × 7 and 9 × 9 kernels. The 7 × 7 kernel enhances the receptive field, capturing more contextual information for better semantic understanding of the target, while the 9 × 9 kernel further expands the receptive field to capture global ship features. This kernel size configuration was determined through experimental comparison with alternative combinations and found to provide the optimal balance between detection accuracy, receptive field coverage, and computational efficiency for real-time SAR ship detection. Larger kernels improve detection accuracy for large ships, ensuring that the entire shape and contours are captured, thus minimizing misidentification of ship parts as separate targets.
Moreover, this paper introduces dilated convolutions to further expand the receptive field of the backbone network. Unlike traditional deep convolutions, which adjust kernel size and stride to control the receptive field, dilated convolutions introduce gaps between kernel elements, allowing for significant receptive field expansion with the same computational cost. By applying dilated convolutions with varying dilation rates on feature maps of different resolutions, this method effectively extracts multi-scale features from SAR images, improving detection accuracy in scenarios with both small boats and large aircraft carriers.
So, we propose a spatial channel decoupling downsampling module based on dilated convolutions, referred to as the DSCDown module, with its specific structure shown in Figure 4. Since the P3 and P4 levels primarily handle low-level features, which contain more detailed information but less semantic information, dilated convolutions with a dilation rate of 2 (L-DSCDown) are used to moderately expand the receptive field and promote the integration of local features. In contrast, the P4 and P5 levels process mid-level features that contain more semantic information and have a lower resolution. A larger dilation rate (set to 3) is used at these levels to better integrate semantic information while avoiding the introduction of excessive noise, leading to the use of H-DSCDown.
In the feature extraction process of the backbone network, different channels contain different information relevant to the target. For example, some channels represent the contours and edges of the ship, while others contain sea clutter or shoreline target information. Through the channel attention mechanism, the network can focus on and enhance the channels related to the target features, while reducing the interference from irrelevant channels. This is especially beneficial for the detection of small ships, as the channel attention mechanism helps to focus on high-resolution features. Based on this, the efficient channel attention (ECA) module is introduced after multi-level feature extraction in the MSKS network for the following reasons:
  • High computational efficiency: The ECA module is a lightweight channel attention mechanism using 1D convolutions, achieving low computational cost, making it ideal for real-time detection frameworks like YOLOv10.
  • Adaptive channel attention: The ECA module adjusts the size of the 1D convolution kernel based on the number of input channels, allowing flexibility across varying channel counts at different feature levels in YOLOv10, without extensive manual tuning.
  • Enhanced feature representation capability: The ECA module highlights relevant ship target features in SAR images while suppressing background clutter, improving the network’s ability to focus on target-related information.
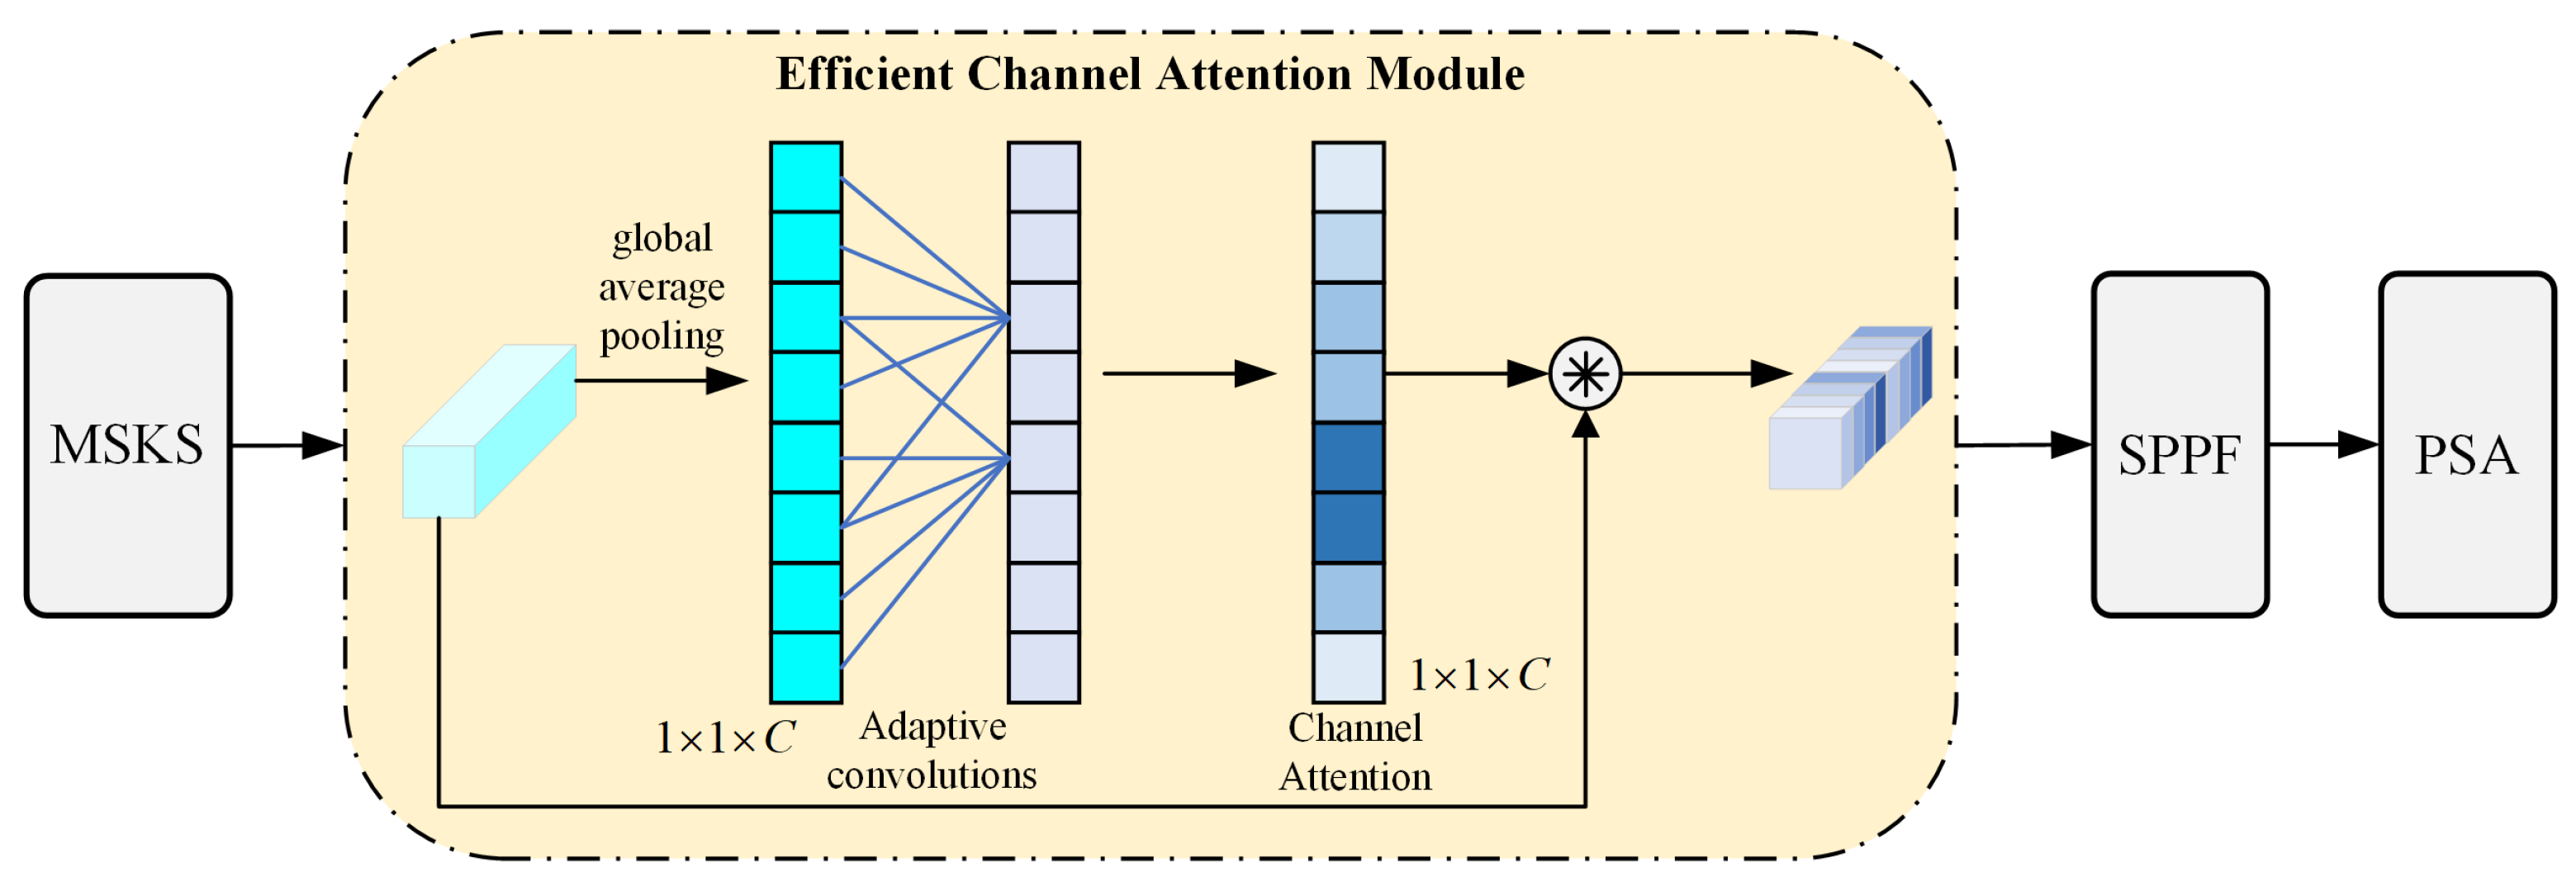
The ECA module is implemented by first aggregating the features output by MSKS. Specifically, as shown in Figure 5, for an input feature map X R C × H × W , global average pooling is applied to compress the spatial information into a channel-level statistical metric,
y = 1 H × W i = 1 H j = 1 W X c , i , j ,
where y R C represents the input feature map; this operation extracts the overall characteristics of the channels by compressing the spatial dimensions. Based on the global descriptor vector y, a one-dimensional convolution with kernel size 1 × k is utilized to capture the inter-channel relationships. The convolution kernel size k is dynamically determined based on the number of channels C, as per the following formula:
k = log 2 ( C ) γ + b γ ,
where γ and b are predefined hyperparameters. In this study, optimal values are determined through experiments to maximize the ECA performance. Subsequently, a one-dimensional convolution operation is applied to y to obtain the channel attention weights α :
α = F c o n v 1 d y .
Finally, the attention weights α are multiplied with the original feature map X channel-wise to obtain the enhanced feature map X :
X = X α
Then, the input feature is multiplied by the channel of the original feature, which strengthens the model’s attention to important channels and avoids the computational complexity of the full connection operation.
Although we select the ECA module [52], we also consider other attention mechanisms, such as the SE and CBAM modules. The SE module uses fully connected layers for channel attention, which can introduce computational overhead in resource-limited settings. The CBAM module combines channel and spatial attention, but excessive focus on spatial details may neglect important inter-channel information, especially for SAR images with complex backgrounds. Experimental comparisons (detailed in the Section 4.3) show that the ECA module provides a better balance between performance and computational efficiency for our network structure and task. It is worth noting that the ECA module outputs the attention features to the SPPF so that it can be fused based on more important channel information when fusing features of different scales, thereby improving the fusion quality.
In summary, adding the ECA module to the backbone network can optimize the channel attention. This provides a more discriminative representation for the input features of the subsequent neck structure.

3.3. Lightweight Neck Network Based on C2fGSConv

In SAR images, ship targets vary greatly in scale, from small patrol boats to large aircraft carriers, with distinct feature representations at different scales. The Neck modules in the YOLO series fuse multi-level features extracted by the backbone network, providing discriminative feature information for subsequent detection heads. However, existing fusion mechanisms may not fully meet the needs of multi-scale ship detection in SAR images. During our research, we identified the following issues with current neck architectures:
  • Computational Resource Consumption: Modules such as C2f or C2fCIB use conventional convolutions such as CBS, which have high computational complexity. The calculation load is related to the kernel size, input/output channels, and feature mapping dimensions. These convolutions consume significant resources and time. In airborne or spaceborne SAR image processing, this high complexity hinders rapid deployment and efficient operation, limiting the model’s scalability and adaptability in practical applications.
  • Feature Fusion Effectiveness: Although feature fusion through upsampling (feature pyramid networks) and downsampling (path aggregation networks) is effective, small-scale ship features often weaken after fusion due to information loss during upsampling or insufficient fusion with other scales. This affects the model’s ability to detect small ships. In low-resolution SAR images, focusing on global feature fusion is crucial for small target detection. However, the existing structure can not automatically adapt to this requirement, thus reducing the detection accuracy in complex scenes.
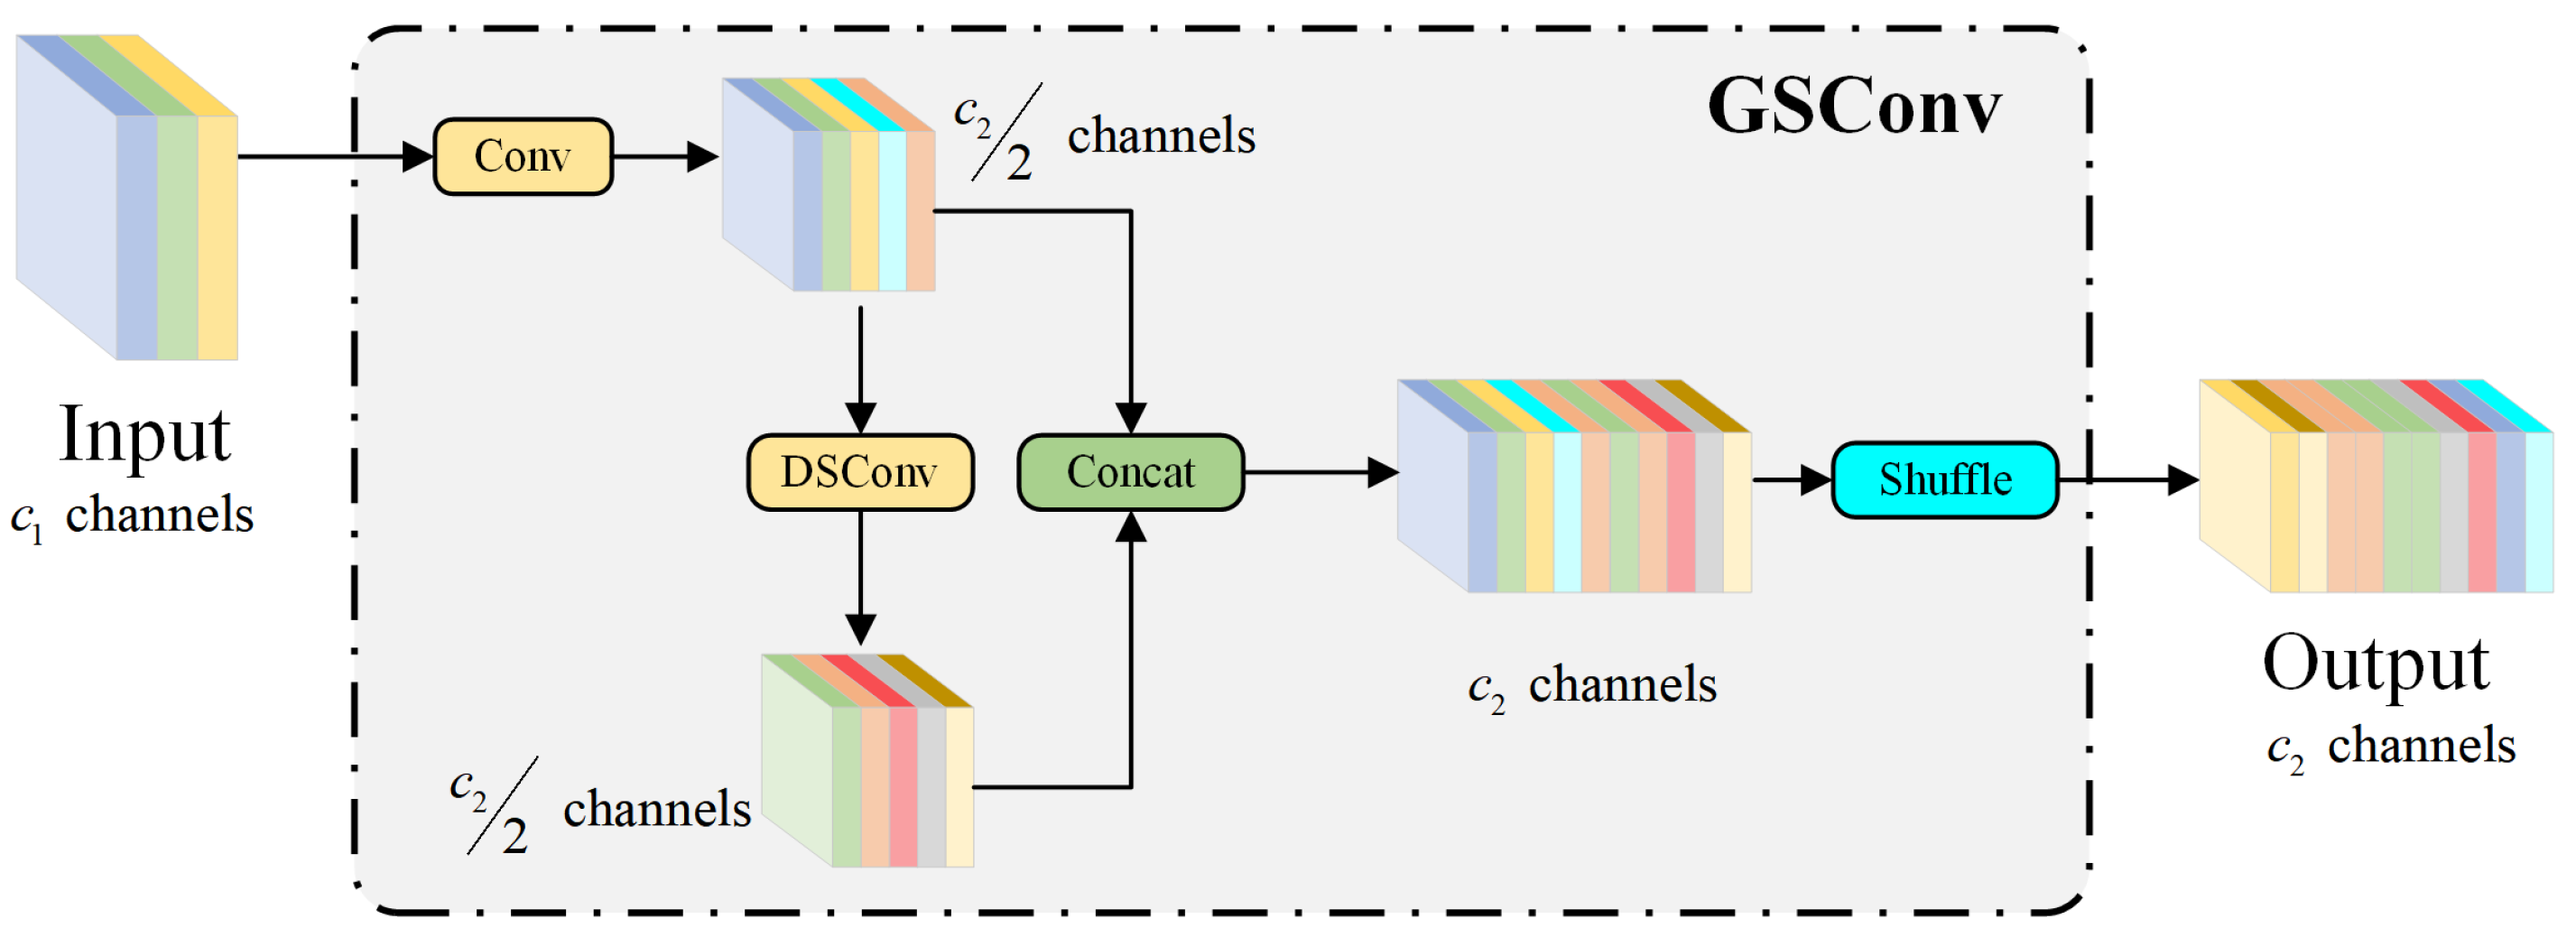
Although YOLOv10 adopts a lightweight design, such as using depthwise separable convolution (DSC) to reduce the number of parameters and computation, there are still notable limitations. Specifically, DSC reduces feature representation ability by separating the channel information of the input image, which leads to lower detection accuracy compared to standard convolution (SC). This limitation is especially prominent in the SAR image ship detection task of this study. GSConv, as a novel lightweight convolution method, cleverly combines the advantages of SC and DSC [53]. It retains a feature representation ability close to that of SC while significantly reducing computational overhead. Figure 6 illustrates the structure of GSConv, where the main branch uses SC to focus on channel information, and the auxiliary branch uses DSC to focus on spatial information. These two branches are then merged via a shuffling operation, fully exploiting both spatial and channel features of ship targets. The computational overhead of GSConv is approximately 50% that of SC, and it retains hidden connections between channels while reducing the computational burden. This demonstrates that GSConv can achieve more efficient feature representation with fewer parameters in the Neck architecture.
To achieve an optimal balance between accuracy and speed and to efficiently fuse features, this paper proposes a lightweight Neck network structure based on GSConv, enhancing the suitability of SSGY for SAR image ship detection tasks on spaceborne or airborne platforms. The decision to exclude GSConv from the backbone network is due to the increasing depth of the backbone layers, which exacerbates data flow resistance and significantly increases inference time. By the time features reach the Neck, they have been sufficiently compressed (with channel dimensions at their maximum and spatial dimensions at their minimum), and the required transformations are relatively moderate. Consequently, GSConv is more effective in the Neck, where it processes the connected feature maps with minimal redundancy, eliminating the need for further compression and enabling more efficient attention mechanisms.
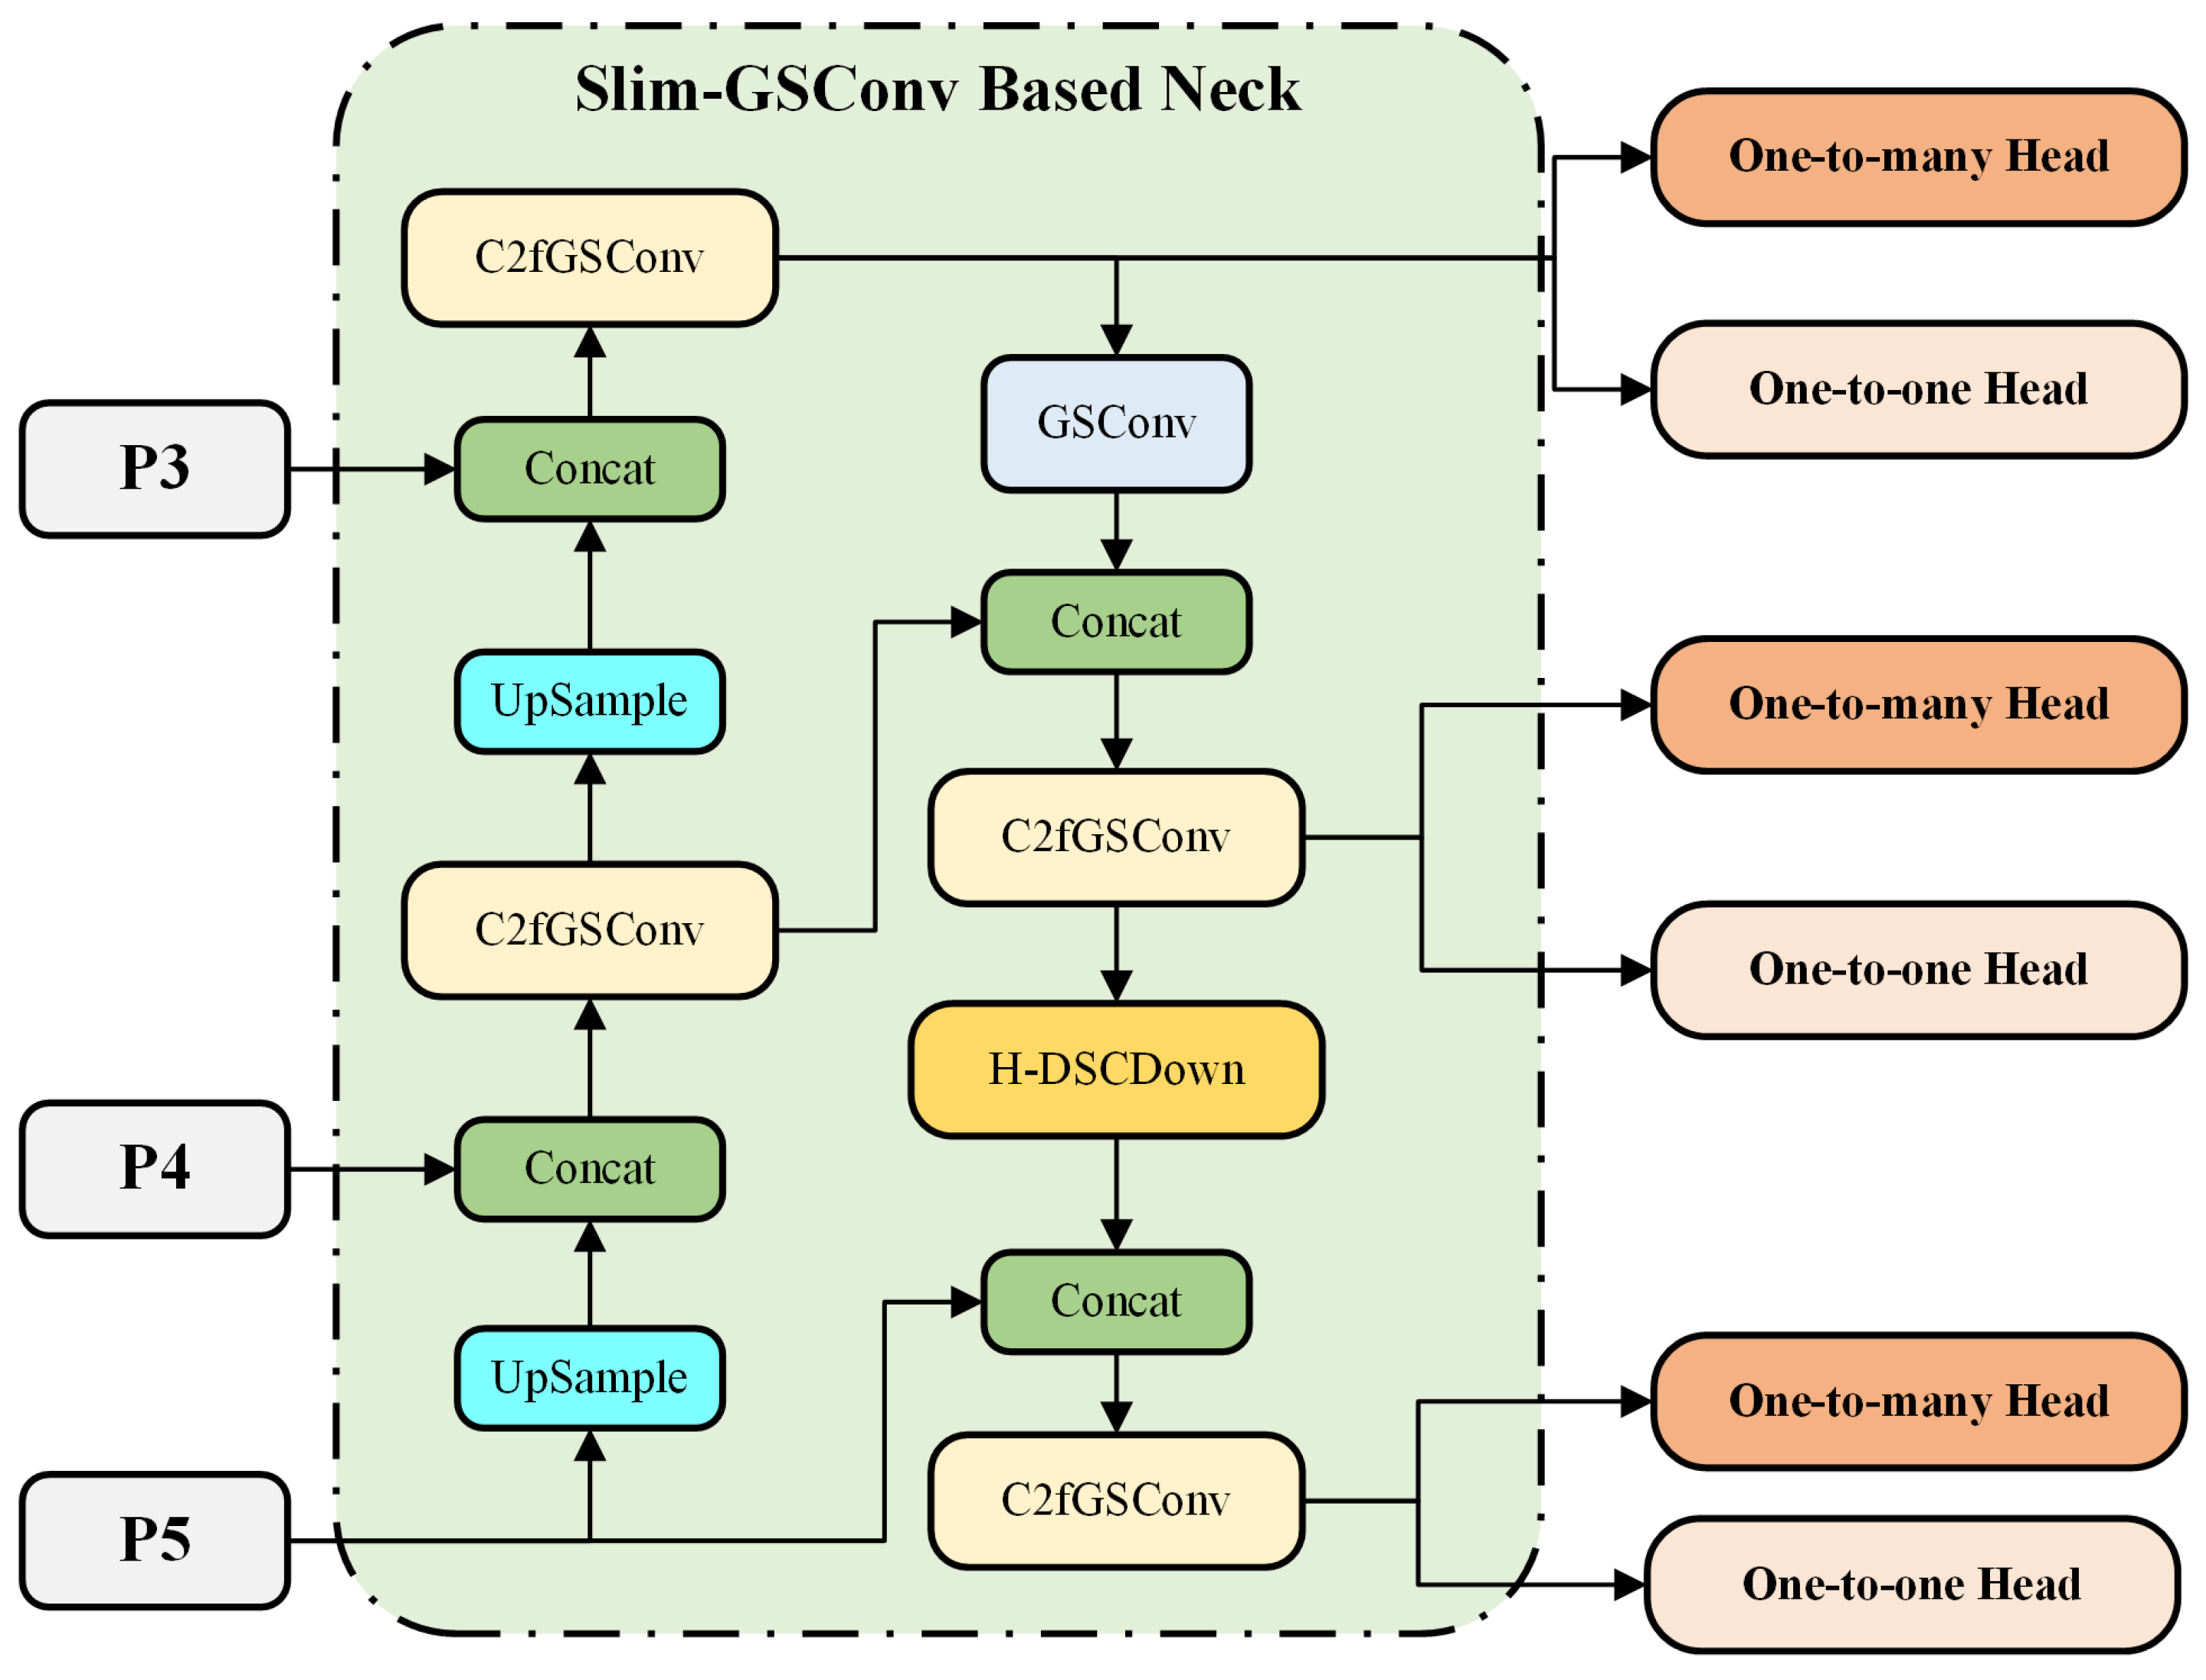
Figure 7 shows the lightweight neck network structure based on GSConv designed in this study. The C2fGSConv module in the figure is a feature fusion processing module based on GSConv. For its specific structure, refer to Figure 8. It is important to note that the activation function for the CBS module in YOLOv10 is SiLU. However, during the experiments, we found that changing the activation function in GSConv to Mish can significantly enhance the detection performance of ships in SAR images. The C2fGSConv module follows the design philosophy of C2f, and the GBM module serves as the basic lightweight convolution module, where the parameters kk and ss represent the parameters of the first standard convolution block in GSConv, respectively. Here, the default size of the depthwise separable convolution kernel is set to 5, and the stride is set to 1.
The introduction of the C2fGSConv module between P4 and P3 enhances the model’s multi-scale feature processing capability. Features at the P4 layer, characterized by higher semantic information but lower resolution, are fused with features from the P3 layer, which provide higher resolution but relatively less semantic information. The C2fGSConv module effectively combines these features, enabling the model to leverage the semantic richness from P4 for accurate classification and the high-resolution details from P3 for precise localization in ship detection tasks. This improved multi-scale feature fusion enhances detection accuracy, particularly for ships of varying sizes and resolutions in SAR images.
Thus, the neck structure of SSGY has successfully reduced computational load and parameter count through the incorporation of the GSConv module. Specific parameter quantification results can be found in Table 1, where comparisons with the original neck structure are provided. This optimization facilitates faster feature fusion and transmission during SAR image processing, thereby improving the overall operational efficiency of the model.

3.4. Detection Head

The YOLOv10 head structure processes multi-scale feature maps from the Neck, facilitating the detection of objects across a wide range of sizes. This is particularly crucial for SAR ship detection, as it enables accurate identification of both small, distant fishing vessels and large, nearby cargo ships. The head network consists of convolutional layers that extract and fuse features from the input maps, along with prediction layers responsible for object localization (bounding box regression) and classification. Together, these components enable comprehensive object detection.
In the YOLO series, the head structure typically includes a classification head and a regression head, which are responsible for object classification and position regression, respectively. Analysis of the detection head indicates that the classification head generally requires more parameters and computational complexity than the regression head. This is due to the greater complexity of the classification head, which must distinguish between multiple object categories. However, experiments replacing the output with true regression and classification values while setting the corresponding loss to zero show that removing the regression module results in a significant drop in validation accuracy compared to removing the classification module. This suggests that accurately predicting the object’s location is more complex than distinguishing its category, especially in complex scenarios with targets of varying sizes and shapes, as precise localization requires the model to learn more intricate spatial information.
The SSGY method adopts the consistent dual assignment strategy from YOLOv10 to facilitate NMS-free training. Specifically, both the one-to-many and one-to-one heads are incorporated during training. The one-to-many branch offers extensive supervision signals, improving the model’s ability to learn diverse object features, while the one-to-one branch primarily operates during inference. This design significantly reduces the computational complexity of the deployed model. Furthermore, to decrease the parameter count and computational load of the classification head, two 3 × 3 convolutional layers are replaced with depthwise separable convolutions, as illustrated in Figure 9.

3.5. Joint Loss Function

The loss function typically consists of two main components: classification loss and bounding box (Bbox) loss. In the classification loss part, we use binary cross-entropy (BCE) loss to predict the presence or absence of ships in SAR images, framing the problem as a binary classification task with the goal of determining the presence of a ship. The BCE loss function is as follows:
L B C E = i = 0 N y i log y ^ i + 1 y i log 1 y ^ i ,
where N represents the number of samples, y i denotes the ground-truth label for the i-th sample (with 0 indicating the absence of a ship and 1 indicating the presence of a ship), and y ^ i is the model-predicted probability of a ship being present in the image.
The other component of the loss function is the bounding box loss. The Intersection over Union (IoU) is defined as the ratio of the overlapping area between the predicted and ground-truth boxes to their combined area, formally expressed by IoU = b p b g t b p b g t b p b g t b p b g t . Given the diverse shapes and positions of ships in SAR imagery, we introduce the complete intersection-over-union (CIoU) loss, which incorporates the IoU, the distance between bounding box centers, and the aspect ratio:
L CIoU = L IoU ρ 2 b p , b g t c 2 α · υ ,
where c denotes the diagonal length of the smallest enclosing rectangle that bounds both the predicted and ground-truth boxes, υ measures the aspect ratio difference between them, and α is a weighting factor that balances this discrepancy.
However, the distribution of ships in SAR scenarios is uneven, with some areas being densely populated and others being sparse. Traditional loss functions fail to effectively address the cross-region variation detection requirements. Moreover, this imbalance may result in imprecise annotations, negatively affecting models trained with loss functions based on CIoU. The Weighted IoU (WIoU) introduces a weighting mechanism that can mitigate the negative impact of inaccurate annotations on model training to some extent. By assigning higher weights to specific regions or categories, this loss function improves detection performance in scenarios with class imbalance or highly complex target distributions [54]. Therefore, this paper adopts WIoU v 3 in the bounding box loss function, with its calculation formula as follows:
L WIo U v 3 = L IoU δ α β δ · L IoU · exp x p x g t 2 + y p y g t 2 W g 2 + H g 2 ,
where x p and y p denote the coordinates of the predicted bounding box, while x g and y g represent the coordinates of the ground-truth bounding box. Meanwhile, W g and H g indicate the width and height, respectively, of the minimum enclosing rectangle. The * signifies that the operations within the parentheses are decoupled to prevent gradients that could hinder the convergence process.
In an SAR ocean scene, the target is usually in a complex noise background and presents a variety of shapes and scales. In response to these challenges, this study combines the CIoU with the WIoU to optimize the geometric features and regional importance of bounding boxes. The proposed combined loss function treats both L CIoU and L WIo U v 3 as independent loss terms, which are then weighted and summed. The formulation is given as follows:
L B b o x _ IoU = λ L CIoU + 1 λ L WIo U v 3 ,
where λ is a coefficient that controls the weighting of CIoU and WIoU, balancing their contributions in the overall loss. This value is typically determined through cross-validation or adjusted empirically based on domain expertise.
Distribution Focal Loss (DFL) addresses uncertainty in bounding box predictions by modeling multiple potential positions for bounding box coordinates. In SAR imagery, ship boundaries can become indistinct or partially occluded due to imaging principles and environmental factors. By enabling finer optimization of predicted boxes, DFL improves the accuracy of bounding box regression.
L o s s D F L = i p i log p ^ i ,
where p i represents the ground-truth probability distribution for each box. Consequently, the total loss function designed in this study can be expressed as follows:
L o s s t o t a l = ω 1 L o s s B C E + ω 2 L o s s B b o x _ IoU + L o s s D F L .
The values of λ , ω 1 , and ω 2 were set based on prior research and refined empirically to balance accuracy and efficiency, and the chosen loss components were selected after considering commonly used alternatives.
So far, we have designed a multi-task loss function that simultaneously optimizes position, category, and confidence, which can further improve the accuracy of ship detection in SAR images.

4. Experiment

4.1. Experimental Datasets

The first dataset selected for training and validation of the SSGY model is the SAR Ship Detection Dataset (SSDD), published by Li et al. in [55]. SSDD is primarily composed of high-resolution SAR satellite images from GF-3, Sentinel-1, and other sources, covering various maritime regions. The dataset features SAR images of different resolutions and sizes, encompassing ships in both open sea and coastal environments. Overall, it contains 1160 images and 2456 ships, with the smallest ship size measuring 7 × 7 pixels and the largest measuring 211 × 298 pixels. In this experiment, a random 2:8 split of the dataset yields 928 images for the training set and 232 images for the test set. During preprocessing, each image is resized to 1000 × 600 pixels and then randomly flipped with a 50% probability.
The second dataset employed in this study is the High-Resolution SAR Images Dataset (HRSID) [56], released in 2020 by the University of Electronic Science and Technology of China for ship detection, semantic segmentation, and instance segmentation in high-resolution SAR images. HRSID comprises 5604 high-resolution SAR images and 16,951 ship instances, collected from remote sensing satellites such as Sentinel-1, TerraSAR-X, and TanDEM-X. The image resolutions include 0.5 m, 1 m, and 3 m, covering various polarizations, sea conditions, maritime areas, and coastal ports. To minimize mislabeling and missed annotations, the labeling process is supported by optical remote sensing imagery.
With respect to ship detection tasks in SAR imagery, the following metrics are used to evaluate model performance: Precision (P), Recall (R), False Alarm (FA), F1 Score (F1), and Average Precision (AP).

4.2. Experimental Environment

The experimental software platform utilizes Ultralytics YOLO, an open-source object detection toolbox developed on PyTorch 2.4, known for its ease of use, powerful functionality, and extensibility. The proposed SSGY model was trained and validated on a system with CUDA 12.4, cuDNN 8.9, and Python 3.8.
The computational framework ran on Ubuntu 22.04, featuring an NVIDIA RTX 3090 GPU, Intel i9-12900K CPU, and a 2TB Kingston SSD. Training was completed in 300 epochs using the Adam optimizer with an initial learning rate of 0.0005, momentum of 0.95, and weight decay of 0.0002 to mitigate overfitting. A learning rate warm-up strategy was applied for the first 10 epochs to enhance stability and convergence. The batch size was set to 32, and early stopping was implemented, halting training if validation loss did not improve over five consecutive epochs. This configuration optimized the performance of the trained SSGY model.

4.3. Ablation Experiments

To assess the impact of various improvement modules on model performance, a series of ablation experiments are conducted on the HRSID dataset. These experiments progressively incorporate different modules, including an MSKS-based backbone network, a C2fGSConv-based lightweight neck network, a lightweight detection head, and a combined loss function. Each module is introduced sequentially to observe its effect on performance, allowing for an analysis of each module’s contribution and providing valuable insights for model optimization.

4.3.1. Ablation Experiment on the MSKS-Based Backbone Network

The experimental results are shown in Table 2. Experiment 1 (baseline model) represents the native YOLOv10n network, achieving 83.25% precision, 86.33% recall, with 2.3 M parameters and 6.7 G FLOPs. Experiment 2, with the MSKS module, increases precision to 85.32%, reduces parameters to 1.7 M and FLOPs to 4.3 G, improving feature extraction but slightly lowering recall to 84.63%. Experiment 3, with the DSCDown module, boosts precision to 84.81% while maintaining the same model complexity as the baseline, highlighting its effectiveness in feature scale optimization. Experiment 4, using the ECA module, increases precision to 85.12%, though recall drops to 84.32%. Despite the recall decrease, ECA significantly enhances detection accuracy through its channel attention mechanism. In contrast, Experiments 5 and 6 with the CBAM and SE modules show no significant performance improvement, with some cases showing a slight decline, possibly due to incompatibility with the network architecture or the unique characteristics of SAR images. Experiment 7, combining MSKS and DSCDown, increases precision to 85.37% and recall to 85.72%, while further reducing model complexity to 1.7 M parameters and 4.3 G FLOPs, demonstrating the synergistic optimization of both modules. Experiment 8, adding the ECA module, raises precision to 85.93% and recall to 86.11%. Although the number of parameters and FLOPs slightly increases, the performance improvement confirms the effectiveness of this combination in SAR ship detection.
In summary, the MSKS and DSCDown modules are key to improving detection performance and optimizing model complexity, while the ECA module further enhances detection when combined with others. In contrast, the CBAM and SE modules underperform in this configuration. Therefore, for SAR ship detection, the combination of MSKS, DSCDown, and ECA modules is recommended to achieve both efficiency and accuracy.

4.3.2. Ablation Experiment on the C2fGSConv-Based Lightweight Neck Network

This study conducts ablation experiments on the neck network to optimize its structure. The experiments compare a CBS-based YOLOv10 neck structure with a lightweight C2fGSConv-based design, alongside a comparative analysis of the SiLU and Mish activation functions used with GSConv. The SSGY network is selected as the feature extraction backbone.
The experimental results are shown in Table 3. Experiment 1 serves as the baseline, using the CBS-based YOLOv10 neck structure, achieving 85.93% precision and 86.11% recall, with 1.8 M parameters and 4.4 G FLOPs. In Experiment 2, the GBSiLu structure reduces the parameters to 1.5 M (a 16.7% decrease) but increases FLOPs to 5.4 G (a 22.7% increase). Precision improves to 86.2%, while recall drops to 85.4%, indicating that GBSiLu enhances precision at the cost of recall. Experiment 3, using the GBMish activation with 1.5 M parameters, results in a slight FLOP increase to 5.5 G, with precision rising to 86.3% and recall reaching 85.9%. Compared to Experiment 2, GBMish improves precision with minimal FLOP increase, demonstrating its effectiveness in feature learning.
Therefore, the neck network has been proven to be lightweight. The new structures in Experiments 2 and 3 improve detection accuracy while reducing parameters, with the GBM module performing the best. As a result, the Mish activation function was chosen for the Bottleneck structure based on GSConv in the neck network. The selection of different structures and activation functions has a significant impact on model performance, requiring a balance of precision, recall, and computational efficiency to optimize SAR ship detection.

4.3.3. Ablation Experiment on the Head and Loss Functions

This study first investigates the impact of a lightweight neck network on model performance. In Experiments 1 and 2, enabling the lightweight head reduces the number of parameters from 1.7 M to 1.5 M and FLOPs from 6.3 G to 5.4 G, effectively lowering model complexity. However, recall decreases from 86.11% to 85.4%, while precision increases from 85.93% to 86.2%. These results suggest that while head lightweighting reduces computational demands, it slightly decreases the model’s target coverage but improves detection accuracy for the targets detected.
Next, the effect of the combined loss function is analyzed. The experimental results are shown in Table 4. Comparing Experiment 1 and Experiment 3, enabling UnionLoss increases FLOPs to 5.7 G while maintaining the same number of parameters. Precision improves to 86.3%, and recall increases to 85.9%. These results indicate that the use of a combined loss function can enhance object localization and classification capabilities without increasing the number of parameters.
In a comprehensive analysis, applying both head lightweighting and the combined loss function in Experiment 4 yields the best performance. The results show that parameters decrease to 1.4 M, FLOPs remain at 5.4 G, precision increases to 86.6%, and recall rises to 86.9%. These findings demonstrate the synergistic effect of head lightweighting and the combined loss function, which enhances model efficiency and significantly improves performance in SAR ship detection.

4.4. Comparative Experiments

4.4.1. Quantization Results

To evaluate the overall performance of the proposed SSGY network, several mainstream object detection algorithms are selected for comparative testing. These include YOLOv8s [41], YOLOv10n [49], and deep learning methods specifically designed for SAR image ship detection, such as LMSD-YOLO [44], YOLOv7oSAR [48], and CViTF-Net [50]. Experiments are conducted on the SSDD and HRSID datasets to comprehensively assess the detection performance of SSGY across different datasets. The comparison results, presented in Table 5, further demonstrate the superiority of SSGY in SAR image ship detection tasks.
From the perspective of the number of parameters in Table 5, SSGY requires only 1.4 M parameters, meeting the design requirements, while YOLOv8s requires 9.14 M. Additionally, SSGY demonstrates outstanding performance in detection precision. In deep learning model deployment, the lower parameter count significantly reduces hardware storage requirements, making SSGY more suitable for edge computing devices or resource-constrained spaceborne and airborne SAR platforms. This reduces the risk of storage overflow and computation delays caused by parameter redundancy, providing a solid foundation for ship detection tasks that require real-time performance.
In terms of the FLOP metric, the computational load of SSGY is 5.4 G, which is relatively low. In contrast, the FLOPs of CViTF-Net reach 205.74 G, significantly lightening the burden on computational units. This not only accelerates the model’s forward inference process and reduces the time required to process massive SAR image data but also ensures high detection capability even on energy-limited computational platforms.
On the SSDD dataset, SSGY achieves an AP value of 93.68%, surpassing the second-best CViTF-Net by 0.53%. This metric reflects SSGY’s superior overall accuracy and reliability in multi-threshold ship detection. With a precision of 91.05%, SSGY outperforms other SAR ship detection methods, demonstrating high confidence in identifying ship targets and minimizing false positives. Although the recall rate of 88.92% is not the highest, it remains competitive, showing that SSGY effectively identifies most ship targets in complex ocean backgrounds and noisy conditions, balancing missed detections and false positives.
On the HRSID dataset, SSGY achieves an AP value of 89.64%, slightly below CViTF-Net by 0.57%. In tests across multiple polarization modes, sea conditions, and port scenarios, SSGY demonstrates strong generalization, accurately identifying ship targets in diverse environments. With a precision of 91.52%, the model shows its accuracy advantage, while the recall rate of 85.58% indicates room for improvement. Despite this, the overall precision underscores its effectiveness in complex scene analysis and target extraction, ensuring stable detection accuracy for practical applications.
In conclusion, the SSGY network achieves high metrics in both model complexity and detection accuracy, fully aligning with the design objectives of this network architecture.
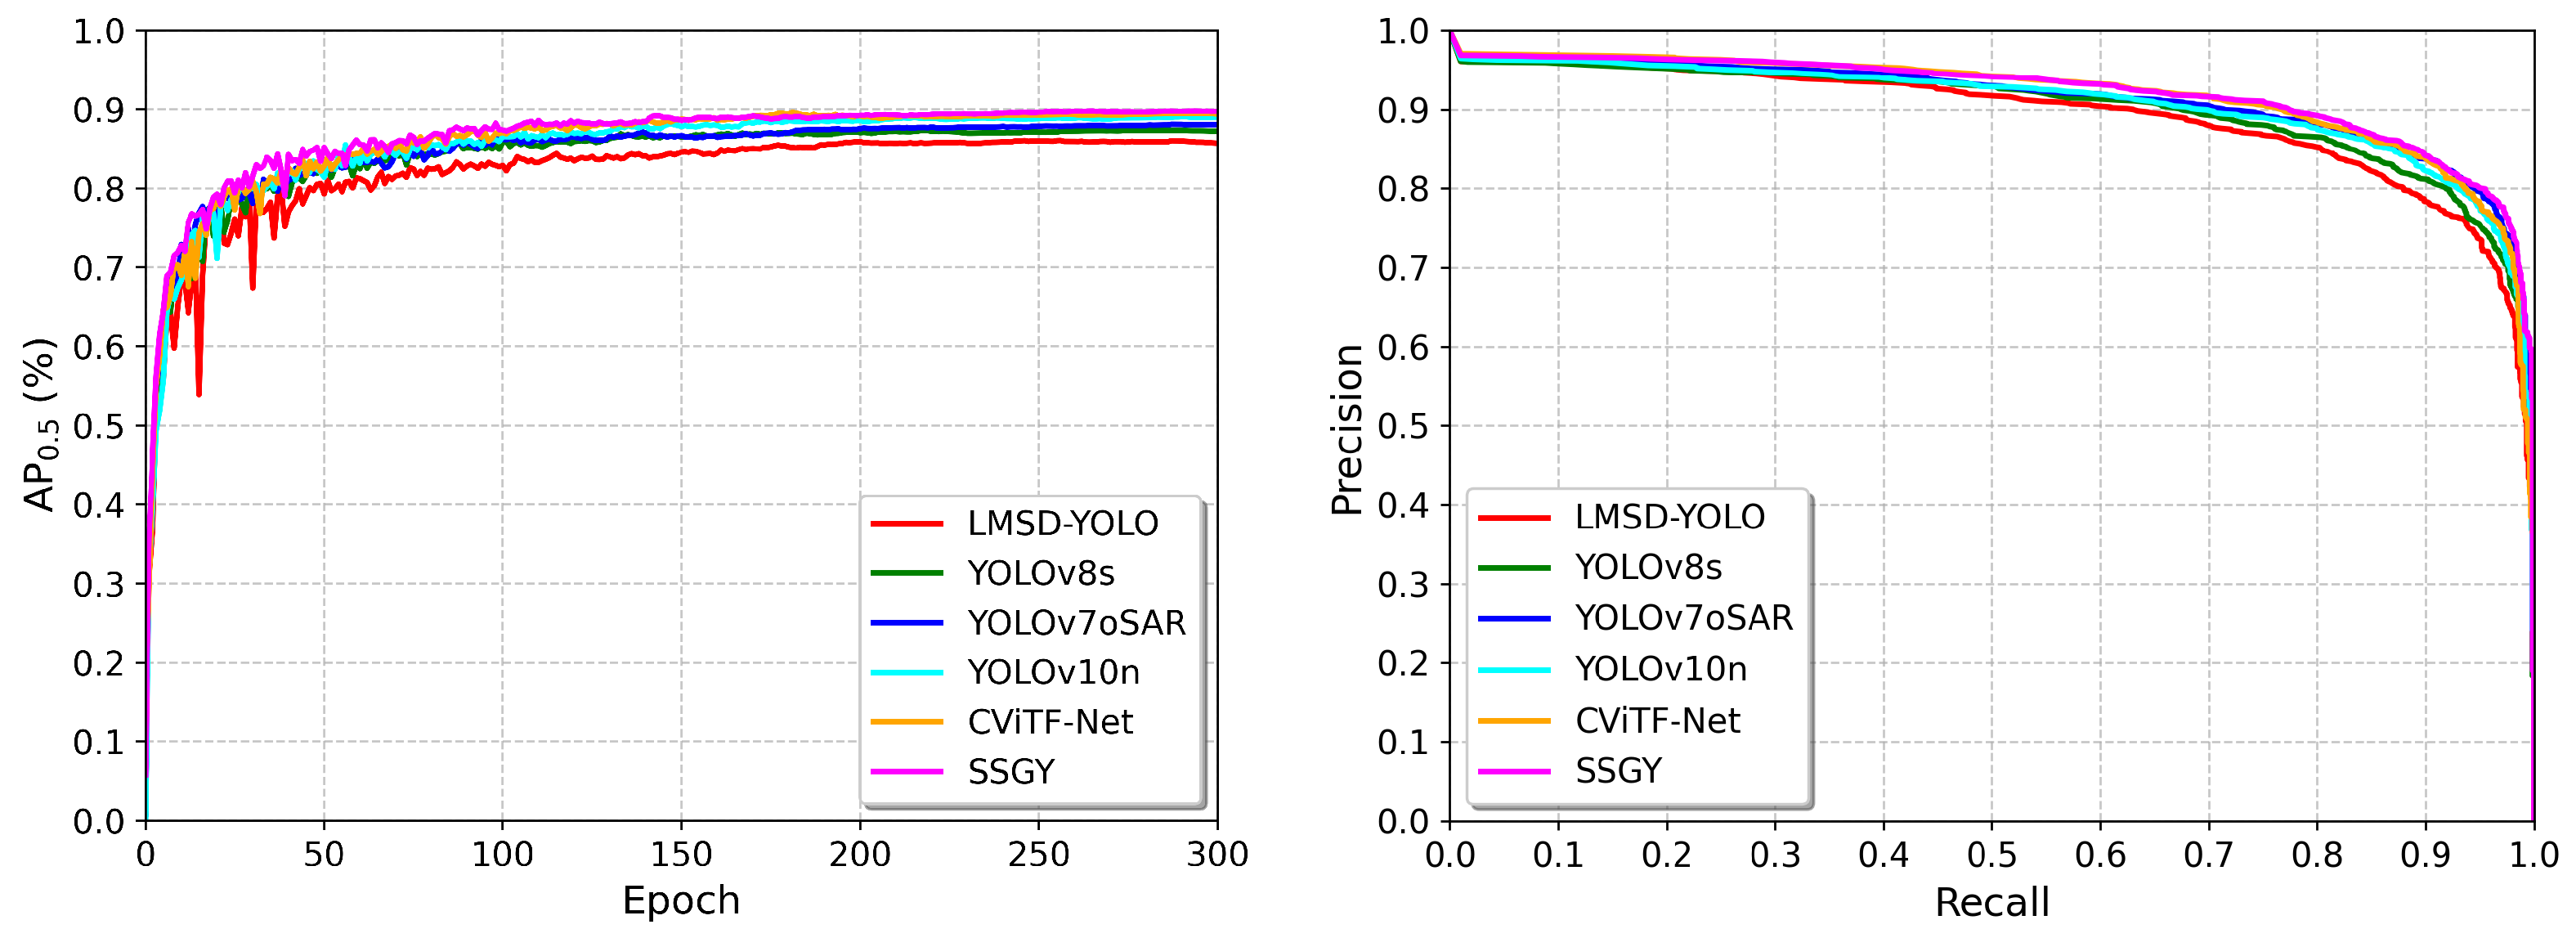
To validate the overall performance of the proposed SSGY network, we present the AP50 and Precision–Recall (PR) curves for various methods on the HRSID dataset, as shown in Figure 10.
From the AP50-Epoch curve, we observe that YOLOv10n, CViTF-Net, and SSGY have higher initial AP50 values, indicating stronger early feature capture, while LMSD-YOLO starts lower. During mid-training, CViTF-Net and SSGY show rapid growth, outpacing other algorithms, reflecting better convergence and learning speed. In the later stages, all algorithms stabilize, with SSGY maintaining a precision of around 0.933, CViTF-Net at 0.923, and YOLOv10n at 0.877, while LMSD-YOLO and YOLOv8s stay lower at 0.791, 0.832, and 0.8235, respectively. Overall, SSGY and CViTF-Net excel in AP50, with SSGY slightly outperforming CViTF-Net, while LMSD-YOLO and YOLOv8s show average performance, and YOLOv10n’s improvement plateaus.
From the PR curve, all algorithms reach 100% precision at lower recall rates, indicating accurate target identification at high confidence. As recall increases, LMSD-YOLO and YOLOv8s show a more significant precision drop, reflecting difficulty in controlling false positives at higher recall. In contrast, CViTF-Net and SSGY exhibit a more gradual decline in precision, with SSGY maintaining high precision even at higher recall rates, demonstrating superior precision–recall balance.

4.4.2. Visual Results

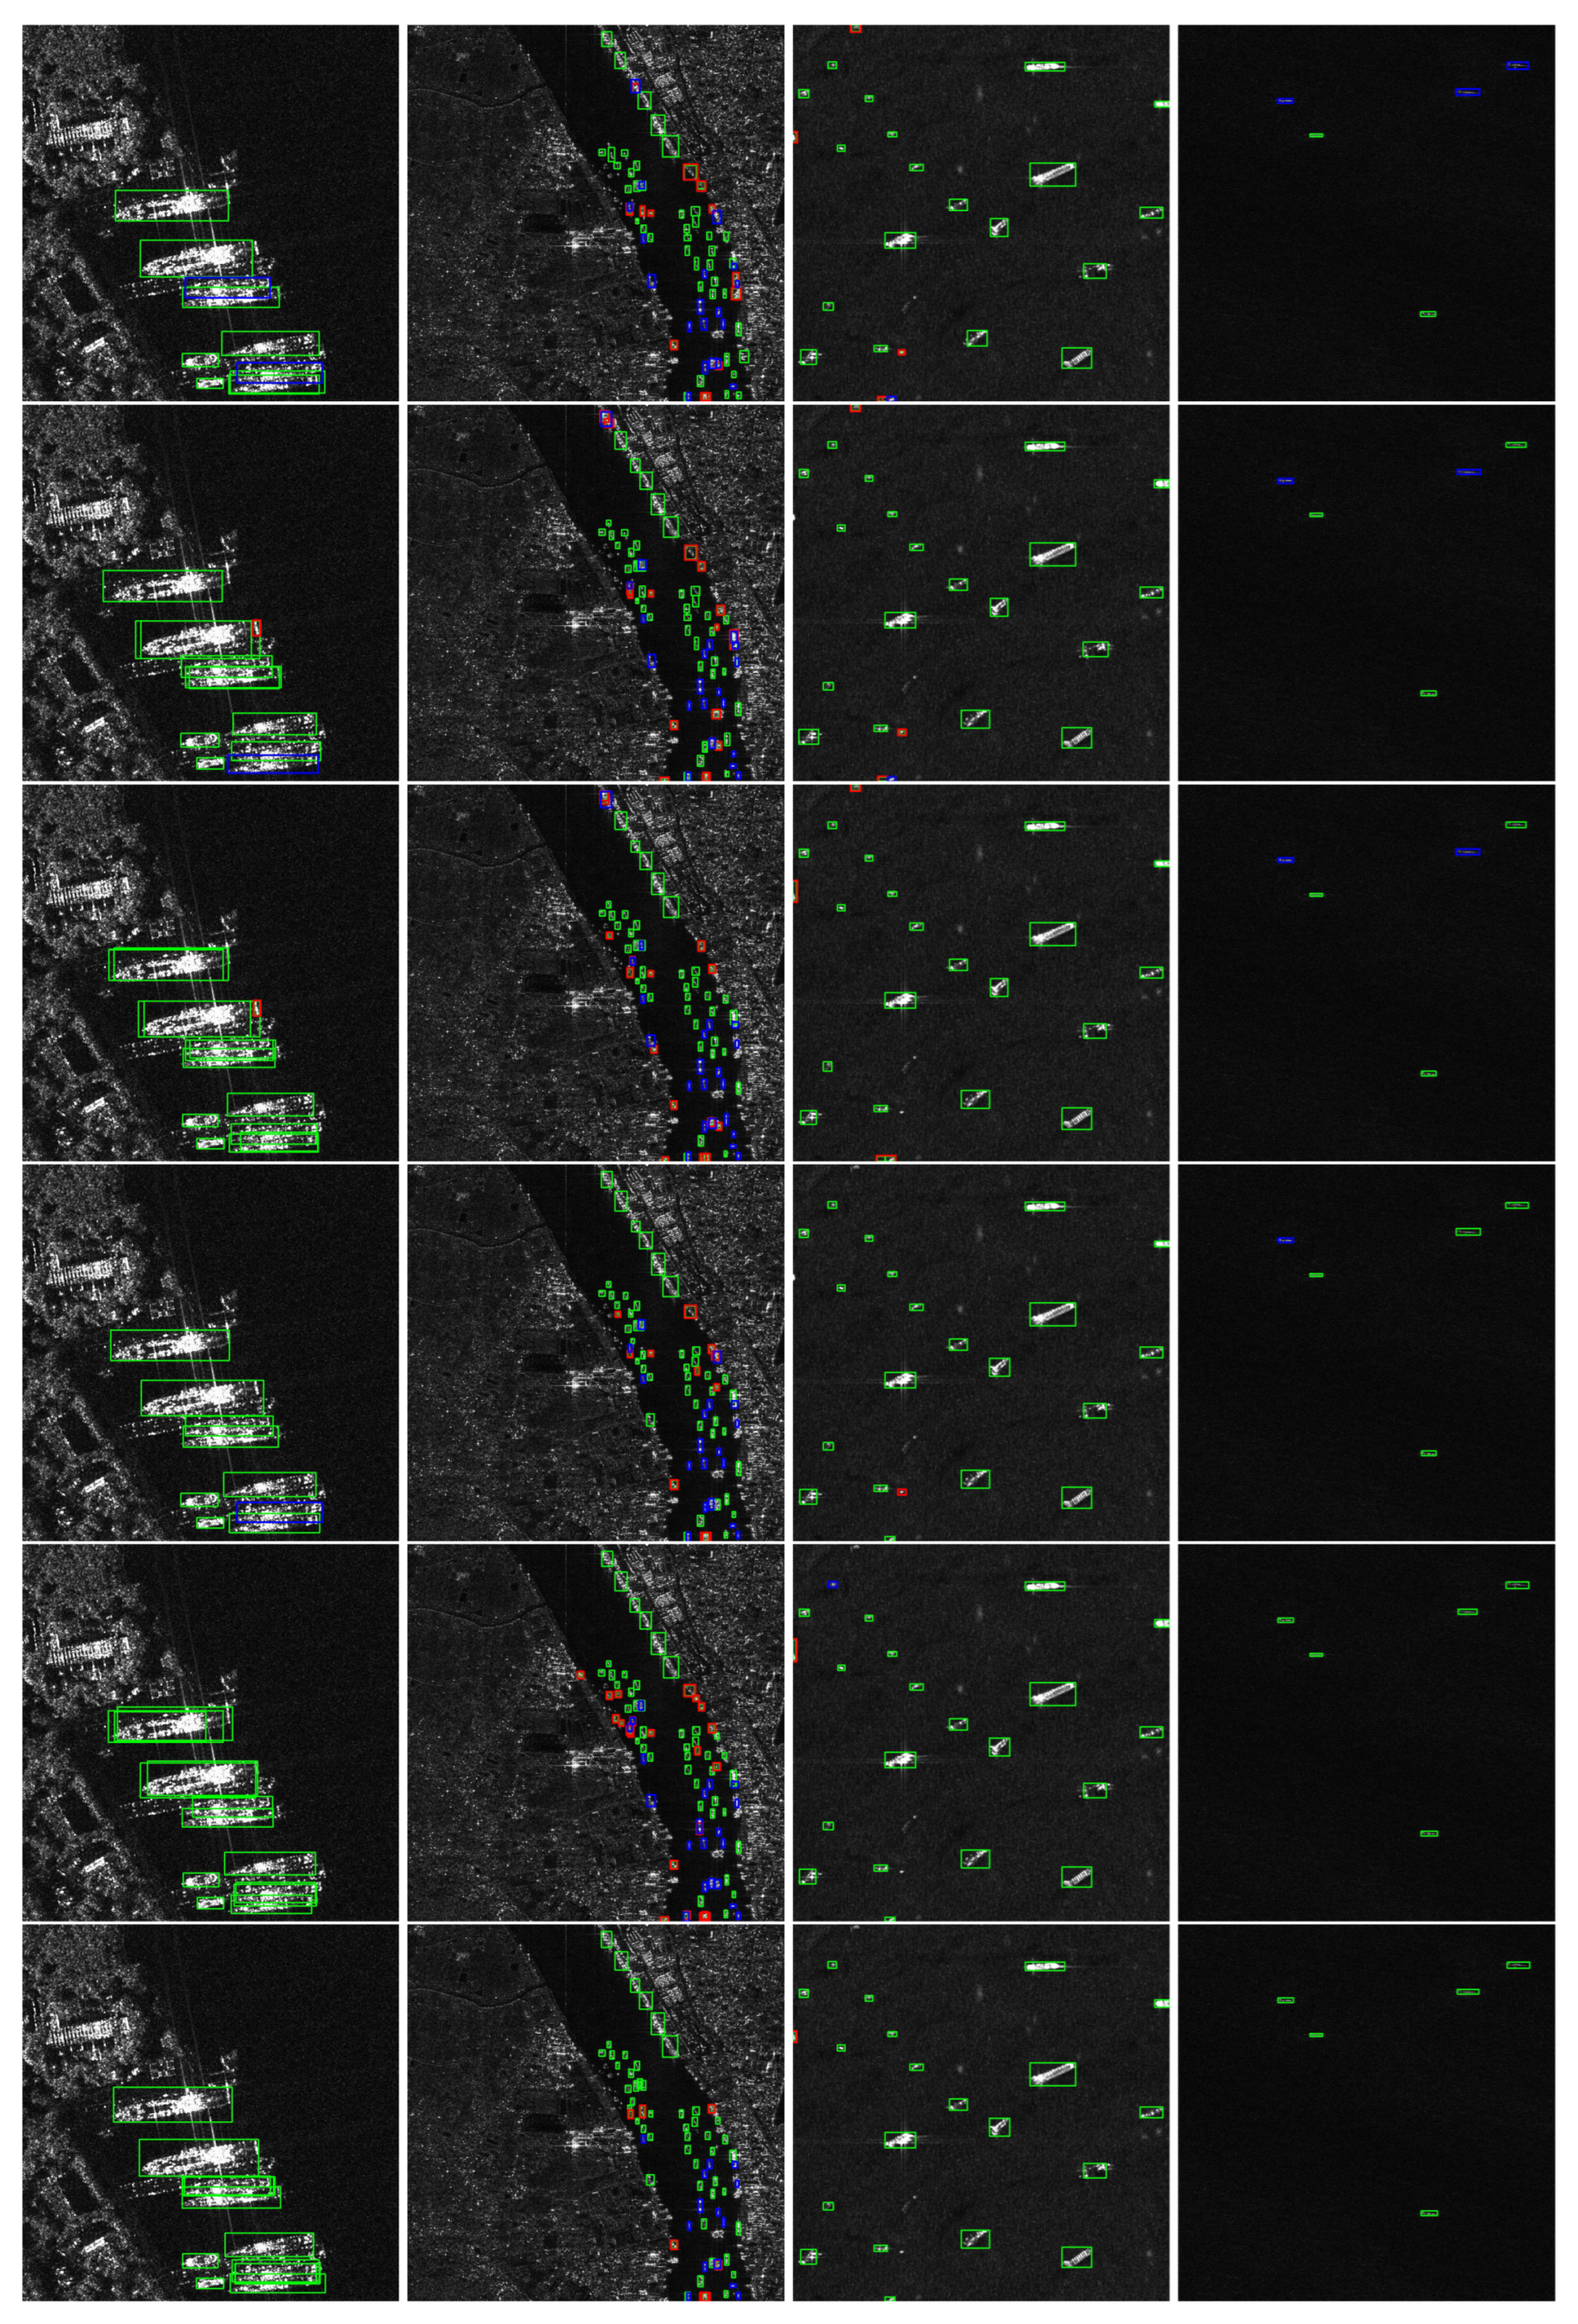
This section visually compares the detection results of different algorithms on various datasets. Figure 11 and Figure 12 present the detection results on the SSDD and HRSID datasets, respectively. Four representative scenes from these datasets—large ships near the shore, small ships near the shore, large ships at sea, and small ships at sea—are selected for comparative analysis.
In the first column of Figure 11 and Figure 12, both images depict large ships near the coastline. These SAR images contain complex backgrounds, where coastal scatterers introduce significant interference. Furthermore, the proximity of the ships increases the likelihood of missed detections. Among the methods evaluated, LMSD-YOLO, YOLOv8s, and YOLOv7oSAR fail to detect one of the three ships in the lower-right corner. YOLOv10n performs slightly better, successfully detecting all the ships. However, in terms of confidence scores, YOLOv10n’s detection performance remains inferior to that of the CViTF-Net and SSGY methods.
In the second column of Figure 11 and Figure 12, both images depict small ships near the coast. These targets occupy fewer pixels, exhibit less distinct features, and are more susceptible to background noise, which increases the difficulty of detection. The LMSD-YOLO and YOLOv8s methods show instances of missed detections due to their limited feature extraction capabilities in noisy and complex coastal SAR images. In Figure 11, YOLOv7oSAR, YOLOv10n, and CViTF-Net perform well, detecting most small ships. However, in the more complex Figure 12, YOLOv7oSAR fails to detect ships on the right bank, YOLOv10n misidentifies parts of ships as entire ships, resulting in false detections, and CViTF-Net produces numerous false alarms when detecting ships on the left bank. SSGY outperforms the other methods in these scenarios. Although it still exhibits some missed detections, it has the lowest miss rate and provides more precise bounding boxes compared to other algorithms.
In the third column of Figure 11 and Figure 12, both images depict large ships at sea. LMSD-YOLO and YOLOv8s exhibit several missed detections. Notably, LMSD-YOLO mistakenly identifies the top clutter in Figure 12 as ships, highlighting its unstable detection performance. YOLOv8s frequently misses detections near the edges of the scene and fails to detect very small ships in the lower half of Figure 12. YOLOv7oSAR performs better, with only a few missed detections in Figure 12, indicating that its design tailored for SAR images is effective. YOLOv10n and CViTF-Net generally achieve better performance; however, both mistakenly identify scatterers on the right side of Figure 11 as ships. These scatterers have ship-like contours but exhibit significantly weaker scattering intensity, which is not characteristic of ships, suggesting insufficient feature discrimination capability in these models. SSGY demonstrates exceptional robustness in these scenarios. It accurately detects large ships, provides precise bounding boxes, and effectively distinguishes ship features, showcasing its ability to handle complex maritime environments with high reliability.
In the fourth column of Figure 11 and Figure 12, both images depict small-scale ship targets at sea, which are challenging to detect due to their small size and weaker scattering strength in the presence of sea clutter. LMSD-YOLO and YOLOv8s continue to experience missed detections. In Figure 11, where the scattering strength of ships is higher, there are fewer missed detections compared to Figure 12, indicating poor detection robustness in LMSD-YOLO and YOLOv8s. The YOLOv7oSAR method shows a few missed detections in both datasets. YOLOv10n, despite some false alarms, generally performs well in detecting small ships, although its detection confidence is relatively low, likely due to a weaker feature extraction capability for SAR images. CViTF-Net exhibits a significant number of false alarms, particularly on the right side of the scene in the SSDD dataset. SSGY performs well in detecting small targets at sea. It can effectively identify small ships in complex multi-target scenarios, and the false alarm or missed detection is almost zero. This shows its superiority in SAR image ship detection tasks.
In summary, visual comparisons of ship detection results across different scenes and scales show that each algorithm has varying capabilities in handling the complexities of SAR images. SSGY stands out with its strong adaptability to complex backgrounds, noise, and diverse target features. Its high detection accuracy, stability, and anti-interference performance make it a reliable and efficient solution for SAR ship detection tasks.

5. Discussion

This paper presents a lightweight SAR image ship detection model, SAR-Star-GSConv-YOLOv10 (SSGY), which optimizes feature extraction through the multi-scale kernel StarNet in the backbone network. The neck network utilizes GSConv for efficient feature fusion, and the detection head employs strategies to minimize computational cost. The loss function integrates multiple components to enhance detection performance. With just 1.4 M parameters, SSGY significantly reduces storage requirements compared to models such as YOLOv10n (2.3 M parameters), making it highly deployable. Its 5.4 G FLOPs, much lower than CViTF-Net’s 205.74 G, ensure reduced computational load, lower time and energy consumption, and efficient operation on SAR platforms with limited computing resources, offering a practical solution for real-world applications.
Recently, an oriented ship detection method for optical remote sensing images (CGTC-RYOLO) [57] combined a contextual global attention mechanism with lightweight task-specific context decoupling to improve detection of multi-scale, arbitrary-orientation, and densely arranged ships. Both CGTC-RYOLO and SSGY aim to enhance detection accuracy and efficiency, but they are optimized for different sensing modalities and challenges. CGTC-RYOLO focuses on optical imagery, leveraging global attention and angle classification to improve rotation robustness. In contrast, SSGY targets SAR imagery, where complex marine backgrounds and speckle noise dominate, and it emphasizes extreme lightweight design (1.4 M parameters, 5.4 G FLOPs) to support deployment on resource-constrained SAR platforms. The proposed method complements optical-based approaches by extending lightweight ship detection into the SAR domain.
In dense scenes, MSKS enlarges the effective receptive field through large kernels and dilated convolutions, while DSCDown preserves fine structural cues. Together, these modules separate adjacent hulls and reduce duplicate or missed detections. The dual-assignment head and distribution focal loss further refine positive sample selection and boundary regression under heavy overlap. For strong iceberg-like scatterers, the efficient channel attention module boosts channels that respond to elongated manmade structures and suppresses responses dominated by background clutter. The combination of CIoU and WIoU in the localization objective penalizes center displacement and aspect ratio inconsistencies, discouraging boxes from fitting amorphous bright clutter and lowering the false alarm rate.
Theoretically, MSKS offers significant advantages as the backbone network. Its star-shaped operation fuses features and maps them to a high-dimensional nonlinear space, enabling the extraction of complex ship features. Smaller convolution kernels in the lower layers reduce computational cost and enhance detail extraction, while larger kernels in higher layers expand the receptive field to capture semantic information. The integration of dilated convolutions and the ECA module further optimizes multi-scale feature capture and channel attention. In the ablation experiments, using YOLOv10n as the baseline, the introduction of the MSKS module improves precision and reduces parameters and FLOPs. When combined with modules such as DSCDown and ECA, detection performance is further enhanced, demonstrating the MSKS module’s effectiveness and crucial role in SAR image ship detection.
In SAR image ship detection, the neck structure based on C2fGSConv plays a crucial role. GSConv combines the benefits of SC and DSC, effectively capturing both spatial and channel features within the neck network. This integration enhances detection accuracy while reducing computational cost, especially during feature fusion at the P3 and P4 layers. In the ablation experiments, the CBS neck structure was used as the baseline. The GBSiLu structure reduces the parameter count but increases FLOPs. However, the C2fGSConv structure with the GBMish activation function further improves accuracy without altering the parameter count, demonstrating its ability to optimize detection accuracy and reduce parameter count, thus enhancing ship detection on resource-constrained SAR platforms.
Despite the effectiveness of the proposed method, hyperparameter sensitivity remains a challenge, particularly in terms of generalization and adaptability to complex SAR environments. While a set of hyperparameters has been determined experimentally, performance fluctuations may arise when the model encounters SAR images with varied data distributions. To address this, we will categorize SAR image data based on factors such as imaging conditions, ship types, and resolution. Using traditional methods, we will first determine the hyperparameter range and then refine the search with Bayesian optimization to identify optimal values. The model will be iteratively adjusted and validated against new data until the performance meets the desired standards.

6. Conclusions

This paper proposes a lightweight SAR image ship detection method, SAR-Star-GSConv-YOLOv10, which combines high efficiency with competitive detection performance. The method integrates multiple lightweight structures to balance computational efficiency and detection accuracy. In the backbone network, the StarNet structure, based on multi-scale convolutional kernels, along with dilated convolutions and an ECA module, enhances feature extraction and addresses the complexity of ship scales and shapes in SAR images. The neck network utilizes the C2fGSConv structure, optimizing multi-scale feature fusion while reducing computational costs and parameters, thus reinforcing lightweight performance. The detection head adopts a dual assignment strategy and replaces some convolutional layers with depthwise separable convolutions to further minimize computational overhead. By incorporating multiple loss terms, the method significantly improves detection accuracy and robustness in complex backgrounds. The experimental results demonstrate that SSGY outperforms similar algorithms on the SSDD and HRSID datasets, achieving a parameter count of 1.4 million and 5.4 billion FLOPs, showing strong resource adaptability. In terms of detection accuracy, the method achieves higher AP and accuracy on both datasets compared to existing methods, confirming its superiority. Future work will focus on enhancing the model’s generalization to adapt to special and complex SAR scenarios, as well as optimizing hyperparameters and detection algorithms to further improve performance and enable broader application.

Author Contributions

Conceptualization, F.H. and C.W.; methodology, F.H.; software, F.H.; validation, F.H., C.W. and B.G.; formal analysis, F.H. and C.W.; investigation, F.H.; resources, F.H.; data curation, F.H.; writing—original draft preparation, F.H.; writing—review and editing, F.H. and C.W.; visualization, F.H.; supervision, B.G.; project administration, B.G.; funding acquisition, B.G. All authors have read and agreed to the published version of the manuscript.

Funding

This research is financially supported by the National Natural Science Foundation of China (Grant No. 62171341).

Data Availability Statement

This study used the SSDD and HRSID. Data sources: https://github.com/TianwenZhang0825/Official-SSDD and https://github.com/chaozhong2010/HRSID (accessed on 1 January 2024).

Conflicts of Interest

The authors declare no conflicts of interest.

References

  1. Tsokas, A.; Rysz, M.; Pardalos, P.M.; Dipple, K. SAR data applications in earth observation: An overview. Expert Syst. Appl. 2022, 205, 117342. [Google Scholar] [CrossRef]
  2. Sommervold, O.; Gazzea, M.; Arghandeh, R. A Survey on SAR and Optical Satellite Image Registration. Remote Sens. 2023, 15, 850. [Google Scholar] [CrossRef]
  3. Li, N.; Lv, Z.; Guo, Z. Observation and Mitigation of Mutual RFI Between SAR Satellites: A Case Study Between Chinese GaoFen-3 and European Sentinel-1A. IEEE Trans. Geosci. Remote Sens. 2022, 60, 5112819. [Google Scholar] [CrossRef]
  4. Li, J.; Xu, C.; Su, H.; Gao, L.; Wang, T. Deep Learning for SAR Ship Detection: Past, Present and Future. Remote Sens. 2022, 14, 2712. [Google Scholar] [CrossRef]
  5. Li, J.; Chen, J.; Cheng, P.; Yu, Z.; Yu, L.; Chi, C. A Survey on Deep-Learning-Based Real-Time SAR Ship Detection. IEEE J. Sel. Top. Appl. Earth Obs. Remote Sens. 2023, 16, 3218–3247. [Google Scholar] [CrossRef]
  6. Xu, X.; Zhang, X.; Zhang, T. Lite-YOLOv5: A Lightweight Deep Learning Detector for On-Board Ship Detection in Large-Scene Sentinel-1 SAR Images. Remote Sens. 2022, 14, 1018. [Google Scholar] [CrossRef]
  7. Singh, P.; Diwakar, M.; Shankar, A.; Shree, R.; Kumar, M. A Review on SAR Image and its Despeckling. Arch. Comput. Methods Eng. 2021, 28, 4633–4653. [Google Scholar] [CrossRef]
  8. Chen, Z.; Liu, C.; Filaretov, V.F.; Yukhimets, D.A. Multi-Scale Ship Detection Algorithm Based on YOLOv7 for Complex Scene SAR Images. Remote Sens. 2023, 15, 2071. [Google Scholar] [CrossRef]
  9. Wang, X.; Li, G.; Zhang, X.P.; He, Y. A Fast CFAR Algorithm Based on Density-Censoring Operation for Ship Detection in SAR Images. IEEE Signal Process. Lett. 2021, 28, 1085–1089. [Google Scholar] [CrossRef]
  10. Zhang, L.; Zhang, Z.; Lu, S.; Xiang, D.; Su, Y. Fast Superpixel-Based Non-Window CFAR Ship Detector for SAR Imagery. Remote Sens. 2022, 14, 2092. [Google Scholar] [CrossRef]
  11. Bezerra, D.X.; Lorenzzetti, J.A.; Paes, R.L. Marine Environmental Impact on CFAR Ship Detection as Measured by Wave Age in SAR Images. Remote Sens. 2023, 15, 3441. [Google Scholar] [CrossRef]
  12. Li, N.; Pan, X.; Yang, L.; Huang, Z.; Wu, Z.; Zheng, G. Adaptive CFAR Method for SAR Ship Detection Using Intensity and Texture Feature Fusion Attention Contrast Mechanism. Sensors 2022, 22, 8116. [Google Scholar] [CrossRef] [PubMed]
  13. Guo, H.; Yang, X.; Wang, N.; Gao, X. A CenterNet++ model for ship detection in SAR images. Pattern Recognit. 2021, 112, 107787. [Google Scholar] [CrossRef]
  14. Ai, J.; Mao, Y.; Luo, Q.; Xing, M.; Jiang, K.; Jia, L.; Yang, X. Robust CFAR Ship Detector Based on Bilateral-Trimmed-Statistics of Complex Ocean Scenes in SAR Imagery: A Closed-Form Solution. IEEE Trans. Aerosp. Electron. Syst. 2021, 57, 1872–1890. [Google Scholar] [CrossRef]
  15. Zhu, J.; Wang, F.; You, H. Unsupervised SAR Image Change Detection Based on Structural Consistency and CFAR Threshold Estimation. Remote Sens. 2023, 15, 1422. [Google Scholar] [CrossRef]
  16. Gao, S.; Liu, H. Performance Comparison of Statistical Models for Characterizing Sea Clutter and Ship CFAR Detection in SAR Images. IEEE J. Sel. Top. Appl. Earth Obs. Remote Sens. 2022, 15, 7414–7430. [Google Scholar] [CrossRef]
  17. Xu, P.; Li, Q.; Zhang, B.; Wu, F.; Zhao, K.; Du, X.; Yang, C.; Zhong, R. On-Board Real-Time Ship Detection in HISEA-1 SAR Images Based on CFAR and Lightweight Deep Learning. Remote Sens. 2021, 13, 1995. [Google Scholar] [CrossRef]
  18. Li, Y.; Wang, Z.; Chen, H.; Li, Y. A Density Clustering-Based CFAR Algorithm for Ship Detection in SAR Images. IEEE Geosci. Remote Sens. Lett. 2024, 21, 4009505. [Google Scholar] [CrossRef]
  19. Lin, Y.; Li, L.; Wei, L.; Liu, L.; Yu, J. Multi-Orientation Edge-Based Satellite Image Matching Method for Optical and Sar Images. Int. Arch. Photogramm. Remote Sens. Spat. Inf. Sci. 2023, XLVIII-1/W2-2023, 1417–1423. [Google Scholar] [CrossRef]
  20. Zhou, M.; Zhou, Y.; Yang, D.; Song, K. Remote Sensing Image Classification Based on Canny Operator Enhanced Edge Features. Sensors 2024, 24, 3912. [Google Scholar] [CrossRef]
  21. Feng, Y.; Han, B.; Wang, X.; Shen, J.; Guan, X.; Ding, H. Self-Supervised Transformers for Unsupervised SAR Complex Interference Detection Using Canny Edge Detector. Remote Sens. 2024, 16, 306. [Google Scholar] [CrossRef]
  22. Maxwell, A.E.; Warner, T.A.; Guillén, L.A. Accuracy Assessment in Convolutional Neural Network-Based Deep Learning Remote Sensing Studies—Part 1: Literature Review. Remote Sens. 2021, 13, 2450. [Google Scholar] [CrossRef]
  23. Sarker, I.H. Deep cybersecurity: A comprehensive overview from neural network and deep learning perspective. SN Comput. Sci. 2021, 2, 154. [Google Scholar] [CrossRef]
  24. Shafique, A.; Cao, G.; Khan, Z.; Asad, M.; Aslam, M. Deep Learning-Based Change Detection in Remote Sensing Images: A Review. Remote Sens. 2022, 14, 871. [Google Scholar] [CrossRef]
  25. Bai, T.; Wang, L.; Yin, D.; Sun, K.; Chen, Y.; Li, W.; Li, D. Deep learning for change detection in remote sensing: A review. Geo-Spat. Inf. Sci. 2023, 26, 262–288. [Google Scholar] [CrossRef]
  26. Zhao, Y.; Zhang, X.; Feng, W.; Xu, J. Deep learning classification by ResNet-18 based on the real spectral dataset from multispectral remote sensing images. Remote Sens. 2022, 14, 4883. [Google Scholar] [CrossRef]
  27. Zhang, X.; Zhou, Y.; Luo, J. Deep learning for processing and analysis of remote sensing big data: A technical review. Big Earth Data 2022, 6, 527–560. [Google Scholar] [CrossRef]
  28. Ren, S.; He, K.; Girshick, R.; Sun, J. Faster R-CNN: Towards real-time object detection with region proposal networks. IEEE Trans. Pattern Anal. Mach. Intell. 2016, 39, 1137–1149. [Google Scholar] [CrossRef]
  29. Tian, Z.; Chu, X.; Wang, X.; Wei, X.; Shen, C. Fully convolutional one-stage 3d object detection on lidar range images. Adv. Neural Inf. Process. Syst. 2022, 35, 34899–34911. [Google Scholar]
  30. Yang, S.; An, W.; Li, S.; Wei, G.; Zou, B. An Improved FCOS Method for Ship Detection in SAR Images. IEEE J. Sel. Top. Appl. Earth Obs. Remote Sens. 2022, 15, 8910–8927. [Google Scholar] [CrossRef]
  31. Zhu, M.; Hu, G.; Zhou, H.; Wang, S.; Feng, Z.; Yue, S. A Ship Detection Method via Redesigned FCOS in Large-Scale SAR Images. Remote Sens. 2022, 14, 1153. [Google Scholar] [CrossRef]
  32. Vaswani, A.; Shazeer, N.; Parmar, N.; Uszkoreit, J.; Jones, L.; Gomez, A.N.; Kaiser, Ł.; Polosukhin, I. Attention Is All You Need. In Proceedings of the Advances in Neural Information Processing Systems 30, Long Beach, CA, USA, 4–9 December 2017. [Google Scholar]
  33. Zhao, Y.; Lv, W.; Xu, S.; Wei, J.; Wang, G.; Dang, Q.; Liu, Y.; Chen, J. Detrs beat yolos on real-time object detection. In Proceedings of the IEEE/CVF Conference on Computer Vision and Pattern Recognition, Seattle, WA, USA, 16–22 June 2024; pp. 16965–16974. [Google Scholar]
  34. Redmon, J. You only look once: Unified, real-time object detection. In Proceedings of the IEEE Conference on Computer Vision and Pattern Recognition, Las Vegas, NV, USA, 27–30 June 2016. [Google Scholar]
  35. Redmon, J.; Farhadi, A. YOLO9000: Better, faster, stronger. In Proceedings of the IEEE Conference on Computer Vision and Pattern Recognition, Honolulu, HI, USA, 21–26 July 2017; pp. 7263–7271. [Google Scholar]
  36. Farhadi, A.; Redmon, J. Yolov3: An incremental improvement. In Computer Vision and Pattern Recognition; Springer: Berlin/Heidelberg, Germany, 2018; Volume 1804, pp. 1–6. [Google Scholar]
  37. Bochkovskiy, A.; Wang, C.Y.; Liao, H.Y.M. Yolov4: Optimal speed and accuracy of object detection. arXiv 2020, arXiv:2004.10934. [Google Scholar] [CrossRef]
  38. Hui, Y.; You, S.; Hu, X.; Yang, P.; Zhao, J. SEB-YOLO: An Improved YOLOv5 Model for Remote Sensing Small Target Detection. Sensors 2024, 24, 2193. [Google Scholar] [CrossRef]
  39. Li, C.; Li, L.; Jiang, H.; Weng, K.; Geng, Y.; Li, L.; Ke, Z.; Li, Q.; Cheng, M.; Nie, W.; et al. YOLOv6: A single-stage object detection framework for industrial applications. arXiv 2022, arXiv:2209.02976. [Google Scholar] [CrossRef]
  40. Wang, C.Y.; Bochkovskiy, A.; Liao, H.Y.M. YOLOv7: Trainable bag-of-freebies sets new state-of-the-art for real-time object detectors. In Proceedings of the IEEE/CVF Conference on Computer Vision and Pattern Recognition, Vancouver, BC, Canada, 17–24 June 2023; pp. 7464–7475. [Google Scholar]
  41. Wang, G.; Chen, Y.; An, P.; Hong, H.; Hu, J.; Huang, T. UAV-YOLOv8: A Small-Object-Detection Model Based on Improved YOLOv8 for UAV Aerial Photography Scenarios. Sensors 2023, 23, 7190. [Google Scholar] [CrossRef]
  42. Li, Y.; Wang, S. EGM-YOLOv8: A Lightweight Ship Detection Model with Efficient Feature Fusion and Attention Mechanisms. J. Mar. Sci. Eng. 2025, 13, 757. [Google Scholar] [CrossRef]
  43. Gao, Z.; Yu, X.; Rong, X.; Wang, W. Improved YOLOv8n for Lightweight Ship Detection. J. Mar. Sci. Eng. 2024, 12, 1774. [Google Scholar] [CrossRef]
  44. Guo, Y.; Chen, S.; Zhan, R.; Wang, W.; Zhang, J. LMSD-YOLO: A Lightweight YOLO Algorithm for Multi-Scale SAR Ship Detection. Remote Sens. 2022, 14, 4801. [Google Scholar] [CrossRef]
  45. Lv, Z.; Lu, J.; Wang, Q.; Guo, Z.; Li, N. ESP-LRSMD: A Two-Step Detector for Ship Detection Using SLC SAR Imagery. IEEE Trans. Geosci. Remote Sens. 2022, 60, 5233516. [Google Scholar] [CrossRef]
  46. Wang, S.; Cai, Z.; Yuan, J. Automatic SAR Ship Detection Based on Multifeature Fusion Network in Spatial and Frequency Domains. IEEE Trans. Geosci. Remote Sens. 2023, 61, 4102111. [Google Scholar] [CrossRef]
  47. Yasir, M.; Liu, S.; Mingming, X.; Wan, J.; Pirasteh, S.; Dang, K.B. ShipGeoNet: SAR Image-Based Geometric Feature Extraction of Ships Using Convolutional Neural Networks. IEEE Trans. Geosci. Remote Sens. 2024, 62, 5202613. [Google Scholar] [CrossRef]
  48. Liu, Y.; Ma, Y.; Chen, F.; Shang, E.; Yao, W.; Zhang, S.; Yang, J. YOLOv7oSAR: A Lightweight High-Precision Ship Detection Model for SAR Images Based on the YOLOv7 Algorithm. Remote Sens. 2024, 16, 913. [Google Scholar] [CrossRef]
  49. Wang, A.; Chen, H.; Liu, L.; Chen, K.; Lin, Z.; Han, J.; Ding, G. Yolov10: Real-time end-to-end object detection. arXiv 2024, arXiv:2405.14458. [Google Scholar]
  50. Huang, M.; Liu, T.; Chen, Y. CViTF-Net: A Convolutional and Visual Transformer Fusion Network for Small Ship Target Detection in Synthetic Aperture Radar Images. Remote Sens. 2023, 15, 4373. [Google Scholar] [CrossRef]
  51. Ma, X.; Dai, X.; Bai, Y.; Wang, Y.; Fu, Y. Rewrite the Stars. In Proceedings of the IEEE/CVF Conference on Computer Vision and Pattern Recognition, Seattle, WA, USA, 16–22 June 2024; pp. 5694–5703. [Google Scholar]
  52. Wang, Q.; Wu, B.; Zhu, P.; Li, P.; Zuo, W.; Hu, Q. ECA-Net: Efficient channel attention for deep convolutional neural networks. In Proceedings of the IEEE/CVF Conference on Computer Vision and Pattern Recognition, Seattle, WA, USA, 13–19 June 2020; pp. 11534–11542. [Google Scholar]
  53. Li, H.; Li, J.; Wei, H.; Liu, Z.; Zhan, Z.; Ren, Q. Slim-neck by GSConv: A lightweight-design for real-time detector architectures. J. Real-Time Image Process. 2024, 21, 62. [Google Scholar] [CrossRef]
  54. Tong, Z.; Chen, Y.; Xu, Z.; Yu, R. Wise-IoU: Bounding box regression loss with dynamic focusing mechanism. arXiv 2023, arXiv:2301.10051. [Google Scholar]
  55. Zhang, T.; Zhang, X.; Li, J.; Xu, X.; Wang, B.; Zhan, X.; Xu, Y.; Ke, X.; Zeng, T.; Su, H.; et al. SAR Ship Detection Dataset (SSDD): Official Release and Comprehensive Data Analysis. Remote Sens. 2021, 13, 3690. [Google Scholar] [CrossRef]
  56. Wei, S.; Zeng, X.; Qu, Q.; Wang, M.; Su, H.; Shi, J. HRSID: A high-resolution SAR images dataset for ship detection and instance segmentation. IEEE Access 2020, 8, 120234–120254. [Google Scholar] [CrossRef]
  57. Gao, G.; Wang, Y.; Chen, Y.; Yang, G.; Yao, L.; Zhang, X.; Li, H.; Li, G. An Oriented Ship Detection Method of Remote Sensing Image With Contextual Global Attention Mechanism and Lightweight Task-Specific Context Decoupling. IEEE Trans. Geosci. Remote Sens. 2025, 63, 4200918. [Google Scholar] [CrossRef]
Figure 1. The overall network structure of YOLOv10.
Remotesensing 17 02868 g001
Figure 2. The structure of SSGY network model.
Remotesensing 17 02868 g002
Figure 3. The multi-scale feature extraction network structure based on StarNet.
Remotesensing 17 02868 g003
Figure 4. Low-level and high-level spatial channel decoupling downsampling modules.
Remotesensing 17 02868 g004
Figure 5. Efficient channel attention module structure.
Remotesensing 17 02868 g005
Figure 6. The structure of GSConv.
Remotesensing 17 02868 g006
Figure 7. Lightweight Neck structure based on GSConv modules. The output modules for each feature level are C2fGSConv, and both P4 and P3 are connected using C2fGSConv. The other convolution modules in the Neck are standard GSConv modules.
Remotesensing 17 02868 g007
Figure 8. C2fGSConv module structure.
Remotesensing 17 02868 g008
Figure 9. Detection head structure.
Remotesensing 17 02868 g009
Figure 10. Comparison with other methods. Left: AP 50 curves; Right: PR curves.
Remotesensing 17 02868 g010
Figure 11. The detection results of each algorithm in four typical SAR scenes from the SSDD dataset. Green, blue, and red rectangles represent detection results, missed detections, and false positives, respectively. Each row, from top to bottom, displays the experimental results of the detection algorithms LMSD-YOLO, YOLOv8s, YOLOv7oSAR, YOLOv10n, CViTF-Net, and SSGY.
Remotesensing 17 02868 g011
Figure 12. The detection results of each algorithm in four typical SAR scenes from the HRSID dataset. Green, blue, and red rectangles represent detection results, missed detections, and false positives, respectively. Each row, from top to bottom, displays the experimental results of the detection algorithms LMSD-YOLO, YOLOv8s, YOLOv7oSAR, YOLOv10n, CViTF-Net, and SSGY.
Remotesensing 17 02868 g012
Table 1. Comparison of the neck structure between SSGY and YOLOv10.
LevelSSGY NeckYOLOv10 Neck
ModuleChannel(I/O)Param.ModuleChannel(I/O)Param.
P5upsample--upsample--
P4C2fGSConv960/3841.07 MC2f960/3841.80 M
upsample--upsample--
P3C2fGSConv576/1920.29 MC2f576/1920.49 M
P3–P4GSConv192/1920.16 MConv192/1920.33 M
C2fGSConv576/3840.93 MC2fCIB576/3840.83 M
P4–P5H-DSCDown384/3840.01 MSCDown384/3840.15 M
C2fGSConv960/5762.14 MC2fCIB960/5761.93 M
Table 2. Ablation study results of MSKS, DSCDown, ECA, CBAM, and SE. The best results are in bold.
No.MSKSDSCDownECACBAMSEPrecision (%)Recall (%)Params (M)FLOPs (G)
1xxxxx83.2586.332.36.7
2xxxx85.3284.631.74.3
3xxxx84.8185.222.36.7
4xxxx85.1284.322.47.0
5xxxx83.7984.182.47.0
6xxxx82.9883.272.36.8
7xxx85.3785.721.74.3
8xx85.9386.111.84.4
Table 3. Ablation study results of CBS, GBSiLu, and GBMish. The best results are in bold.
No.CBSGBSiLuGBMishPrecision (%)Recall (%)Params (M)FLOPs (G)
1xx85.9386.111.84.4
2xx86.2085.401.55.4
3xx86.3085.901.55.5
Table 4. Ablation study results of the Light Head and Union Loss. The best results are in bold.
No.Light HeadUnion LossPrecision (%)Recall (%)Params (M)FLOPs (G)
1xx85.9386.111.76.3
2x86.2085.401.55.4
3x86.3085.901.55.7
486.6086.901.45.4
Table 5. Comparison with other methods in two datasets. The best results are in bold.
AlgorithmParamsFLOPsSSDDHRSID
(M)(G)AP0.5(%)P(%)R(%)F1(%)AP0.5(%)P(%)R(%)F1(%)
LMSD-YOLO9.1416.6088.3689.4588.2388.8485.1188.0085.3286.64
YOLOv8s6.0213.2091.2391.5490.1290.8287.2389.7887.3488.54
YOLOv7oSAR11.1428.8392.1192.2389.0190.5987.9689.6786.0287.81
YOLOv10n2.306.7092.5793.1389.3191.1888.1389.2383.1286.07
CViTF-Net90.97205.7493.2894.0690.2092.0989.7191.0385.3288.08
SSGY1.405.4093.9494.0590.9292.4689.5491.5285.5888.45
Disclaimer/Publisher’s Note: The statements, opinions and data contained in all publications are solely those of the individual author(s) and contributor(s) and not of MDPI and/or the editor(s). MDPI and/or the editor(s) disclaim responsibility for any injury to people or property resulting from any ideas, methods, instructions or products referred to in the content.