Article

Remote Observation of the Impacts of Land Use on Rainfall Variability in the Triângulo Mineiro (Brazilian Cerrado Region)

by
Ana Carolina Durigon Boldrin
*,
Bruno Enrique Fuzzo
,
João Alberto Fischer Filho
and
Daniela Fernanda da Silva Fuzzo
Department of Agrarian and Biological Sciences, State University of Minas Gerais (UEMG), Frutal Campus, Frutal 38202-436, Brazil
*
Author to whom correspondence should be addressed.
Remote Sens. 2025, 17(16), 2866; https://doi.org/10.3390/rs17162866 (registering DOI)
Submission received: 30 May 2025 / Revised: 28 July 2025 / Accepted: 1 August 2025 / Published: 17 August 2025
(This article belongs to the Section Environmental Remote Sensing)

Abstract

Throughout history, humans have modified the environment, transforming natural biomes into agricultural areas. In the 1990s, economic policies accelerated the expansion of agricultural frontiers in Brazil, including the Triângulo Mineiro and Alto Paranaíba regions. This study analyzes rainfall variability from 1990 to 2021 and its relationship with land use. For this purpose, satellite data from MapBiomas, ERA5, and NASA POWER were processed using Google Earth Engine and QGIS. Statistical methods included the Spearman correlation and the Mann–Kendall trend test. The results revealed that average annual precipitation decreased from 1663.35 mm in 1991 to 1128.94 mm in 2022—a 32.14% reduction. Simultaneously, agricultural and urban areas increased by 365% and 237.59%, respectively. Spearman analysis showed negative correlations between precipitation and agriculture (ρ = −0.51) and urbanization (ρ = −0.51), and positive correlations with pasture (ρ = +0.52) and water bodies (ρ = +0.46). These trends suggest that land use intensification significantly affects regional rainfall patterns. Unlike studies focusing mainly on Amazon deforestation, this research emphasizes the Cerrado biome’s climatic vulnerability. The use of long-term, high-resolution remote sensing data allows a robust analysis of land use impacts. By highlighting a clear link between land transformation and precipitation decline, this study offers insights for policymaking aimed at balancing agricultural development and water resource preservation. This research underscores the importance of sustainable land management practices, such as agroecology, reforestation, and ecological corridors, for regional climate resilience.

1. Introduction

The environment has undergone constant transformations caused by human actions over the years, resulting in significant impacts on climate projections at a global scale [1]. In Brazil, economic policies adopted from the 1990s onward intensified resource exploitation and promoted agricultural expansion, leading to dramatic changes in natural landscapes and negative effects on biodiversity [2]. Within this context, the Cerrado biome stands out as one of the primary targets of native vegetation conversion into agricultural and pasture areas—around 40% of its original cover has been transformed—contributing directly to changes in regional climate patterns.
Climate change mitigation has become a widely debated topic in global forums. The Food and Agriculture Organization of the United Nations (FAO), through the 2030 Agenda and the Paris Agreement, has emphasized the need to align hunger reduction with climate action, particularly by improving livestock management systems [3]. However, the United Nations Framework Convention on Climate Change has mainly prioritized the impacts of greenhouse gas emissions, often overlooking biophysical changes arising from deforestation and the vegetation–climate relationship [4,5].
According to the Intergovernmental Panel on Climate Change (IPCC) [1], climate variability is driven by both greenhouse gas emissions and changes in land use and land cover, which affect the troposphere’s energy balance. These modifications disrupt ecological interaction systems and, when correlated with precipitation indices, allow for robust historical analyses of environmental and climate impacts [6]. Although most studies focus on the effects of Amazon deforestation on the climate, other biomes have also experienced intense transformations. In the Cerrado, such changes over the past decades have the potential to impact the climate both regionally and globally [7]. Therefore, developing research to support environmental protection policies targeting this vulnerable biome is essential.
The Triângulo Mineiro/Alto Paranaíba mesoregion, located within the Cerrado biome, began receiving substantial investments in the 1970s, notably through initiatives like the Proálcool program, which accelerated agribusiness development in the area. Understanding the evolution of this scenario requires an analysis of historical environmental and climate data using models capable of identifying the effects of land use and land cover transformations, as well as the observed impacts and projections of future changes [6].
Recent studies reinforce the significance of these land transformations. For instance, one analysis of 81 river basins throughout the Cerrado revealed that reductions in river flow are more closely linked to deforestation than to climate change, with projections indicating up to a 33.9% decline in flow by 2050 [8]. In parallel, other researchers observed a consistent trend of increased evapotranspiration and decreased rainfall, especially in regions converted to soybean and sugarcane cultivation—factors contributing to reduced net water availability [9]. Moreover, despite focusing on a different state, additional findings show comparable outcomes, particularly regarding the acceleration of erosion and the loss of native vegetation triggered by agricultural expansion [10].
With the scientific and computational advances of recent decades, our understanding of global climate dynamics has significantly improved. These developments enable more precise analyses of the causes of climate change, although uncertainties persist in regional projections. Satellite technology has become a valuable tool for analyzing historical climate records and current conditions, while also contributing to the creation of databases that aid in climate trend classification and identification. This technology facilitates the use of meteorological sensor data through the European Commission’s Joint Research Centre (JRC) database [11]. It is well-established that the biophysical processes resulting from land use and land cover transformations are directly linked to rising temperatures, reduced evapotranspiration, and declining precipitation. Therefore, examining the correlations among these factors and their temporal behavior is essential.
Simultaneously, the rise of big data technologies has revolutionized how we interact with our planet. Geospatial data obtained through remote sensing, soil surveys, and geolocated sensors are widely used to examine changes in land use and climatic conditions [12]. Google Earth Engine (GEE), for example, is a cloud-based platform that enables the storage and processing of massive datasets, while offering tools for detailed analysis and dissemination of the results [13,14]. Studies with this focus are fundamental for understanding environmental impacts across different sectors of society.
Studies such as Ref. [15], a scientometric analysis, demonstrate the expanding use of Google Earth Engine (GEE) in research related to land use and water resource management, with particular emphasis on agricultural and climate monitoring. Although focused on greenhouse gases, Ref. [16] highlights the relevance of GEE in conducting complex environmental analyses and its growing integration with machine learning techniques to improve climate monitoring capabilities.
Global climate change has altered biodiversity composition and ecosystem distribution, while increasing the frequency of extreme events such as droughts, floods, and heat waves [17]. This scenario points toward a future marked by increasingly severe and unpredictable climate conditions.
The motivation for this study stems from the rapid agricultural and urban expansion observed in the Triângulo Mineiro and Alto Paranaíba region since the 1990s, driven by public incentive policies and increased economic activity. Despite being a key biome for national food production and biodiversity, the Cerrado has received limited scientific attention compared to the Amazon, even though land use changes here have significantly altered local climate dynamics. Given this context, this study aims to assess the relationship between land cover transformations and rainfall variability, using advanced remote sensing technologies and historical data. The findings are intended to support the development of sustainable land management strategies that balance agricultural growth with environmental conservation.
Within this context, the present study aimed to analyze rainfall variability in the Triângulo Mineiro/Alto Paranaíba region from 1990 to 2022 and its relationship with land use. These analyses can provide valuable insights for developing strategies to promote sustainable land use and mitigate climate impacts, particularly in regions of high economic and environmental significance.

2. Materials and Methods

2.1. Study Area

The study area comprises the Triângulo Mineiro/Alto Paranaíba region, located between geographic coordinates 17°55′12″S to 20°41′30″S latitude and 45°33′30″W to 51°0′18″W longitude, representing the western portion of Minas Gerais state [18]. The state borders areas of Goias, São Paulo, and Mato Grosso do Sul states, as well as central, western, and northwestern Minas Gerais (Figure 1).
This study area was selected due to its economic significance for both Minas Gerais state and the national territory, particularly its prominence in grain production, sugarcane cultivation, and beef–dairy cattle farming [19]. The Triângulo Mineiro mesoregion comprises 66 municipalities, accounting for 13.67% of Minas Gerais’ territory and 16% of the state’s GDP in 2019. Furthermore, it boasts one of the highest GDP per capita figures among Minas Gerais regions, generating 8.9% of formal employment and representing 7% of the state’s total exports. Notably, Minas Gerais alone accounts for 13.8% of Brazil’s total exports [20].
The region’s main export products are sugar, coffee, corn, soybeans, and their derivatives. Additionally, meat production and exports also represent significant economic activities, according to the annual report by the Fundação João Pinheiro (FJP) [21].

2.2. Data Collection and Processing

For land use and land coverage identification and analysis, images from the MapBiomas catalog were used, which are available through the Google Earth Engine (GEE) virtual library. The raster-format maps (30 × 30 m pixels) are based on the Landsat collection from 1985 to 2021. The platform’s data are automatically classified and cloud-processed to generate an annual historical series of land coverage and land use maps in Brazil [22]. Thus, each image pixel is classified into different land use categories [23].
Using municipal boundary vectors obtained from the IBGE (Brazilian Institute of Geography and Statistics), the MapBiomas images were clipped and processed to extract land use area values for each type from 1990 to 2021, employing the QGIS 3.16 re.report tool.
The data were integrated within a GIS environment using QGIS 3.16 software, enabling land use quantification and a spatial distribution assessment of land coverage transformations across the entire region. For data interpretation, MapBiomas layers were reclassified using subclasses that highlight temporal changes in major land classes, as presented in Table 1, which displays the complete classification scheme of classes and subclasses for the municipalities.
The study used the ERA5 global model database, an atmospheric reanalysis product from the European Centre for Medium-Range Weather Forecasts (ECMWF), containing rainfall data (mm) for the 1990–2021 period. The data values were processed using a custom JavaScript script developed by the author, implemented through the virtual library on the Google Earth Engine (GEE) cloud platform for the study region. ERA5 data were acquired at a monthly temporal resolution with a spatial resolution of 0.31 degrees (approximately 31 × 31 km).
The platform uses its server processing power to rapidly handle large datasets; the programming language used in this tool is JavaScript. The complete repository is available at https://developers.google.com/earth-engine/datasets/ (accessed on 06 January 2020). This tool itself represents one of the study’s key focal points due to its distinctive capabilities, particularly in the field of remote sensing, compared to other GIS software (QGIS 3.16).
For the years 2020 and 2021, data from the NASAPOWER platform (National Aeronautics and Space Administration—Prediction of Worldwide Energy Resources) were used due to processing failures in ERA5 data during this period. The NASAPOWER system provides daily meteorological and solar information for various applications, using satellite data and surface measurement-based models, with a spatial resolution of 0.5° × 0.5° latitude/longitude [24].
The precipitation data were interpolated using the inverse distance weighting (IDW) model, which is based on spatial dependence. This model calculates values by multiplying observed measurements by the inverse of their respective distances to the point of interest. The interpolation was performed within a geographic information system (GIS) environment using QGIS 3.16 software.
IDW is a deterministic model that estimates unknown values through the weighted averages of known measurements from nearby points, assigning greater weight to closer points. This calculation is mathematically defined by Equation (1) as follows:
Z = i = 1 n 1 d i Z i i = 1 n 1 d i
where: Z = estimated values; n = number of samples; Zi = known values; di = distances between the known and estimated values (Zi and Z). The IDW interpolation model is an exact method that is suitable for either preliminary surface visualization or interpretation. However, it does not include error prediction assessments, which may produce a ‘bullseye’ effect around data locations—small areas that contrast with the overall smoothing of the variable.

2.3. Exploratory Data Analysis

To preliminarily evaluate the behavior of a historical time series of a climatic parameter, averages were calculated and statistical tests applied. Parametric tests are more effective when data normality is met, whereas non-parametric tests—although requiring independence—are more robust against outliers [25]. Thus, the following tests were performed.
The Kolmogorov–Smirnov (KS) normality test was applied to verify whether precipitation data follow a normal distribution—one of the most important probability distributions, also known as Gaussian or the Gauss distribution, was developed by Abraham de Moivre in 1733 [26].
The analysis was conducted using BioEstat 5.0 software, which is suitable for samples with 30 or more observations. The test provides the significance value (p-value), which indicates the degree of agreement between the data and the null hypothesis (H0), where H0 corresponds to a normal distribution. The decision rule follows: if the p-value is ≤α, we reject H0, indicating that the data do not follow a normal distribution; otherwise, H0 is not rejected, suggesting that normality is plausible.
D = max | F ( x ) F ( a )
The Mann–Kendall (MK) test is a non-parametric trend analysis method used to determine whether the slope of the regression line is significant [27,28]. The test compares each time-series value with all subsequent values in sequential order, counting the number of instances where later values exceed the current value. This analysis was performed using Excel software. The S statistic is obtained by summing all counts, as shown in Equation (3):
S = i = 2 n i = 1 i = 1 x i x j
where the i j signal (x x) is obtained as follows: −1, for xi xj < 0; 0, for xi xj = 0; 1, for xi xj > 0. The S statistic tends to normality for large n values, with average and variance: E[S] = 0, as in Equation (4):
V a r S = 1 18 n n 1 2 n + 5 p 1 q t p ( t p 1 ) ( 2 t p + 5 )
where n is the size of the time series; tp is the number of steps to the value; p and q are numbers of equal value. The Z-test statistic is given by Equation (5):
Z = S 1 V a r   ( S )      i f   S > 0 Z = 0      i f   S = 0 Z = S + 1 V a r   ( S )      i f   S < 0
The presence of a statistically significant trend in the time series was assessed using the Z statistic value to test the null hypothesis that no trend exists. Z is the output parameter of the M-K statistic. Positive Z values indicate increasing trends, while negative values denote decreasing trends.
To test any trend (increasing or decreasing) at a significance level of α, the null hypothesis is rejected if the absolute value of Z exceeds Z1 − α/2 from the standard normal distribution table. A significance level of α = 0.05 was used, as illustrated in Table 1.
Table 1. Mann–Kendall test significance. Source: Adapted from Ref. [29].
SignificanceSymbolZ
No TrendNT0
Significant Increasing TrendSIT>+1.96
Significant Decreasing TrendSDT<−1.96
Non-Significant Increasing TrendNSIT<+1.96
Non-Significant Decreasing TrendNSDT>−1.96
Thus, if the absolute value of Z exceeds 1.96, the null hypothesis is rejected at the 5% significance level, indicating statistically different averages. The non-parametric Mann–Kendall test and Sen’s Slope estimator are recognized as appropriate methods for analyzing trends and/or changes in time series data [30].
To investigate whether different land use classes (forest, urban area, water bodies, agriculture, silviculture, pasture, and land mosaic use) were associated with precipitation variability in the Triângulo Mineiro region from 1990 to 2021, a correlation analysis was performed between the MapBiomas land use time series and annual accumulated precipitation, using Spearman’s coefficient (r). This analysis was conducted in BioEstat 5.0 statistical software, calculated by Equation (6):
r = Σ x y ( Σ x 2 Σ z 2
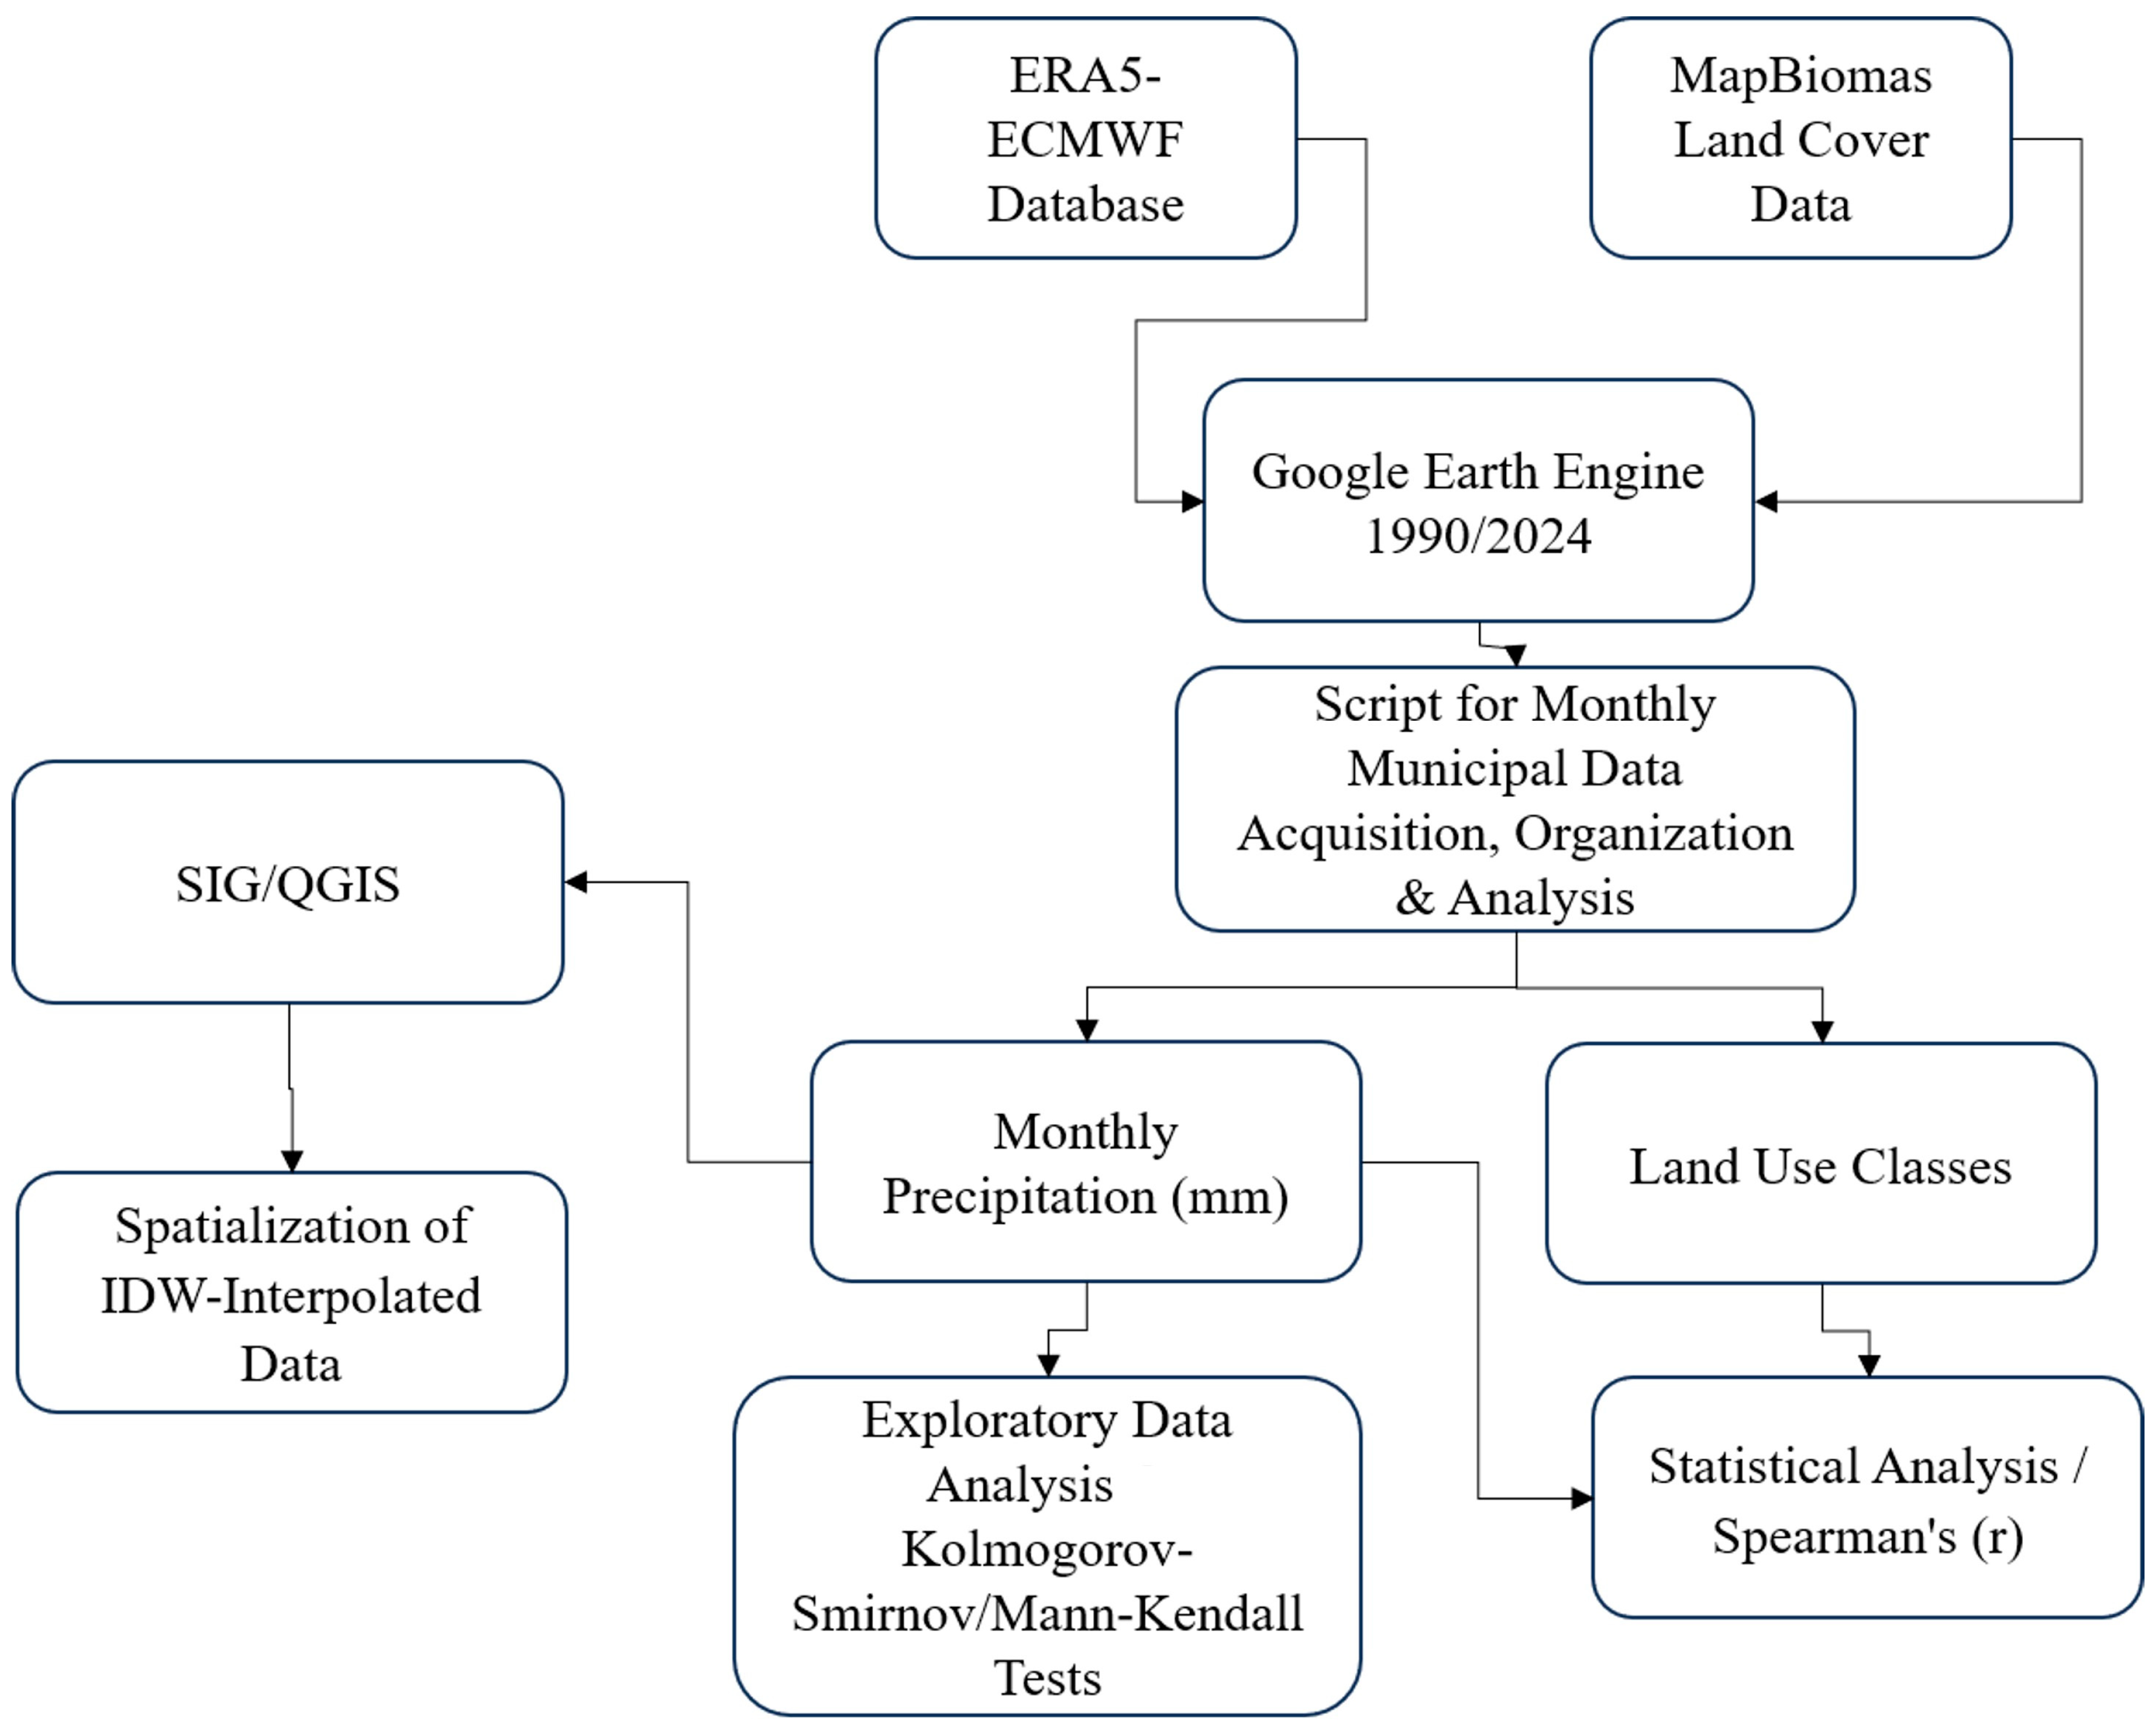
where x and y represent the differences between two observation points. Similar methodologies analyzing temporal correlations between land cover and climatic variables (precipitation, evapotranspiration, and temperature) have previously been proposed by other researchers [31,32]. The methodological steps applied in this study can be summarized in the workflow diagram presented in Figure 2.

3. Results

From data collected by the 66 virtual rainfall stations analyzed in the Triângulo Mineiro region (Figure 3), the mean annual precipitation for the 1990–2022 period was 134,020 mm. According to Ref. [33], areas of the Triângulo Mineiro and Alto Paranaíba (TM/AP) with lower elevations (±450 m) typically receive 1300–1450 mm of annual precipitation, while higher elevation zones (±1000 m) average 1450–1750 mm. Thus, the values obtained over the 32-year study period fall within the expected range for low-altitude areas.
Figure 3 reveals the temporal variability of average annual precipitation, showing a decreasing trend over the 32-year analysis period. Peak annual precipitation values (±1600 mm) occurred in 1991, 1992, 1997, and 2009, with no recurrence thereafter. Conversely, minimum values (≤1200 mm) were recorded in 1991, 1999, 2001, 2002, 2007, 2012, 2014, 2017, 2020, and 2021, demonstrating an increased frequency of low-rainfall years. Notably, precipitation has remained below the 32-year mean (1340.20 mm) since 2017, showing five consecutive years of reduced rainfall.
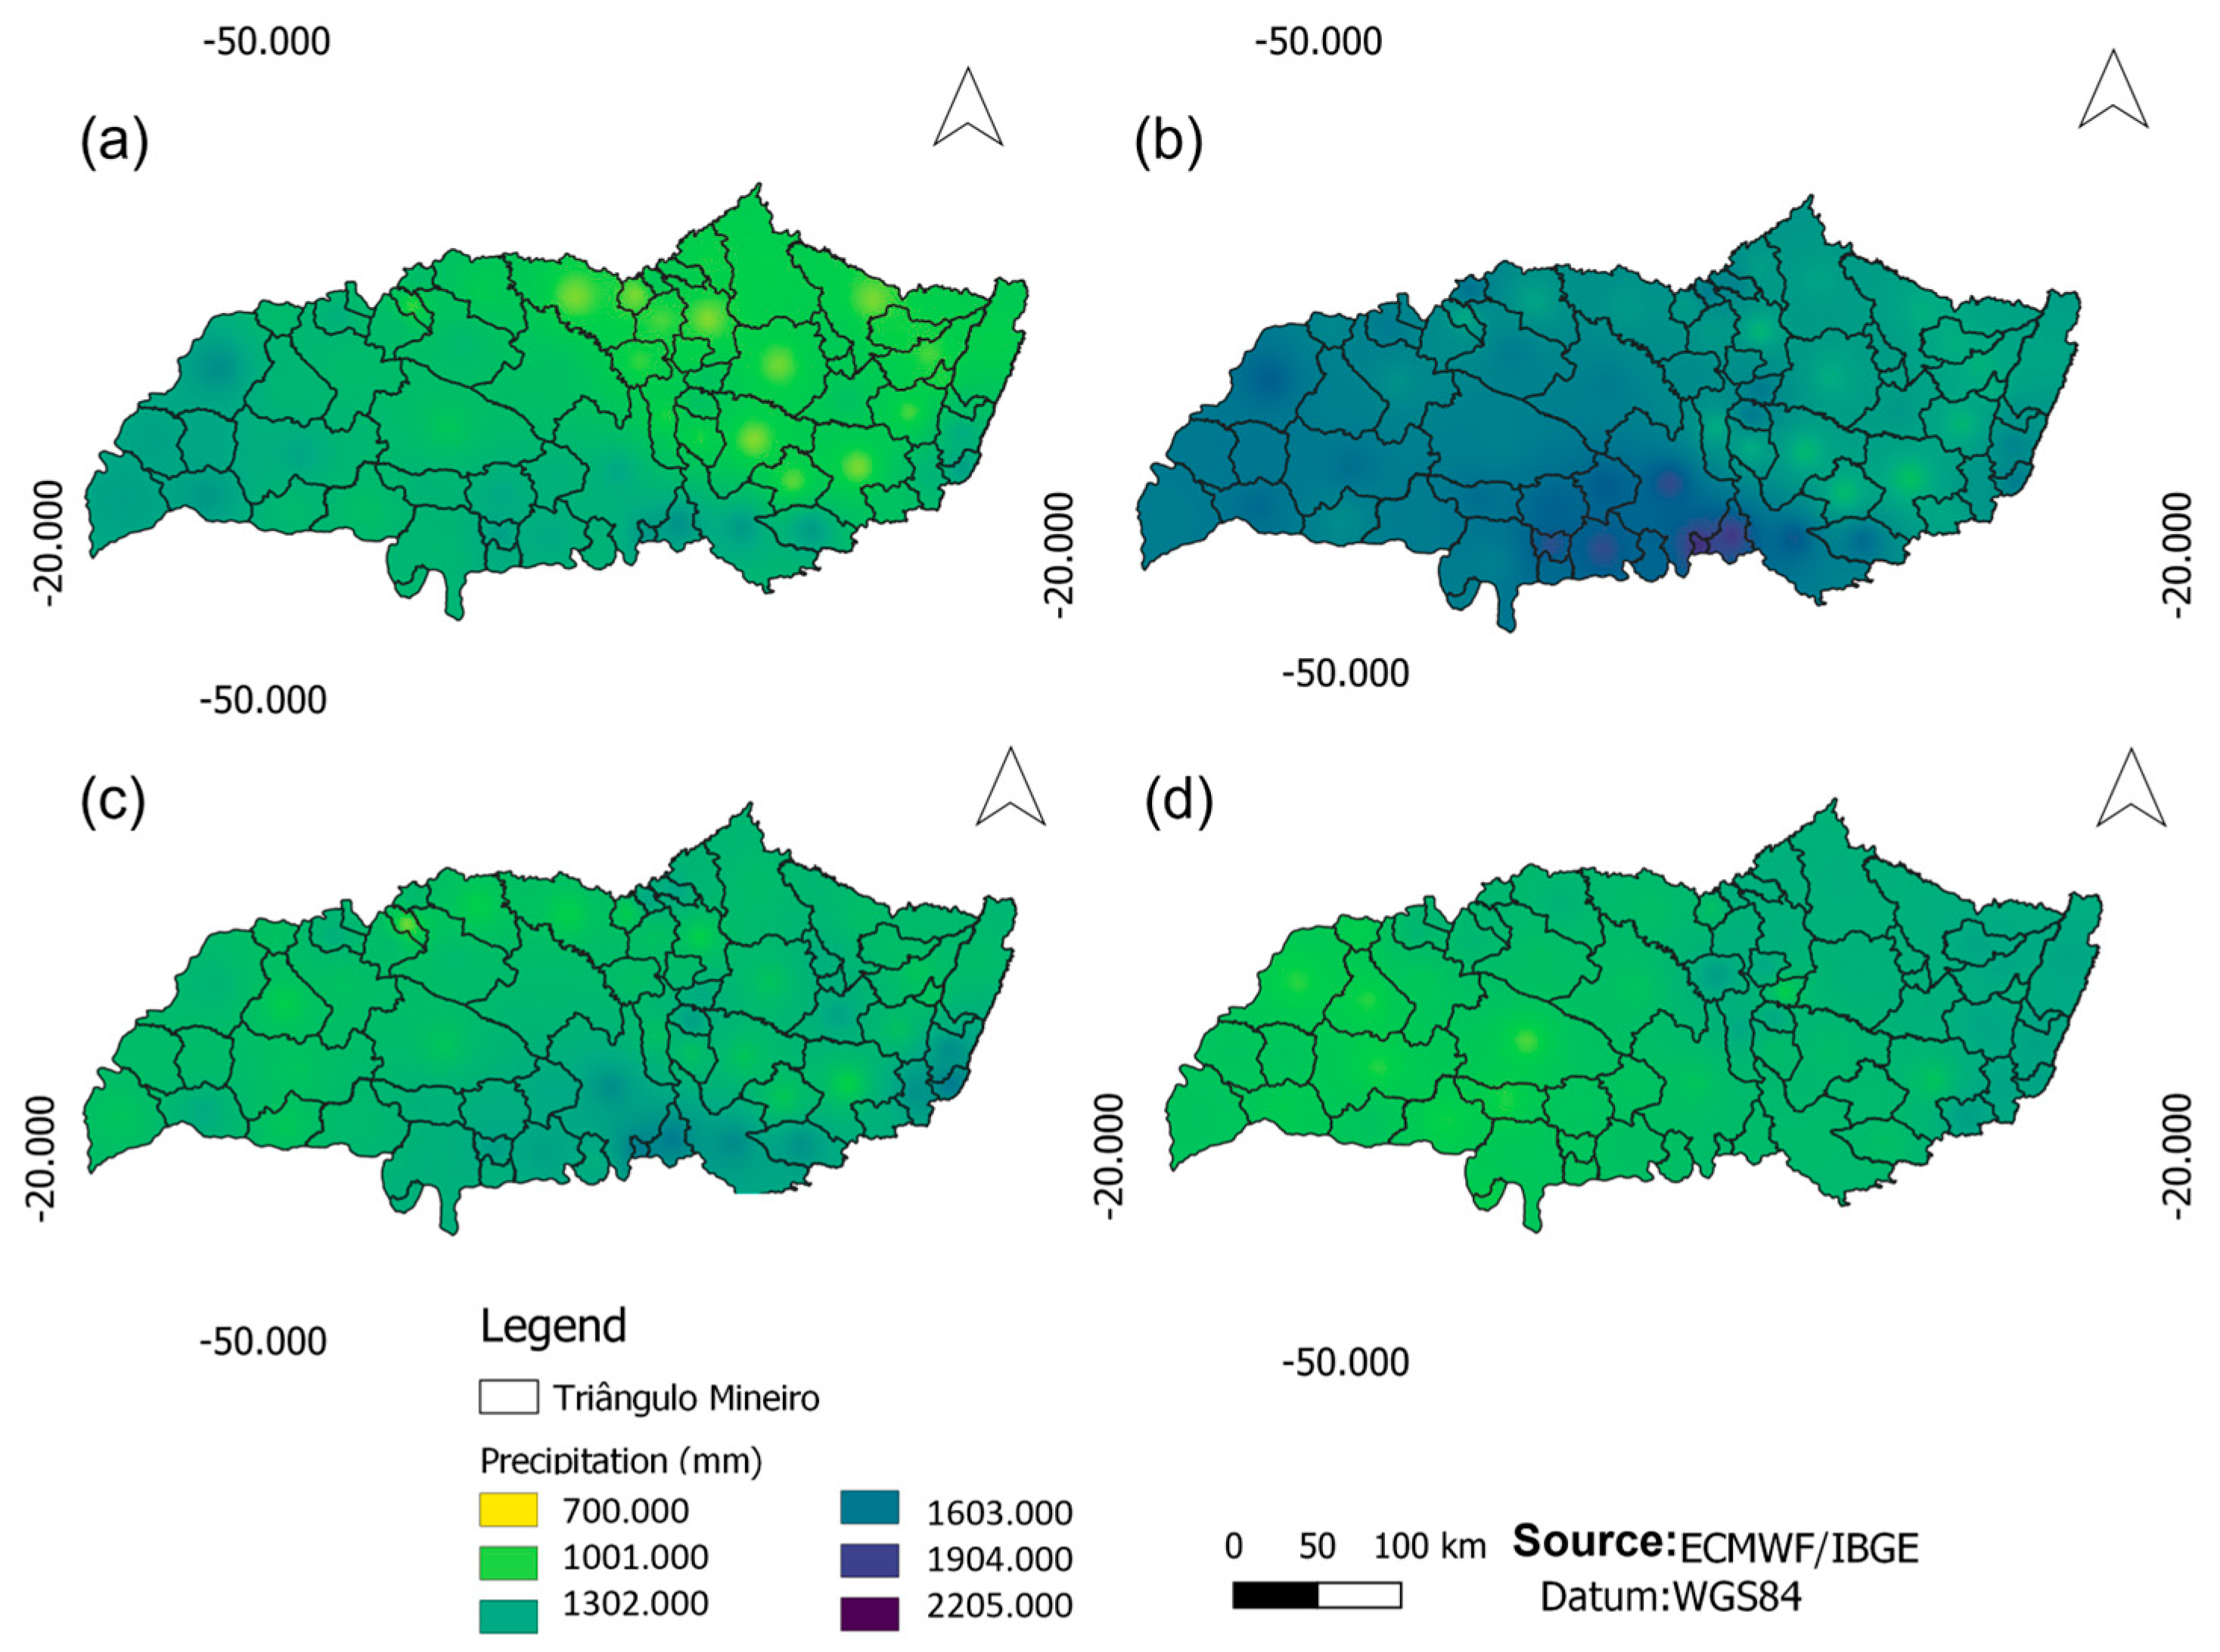
Figure 4a–d presents the spatial distribution of precipitation across the Triângulo Mineiro/Alto Paranaíba region. The Pontal Mineiro subregion—encompassing municipalities such as Carneirinho, Limeira do Oeste, Iturama, União de Minas, Santa Vitória, and São Francisco de Sales—shows lower rainfall levels compared to other areas.
The decline in annual average precipitation intensified post-2010 (1223.81 mm), recurring in 2012 (1146.45 mm) and persisting below the average through 2022 (998.79 mm). Figure 4a–d illustrates the spatial variation in annual accumulated rainfall across the Triângulo Mineiro/Alto Paranaíba region for the years 1990, 2000, 2010, and 2022. A progressive decline in precipitation levels is evident over the decades. In 1990, municipalities in higher-elevation areas recorded values between 1400 mm and 1600 mm, while lower-elevation zones such as the Pontal Mineiro subregion—including Carneirinho, Santa Vitória, and Iturama—were slightly drier.
By 2010, regional rainfall had dropped to an average of 1223 mm, representing a 13% decrease relative to earlier values. The lowest average occurred in 2022, reaching just 998.79 mm, a total decline of 32.14% when compared to 1991 levels. This pattern underscores a statistically significant downward trend in annual precipitation, confirmed by the Mann–Kendall test, and aligns with findings from similar climatic studies in the Cerrado.
As shown in Table 2, statistical analyses indicated non-normal precipitation data (non-parametric) at the 0.05% significance level, per the Kolmogorov–Smirnov test. Subsequently, Mann–Kendall testing revealed absolute Z-values below −1.96, supporting null hypothesis acceptance at α = 0.05 and confirming a statistically significant decreasing trend across all municipalities. These results demonstrate that annual average precipitation in the Triângulo Mineiro/Alto Paranaíba region declined throughout the three-decade study period.
When visualized in the dendrogram (Figure 5), the results reveal distinct relationships among the analyzed samples. The driest years (2018–2021) form a separate cluster, suggesting a correlation with expanding agricultural areas in the region. This pattern implies that cropland expansion may be linked to precipitation regime changes, underscoring the need to investigate land use impacts on local climate conditions.
Analysis of the MapBiomas land coverage/use data (1990–2022), Figure 6, reveals progressive Cerrado-to-cropland conversion. Figure 6 shows a 41.62% reduction in pastureland over 33 years (4884.264 ha to 2851.251 ha), while agricultural areas expanded 365% (619.261 ha in 1999 to 2260.517 ha in 2021). Forest cover declined 8.87% (1.212 ha to 1.104 ha) during this period.
Urban areas expanded by 237.59% (23.730 ha in 1999 to 56.382 ha in 2021), while water bodies decreased by 5.06% (228.315 ha to 216.760 ha). Silviculture increased 155.60% (95.242 ha to 148.197 ha), and land mosaic use grew by 128.43% (1.605 ha to 2.061 ha) during this period.
The agricultural sector expansion can be attributed to agrarian incentive policies implemented during 2008–2009, when the government aimed to strengthen the sector through employment generation, domestic market consolidation, income growth, environmental preservation incentives, and agricultural debt restructuring. Consequently, the Triângulo Mineiro region attracted new investments—including ethanol plant installations—which accelerated sugarcane cultivation expansion. This transition converted degraded pasturelands into croplands, boosting agricultural output while reducing pasture area extent.
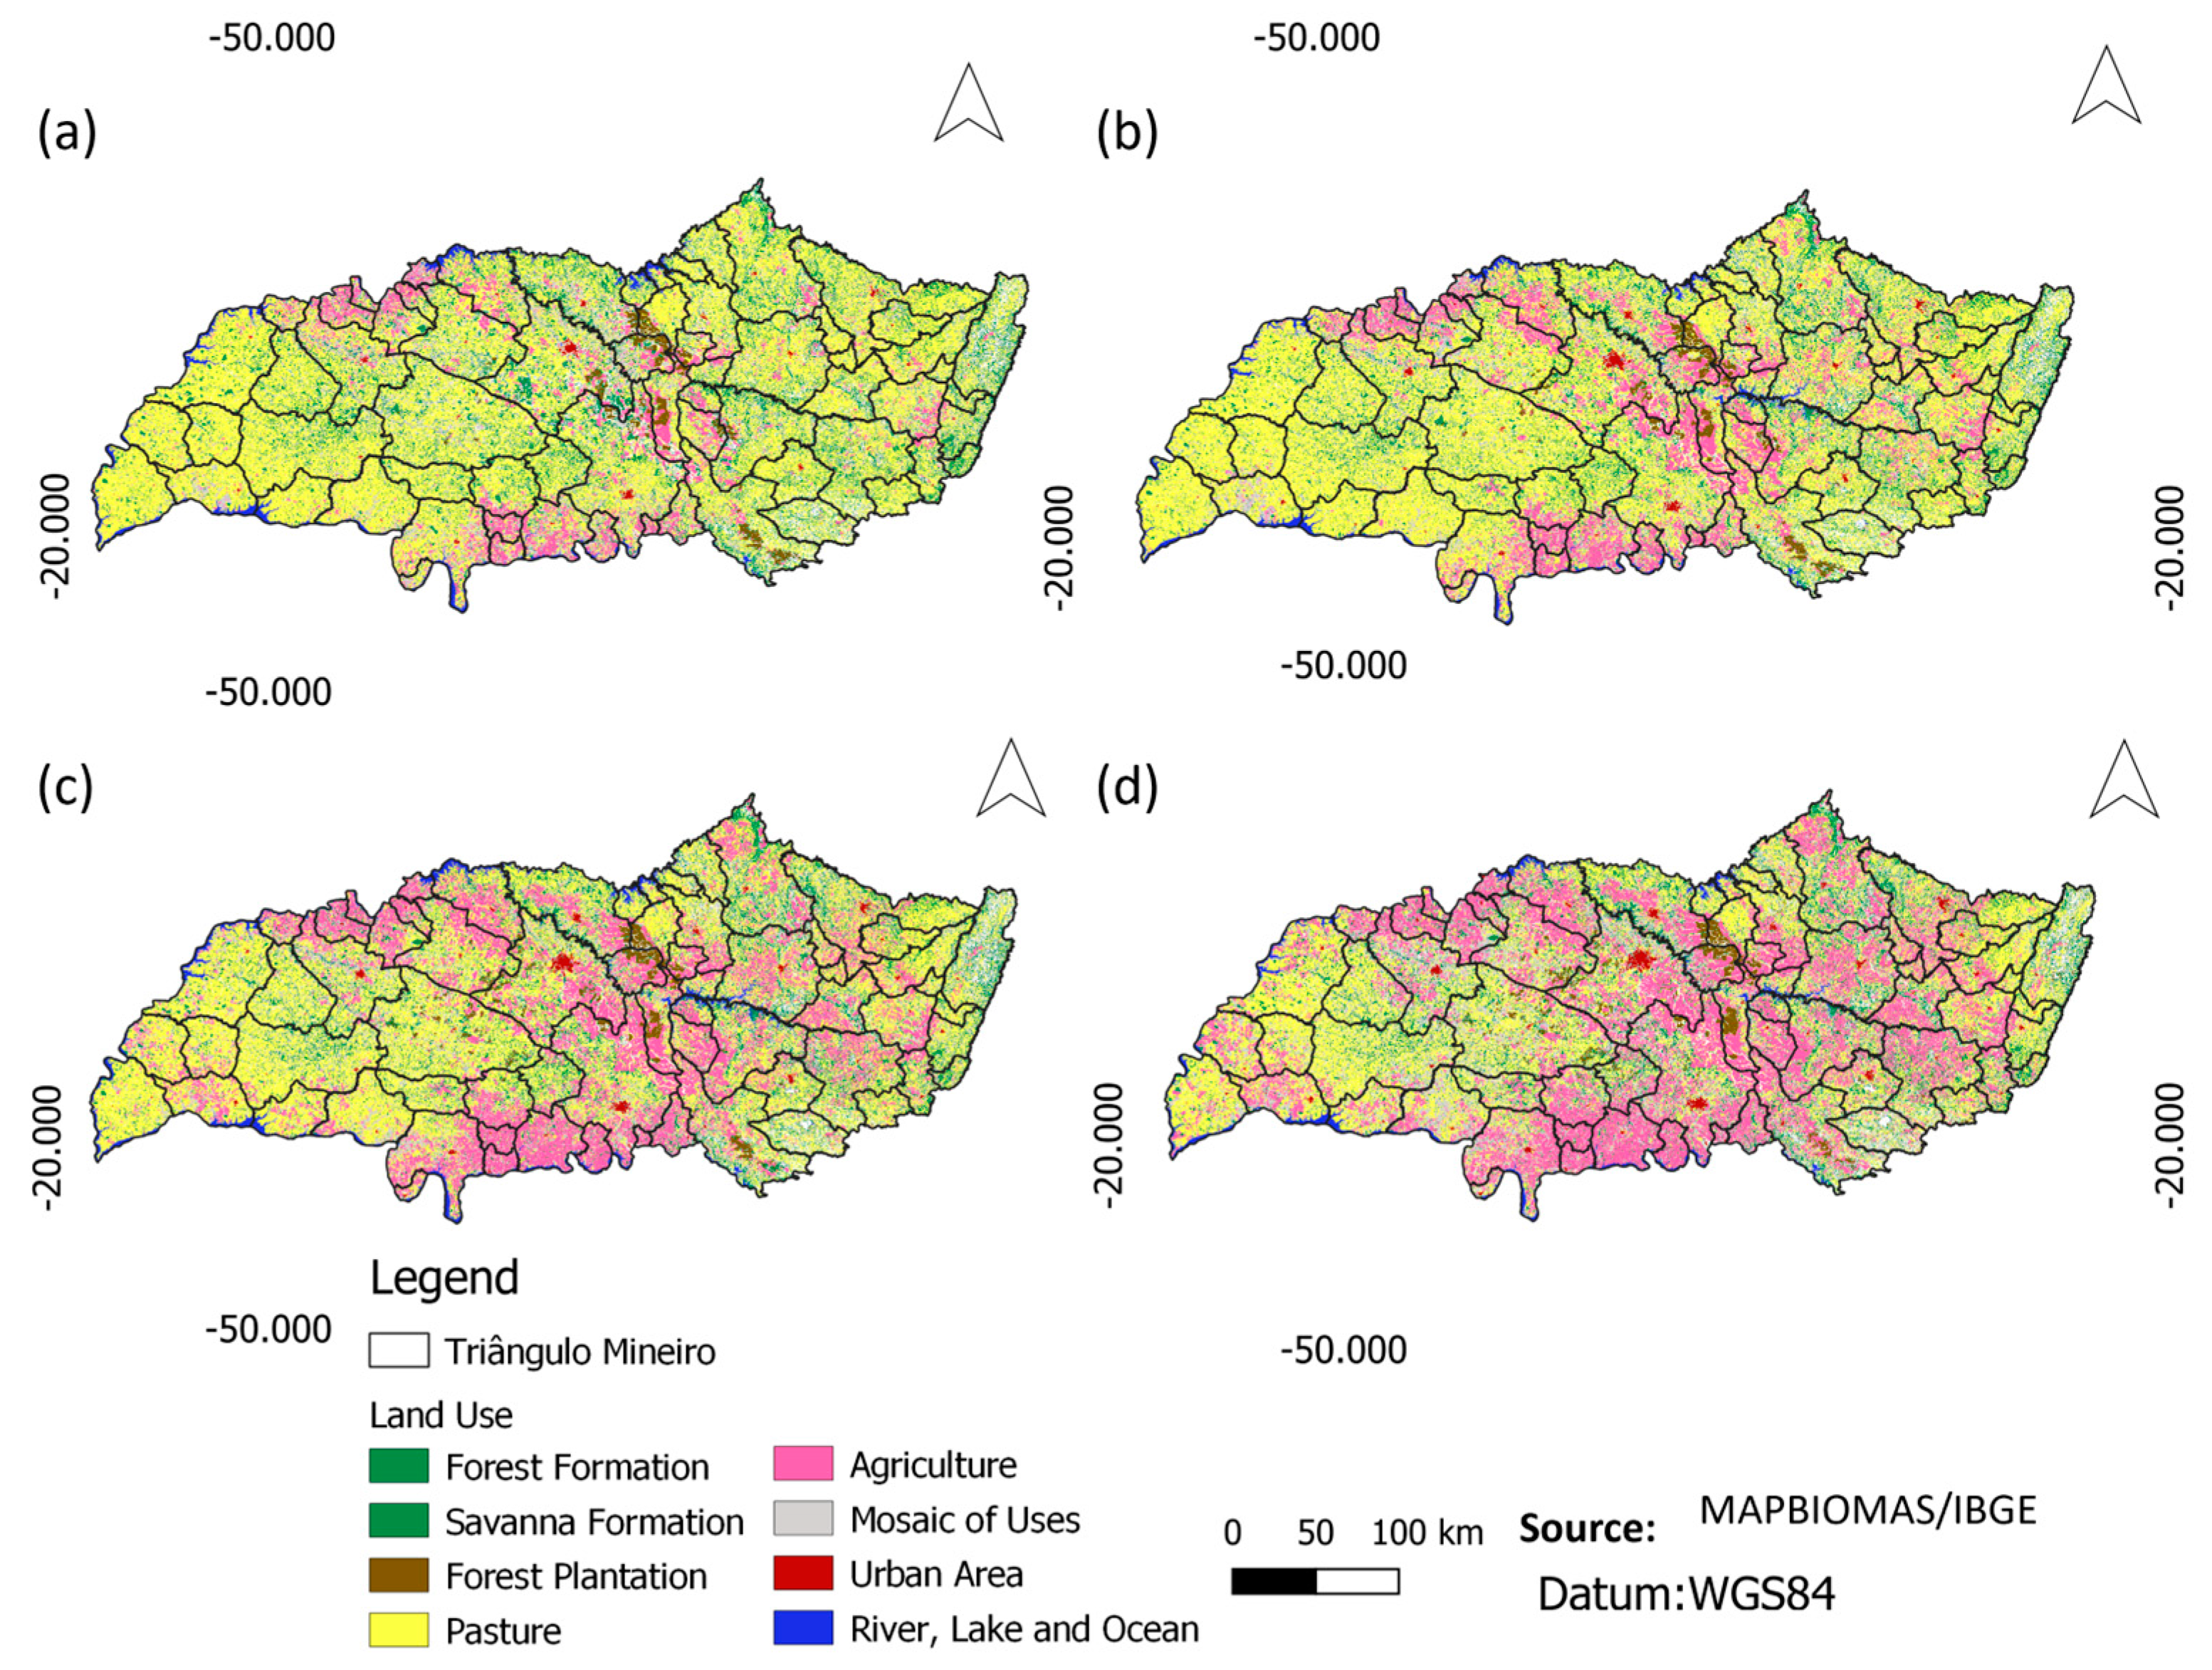
Thise land use/coverage transformation over the 32-year study period (Figure 6a–d) generated conflicting economic, social, and environmental effects.
The conversion of pasture areas into agricultural land between 1990 and 2021 occurred mainly around the region’s main economic hubs, such as Uberaba (62), Uberlândia (63), Coromandel (19), Patrocínio (43), Perdizes (45), Nova Ponte (41), and Frutal (25).
Figure 6a–d depicts land use and land cover transformations over time, highlighting drastic shifts in landscape composition. Between 1990 and 2022, the region experienced a 365% increase in agricultural land, from 619,261 ha to 2260.517 ha, and a 237.59% rise in urban area, expanding from 23,730 ha to 56,382 ha. In contrast, pastureland decreased by 41.62%, falling from 4884.264 ha to 2851.251 ha, while water bodies declined by 5.06%. Forest cover dropped by 8.87%, pointing to ongoing vegetation loss amid intensified land exploitation. In the land cover maps presented in Figure 6, the class “land mosaic use” corresponds to spatially heterogeneous areas composed of mixed land cover types, such as agricultural plots interspersed with remnants of pasture or native vegetation.
These changes are concentrated around agribusiness hubs such as Uberaba, Uberlândia, Patrocínio, and Frutal, driven by the installation of grain-processing facilities, sugarcane mills, ethanol plants, and transport infrastructure investments. The concurrent reduction in natural vegetation and the increase in cultivated surfaces suggest a feedback loop between land use intensification and climate stress, as evidenced by declining rainfall.
Urban growth has accelerated due to the rural exodus recorded since the 1970s. In the Triângulo Mineiro/Alto Paranaíba mesoregion, transportation, energy, telecommunications, and production infrastructure consolidated most intensively near agricultural hubs [34]. Analysis of urban area expansion (237.59%) reveals Uberaba (62) and Uberlândia (63) as dominant centers, exhibiting both the greatest spatial growth and agricultural investment inflows. Although the text reports an 8.87% reduction in native forest cover, there was a significant increase in silviculture areas (155.60%), which represents a reforestation practice for productive, rather than ecological, purposes.
The analyzed precipitation and land use data (Figure 4 and Figure 6) show a decreasing trend in rainfall levels from 1990 to 2021, while areas allocated to agricultural crops expanded in the region.
The Spearman correlation analysis revealed strong relationship between precipitation (mm) and different land use types. Positive correlation values indicate concurrent increases in both variables, while negative values suggest an inverse relation—as one variable increases, the other decreases. This explains the observed negative correlations between both agriculture–precipitation and urban areas–precipitation, demonstrating that the expansion of these land use types coincided with declining rainfall trends during the study period.
Spearman correlation analysis demonstrates that the expansion of agricultural (ρ = −0.51), urban (ρ = −0.51), and silviculture (ρ = −0.36) areas correlates with precipitation reduction, confirming land use changes significantly influence regional water budgets [35]. On the other hand, pasturelands (ρ = 0.52) and water bodies (ρ = 0.46) show positive correlations with precipitation, indicating their preservation supports soil moisture retention and water infiltration [36]. The effects of fast urbanization, growing urban populations, and their activities on both natural and built environments are generating multiple urban impacts—including microclimate alterations and increased thermal discomfort [37]. Land mosaic use (ρ = −0.48) also negatively impacted precipitation, while forest coverage showed minimal correlation (ρ = −0.02), suggesting a negligible direct influence on rainfall variability during the study period.
These results highlight the need for sustainable strategies to mitigate the impacts of agricultural and urban expansion on the water regime, such as the use of agroecological practices, reforestation, and ecological corridor preservation, which are essential for water resources conservation in the region.

4. Discussion

The results of this study confirm a consistent and significant downward trend in average annual precipitation across the Triângulo Mineiro and Alto Paranaíba region between 1990 and 2022. This trend was validated statistically through the Mann–Kendall test, which indicated a statistically significant decrease in rainfall in all 66 municipalities analyzed. These findings are supported by similar regional studies that link reductions in precipitation to both climatic variability and anthropogenic land use changes.
Notably, precipitation remained consistently below the historical average after 2017, suggesting a shift in the local hydrological regime that aligns with broader regional climate change patterns. Regional precipitation in this area is influenced by the Intertropical Convergence Zone (ITCZ) [38]. However, precipitation anomalies during the El Niño and La Niña cycles—characterized by reductions or increases in rainfall, runoff, and moisture convergence [38,39]—demonstrate the complex spatiotemporal variability present in Minas Gerais. This variability can cause atmospheric pattern anomalies [35], especially given southeastern Brazil’s transitional position between climate zones [36], which limits the direct ENSO influence [33]. As emphasized by [29], the Atlantic Ocean further modulates the region’s non-linear responses. This inland dynamic reflects continental influences that reduce moisture retention when compared to coastal zones dominated by oceanic humidity [40].
Land use analysis revealed the clear transformation of the Cerrado biome over the study period, with significant expansion of agricultural and urban areas occurring at the expense of pasturelands and forest cover. The observed 365% increase in cropland and a 237.59% expansion in urban areas were especially pronounced in municipalities with strong agribusiness investments, such as Uberlândia and Uberaba.
This intensification of land use was strongly correlated with precipitation declines, as shown by the negative Spearman correlation coefficients between precipitation and agriculture (ρ = −0.51) and urban areas (ρ = −0.51). These patterns suggest a potential feedback loop, in which land use changes exacerbate climatic stress through alterations in surface albedo, evapotranspiration, and atmospheric moisture recycling. Historical data support this downward trend: Ref. [36] documented rainfall reductions across Mato Grosso, Mato Grosso do Sul, and Goiás beginning in the 1990s, while data from the Global Precipitation Climatology Project reveal a 70 mm reduction in Cerrado precipitation between the periods 1979–1992 and 1993–2006.
The findings also emphasize the role of preserved land cover in maintaining local climatic stability. Positive correlations between precipitation and pasture (ρ = 0.52) and water bodies (ρ = 0.46) indicate that such landscapes contribute to higher levels of water retention and soil moisture. Conversely, the minimal correlation observed with forest areas (ρ = −0.02) may reflect either spatial displacement of the remaining forests or their extent being insufficient to influence regional hydrodynamics.
These insights highlight the urgent need for land management strategies that integrate agroecological practices, promote ecological corridor conservation, and prioritize reforestation efforts to mitigate the negative effects of agricultural intensification on the regional water cycle. Studies such as that of [41] underscore that evapotranspiration sustained by vegetation, even in dry conditions, aggravates local water deficits. Additionally, land use changes amplify precipitation loss and raise annual average temperatures between 0.1 and 3.8 °C, disrupting seasonal stability [42]. Other findings show that changes in dry season duration are influenced by both natural climate oscillations and land transformation [43].
The findings of this study contribute significantly to understanding how land use dynamics affect regional climate, particularly rainfall patterns, in the Cerrado biome. These results have practical applications in environmental policy development, spatial planning, and climate adaptation strategies. By identifying statistically consistent trends between land cover changes and declining precipitation, this study provides critical evidence for policymakers and stakeholders seeking to reconcile agricultural development with environmental sustainability. Such insights may inform the creation of land use regulations, incentive frameworks for conservation practices, and integrated watershed management policies. These dynamics are further complicated by expanding monocultures and biofuel production, which often prioritize export markets over domestic food security [5]. Rapid agricultural expansion has led to soil erosion, temperature increases, reduced evapotranspiration, and precipitation loss [44].
Future projections must consider that current trends, if maintained, could intensify environmental vulnerabilities such as prolonged droughts, reduced water availability for irrigation, and ecosystem imbalance. Therefore, future research should aim to integrate dynamic land–climate models and explore socio-environmental scenarios that account for policy, technological, and land management variables.
Although the results show a 155.60% increase in silviculture areas during the study period, this expansion does not contradict the observed reduction in native forest cover. The silviculture class, as defined by the MapBiomas dataset, refers to managed forest plantations primarily intended for commercial purposes, which are often composed of exotic species and characterized by low ecological diversity. In contrast, the native forest formation class—which includes the remnants of original biome vegetation—recorded a decrease of 8.87%, reinforcing the conclusion that agricultural intensification has occurred at the expense of ecologically relevant forested areas. This distinction underscores the importance of differentiating productive reforestation from the conservation of natural forest ecosystems when evaluating land cover dynamics and their impact on regional climate regulation.
In this context, it is important to acknowledge that agribusiness expansion in the region was driven by grain-processing facilities, sugar and ethanol plants, and infrastructure development in transport and logistics [45], which, alongside technological modernization, reshaped production systems [46]. This transition also elevated demand for secondary sectors, including farm inputs, machinery, and specialized services, while stimulating the need for skilled labor and scientific knowledge diffusion. The methodological approach adopted here is well-suited to regional-scale assessments and serves as a replicable model for other areas experiencing similar land use pressures and climatic sensitivity.

5. Conclusions

The analytical results herein confirm our hypotheses, demonstrating a direct relation between precipitation decline and land use changes in the study region (1990–2022). During this period, annual average precipitation decreased by 32.14%, from 1663.35 mm (1991) to 1128.94 mm (2022), with the downward trend accelerating post-2010. The analysis of land use revealed significant changes, with a significant increase in areas designated for agriculture (365%), forestry (155.60%), land mosaic use (128.43%), and urban areas (237.59%), while pasture areas registered a reduction of 41.62%. These data demonstrate that the intensification of agricultural and urban activities occurred simultaneously with the recorded drop in rainfall rates.
Spearman correlation analysis confirmed this relation, showing positive precipitation correlations for water bodies (ρ = +0.46) and pastures (ρ = +0.52), indicating covarying increases or decreases. Conversely, agriculture (ρ = −0.51) and urbanization (ρ = −0.51) exhibited negative correlations, demonstrating that their expansion was associated with precipitation declines during the study period.
Given this scenario, these results reinforce the need for environmental management strategies that reconcile agricultural expansion with the preservation of water resources. Measures such as the use of agroecological practices, the recovery of degraded areas, and the maintenance of ecological corridors are essential to minimize the impacts of changes in land use on the region’s water regime, ensuring the sustainability of production and the conservation of local ecosystems.

Author Contributions

Conceptualization, A.C.D.B. and D.F.d.S.F.; methodology, D.F.d.S.F.; software, J.A.F.F. and D.F.d.S.F.; validation, B.E.F. and J.A.F.F.; formal analysis, B.E.F. and J.A.F.F.; investigation, A.C.D.B.; resources, J.A.F.F.; data curation, A.C.D.B. and B.E.F.; writing—original draft preparation, A.C.D.B.; writing—review and editing, D.F.d.S.F.; visualization, A.C.D.B.; supervision, D.F.d.S.F.; project administration, D.F.d.S.F.; funding acquisition, D.F.d.S.F. All authors have read and agreed to the published version of the manuscript.

Funding

This research was funded by the Minas Gerais State Research Support Foundation (FAPEMIG), and State University of Minas Gerais, Unity Frutal.

Data Availability Statement

(1) Land use and land cover data were obtained from the MapBiomas platform, available at https://mapbiomas.org/en (accessed on 6 August 2024); (2) Precipitation data for 1990–2021 were retrieved from the ERA5 reanalysis dataset, available through the European Centre for Medium-Range Weather Forecasts (ECMWF) at https://cds.climate.copernicus.eu/ (accessed on 6 May 2024); (3) For the years 2020 and 2021, precipitation data were supplemented with NASA POWER data, available at https://power.larc.nasa.gov/ (accessed on 6 June 2024); (4) All data were processed using the Google Earth Engine platform, accessible at https://earthengine.google.com (accessed on 26 August 2024). The custom code used for data processing is available upon request from the corresponding author.

Conflicts of Interest

The authors declare no conflicts of interest.

References

  1. IPCC. Climate Change 2014: Synthesis Report. Contribution of Working Groups I, II and III to the Fifth Assessment Report of the Intergovernmental Panel on Climate Change, 1st ed.; Pachauri, R.K., Meyer, L.A., Eds.; IPCC: Geneva, Switzerland, 2014; pp. 1–151. [Google Scholar]
  2. De Marco, P., Jr.; Villén, S.; Mendes, P.; Nóbrega, C.; Cortes, L.; Castro, T.; Souza, R. Vulnerability of Cerrado Threatened Mammals: An Integrative Landscape and Climate Modeling Approach. Biodivers. Conserv. 2020, 29, 1637–1658. [Google Scholar] [CrossRef]
  3. FAO—Food and Agriculture Organization of the United Nations. Livestock and Environment. Available online: http://www.fao.org/livestock-environment/en/ (accessed on 15 November 2023).
  4. Perugini, L.; Caporaso, L.; Marconi, S.; Cescatti, A.; Quesada, B.; De Noblet-Ducoudré, N.; House, J.I.; Arneth, A. Biophysical Effects on Temperature and Precipitation Due to Land Cover Change. Environ. Res. Lett. 2017, 12, 053002. [Google Scholar] [CrossRef]
  5. Campos, J.D.O.; Chaves, H.M.L. Tendências e Variabilidades nas Séries Históricas de Precipitação Mensal e Anual no Bioma Cerrado no Período 1977–2010. Rev. Bras. Meteorol. 2020, 35, 157–169. [Google Scholar] [CrossRef]
  6. Urban, M.C.; Bocedi, G.; Hendry, A.P.; Mihoub, J.B.; Pe’er, G.; Singer, A.; Bridle, J.R.; Grozier, L.G.; Meester, L.; Godsoe, W.; et al. Improving the Forecast for Biodiversity under Climate Change. Science 2016, 353, aad8466. [Google Scholar] [CrossRef] [PubMed]
  7. Arantes, A.E.; Ferreira, L.G.; Coe, M.T. The Seasonal Carbon and Water Balances of the Cerrado Environment of Brazil: Past, Present, and Future Influences of Land Cover and Land Use. ISPRS J. Photogramm. Remote Sens. 2016, 117, 66–78. [Google Scholar] [CrossRef]
  8. Salmona, Y.B.; Matricardi, E.A.T.; Skole, D.L.; Silva, J.F.A.; Coelho Filho, O.A.; Pedlowski, M.A.; Sampaio, J.M.; Ramírez, L.C.C.; Brandão, R.A.; Silva, A.L.; et al. A worrying future for river flows in the Brazilian Cerrado provoked by land use and climate changes. Sustainability 2023, 15, 4251. [Google Scholar] [CrossRef]
  9. Silva, C.O.F.; Manzione, R.L.; Caldas, M.M. Net water flux and land use shifts across the Brazilian Cerrado between 2000 and 2019. Reg. Environ. Change 2023, 23, 151. [Google Scholar] [CrossRef]
  10. Fushimi, M.; de Lima, G.N.; Capoane, V. Changes in land use and cover and their environmental impacts in the Cerrado of Mato Grosso do Sul, Brazil. Sustainability 2024, 16, 4266. [Google Scholar] [CrossRef]
  11. Moraes, R.A.; Rocha, J.V.; Lamparelli, R.A.C. Determination of Total Accumulated Rainfall, Global Radiation, Evapotranspiration and Degree-Days Originated from the ECMWF Model to Sugar Cane Crop. Eng. Agríc. 2014, 34, 322–331. [Google Scholar] [CrossRef]
  12. Mahdianpari, M.; Tamiminia, H.; Saleshi, B.; Quackenbush, L.; Adeli, S.; Brisco, B. Google Earth Engine for Geo-Big Data Applications: A Meta-Analysis and Systematic Review. ISPRS J. Photogramm. Remote Sens. 2020, 164, 152–170. [Google Scholar]
  13. Kumar, L.; Mutanga, O. Google Earth Engine Applications Since Inception: Usage, Trends, and Potential. Remote Sens. 2018, 10, 1509. [Google Scholar] [CrossRef]
  14. Gorelick, N.; Hancher, M.; Dixon, M.; Ilyushchenko, S.; Thau, D.; Moore, R. Google Earth Engine: Planetary-Scale Geospatial Analysis for Everyone. Remote Sens. Environ. 2017, 202, 18–27. [Google Scholar] [CrossRef]
  15. Sharnagat, N.; Nema, A.K.; Mishra, P.K.; Patidar, N.; Kumar, R.; Suryawanshi, A.; Radha, L. State-of-the-art status of Google Earth Engine (GEE) application in land and water resource management: A scientometric analysis. J. Geovis. Spat. Anal. 2025, 9, 16. [Google Scholar] [CrossRef]
  16. Wilson, D.D.; Tefera, G.W.; Ray, R.L. Application of Google Earth Engine to monitor greenhouse gases: A review. Data 2025, 10, 8. [Google Scholar] [CrossRef]
  17. Ferreira Filho, D.F.; Bezerra, P.E.S.; Silva, M.N.A.; Rodrigues, R.S.S.; Figueiredo, N.M. Aplicação de Técnicas de Interpolação para Espacialização de Chuvas da Rede Hidrográfica: Estudo de Caso Calha Norte–PA. Rev. Bras. Climatol. 2019, 24. [Google Scholar] [CrossRef]
  18. Instituto Brasileiro de Geografia e Estatística (IBGE). Malhas Territoriais. Available online: https://www.ibge.gov.br/geociencias/organizacao-do-territorio/malhas-territoriais/15774-malhas.html?edicao=43129&t=downloads (accessed on 28 May 2023).
  19. Cleps, G.D.G.; De Amorim, P.H.S. A Economia Solidária e sua Expansão na Mesorregião do Triângulo Mineiro e Alto Paranaíba–MG. Caminhos Geogr. 2018, 19, 349–360. [Google Scholar] [CrossRef]
  20. Lopes, R.P.M.; Quaresma, M.P. Desempenho Fiscal dos Municípios: Uma Análise Comparativa para as Mesorregiões do Norte de Minas e Triângulo Mineiro. Rev. Binac. Bras. Argent. Diálogo Cienc. 2023, 12, 293–319. [Google Scholar]
  21. Fundação João Pinheiro (FJP). Produto Interno Bruto dos Municípios de Minas Gerais, 1st ed.; Diretoria de Estatística e Informações: Belo Horizonte, Brazil, 2022. [Google Scholar]
  22. Moraes, R.F. Análise das Mudanças do Uso e da Cobertura da Terra em Municípios com Áreas de Mineração na Microrregião de Itabira a partir de Dados do MAPBIOMAS entre 1987 e 2017. Rev. Eng. Interes. Soc. 2020, 5, 77–96. [Google Scholar] [CrossRef]
  23. MapBiomas. Projeto MapBiomas—Coleção 3.1 da Série Anual de Mapas de Cobertura e Uso de Solo do Brasil. Available online: http://mapbiomas.org/pages/database/mapbiomas_collection (accessed on 15 June 2023).
  24. Stackhouse, P.W.; MacPherson, B.; Broddle, M.; McNeil, C.; Barnett, A.J.; Mikovitz, C.; Zhang, T. Introduction to the Prediction of Worldwide Energy Resources (POWER) Project. In Proceedings of the NASA Applied Sciences Week 2021, Online, 2–3 October 2021. [Google Scholar]
  25. Ahmad, I.; Tang, D.; Wang, T.F.; Wang, M.; Wagan, B. Precipitation trends over time using Mann-Kendall and Spearman’s rho tests in Swat River Basin, Pakistan. Adv. Meteorol. 2015, 2015, 431860. [Google Scholar] [CrossRef]
  26. Triola, M.F. Introdução à Estatística, 12th ed.; LTC: Rio de Janeiro, Brazil, 2017. [Google Scholar]
  27. Mann, H.B. Non-parametric test against trend. Econometrica 1945, 13, 245–259. [Google Scholar] [CrossRef]
  28. Kendall, M.G. Rank Correlation Methods, 4th ed.; Charles Griffin: London, UK, 1975. [Google Scholar]
  29. Alves, M.P.A.; Zavattini, J.A.; Minuzzi, R.B. Ondas de frio e impactos na produtividade da maçã São Joaquim (SC-Brasil). Rev. Bras. Climatol. 2022, 30, 817–844. [Google Scholar] [CrossRef]
  30. Santos, V.O.; Nishiyama, L. Tendências hidrológicas no alto curso da bacia hidrográfica do rio Uberaba, em Minas Gerais. Caminhos Geogr. 2016, 17, 196–212. [Google Scholar]
  31. Spera, S.A.; Galford, G.L.; Coe, M.T.; Macedo, M.N.; Mustard, J.F. Land use change affects water recycling in Brazil’s last agricultural frontier. Glob. Change Biol. 2016, 22, 3405–3413. [Google Scholar] [CrossRef] [PubMed]
  32. Debortoli, N.S.; Dubreuil, V.; Hirota, M.; Rodrigues-Filho, S.; Lindoso, D.P.; Nabucet, J. Detecting deforestation impacts in Southern Amazonia rainfall using rain gauges. Int. J. Climatol. 2016, 37, 2889–2900. [Google Scholar] [CrossRef]
  33. Silva, N.R.; Mendes, P.C. O geoprocessamento na identificação dos pontos de alagamentos e inundações na área urbana de Uberlândia-MG no período de 2011 a 2016. Braz. Geogr. J. 2018, 9, 119–136. [Google Scholar]
  34. Santos, H.F. Modernização da Agricultura e Dinâmica do Agronegócio Globalizado no Triângulo Mineiro/Alto Paranaíba. Geogr. Quest. 2019, 12. Available online: https://www.researchgate.net/publication/335055018_MODERNIZACAO_DA_AGRICULTURA_E_DINAMICA_DO_AGRONEGOCIO_GLOBALIZADO_NO_TRIANGULO_MINEIROALTO_PARANAIBA (accessed on 15 June 2023).
  35. Lawrence, D.; Vandecar, K. Effects of tropical deforestation on climate and agriculture. Nat. Clim. Change 2015, 5, 27–36. [Google Scholar] [CrossRef]
  36. Minuzzi, R.B. Variabilidade climática do período chuvoso e durante anos de El Niño Oscilação Sul no município de Corinto, em Minas Gerais. In Recursos Naturais: Estudos & Aplicações, 1st ed.; Francisco, P.R.M., Medeiros, P.C., Santos, C.S., Ritá, F.S., Marques, R.F.P.V., Rodrigues, L.S., Santana, H.C., Alves, G.S., Eds.; EPTEC: Campina Grande, Brazil, 2023; pp. 6–17. [Google Scholar]
  37. Grimm, A.M.; Tedeschi, R.G. ENSO and extreme rainfall events in South America. J. Clim. 2009, 22, 1589–1609. [Google Scholar] [CrossRef]
  38. Santos, A.A.; Cestonaro, T. Diagnóstico da elaboração dos planos de arborização urbana dos municípios do estado do Paraná. Paisag. Ambiente 2022, 33, e188661. [Google Scholar] [CrossRef]
  39. Medeiros, F.J.; Oliveira, C.P. Dynamical aspects of the recent strong El Niño events and its climate impacts in Northeast Brazil. Pure Appl. Geophys. 2021, 178, 2315–2332. [Google Scholar] [CrossRef]
  40. Keys, P.W.; Collins, P.M.; Chaplin-Kramer, R.; Wang-Erlandsson, L. Atmospheric water recycling: An essential feature of critical natural asset stewardship. Glob. Sustain. 2024, 7, e2. [Google Scholar] [CrossRef]
  41. Franco, A.C.; Rossatto, D.R.; Silva, L.C.R.; Ferreira, C.S. Cerrado vegetation and global change: The role of functional types, resource availability and disturbance in regulating plant community responses to rising CO2 levels and climate warming. Theor. Exp. Plant Physiol. 2014, 26, 19–38. [Google Scholar] [CrossRef]
  42. Wang, G.; Sun, S.; Mei, R. Vegetation dynamics contributes to the multi-decadal variability of precipitation in the Amazon region. Geophys. Res. Lett. 2011, 38, 1–5. [Google Scholar] [CrossRef]
  43. Marengo, J.A.; Nobre, C.A.; Seluchi, M.E.; Cuartas, A.; Alves, L.M.; Mendiondo, E.M.; Obregón, G.; Sampaio, G. A seca e a crise hídrica de 2014–2015 em São Paulo. Rev. USP 2015, 106, 31–44. [Google Scholar] [CrossRef]
  44. Lee, J.E.; Lintner, B.R.; Boyce, C.K.; Lawrence, P.J. Land use change exacerbates tropical South American drought by sea surface temperature variability. Geophys. Res. Lett. 2011, 38, 1–6. [Google Scholar] [CrossRef]
  45. Rivani, H.; Utsumi, A.G. Mapeamento de Campos de Murundus na Bacia do Rio Claro (MG) utilizando o Google Earth Engine. Rev. Geoaraguaia 2023, 13, 114–130. [Google Scholar]
  46. Buainain, A.M.; Alves, E.; Silveira, J.M.J.; Navarro, Z. O Mundo Rural no Brasil do século 21: A Formação de um novo Padrão Agrário e Agrícola; Embrapa: Brasília, DF, Brazil, 2014. [Google Scholar]
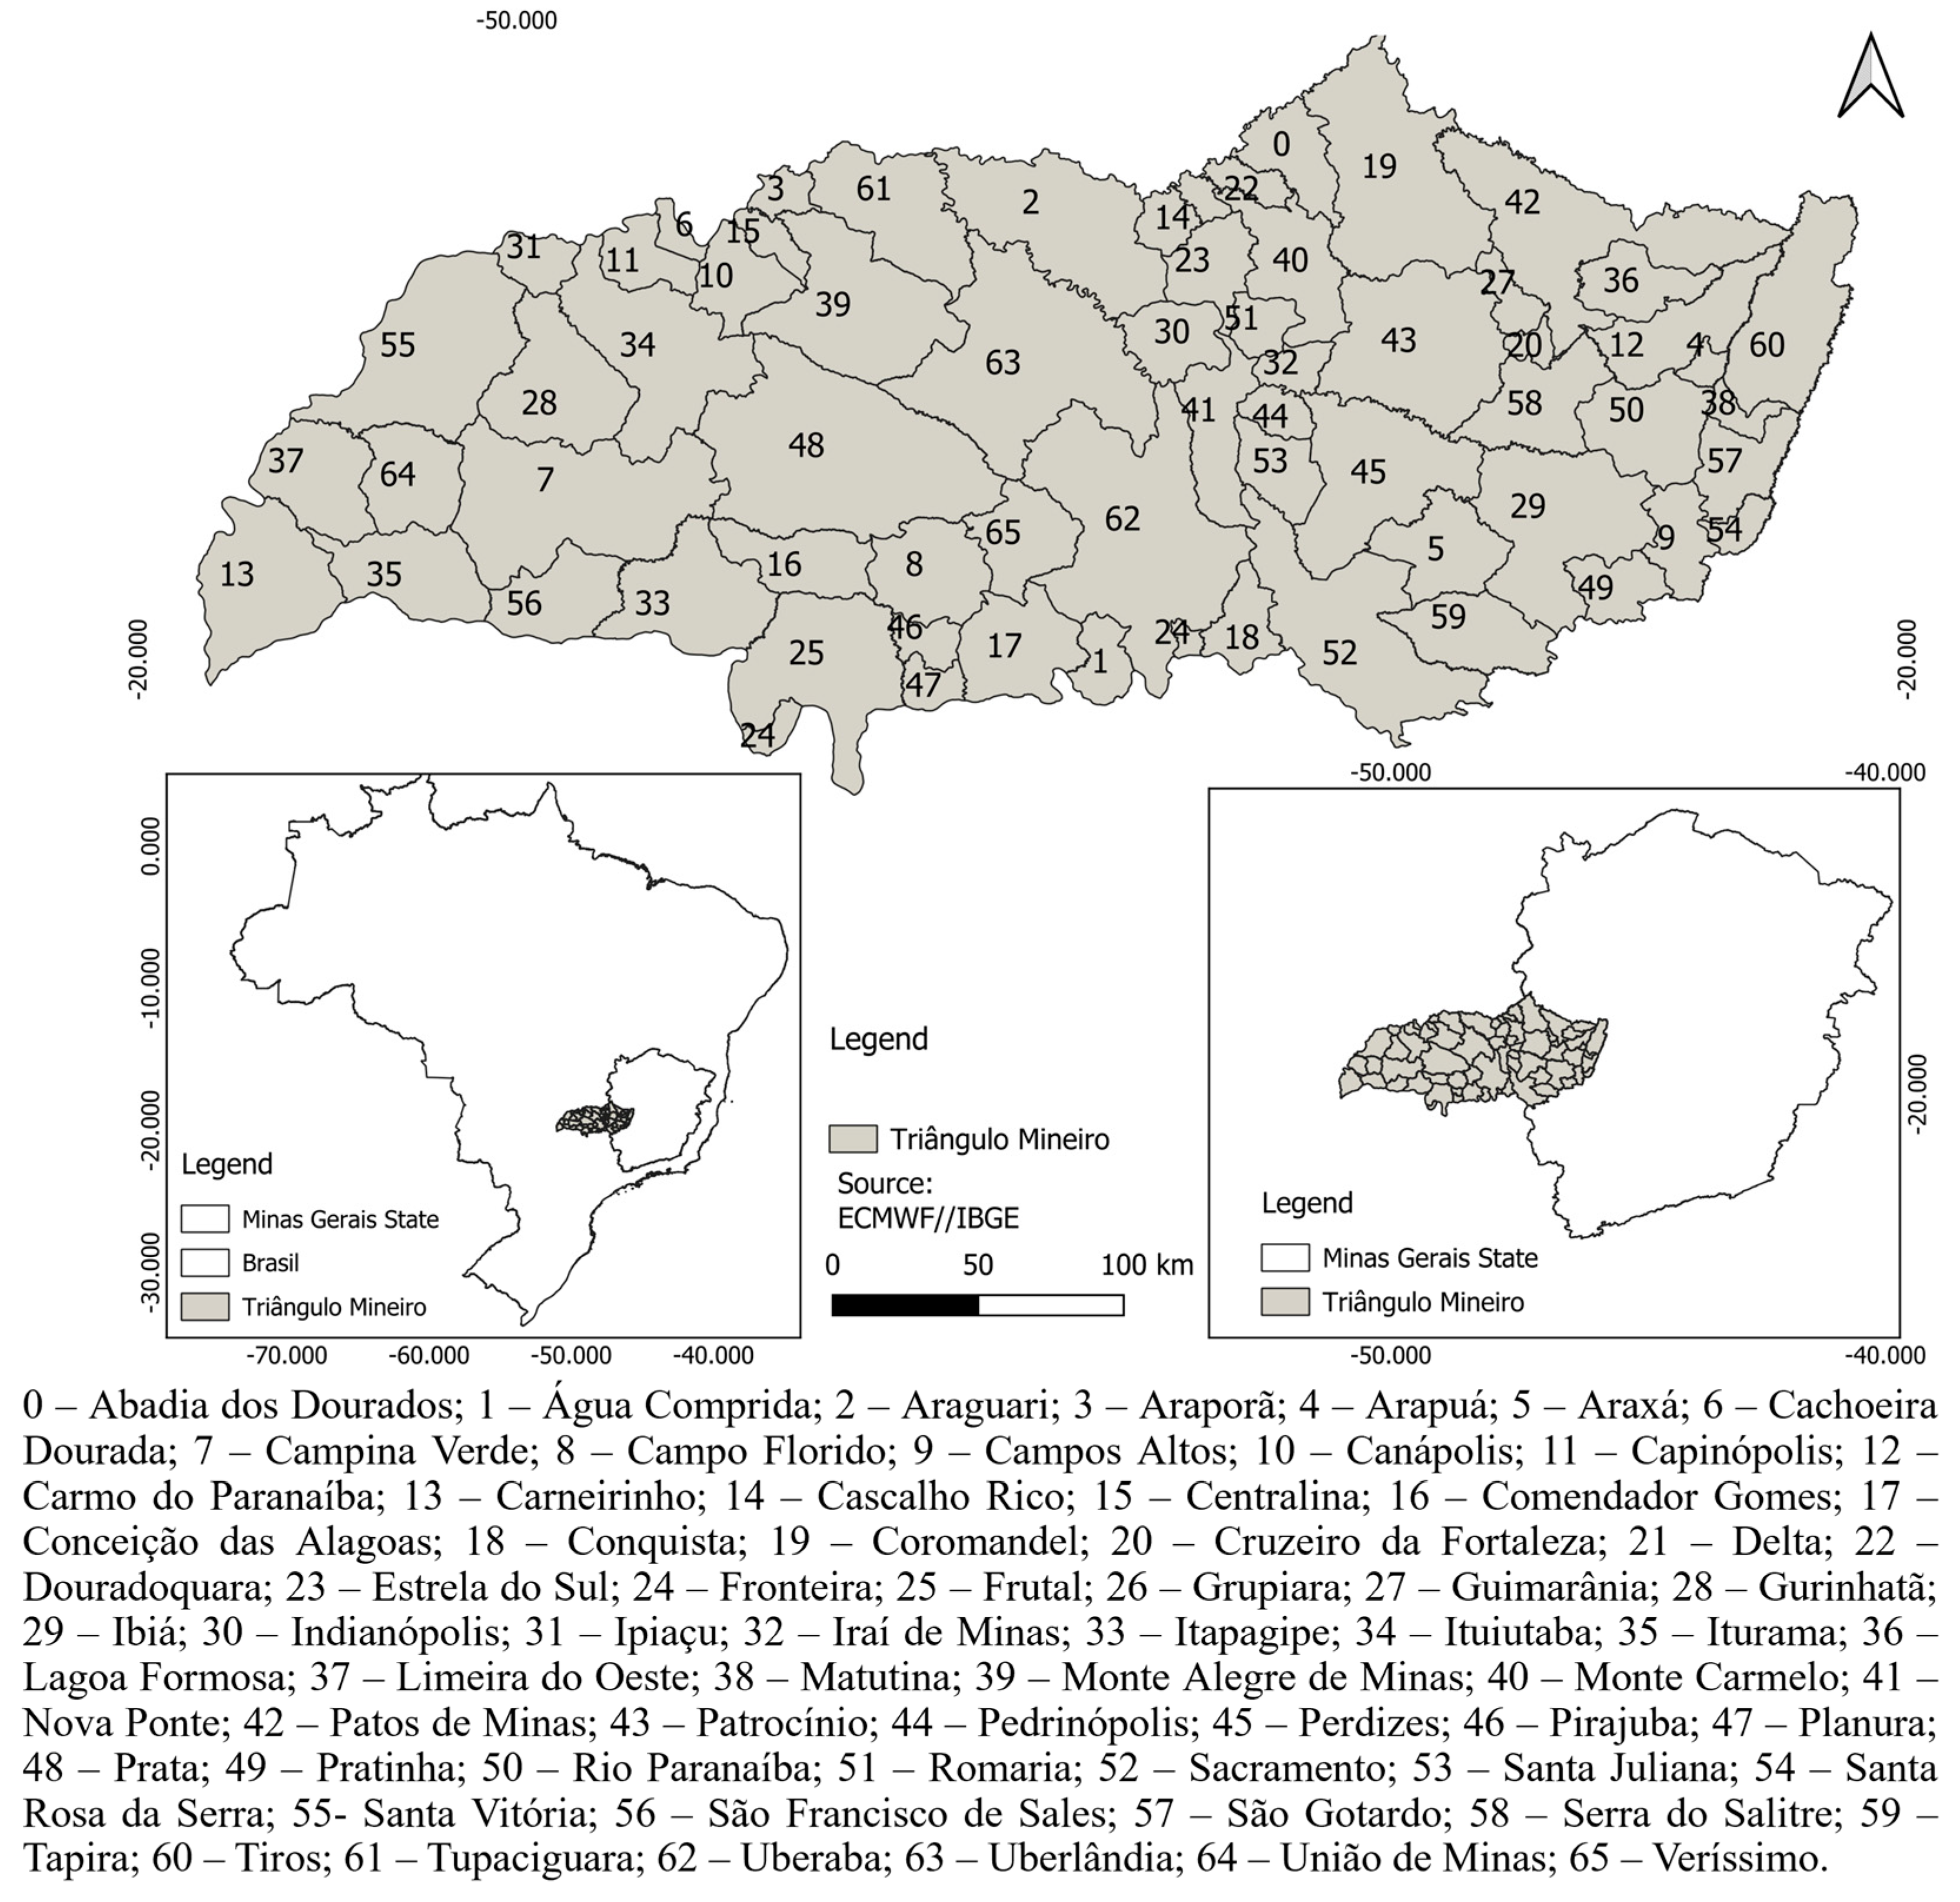
Figure 1. Location of the study area.
Remotesensing 17 02866 g001
Figure 2. Methodological workflow.
Remotesensing 17 02866 g002
Figure 3. Data collection points for accumulated rainfall (1990–2021).
Remotesensing 17 02866 g003
Figure 4. Spatial distribution of accumulated rainfall for (a) 1990, (b) 2000, (c) 2010, and (d) 2022.
Remotesensing 17 02866 g004
Figure 5. Cluster dendrogram illustrating the similarity grouping of the wettest and driest years in the Triângulo Mineiro/Alto Paranaíba region (1990–2022). The dendrogram highlights temporal patterns in precipitation extremes, wherein drier years (particularly 2018–2021) are clustered together, suggesting potential links to agricultural land expansion. This visualization aids in identifying distinct periods with similar climatic behavior and supports the analysis of land use impacts on rainfall variability.
Remotesensing 17 02866 g005
Figure 6. Land coverage/use maps of Triângulo Mineiro/Alto Paranaíba for 1990 (a), 2000 (b), 2010 (c), and 2022 (d).
Remotesensing 17 02866 g006
Table 2. Statistical tests of annual precipitation series for the Triângulo Mineiro/Alto Paranaíba municipalities. Significance level: 0.05% and “ns” (data do not exhibit normality).
Municipality012345678910
Normalitynsnsnsnsnsnsnsnsnsnsns
Mann-Kendall−0.45−0.49−0.45−0.45−0.45−0.49−0.45−0.49−0.49−0.49−0.45
TrendTSDTSDTSDTSDTSDTSDTSDTSDTSDTSDTSD
Municipality1112131415161718192021
Normalitynsnsnsnsnsnsnsnsnsnsns
Mann–Kendall−0.49−0.45−0.49−0.45−0.45−0.49−0.49−0.49−0.49−0.49−0.49
Trend TSDTSDTSDTSDTSDTSDTSDTSDTSDTSDTSD
Municipality2223242526272829303132
Normalitynsnsnsnsnsnsnsnsnsnsns
Mann–Kendall−0.49−0.45−0.49−0.49−0.49−0.49−0.49−0.49−0.45−0.49−0.49
Trend TSDTSDTSDTSDTSDTSDTSDTSDTSDTSDTSD
Municipality3334353637383940414243
Normalitynsnsnsnsnsnsnsnsnsnsns
Mann–Kendall−0.49−0.49−0.49−0.45−0.49−0.49−0.49−0.45−0.49−0.45−0.45
TrendTSDTSDTSDTSDTSDTSDTSDTSDTSDTSDTSD
Municipality4445464748495051525354
Normalitynsnsnsnsnsnsnsnsnsnsns
Mann–Kendall−0.49−0.45−0.49−0.49−0.49−0.49−0.45−0.49−0.49−0.49−0.49
Trend TSDTSDTSDTSDTSDTSDTSDTSDTSDTSDTSD
Municipality5556575859606162636465
Normalitynsnsnsnsnsnsnsnsnsnsns
Mann–Kendall−0.49−0.49−0.49−0.49−0.49−0.45−0.45−0.49−0.49−0.49−0.49
Trend TSDTSDTSDTSDTSDTSDTSDTSDTSDTSDTSD
Disclaimer/Publisher’s Note: The statements, opinions and data contained in all publications are solely those of the individual author(s) and contributor(s) and not of MDPI and/or the editor(s). MDPI and/or the editor(s) disclaim responsibility for any injury to people or property resulting from any ideas, methods, instructions or products referred to in the content.