Article

Spatiotemporal Evolution and Differentiated Spatial Governance of Slope-Classified Cultivated Land Fragmentation in Rapid Urbanization: Machine Learning-Driven Insights from Guangdong Province

1
Department of Land Management, School of Public Affairs, Zhejiang University, Hangzhou 310058, China
2
Sustainability Assessment of Food and Agricultural Systems, School of Life Sciences, Technical University of Munich, 85354 Freising, Germany
3
Land Academy for National Development, Zhejiang University, Hangzhou 310058, China
*
Author to whom correspondence should be addressed.
Remote Sens. 2025, 17(16), 2855; https://doi.org/10.3390/rs17162855
Submission received: 8 July 2025 / Revised: 14 August 2025 / Accepted: 14 August 2025 / Published: 16 August 2025
(This article belongs to the Special Issue Remote Sensing Measurements of Land Use and Land Cover)

Abstract

Rapid urbanization exerts immense pressure on cultivated land. Among these, slope-classified cultivated land (referring to cropland categorized by slope gradients) is especially vulnerable to fragmentation due to its ecological fragility, challenging utilization, and critical role in soil conservation and sustainable agriculture. This study explores the spatiotemporal dynamics and driving mechanisms of slope-classified cultivated land fragmentation (SCLF) in Guangdong Province, China, from 2000 to 2020. Using multi-temporal geospatial data, machine learning interpretation, and socioeconomic datasets, this research quantifies the spatiotemporal changes in SCLF, identifies key drivers and their interactions, and proposes differentiated protection strategies. The results reveal the following: (1) The SCLF decreased in the Pearl River Delta, exhibited “U-shaped” fluctuations in the west and east, and increased steadily in northern Guangdong. (2) The machine learning interpretation highlights significantly amplified synergistic effects among drivers, with socioeconomic factors, particularly agricultural mechanization and non-farm employment rates, exerting dominant influences on fragmentation patterns. (3) A “core–transitional–marginal” protection framework is proposed, intensifying the land use efficiency and ecological resilience in core areas, coupling land consolidation with green infrastructure in transitional zones, and promoting agroecological diversification in marginal regions. This research proposed a novel framework for SCLF, contributing to cultivated land protection and informing differentiated spatial governance in rapidly urbanizing regions.

1. Introduction

Under the dual pressures of global population growth and resource constraints, the spatial pattern evolution of cultivated land resources, as a fundamental strategic resource for human survival and development, profoundly influences both food security and ecosystem service functions [1,2]. In recent years, cultivated land fragmentation (CLF), as a visible manifestation of human–land relationship conflicts, has evolved from mere morphological changes in land parcels to systemic risks threatening agricultural sustainability. As a complex phenomenon emerging from human–land system interactions, CLF encompasses dual attributes of spatial morphological differentiation and land tenure [3]. Spatially, CLF manifests as the spatial deconstruction of contiguous farmland, where originally continuous and homogeneous cultivated land is divided into smaller, irregularly shaped, and spatially discrete patches [4,5]. This physical fragmentation directly constrains the mechanization efficiency and economies of scale in agricultural operations [6,7]. From the tenure dimension, CLF emphasizes the dispersion of land tenure, including both the spatial discontinuity of farmers’ ownership and operational rights [8] and the complexity of property relations arising from multi-stakeholder land sharing [9,10].
Recently, more studies have focused on a refined perspective: slope-classified cultivated land fragmentation (SCLF). SCLF specifically examines how slope gradients affect fragmentation patterns and is crucial for understanding the spatial heterogeneity of cultivated land fragmentation across different altitudinal zones. This concept transcends the “homogeneous spatial assumption” found in traditional CLF frameworks and incorporates the dynamic interaction between topographic factors and land use practices. The slope gradient is a critical determinant of cultivated land fragmentation, influencing patterns through physical barriers, policy responses, and technological adaptations [11]. For instance, in regions with steep slopes, fragmentation is more severe due to limited accessibility, whereas in flatter areas, it may be driven by other factors, such as economic or demographic pressures. SCLF offers a nuanced approach to understanding land use dynamics, shedding light on the complex interplay between topography and human activity [12].
The formation of CLF and its sub-dimension, SCLF, is driven by a complex interplay of natural geographic conditions, land use institutions, and socioeconomic development. These driving factors exhibit substantial spatial heterogeneity [10,13,14,15]. For instance, in peri-urban plains, CLF is largely driven by urban expansion and infrastructure development, while in hilly and mountainous regions, a fragmented terrain and dispersed land distribution are the primary causes [16]. In economically developed areas, frequent farmland transfer and pressure from non-agricultural land use contribute to intensified fragmentation. In contrast, in less developed regions with a severe population outflow, CLF is more often caused by land abandonment, reduced utilization rates, and weakened farming capacity [17]. Cultivated land use patterns also vary considerably due to geographical conditions and cropping structures. For example, mountainous areas with rugged terrain and complex hydrological features are more prone to severe land fragmentation [17], whereas regions dominated by grain crop cultivation typically show lower levels of CLF and a high degree of spatial aggregation [18]. CLF hampers the progress of agricultural mechanization, reduces productivity, and significantly increases farming costs [6]. Furthermore, rural production and living conditions, such as the interspersion of cultivated land and settlements, the spatial barrier effect of linear features, and plot sizes, play critical roles in shaping the spatial patterns of farmland fragmentation [19].
Current macro-scale evaluation systems for CLF primarily rely on physical boundaries and distinct land patches. This fragmented form is readily identifiable and measurable. Based on the spatial differences in cultivated land functions, the physical fragmentation characteristics of cultivated land can be quantified using landscape pattern indices, such as the patch density (PD), Mean Patch Size (MPS), edge density (ED), and Shape Index (SI). These metrics enable the intuitive identification of phenomena like patch size reductions, shape complexity, and spatial isolation and facilitate the linkage to ecosystem services [14,18,20]. Methods employing single indices, composite indices, and landscape pattern indices are commonly used to assess CLF [21,22]. Among these, the single-index evaluation method can effectively measure the physical attributes of individual plots but tends to overlook other essential attributes of CLF [23]. Conversely, composite index methods offer an enhanced precision in measuring CLF [24], and the scattered landscape pattern characteristics of cultivated land have garnered significant academic attention, encompassing its location, shape, size, and spatial distribution [25]. Existing studies demonstrate a significant nonlinear correlation between topographic complexity and cultivated land fragmentation indices [11]. The slope gradient, as a critical topographic factor, drives the formation of differentiated fragmentation patterns across altitudinal zones through a tripartite coupling pathway, physical barriers, policy responses, and technological adaptations, which reveals limitations in conventional CLF indicator systems. The fragmentation effect induced by policy implementation exposes gentle-slope zones undertaking grain-for-green compensation to dual risks of intensified fragmentation and diminished ecosystem services [20]. Constructing long-term sequence analysis models under a slope differentiation framework not only deciphers the interactive feedback mechanisms between topographic constraints and human activities but also provides spatially targeted evidence for developing slope-oriented cultivated land protection and ecological restoration strategies [12].
China’s average cultivated land parcel size has decreased by nearly 40% compared to the late 20th century, with the fragmentation index in the Southwest Karst region being 25 times higher than that in the Northeast Plain region, demonstrating significant topographic gradient disparities [26]. This spatial change not only constrains grain productivity improvement by reducing agricultural machinery efficiency [6,14], but also leads to habitat fragmentation and non-point source pollution dispersion through landscape edge effects [27,28]. Currently, China’s per capita cultivated land area stands at merely 45% of the global average [29], while the expansion of construction land has led to a decline in the contiguous degree of cultivated land in the economically active Pearl River Delta region, with the highest urbanization rate [30]. The compounding effects of “quantitative rigid constraints” and “qualitative elastic depletion” in cultivated land systems makes food security risks a novel challenge for spatial governance, urgently necessitating the establishment of collaborative mechanisms for cultivated land protection. This study selects Guangdong Province as a representative region for investigating SCLF. Guangdong features a stepped topographic gradient encompassing the Pearl River Delta (PRD) plains and northern mountainous areas, providing a natural laboratory for elucidating spatial differentiation patterns of fragmentation under topographic constraints. Moreover, as China’s most urbanized province with high cropland conversion rates [31], its rapid industrialization has generated distinctive SCLF characteristics: elevated proportions of high-slope farmland and intensive construction land expansion. These conditions create a compound mechanism where fragmentation emerges from policy interventions and market forces. However, despite these unique conditions, limited research has systematically examined how SCLF varies across slope gradients in rapidly urbanizing regions and how such patterns relate to both policy and socioeconomics. Addressing this gap, this study aims to (1) quantify the spatiotemporal dynamics of cultivated land fragmentation across slope gradients in rapidly urbanizing regions; (2) identify the driving factors of SCLF in different regions; and (3) reconcile the topographic carrying capacity with sustainable intensification needs, providing spatially differentiated solutions for cultivated land protection.

2. Materials and Methods

2.1. Study Area

Guangdong Province is located along the southern coast of China (Figure 1), administratively encompassing 21 cities with a total area of 17.98 × 10⁴ km2. The terrain exhibits significant elevational gradients, ranging from 0 to 1887 m, descending progressively from north to south. The northern region is dominated by mountainous landscapes, while the central area comprises the Pearl River Delta alluvial plain. The eastern and western flanks feature coastal plains and hilly topography. Climatically, the province is predominantly influenced by a subtropical monsoon climate, with localized tropical monsoon conditions in the south. It is marked by warm, dry winters and hot, rainy summers, providing optimal hydrothermal conditions for agricultural activities.
Guangdong Province, a pivotal economic engine and urbanization frontrunner in China, exemplifies pronounced regional disparities with distinct core–periphery dynamics. The Pearl River Delta (PRD), contributing approximately 80% of the province’s GDP, stands in stark contrast to its peripheral counterparts. This spatial heterogeneity is evident in urbanization rates, which exceed 85% in PRD metropolises such as Shenzhen and Guangzhou but fall below 60% in many non-PRD prefectures, despite the provincial average of 75.9%, which is over 10% higher than the national level. Rapid industrialization and infrastructure densification in the PRD drive intensive cultivated land conversion and fragmentation, while mountainous peripheries face abandonment due to labor outmigration, amplifying conflicts within the “human–land–food” system. Deciphering drivers of SCLF is pivotal for forging targeted differentiated governance frameworks that reconcile food security in high-pressure urban area with sustainable land use in marginal regions.

2.2. Data Collection

This study integrates multi-source datasets encompassing land cover, Digital Elevation Model (DEM), meteorological data, and socio-demographic statistics. Land cover and DEM data are employed to identify cultivated land across varying slope gradients. The China Land Cover Dataset (CLCD), providing continuous annual land cover classification from 2000 to 2020 at 30 m spatial resolution, delineates seven categorical types: cultivated land, forest, shrub, grassland, water body, barren land, and impervious surfaces [32]. Based on the visual interpretation samples, the overall accuracy rate of CLCD reached 80%. The DEM data is derived from the ASTER GDEM with 30 m resolution, obtained through the Geospatial Data Cloud platform (http://www.gscloud.cn). The water network data and road network data are from the Open Street Map (https://www.openstreetmap.org/) and are calculated in county-level units. The county-level socioeconomic factors utilized in this driving factors analysis are extracted from two primary sources: the Guangdong Provincial Rural Statistical Yearbook and the Guangdong Statistical Yearbook from 2000 to 2020 (https://gdzd.stats.gov.cn/dcsj/gdsnjsj/201902/t20190201_154503.html (accessed on 27 November 2024)).

2.3. Research Methods

2.3.1. Determining Slope-Classified Cultivated Land Types

The classification of cultivated land slope gradients in this study adheres to China’s regulatory framework, specifically the Current Land Use Classification (GB/T 21010-2017) [33] and the Soil and Water Conservation Law. A multistep GIS-based workflow is implemented to calculate slope-classified cultivated land fragmentation index. First, 30 m DEM data and cultivated land boundary data are acquired and reprojected to a unified coordinate system. Slope is calculated using ArcGIS and reclassified into five regulatory categories: flat (<2°), gentle (2–6°), moderate (6–15°), steep (15–25°), and extremely steep (>25°). Zonal statistics are applied to overlay the reclassified slope raster with cultivated land boundaries, enabling precise extraction of slope types for individual agricultural parcels.

2.3.2. Construction of Slope-Classified Cultivated Land Fragmentation Index System

The application of landscape pattern indices provides an analytical lens to decode CLF dynamics, particularly in quantifying morphometric changes in cultivated landscapes [16]. This study employes county-level administrative units as the fundamental analysis units. A slope-classified cultivated land fragmentation index (SCLFI) is developed by integrating six landscape metrics representing area, density, shape, and spatial distribution characteristics. The fragmentation assessment framework incorporates patch density (PD) as a core indicator of landscape subdivision intensity, where increased PD values directly reflect spatial partitioning severity. Landscape division index (DIVISION) extends this evaluation by quantifying the probabilistic segregation of landscapes into discrete patches through dual integration of patch abundance and areal heterogeneity. Landscape shape index (LSI) complements these measures through normalized edge density characterization, serving as a stable descriptor of patch contour irregularity compared to conventional edge metrics. Area-weighted mean patch area (AREA_AM) operates as an inverse fragmentation proxy, with fragmentation intensification evidenced by concurrent reductions in mean patch dimensions and increased size distribution variability. Spatial isolation dynamics are quantified via mean Euclidean nearest-neighbor distance (ENN_AM), where extended inter-patch distances inversely correlate with landscape connectivity. Finally, aggregation index (AI) delineates the spatial clustering propensity of homogeneous patches, where depressed AI values explicitly manifest reduced patch aggregation as a hallmark of fragmentation progression [34,35].
All metrics are computed at the landscape level using FragStats v4.2. Raw values are normalized via normalization to eliminate dimensional heterogeneity. The CRITIC weighting method is applied to assign objective weights by simultaneously evaluating intra-indicator contrast intensity and inter-indicator conflicts [36]. This approach minimizes subjectivity while ensuring statistically robust integration of multidimensional fragmentation features. The final SCLFI is derived as a weighted sum of normalized metrics, enabling systematic quantification of slope-dependent cultivated land fragmentation, Equation (1).
S C L F I i = j = 1 n w j · x i j
where S C L F I i is the degree of CLF, w j is the weight coefficient corresponding to each indicator, and x i j is the standardized value of each indicator.
To normalize the six landscape pattern indices mentioned above, both positive and reverse data normalization processes were applied to obtain standardized dimensionless data. The calculation formula for normalization is as follows:
x i j = X i j X i M i n X i M a x X i M i n   P o s i t i v e   S t a n d a r d i s a t i o n X i M a x X i j X i M a x X i M i n   R e v e r s e   S t a n d a r d i s a t i o n
where x i j is the dimensionless data after normalization, and X i j represents the various landscape pattern indices, while X i M a x and X i M i n denote the maximum and minimum values among these indices. Then the calculation formula for calculating the contrast strength of each indicator is as follows:
σ j = i = 1 n x i j x ¯ i j 2 n 1
where σ j is the standard deviation, and x ¯ i j is the average of x i j . The calculation formula for computing the conflict of each indicator is as follows:
R j = i = 1 m 1 r i j
where R j is the conflict, and r i j   represents the correlation coefficient. Additionally, the calculation formula for determining the information carrying capacity of each indicator is as follows:
C j = σ j · R j
where C j is the amount of information carried. Finally, the weighting coefficients are calculated using Equation (6). The calculation formula for weighting coefficient is as follows:
w j = C j j = 1 m C j
where w j is the weighting coefficient of these indicators.

2.3.3. Driver Analysis of Slope-Classified Cultivated Land Fragmentation

(1)
Explanatory variables
As a pronounced manifestation of land use change, SCLF arises from complex interactions among multiple driving forces. The determinants are categorized into three dimensions, natural factors, population, and socioeconomic factors, comprising 14 specific indicators (Table 1). Natural factors, including annual precipitation (AP), average temperature (AT), and water network density (WND), exert profound and direct influences on cropland morphology and structural configuration [37]. These factors fundamentally constrain agricultural suitability and land use potential. Population dynamics, particularly agricultural labor availability, serve as immediate determinants of cultivation decisions [38]. Two critical indicators are selected: number of agricultural employees (NAE) and proportion of rural labor engaged in non-agricultural industries (PRN). The dual processes of agricultural labor depletion and occupational transition significantly influence cultivated land use patterns and fragmentation dynamics. Socioeconomic factors show composite effects of agricultural productivity, regional development levels, and policy orientations, ultimately shaping cultivated land management strategies [39,40]. The selected indicators include the following: gross output value of agriculture (GDP), output of grain of each county (OG), average grain output per mu (AGO), per capita disposable income of rural households (DIR), per capita gross domestic product (PGDP), per capita disposable income of urban households (DIU), local government budgetary expenditure (LGBE), road network density (RND), and total power of agricultural machinery (PAM). These indicators comprehensively capture the multidimensional interactions between agricultural profitability, urbanization pressure and infrastructure development on SCLF.
Furthermore, to reveal the driving forces of SCLF, this study employed the variance inflation factor (VIF) to avoid the collinearity issue among these factors. When VIF > 7.5, it indicates that each factor is collinear and should be removed [31,41]. Table 1 shows that the VIF of each variable is less than 7.5, indicating that there is no collinearity issue among these factors, and thus it can be used for subsequent analysis.
(2)
XGBoost model and SHAP interpreter
Extreme Gradient Boosting (XGBoost) algorithm, renowned for its ensemble learning architecture and regularization capabilities [42], constructs predictive models through iterative additive expansion. SHapley Additive Explanation (SHAP) interpreter, grounded in cooperative game theory [43], quantifies feature contributions through Shapley value decomposition, enabling both global importance ranking and local effect interpretation [44,45]. The integration of XGBoost and SHAP in our proposed framework delivers three pivotal advantages for deciphering the nonlinear mechanisms of SCLF. Firstly, XGBoost’s ensemble architecture captures complex and high-dimensional interactions among socio-ecological drivers that linear models fail to detect. Critically, SHAP values quantitatively decompose feature contributions to each prediction, establish spatially explicit driver hierarchies, and enable precise identification of dominant fragmentation drivers. Furthermore, the framework projects SCLF responses to targeted driver perturbations while controlling covariate effects. This synergy bridges computational power with geospatial explicability, effecting a shift from correlation-based to causality-oriented fragmentation research. Therefore, this study applies SHAP analysis to XGBoost model outputs to investigate the driving mechanisms of SCLFI across distinct regions.
In this study, the dataset was divided into training and test sets at a ratio of 0.8. The hyperparameter of the XGBoost model is selected using a grid search method with 5-fold cross-validation on the training set. The max_depth is 5, which can control the complexity of the model and prevent overfitting. Then, train the model on the complete dataset using parameters, and use SHAP values to explain the influence of the model results. The XGBoost algorithm and SHAP interpreter are implemented using the “xgboost” and “shap” packages within the R programming environment.

3. Results

3.1. Overall Cultivated Land Use Change

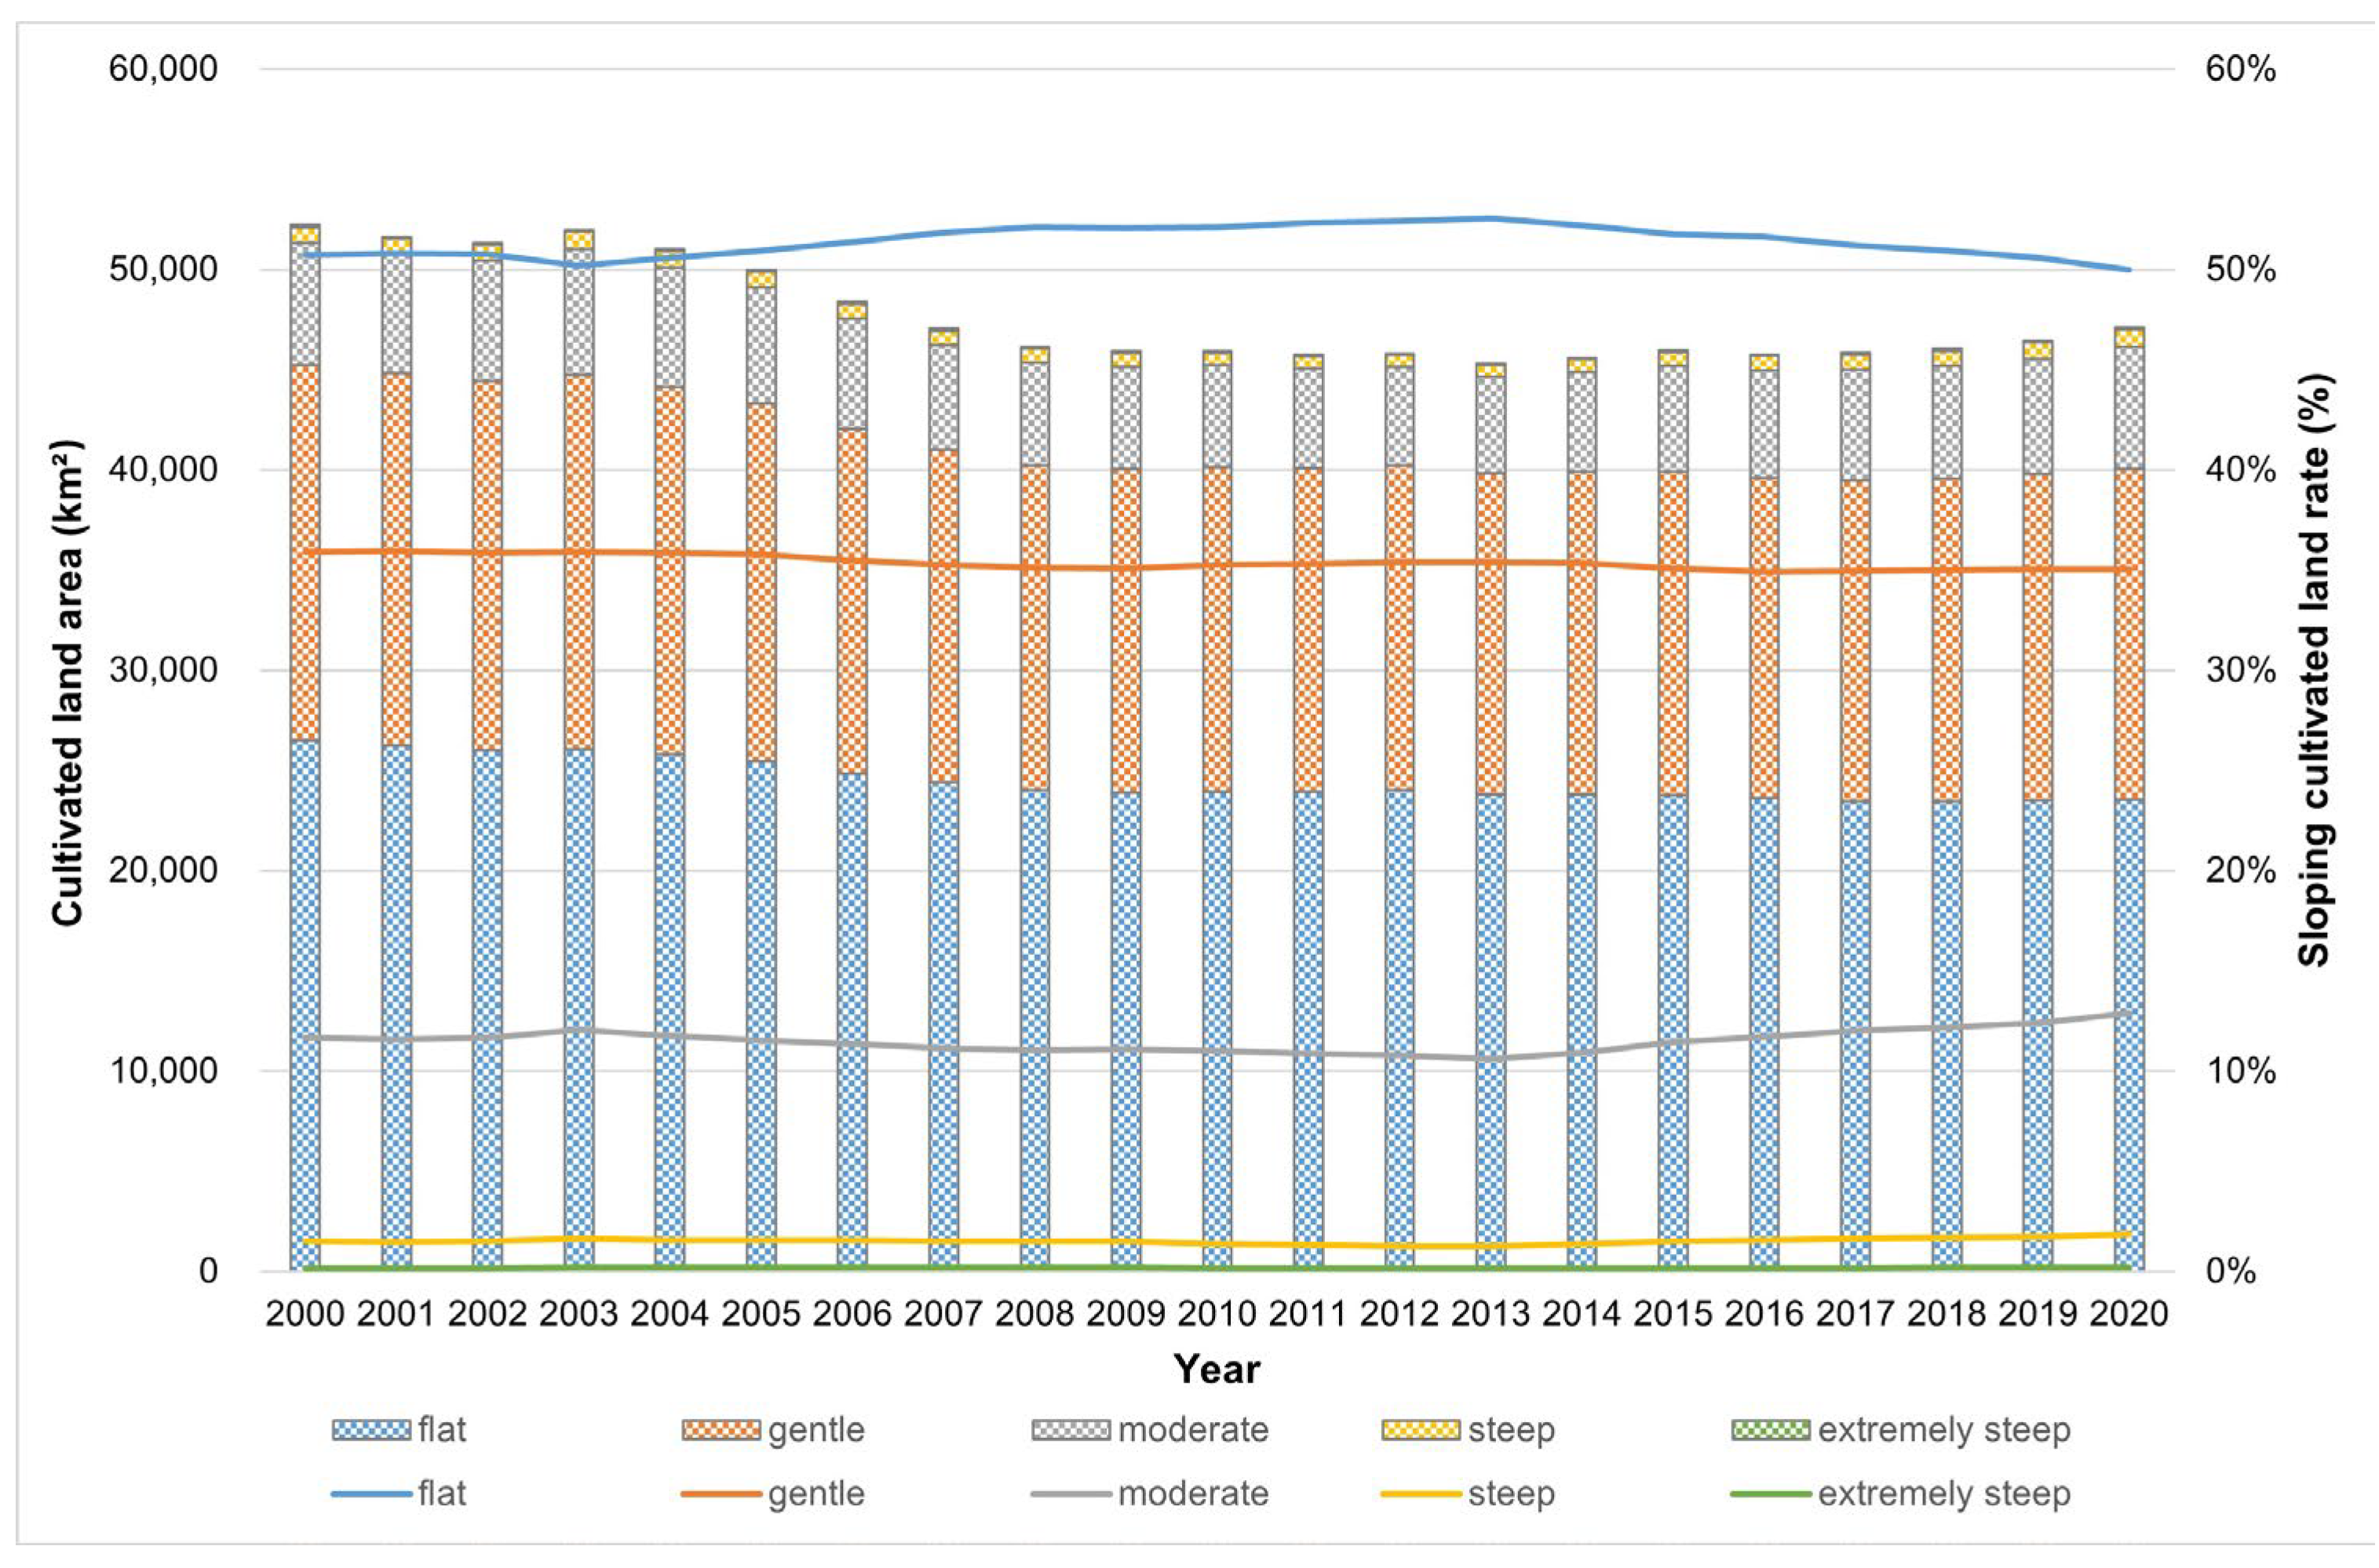
The cultivated land area in Guangdong Province exhibited a phased decline from 52,225.44 km2 in 2000 to 45,300.34 km2 in 2013, followed by a moderate recovery to 47,113.88 km2 by 2020, culminating in a net reduction of 5111.56 km2 over the two-decade period (Figure 2). This pronounced contraction underscores the critical status of cultivated land resources, necessitating the immediate implementation of more stringent farmland protection policies. Concurrently, the proportion of flat cultivated land decreased from 50.72% to 49.98%, while moderate-slope cultivated land increased from 11.65% to 12.90% during the same period. The overall trajectory reveals a substantial reduction in the total cultivated land area accompanied by a gradual expansion of steeper cultivated land (slope > 6°). This spatial pattern may be attributed to two primary factors: the extensive urban encroachment on prime agricultural land and compensatory reclamation of sloping land for cultivation purposes.
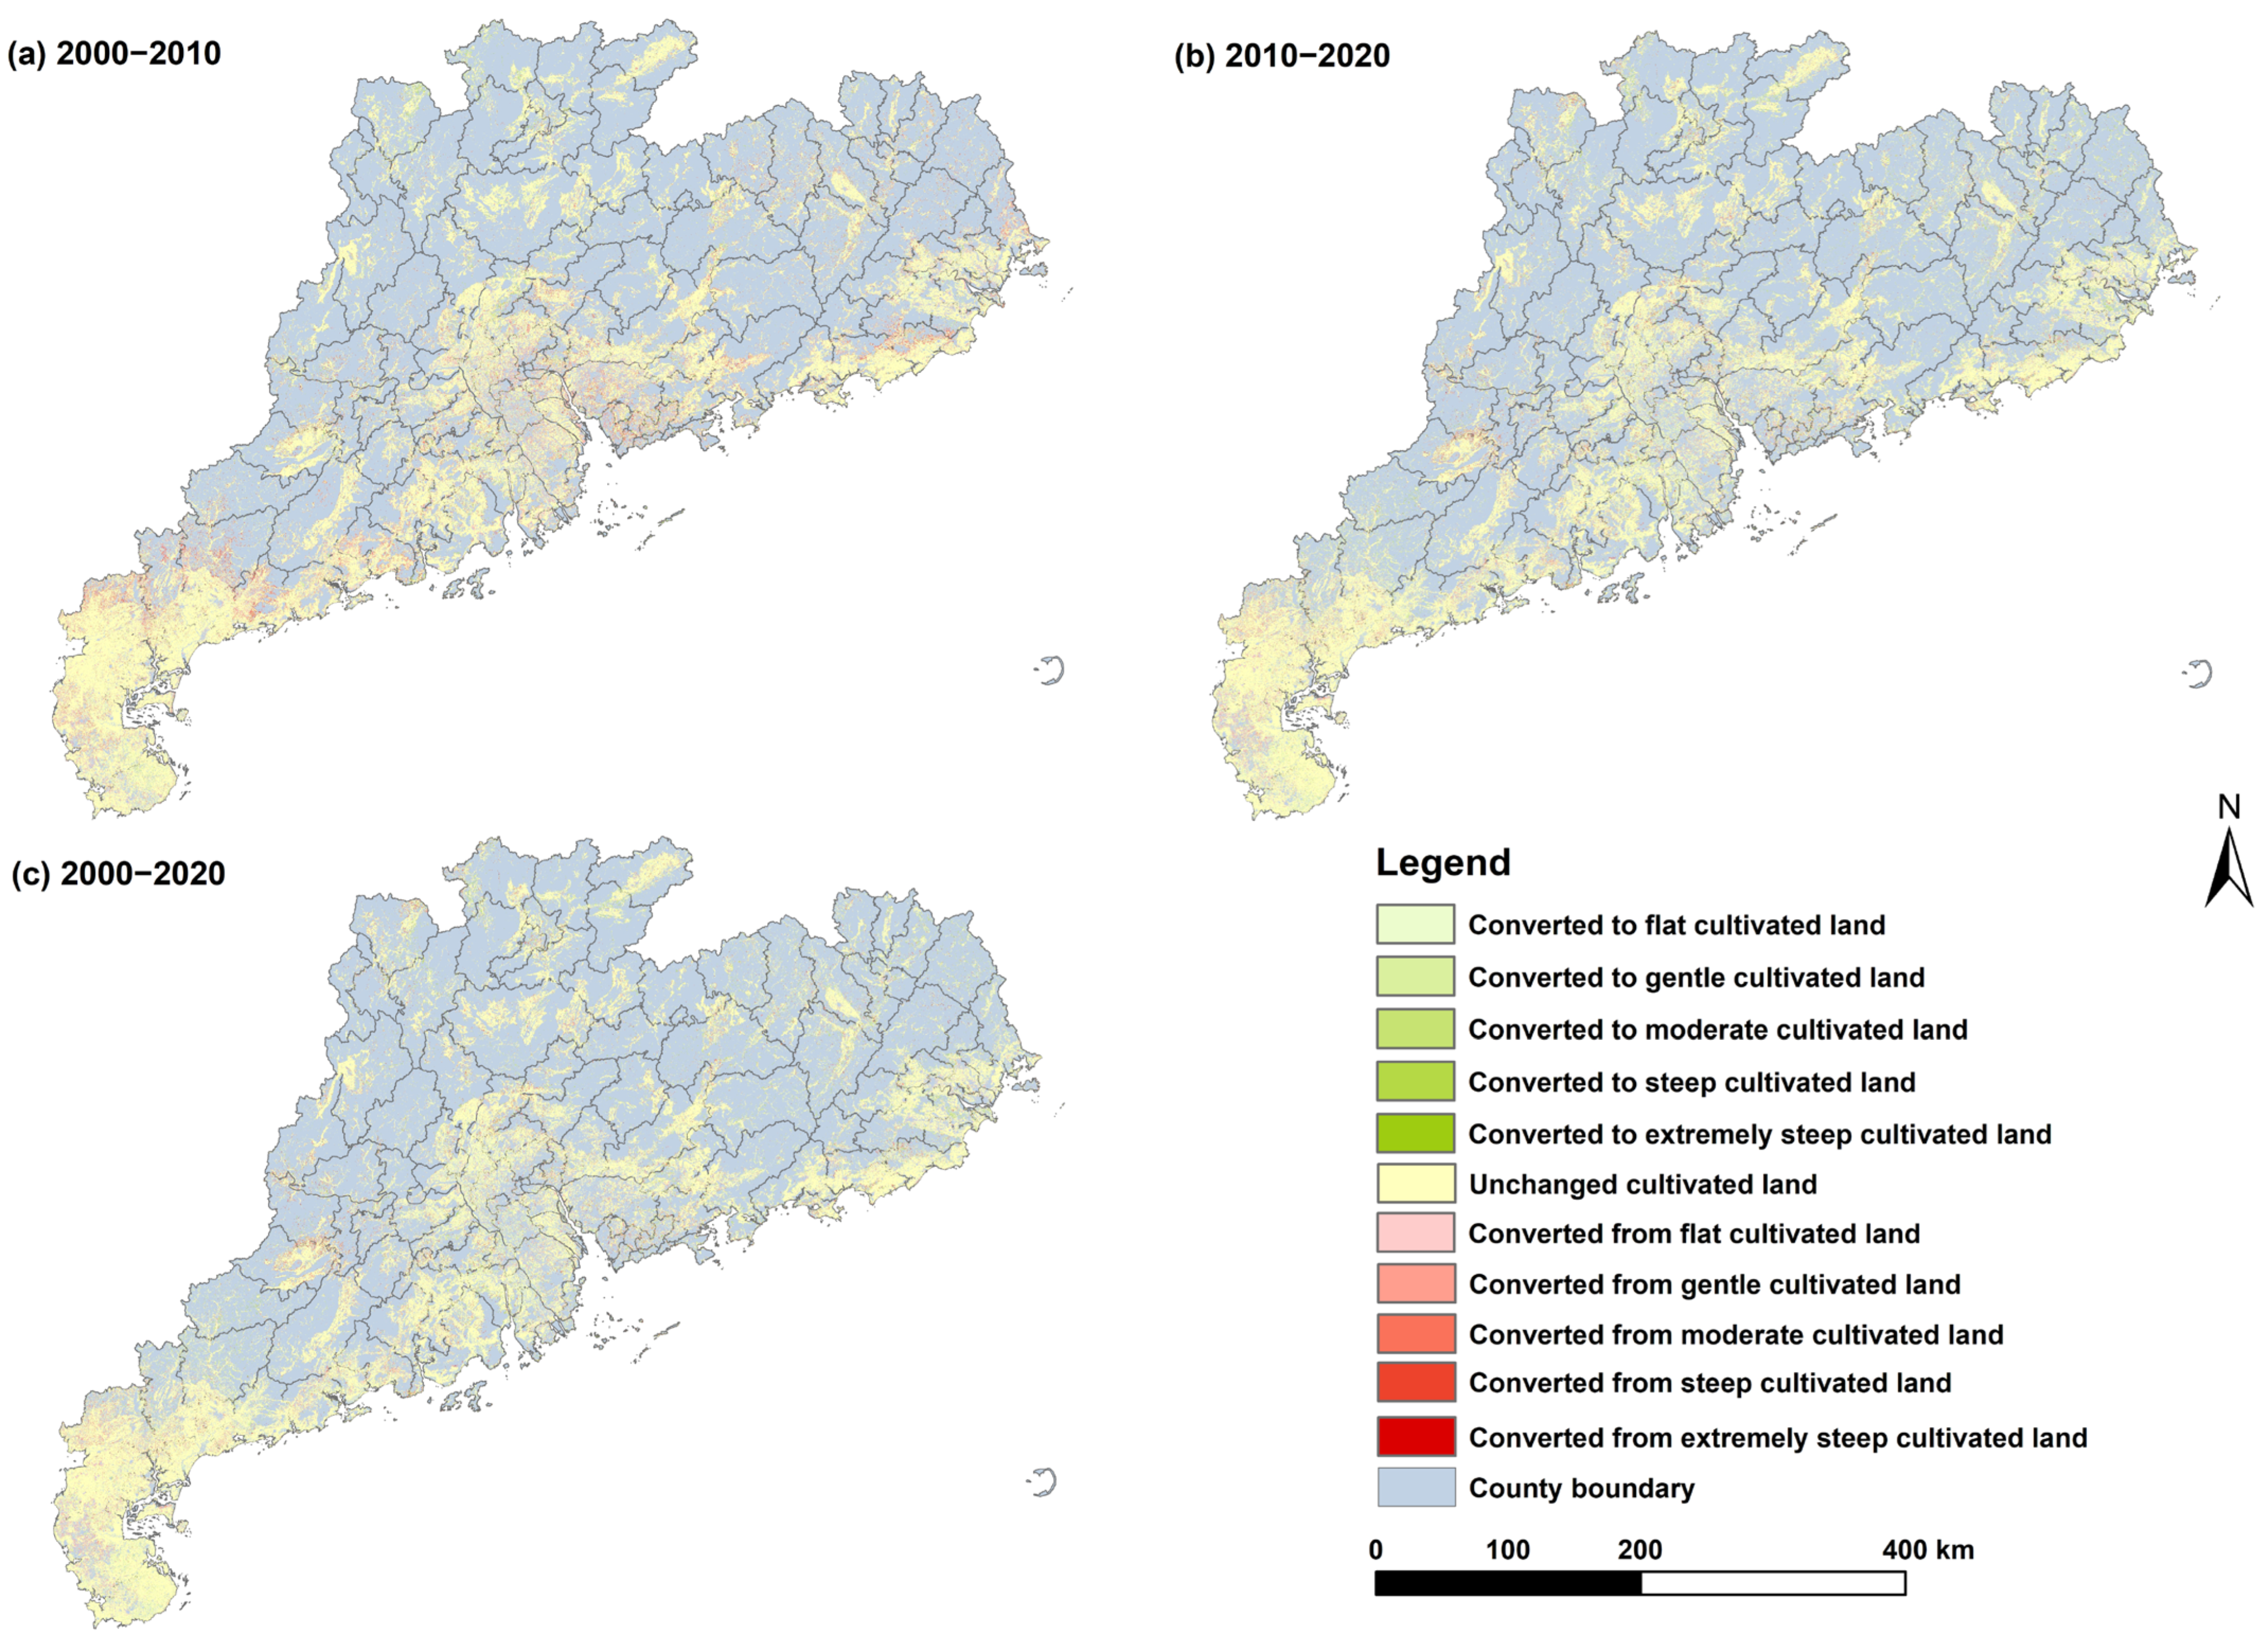
This study extracted spatial changes in cultivated land transferred-in and transferred-out across Guangdong Province during two distinct periods (2000–2010 and 2010–2020), as illustrated in Figure 3. The derived data underwent a reclassification into three primary categories, unchanged cultivated land, converted to cultivated land, and converted from cultivated land, with a further stratification based on slope gradients. The further analysis of land use transitions between 2000–2010 and 2010–2020 revealed that newly added cultivated land was distributed across the entire study area, with the Leizhou Peninsula exhibiting the most significant increase. During the 2010–2020 period, the area of new cultivated land expanded compared to the previous period, and the newly added cultivated land in the northern region generally featured steeper slopes with more spatially concentrated distributions than in the prior decade. Outflows of cultivated land were primarily concentrated in the central region and the eastern/western flanks of the study area. During 2000–2010, transitions from cultivated land to other land uses were more prevalent than in the subsequent period, particularly in the PRD, eastern region of Guangdong (ERGD), and western region of Guangdong (WRGD), where moderate and steep cultivated land were extensively converted to other land use types. In contrast, during the later study period, the converted cultivated land exhibited gentler slopes, except for the outflow areas in the northern region of Guangdong (NRGD) that maintained relatively steeper gradients.

3.2. Spatial Pattern of Slope-Classified Cultivated Land Use Change at County Scale

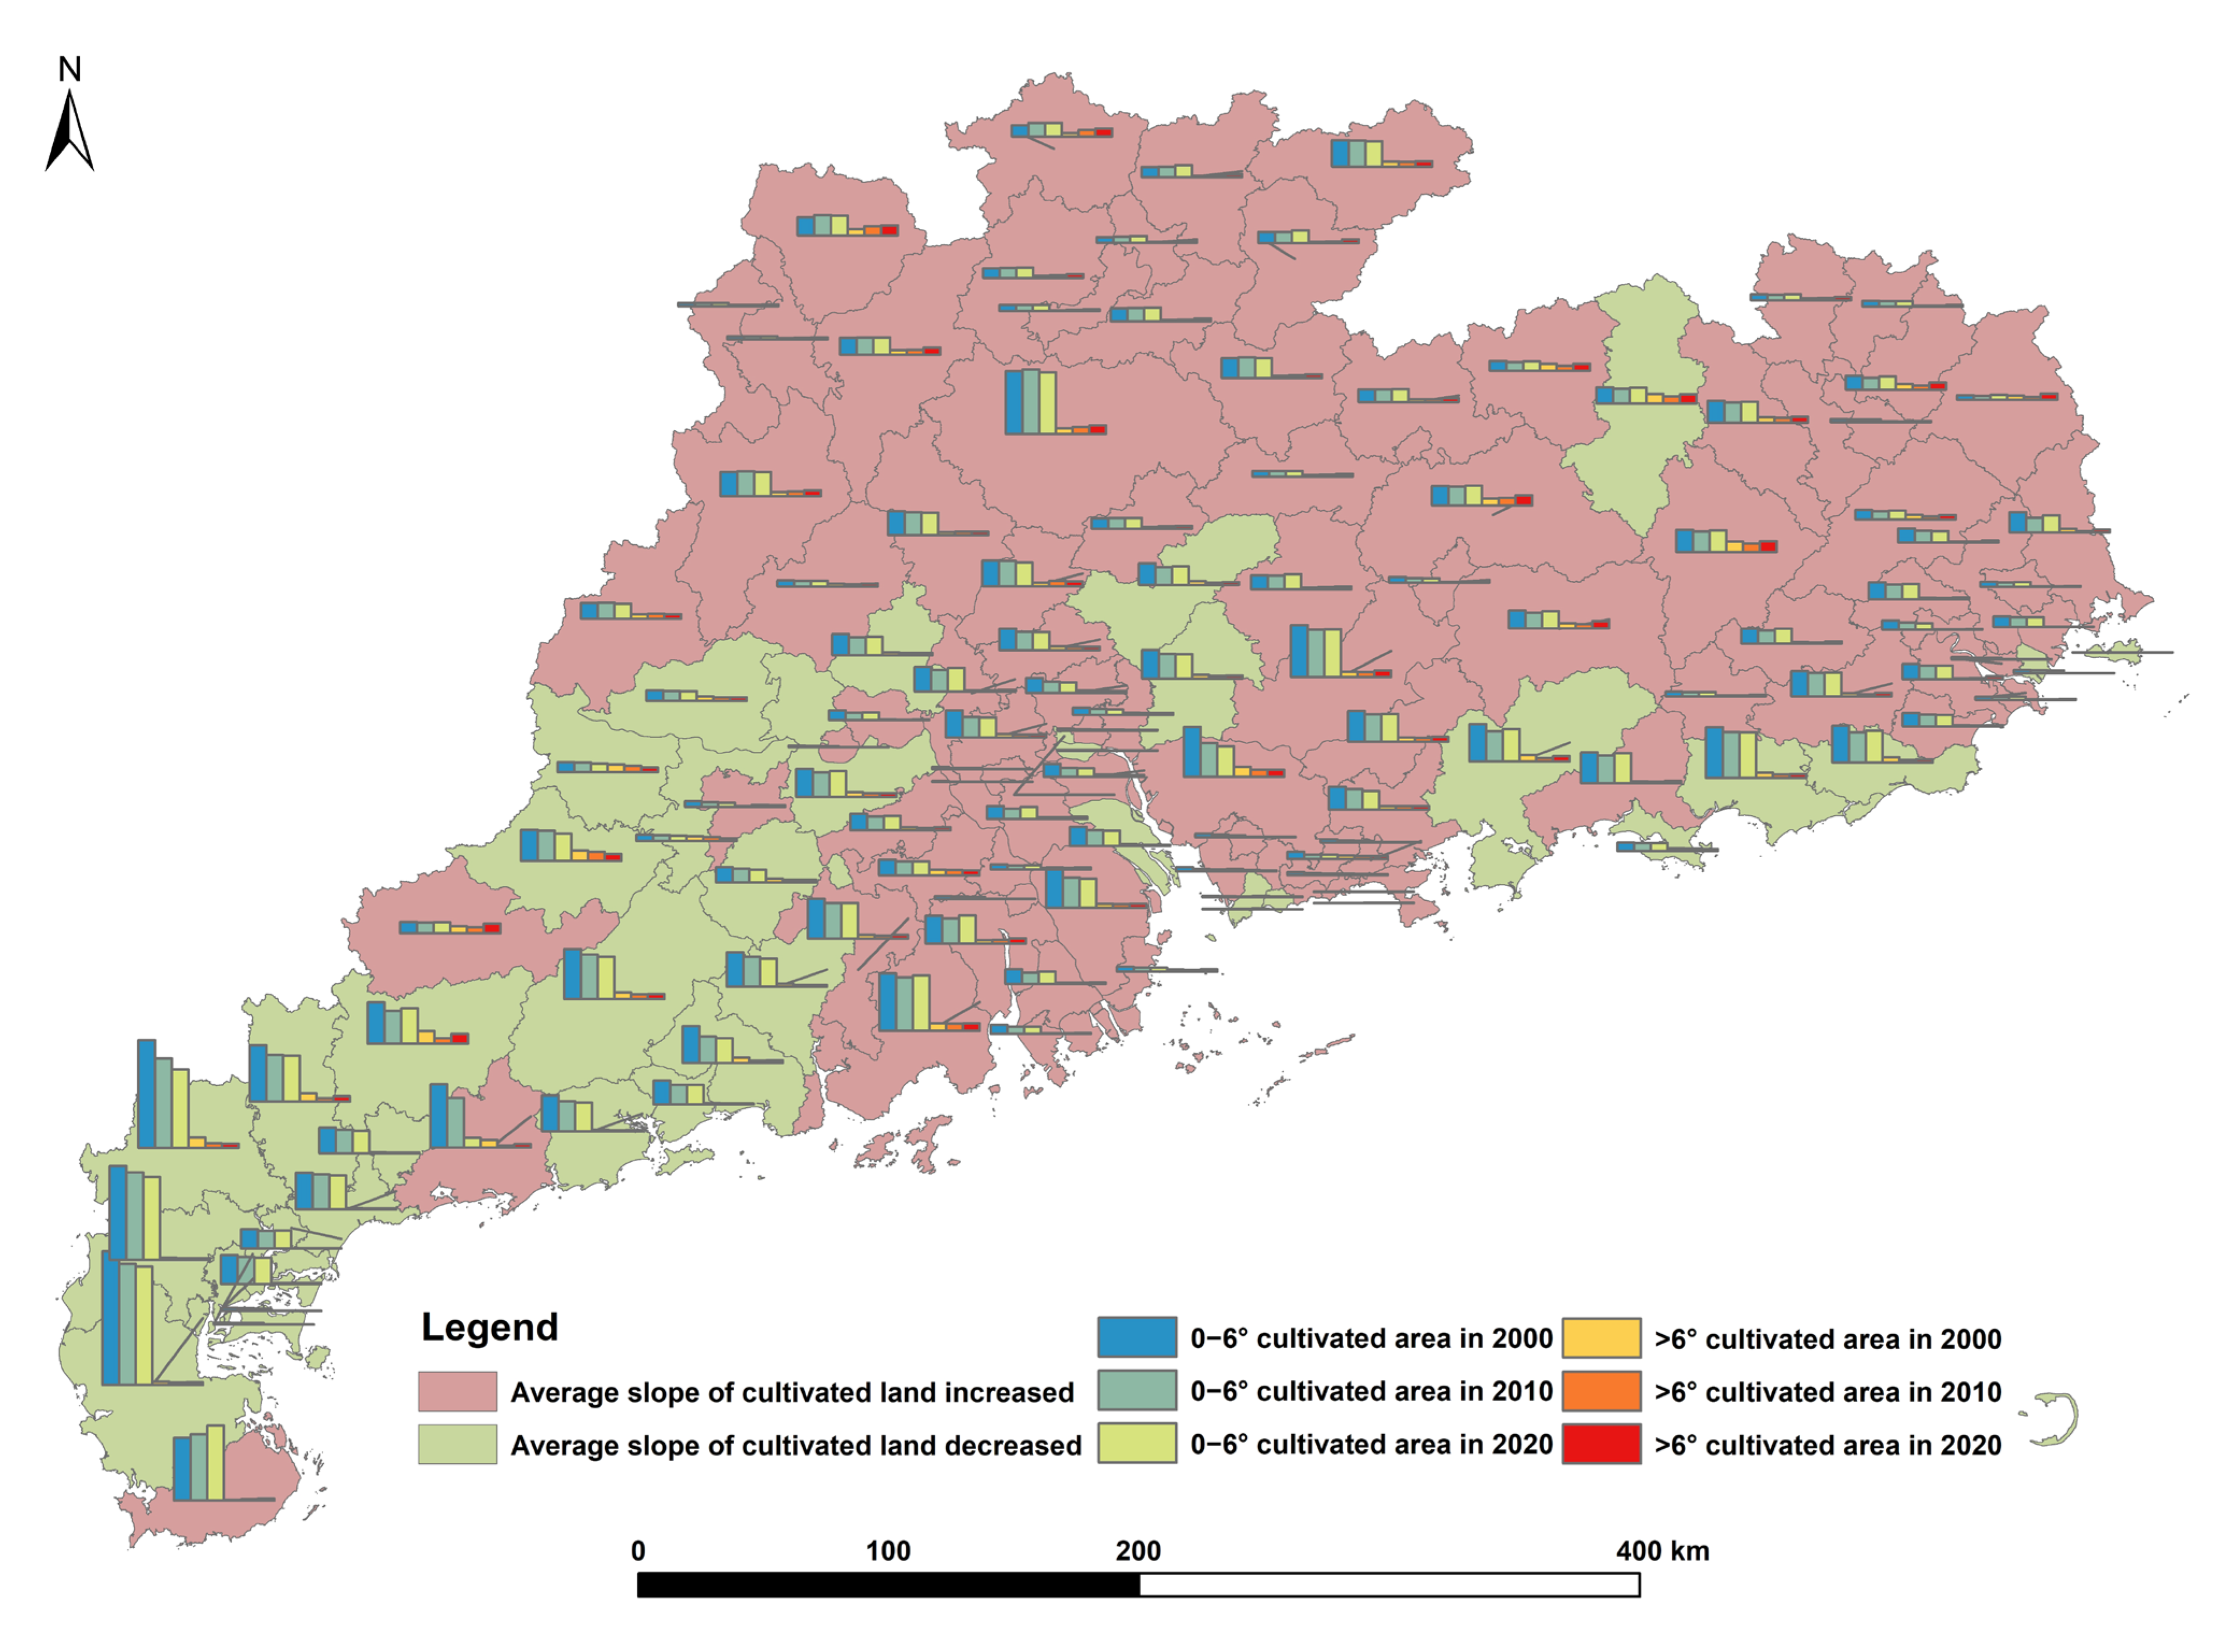
The preceding section examined the spatial variations in the inflow and outflow of cultivated land across different slope gradients in Guangdong Province. Given the current agricultural land transfer policy framework that prioritizes self-balancing within county jurisdictions while employing interprovincial coordination as a supplementary mechanism, this section focuses on analyzing quantitative changes in slope-classified cultivated land at the county level. Overall, significant differences exist in the slope-classified cultivated land use change among counties (Figure 4). From 2000 to 2020, 37 county-level administrative units exhibited decreased average slopes of cultivated land, concentrated throughout the WRGD and coastal counties of the ERGD. This spatial pattern suggests land use optimization towards land flattening, potentially reflecting land consolidation or reclamation initiatives. Conversely, areas marked by increased average slopes (highlighted in red) demonstrate a scattered distribution across the study area, particularly within the NRGD and ERGD, which is indicative of substantial land transformation processes likely driven by the agricultural expansion onto steeper land. Although cultivated land in most WRGD areas witnessed a slope reduction, the persistent decline in flat cultivated land and gentle-slope cultivated land warrants attention. Meanwhile, the increase in cultivated land exceeding a 6° slope within the inland ERGD and NRGD underscores enduring challenges in food security through sustainable land management practices in these regions.

3.3. Spatial Pattern of Slope-Classified Cultivated Land Fragmentation

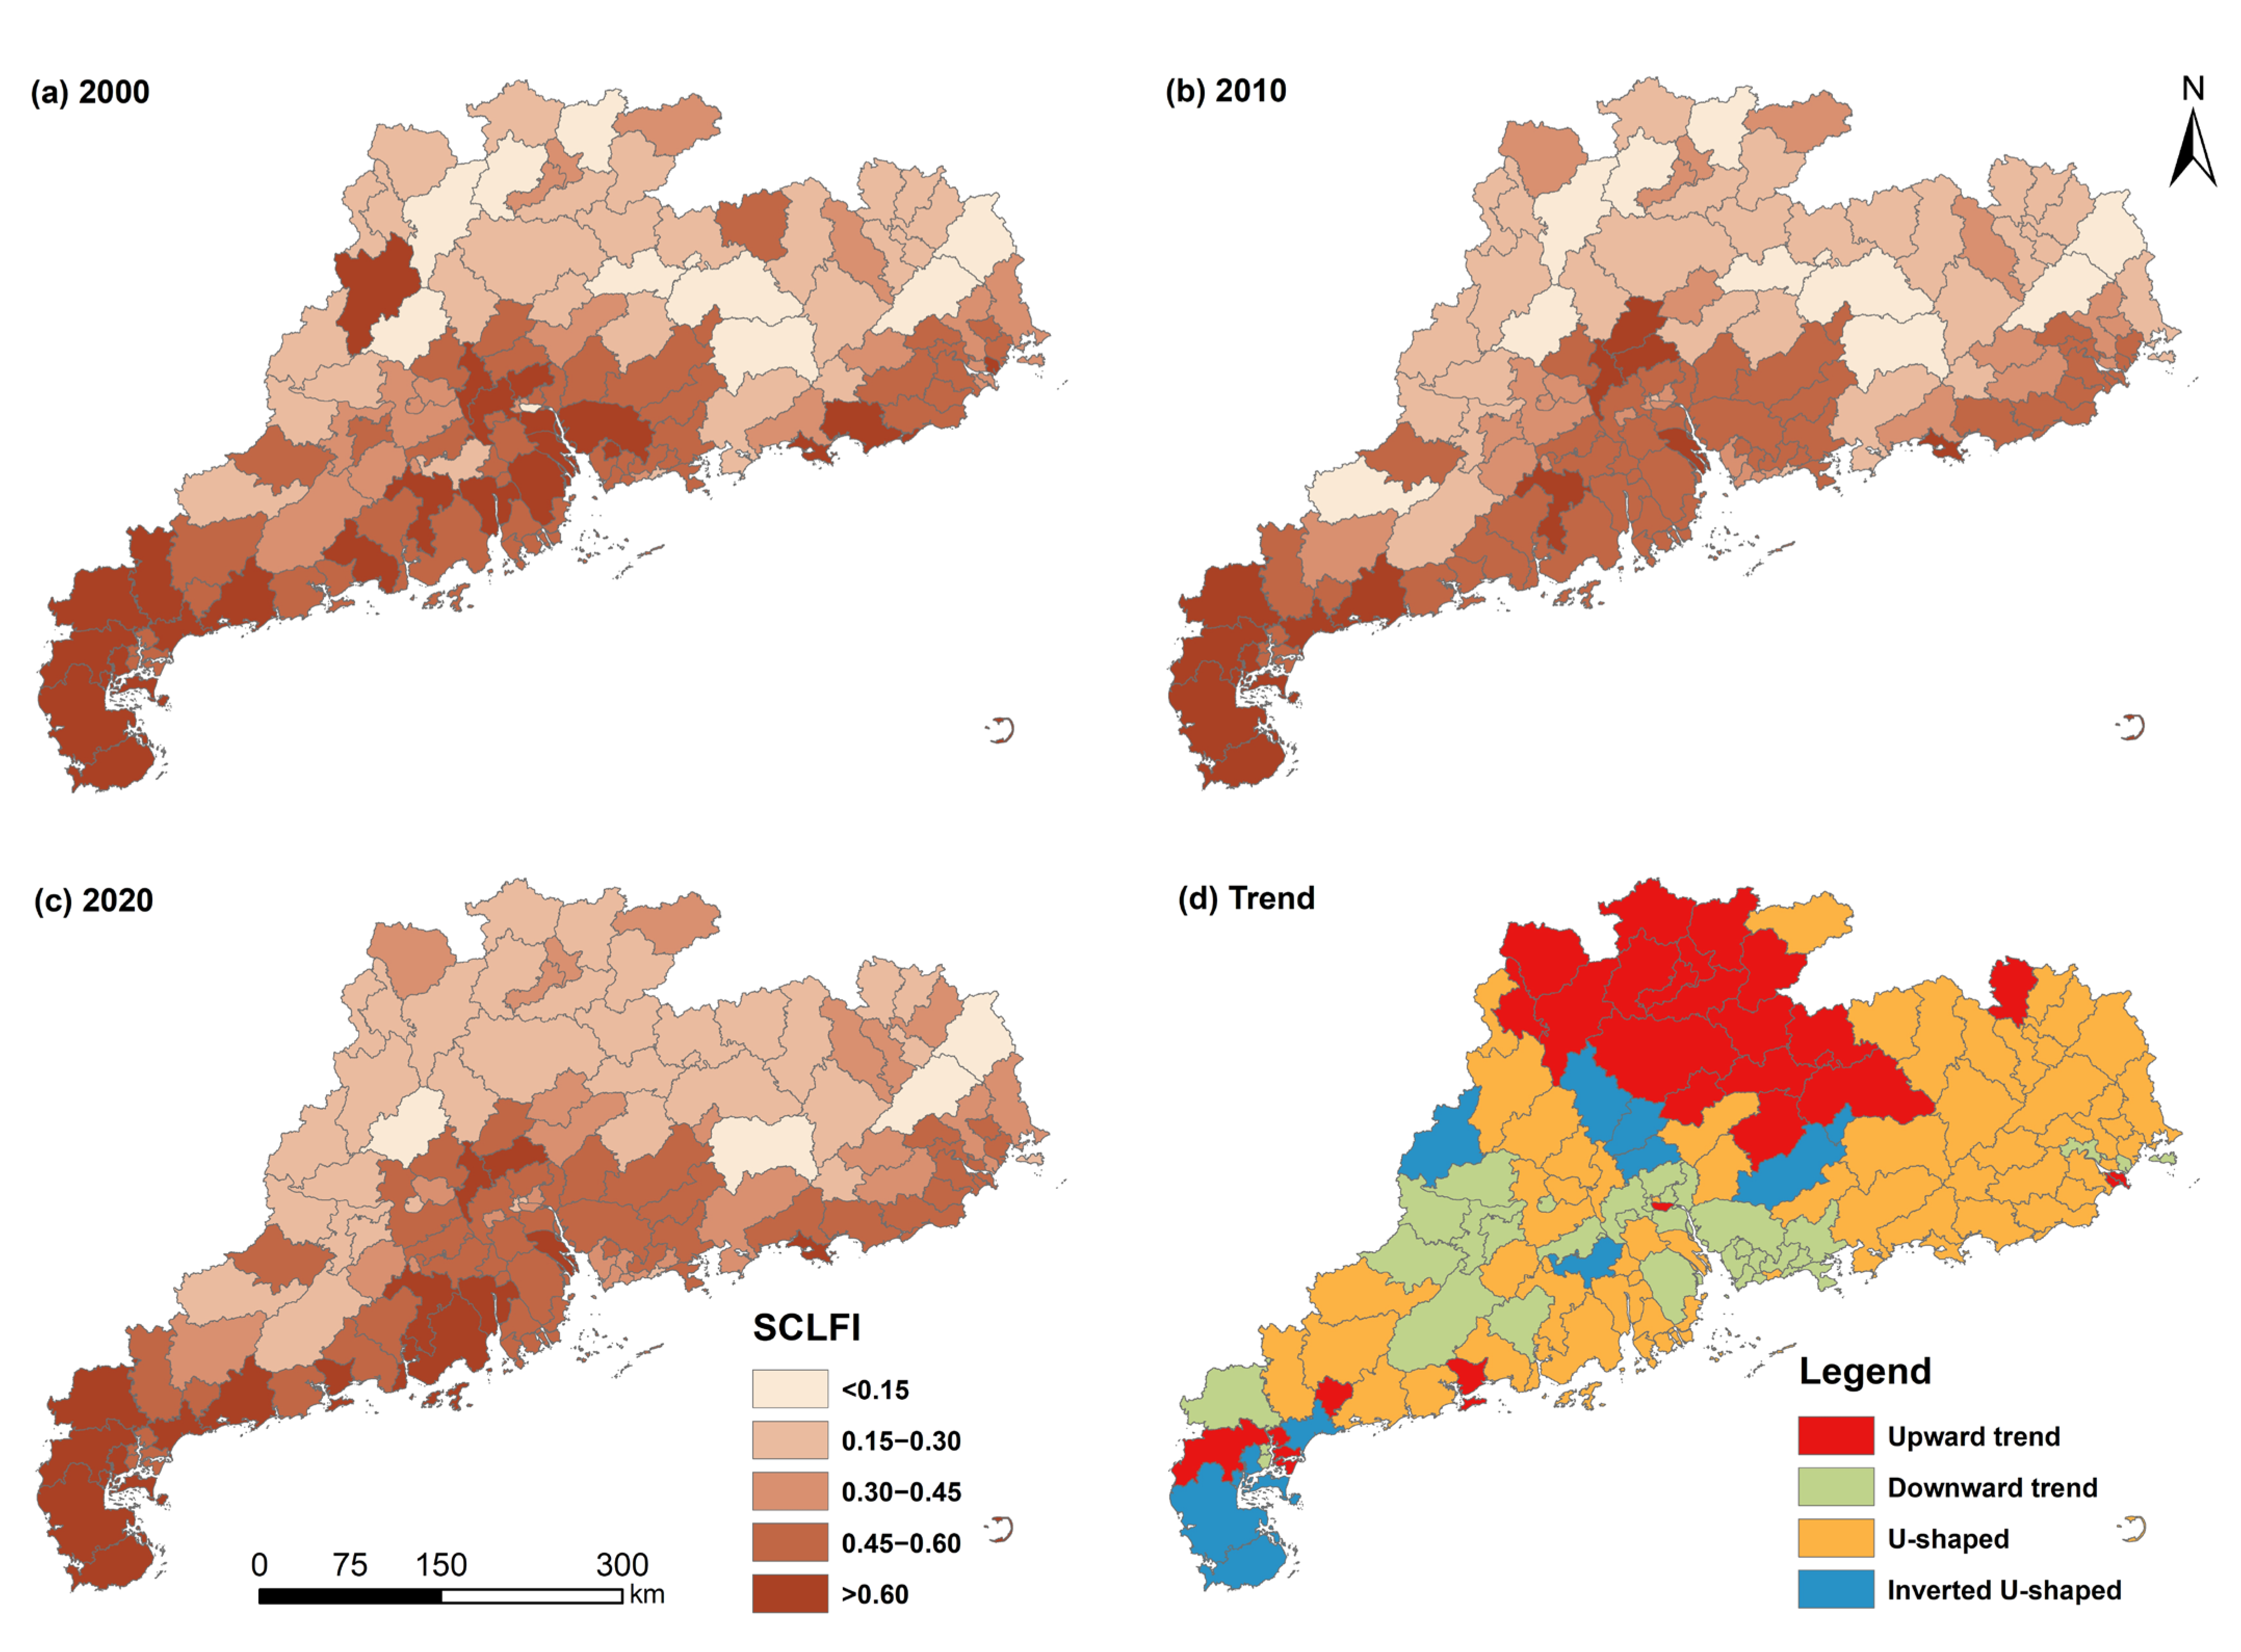
The SCLFI demonstrates marked spatial heterogeneity across Guangdong Province (Figure 5). Slope-mediated cultivated land fragmentation is predominantly concentrated in the PRD and coastal WRGD, followed by eastern Guangdong’s littoral regions, where SCLFI values consistently exceed 0.45, which is indicative of advanced fragmentation states throughout the study period. The temporal analysis reveals a distinct regional divergence in the SCLFI. The PRD exhibits a sustained decadal decline in the fragmentation index, suggesting the progressive mitigation of slope-induced fragmentation pressures. Conversely, WRGD and ERGD patterns are characterized by an initial fragmentation reduction (2000–2010) followed by a subsequent resurgence (2010–2020), reflecting the cyclical intensification of cultivated land dissection processes. Notably, in the NRGD northeastern and northwestern peripheries maintain comparatively subdued SCLFI values (SCLFI < 0.30). However, these regions show either monotonic increases or U-shaped escalation profiles, portending a latent risk of intensified fragmentation in traditionally marginal agricultural zones.

3.4. Drivers of Slope-Classified Cultivated Land Fragmentation

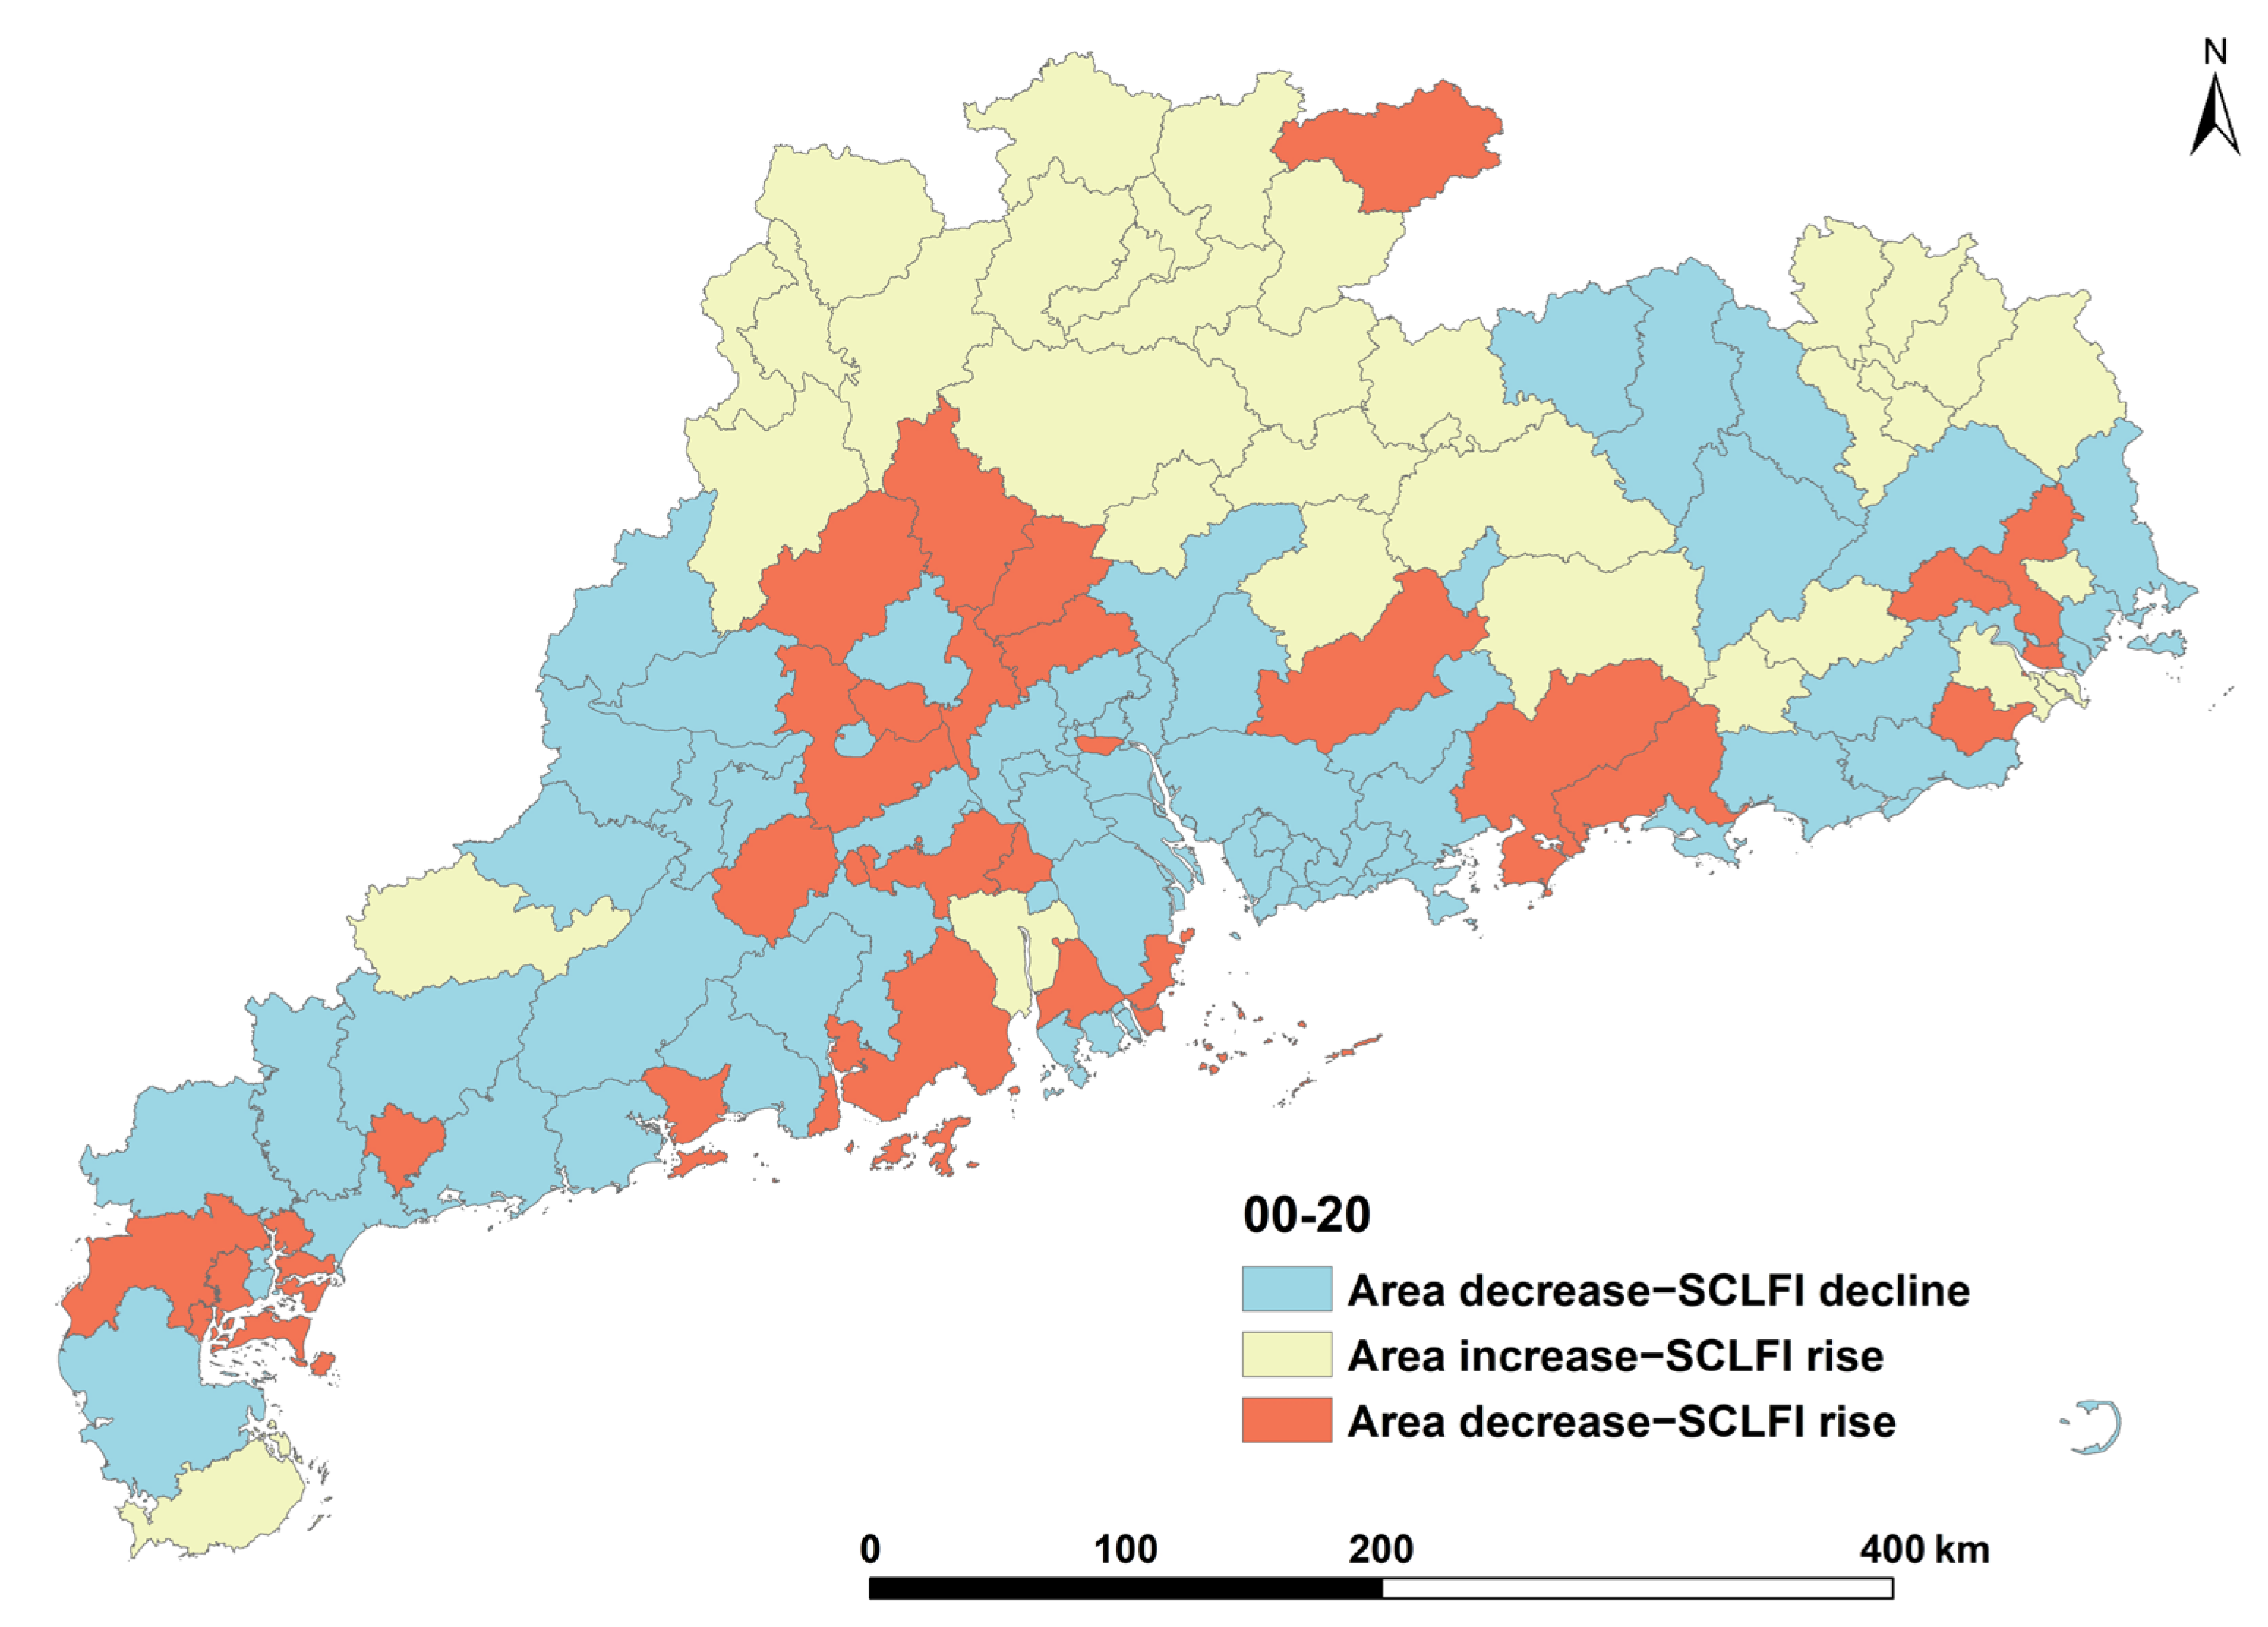
Recognizing the driving factors of the SCLFI can help guide the development of a cultivated protection policy. This study used the XGBoost model and SHAP model to explore the driving factors of slope-classified cultivated land fragmentation and its regional characteristics in Guangdong Province. Guangdong Province was classified into three distinct patterns based on the spatial heterogeneity of slope-classified cultivated land area changes and SCLFI dynamics: (1) area decrease–SCLFI decline, (2) area increase–SCLFI rise, and (3) area decrease–SCLFI rise (Figure 6). Table 2 shows that the XGBoost model clearly explains the interpreted values of the SCLFI for all types of regions in 2000, 2010, and 2020. The resulting R2 values for the regions of area decreasing and SCLFI declining, the regions of area increasing and SCLFI rising, the regions of area decreasing and SCLFI rising, and Guangdong were 0.619 to 0.773, 0.652 to 0.887, 0.464 to 0.866, and 0.597 to 0.645, respectively. Given the intricate and complex interactions among the numerous factors that collectively co-influence the SCLFI, as well as their trade-offs, this outcome is deemed acceptable.
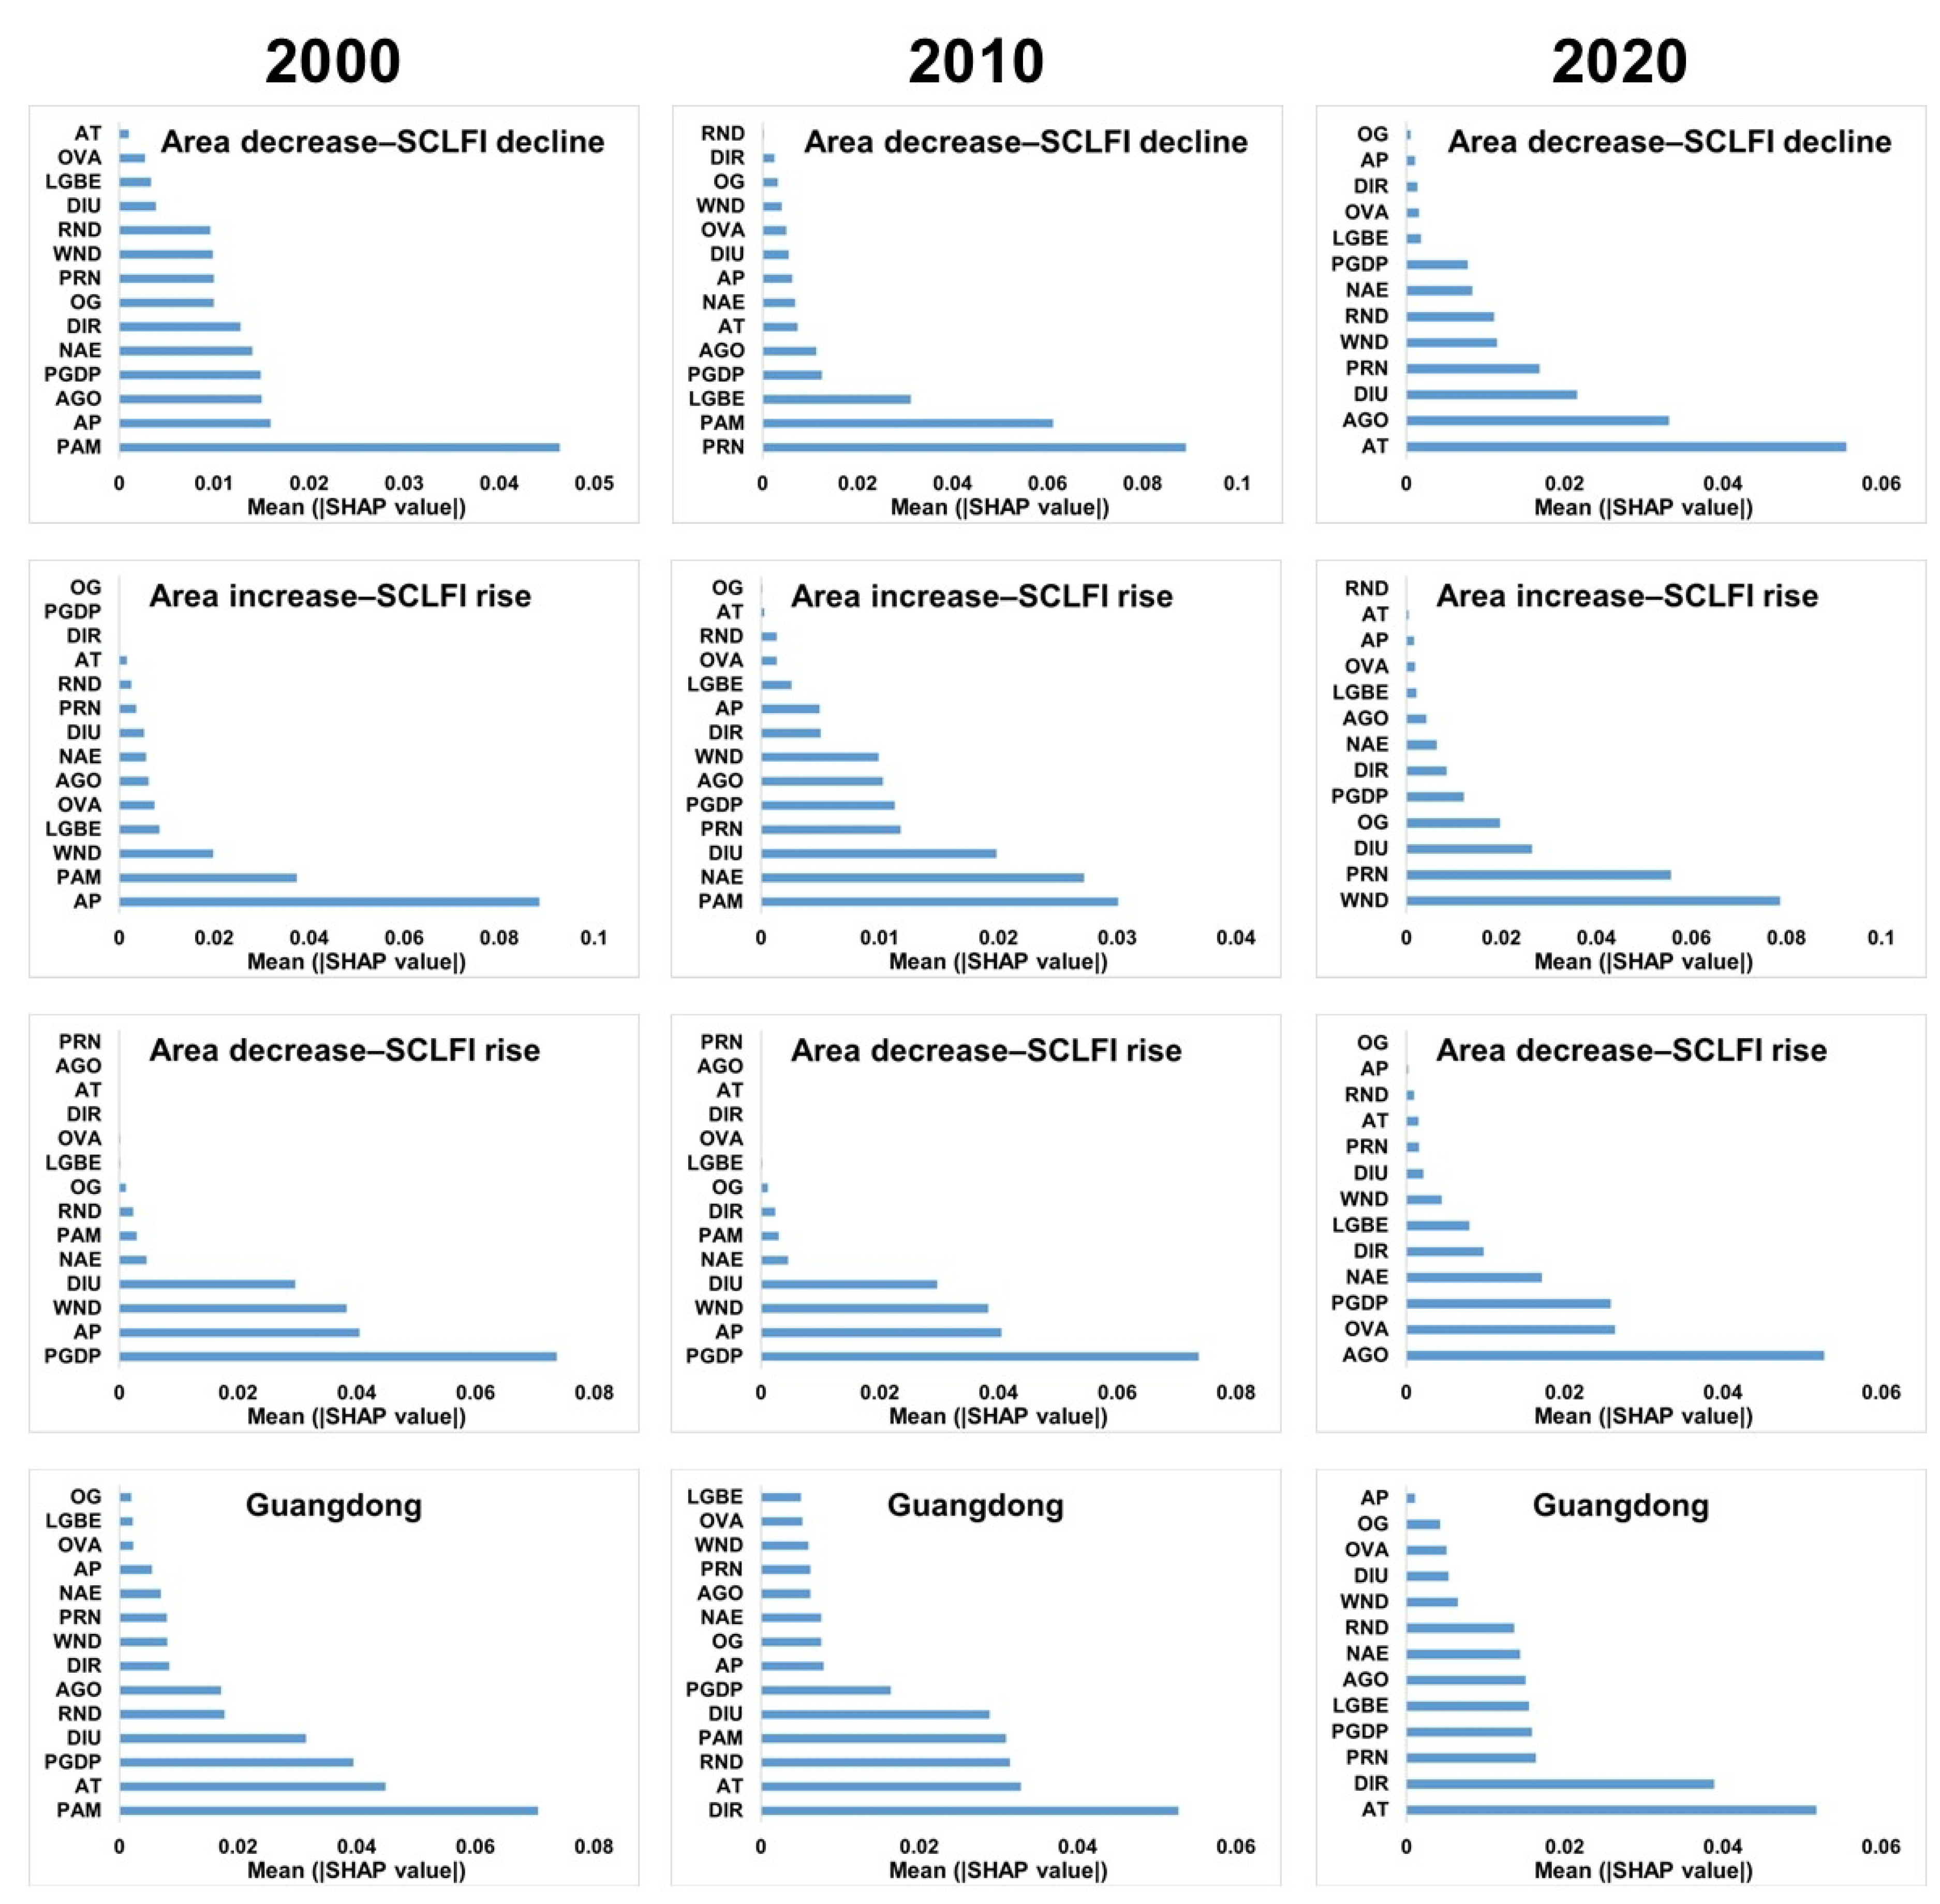
The XGBoost model revealed distinct driving factors across different spatial patterns, with the SHAP value analysis further quantifying the relative contributions of these determinants. The considered drivers encompass the natural factors, population, and socioeconomic indicators (Figure 7). However, our analysis identified notable variations in driving mechanisms between different patterns. As illustrated in Figure 7, the AT maintained dominance over SCLFI dynamics throughout 2000–2020, suggesting its persistent significance as a key driver during SCLF evolution processes. The DIR progressively increased to become the most influential factor. The DIR consistently exerts a consistent influence on the SCLFI, particularly evident in the 2010 and 2020 datasets across all regions, except in the area decrease–SCLFI decline and area increase–SCLFI rise scenarios. This implies that the disposable income of rural households generally impacts the SCLFI. In addition, the PGDP and PAM persistently emerged as major determinants of the SCLFI. The PGDP demonstrates pronounced contributions in the area decrease–SCLFI rise pattern, while the PAM exhibits significant contributions in both area decrease–SCLFI decline and area increase–SCLFI rise scenarios. The proportion of the agricultural population engaged in non-farming occupations exhibits a complex association with SCLFI dynamics. While demonstrating generally less evident effects in 2000, this factor shows positive correlations with the SCLFI in 2010 and 2020, with a progressively strengthening influence, particularly pronounced in area decrease–SCLFI decline and area increase–SCLFI rise scenarios. This pattern reflects evolving population-driven SCLFI mechanisms. Moreover, the average grain output contributes to the SCLFI, which is especially evident in 2020 for regions experiencing area decreases, highlighting agricultural productivity’s role in SCLF processes.

4. Discussion

4.1. Spatial Differentiation Characteristics of Slope of Cultivated Land

To address food security and land degradation challenges, China’s government has implemented a dynamic equilibrium system for cultivated land and established permanent basic farmland zoning to maintain both the quantity and quality of cultivated land [46,47]. Our analysis demonstrates Guangdong Province’s success in maintaining a stable cultivated land quantity since 2010. However, it coincides with a concerning upward trend in the average slope gradient, which is a phenomenon arising from complex interactions between policy implementation, agricultural restructuring, ecological conservation, and regional development disparities. The spatial substitution pattern characterized by “lowland occupation–mountainous compensation” has emerged as a critical mechanism maintaining the total cultivated area. Rapid urbanization in the PRD has consumed substantial high-quality flat cultivated land, with compensation lands predominantly developed in northern mountainous regions through the cultivated land requisition–compensation balance policy. This spatial mismatch results in systematic slope gradient increases, as compensation lands in hilly areas replace flat and gentle cultivated land. Concurrently, economic incentives drive the conversion of remaining flat lands to high-value agriculture or non-agricultural uses. Furthermore, ecological restoration programs have retired cultivated lands on steep slopes, while limited reclamation potentials in mountainous region constrain compensation efforts to moderately sloped areas.
The observed slope transition dynamics, both the intensification and mitigation, carry significant implications for land management. Areas experiencing slope increases require targeted erosion control measures and sustainable farming practices. Conversely, slope reduction areas present opportunities for agricultural intensification through improved irrigation and mechanization. The findings emphasize the urgent need for slope-sensitive land use planning and differentiated conservation strategies to ensure sustainable agricultural development in Guangdong [48]. Compared with previous CLF studies that primarily focus on fragmentation in flat or gently sloped areas, our results highlight the critical role of slope gradients in shaping fragmentation dynamics, thus extending the theoretical understanding of SCLF to topographically complex and highly urbanized regions.

4.2. Divergent Drivers of Slope-Classified Cultivated Land Fragmentation

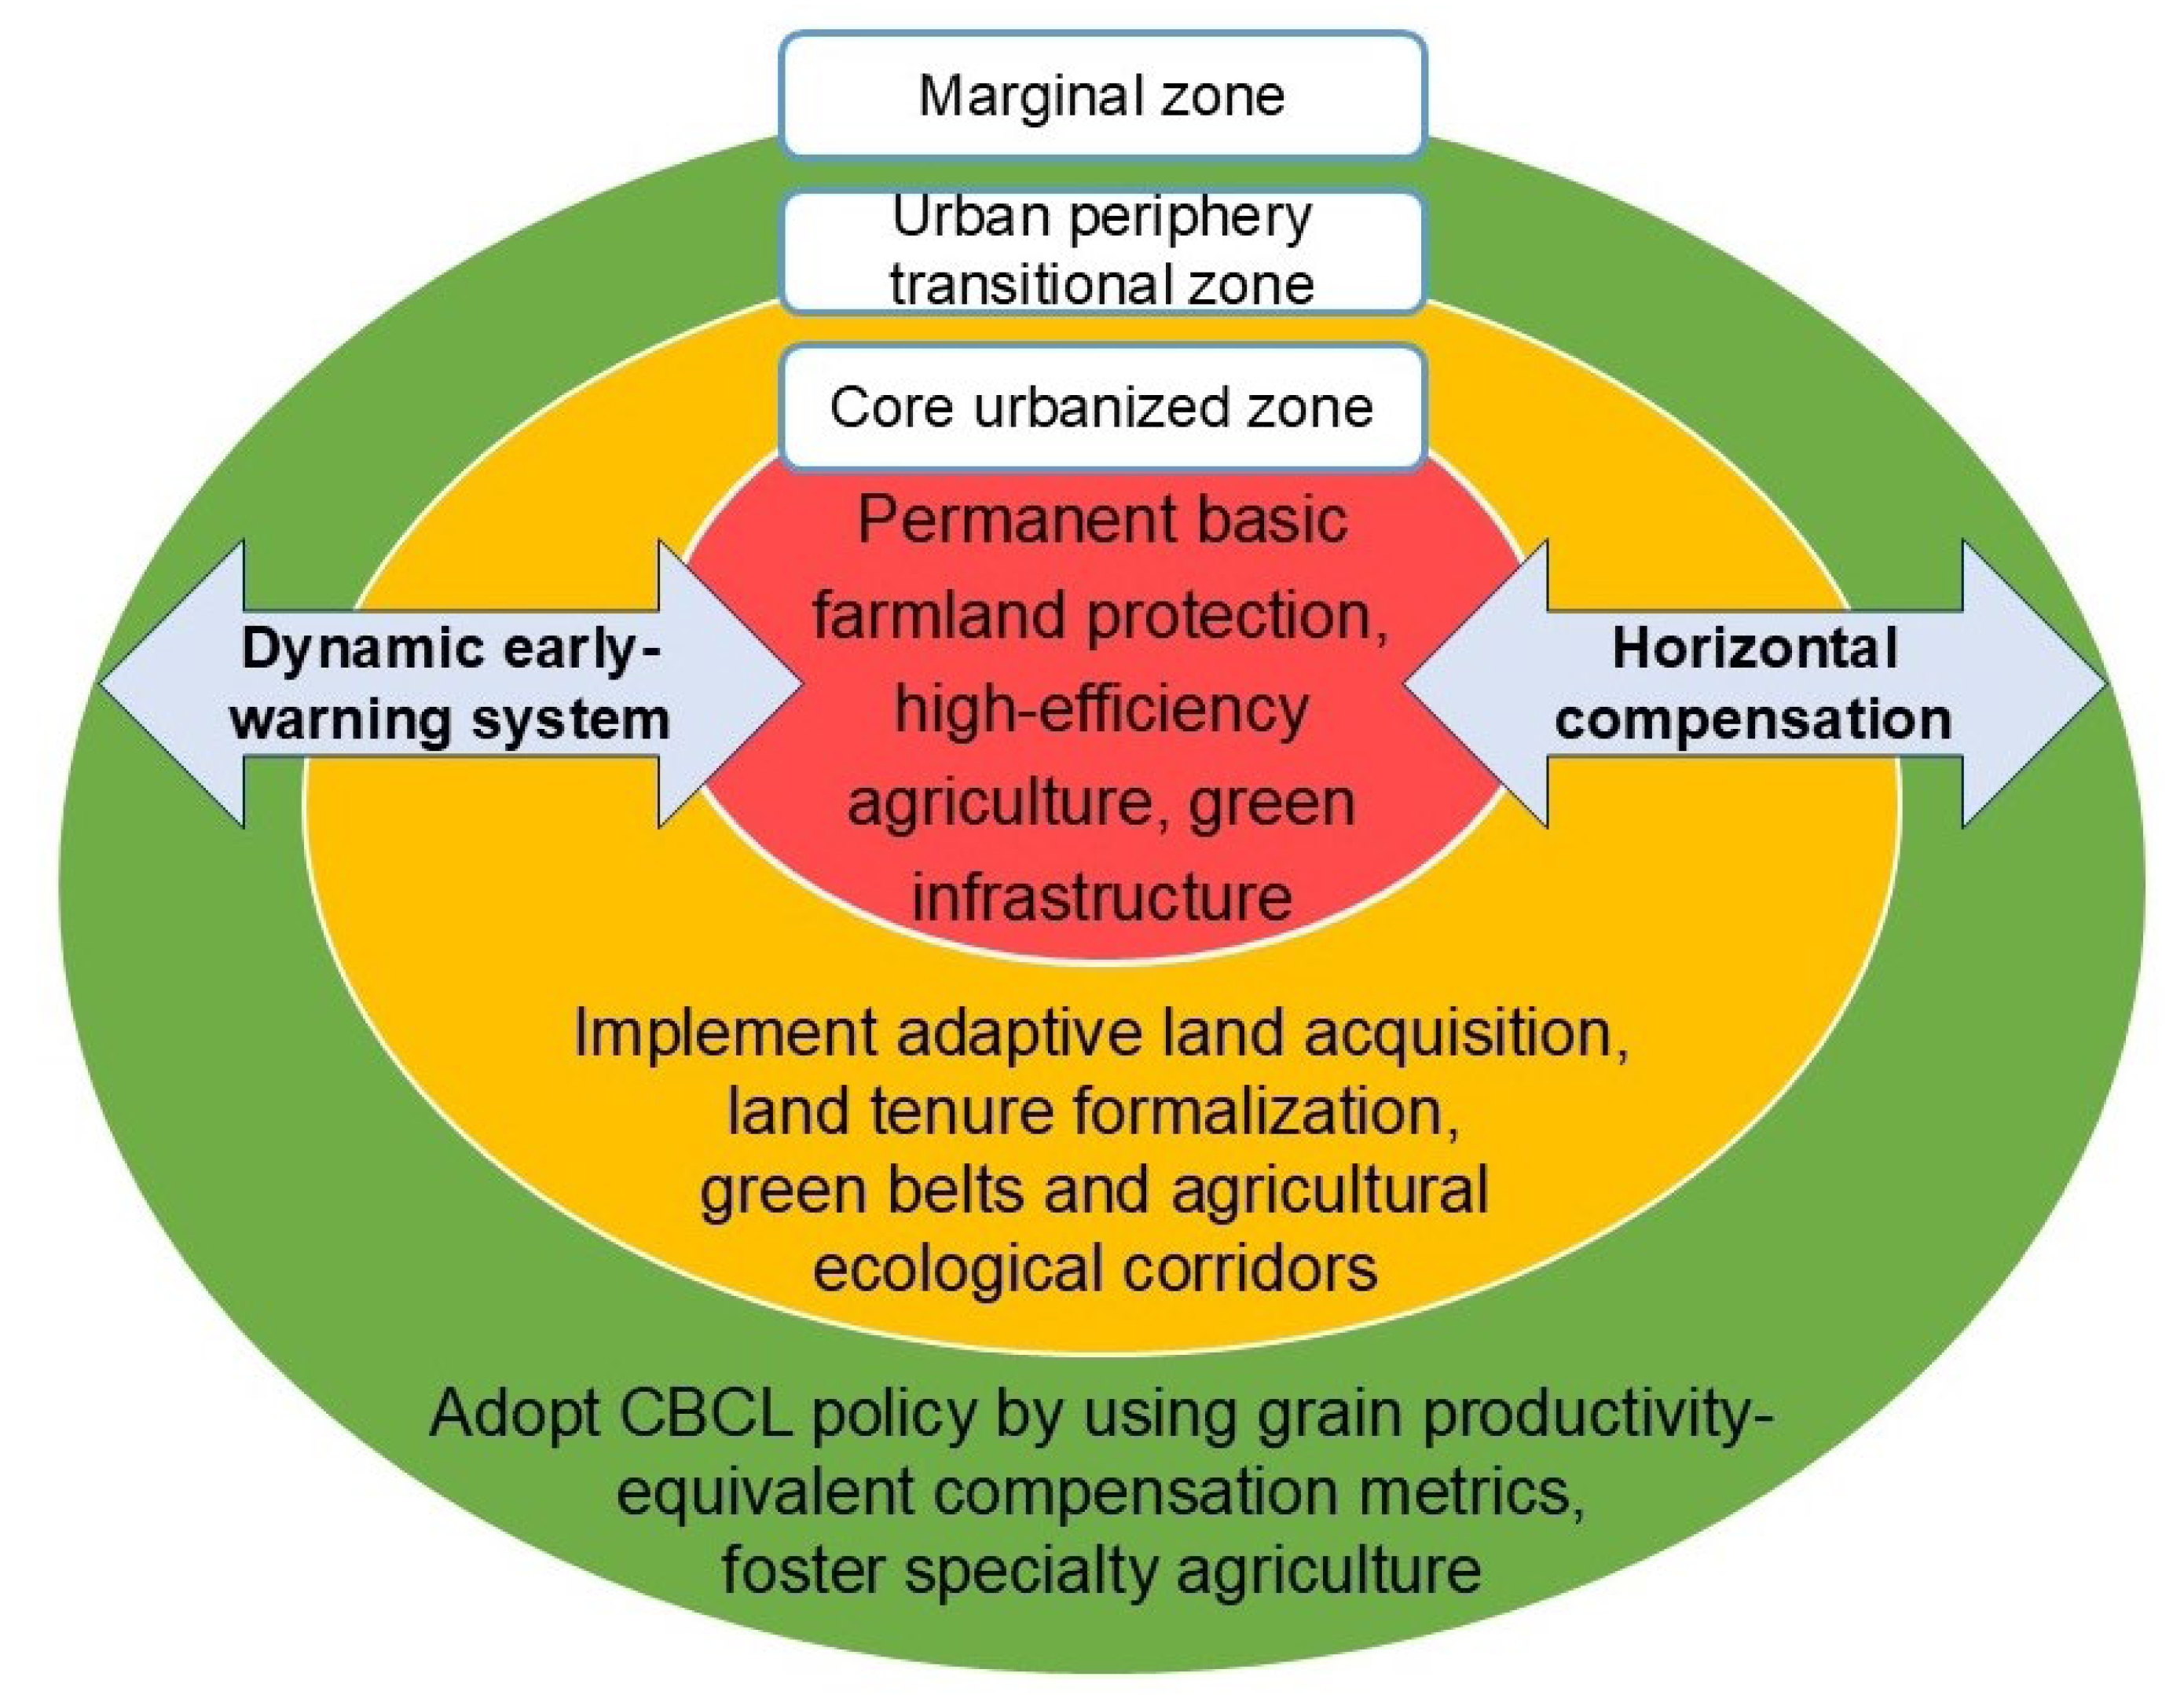
Under the urbanization gradient drive, cultivated land changes across different regions exhibit significant spatial differentiation (Figure 8). The core area with a high level of economic development and a deep degree of urbanization shows a decrease in cultivated land area and a reduction in SLCF. The cultivated land demonstrates a quantity reduction alongside decreased fragmentation due to non-agricultural land conversion competition and policy integration, transitioning towards large-scale intensive agriculture. The urban periphery transitional zones illustrate a reduction in cultivated land area but an increase in SCLF. It suffers from “pancake-style” urban sprawl erosion and land tenure fragmentation, experiencing both quantity loss through infrastructure encroachment and quality degradation from abandoned cropland and ownership disputes, manifesting as a “quantity–quality double decline”. The cultivated land area and SCLF in the outermost marginal areas have both increased. It achieves nominal quantity growth through marginal land reclamation to meet the Cultivated Land Compensation Balance (CLCB) policy requirements but falls into “low-quality expansion traps” characterized by a scattered distribution and ecological risks due to topographic constraints and livelihood-driven cultivation.
To address these gradient-based variations, a differentiated policy framework should be established for optimal land resource allocation (Figure 8). Urban cores should embrace a productivity-oriented conservation paradigm. Policy efforts should shift from merely retaining land area to enhancing land use efficiency and ecological resilience. This can be achieved by integrating permanent basic farmland protection with incentives for high-efficiency agriculture, including automation, digital monitoring systems, and eco-certification programs. Furthermore, coupling land consolidation with green infrastructure development can simultaneously mitigate fragmentation and improve agroecosystem services. Transitional periphery zones with rising fragmentation and land abandonment, should establish funds for cultivated land aggregation, implement adaptive land acquisition frameworks to curb abandonment, and expedite land tenure formalization. Simultaneously, the inclusion of landscape-level spatial planning tools, such as green belts and agricultural ecological corridors, can help limit fragmentation spillovers from urban expansion while preserving core production spaces. In marginal zone, where cultivated land slopes have increased due to compensation pressures, a policy should shift from quantity-based metrics toward slope-sensitive land protection standards. It reforms the CBCL policy by adopting grain productivity-equivalent compensation metrics, prohibits reclamation in ecologically sensitive zones, and fosters specialty agriculture, complemented by carbon sink trading mechanisms to monetize ecological conservation. Cross-regional coordination mechanisms should reinforce horizontal compensation for cultivated land protection and establish a national spatial intelligence monitoring network. This integrated approach should develop a dynamic early-warning system tracking the “land use change–ecological risk–food productivity” across gradient zones. The proposed tripartite regulation system (core zone intensification, transitional zone rehabilitation, marginal zone transformation)—through spatial zoning controls, economic incentives, and technological empowerment—shifts cultivated land management from passive quantity control to proactive pattern optimization.

4.3. Implication for Differentiated Cultivated Land Protection

SCLF exerts multifaceted and context-dependent impacts on rural development. Studies indicate that CLF generally negatively affects agricultural productivity by hindering mechanization and scale management, increasing operational costs [20] and potentially exacerbating farmland abandonment due to remote or inaccessible plots [49]. However, moderate fragmentation may enhance farmers’ income flexibility through decentralized labor allocation and diversified cropping systems, while improving the agricultural resilience to disasters [8,50]. Furthermore, CLF accelerates rural population outmigration by reducing agricultural efficiency [49] yet may alleviate land tenure conflicts [15]. Therefore, differentiated policymaking should integrate the fragmentation intensity and regional conditions, employing dynamic assessments, spatial planning optimization, and technological innovations to balance productivity, ecological integrity, and social stability [51]. The effectiveness of differentiated cultivated land protection hinges on the establishment of a dynamic, spatially explicit governance system. Firstly, an integrated land suitability and risk assessment platform was developed, incorporating multidimensional indicators including slope stability, soil fertility, SCLF indices, and climate vulnerability metrics, comprehensively monitoring the situation of the cultivated land [52]. In addition, through continuous remote sensing, AI-based land change detection, and multi-stakeholder participation embedded in the policy feedback loop, the accuracy of the land use change is ensured and the policy response capacity is enhanced. Furthermore, all projects involving the development, utilization, and conservation of cultivated land should be subject to full life-cycle management. This entails establishing a comprehensive regulatory chain that spans the entire process, from the preliminary site selection and feasibility assessment, planning approval, and construction implementation to the post-project monitoring, performance evaluation, and accountability tracking. The functional zoning and cultivable status of each plot of cultivated land should be clearly defined. A tiered early-warning mechanism should also be established to enable the targeted supervision of projects exhibiting issues such as an imbalance in land requisition–compensation or ecological degradation. Embedding differentiation into cultivated land governance, across slope conditions, fragmentation dynamics, and urbanization gradients, helps ensure that cultivated land resources are scientifically protected and sustainably utilized in the context of high-quality development.

4.4. Contributions, Limitations, and Future Research Directions

This study makes three major contributions to the theory and practice of SCLF. First, it incorporates the slope gradient as a fundamental dimension in fragmentation analysis, addressing the gap in previous CLF studies that focused primarily on flat terrains. This extension enables SCLF theory to better capture the realities of topographically diverse and rapidly urbanizing regions. Second, it proposes a “three-zone” governance framework, including core zone intensification, transitional zone rehabilitation, and marginal zone transformation, which offers a replicable model for addressing cultivated land protection challenges under the combined pressures of urban expansion and topographic constraints. Third, it empirically verifies that slope-sensitive land use planning can reconcile the tension between urban development and cultivated land protection, providing data-driven support for cultivated land protection. Compared with previous studies that largely examine CLF patterns under single-factor influences, such as urbanization rates or land tenure arrangements [30,52], this research integrates multiple dimensions within a topographic context. This multi-factor, slope-classified perspective allows for a more precise identification of fragmentation mechanisms and the design of more targeted strategies.
Despite these contributions, several limitations should be acknowledged. This study treated individual pixels as complete land use units to evaluate the county-level SCLF across different regions. However, due to the spatial resolution limitation of the remote sensing imagery (30 m), the intra-pixel variability in land cover could not be fully captured. This may introduce uncertainties or potential biases in the SCLF assessment, especially in fragmented landscapes. While this research explored key driving factors and mechanisms influencing the spatial differentiation of SCLF, the potential intermediate effects and indirect interactions between variables remain unclear. Complex socioeconomic processes may operate through multistep pathways, which are not yet fully disentangled in our analysis. Future research should consider incorporating higher-resolution datasets and applying causal inference methods, such as structural equation modeling and a mediation analysis, to better capture these indirect effects and better reflect the complexity of land use dynamics. In addition, comparative studies across regions with different socioeconomic and ecological contexts would help test the applicability and long-term impacts of the proposed “three-zone” governance framework, ensuring its broader relevance and policy effectiveness.

5. Conclusions

An innovative SCLF assessment framework was developed to analyze the spatiotemporal dynamics of the cultivated land fragmentation across slope classifications in Guangdong Province. Machine learning techniques were employed to investigate divergent SCLF drivers in different regions, enabling the formulation of differentiated spatial governance strategies. The driving mechanisms are systematically revealed using multi-source datasets. The principal findings are as follows: (1) The spatiotemporal analysis demonstrates that the PRD exhibited a continuous decreasing trend during 2000–2020, and the SCLFI in most counties dropped from greater than 0.6 to the range of 0.45–0.60. The WRGD and ERGD manifested a “decline–rebound” phased characteristic, and the SCLFI in coastal counties is higher than that in non-coastal areas. Notably, despite initially low fragmentation levels and SCLFI values below 0.30 for all units, the NRGD displayed either persistent upward trends or U-shaped evolutionary patterns. (2) The mechanism investigation identifies SCLF as an outcome of synergistic interactions among natural geographical factors, demographic dynamics, and socioeconomic transformations. Particularly, the explanatory power of socioeconomic factors, including agricultural mechanization levels, non-agricultural employment rates, and farmer income, has shown remarkable enhancements. (3) Based on the spatial heterogeneity analysis, a conceptual three-tiered gradient protection framework was proposed, consisting of the core urbanized zone, the urban periphery transitional zone, and the marginal zone. This framework underscores the necessity of adopting differentiated governance strategies tailored to the unique socioeconomic conditions and cultivated land resource characteristics of each zone. This research framework provides decision-making support for the synergistic advancement of cultivated land preservation and rural revitalization, offering practical significance for improving spatial planning systems and innovating cultivated land protection mechanisms.

Author Contributions

Conceptualization, M.S. and Y.C.; Methodology, M.S.; Formal analysis, M.S. and N.C.; Data curation, M.S., N.C. and Y.W.; Writing—original draft, M.S.; Writing—review & editing, Y.C.; Supervision, Y.C. All authors have read and agreed to the published version of the manuscript.

Funding

This research was funded by the National Natural Science Foundation of China, grant number 42371295.

Data Availability Statement

Dataset available on request from the authors.

Conflicts of Interest

The authors declare no conflicts of interest.

References

  1. Kong, X. China must protect high-quality arable land. Nature 2014, 506, 7. [Google Scholar] [CrossRef]
  2. Chen, Y.; Yao, M.; Zhao, Q.; Chen, Z.; Jiang, P.; Li, M.; Chen, D. Delineation of a basic farmland protection zone based on spatial connectivity and comprehensive quality evaluation: A case study of Changsha City, China. Land Use Policy 2021, 101, 105145. [Google Scholar] [CrossRef]
  3. Cao, Y.; Zou, J.; Fang, X.; Wang, J.; Cao, Y.; Li, G. Effect of land tenure fragmentation on the decision-making and scale of agricultural land transfer in China. Land Use Policy 2020, 99, 104996. [Google Scholar] [CrossRef]
  4. Ciaian, P.; Guri, F.; Rajcaniova, M.; Drabik, D.; Paloma, S.G.Y. Land fragmentation and production diversification: A case study from rural Albania. Land Use Policy 2018, 76, 589–599. [Google Scholar] [CrossRef]
  5. Zhou, D.; Qi, J.; Yuan, C. Progress review and prospects for farmland fragmentation in China in the past 40 years. China Land Sci. 2021, 35, 107–116. [Google Scholar]
  6. Yang, Y.; Liu, Y.; Li, Y.; Li, J. Measure of urban-rural transformation in Beijing-Tianjin-Hebei region in the new millennium: Population-land-industry perspective. Land Use Policy 2018, 79, 595–608. [Google Scholar] [CrossRef]
  7. Yang, H.; Li, Y.; Han, X.; Zheng, D. Has land fragmentation increased the cost of agricultural production for “scale farmers”?: Based on micro surveys of 776 family farms and 1166 spacialized households across the country. China Land Sci. 2019, 33, 76–83. [Google Scholar]
  8. Qiu, L.; Zhu, J.; Pan, Y.; Wu, S.; Dang, Y.; Xu, B.; Yang, H. The positive impacts of landscape fragmentation on the diversification of agricultural production in Zhejiang Province, China. J. Clean. Prod. 2020, 251, 119722. [Google Scholar] [CrossRef]
  9. Sklenicka, P.; Janovska, V.; Salek, M.; Vlasak, J.; Molnarova, K. The Farmland Rental Paradox: Extreme land ownership fragmentation as a new form of land degradation. Land Use Policy 2014, 38, 587–593. [Google Scholar] [CrossRef]
  10. Zang, L.; Araral, E.; Wang, Y. Effects of land fragmentation on the governance of the commons: Theory and evidence from 284 villages and 17 provinces in China. Land Use Policy 2019, 82, 518–527. [Google Scholar] [CrossRef]
  11. Li, Q.; Jin, T.; Peng, Q.; Lin, J.; Zhang, D.; Huang, J.; Liu, B. Identifying the extent of the spatial expression of landscape fragmentation based on scale effect analysis in Southwest China. Ecol. Indic. 2022, 141, 109120. [Google Scholar] [CrossRef]
  12. Zhou, Y.; Li, X.; Liu, Y. Cultivated land protection and rational use in China. Land Use Policy 2021, 106, 105454. [Google Scholar] [CrossRef]
  13. Li, Y.; Wu, W.; Liu, Y. Land consolidation for rural sustainability in China: Practical reflections and policy implications. Land Use Policy 2018, 74, 137–141. [Google Scholar] [CrossRef]
  14. Liu, J.; Jin, X.; Xu, W.; Sun, R.; Han, B.; Yang, X.; Gu, Z.; Xu, C.; Sui, X.; Zhou, Y. Influential factors and classification of cultivated land fragmentation, and implications for future land consolidation: A case study of Jiangsu Province in eastern China. Land Use Policy 2019, 88, 104185. [Google Scholar] [CrossRef]
  15. Ntihinyurwa, P.D.; De Vries, W.T.; Chigbu, U.E.; Dukwiyimpuhwe, P.A. The positive impacts of farm land fragmentation in Rwanda. Land Use Policy 2019, 81, 565–581. [Google Scholar] [CrossRef]
  16. Han, P.; Xiang, J.; Zhao, Q. Spatial differentiation and scenario simulation of cultivated land in mountainous areas of Western Hubei, China: A PLUS model. Environ. Sci. Pollut. Res. 2023, 30, 52804–52817. [Google Scholar] [CrossRef]
  17. Xu, W.; Jin, X.; Liu, J.; Zhou, Y. Analysis of influencing factors of cultivated land fragmentation based on hierarchical linear model: A case study of Jiangsu Province, China. Land Use Policy 2021, 101, 105119. [Google Scholar] [CrossRef]
  18. Xu, W.; Jin, X.; Liu, J.; Zhou, Y. Impact of cultivated land fragmentation on spatial heterogeneity of agricultural agglomeration in China. J. Geogr. Sci. 2020, 30, 1571–1589. [Google Scholar] [CrossRef]
  19. Liang, J.; Pan, S.; Chen, W.; Li, J.; Zhou, T. Cultivated Land Fragmentation and Its Influencing Factors Detection: A Case Study in Huaihe River Basin, China. Int. J. Environ. Res. Public Health 2021, 19, 138. [Google Scholar] [CrossRef] [PubMed]
  20. Liu, J.; Jin, X.; Xu, W.; Zhou, Y. Evolution of cultivated land fragmentation and its driving mechanism in rural development: A case study of Jiangsu Province. J. Rural Stud. 2022, 91, 58–72. [Google Scholar] [CrossRef]
  21. Yu, Q.; Hu, Q.; Van Vliet, J.; Verburg, P.H.; Wu, W. GlobeLand30 shows little cropland area loss but greater fragmentation in China. Int. J. Appl. Earth Obs. Geoinf. 2018, 66, 37–45. [Google Scholar] [CrossRef]
  22. Jiang, P.; Chen, D.; Li, M. Farmland landscape fragmentation evolution and its driving mechanism from rural to urban: A case study of Changzhou City. J. Rural Stud. 2021, 82, 1–18. [Google Scholar] [CrossRef]
  23. Zhou, B.B.; Aggarwal, R.; Wu, J.; Lv, L. Urbanization-associated farmland loss: A macro-micro comparative study in China. Land Use Policy 2021, 101, 105228. [Google Scholar] [CrossRef]
  24. Zou, L.; Wang, J.; Bai, M. Assessing spatial–temporal heterogeneity of China’s landscape fragmentation in 1980–2020. Ecol. Indic. 2022, 136, 108654. [Google Scholar] [CrossRef]
  25. Latruffe, L.; Piet, L. Does land fragmentation affect farm performance? A case study from Brittany, France. Agric. Syst. 2014, 129, 68–80. [Google Scholar] [CrossRef]
  26. Ministry of Natural Resources. The Third National Land Resource Survey 2021. Available online: https://www.gov.cn/xinwen/2021-08/26/content_5633490.htm (accessed on 27 November 2024).
  27. Song, W.; Pijanowski, B.C. The effects of China’s cultivated land balance program on potential land productivity at a national scale. Appl. Geogr. 2014, 46, 158–170. [Google Scholar] [CrossRef]
  28. Du, X.; Zhang, X.; Jin, X. Assessing the effectiveness of land consolidation for improving agricultural productivity in China. Land Use Policy 2018, 70, 360–367. [Google Scholar] [CrossRef]
  29. Jin, R.; Li, B.; Zhou, T.; Wanatowski, D.; Piroozfar, P. An empirical study of perceptions towards construction and demolition waste recycling and reuse in China. Resour. Conserv. Recycl. 2017, 126, 86–98. [Google Scholar] [CrossRef]
  30. Su, M.; Sun, K.; Deng, B.; Cheng, N.; Cao, Y. Quantification and Driving Factors of Cultivated Land Fragmentation in Rapidly Urbanizing Area: A Case Study in Guangdong Province. Remote Sens. 2024, 16, 2633. [Google Scholar] [CrossRef]
  31. Guo, A.; Yue, W.; Yang, J.; Xue, B.; Xiao, W.; Li, M.; He, T.; Zhang, M.; Jin, X.; Zhou, Q. Cropland Abandonment in China: Patterns, Drivers, and Implications for Food Security. J. Clean. Prod. 2023, 418, 138154. [Google Scholar] [CrossRef]
  32. Yang, J.; Huang, X. The 30 m annual land cover dataset and its dynamics in China from 1990 to 2019. Earth Syst. Sci. Data 2021, 13, 3907–3925. [Google Scholar] [CrossRef]
  33. GB/T 21010-2017; Land use status classification. Standards Press of China: Beijing, China, 2017.
  34. Zhou, Y.; Chen, T.; Feng, Z.; Wu, K. Identifying the contradiction between the cultivated land fragmentation and the construction land expansion from the perspective of urban-rural differences. Ecol. Inform. 2022, 71, 101826. [Google Scholar] [CrossRef]
  35. Zhou, Y.; Xu, K.; Feng, Z.; Wu, K. Quantification and driving mechanism of cultivated land fragmentation under scale differences. Ecol. Inform. 2023, 78, 102336. [Google Scholar] [CrossRef]
  36. Diakoulaki, D.; Mavrotas, G.; Papayannakis, L. Determining objective weights in multiple criteria problems: The critic method. Comput. Oper. Res. 1995, 22, 763–770. [Google Scholar] [CrossRef]
  37. Zhao, Y.; Feng, Q.; Lu, A. Spatiotemporal variation in vegetation coverage and its driving factors in the Guanzhong Basin, NW China. Ecol. Inform. 2021, 64, 101371. [Google Scholar] [CrossRef]
  38. Li, Y.; Zhou, T.; Jiang, G.; Li, G.; Zhou, D.; Luo, Y. Spatial pattern and mechanisms of farmland abandonment in Agricultural and Pastoral Areas of Qingzang Plateau. Geogr. Sustain. 2021, 2, 139–150. [Google Scholar] [CrossRef]
  39. Deng, X.; Huang, J.; Rozelle, S.; Zhang, J.; Li, Z. Impact of urbanization on cultivated land changes in China. Land Use Policy 2015, 45, 1–7. [Google Scholar] [CrossRef]
  40. Tran, T.Q.; Vu, H.V. Land Fragmentation and Household Income: First Evidence from Rural Vietnam. Land Use Policy 2019, 89, 104247. [Google Scholar] [CrossRef]
  41. Sheng, J.; Han, X.; Zhou, H. Spatially varying patterns of afforestation/reforestation and socio-economic factors in China: A geographically weighted regression approach. J. Clean. Prod. 2017, 153, 362–371. [Google Scholar] [CrossRef]
  42. Chen, T.; Guestrin, C. XGBoost: A Scalable Tree Boosting System. In Proceedings of the 22nd ACM SIGKDD International Conference on Knowledge Discovery and Data Mining, San Francisco, CA, USA, 13–17 August 2016; pp. 785–794. [Google Scholar] [CrossRef]
  43. Lundberg, S.; Lee, S.I. A Unified Approach to Interpreting Model Predictions. arXiv 2017. [Google Scholar] [CrossRef]
  44. Jia, Y.; Chen, Z.; Lu, X.; Sheng, S.; Huang, J.; Wang, Y. The degradation and marginal effects of green space under the stress of urban sprawl in the metropolitan area. Urban For. Urban Green. 2024, 95, 128318. [Google Scholar] [CrossRef]
  45. Chen, Y.; Ma, W.; Shao, Y.; Wang, N.; Yu, Z.; Li, H.; Hu, Q. The impacts and thresholds detection of 2D/3D urban morphology on the heat island effects at the functional zone in megacity during heatwave event. Sustain. Cities Soc. 2025, 118, 106002. [Google Scholar] [CrossRef]
  46. Ke, X.; Van Vliet, J.; Zhou, T.; Verburg, P.H.; Zheng, W.; Liu, X. Direct and indirect loss of natural habitat due to built-up area expansion: A model-based analysis for the city of Wuhan, China. Land Use Policy 2018, 74, 231–239. [Google Scholar] [CrossRef]
  47. Zheng, W.; Ke, X.; Zhou, T.; Yang, B. Trade-offs between cropland quality and ecosystem services of marginal compensated cropland—A case study in Wuhan, China. Ecol. Indic. 2019, 105, 613–620. [Google Scholar] [CrossRef]
  48. Xu, M.; Niu, L.; Wang, X.; Zhang, Z. Evolution of farmland landscape fragmentation and its driving factors in the Beijing-Tianjin-Hebei region. J. Clean. Prod. 2023, 418, 138031. [Google Scholar] [CrossRef]
  49. Ge, D.; Long, H.; Qiao, W.; Wang, Z.; Sun, D.; Yang, R. Effects of rural–urban migration on agricultural transformation: A case of Yucheng City, China. J. Rural Stud. 2020, 76, 85–95. [Google Scholar] [CrossRef]
  50. Guo, G.; Ding, C. Quantitative research of the impact of land fragmentation on scale returns of grain production-based on empirical data of Yancheng City and Xuzhou City in Jiangsu Province. J. Nat. Resour. 2016, 31, 202–214. [Google Scholar]
  51. Ntihinyurwa, P.D.; De Vries, W.T. Farmland fragmentation and defragmentation nexus: Scoping the causes, impacts, and the conditions determining its management decisions. Ecol. Indic. 2020, 119, 106828. [Google Scholar] [CrossRef]
  52. Cao, Y.; Cao, Y.; Li, G.; Tian, Y.; Fang, X.; Li, Y.; Tan, Y. Linking ecosystem services trade-offs, bundles and hotspot identification with cropland management in the coastal Hangzhou Bay area of China. Land Use Policy 2020, 97, 104689. [Google Scholar] [CrossRef]
Figure 1. The location of Guangdong Province, China. The full map of China is made based on the standard map with the review number GS (2019) 1822, downloaded from the standard map service website of the Ministry of Natural Resources.
Remotesensing 17 02855 g001
Figure 2. Slope-classified cultivated land area in Guangdong from 2000 to 2020.
Remotesensing 17 02855 g002
Figure 3. Slope-classified cultivated land use change in Guangdong from 2000 to 2020.
Remotesensing 17 02855 g003
Figure 4. Temporal and spatial differences in slope-classified cultivated land in Guangdong Province during 2000–2020.
Remotesensing 17 02855 g004
Figure 5. Spatial distribution of SCLFI in Guangdong Province in 2000, 2010, and 2020 and SCLF trends from 2000 to 2020.
Remotesensing 17 02855 g005
Figure 6. Patterns of Guangdong Province based on the changes in the cultivated land area and SCLFI.
Remotesensing 17 02855 g006
Figure 7. The relative importance and differences in the contribution of SCLFI indicators.
Remotesensing 17 02855 g007
Figure 8. Policy guidelines for each zone.
Remotesensing 17 02855 g008
Table 1. Explanatory variable for slope-classified cultivated land fragmentation.
FactorVariableDescriptionUnitVIF
Natural factorsWNDWater network density of each countykm/km25.132
ATAverage temperature of each county°C1.913
APAnnual precipitation of each countymm2.245
Socioeconomic factorsOVAGross output value of agriculture of each county104 RMB3.539
OGOutput of grain of each countyt5.390
AGOAverage grain output per mu in each countykg/mu1.606
DIRPer capita disposable income of rural households in each countyRMB7.245
PGDPPer capita gross domestic product of each countyRMB2.685
DIUPer capita disposable income of urban households in each countyRMB6.244
LGBELocal government budgetary expenditure of each county104 RMB2.222
RNDRoad network density of each countykm/km25.110
PAMTotal power of agricultural machinery of each countykW3.075
PopulationNAENumber of agricultural employees in each county/5.967
PRNProportion of rural labor engaged in non-agricultural industries in each county%2.311
Table 2. Determination coefficient (R2) and root mean square error (RMSE) of XGBoost.
200020102020
R2RMSER2RMSER2RMSE
Area decrease–SCLFI decline0.6190.1450.7730.0700.6580.078
Area increase–SCLFI rise0.6520.0940.6760.0680.8870.032
Area decrease–SCLFI rise0.7190.2110.4640.1570.8660.177
Guangdong0.6250.1580.5970.1290.6450.111
Disclaimer/Publisher’s Note: The statements, opinions and data contained in all publications are solely those of the individual author(s) and contributor(s) and not of MDPI and/or the editor(s). MDPI and/or the editor(s) disclaim responsibility for any injury to people or property resulting from any ideas, methods, instructions or products referred to in the content.