Article

Deep-Learning-Based Multi-Channel Satellite Precipitation Forecasting Enhanced by Cloud Phase Classification

1
School of Information Science and Engineering, Dalian Polytechnic University, Dalian 116034, China
2
Key Laboratory of Earth System Numerical Modeling and Application, Institute of Atmospheric Physics, Chinese Academy of Sciences, Beijing 100029, China
3
Beijing Institute of Applied Meteorology, Beijing 100029, China
4
Public Meteorological Service Center, China Meteorological Administration, Beijing 100081, China
5
College of Marine Sciences, University of Chinese Academy of Sciences, Qingdao 266400, China
*
Author to whom correspondence should be addressed.
Remote Sens. 2025, 17(16), 2853; https://doi.org/10.3390/rs17162853 (registering DOI)
Submission received: 6 July 2025 / Revised: 6 August 2025 / Accepted: 13 August 2025 / Published: 16 August 2025

Abstract

Clouds are closely related to precipitation, as their type, microphysical characteristics, and dynamic properties determine the intensity, duration, and form of rainfall. While geostationary satellites offer continuous cloud-top observations, they cannot capture the full three-dimensional structure of clouds, limiting the accuracy of precipitation forecasting based on geostationary satellite data. However, cloud–precipitation relationships contain valuable physical information that can be leveraged to improve forecasting performance. To further enhance the precision of satellite precipitation forecasting, this study proposes a multi-channel satellite precipitation forecasting method that integrates cloud classification products. The method combines precipitation-prior information from Himawari-8 satellite cloud classification products with multi-channel satellite observations to generate precipitation forecasts for the next four hours. This approach further exploits the potential of satellite observations in precipitation forecasting. Experimental results show that integrating cloud classification products improves the Critical Success Index by 8.0%, improves the Correlation Coefficient by 5.8%, and reduces the Mean Squared Error by 3.0%, but increases the MAE by 4.5%. It is proven that this method can effectively improve the accuracy of multi-channel satellite precipitation forecasting.

1. Introduction

Accurate precipitation forecasting is increasingly critical for societal development [1]. In addition to enhancing daily convenience, precise precipitation forecasting is essential for a wide range of sectors, including transportation, agricultural production, energy management, and aviation safety [2,3]. The growing demands of socio-economic development underscore the urgent need for reliable precipitation forecasting capabilities [4]. Geostationary meteorological satellites, renowned for their ability to provide large-scale, continuous, and unrestricted observations, play a pivotal role in weather monitoring and disaster early warning systems [5,6]. Despite their advantages, such as their high spatial and temporal resolution, which facilitate their application in meteorological studies, the instrumentation onboard geostationary satellites is predominantly limited to passive sensors due to the inherent constraints of their orbital characteristics. Consequently, these satellites are primarily capable of retrieving cloud-top brightness temperature and reflectance data, while lacking the ability to capture the three-dimensional structure of clouds [7]. This limitation significantly impedes the accuracy of precipitation forecasting based on geostationary satellite data, presenting considerable challenges for their utilization in precipitation-related research and applications.
Polar-orbiting satellites can obtain information about water droplets and ice crystals within clouds through their onboard microwave sensors, providing observation data with a solid physical foundation [8]. In contrast, due to the observational limitations of geostationary meteorological satellites, the scanning radiometers carried by these satellites are typically only capable of measuring cloud-top brightness temperature and reflectance. Compared to polar-orbiting meteorological satellites, the observational data acquired by geostationary satellites lack a robust physical basis for precipitation-related tasks, which limits the accuracy of precipitation forecasting based on geostationary satellite data to some extent [9]. However, geostationary satellites offer high spatial and temporal resolution, and their continuous monitoring capability is important for time-sensitive applications.
In previous studies, we proposed a deep-learning-based multi-channel satellite precipitation forecasting method. This approach takes time-series multi-channel satellite observations as input and directly outputs 4-h precipitation forecasts. Through comprehensive experiments involving different band combination schemes, ablation studies, and comparative analyses with multiple models, the study demonstrated the effectiveness of this methodology [10]. Nevertheless, the characteristics of geostationary satellite observations constrain the accuracy of model-based precipitation forecasting to some degree. Therefore, we aim to explore a method to improve the accuracy of multi-channel satellite precipitation forecasting by addressing the unique observational characteristics of geostationary satellites. Enhancing the correlation between geostationary satellite observations and precipitation becomes a critical issue. Clouds are a prerequisite for precipitation, and their type, microphysical processes, and dynamic properties determine the intensity, duration, and type of precipitation [11,12,13]. Leveraging the relationship between clouds and precipitation can help improve the accuracy of satellite-based precipitation forecasting models. Thus, the key challenge of this study lies in how to effectively integrate satellite cloud classification products with multi-channel satellite observations.
Under these circumstances, how to further enhance the performance of satellite-based precipitation forecasting under existing conditions has become a direction worthy of in-depth research. Previous studies on quantitative precipitation estimation (QPE) based on satellite observations have explored related approaches [14,15,16,17], such as using predefined features and clustering methods to divide cloud clusters into distinct cloud patches. These methods have to some extent improved the performance of QPE products, representing an initial attempt to apply cloud classification products to precipitation estimation tasks [18,19]. However, these approaches do not systematically evaluate the relationship between different cloud types and precipitation, nor do they consider the future evolution of clouds. Additionally, the classification of clouds based on limited features is insufficient to capture the differences among various cloud types [20]. Therefore, systematically analyzing the relationship between different cloud types and precipitation is important. Furthermore, for precipitation forecasting tasks, future precipitation characteristics are closely related to the evolution of clouds over time. Integrating the temporal variation features of cloud types could further enhance the utility of cloud classification products.
To address the limitations inherent in geostationary satellite observations, we propose a novel approach that incorporates cloud classification products into multi-channel satellite precipitation forecasting. By integrating prior information from cloud classification products, we construct a probability of precipitation matrix, which serves as an auxiliary input to the forecasting model. This matrix is combined with time-series satellite observation data and input into a multi-channel satellite precipitation forecasting network to generate precipitation forecasts for the next four hours. Specifically, the proposed method strengthens the correlation between geostationary satellite infrared observations and precipitation by leveraging cloud classification priors, thereby further exploiting the potential of satellite observations and improving forecasting accuracy. Building on previous research [10], this study further conducts research on the multi-channel satellite precipitation forecasting method that integrates cloud classification products. By incorporating cloud classification products into the multi-channel satellite precipitation forecasting model, this study systematically evaluates their impact on precipitation prediction accuracy.

2. Data

This section describes the sources of various datasets used in the experiments and their preprocessing methods. Additionally, it explains how cloud classification products are integrated with satellite observations to develop multi-channel satellite precipitation forecasting.

2.1. FY-4A Satellite

The FY-4A satellite, China’s new-generation geostationary meteorological satellite, was launched on 11 December 2016, from the Xichang Satellite Launch Center and successfully positioned at 99.5°E above the equator on 17 December 2016. On 25 September 2017, the satellite was officially relocated to 104.7°E above the equator to commence operational duties. The FY-4A satellite is equipped with multiple advanced instruments, including the Advanced Geostationary Radiation Imager (AGRI), the Geostationary Interferometric Infrared Sounder (GIIRS), and the Lightning Mapping Imager (LMI).
This study focuses primarily on the AGRI, the primary payload of the FY-4A satellite. The AGRI features 14 observation channels, including visible, near-infrared, water vapor, and infrared channels, which represent a nearly threefold increase compared to the five channels of the previous-generation Fengyun-2 series of satellites [21,22]. This expansion enables the acquisition of richer observational data. For instance, while the Fengyun-2 series had only one visible channel, the FY-4A satellite is equipped with three visible channels, allowing for the generation of color observational images [23]. Additionally, the Fengyun-2 series required one hour to complete a full-disk scan, whereas the FY-4A satellite achieves this in just 15 min [24]. During flood seasons, it can perform rapid scans of China and the surrounding regions every five minutes, demonstrating significant advantages in both the spatial resolution and temporal frequency of observational data [25]. Figure 1 shows the infrared band visualization image from the FY-4A satellite.

2.2. Himawari-8 Cloud Classification Products

The Himawari-8 satellite, the third-generation geostationary meteorological satellite operated by the Japan Meteorological Agency (JMA), officially began broadcasting observational data on 2 July 2015. Positioned at 140.7°E above the equator, the satellite commenced its operational duties. Himawari-8 is equipped with the Advanced Himawari Imager (AHI), which features sixteen observational channels, including three visible channels, three near-infrared channels, one shortwave infrared channel, three water vapor channels, and six infrared channels. The AHI can complete a full-disk scan every 10 min and achieves a scanning frequency of 2.5 min for the Japanese region [26].
The Japan Aerospace Exploration Agency (JAXA) has developed various cloud products for the Himawari-8 satellite [27]. The cloud classification product of Himawari-8 is generated by performing cloud detection and classification based on the AHI. The core algorithm primarily relies on a threshold-based approach combined with radiative transfer simulations. In addition to the original AHI brightness temperature and reflectance data, the processing makes extensive use of auxiliary datasets, including atmospheric profile data from Numerical Weather Prediction (NWP) models, the USGS Bidirectional Reflectance Distribution Function (BRDF) database for surface background separation, as well as geometric information such as solar zenith angle and satellite zenith/azimuth angles. Observations from the CALIPSO satellite’s lidar are used for performance validation [28].
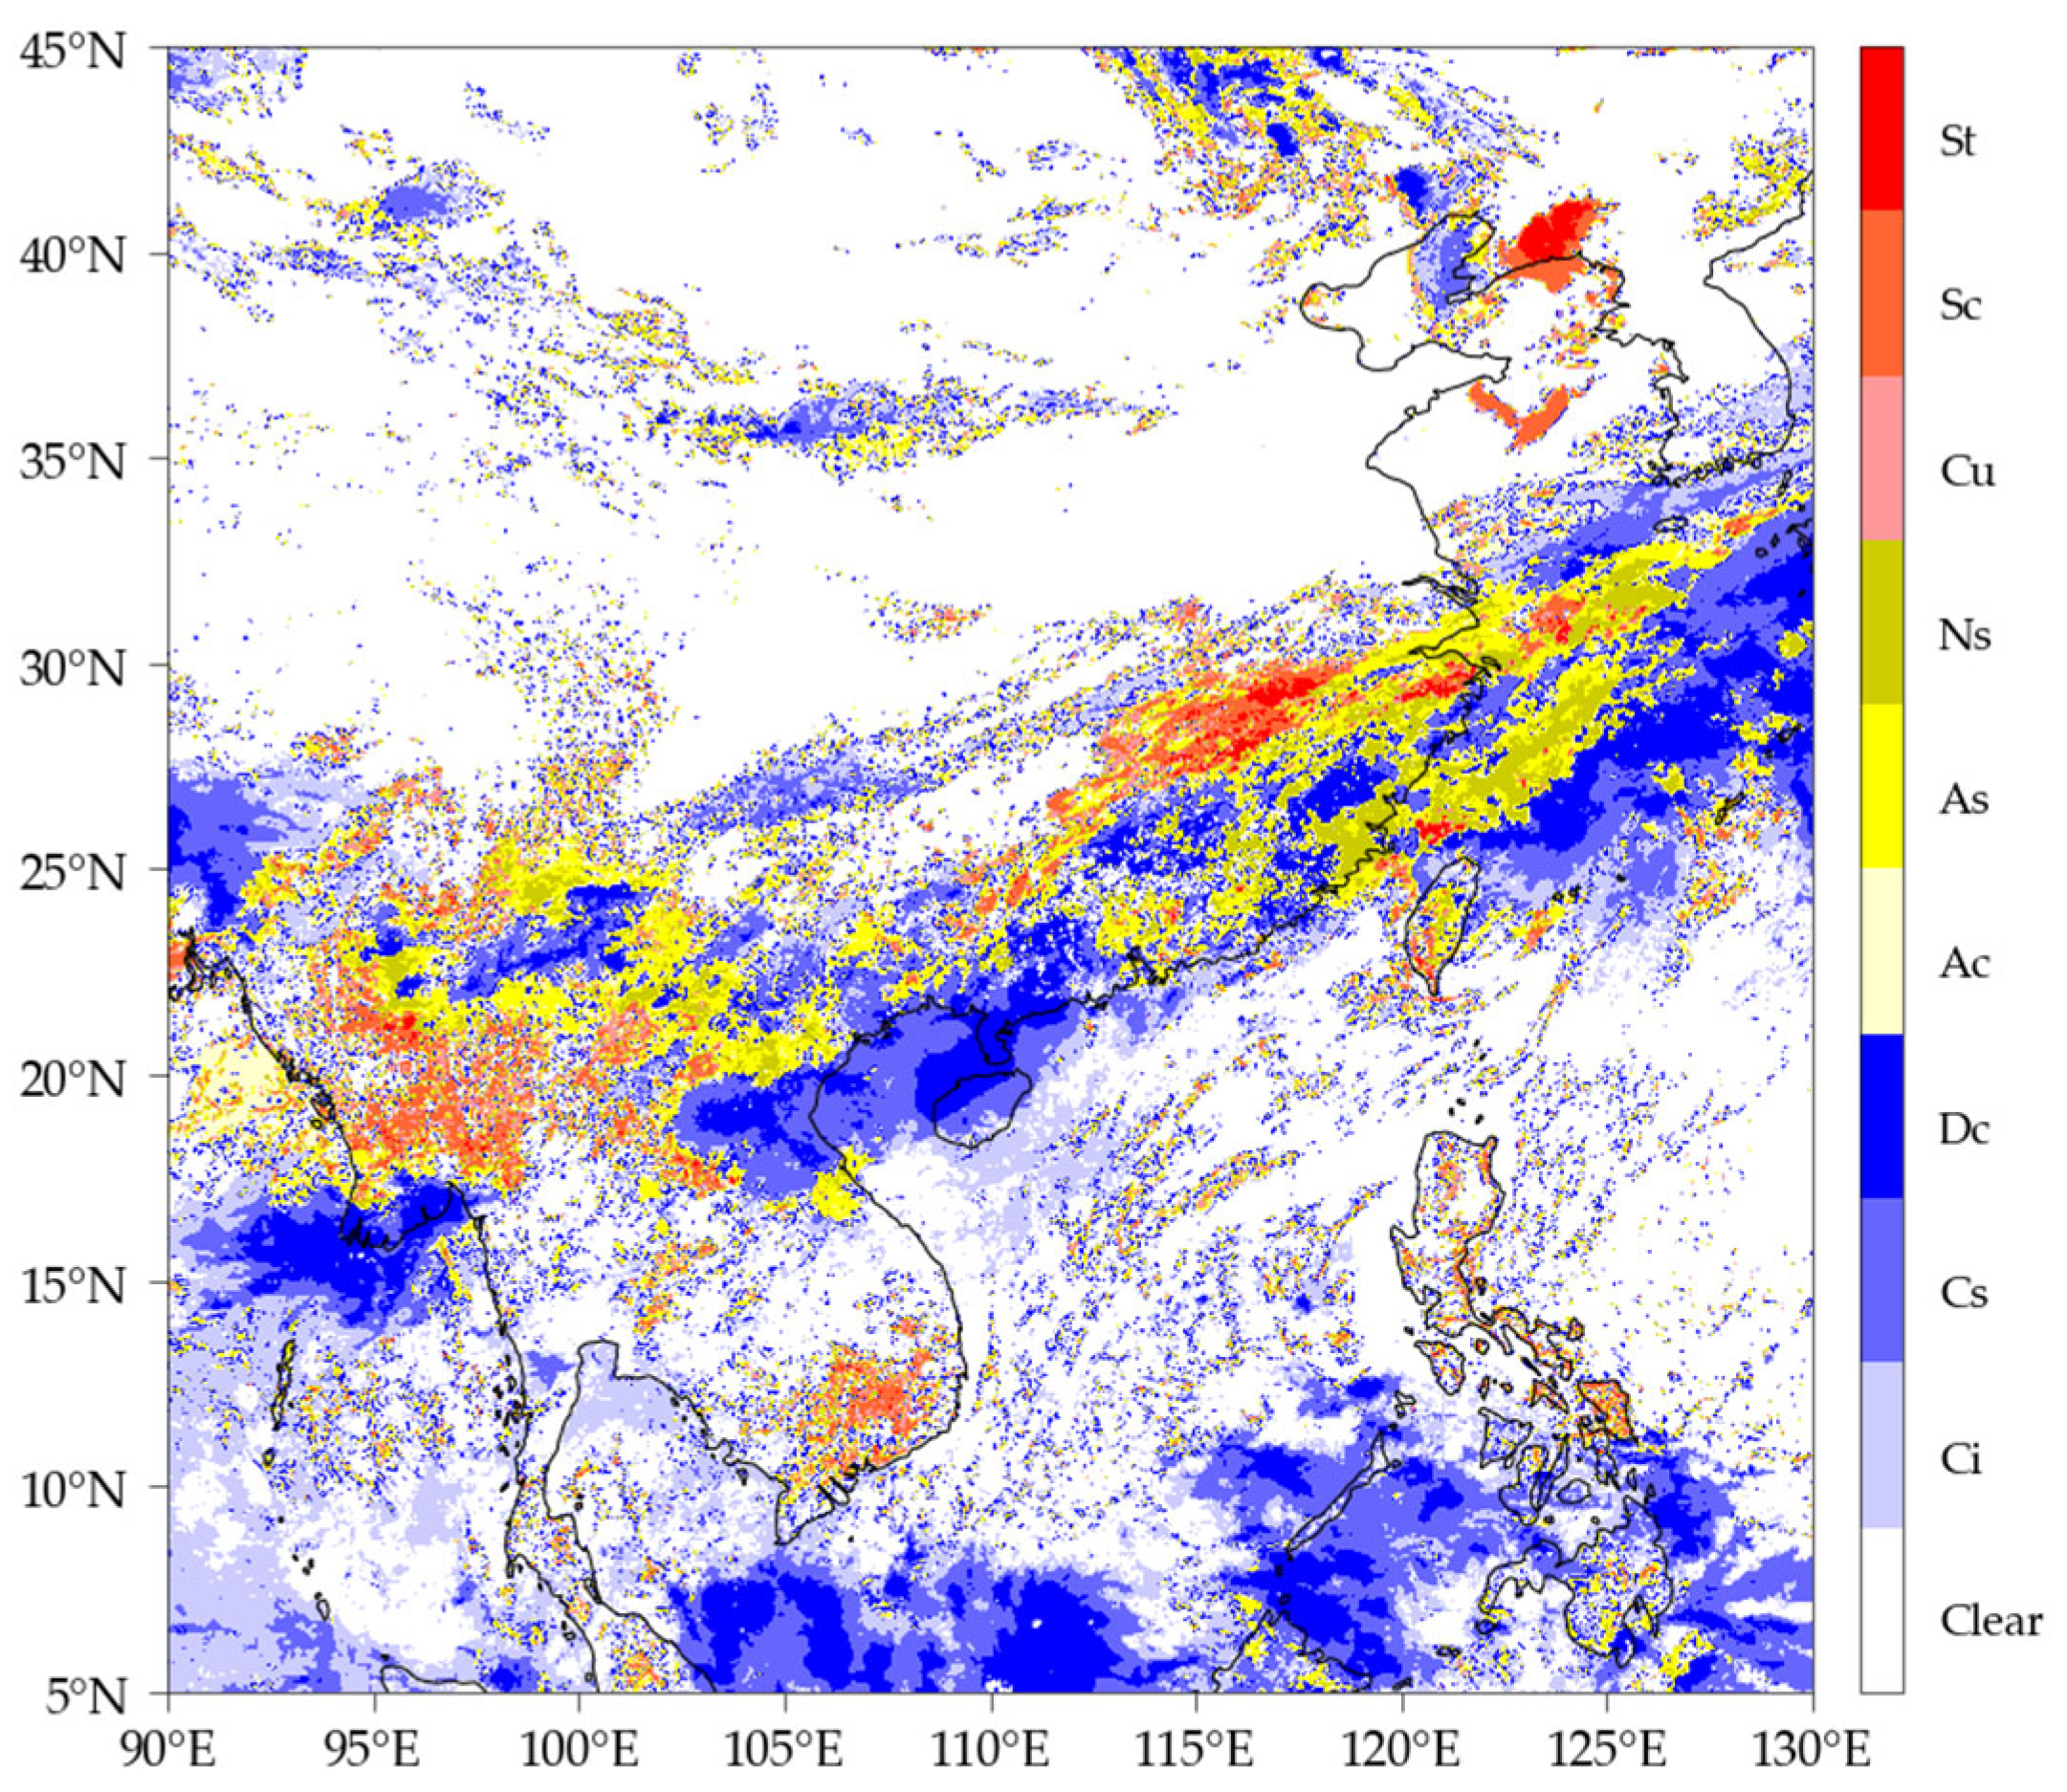
In this study, the cloud classification products from Himawari-8 are utilized as label data during model training and as evaluation data during testing. These data products can be accessed through the following website: https://www.eorc.jaxa.jp/ptree/index.html. (accessed on 19 July 2025) The cloud classification products are distributed in NetCDF format, with the CLTYPE variable representing the cloud classification data. The CLTYPE variable uses numerical values ranging from 0 to 9 to denote different cloud types and clear skies. The classification follows the International Satellite Cloud Climatology Project (ISCCP) standards [29], with cloud types including the following: 1. Cirrus (Ci), 2. Cirro-stratus (Cs), 3. deep convection (Dc), 4. Alto-cumulus (Ac), 5. Alto-stratus (As), 6. Nimbo-stratus (Ns), 7. Cumulus (Cu), 8. Strato-cumulus (Sc), and 9. Stratus (St). A visualization of the Himawari-8 cloud classification products is shown in Figure 2.

2.3. Precipitation Data

The Global Precipitation Measurement (GPM) mission is an international satellite initiative designed to provide global observations of rain and snow. At its core, the GPM program deploys a core satellite equipped with advanced radar and radiometer instruments to measure atmospheric precipitation. The observations from the core satellite serve as a reference standard to unify and calibrate the data from other operational satellites within the program [30,31]. By monitoring global precipitation, the GPM mission aims to enhance the understanding of the global water and energy cycles and improve the forecasting capabilities for natural disasters and extreme weather events [32,33]. The GPM core satellite carries two primary instruments: the Dual-frequency Precipitation Radar (DPR) and the GPM Microwave Imager (GMI) [34]. The DPR consists of two radar systems: the Ka-band Precipitation Radar (KaPR) operating at 35.5 GHz and the Ku-band Precipitation Radar (KuPR) operating at 13.6 GHz. The simultaneous observations from the KaPR and KuPR enable the retrieval of droplet size distribution information under moderate precipitation conditions. The GMI, on the other hand, is a scanning multi-channel microwave imager with a swath width of 885 km. It features 13 channels covering a frequency range from 10 GHz to 183 GHz. The GMI is optimized with specific frequencies to detect varying levels of precipitation, and the differences between its channels can be used as indicators of optical thickness, water content, and precipitation intensity [35].
The GPM-IMERG (Integrated Multi-satellitE Retrievals for GPM) product is a key precipitation dataset within the GPM mission, designed to provide high-spatiotemporal-resolution global QPE [36]. This product aims to enhance the understanding and monitoring of global precipitation patterns [37,38]. The GPM-IMERG algorithm integrates observational data from multiple meteorological satellites over a given time period to estimate precipitation rates across most regions of the Earth’s surface. By combining infrared (IR), microwave (MW), and ground-based observations, the algorithm produces gridded precipitation products with a temporal resolution of 30 min and a spatial resolution of 0.1° × 0.1° [39,40]. Over time, the accumulation of this dataset will help researchers better understand climate and weather models, while also strengthening its applications in disaster early warning, extreme event analysis, and energy development [41,42]. In this study, the GPM-IMERG product is utilized as the label data for model training.
In addition, ground-based rain gauge observations are introduced in the evaluation phase of the experiments. Rain gauge data provide higher accuracy in precipitation measurements, although their spatial representativeness is limited due to the localized nature of the measurements. Despite this limitation, rain gauge data are widely used for the validation of precipitation-related tasks. In this study, ground-based rain gauge observations are utilized to objectively evaluate the accuracy of the multi-channel satellite precipitation forecasting method integrated with cloud classification products. The rain gauge data are obtained from automatic weather stations across China, providing hourly cumulative precipitation measurements [43,44]. These data serve as a reliable reference for assessing the performance of the proposed method.

2.4. Analysis of Cloud–Precipitation Relationships

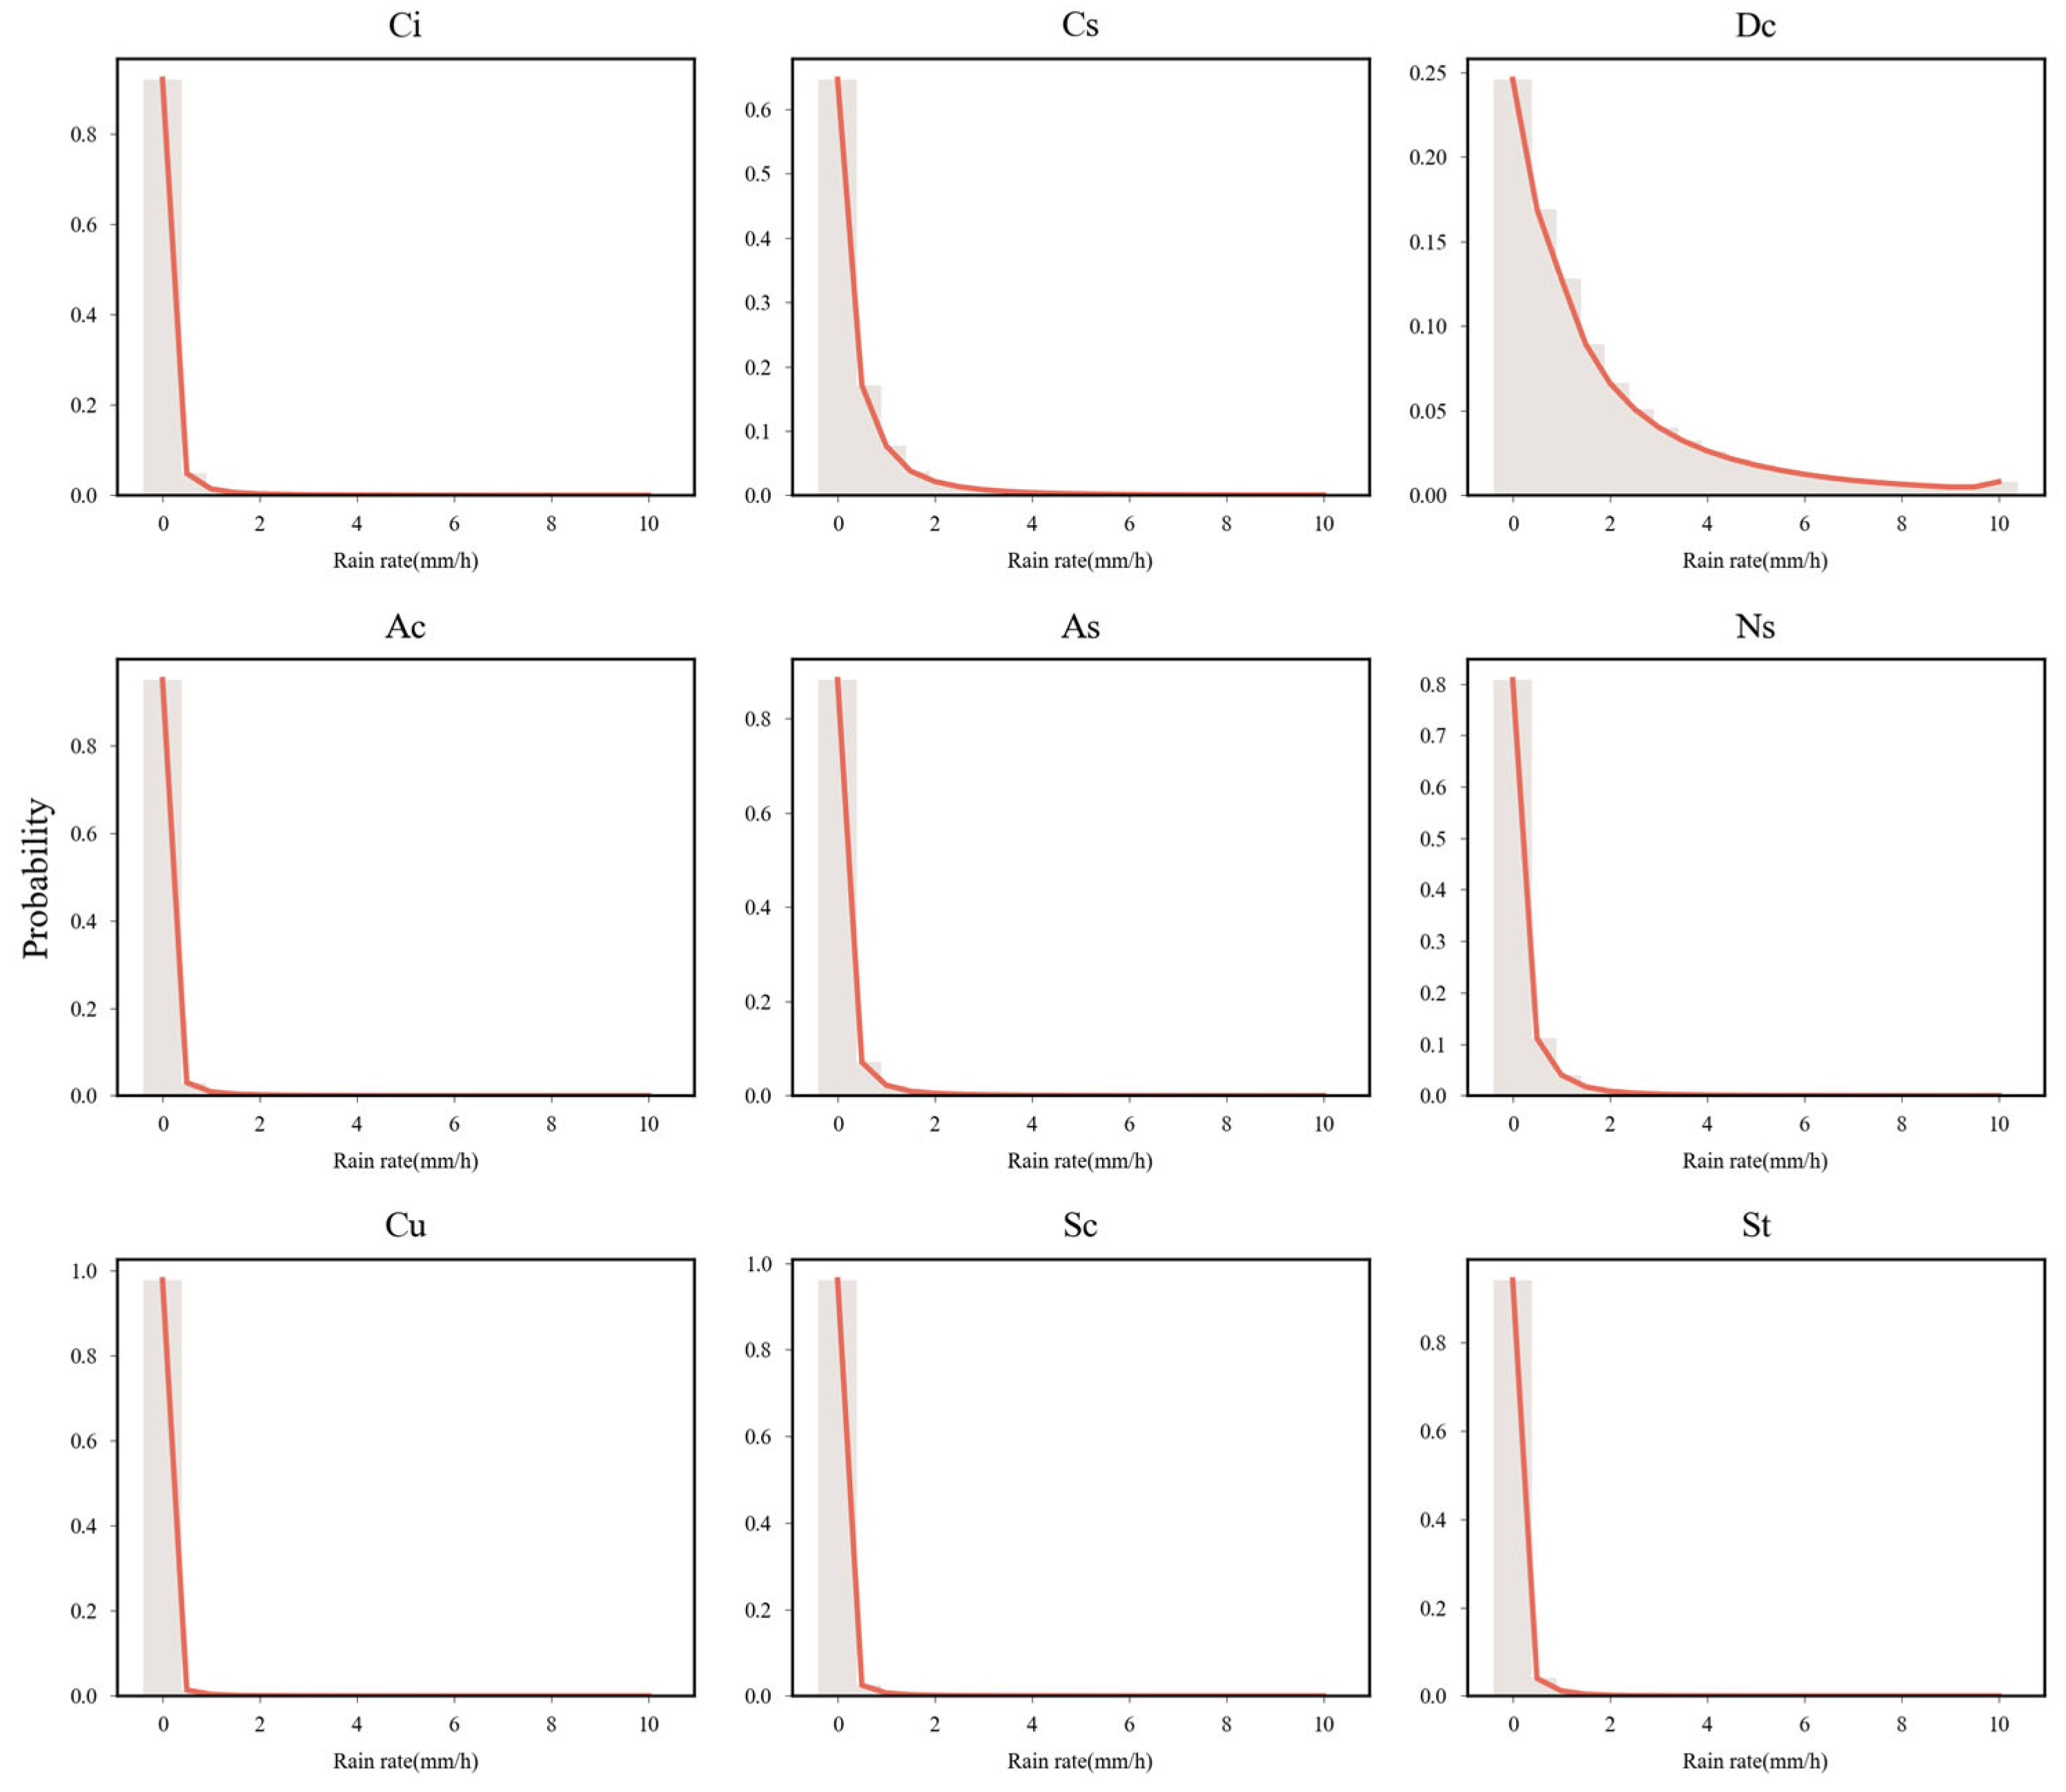
The analysis of cloud–precipitation relationships is a fundamental aspect of this study, as clouds play a critical role in the formation and distribution of precipitation. The types, microphysical properties, and dynamic evolution of clouds directly influence the intensity, duration, and spatial extent of precipitation events. Therefore, to provide a clearer representation of the precipitation rate distribution across different cloud types, this study conducted a statistical analysis of precipitation rates associated with various cloud types. In this analysis, the GPM-IMERG dataset with a temporal resolution of 30 min was employed to derive the precipitation rate distribution for different cloud categories, based on a total of 7344 samples collected from May to September during the years 2018 to 2020. At the same moment, cloud classification data were matched pixel by pixel with GPM-IMERG precipitation data, ensuring a precise correspondence between cloud type and precipitation rates. Given the complexity and variability of precipitation, which often exhibits extreme values, a threshold of 10 mm/h was applied to enhance clarity in the presentation of precipitation rate distributions. Precipitation rates exceeding 10 mm/h were aggregated into a single category.
The resulting distribution of precipitation rates for different cloud types is illustrated in Figure 3. In this figure, the vertical axis represents precipitation frequency, while the horizontal axis denotes precipitation rate. The analysis includes clear-sky conditions alongside nine distinct cloud types classified according to the ISCCP standard. The histogram bin size was set at 0.5 mm/h increments, with the initial bin including 0.1–0.5 mm/h. This binning approach provides a comprehensive statistical representation of the precipitation rate distribution across different cloud types.
According to the statistical results in Figure 3, deep convective clouds have a precipitation probability exceeding 75%, making them the most likely cloud type to produce rainfall. They are also typically associated with higher precipitation rates compared to other cloud types. In contrast, Cirro-stratus clouds typically exhibit precipitation rates below 3.5 mm/h, with a precipitation probability of only around 35%. Nimbo-stratus clouds have an even lower precipitation probability of approximately 20%, with precipitation primarily occurring at rates below 2 mm/h. For other cloud types, precipitation is almost negligible. However, some uncertainties exist in the analysis results. On one hand, the cloud classification product is affected by parallax errors from geostationary satellites, leading to pixel distortions that introduce errors when matching pixels based on their spatial locations. On the other hand, the GPM-IMERG product itself has inherent uncertainties, and its resolution is relatively low compared to satellite observation data, further contributing to these errors.
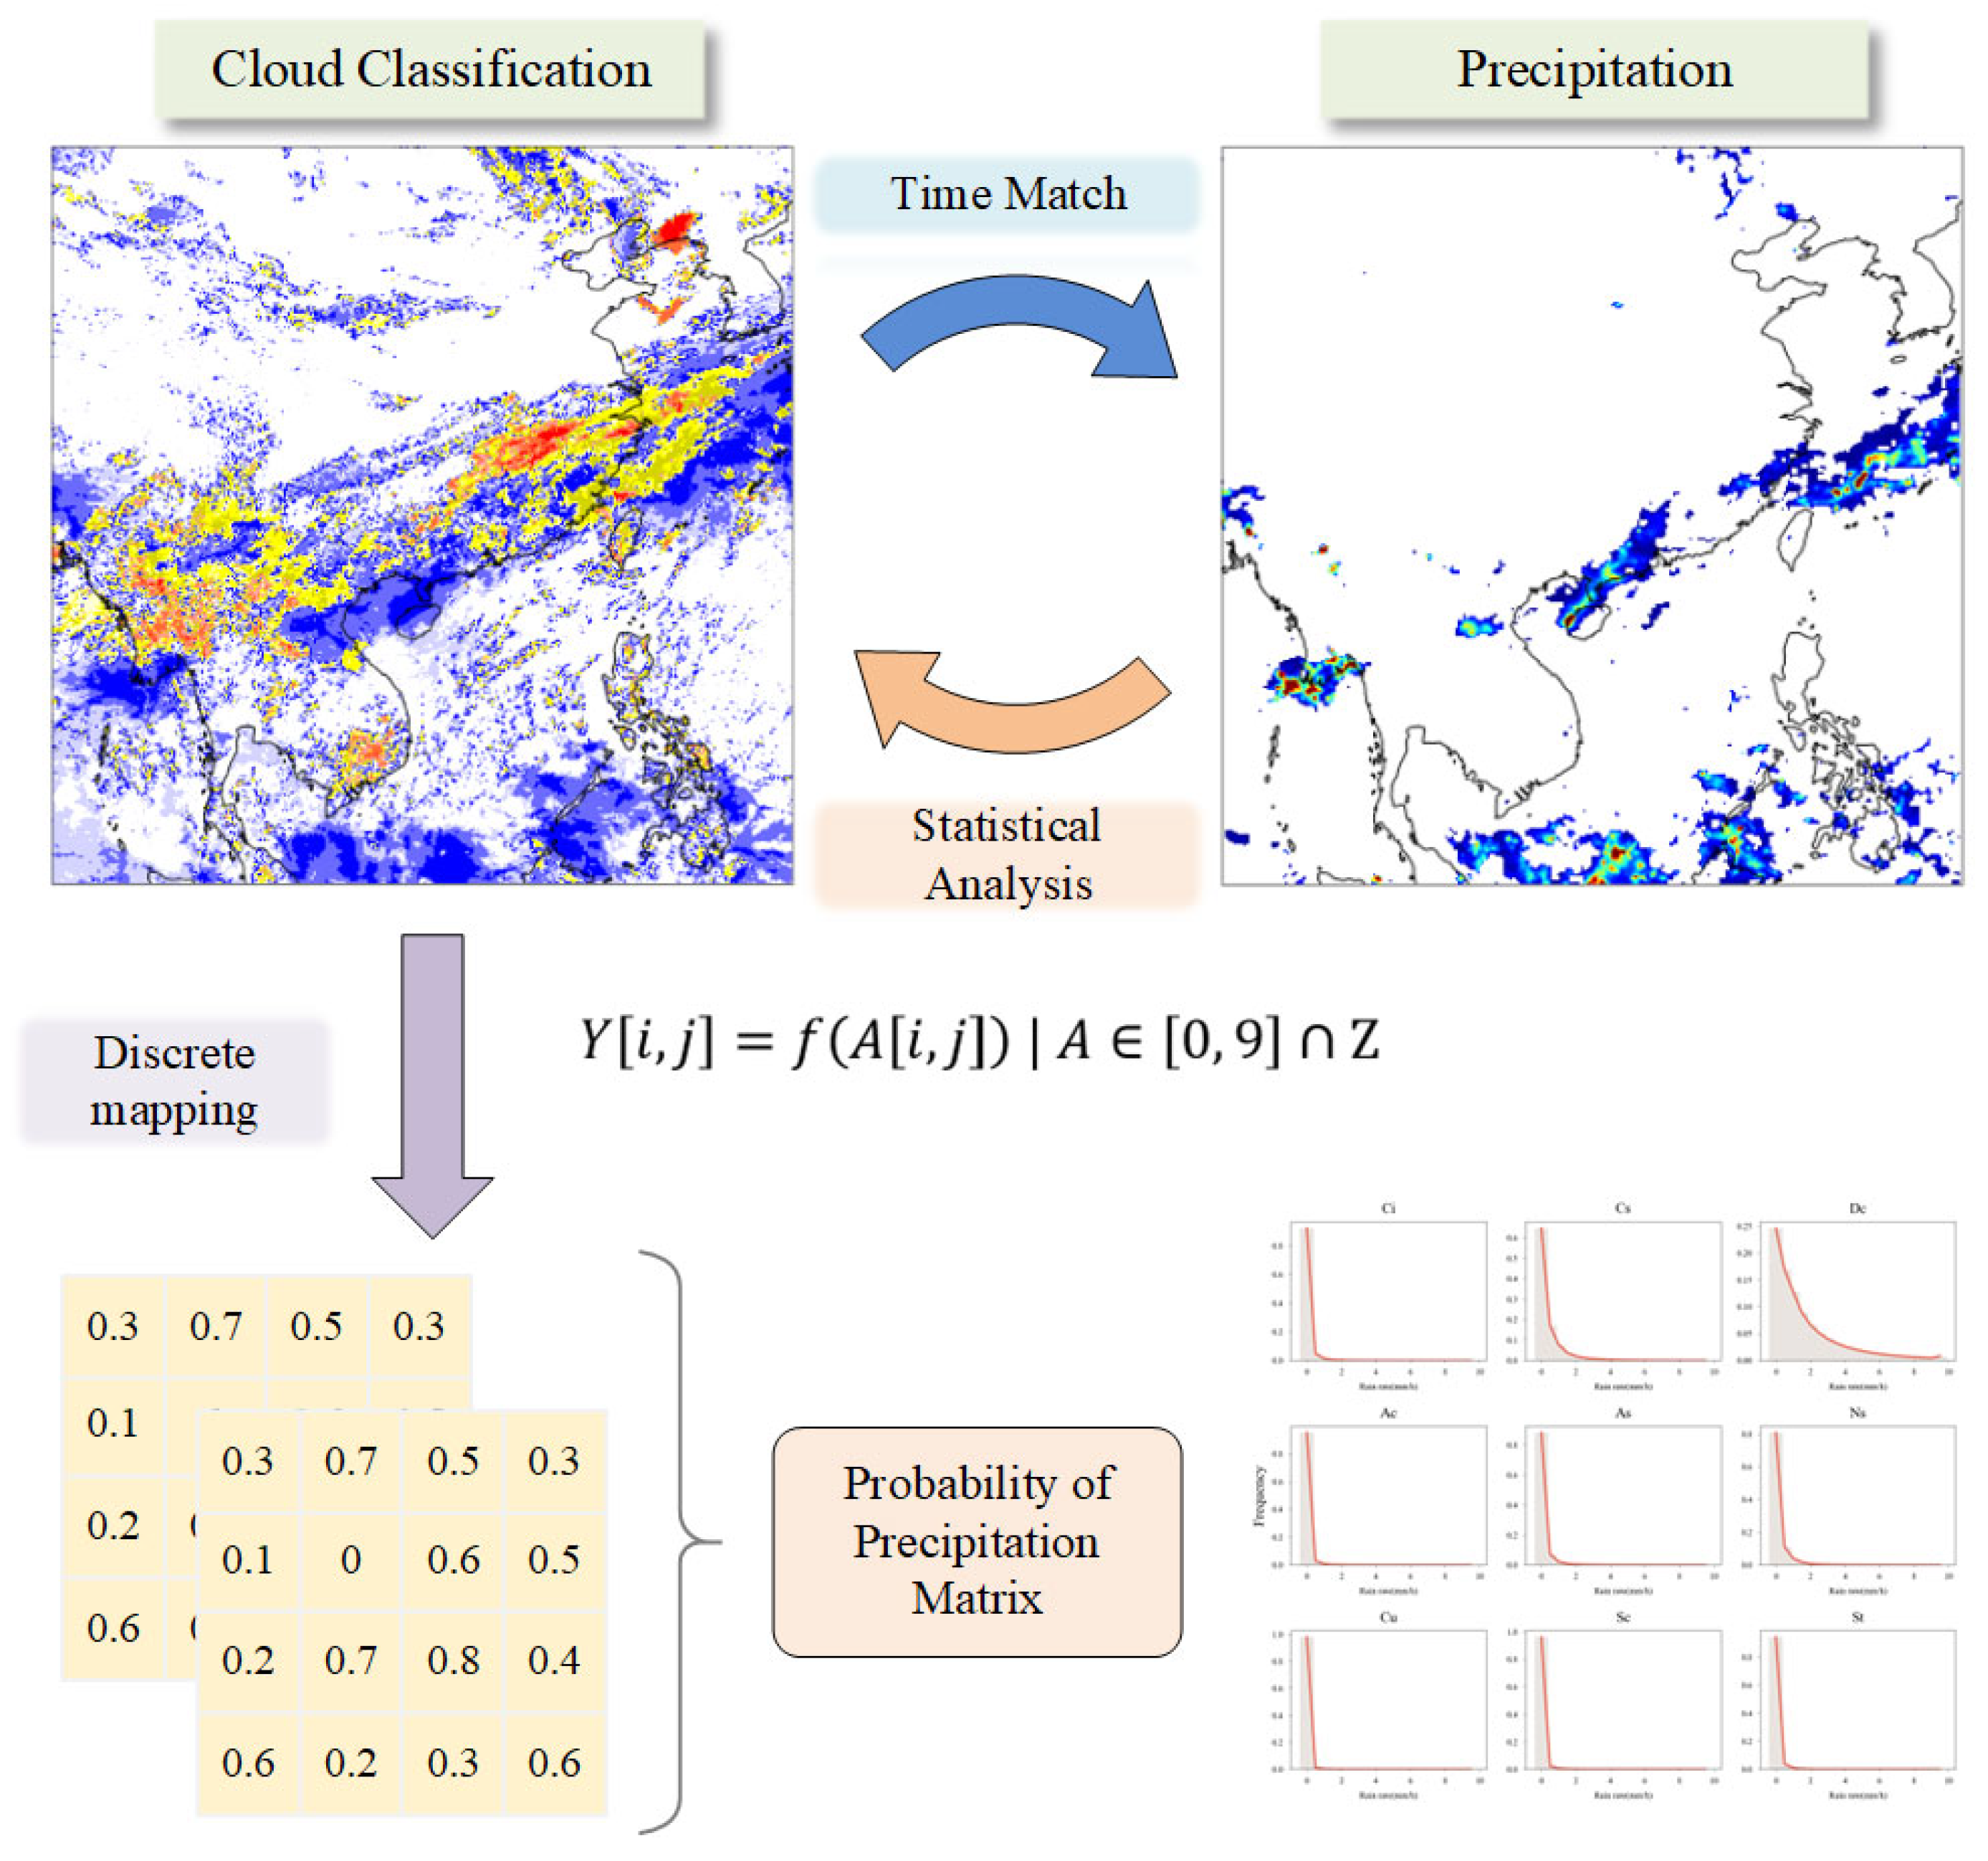
Therefore, based on the statistical results of precipitation rate distribution across different cloud types, it can be concluded that deep convective clouds exhibit the highest precipitation probability and the largest precipitation rate among all cloud types. Additionally, Cirro-stratus and Nimbo-stratus clouds also show a significant association with precipitation. These three cloud types, according to the ISCCP cloud classification standard, have the greatest optical thickness and relatively high cloud-top heights, along with abundant cloud water content. These characteristics align closely with precipitation-bearing clouds, making them more likely to generate precipitation. These findings strongly confirm the clear relationship between cloud classification products and precipitation, highlighting their great potential in assisting models to improve precipitation forecasting performance. Based on a statistical analysis of cloud–rainfall relationships, this method enables the determination of mean precipitation amounts and precipitation probabilities associated with different cloud types. And based on these results, we employ a discrete mapping approach to assign numerical values to different cloud types, transforming cloud classification results from categorical labels into quantitative parameters. This transformation allows for the integration of cloud classification products with multi-channel satellite observations, ultimately enhancing satellite-based precipitation forecasting. By incorporating the information contained in cloud classification products, the accuracy of satellite precipitation forecasts can be improved. The mapping method for cloud classification products is illustrated in Figure 4.
Furthermore, as shown in Figure 4, in the conventional construction of the probability of precipitation matrix, Himawari-8 cloud classification data are matched with GPM-IMERG data in real time. To investigate the impact of temporal information on precipitation forecasting accuracy, the Himawari-8 data are instead matched with precipitation data from 4 h later, thereby constructing a probability of precipitation matrix that incorporates temporal information.

3. Method

In this section, the implementation principles of the proposed method integrating cloud classification products are described in detail, along with the methodology for multi-channel satellite precipitation forecasting. Additionally, the experimental design, network training strategies, and evaluation metrics are comprehensively outlined. Specifically, the integration of cloud classification products strengthens the physical basis of precipitation forecasting. The proposed method leverages multi-channel satellite observations and cloud classification data to improve forecasting accuracy. Furthermore, the experimental setup includes model architecture, training procedures, and evaluation metrics. The evaluation metrics are designed to objectively assess the performance of the proposed method.

3.1. Model Architecture and Cloud Classification Product Integration

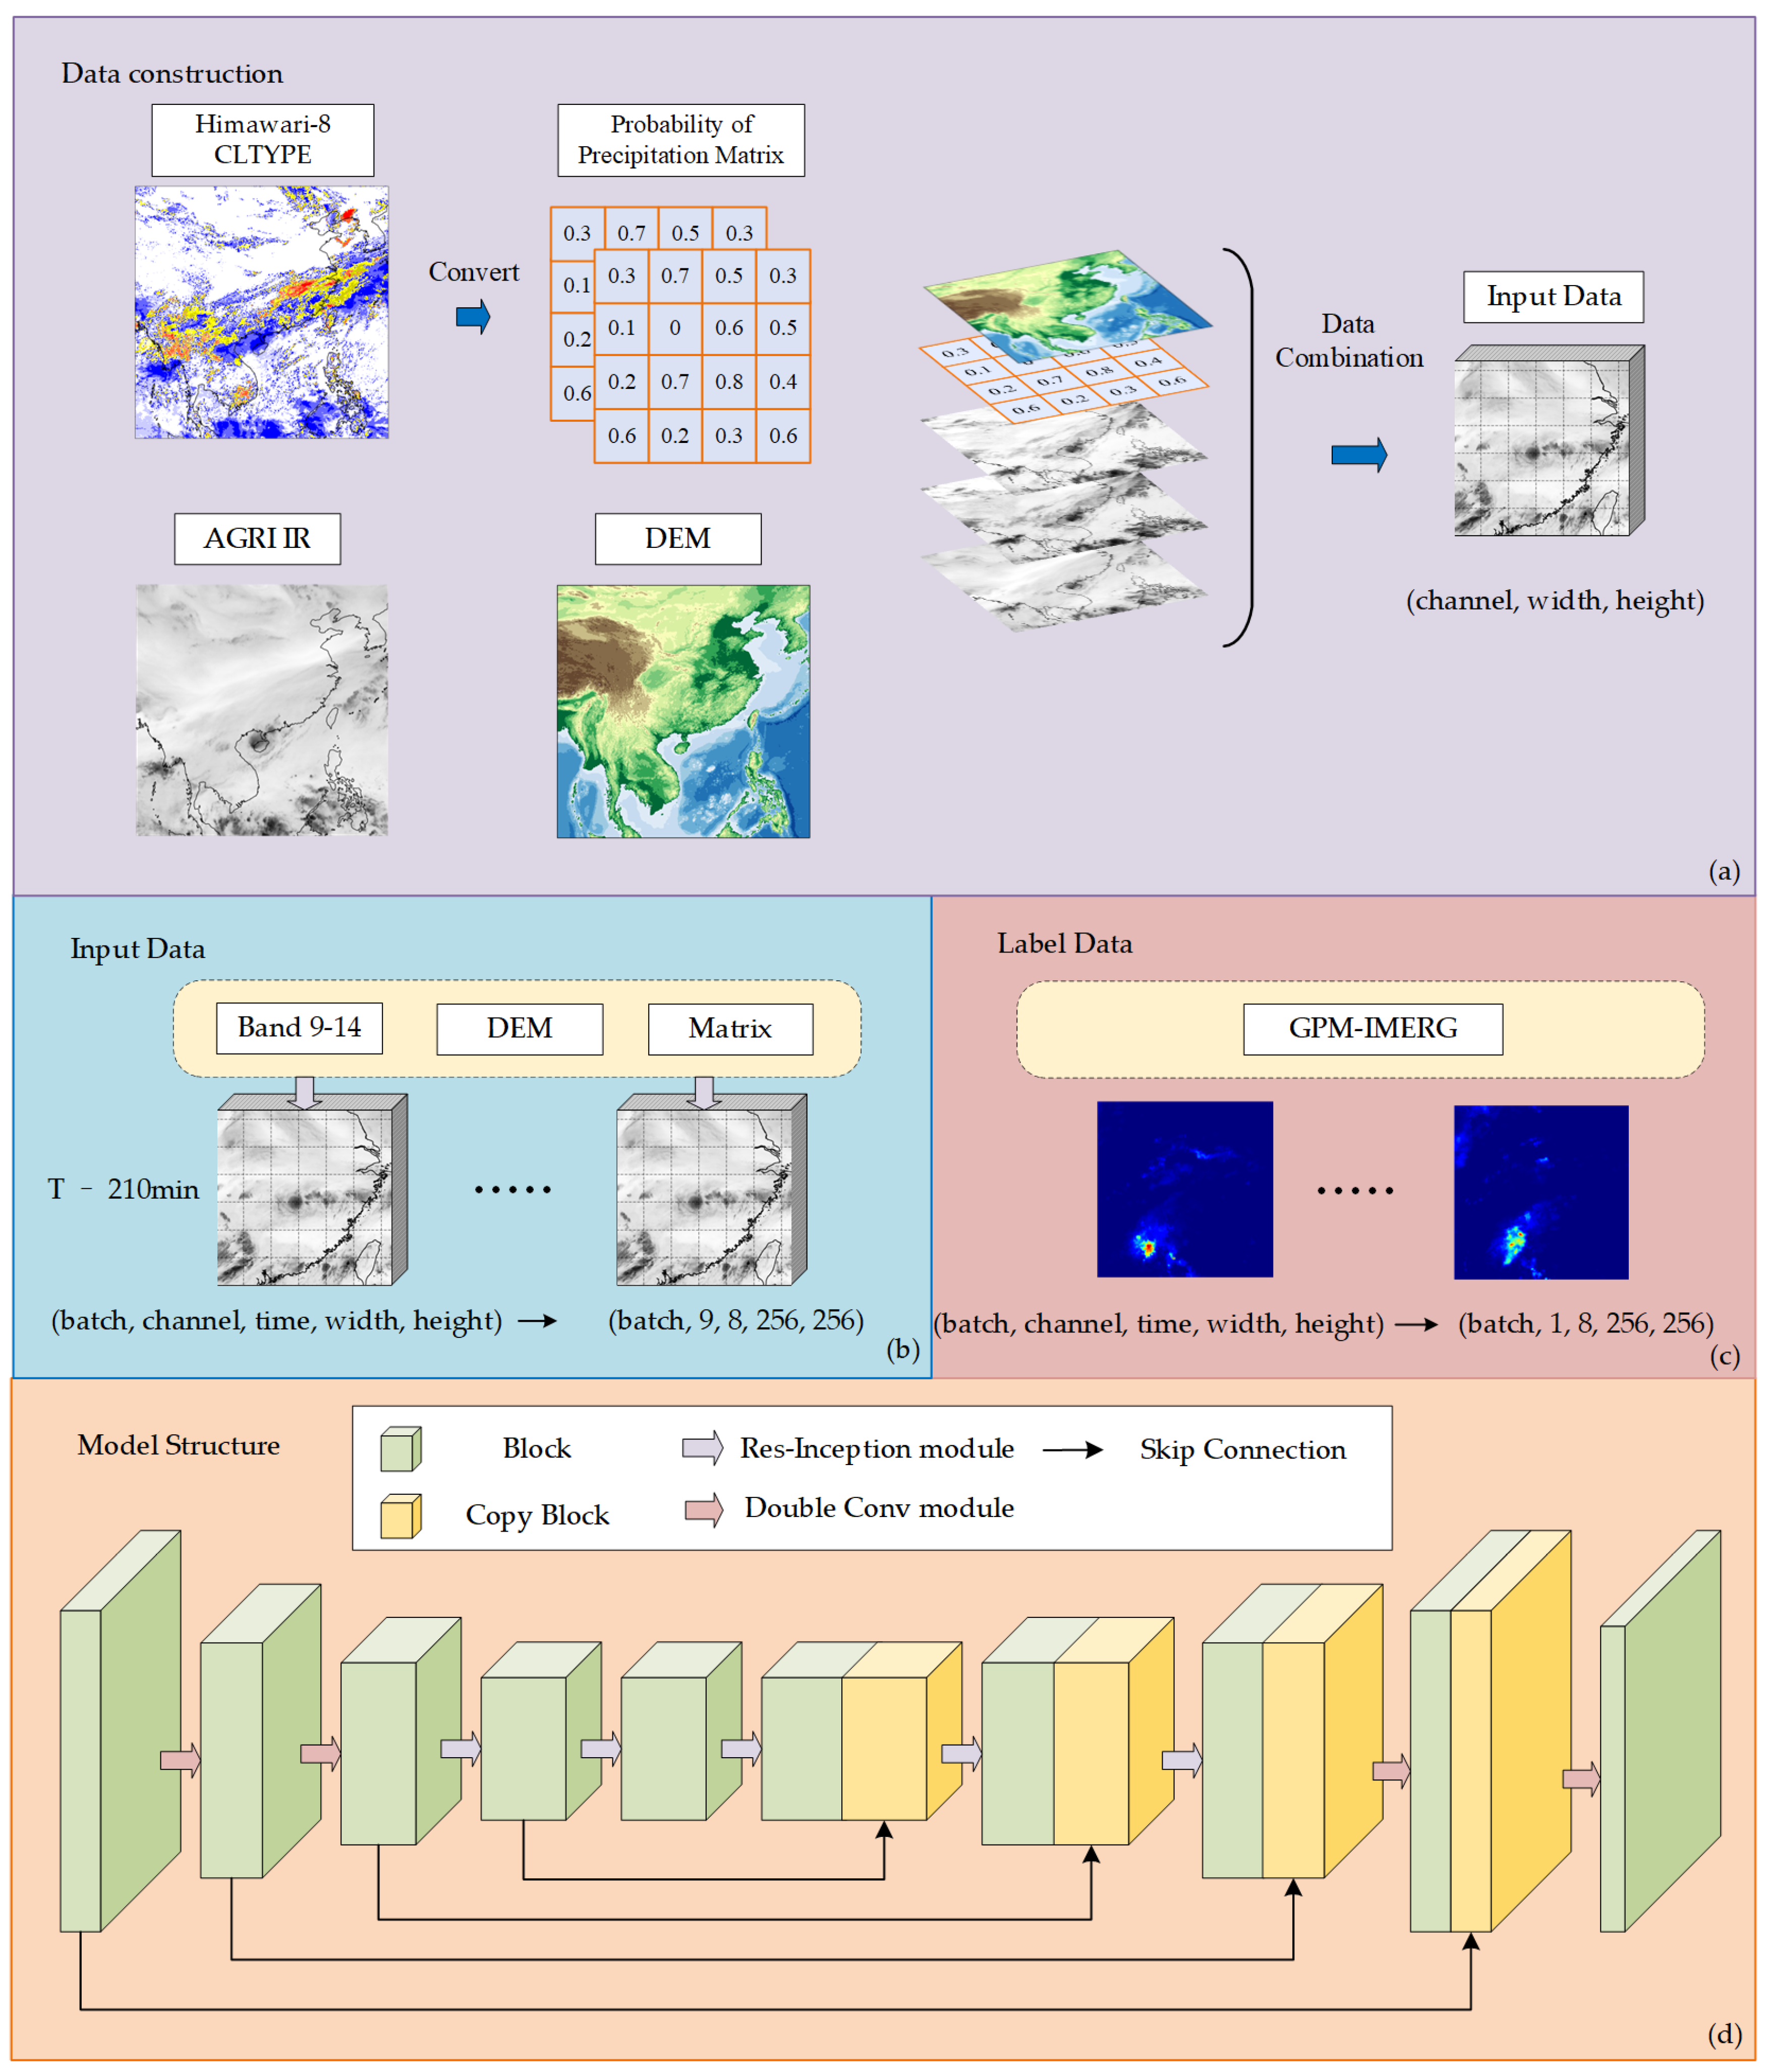
The southeastern coastal region of China is selected as the study area, with a latitude range of 22–34.75°N and a longitude range of 110–122.75°E, at a spatial resolution of 0.05° × 0.05°. Compared to other regions in China, this area has a higher density of region automatic weather stations (see Figures 11–13 for station distribution) and allows for a more effective evaluation of the accuracy of precipitation forecast products that incorporate cloud classification products. In the experiment, data from May to September of 2018–2020 are used as the training dataset for the model, while data from May to September of 2021 are used to evaluate the accuracy of the precipitation forecast. The implementation of satellite precipitation forecasting integrating cloud classification products is illustrated in Figure 5.
As shown in Figure 5, the input data include FY-4A satellite Level-1 (L1) observations, a digital elevation model (DEM), and a probability of precipitation matrix derived from the cloud classification product.
The processing pipeline consists of four main steps. First, based on the temporal intervals of the FY-4A, Himawari-8, and GPM-IMERG products, time matching is performed at 30-min intervals. Linear interpolation is then applied to the GPM-IMERG data to resample it to a spatial resolution of 0.05° × 0.05°, enabling spatiotemporal alignment among the three datasets. Second, the FY-4A L1 satellite data are preprocessed to extract observations from bands 09 to 14. Third, the DEM data are obtained from NOAA’s ETOPO2v2c dataset, which has a spatial resolution of 1/30°. Linear interpolation is applied to match the resolution of the FY-4A satellite data. Finally, using the method described in Section 2.4, the cloud classification product is discretely mapped into a probability of precipitation matrix that incorporates prior information about precipitation occurrence. It is important to note that, in precipitation forecasting, there exists a temporal gap between precipitation events and satellite observations. Therefore, this study also accounts for the impact of time on precipitation forecasting. To integrate temporal information into multi-channel satellite observations, we analyze the influence of temporal variations on cloud–precipitation relationships, as described in Section 2.4. Based on this analysis, we construct a probability of precipitation matrix that includes temporal information, aiming to improve the fusion of cloud classification information with satellite observational data for enhanced precipitation forecasting.
The constructed probability of precipitation matrix is stacked with FY-4A satellite AGRI infrared observations and DEM data from the same time step to form a single-time-step matrix for satellite precipitation forecasting integrating cloud classification products. The resulting data matrix has a dimension of 9 × 256 × 256 pixels, and the dimensions represent channel, latitude, and longitude, respectively. To build the multi-channel satellite precipitation forecasting dataset, multiple time step matrices are combined along the temporal dimension. The MCSPF-Net model is adopted as the multi-channel satellite precipitation forecasting model integrating cloud classification products [10]. During dataset construction, the time continuity of the data matrices is verified. When eight consecutive frames (240 min) of data matrices are temporally continuous, they are combined into a time-series dataset with a dimension of 9 × 8 × 256 × 256 pixels, and the dimensions represent channel, time step, latitude, and longitude, respectively. The dataset construction process is illustrated in Figure 5a,b. Specifically, assuming the current real-time observation is at time T, the input data are constructed from T-210 min to T. For model training, the GPM-IMERG product is used as the label data. As shown in Figure 5c, the GPM-IMERG data are stacked along the temporal dimension after time continuity verification. When the precipitation label data cover the period from T+30 min to T+240 min, they are combined into a dataset with a dimension of 1 × 8 × 256 × 256 pixels, and the dimensions represent channel, time step, latitude, and longitude, respectively. Together, these two components form the multi-channel satellite precipitation forecasting dataset integrating cloud classification products, which is utilized for model training and testing.
The deep learning model employed in this study adopts an Encoder–Decoder architecture as its core framework [45], as illustrated in Figure 5d. In the diagram, “Block” represents the input data processed by the model, while “Copy Block” refers to the data obtained through skip connections that replicate the original Block. The model employs Res-Inception units and Double-Conv units as its feature extraction modules, and the structure of the Res-Inception unit is shown in Equation (1).
B C o n v = B N C o n v 3 d 3,3 , 3 B I n p u t B 1 = B N D W C o n v 3 d 3,3 , 3 B C o n v B 2 = B N D W C o n v 3 d 5,5 , 5 B C o n v B 3 = B N D W C o n v 3 d 7,7 , 7 B C o n v B 4 = B N C o n v 3 d 1,1 , 1 B C o n v B O u t = B 1 + B 2 + B 3 + B 4
In the formula, B x represents the information contained in the previous Block, B N represents the batch normalization layer, and DWConv3d represents the 3D depth-wise separable convolution. The use of depth-wise separable convolutions reduces the number of model parameters and the computational cost, thereby improving forecasting efficiency and accuracy [46]. The input data first pass through a 3D convolution layer with a kernel size of 3. The extracted features are then duplicated into four copies and fed into the Res-Inception unit. Three of these copies are processed by depth-wise separable convolutions with kernel sizes of 3, 5, and 7, respectively, while the fourth copy is processed by a convolution layer with a kernel size of 1. Previous ablation studies and comparative experiments have demonstrated the effectiveness of this architecture. After the encoding and decoding process, the original satellite observation data and the cloud classification mapping matrix are transformed into future precipitation estimates, enabling the model to achieve the precipitation forecast for the next 4 h [10].

3.2. Experimental Plan Setup

In this study, the dataset is constructed using FY-4A satellite AGRI Level-1 multi-band observations, Himawari-8 cloud classification products, and GPM-IMERG precipitation data. The dataset construction and experimental procedures follow the methodology outlined in the previous sections [10]. The data cover the period from May to September between 2018 and 2021, and are split into training and testing datasets at a ratio of 3:1. The training dataset is randomly shuffled before being input into the model to enhance its robustness, while the testing dataset is fed sequentially to evaluate model performance. Adam was used as the optimizer during the network training process, and an early-stopping strategy was also applied. Additionally, a mini-batch training approach was adopted with a batch size set to 4. Given the highly nonlinear characteristics of precipitation and the complex distribution of precipitation rates, the loss function for network training combined MSELoss and L1Loss. The formulas for the loss functions are provided in Equations (2)–(4).
M S E l o s s x , y = 1 n i = 1 n x i y i 2
L 1 l o s s x , y = 1 n i = 1 n x i y i
l x , y = M S E l o s s x , y + L 1 l o s s x , y
In the formulas, n represents the number of included pixels, x is the output precipitation forecast result, and y is the input label data. During network training, the Adam optimizer was used for model optimization, and an early-stopping strategy was employed to prevent overfitting. The training process utilized a dynamic learning rate, with the One-Cycle learning rate schedule applied. The maximum learning rate was set to 0.05.
This study incorporated cloud classification products as auxiliary input data for multi-channel satellite-based precipitation forecasting. To quantitatively evaluate the impact of cloud classification products on precipitation forecasting, four comparative experiments were designed. These experiments aimed to systematically evaluate the contribution of cloud classification products to precipitation forecasting. The precipitation forecasting plans included the following:
  • Input Data: FY-4A satellite infrared observations from bands 09 to 14;
  • Input Data: FY-4A satellite infrared observations from bands 09 to 14 + DEM;
  • Input Data: FY-4A satellite infrared observations from bands 09 to 14 + DEM + probability of precipitation matrix;
  • Input Data: FY-4A satellite infrared observations from bands 09 to 14 + DEM + probability of precipitation matrix incorporating temporal information.
All experimental plans include FY-4A satellite infrared observations from bands 09 to 14, as previous work has demonstrated that this band configuration delivers optimal performance. Building on this foundation, this study aims to further improve the accuracy of satellite-based precipitation forecasting through data fusion techniques. Additionally, considering the influence of terrain on precipitation, digital elevation model (DEM) data are incorporated into Forecasting Plan 2 to enrich the input features. Forecasting Plans 3 and 4 further integrate a discrete mapping matrix derived from cloud classification products, with a key distinction between the two. Specifically, Forecasting Plan 4 includes an additional temporal variation feature in the probability of precipitation matrix, which is obtained through statistical analysis. By designing these four forecasting plans, this study quantitatively evaluates the impact of cloud classification products on precipitation forecasting accuracy and explores how to better integrate cloud classification products with multi-channel satellite observations to achieve optimal short-term nowcasting performance. For clarity in subsequent discussions, the four forecasting plans are referred to as “Plan 1” to “Plan 4.”

3.3. Experimental Evaluation Metrics

To comprehensively evaluate the performance of the MCSPF-Net in short-term precipitation forecasting, multiple evaluation metrics are employed. Quantitative assessment includes Mean Squared Error (MSE), Mean Absolute Error (MAE), and Correlation Coefficient (CC). These metrics are used to measure the numerical deviation between the forecasted and actual precipitation rates. MSE and MAE emphasize different aspects of error. MSE squares the errors before averaging, which amplifies the impact of larger errors, making it more sensitive to outliers and penalizing large deviations more heavily. In contrast, MAE calculates the average of the absolute errors, treating all errors equally regardless of their magnitude. As a result, MSE highlights the presence of large errors, while MAE provides a more balanced assessment of overall error without penalizing larger ones. The evaluation formulas are provided in Equations (5)–(7), where m represents the number of pixels corresponding to the precipitation forecast result in space and time, x denotes the forecasted precipitation values from the model, and y corresponds to the ground truth precipitation data.
MSE = 1 m m i = 1 x i y i 2
MAE = 1 m m i = 1 x i y i
CC = m i = 1 x i x ¯ y i y ¯ m i = 1 x i x ¯ 2 m i = 1 y i y ¯ 2
For categorical assessment, three metrics are utilized: Probability of Detection (POD), False Alarm Ratio (FAR), and Critical Success Index (CSI). These metrics are designed to evaluate the spatial consistency between the model’s forecasted precipitation and the actual observed precipitation. The formulas for calculating these metrics are presented in Equations (8)–(10). H (Hit) represents the number of times precipitation occurred and was accurately predicted. F (False) represents the number of times precipitation did not occur but was predicted. M (Miss) represents the number of times precipitation occurred but was not predicted.
POD = H H + M
FAR = F H + F
CSI = H H + F + M

4. Evaluation of Precipitation Forecasting Performance

In this section, a series of comparative evaluation experiments are conducted to investigate the impact of cloud classification products on multi-channel satellite precipitation forecasting. The experiments include quantitative performance assessment of the four forecasting plans, analysis of spatial distribution changes in precipitation forecasting performance under different input conditions using the MCSPF-Net model, and validation of the proposed method’s accuracy in real-world scenarios using ground-based rain gauge observations as ground truth. Through these experiments, this study aims to comprehensively evaluate the effectiveness of integrating cloud classification products into multi-channel satellite precipitation forecasting and provide insights for improving short-term forecasting accuracy.

4.1. Performance Analysis of Four Precipitation Forecasting Plans

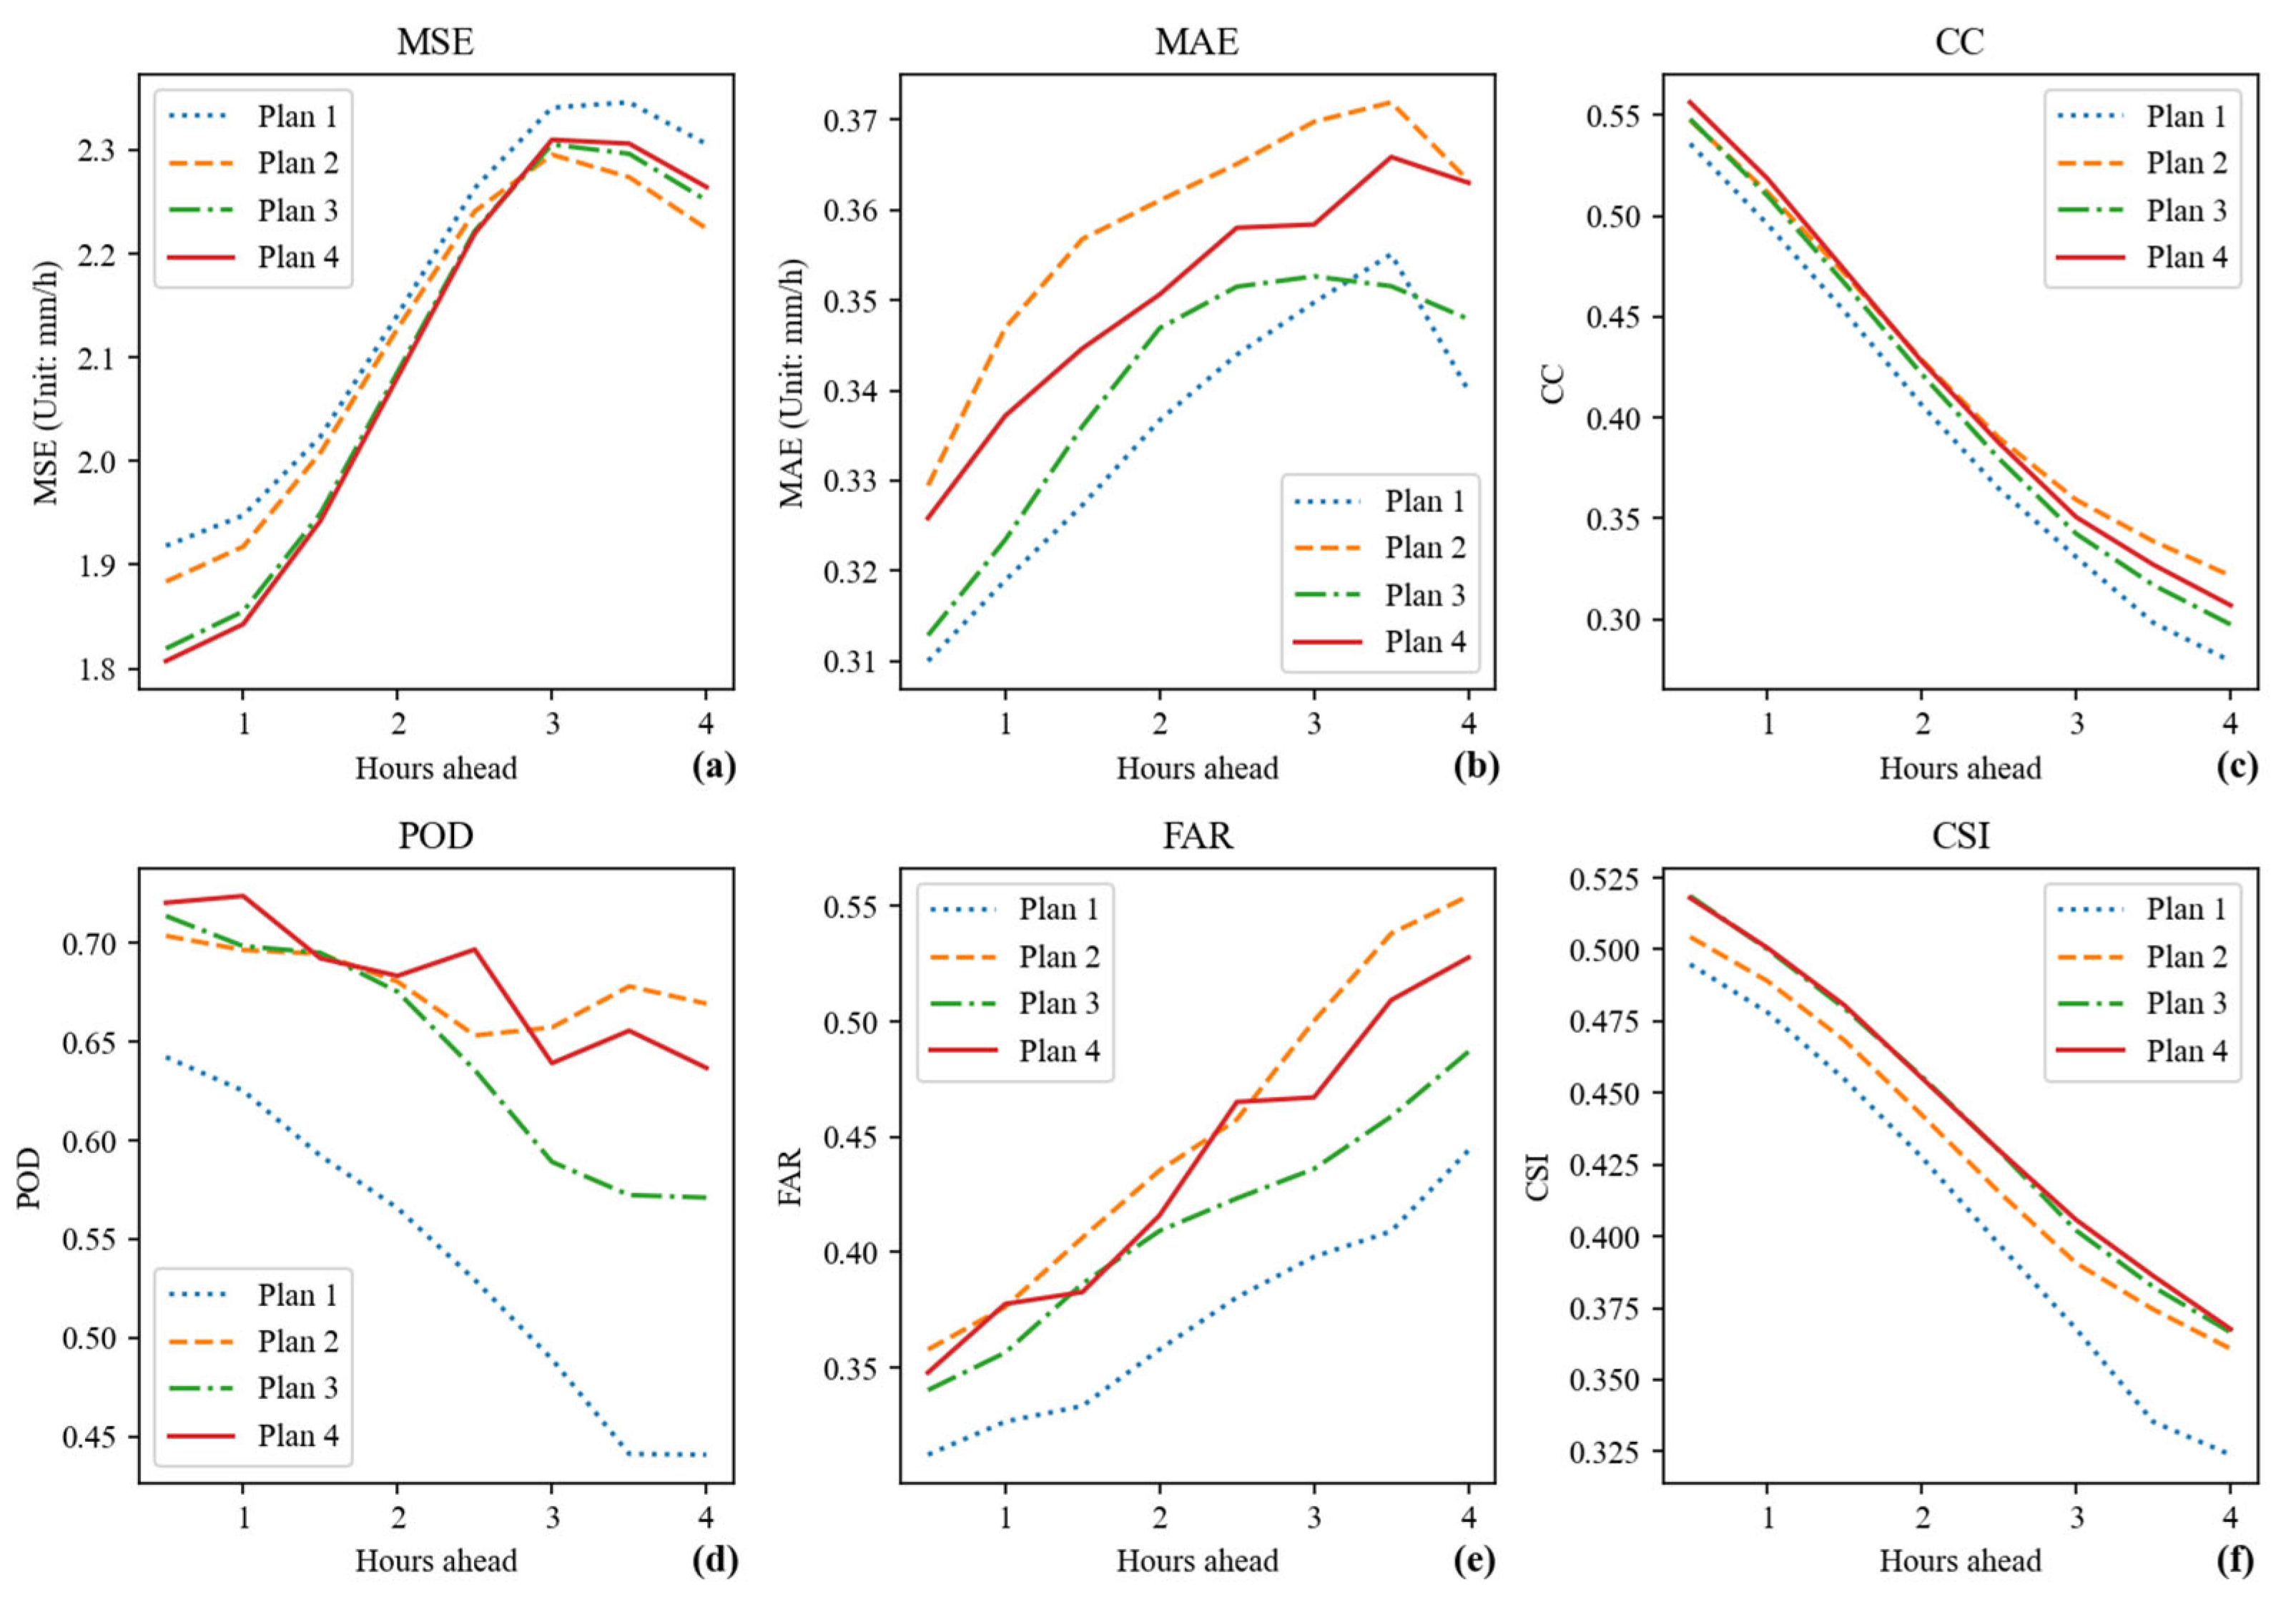
To investigate the impact of temporal information on the method’s performance, four distinct forecasting schemes are designed, aiming to explore how cloud classification products can more effectively enhance the accuracy of satellite-based precipitation forecasting. The evaluation metrics for the four forecasting schemes, showing their variations with forecast lead time, are presented in Figure 6.
Based on the evaluation results shown in Figure 6, it can be observed that the four forecasting schemes exhibit certain differences in precipitation forecasting accuracy. In terms of the MSE metric, Plan 3 and Plan 4 demonstrate performance advantages, outperforming Plan 1 in forecasting accuracy. This indicates that integrating cloud classification products helps the model reduce extreme errors, thereby improving precipitation forecasting precision. However, regarding the MAE metric, Plans 2, 3, and 4 exhibit varying degrees of increased error values. Among them, the error of Plan 2 increased the most, while the increase in the error of Plan 3 is relatively limited. This observed pattern differs substantially from the results obtained when using MSE as the evaluation metric. The differing sensitivities of MSE and MAE to various types of errors, due to their distinct mathematical formulations, lead to the observed divergence in trends. This suggests that while cloud classification products can mitigate extreme forecasting errors, they may amplify the overall error distribution. On the other hand, for the CC metric, the schemes incorporating cloud classification products achieve higher Correlation Coefficients, indicating a notable improvement in the consistency between forecasted and observed precipitation. Overall, the integration of cloud classification products enhances the accuracy of satellite-based precipitation forecasting.
From the POD, FAR, and CSI metrics, it can be observed that the introduction of cloud classification products and DEM improves the POD values. Although this leads to higher FAR values, the CSI metric still shows a notable improvement. The CSI metric takes into account both false alarms and missed detections (F + M), allowing for a comprehensive evaluation of whether the accuracy of precipitation forecasting has improved—that is, whether the proportion of correctly predicted precipitation events by the model has improved relative to the number of incorrect predictions (F + M). Furthermore, Plan 3 and Plan 4 exhibit lower FAR values compared to Plan 2, which demonstrates that cloud classification products can enhance precipitation forecasting accuracy by improving the model’s ability to identify future precipitation areas. This highlights the auxiliary role of cloud classification products in precipitation forecasting. Additionally, Plan 4 outperforms Plan 3 in the latter half of the forecasting period, indicating that incorporating temporal information helps the model better capture long-term precipitation trends and improves the accuracy of long-term forecasts. As a result, Plan 4 achieves the best CSI performance among the four schemes, further proving that adding temporal information to cloud classification products provides a clear advantage in precipitation forecasting accuracy. To facilitate a clearer comparison of the performance of the four forecasting plans, the mean values of the quantitative evaluation metrics are calculated for each scheme. The quantitative evaluation results of the precipitation forecasting plans are shown in Table 1.
According to the statistical results in Table 1, the MSE values for Plans 2–4 improve by 1.9%, 2.9%, and 3.0%, respectively, compared to Plan 1, while the MAE values increase by 6.9%, 1.5%, and 4.5%, respectively. This variation arises from the different sensitivities of MSE and MAE as evaluation metrics—MSE is more sensitive to extreme errors, whereas MAE reflects overall error variations. Due to the complexity and nonlinear characteristics of precipitation forecasting, errors exhibit some degree of fluctuation. Due to the differences in how the two metrics measure error, the MSE decreases while the MAE increases. This indicates that the inclusion of cloud classification products helps the model better handle high precipitation rates, although it also introduces a relatively larger overall error. For the CC metric, the values increase by 6.6%, 3.8%, and 5.8%, respectively, across the three plans. This indicates that all three approaches improve the correlation of precipitation forecasts, thereby enhancing forecasting accuracy.
For the most critical evaluation metric in precipitation forecasting, the CSI, Plans 2–4 showed improvements of 5.1%, 7.8%, and 8.0%, respectively, compared to Plan 1. The increase in CSI primarily stemmed from a significant improvement in POD, while the model effectively controlled the FAR, ultimately leading to better CSI performance. The variations in quantitative evaluation metrics demonstrate that integrating prior information from cloud classification products can enhance hit rates in precipitation forecasting while having minimal impact on FAR, thereby further improving the CSI. This enhancement strengthens the model’s ability to forecast precipitation accurately. Additionally, Plan 4, which includes temporal information, performed better than Plan 3, which only considers the cloud–precipitation relationship, in terms of MSE, CC, CSI, and POD.
This indicates that prior temporal information helps the model better capture the temporal variability of precipitation. By incorporating temporal information from the precipitation probability matrix, the association between input data and precipitation is further strengthened, leading to notable improvements across multiple precipitation forecasting metrics. During feature extraction, the model effectively leverages prior temporal information, achieving better performance than Plan 3. This highlights the crucial role of cloud classification products in guiding precipitation forecasting, ultimately improving the model’s overall forecasting capability.

4.2. Spatial Distribution of Precipitation Forecast Metrics

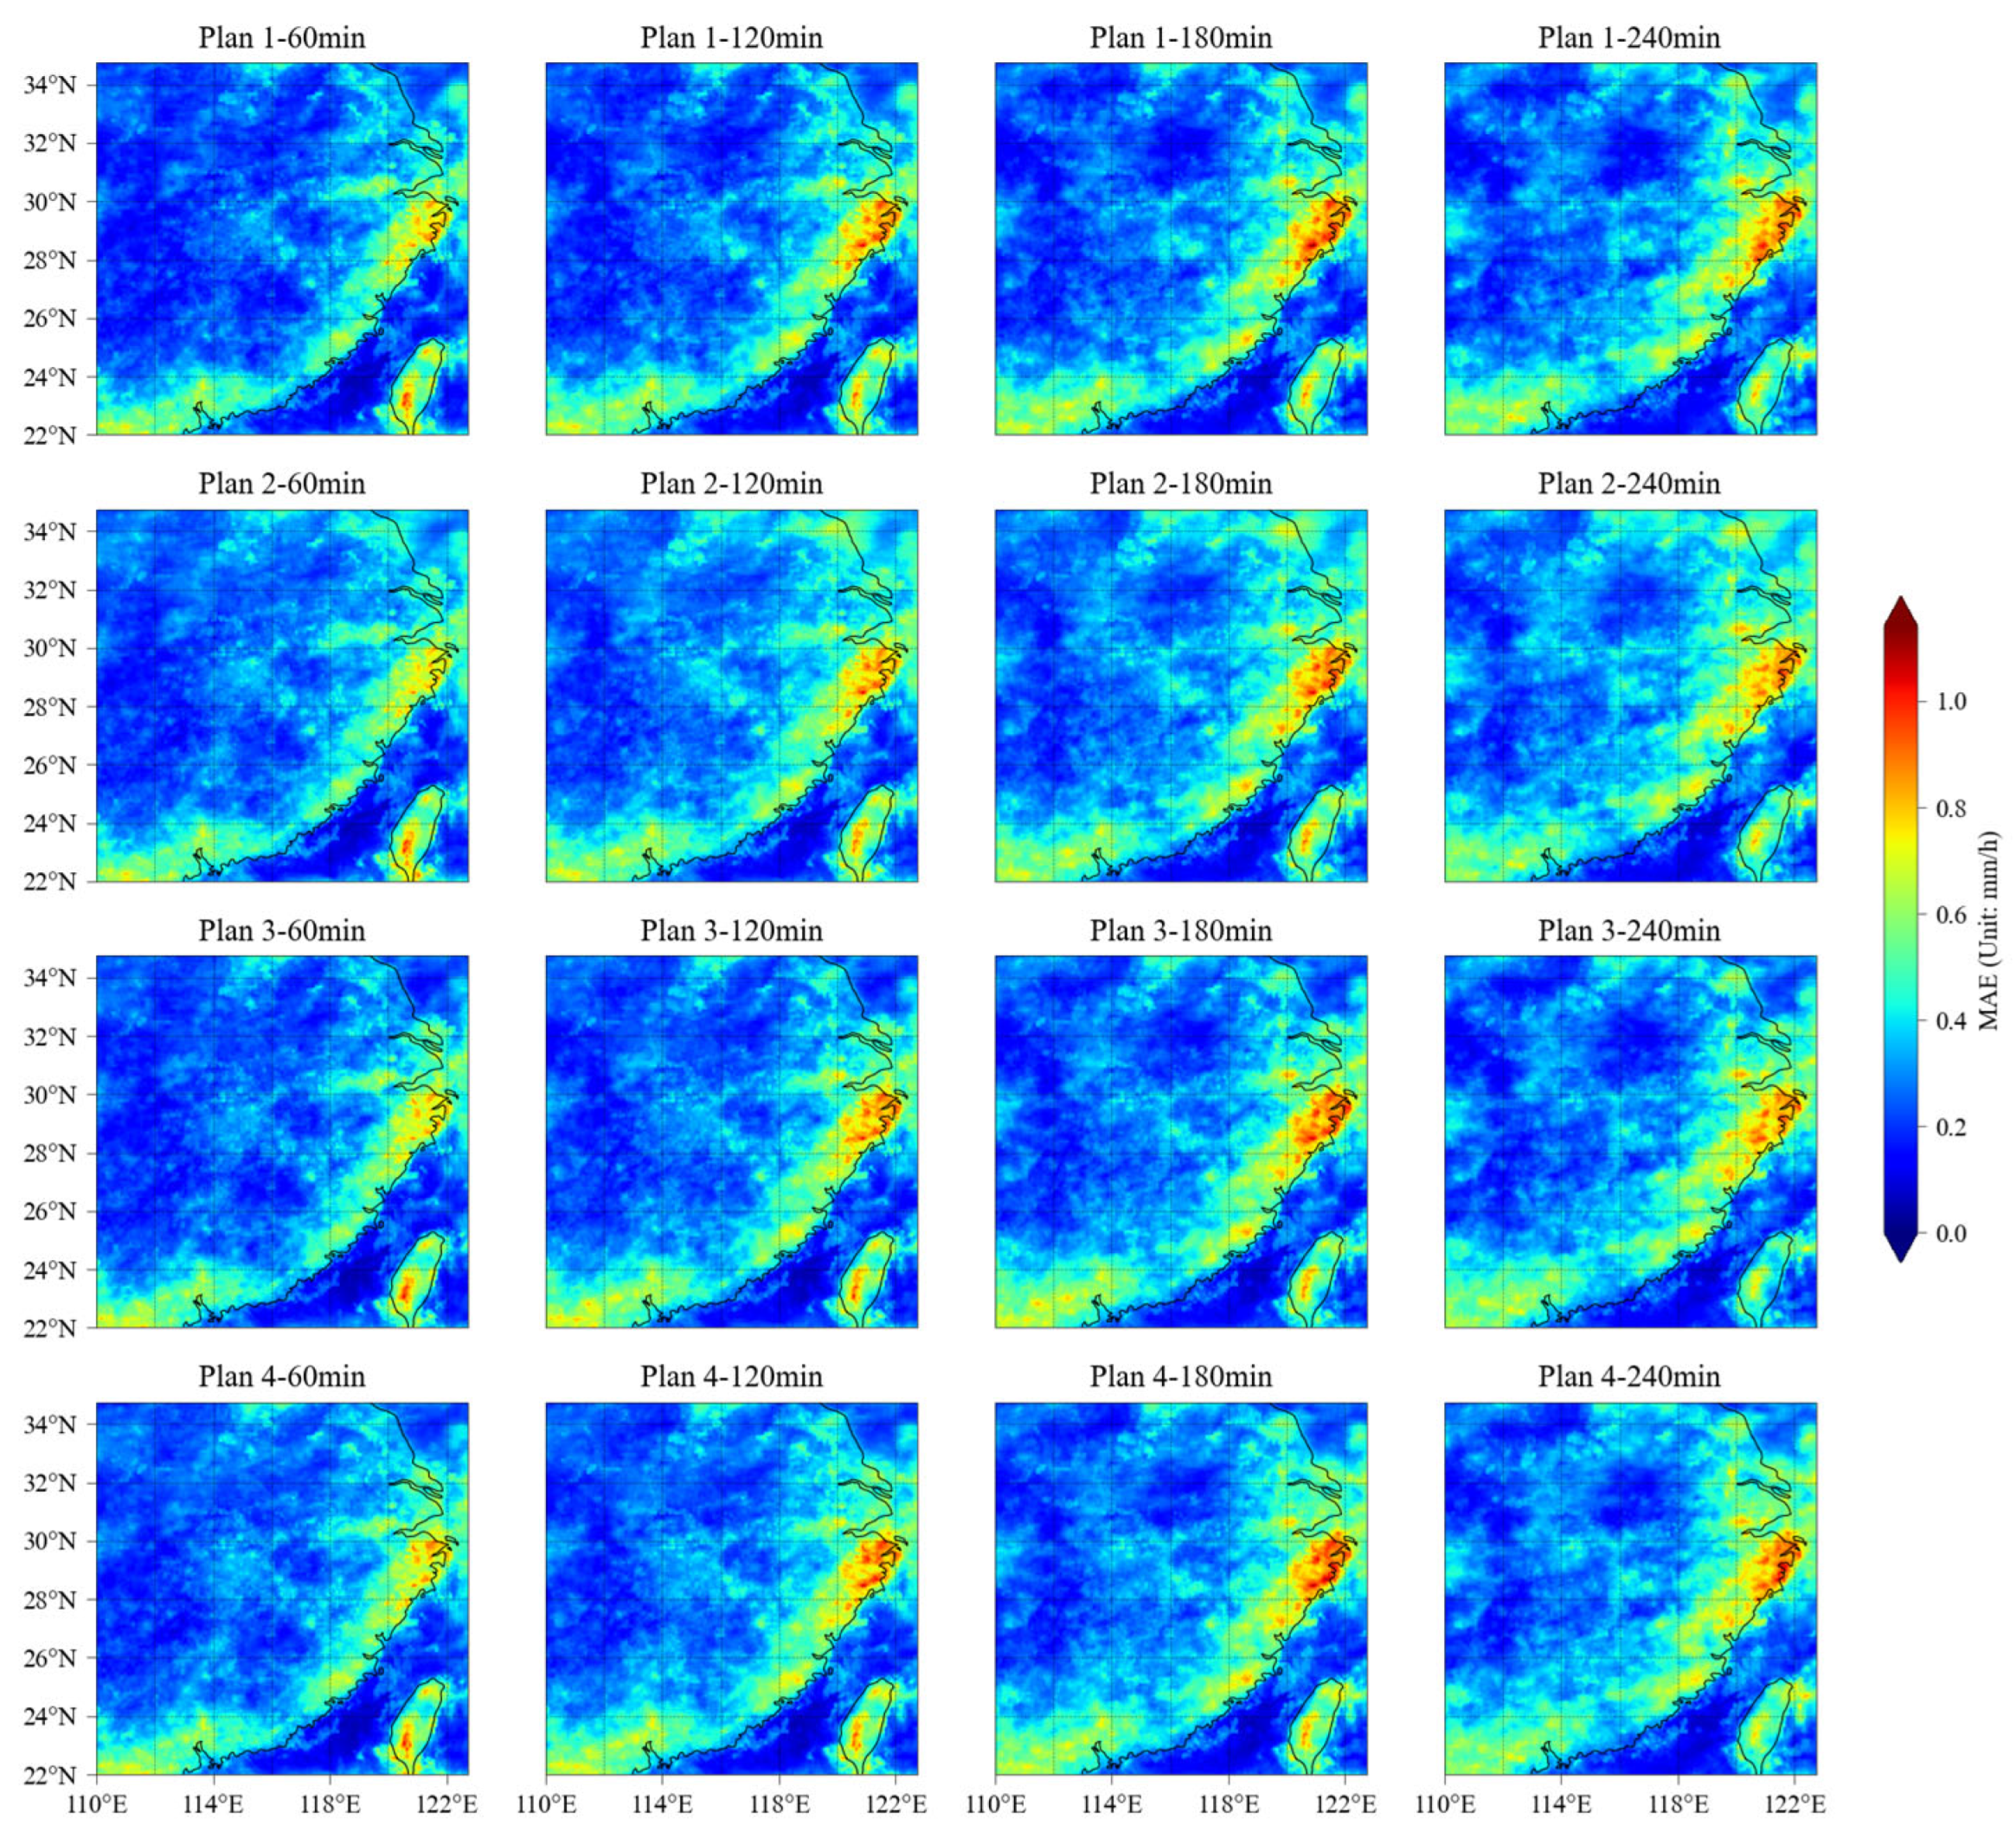
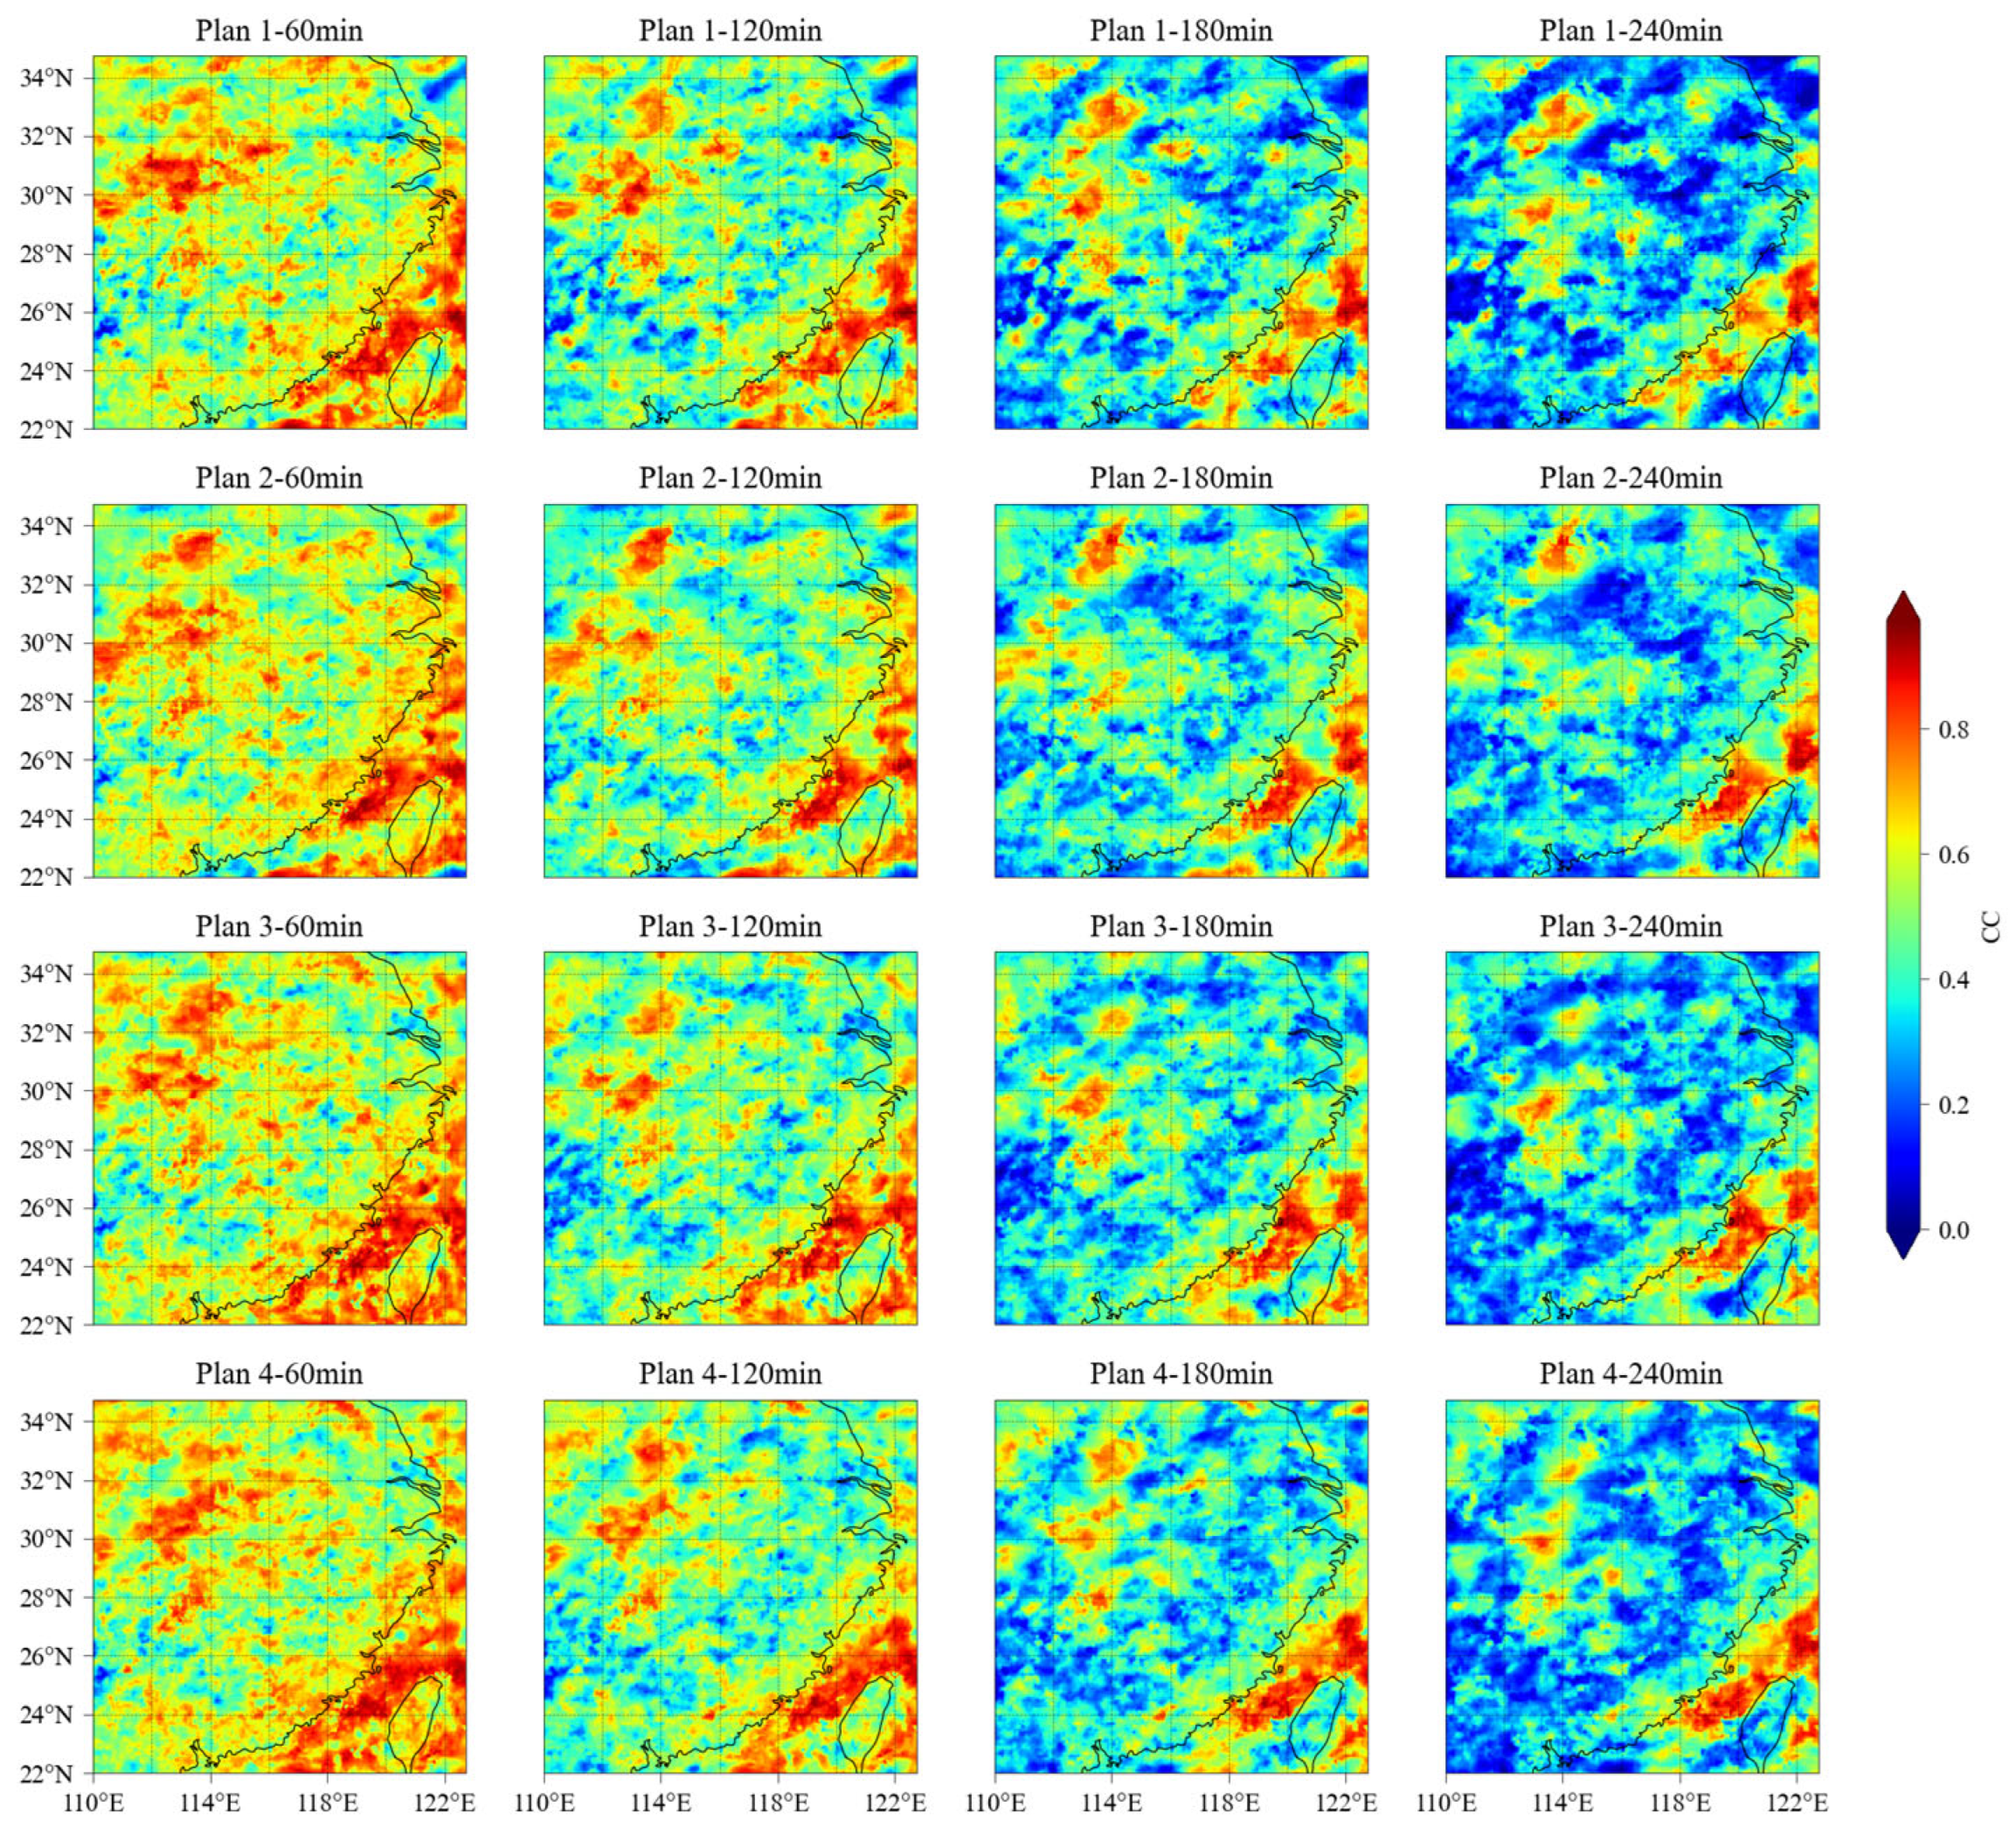
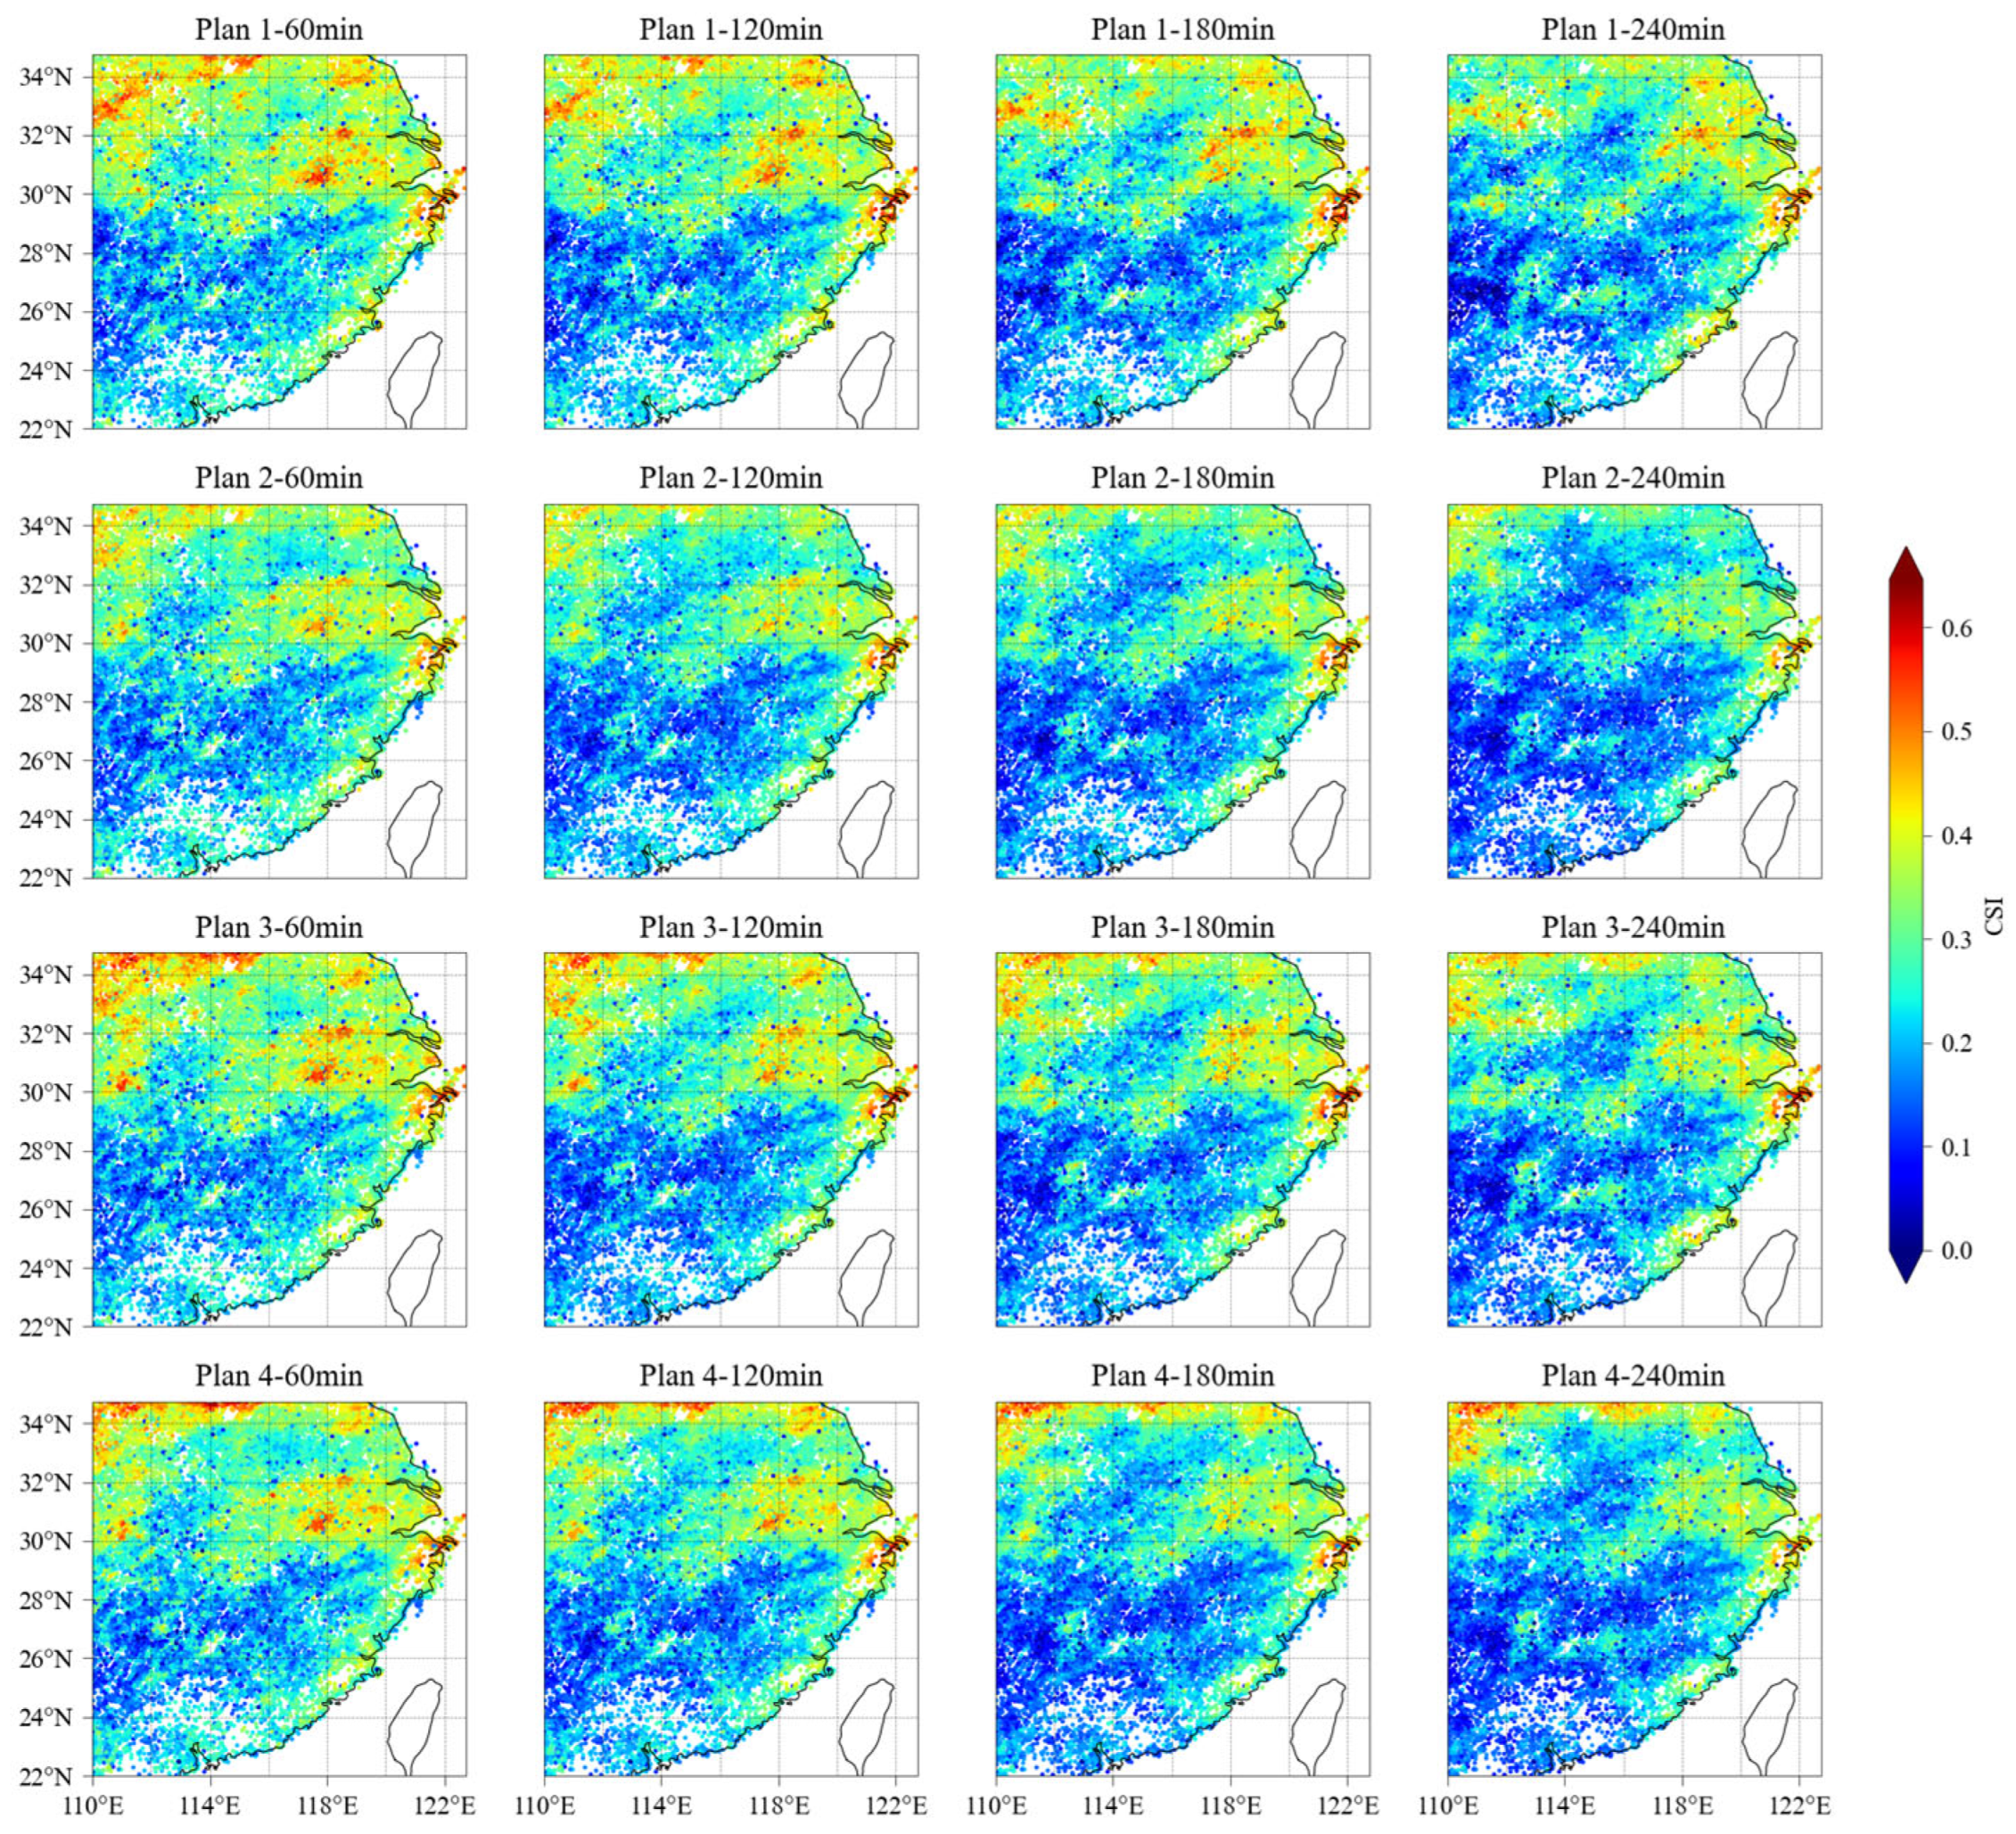
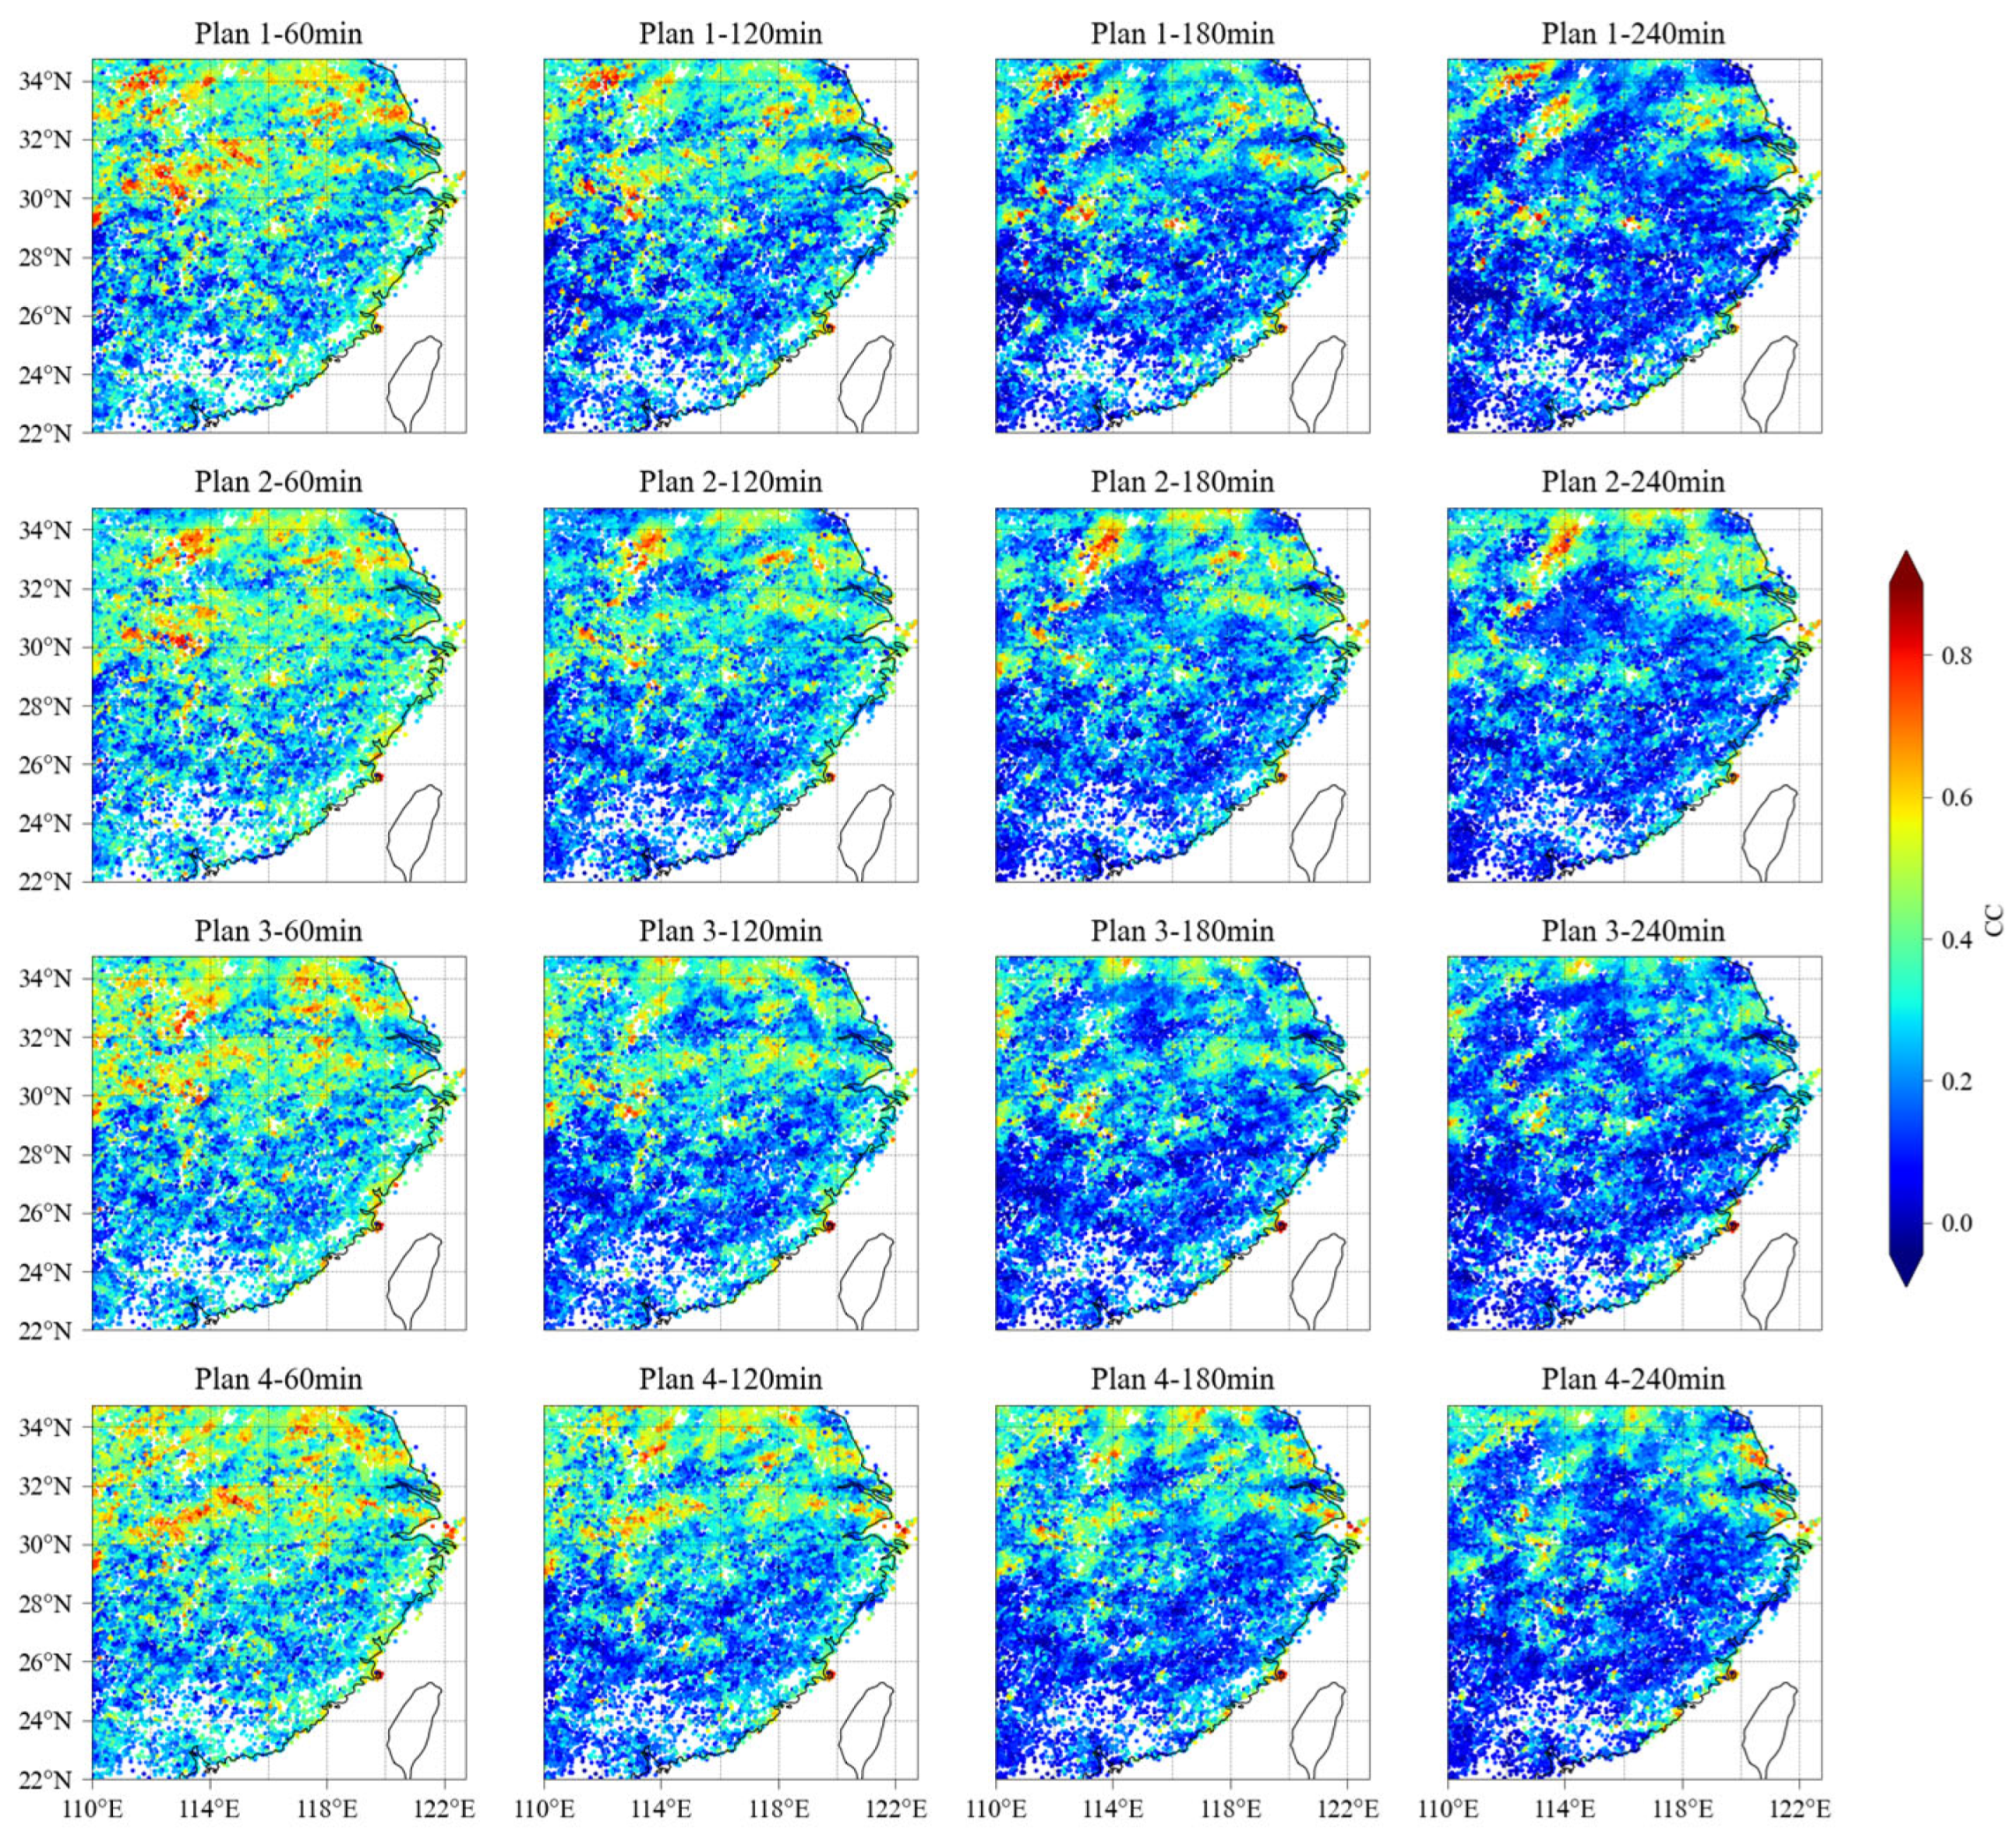
In this section, we analyze the spatial distribution of evaluation metrics for the four precipitation forecasting plans. During the evaluation, the output from the test dataset is used to compute the spatial distribution of these metrics, with the GPM-IMERG products serving as the ground truth for assessing the forecasting results. The spatial distributions of the evaluation metrics for the four forecasting plans are shown in Figure 7, Figure 8 and Figure 9, illustrating how MAE, CSI, and CC change as the forecast lead time increases. To facilitate comparison, the experiment schemes and corresponding forecast lead times are labeled above each image.
The comparison of Figure 7, Figure 8 and Figure 9 shows that integrating cloud classification products improves the spatial distribution of the CSI metric while also enhancing the MAE and CC values to some extent. The fusion of cloud classification products with multi-channel satellite observations has improved the network’s ability to detect precipitation, with CSI values reaching up to 0.9 in some regions. The comparison also reveals that Plans 3 and 4 not only demonstrate higher CSI and CC values but also exhibit a more uniform spatial distribution of these metrics. Compared to Plan 1, Plans 3 and 4 achieve higher CSI and CC values across a broader area, improving the accuracy of precipitation location forecasting. Although there is a slight increase in MAE values, the spatial distribution indicates that Plans 3 and 4 effectively suppress extreme values, preventing a rise in overall error. Combined with the improvements in CSI and CC, this confirms the positive impact of the proposed method on precipitation forecasting accuracy. Overall, incorporating cloud classification products greatly enhances the model’s ability to predict short-term precipitation by improving the accuracy of precipitation location forecasts while keeping errors under control, resulting in better forecasting performance.
Furthermore, to investigate the sources of precipitation forecasting errors, this study analyzed the precipitation characteristics in the study area for 2021. The results, presented in Figure 10, include the mean precipitation rate and precipitation frequency. Figure 10 reveals a clear correlation between the spatial distribution of MAEs and both the mean precipitation rate and precipitation frequency. Regions with higher precipitation rates or more frequent rainfall tend to exhibit larger errors. For example, in areas surrounding Shanghai, frequent precipitation events and high average precipitation rates contribute to rapid error accumulation, ultimately leading to higher MAE values. In contrast, the CSI metric shows better performance in regions with high precipitation frequencies, indicating that the model effectively predicts the occurrence of precipitation. The CC metric, on the other hand, is more uniformly distributed, suggesting a strong correlation between the predicted precipitation and the processed ground truth data, demonstrating the model’s ability to capture precipitation variability. Overall, incorporating prior information from cloud classification products enhances the accuracy of four-hour precipitation forecasts. However, while the model effectively predicts precipitation occurrence and spatial distribution, some errors remain in forecasting precipitation intensity.

4.3. Evaluation of Precipitation Forecast Accuracy Using Rain Gauges

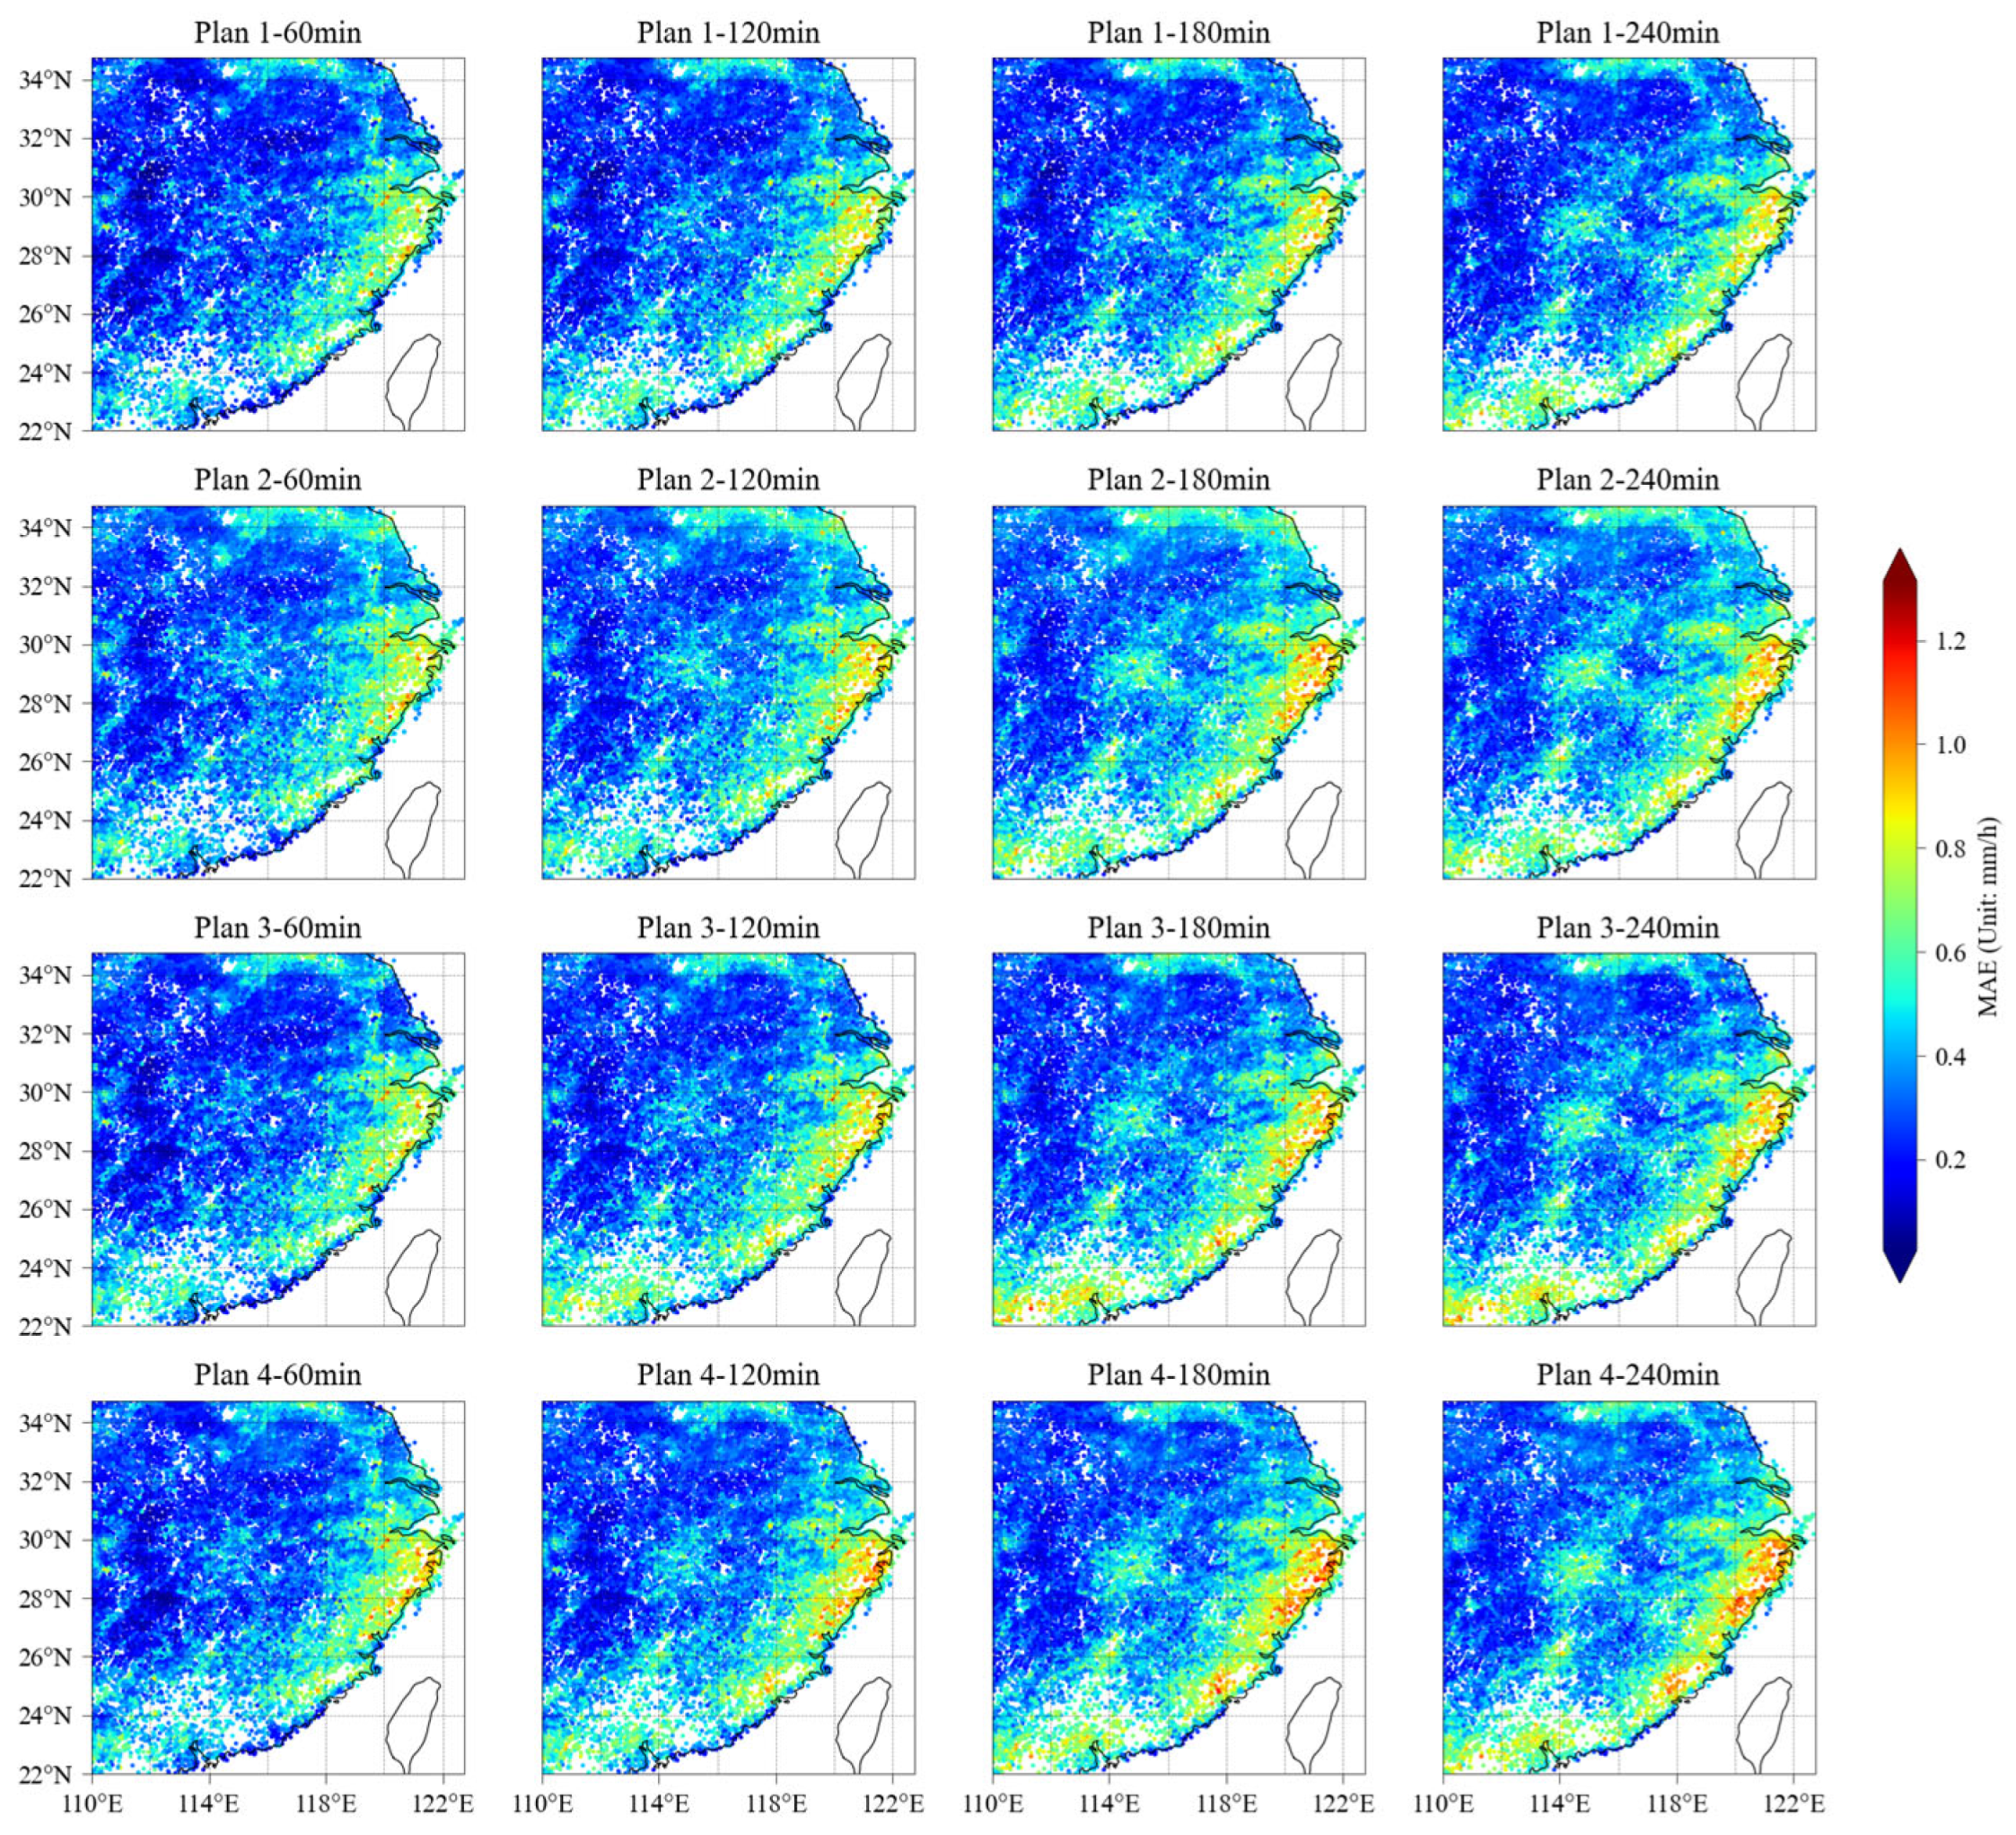
In this section, the performance of three precipitation forecasting schemes will be evaluated using rain gauge observations from ground-based monitoring stations. Each station’s data will be independently used to assess the accuracy of precipitation forecasting. The evaluation results from all stations will then be visualized using point plots. Figure 11, Figure 12 and Figure 13 illustrate the spatial distribution of MAE, CSI, and CC metrics for the three precipitation forecasting schemes, using rain gauge observations as ground truth. Each row in the figures corresponds to a specific forecasting scheme, with different evaluation metrics shown across various forecast lead times. To facilitate comparison, the figure titles follow the format “Plan X—XX min,” indicating the scheme and the corresponding forecast lead time.
Figure 11, Figure 12 and Figure 13 show that all four precipitation forecasting schemes exhibit trends consistent with forecasting tasks, where evaluation metrics gradually decrease as lead time increases. However, differences in spatial distribution are observed across the metrics. For the CSI metric, Plan 1 and Plan 3 have similar mean values, and Plan 3 demonstrates higher CSI scores across a part of the regions, indicating its superior capability in accurately forecasting precipitation occurrence over more extensive areas. Meanwhile, Plans 2 and 4 show a decline in performance at later forecast lead times, falling below the other two schemes. In terms of the MAE metric, Plan 1 exhibits lower errors in the central region, and Plan 3 also maintains relatively low errors. In contrast, Plans 2 and 4 show higher errors compared to the other schemes, aligning with earlier evaluation results. For the CC metric, the differences among the four plans are less pronounced. However, Plan 4 achieves the highest Correlation Coefficient, indicating a stronger alignment between forecasted and observed precipitation, demonstrating better consistency with ground observations.
The above analysis indicates that while the four precipitation forecasting schemes exhibit some differences in the spatial distribution of evaluation metrics, their overall values remain relatively close. To further assess the forecasting accuracy under different precipitation intensities, this study calculates the mean CSI values at various precipitation rates. This evaluation helps determine the performance of each forecasting scheme across different precipitation intensities. The assessment uses five thresholds, 0.1, 1, 2, 3, and 5 mm/h, and the results are presented in bar charts to illustrate the variations in CSI values. The evaluation results are shown in Figure 14.
Based on the statistical results of the CSI metric shown in Figure 14 and Table 2, it is evident that the four precipitation forecasting schemes exhibit varying degrees of performance across different precipitation thresholds. Among them, Plan 4 consistently demonstrates higher CSI values, especially at moderate to high precipitation rates, highlighting its effectiveness in capturing significant rainfall events. At the 1 mm/h threshold, Plan 4 achieves a CSI of 0.191, marking an improvement of approximately 9.1% over Plan 1 and 3.2% over Plan 3. As the precipitation threshold increases, this advantage becomes more pronounced: at 3 mm/h, Plan 4 reaches a CSI of 0.080, which is 11.1% and 17.6% higher than Plan 1 and Plan 3, respectively. Even at the highest threshold of 5 mm/h, where all schemes show a performance decline, Plan 4 maintains a relatively high CSI (0.031), outperforming Plan 1 by nearly 47.6%. These results indicate that the integration of cloud classification products with temporal information in Plan 4 enhances the model’s detection capability for more intense precipitation events. This improvement suggests that Plan 4 not only increases the hit rate for heavy rainfall but also offers better spatial consistency in forecasting. Although the overall improvement comes with an increase in MAE, the gains in CSI across thresholds demonstrate that Plan 4 offers a more reliable and robust approach to precipitation forecasting.
In summary, the integration of cloud classification products enhances the performance of the network in precipitation forecasting. It improves the correlation between predicted results and ground truth while strengthening the model’s ability to accurately forecast future precipitation areas. Furthermore, the incorporation of temporal information further boosts the network’s capability to fit precipitation forecasting tasks, particularly enabling better forecasts in scenarios with higher precipitation rates.

5. Conclusions

Building on previous research, this study proposes a multi-channel satellite precipitation forecasting method that integrates cloud classification products. The method converts cloud classification products into probability of precipitation matrices and fuses them with multi-channel satellite observations to generate precipitation forecasts for the next four hours. By incorporating prior information, the proposed method enhances the performance of satellite-based precipitation forecasting. Evaluation results demonstrate that integrating cloud classification products improves precipitation forecasting accuracy, while the addition of temporal information further boosts forecasting precision. Compared to the baseline method, the proposed approach achieved improvements of 3.0% in MSE, 5.8% in CC, and 8.0% in CSI, but increased the MAE by 4.5%. These results indicate that the integration of cloud classification products enables the model to better capture the temporal evolution of precipitation. Validation using ground-based rain gauge observations confirms that the proposed method enhances forecasting accuracy, particularly for scenarios with higher precipitation rates. These results prove that the method effectively leverages prior information from cloud classification products to improve the performance of satellite-based precipitation forecasting.

6. Discussion

This study proposes a satellite-based precipitation forecasting method that enhances prediction accuracy by leveraging the relationship between cloud classification products and precipitation. Evaluation results show that while this method improves the CSI metric, it also leads to an increase in the MAE metric. The improvement in CSI can be attributed to the statistical relationship between cloud types and precipitation patterns. By statistically analyzing the quantitative relationship between cloud types and rainfall intensity within the study region, the model gains prior information about the likelihood and intensity of precipitation associated with different cloud types. This prior information helps constrain the prediction space and guides the model toward more physically consistent outputs. In particular, deep convective clouds are statistically associated with both a high probability and high intensity of precipitation. This helps the model better distinguish between rainy and non-rainy conditions, which in turn contributes to higher CSI scores. However, the increase in MAE may result from the discrete mapping process used to convert cloud types into numerical features. This approach simplifies complex atmospheric structures into fixed categories. While effective, this simplification can introduce systematic biases or cause overcorrections in certain regions, especially where local cloud–rain relationships differ from the broader regional statistical patterns. As a result, categorical predictions (e.g., rain/no rain) are strengthened, but the precise numerical estimation of precipitation intensity may be affected in some cases, leading to higher MAE.
Therefore, given the complexity of precipitation forecasting, several aspects of this study warrant further investigation.
Deep learning, as a data-driven approach, relies heavily on the quality of the dataset. The accuracy of precipitation forecasting is directly influenced by the quality of the label data. Although the GPM-IMERG Final Run product offers relatively high accuracy, it still lags behind ground-based observations in terms of precision. Therefore, obtaining more accurate precipitation label products or directly utilizing unstructured ground-based observation data remains an important area for future research.
Precipitation forecasting is inherently a forecasting of a weather phenomenon governed by physical processes. Introducing physical constraints to numerically limit the range of model outputs can reduce uncertainties in the forecast results and improve model performance. Additionally, such constraints may further decrease forecasting errors and enhance forecasting accuracy. Moreover, integrating physical constraints can promote the fusion of deep learning methods with atmospheric science theories, thereby advancing the field of atmospheric science and opening up new possibilities for the application of deep learning in this domain.
The cloud classification products used in this study are derived from geostationary satellite observations, with high temporal and spatial resolution with relatively low latency, making them suited for near-real-time forecasting applications. Integrating cloud classification information has a lower computational overhead, as the mapping process is based on statistical data, which greatly enhances the model’s real-time performance. Moreover, since this approach relies on the general relationship between clouds and precipitation along with satellite observation data, it can be extended to other geographic regions by generating region-specific cloud–precipitation statistical relationships. Additionally, the method can be transferred to other satellite platforms with similar infrared spectral capabilities (e.g., Himawari-8, GOES-16), further expanding its applicability.

Author Contributions

Conceptualization, Y.J. and W.C.; methodology, Y.J.; software, Y.J.; validation, W.C., S.W. and S.B.; formal analysis, J.S.; investigation, Y.J.; resources, W.C.; data curation, Y.L.; writing—original draft preparation, Y.J.; writing—review and editing, W.C.; visualization, S.W.; supervision, Y.J.; project administration, W.C.; funding acquisition, J.L. All authors have read and agreed to the published version of the manuscript.

Funding

This work is supported by the National Key R&D Program of China (Grant Nos. 2021YFC3101505), the National Natural Science Foundation of China (Grant Nos. 42375156) and the Basic Scientific Research Business of Provincial Universities in Liaoning Province.

Data Availability Statement

The FY-4A products and the automatic weather station products are available online: https://data.cma.cn/ (accessed on 19 July 2025); the Himawari-8 products are available online: https://www.eorc.jaxa.jp/ptree/index.html (accessed on 19 July 2025); and the GPM-IMERG products are available online: https://gpm.nasa.gov/data/directory (accessed on 19 July 2025).

Acknowledgments

The authors would like to thank the China National Satellite Meteorological Center and National Aeronautics and Space Administration for their data provision. The research product of the cloud type that was used in this paper was supplied by the P-Tree System, Japan Aerospace Exploration Agency (JAXA).

Conflicts of Interest

The authors declare no conflicts of interest.

References

  1. Bi, K.; Xie, L.; Zhang, H.; Chen, X.; Gu, X.; Tian, Q. Accurate Medium-Range Global Weather Forecasting with 3D Neural Networks. Nature 2023, 619, 533–538. [Google Scholar] [CrossRef]
  2. Pan, X.; Lu, Y.; Zhao, K.; Huang, H.; Wang, M.; Chen, H. Improving Nowcasting of Convective Development by Incorporating Polarimetric Radar Variables Into a Deep-Learning Model. Geophys. Res. Lett. 2021, 48, e2021GL095302. [Google Scholar] [CrossRef]
  3. Sadeghi, M.; Nguyen, P.; Hsu, K.; Sorooshian, S. Improving near Real-Time Precipitation Estimation Using a U-Net Convolutional Neural Network and Geographical Information. Environ. Model. Softw. 2020, 134, 104856. [Google Scholar] [CrossRef]
  4. Mekonnen, K.; Melesse, A.M.; Woldesenbet, T.A. Spatial Evaluation of Satellite-Retrieved Extreme Rainfall Rates in the Upper Awash River Basin, Ethiopia. Atmos. Res. 2021, 249, 105297. [Google Scholar] [CrossRef]
  5. Gebremicael, T.G. Satellite-Based Rainfall Estimates Evaluation Using a Parsimonious Hydrological Model in the Complex Climate and Topography of the Nile River Catchments. Atmos. Res. 2022, 266, 105939. [Google Scholar] [CrossRef]
  6. Penteliuc, M.; Frincu, M. Prediction of Cloud Movement from Satellite Images Using Neural Networks. In Proceedings of the 2019 21st International Symposium on Symbolic and Numeric Algorithms for Scientific Computing (SYNASC), Timisoara, Romania, 4–7 September 2019; pp. 222–229. [Google Scholar]
  7. Chen, Y.; Huang, J.; Song, X.; Wen, H.; Song, H. Evaluation of the Impacts of Rain Gauge Density and Distribution on Gauge-Satellite Merged Precipitation Estimates. IEEE Trans. Geosci. Remote Sens. 2022, 60, 4100218. [Google Scholar] [CrossRef]
  8. Battaglia, A.; Kollias, P.; Dhillon, R.; Roy, R.; Tanelli, S.; Lamer, K.; Grecu, M.; Lebsock, M.; Watters, D.; Mroz, K.; et al. Spaceborne Cloud and Precipitation Radars: Status, Challenges, and Ways Forward. Rev. Geophys. 2020, 58, e2019RG000686. [Google Scholar] [CrossRef]
  9. Upadhyaya, S.A.; Kirstetter, P.; Kuligowski, R.J.; Searls, M. Towards Improved Precipitation Estimation with the GOES-16 Advanced Baseline Imager: Algorithm and Evaluation. Q. J. R. Meteorol. Soc. 2022, 148, 3406–3427. [Google Scholar] [CrossRef]
  10. Jiang, Y.; Gao, F.; Zhang, S.; Cheng, W.; Liu, C.; Wang, S. MCSPF-Net: A Precipitation Forecasting Method Using Multi-Channel Cloud Observations of FY-4A Satellite by 3D Convolution Neural Network. Remote Sens. 2023, 15, 4536. [Google Scholar] [CrossRef]
  11. Morrison, H.; Van Lier-Walqui, M.; Fridlind, A.M.; Grabowski, W.W.; Harrington, J.Y.; Hoose, C.; Korolev, A.; Kumjian, M.R.; Milbrandt, J.A.; Pawlowska, H.; et al. Confronting the Challenge of Modeling Cloud and Precipitation Microphysics. J. Adv. Model. Earth Syst. 2020, 12, e2019MS001689. [Google Scholar] [CrossRef]
  12. Berg, W.; L’Ecuyer, T.; Van Den Heever, S. Evidence for the Impact of Aerosols on the Onset and Microphysical Properties of Rainfall from a Combination of Satellite Observations and Cloud-resolving Model Simulations. J. Geophys. Res. Atmospheres 2008, 113, 2007JD009649. [Google Scholar] [CrossRef]
  13. Shen, X.; Wang, Y.; Zhang, N.; Li, X. Precipitation and Cloud Statistics in the Deep Tropical Convective Regime. J. Geophys. Res. Atmospheres 2010, 115, 2010JD014481. [Google Scholar] [CrossRef]
  14. Wang, C.; Tang, G.; Xiong, W.; Ma, Z.; Zhu, S. Infrared Precipitation Estimation Using Convolutional Neural Network for FengYun Satellites. J. Hydrol. 2021, 603, 127113. [Google Scholar] [CrossRef]
  15. Xue, M.; Hang, R.; Liu, Q.; Yuan, X.-T.; Lu, X. CNN-Based near-Real-Time Precipitation Estimation from Fengyun-2 Satellite over Xinjiang, China. Atmos. Res. 2021, 250, 105337. [Google Scholar] [CrossRef]
  16. Hayatbini, N.; Kong, B.; Hsu, K.; Nguyen, P.; Sorooshian, S.; Stephens, G.; Fowlkes, C.; Nemani, R. Conditional Generative Adversarial Networks (cGANs) for Near Real-Time Precipitation Estimation from Multispectral GOES-16 Satellite Imageries—PERSIANN-cGAN. Remote Sens. 2019, 11, 2193. [Google Scholar] [CrossRef]
  17. Sadeghi, M.; Asanjan, A.A.; Faridzad, M.; Nguyen, P.; Hsu, K.; Sorooshian, S.; Braithwaite, D. PERSIANN-CNN: Precipitation Estimation from Remotely Sensed Information Using Artificial Neural Networks–Convolutional Neural Networks. J. Hydrometeorol. 2019, 20, 2273–2289. [Google Scholar] [CrossRef]
  18. Hong, Y.; Hsu, K.-L.; Sorooshian, S.; Gao, X. Precipitation Estimation from Remotely Sensed Imagery Using an Artificial Neural Network Cloud Classification System. J. Appl. Meteorol. 2004, 43, 1834–1853. [Google Scholar] [CrossRef]
  19. Salahi, A.; Ashrafzadeh, A.; Vazifedoust, M. Remote Sensing-Based Precipitation Forecasting Using Cloud Optical Characteristics: Threshold Optimization and Evaluation in Northern and Western Iran. Nat. Hazards 2024, 120, 3661–3675. [Google Scholar] [CrossRef]
  20. Afzali Gorooh, V.; Kalia, S.; Nguyen, P.; Hsu, K.; Sorooshian, S.; Ganguly, S.; Nemani, R. Deep Neural Network Cloud-Type Classification (DeepCTC) Model and Its Application in Evaluating PERSIANN-CCS. Remote Sens. 2020, 12, 316. [Google Scholar] [CrossRef]
  21. Hong, J.; Mao, F.; Gong, W.; Gan, Y.; Zang, L.; Quan, J.; Chen, J. Assimilating Fengyun-4A Observations to Improve WRF-Chem PM2.5 Predictions in China. Atmos. Res. 2022, 265, 105878. [Google Scholar] [CrossRef]
  22. Zhang, P.; Lu, Q.; Hu, X.; Gu, S.; Yang, L.; Min, M.; Chen, L.; Xu, N.; Sun, L.; Bai, W.; et al. Latest Progress of the Chinese Meteorological Satellite Program and Core Data Processing Technologies. Adv. Atmos. Sci. 2019, 36, 1027–1045. [Google Scholar] [CrossRef]
  23. Hu, Y.; Zhang, Y.; Yan, L.; Li, X.-M.; Dou, C.; Jia, G.; Si, Y.; Zhang, L. Evaluation of the Radiometric Calibration of FY4A-AGRI Thermal Infrared Data Using Lake Qinghai. IEEE Trans. Geosci. Remote Sens. 2021, 59, 8040–8050. [Google Scholar] [CrossRef]
  24. Yang, J.; Zhang, Z.; Wei, C.; Lu, F.; Guo, Q. Introducing the New Generation of Chinese Geostationary Weather Satellites, Fengyun-4. Bull. Am. Meteorol. Soc. 2017, 98, 1637–1658. [Google Scholar] [CrossRef]
  25. Xian, D.; Zhang, P.; Gao, L.; Sun, R.; Zhang, H.; Jia, X. Fengyun Meteorological Satellite Products for Earth System Science Applications. Adv. Atmos. Sci. 2021, 38, 1267–1284. [Google Scholar] [CrossRef]
  26. Bessho, K.; Date, K.; Hayashi, M.; Ikeda, A.; Imai, T.; Inoue, H.; Kumagai, Y.; Miyakawa, T.; Murata, H.; Ohno, T.; et al. An Introduction to Himawari-8/9-Japan’s New-Generation Geostationary Meteorological Satellites. J. Meteorol. Soc. Jpn. Ser II 2016, 94, 151–183. [Google Scholar] [CrossRef]
  27. Letu, H.; Nagao, T.M.; Nakajima, T.Y.; Riedi, J.; Ishimoto, H.; Baran, A.J.; Shang, H.; Sekiguchi, M.; Kikuchi, M. Ice Cloud Properties From Himawari-8/AHI Next-Generation Geostationary Satellite: Capability of the AHI to Monitor the DC Cloud Generation Process. IEEE Trans. Geosci. Remote Sens. 2019, 57, 3229–3239. [Google Scholar] [CrossRef]
  28. Nie, L.; Chen, Y.; Zhang, D. All-Day Cloud Property and Occurrence Probability Dataset Based on Satellite Remote Sensing Data. Sci. Data 2025, 12, 387. [Google Scholar] [CrossRef]
  29. Hahn, C.J.; Rossow, W.B.; Warren, S.G. ISCCP Cloud Properties Associated with Standard Cloud Types Identified in Individual Surface Observations. J. Clim. 2001, 14, 11–28. [Google Scholar] [CrossRef]
  30. Huffman, G.J.; Bolvin, D.T.; Braithwaite, D.; Hsu, K.; Joyce, R.; Kidd, C.; Sorooshian, S.; Xie, P. Developing the Integrated Multi-Satellite Retrievals for GPM (IMERG). In Proceedings of the EGU General Assembly Conference Abstracts; EGU, Vienna, Austria, 22–27 April 2012; Volume 6921. [Google Scholar]
  31. Tang, G.; Zeng, Z.; Long, D.; Guo, X.; Yong, B.; Zhang, W.; Hong, Y. Statistical and Hydrological Comparisons between TRMM and GPM Level-3 Products over a Midlatitude Basin: Is Day-1 IMERG a Good Successor for TMPA 3B42V7? J. Hydrometeorol. 2016, 17, 121–137. [Google Scholar] [CrossRef]
  32. Hou, A.Y.; Kakar, R.K.; Neeck, S.; Azarbarzin, A.A.; Kummerow, C.D.; Kojima, M.; Oki, R.; Nakamura, K.; Iguchi, T. The Global Precipitation Measurement Mission. Bull. Am. Meteorol. Soc. 2014, 95, 701–722. [Google Scholar] [CrossRef]
  33. Liu, Z.; Ostrenga, D.; Vollmer, B.; Deshong, B.; Macritchie, K.; Greene, M.; Kempler, S. Global Precipitation Measurement Mission Products and Services at the NASA GES DISC. Bull. Am. Meteorol. Soc. 2017, 98, 437–444. [Google Scholar] [CrossRef] [PubMed]
  34. Maggioni, V.; Meyers, P.C.; Robinson, M.D. A Review of Merged High-Resolution Satellite Precipitation Product Accuracy during the Tropical Rainfall Measuring Mission (TRMM) Era. J. Hydrometeorol. 2016, 17, 1101–1117. [Google Scholar] [CrossRef]
  35. Foelsche, U.; Kirchengast, G.; Fuchsberger, J.; Tan, J.; Petersen, W.A. Evaluation of GPM IMERG Early, Late, and Final Rainfall Estimates Using WegenerNet Gauge Data in Southeastern Austria. Hydrol. Earth Syst. Sci. 2017, 21, 6559–6572. [Google Scholar] [CrossRef]
  36. Satgé, F.; Hussain, Y.; Bonnet, M.-P.; Hussain, B.; Martinez-Carvajal, H.; Akhter, G.; Uagoda, R. Benefits of the Successive GPM Based Satellite Precipitation Estimates IMERG–V03, –V04, –V05 and GSMaP–V06, –V07 Over Diverse Geomorphic and Meteorological Regions of Pakistan. Remote Sens. 2018, 10, 1373. [Google Scholar] [CrossRef]
  37. Pradhan, R.K.; Markonis, Y.; Vargas Godoy, M.R.; Villalba-Pradas, A.; Andreadis, K.M.; Nikolopoulos, E.I.; Papalexiou, S.M.; Rahim, A.; Tapiador, F.J.; Hanel, M. Review of GPM IMERG Performance: A Global Perspective. Remote Sens. Environ. 2022, 268, 112754. [Google Scholar] [CrossRef]
  38. Liu, Z. Comparison of Integrated Multisatellite Retrievals for GPM (IMERG) and TRMM Multisatellite Precipitation Analysis (TMPA) Monthly Precipitation Products: Initial Results. J. Hydrometeorol. 2016, 17, 777–790. [Google Scholar] [CrossRef]
  39. Sun, Q.; Miao, C.; Duan, Q.; Ashouri, H.; Sorooshian, S.; Hsu, K. A Review of Global Precipitation Data Sets: Data Sources, Estimation, and Intercomparisons. Rev. Geophys. 2018, 56, 79–107. [Google Scholar] [CrossRef]
  40. Moazami, S.; Najafi, M.R. A Comprehensive Evaluation of GPM-IMERG V06 and MRMS with Hourly Ground-Based Precipitation Observations across Canada. J. Hydrol. 2021, 594, 125929. [Google Scholar] [CrossRef]
  41. Anjum, M.N.; Ding, Y.; Shangguan, D.; Ahmad, I.; Ijaz, M.W.; Farid, H.U.; Yagoub, Y.E.; Zaman, M.; Adnan, M. Performance Evaluation of Latest Integrated Multi-Satellite Retrievals for Global Precipitation Measurement (IMERG) over the Northern Highlands of Pakistan. Atmos. Res. 2018, 205, 134–146. [Google Scholar] [CrossRef]
  42. Huang, C.; Hu, J.; Chen, S.; Zhang, A.; Liang, Z.; Tong, X.; Xiao, L.; Min, C.; Zhang, Z. How Well Can IMERG Products Capture Typhoon Extreme Precipitation Events over Southern China? Remote Sens. 2019, 11, 70. [Google Scholar] [CrossRef]
  43. Xu, B.; Xie, P.; Xu, M.; Jiang, L.; Shi, C.; You, R. A Validation of Passive Microwave Rain-Rate Retrievals from the Chinese FengYun-3B Satellite. J. Hydrometeorol. 2015, 16, 1886–1905. [Google Scholar] [CrossRef]
  44. Ren, Z.; Zhao, P.; Zhang, Q.; Zhang, Z.; Cao, L.; Yang, L.; Zou, F.; Zhao, Y.; Zhao, H.; Chen, Z. Quality control procedures for hourly precipitation data from automatic weather stations in China. Meteorol. Mon. 2010, 36, 123–132. (In Chinese) [Google Scholar]
  45. Ronneberger, O.; Fischer, P.; Brox, T. U-Net: Convolutional Networks for Biomedical Image Segmentation. In Medical Image Computing and Computer-Assisted Intervention—MICCAI 2015; Navab, N., Hornegger, J., Wells, W.M., Frangi, A.F., Eds.; Lecture Notes in Computer Science; Springer International Publishing: Cham, Switzerland, 2015; Volume 9351, pp. 234–241. ISBN 978-3-319-24573-7. [Google Scholar]
  46. Xie, S.; Girshick, R.; Dollár, P.; Tu, Z.; He, K. Aggregated Residual Transformations for Deep Neural Networks. arXiv 2017, arXiv:1611.05431. [Google Scholar] [CrossRef]
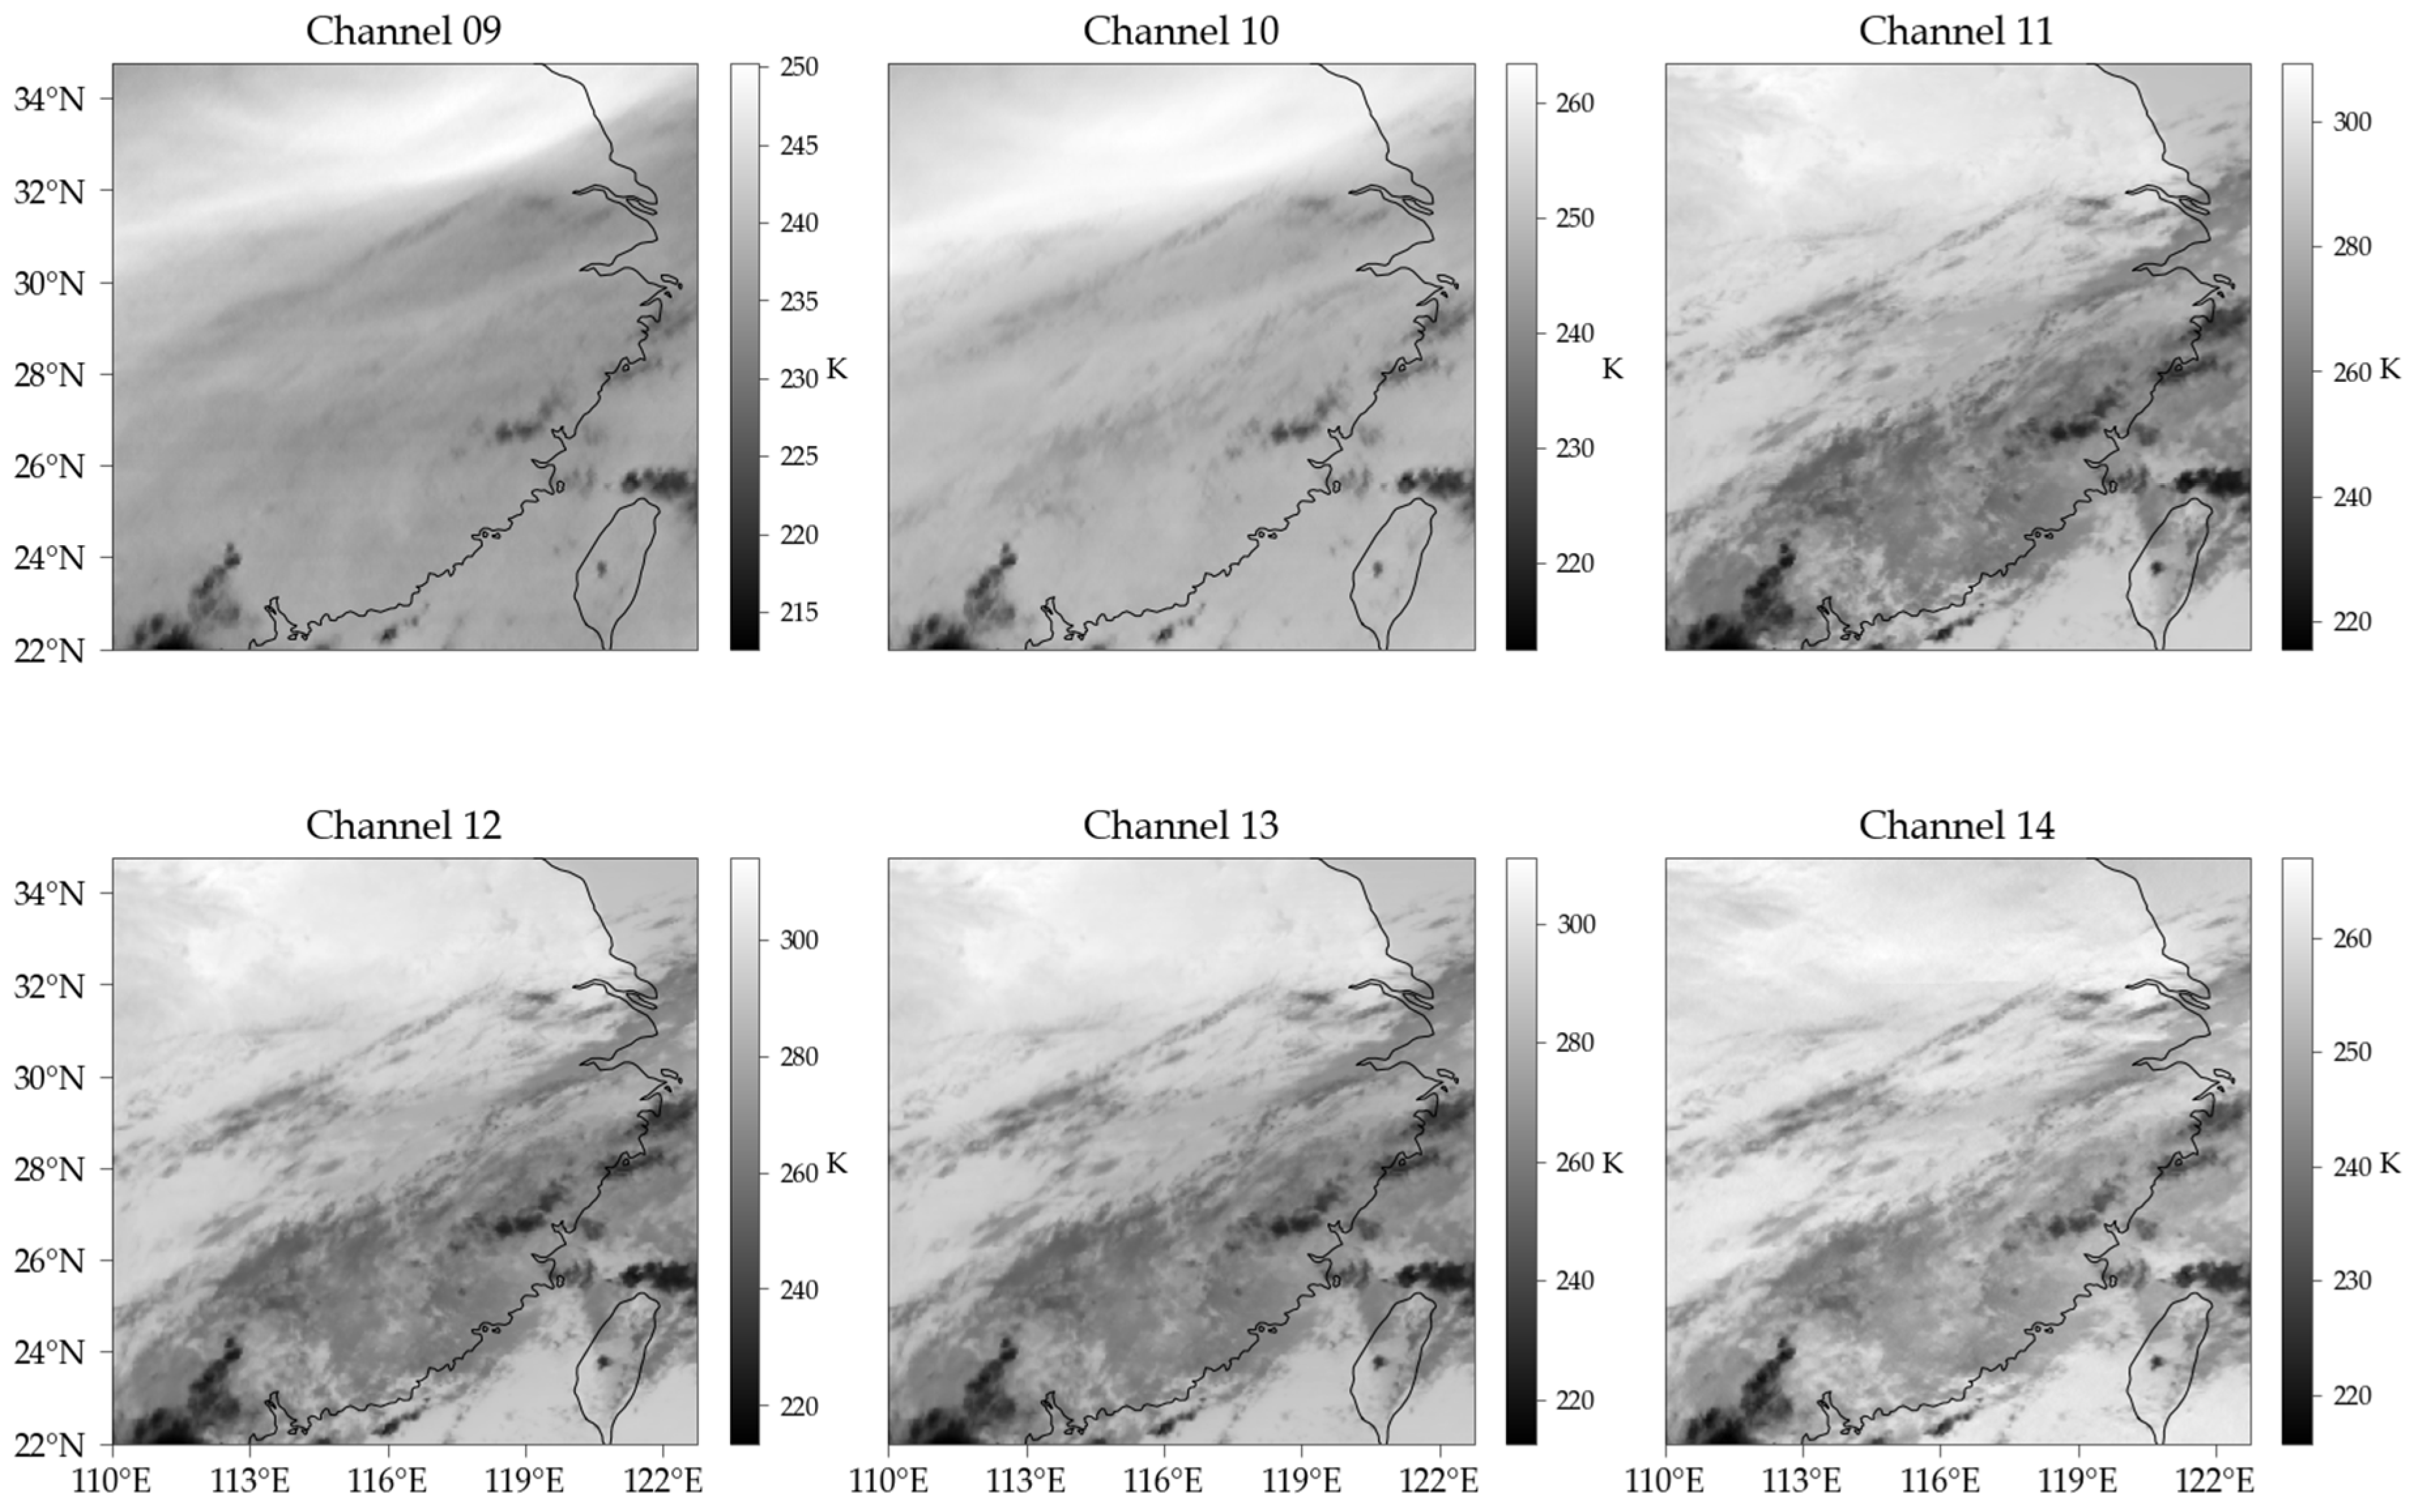
Figure 1. The infrared band visualization image from the FY-4A satellite, where channels 9–14 correspond to wavelengths of 6.25 μm, 7.1 μm, 8.5 μm, 10.7 μm, 12.0 μm, and 13.5 μm, respectively. Units: K (Kelvin). (Example time: 2 June 2019, 03 UTC).
Remotesensing 17 02853 g001
Figure 2. The Himawari-8 cloud classification products, and the cloud types depicted in the figure include the following: Stratus (St), Strato-cumulus (Sc), Cumulus (Cu), Nimbo-stratus (Ns), Alto-stratus (As), Alto-cumulus (Ac), deep convection (Dc), Cirro-stratus (Cs), Cirrus (Ci). (Example time: 2 June 2019, 03 UTC).
Remotesensing 17 02853 g002
Figure 3. The resulting distribution of precipitation rates for different cloud types. The abscissa represents the precipitation rate (mm/h), while the ordinate denotes the probability distribution of precipitation events associated with each cloud type.
Remotesensing 17 02853 g003
Figure 4. The mapping method for cloud classification products.
Remotesensing 17 02853 g004
Figure 5. The implementation of satellite precipitation forecasting integrating cloud classification products. Each panel in the figure corresponds to (a) basic data construction method, (b) input data construction method, (c) label data construction method, (d) precipitation forecasting model structure.
Remotesensing 17 02853 g005
Figure 6. Quantitative evaluation results of precipitation forecast plans with different forecast lead times. The x-axis represents the forecast lead time, while the y-axis indicates the variations in different metrics. (ac) of Figure 6 displays three quantitative evaluation metrics: Mean Squared Error (MSE), Mean Absolute Error (MAE), and Correlation Coefficient (CC). The second row shows three categorical evaluation metrics (df): Probability of Detection (POD), False Alarm Ratio (FAR), and Critical Success Index (CSI). (MSE, MAE Unit: mm/h.)
Remotesensing 17 02853 g006
Figure 7. Spatial distribution of MAE metric in four precipitation forecast plans. Four rows of images represent spatial distributions of Plans 1–4 at forecast lead times of 60, 120, 180, and 240 min, respectively.
Remotesensing 17 02853 g007
Figure 8. Spatial distribution of CSI metric in four precipitation forecast plans. Four rows of images represent spatial distributions of Plans 1–4 at forecast lead times of 60, 120, 180, and 240 min, respectively.
Remotesensing 17 02853 g008
Figure 9. Spatial distribution of CC metric in four precipitation forecast plans. Four rows of images represent spatial distributions of Plans 1–4 at forecast lead times of 60, 120, 180, and 240 min, respectively.
Remotesensing 17 02853 g009
Figure 10. Regional average precipitation and precipitation frequency (example time: May to September 2021).
Remotesensing 17 02853 g010
Figure 11. The spatial distribution of MAE metrics for the precipitation forecasting results using ground rain gauge observations as true values. The figure titles follow the format “Plan X—XX min,” indicating the scheme and the corresponding forecast lead time.
Remotesensing 17 02853 g011
Figure 12. The spatial distribution of CSI metrics for the precipitation forecasting results using ground rain gauge observations as true values.
Remotesensing 17 02853 g012
Figure 13. The spatial distribution of CC metrics for the precipitation forecasting results using ground rain gauge observations as true values.
Remotesensing 17 02853 g013
Figure 14. Average CSI metrics across different thresholds for the four precipitation forecasting plans (thresholds: 0.1, 1, 2, 3, and 5 mm/h).
Remotesensing 17 02853 g014
Table 1. The average values of the multi-index quantitative evaluation results of four quantitative precipitation forecasting plans (MSE, MAE Unit: mm/h).
MetricPlan 1Plan 2Plan 3Plan 4
MSE2.1612.1212.0982.097
MAE0.3350.3580.3400.350
CC0.3950.4210.4100.418
POD0.5410.6790.6440.681
FAR0.3700.4530.4120.437
CSI0.4100.4310.4420.443
Table 2. The four precipitation forecasting schemes demonstrate varying performances across different thresholds when evaluated by the 4-h average CSI metric. (Thresholds: 0.1, 1, 2, 3, and 5 mm/h.)
Threshold (mm/h)Plan 1Plan 2Plan 3Plan 4
0.10.2710.2450.2650.254
10.1750.1830.1850.191
20.1150.1220.1140.126
30.0720.0780.0680.080
50.0210.0320.0240.031
Disclaimer/Publisher’s Note: The statements, opinions and data contained in all publications are solely those of the individual author(s) and contributor(s) and not of MDPI and/or the editor(s). MDPI and/or the editor(s) disclaim responsibility for any injury to people or property resulting from any ideas, methods, instructions or products referred to in the content.