Article

An Enhanced Cycle Slip Detection Approach Based on Inter-Frequency Cross-Validation for Multi-Constellation and Multi-Frequency GNSS Systems

College of Aerospace Science and Engineering, National University of Defense Technology, Changsha 410073, China
*
Author to whom correspondence should be addressed.
Remote Sens. 2025, 17(16), 2856; https://doi.org/10.3390/rs17162856
Submission received: 19 July 2025 / Revised: 13 August 2025 / Accepted: 15 August 2025 / Published: 16 August 2025

Abstract

Cycle slip detection in the carrier phase is important for achieving precise relative positioning with global navigation satellite systems (GNSSs) in urban environments. The false alarm rate (FAR) and missing detection rate (MDR) of the detection approach will significantly affect the positioning error. This paper proposes a novel cycle slip detection approach based on inter-frequency cross-validation (IFCV), and designs corresponding test statistics and thresholds. In contrast to conventional cycle slip detection methods, the proposed IFCV approach has the advantages of higher accuracy and efficiency, which is validated by the airborne dynamic test. For cycle slips of specific proportions (such as five-cycle and four-cycle slips), the IFCV method significantly reduces the MDR from 3.89% to 0% and decreases the relative positioning error from 4.69 cm to 3.17 cm. In tests involving randomly injected cycle slips, the IFCV method reduces the MDR from 0.02% to 0%, reduces the relative positioning error from 3.83 cm to 3.02 cm, and decreases the average computational time from 1.02 ms to 0.53 ms.

1. Introduction

With the rapid development and of multi-constellation, multi-frequency global navigation satellite systems (GNSSs), including GPS, BDS, Galileo, GLONASS and other regional navigation systems, carrier-phase-based differential relative positioning, also commonly referred to as real-time kinematics (RTK), has been widely used in various missions, such as unmanned aerial vehicle (UAV) formation flight, automatic rendezvous and docking, automatic aircraft landing, and intelligent autonomous driving for dynamic carriers ranging from unmanned ground vehicles (UGVs) to spacecraft, due to its significant advantages in accuracy and cost [1,2,3]. For precise relative navigation utilizing differenced carrier phase observations, rapid and accurate determination of the integer ambiguity resolution (IAR) is critical, as it directly determines the ultimate achievable navigation performance [4,5]. However, in challenging signal environments characterized by occlusion, attenuation, ionosphere scintillation or interference, GNSS receivers may experience intermittent signal tracking and even loss of lock [6]. The resulting cycle slips in carrier phase observations degrade positioning accuracy to the meter level if undetected or improperly corrected [7,8,9].
Conventional approaches for cycle slip detection encompass high-order differencing, polynomial fitting, ionospheric residual combinations, and INS (inertial navigation system)-aided detection [10,11,12,13]. The conventional geometry-free (GF) method constructs GF test statistics using dual-frequency measurement to enable efficient detection [14]. However, it fails to identify cycle slips with a specific proportion between frequencies. Upon detection of a cycle slip, dual-frequency carrier phase observations for the affected satellite are excluded, thereby diminishing GNSS availability at the corresponding epoch [15]. Furthermore, the widely adopted Turbo-Edit method uses a combination of the GF and Melbourne–Wübbena (MW) methods to detect cycle slips, mitigating the abovementioned limitation in the GF method, yet it retains inherent deficiencies [16]. Notably, pseudorange measurement errors significantly degrade detection reliability in dual-frequency combinations. Moreover, this approach is prone to overlooking cycle slips with similar magnitudes or specific proportionality across frequencies, potentially resulting in missed detection or false alarms [17]. Conversely, the proposed inter-frequency cross-validation (IFCV) approach employs a satellite array, leveraging all visible satellites to construct test statistics rather than individual satellites, which substantially enhances detection robustness and reduces failure margins.
Recent advances in cycle slip detection with auxiliary information have been reported by multiple researchers. Wei Li et al. designed a novel detection threshold based on ionospheric variation amplitude, which improves PPP positioning accuracy by 20% under quiet ionospheric conditions and 85% during ionospheric disturbances [18]. However, this method is limited to low-sampling-rate observation data. Wei Liu et al. proposed a smoothed Doppler-aided carrier phase cycle slip detection method, achieving a 100% detection success rate validated through dynamic experiments, with PPP (precise point positioning) positioning accuracy reaching the centimeter level [19]. Chan-hee Lee et al. utilized dual-frequency carrier phase observations to detect minor cycle slips in single-frequency signals, demonstrating in UAV flight tests lower false alarm and missed detection rates compared to Doppler-aided methods [20]. Qingsong Li et al. investigated an inertial navigation system (INS)-aided detection approach, leveraging the high precision of INS-derived position increments over short intervals to enable high-accuracy cycle slip detection, while also analyzing its impact on integrity risk for relative positioning [21].
Recent studies have increasingly focused on multi-frequency combination observations to enhance cycle slip detection performance [22,23,24]. Currently, the combined coefficient method, widely applied in triple-frequency scenarios, optimizes coefficients to satisfy integer constraints while maximizing wavelength, minimizing noise, and reducing ionospheric influences [22,25]. To address the cycle slip detection challenges in quad-frequency and penta-frequency systems, Shuai Nie et al. proposed an optimal multi-frequency combination coefficient detection method based on composite noise and ionospheric scaling factors, which effectively enhances the success rate of cycle slip repair under ionospheric disturbances [26]. Although Reference [24] proposed a dual-frequency GF model with the LAMBDA (least-squares ambiguity decorrelation adjustment) algorithm for triple-frequency cycle slip repair, small-magnitude cycle slips remain challenging to detect. Alternative approaches integrate pseudorange and carrier phase observations to search for optimal coefficients in triple-frequency cycle slip detection [27,28,29,30]. However, specific coefficient combinations of cycle slips remain undetectable. The IFCV method overcomes this by deriving test statistics from double-differenced (DD) carrier phase observations, thus detecting more slips successfully.
This paper proposes a novel carrier phase cycle slip detection method based on inter-frequency cross-validation (IFCV). The core principle involves utilizing double-differenced carrier phase observations from all visible satellites on a single frequency to predict carrier phase measurements at another frequency. The key component of the method is a novel test statistic, formulated through the discrepancy between the predicted and actual carrier phase observations at the second frequency. The detection process is systematically structured within a dual-hypothesis testing framework. Furthermore, the inherent properties of the IFCV approach facilitate the precise analytical derivation of the relative position error distribution and integrity risk [21]. The performance of the proposed IFCV approach is rigorously evaluated through dynamic flight tests. Results demonstrate that the IFCV approach significantly outperforms the Turbo-Edit method, achieving superior positioning accuracy, reducing missing detection rate, and shortening computational time. The enhanced performance is evident for both stochastic cycle slips and cycle slips in specific proportion.

2. Related Methods

For precise relative positioning scenarios, measurement equation should be constructed utilizing carrier phase observation. The classical non-differenced carrier phase measurement equation is expressed as
φ k j = 1 λ r j ( T j ) r k ( t k ) + f δ t k f δ t j + 1 λ δ ρ k , tro j 1 λ δ ρ k , ion j N k j + ε k j
where j is the satellite number, and k is the station number; ϕ k j is the carrier phase from observation; λ is the wavelength of the carrier; r j ( T j ) is the position vector of the satellite at the moment of signal transmission; r k ( t k ) is the position vector of the receiver at the moment of signal reception; the operator · represents the norm of the vector; f is the frequency of the carrier; δ t k is the clock error of the receiver; δ t j is the clock error of the satellite; δ ρ k , tro j denotes tropospheric delay; δ ρ k , ion j denotes ionospheric delay; N k j is the ambiguity of the channel; and ε k j is random measurement error.
In precise relative positioning, the inter-station single-differenced (SD) carrier phase measurement equation is utilized to eliminate tropospheric delay, tropospheric delay, and satellite clock error.
φ A j φ B j = 1 λ r j ( T j ) r A ( T A ) 1 λ r j ( T j ) r B ( T B ) + f ( δ t A δ t B ) N A B j + ε A B j
where A and B represent the two stations, N A B j is the SD ambiguity between A and B, and ε A B j is random SD measurement error.
Conventionally, the LAMBDA method is employed for ambiguity resolution. Subsequently, the relative position vector between the user and base stations is derived by substituting the resolved ambiguities into Equation (2). In Fixed-and-Hold ambiguity resolution mode, once ambiguities for all channels are determined during initialization, subsequent epochs directly compute relative position vectors based on Equation (2). This approach offers advantages in computational efficiency by eliminating the need for continuous floating-point ambiguity solutions. However, its vulnerability lies in susceptibility to cycle slips: if undetected in any channel, positioning errors propagate irrecoverably. Consequently, high-accuracy cycle slip detection method is imperative for this mode.

2.1. The MW Method

The classical MW combination method detects cycle slips by utilizing the inter-epoch stability of wide-lane ambiguity [17]. The wide-lane ambiguity is formally defined as
N W L = 1 λ W L f 1 φ   1 f 2 φ   2 f 1 f 2 f 1 ρ 1 + f 2 ρ 2 f 1 + f 2
where λ W L denotes the wide-lane wavelength, ρ 1 and ρ 2 denote the pseudorange observations, and φ   1 and φ 2 denote the carrier phase observations. In the absence of cycle slips, the wide-lane ambiguity should remain constant between consecutive epochs. A test statistic can therefore be constructed as:
T = N W L ( t i ) N W L ( t i - 1 )
where t i denotes the current epoch. Cycle slips are detected based on the following criteria: If T < T H (where T H is a predefined threshold), the carrier phase observations are deemed cycle-slip-free. If T > T H , cycle slips are identified in the carrier phase observations of the corresponding satellite.

2.2. The GF Method

The classical GF combination method utilizes the frequency-domain correlation of dual-frequency carrier phase observations to detect cycle slips through inter-epoch differencing. The GF observation is defined as
φ G F = λ 1 φ 1 λ 2 φ 2
where λ 1 , λ 2 are wavelengths and φ 1 , φ 2 denote carrier phase observations. In the absence of cycle slips and under negligible short-term ionospheric delay variations, φ G F remains consistent across epochs. A test statistic is constructed as
T = φ GF t i φ GF t i 1
Cycle slips are flagged when T > T H ( T H = 3 σ GF , where σ GF denotes the noise standard deviation).
However, the MW combination fails to detect small cycle slips (<2 cycles) due to pseudorange noise. Meanwhile, the GF method cannot identify proportional cycle slips satisfying Δ N 1 / Δ N 2 f 1 / f 2 .
A classical cycle slip detection method, Turbo-Edit, integrates the MW and GF combinations to identify cycle slips without requiring satellite/station position vectors, enabling single-station operation [16]. Nevertheless, this method exhibits limitations in detecting cycle slips of specific proportions. To address these deficiencies, this paper proposes a novel IFCV approach, detailed in the following section.

3. IFCV Method

3.1. Single-Frequency Inter-Epoch Inter-Station Double-Difference Carrier Phase Observation Equation

Two observation stations (denoted as Station A and Station B) receive navigation satellite signals across two consecutive epochs ( t 1 and t 0 ). The double-difference carrier phase observation equation is formulated as
λ f 1 Δ φ A B j ( t 1 ) λ f 1 Δ φ A B j ( t 0 ) = ( r j ( T 1 ) r B ( t 1 ) r j ( T 1 ) r A ( t 1 ) ) ( r j ( T 0 ) r B ( t 0 ) r j ( T 0 ) r A ( t 0 ) ) + c δ t A B ( t 1 ) δ t A B ( t 0 ) + ε A B , Δ t j
where A and B are the base station and the user station; φ A B ( t 1 ) = φ B ( t 1 ) φ A ( t 1 ) is the single-difference carrier phase observation between stations at t 1 ; r j ( T 1 ) is the position vector of satellite j , and r B ( t 1 ) is the position vector of the user Station B; δ t A B ( t 1 ) = δ t B ( t 1 ) δ t A ( t 1 ) is the single-difference receiver clock error between two stations; and ε A B , δ t is the random error of DD carrier phase observations.
According to the Appendix A at the end of the paper, Equation (7) is linearized through Taylor expansion and transformed into
λ f 1 Δ φ AB , Δ t j r j ( T 1 ) r A ( t 1 ) Δ r A B , ( t 1 ) r j ( T 1 ) r A ( t 1 ) + r j ( T 0 ) r A ( t 0 ) Δ r A B 0 ( t 0 ) r j ( T 0 ) r A ( t 0 ) = r B j 0 ( t 1 ) δ Δ r A B , Δ t + c δ t A B , Δ t , f 1 + ε A B , Δ t j
where r A B 0 denotes the initial value of the baseline vector; Δ φ A B , Δ t j denotes DD carrier phase observation, r B j 0 ( t 1 ) denotes the line-of-sight (LOS) vector from the user Station B to the satellite, and δ Δ r A B , Δ t denotes the variation in baseline vector correction between two consecutive epochs t 1 and t 0 , serving as the unknown parameter to be estimated. These variables are defined as follows:
Δ φ A B , Δ t j = Δ φ A B j ( t 1 ) Δ φ A B j ( t 0 )
r B j 0 ( t 1 ) = r j ( T 1 ) r A ( t 1 ) Δ r A B 0 ( t 1 ) r j ( T 1 ) r A ( t 1 ) Δ r A B 0 ( t 1 )
δ Δ r A B , Δ t = δ Δ r A B ( t 1 ) δ Δ r A B ( t 0 )
δ t A B , Δ t = δ t A B ( t 1 ) δ t A B ( t 0 )
When multiple visible satellites are available, a joint equation system is formulated as follows:
Y = A δ X + E
Y = λ f 1 Δ φ A B , Δ t 1 Δ R A B , Δ t 1 λ f 1 Δ φ A B , Δ t j Δ R A B , Δ t j λ f 1 Δ φ A B , Δ t n Δ R A B , Δ t n , A = r B 10 ( t 1 ) 1 r B j 0 ( t 1 ) 1 r B n 0 ( t 1 ) 1 ,  
δ X = δ Δ r A B , Δ t c δ t A B , Δ t ,   E = ε A B , Δ t 1 ε A B , Δ t j ε A B , Δ t n
Δ R A B , Δ t j = r j ( T 1 ) r A ( t 1 ) Δ r A B , ( t 1 ) r j ( T 1 ) r A ( t 1 ) r j ( T 0 ) r A ( t 0 ) Δ r A B , ( t 0 ) r j ( T 0 ) r A ( t 0 )
The least-squares (LS) solution is expressed as
δ   X ^   = ( A T PA ) 1 A T PY
and the covariance matrix of X ^ is
Σ δ   X ^   = ( A T PA ) 1
The weight matrix P is a diagonal matrix, with its main diagonal elements given by 1 σ j 2 , where σ j 2 denotes the variance of the comprehensive measurement error for the DD carrier phase observation.
To mitigate adverse effects of individual cycle slips on LS estimated solutions, elements of the standardized residual vector are sequentially tested. Observations corresponding to residuals exceeding the threshold are removed, and the LS estimation is reiterated with all validated observations.

3.2. Novel Test Statistic Design for Cycle Slip Detection

Based on the least-squares estimation, the predicted double-differenced (DD) carrier-phase observable for frequency f 2 can be derived from the estimated vector δ   X ^   f 1 at the frequency f 1 :
λ f 2 Δ φ ˜ A B , f 2 , Δ t j = Δ R A B , Δ t j r B j 0 ( t 1 ) δ Δ r A B , Δ t , f 1 + c δ t A B , Δ t , f 1
The variance of the predicted DD carrier phase observation σ Δ φ ˜ f 2 2 (abbreviated form of σ Δ φ ˜ A B , f 2 , Δ t j 2 ) is computed via covariance propagation:
σ Δ φ ˜ f 2 2 = A j Σ δ X ^ f 1 A j T
where A j denotes the coefficient matrix for the satellite j
A j = r B j 0 ( t 1 ) 1
For the j th channel, the test statistic is defined as:
T j = λ f 2 Δ φ f 2 j λ f 2 Δ φ ˜ f 2 j
where λ f 2 is the carrier wavelength at frequency f 2 ; Δ φ f 2 j is the actual DD carrier phase observation; and Δ φ ˜ f 2 j is the predicted DD carrier phase observation derived from Equation (19).
Under the null hypothesis H 0 (no cycle slip), both actual and predicted DD observation errors follow zero-mean normal distributions. T j follows a zero-mean normal distribution.
Under the alternative hypothesis H 1 (cycle slip occurs in the DD carrier phase observation), T j follows a non-zero-mean normal distribution:
H 0 : T N ( 0 , σ T 2 ) H 1 : T N ( λ f 2 k , σ T 2 ) , k   Z   & k 0
where k denotes the integer cycle slip value, and σ T 2 combines variances from both prediction and observation errors:
σ T j 2 = λ f 2 2 σ Δ φ f 2 j 2 + λ f 2 2 σ Δ φ ˜ f 2 j 2
where σ Δ φ ˜ f 2 j 2 is computed from Equation (20), while σ Δ φ f 2 j 2 represents the normal error variance of the DD observation.
Given a false alarm rate α , the detection threshold T H is determined by:
TH j = Φ 1 ( 1 α 2 ) σ T j
where Φ 1 ( ) is the inverse cumulative distribution function (CDF) of the standard normal distribution:
Φ ( x ) = x 1 2 π exp ( τ 2 2 ) d τ
A cycle slip is detected when T j > T H j , and the corresponding DD observation is eliminated. If the test statistic T j falls below the test threshold T H j , it indicates the absence of cycle slips in the carrier phase observation of this channel, and the observation can be utilized for final precise relative positioning solutions.
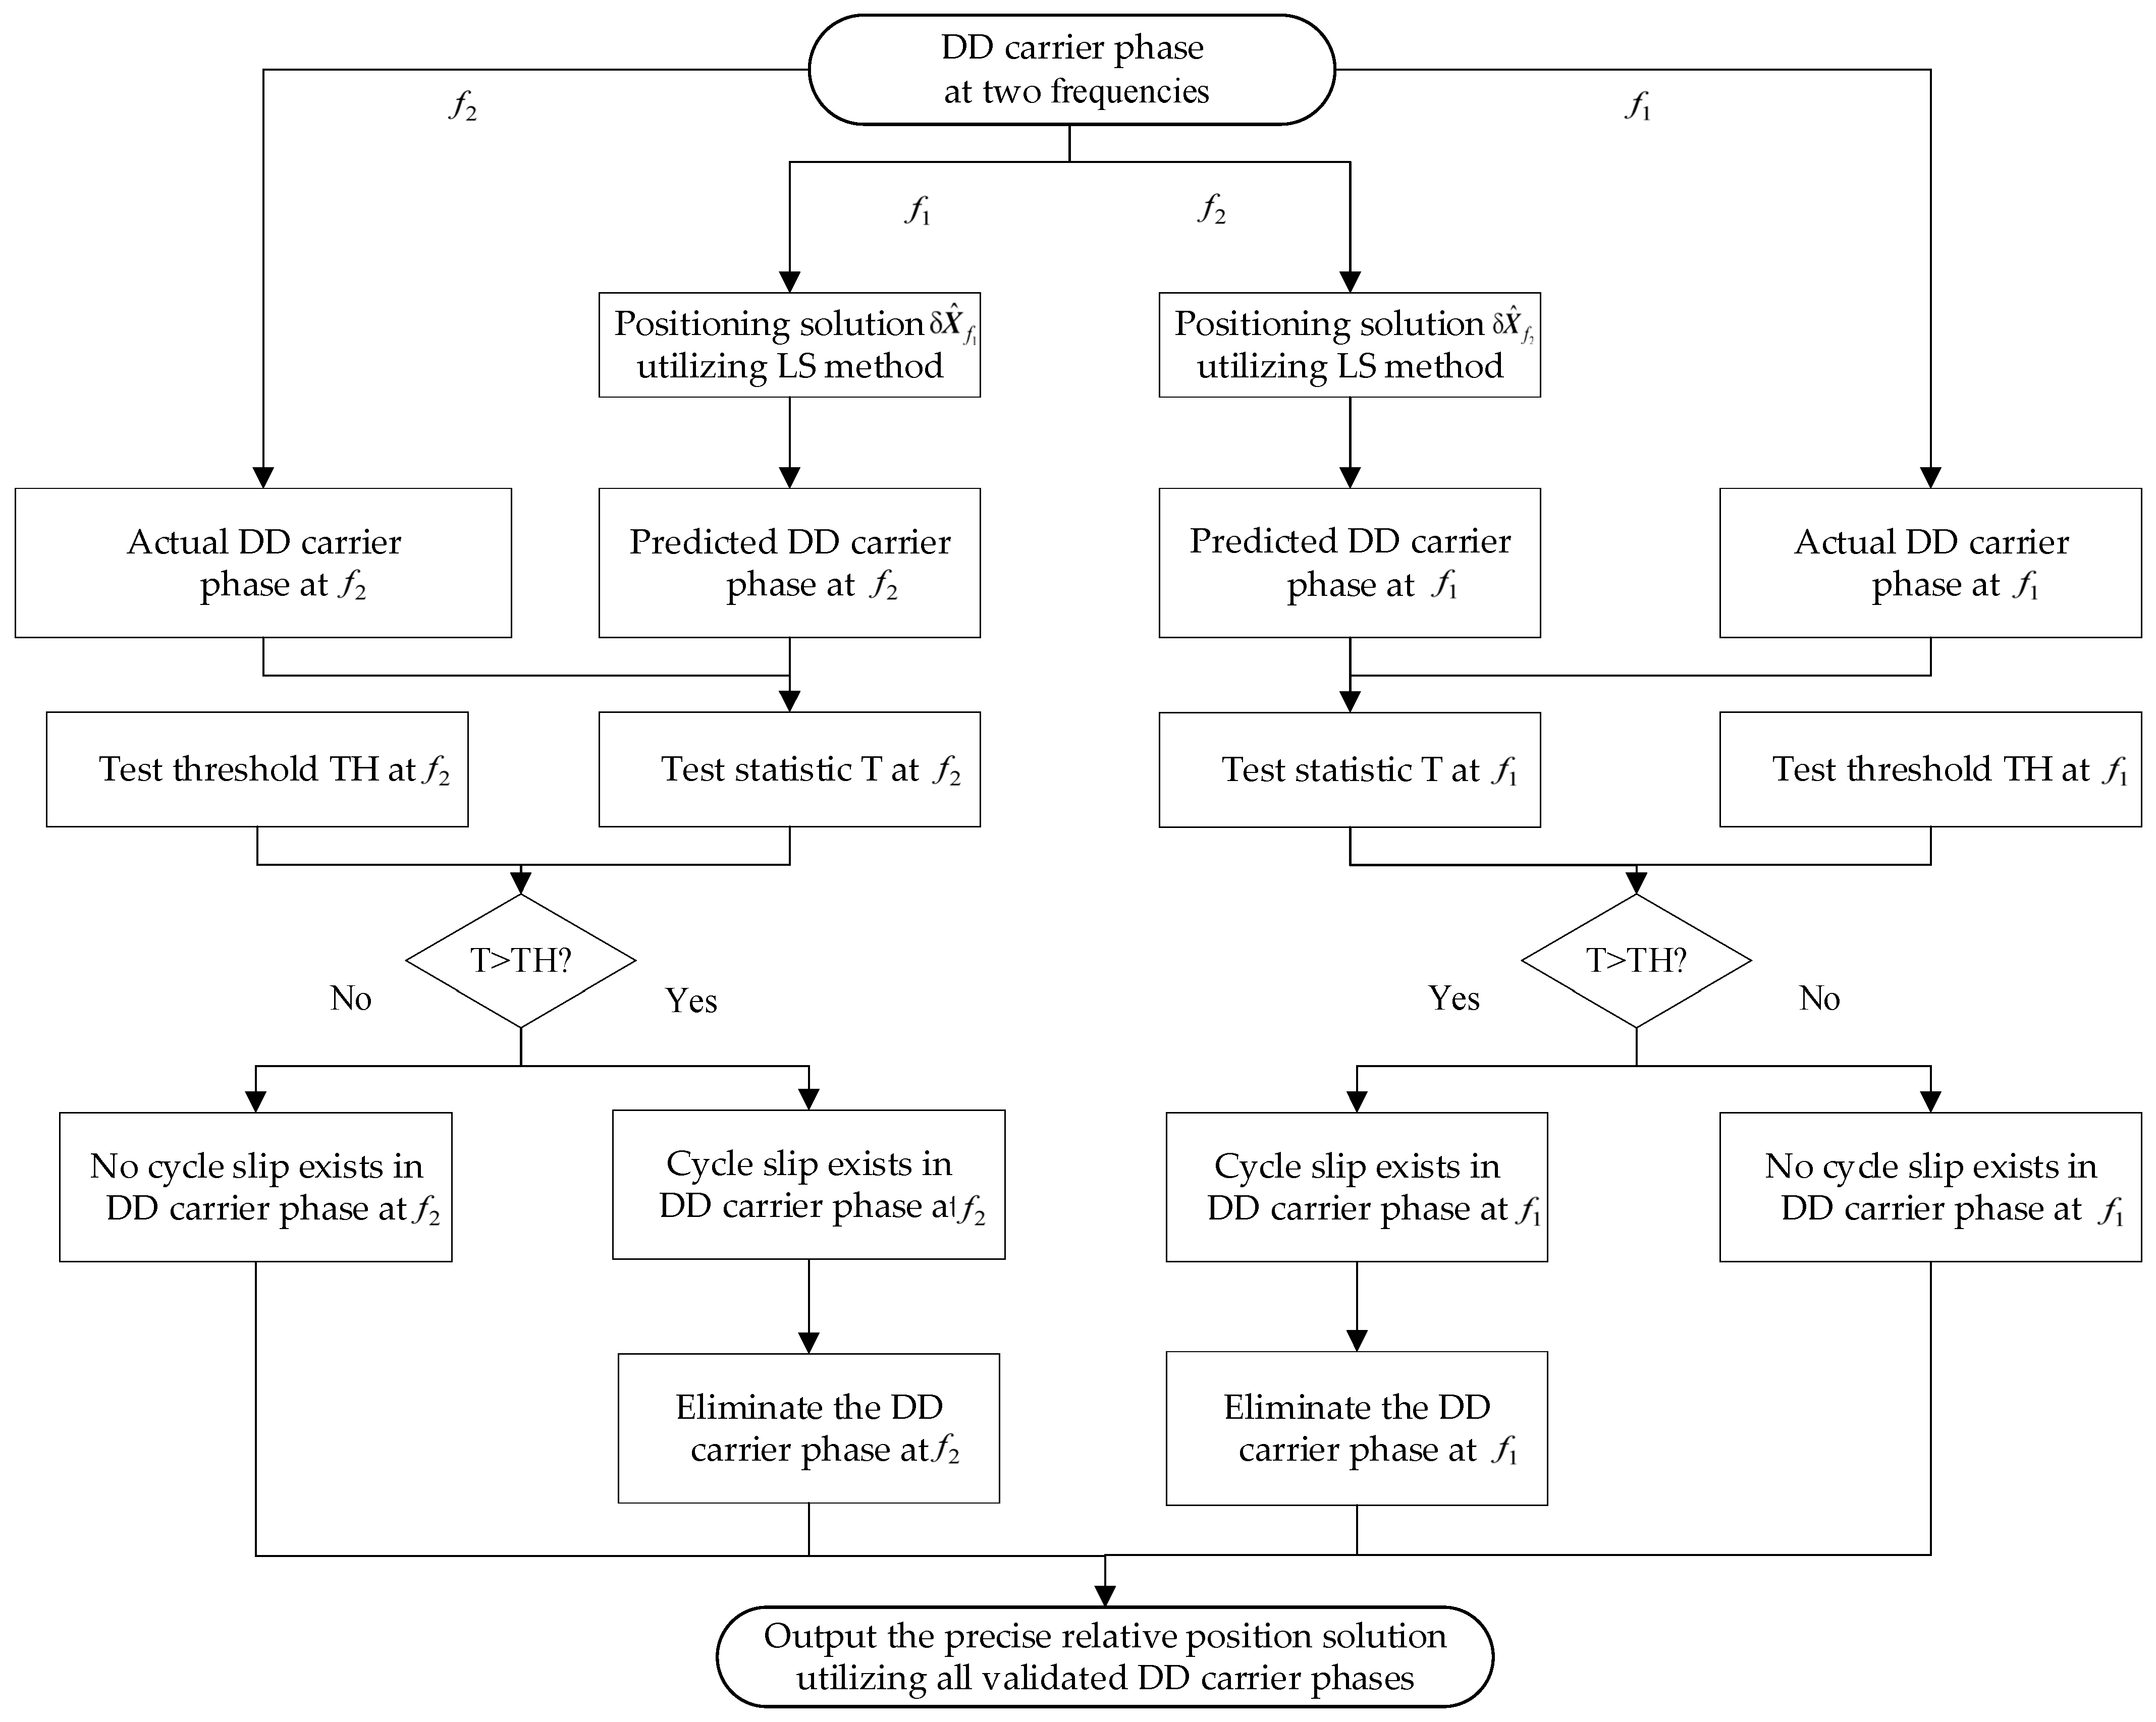
The technical roadmap of the IFCV method is shown in Figure 1.

3.3. Algorithmic Workflow

The algorithmic workflow of the proposed IFCV method for cycle slip detection comprises the following steps and is shown in Figure 2:
(1)
DD carrier phase observation preprocessing: Calculate the DD carrier phase observations Δ φ AB , f 1 , Δ t j for all visible satellites. Simultaneously, derive the position vectors of the base station ( r A ) and user station ( r B 0 ) across two consecutive epochs ( t 1 and t 0 ), along with the line-of-sight (LOS) unit vectors r B j 0 .
(2)
Linearized measurement equation and parameter estimation: Establish the linearized measurement equation for each DD carrier phase observation. The parameter estimates δ X f 1 and associated covariance matrix Σ δ X ^ f 1 are derived via weighted LS estimate. Observations corresponding to standardized residuals exceeding the normal distribution test threshold are removed, and the LS estimation is reiterated with all validated observations.
(3)
DD carrier phase observation prediction: Calculate the predicted DD carrier phase observation σ Δ φ ˜ A B , f 2 , Δ t j 2 for frequency f 2 with the estimated vector δ X ^ f 1 at frequency f 1 .
(4)
Test statistic and threshold calculation: Calculate the test statistic T j and threshold calculation T H with the predicted DD observation Δ φ ˜ f 2 j and actual DD observation Δ φ f 2 j .
(5)
Cycle slip detection and elimination: A cycle slip is detected when T j > T H j , and the corresponding DD observation needs to be eliminated.
(6)
Final positioning solution: Validated observations are utilized to construct the inter-station and inter-satellite DD carrier phase equations. Precise relative positioning is computed based on this model, and the results are outputted.

4. Results

4.1. Field Test Setup

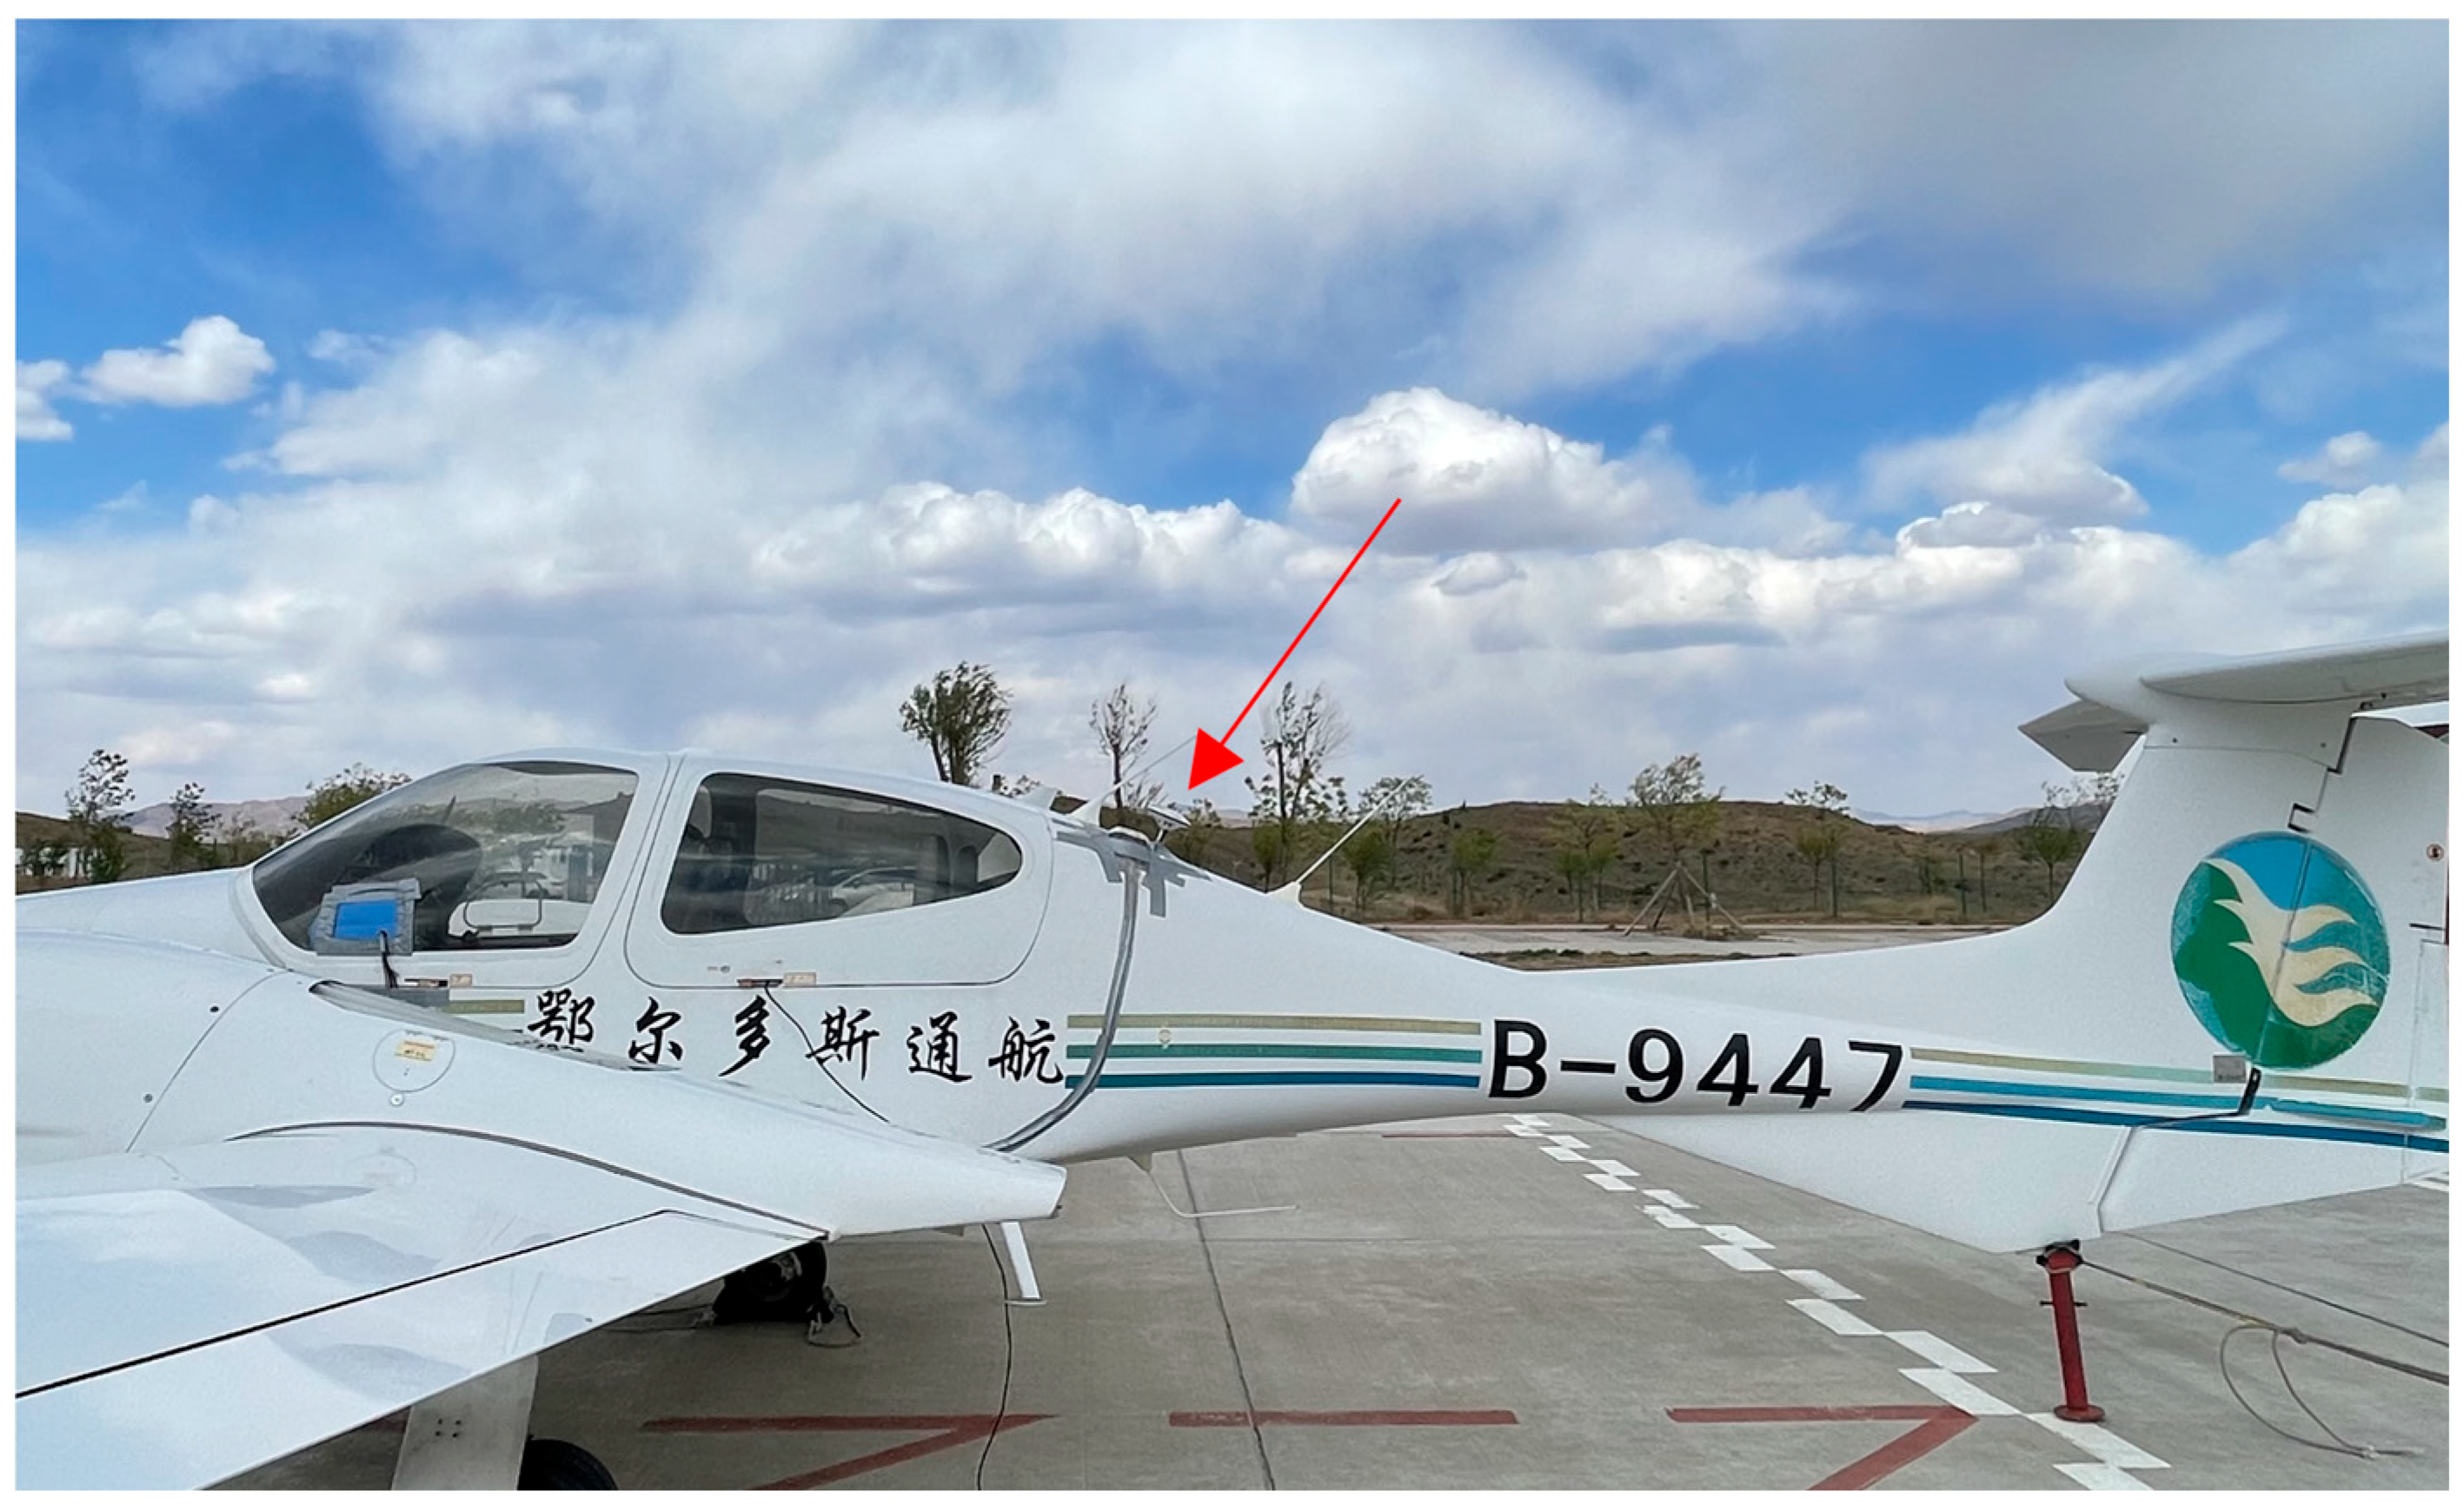
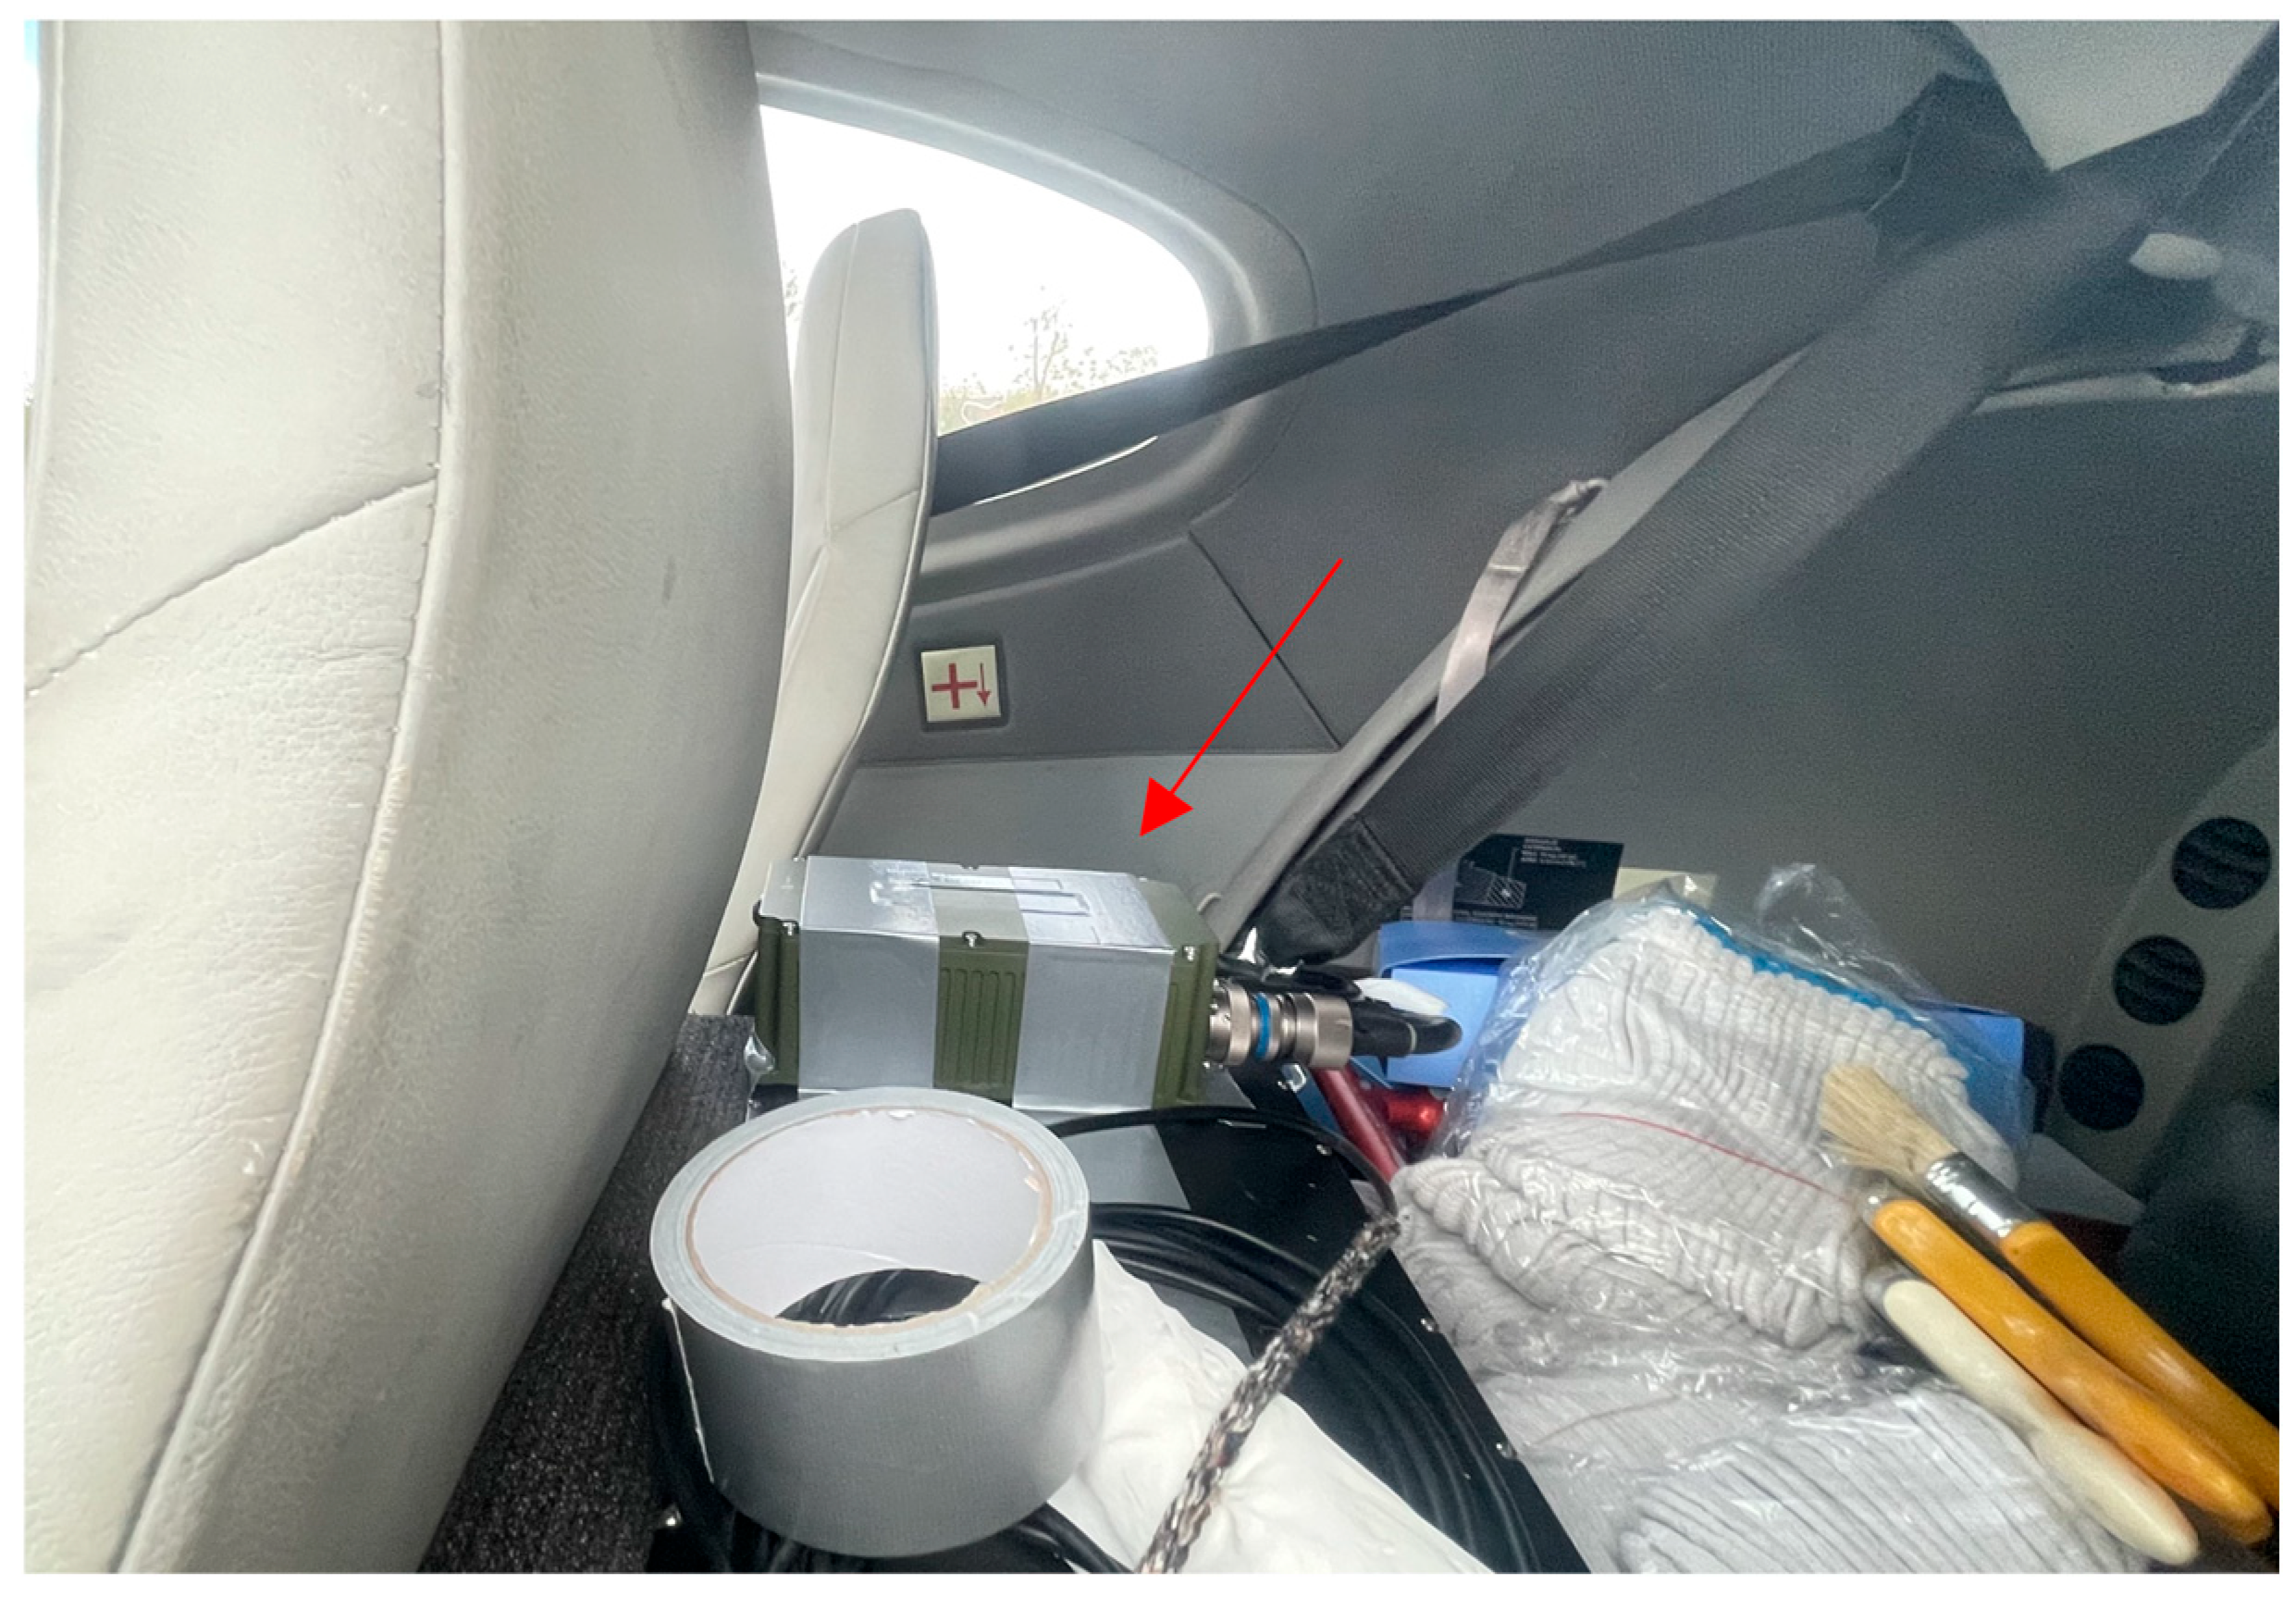
In practical applications, the Turbo-Edit method, which utilizes a combination of the MW and GF methods, demonstrates high effectiveness for cycle slip detection. To validate the advantages of the IFCV method over Turbo-Edit and assess its capability for dynamic data, an airborne flight test was conducted using a small fixed-wing aircraft. Precise relative positioning and cycle slip detection were implemented within the data processing module of the user station, as shown in Figure 3. A static reference station was established on the ground adjacent to the airport runway, positioned approximately 100 m from the takeoff point, with its configuration illustrated in Figure 4. The station operates within a local geodetic coordinate system (coordinate axes oriented toward the North, East, and Upward directions). The user station was installed in the rear of the aircraft cabin, with its antenna installed externally on the fuselage, as shown in Figure 5 and Figure 6.
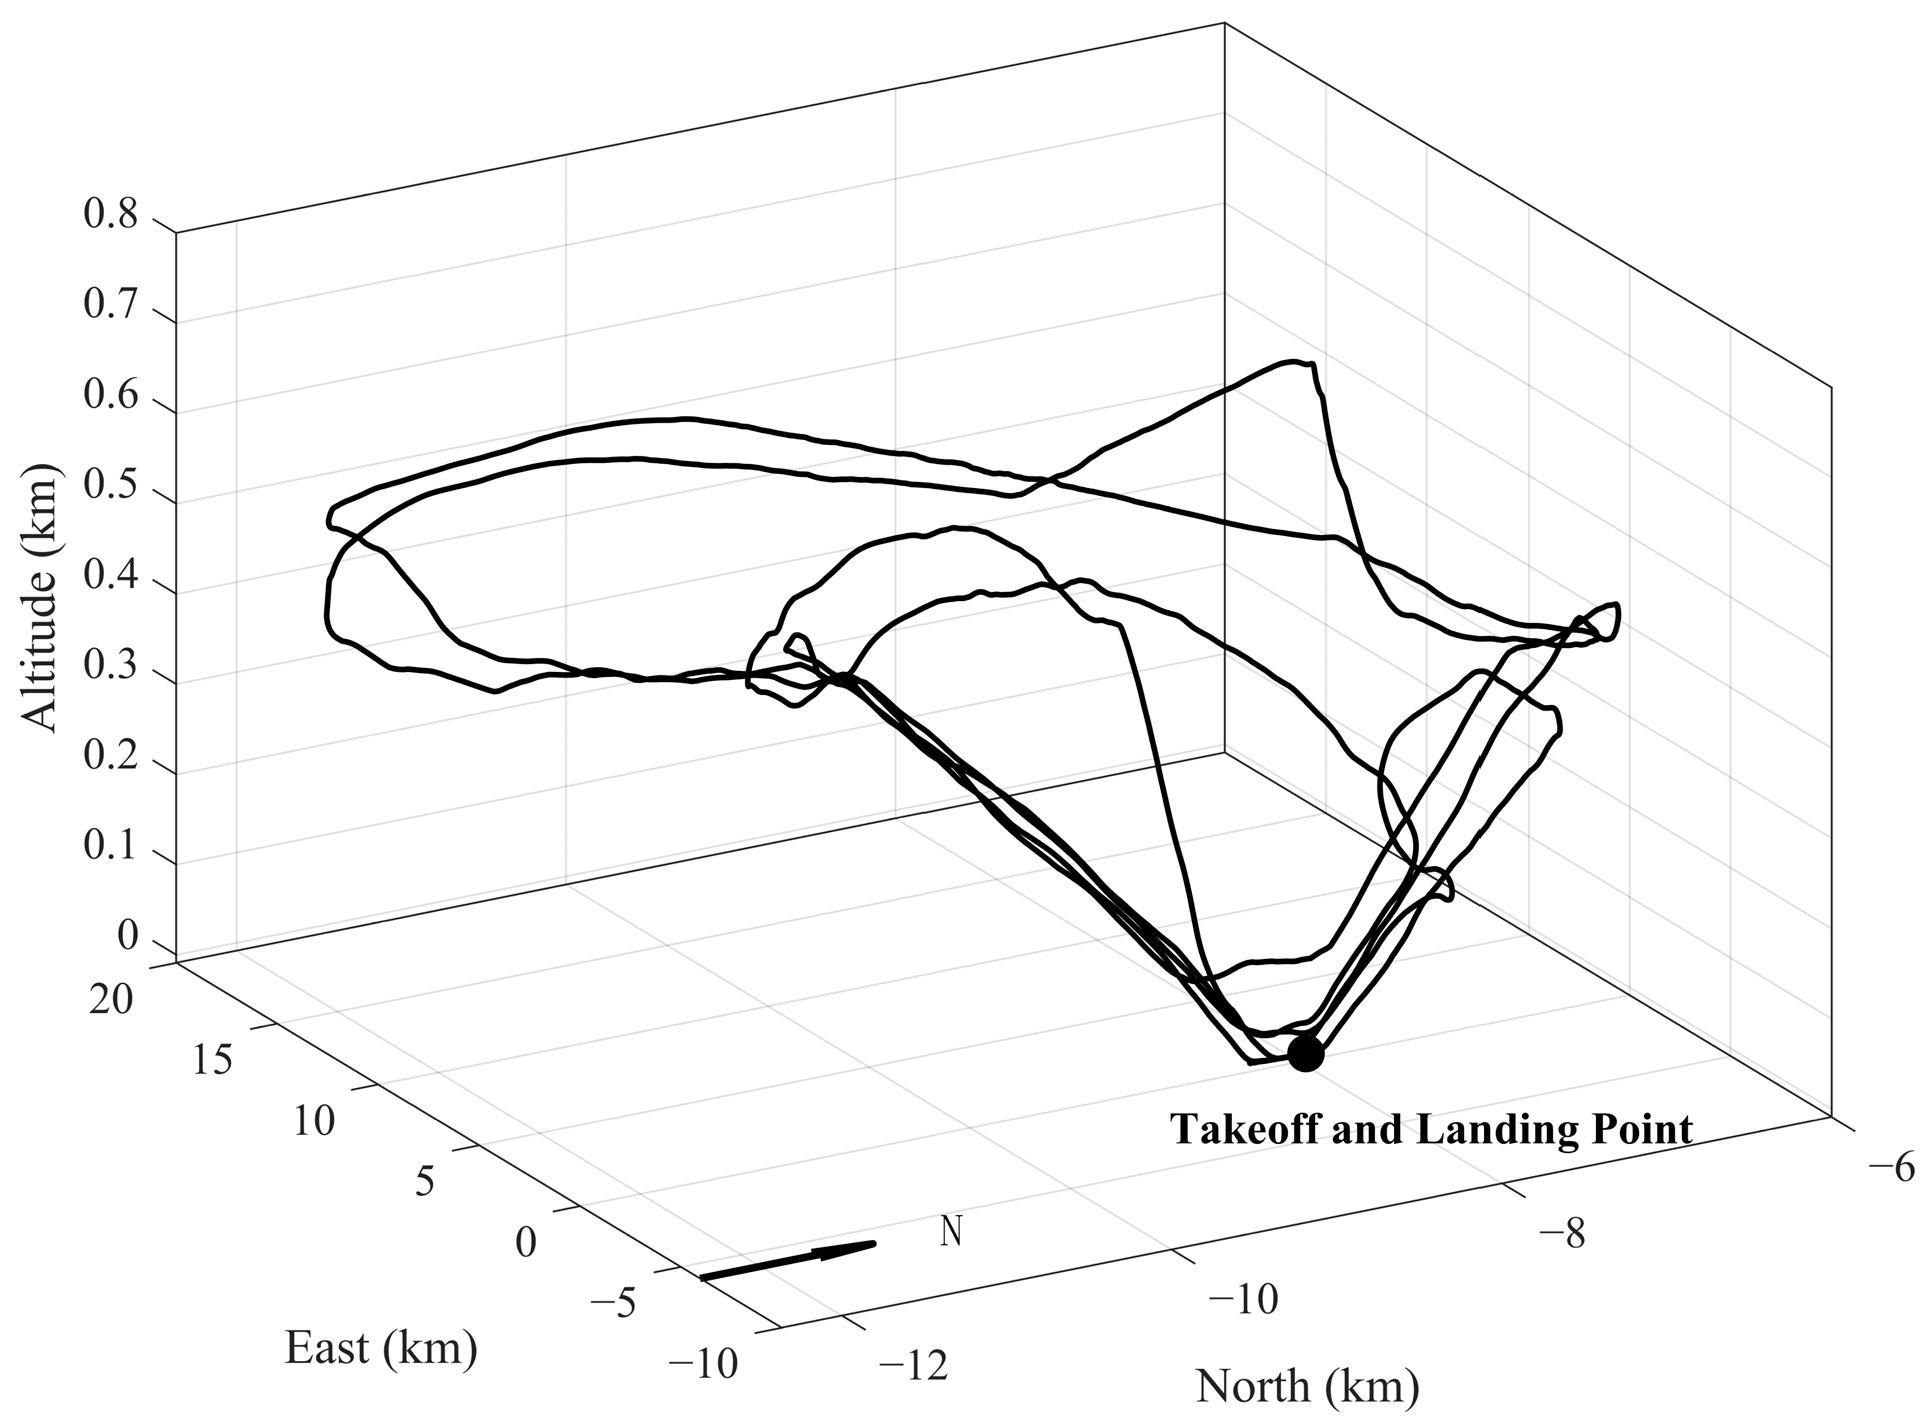
The aircraft’s flight trajectory, illustrated in Figure 7, consists of four complete loops. The maximum baseline distance between the base station and the user station is approximately 16 km.
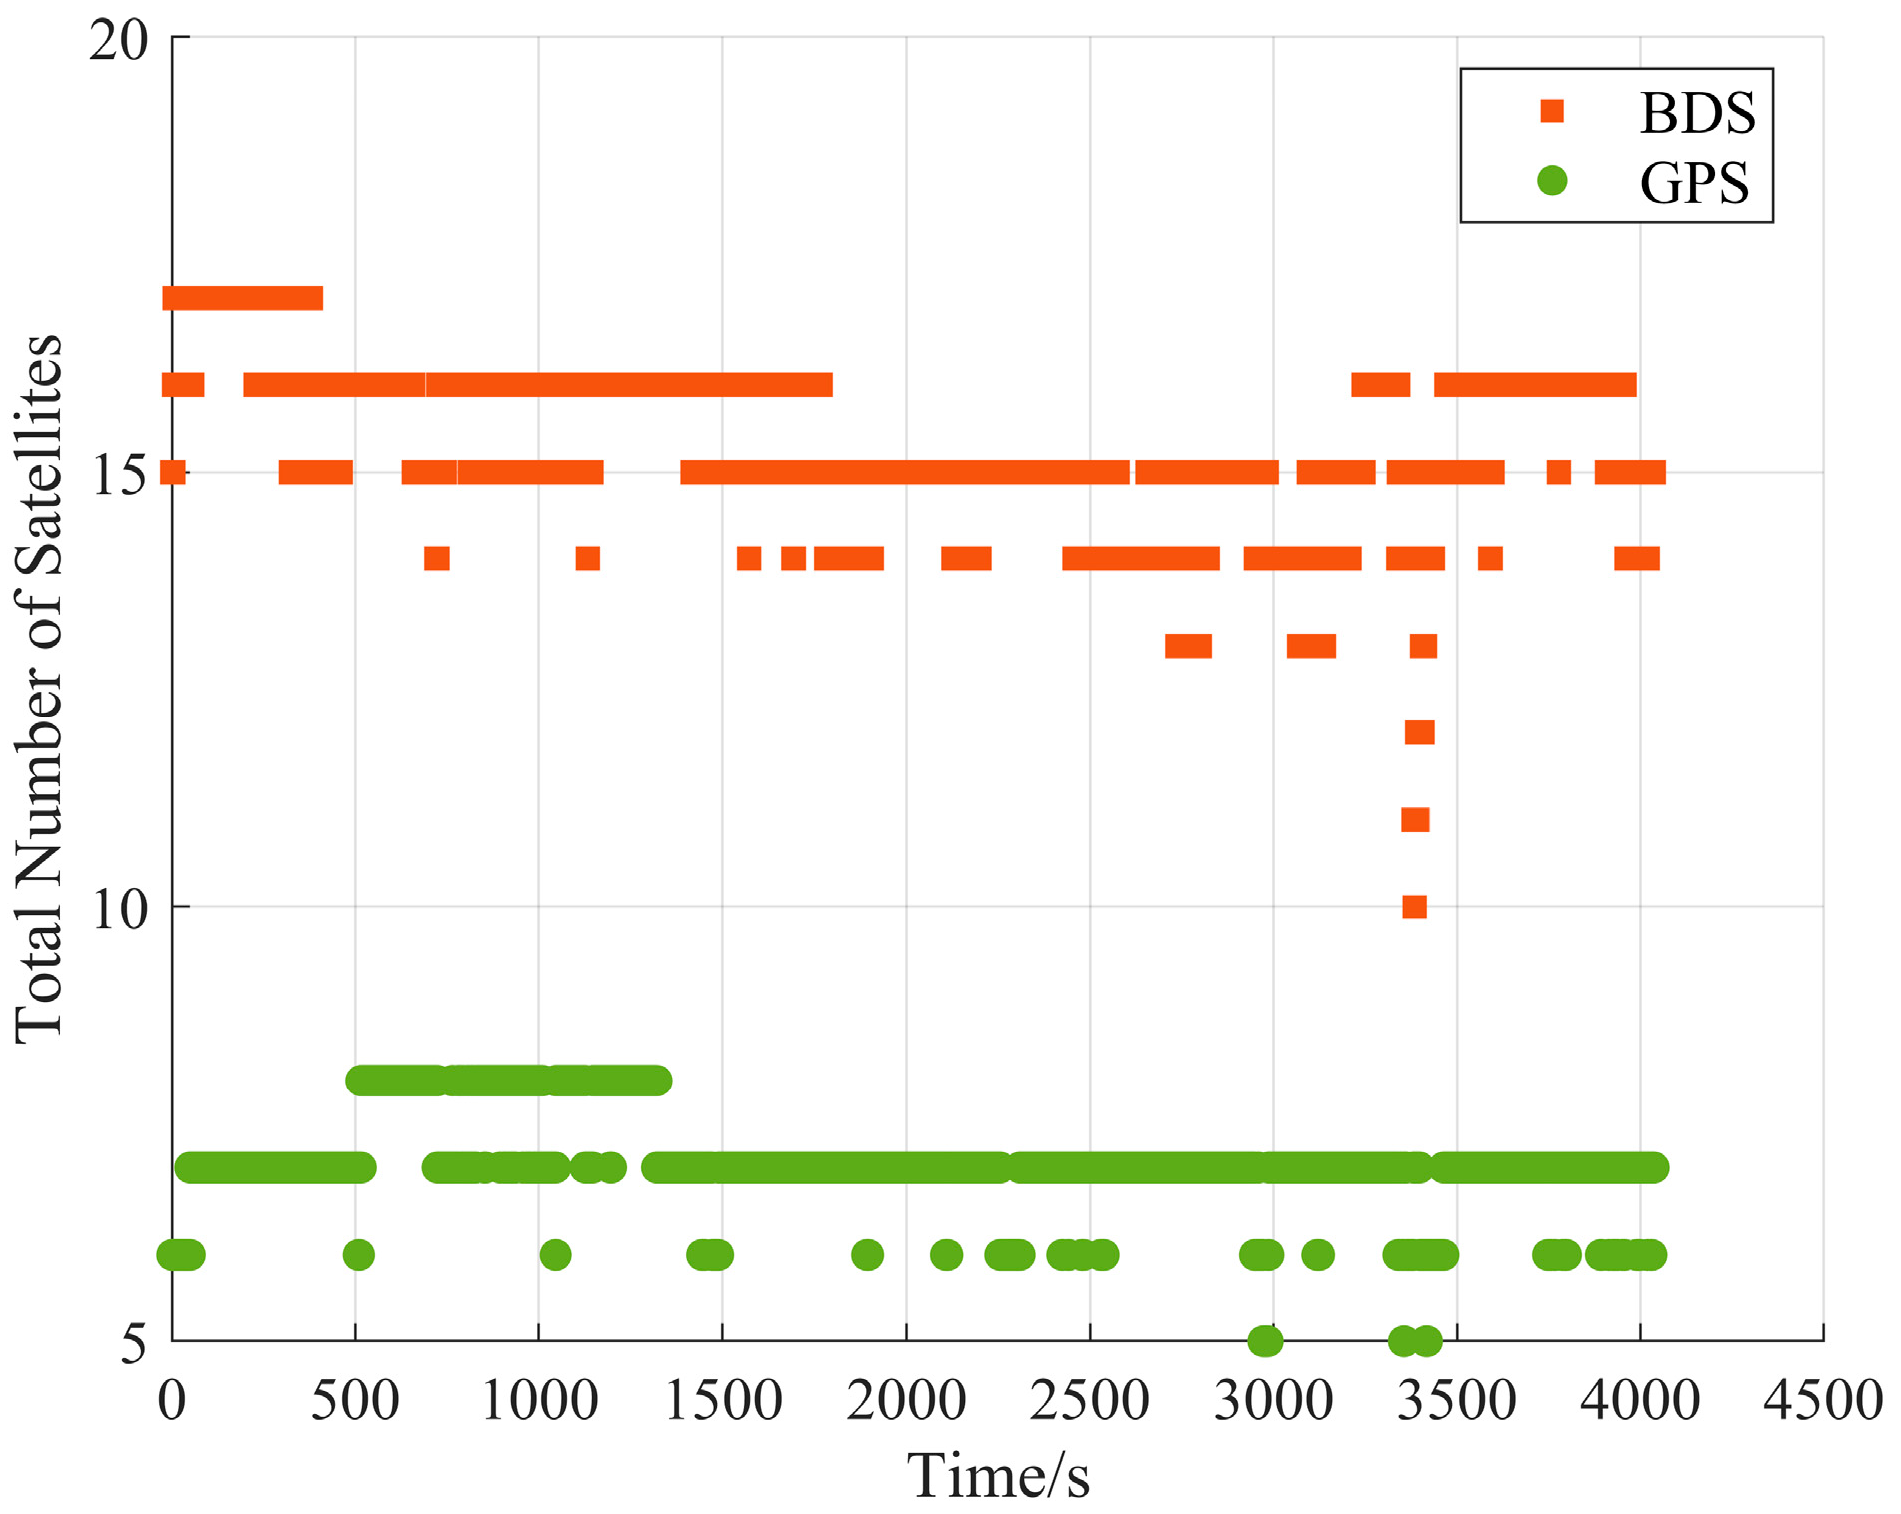
The variation in the number of visible common-view satellites between the user station and reference station during the flight is illustrated in Figure 8.

4.2. Test Statistic Performance Validation

Owing to the favorable observational conditions during this experiment, post-processing data analysis reveals virtually no natural cycle slips. To evaluate the performance of the IFCV method’s test statistic, three experimental schemes are designed:
Scheme A: Carrier phase observations without artificial injection of cycle slips, which is designated as the control group.
Scheme B: Specific cycle slips (five cycles and four cycles) are injected into the carrier phase observations on both the B1I and B3I frequencies for the MEO (Medium Earth Orbit) satellite C11 (orbital altitude: 21,528 km; inclination: 55°) at all epochs.
Scheme C: Random cycle slips are injected into the carrier phase observations at both frequencies mentioned above.
The three schemes are processed using both the IFCV and Turbo-Edit methods. The test statistics, test thresholds, detection success rates, and MDR are compared.

4.2.1. Performance Validation Without Cycle Slip Injection

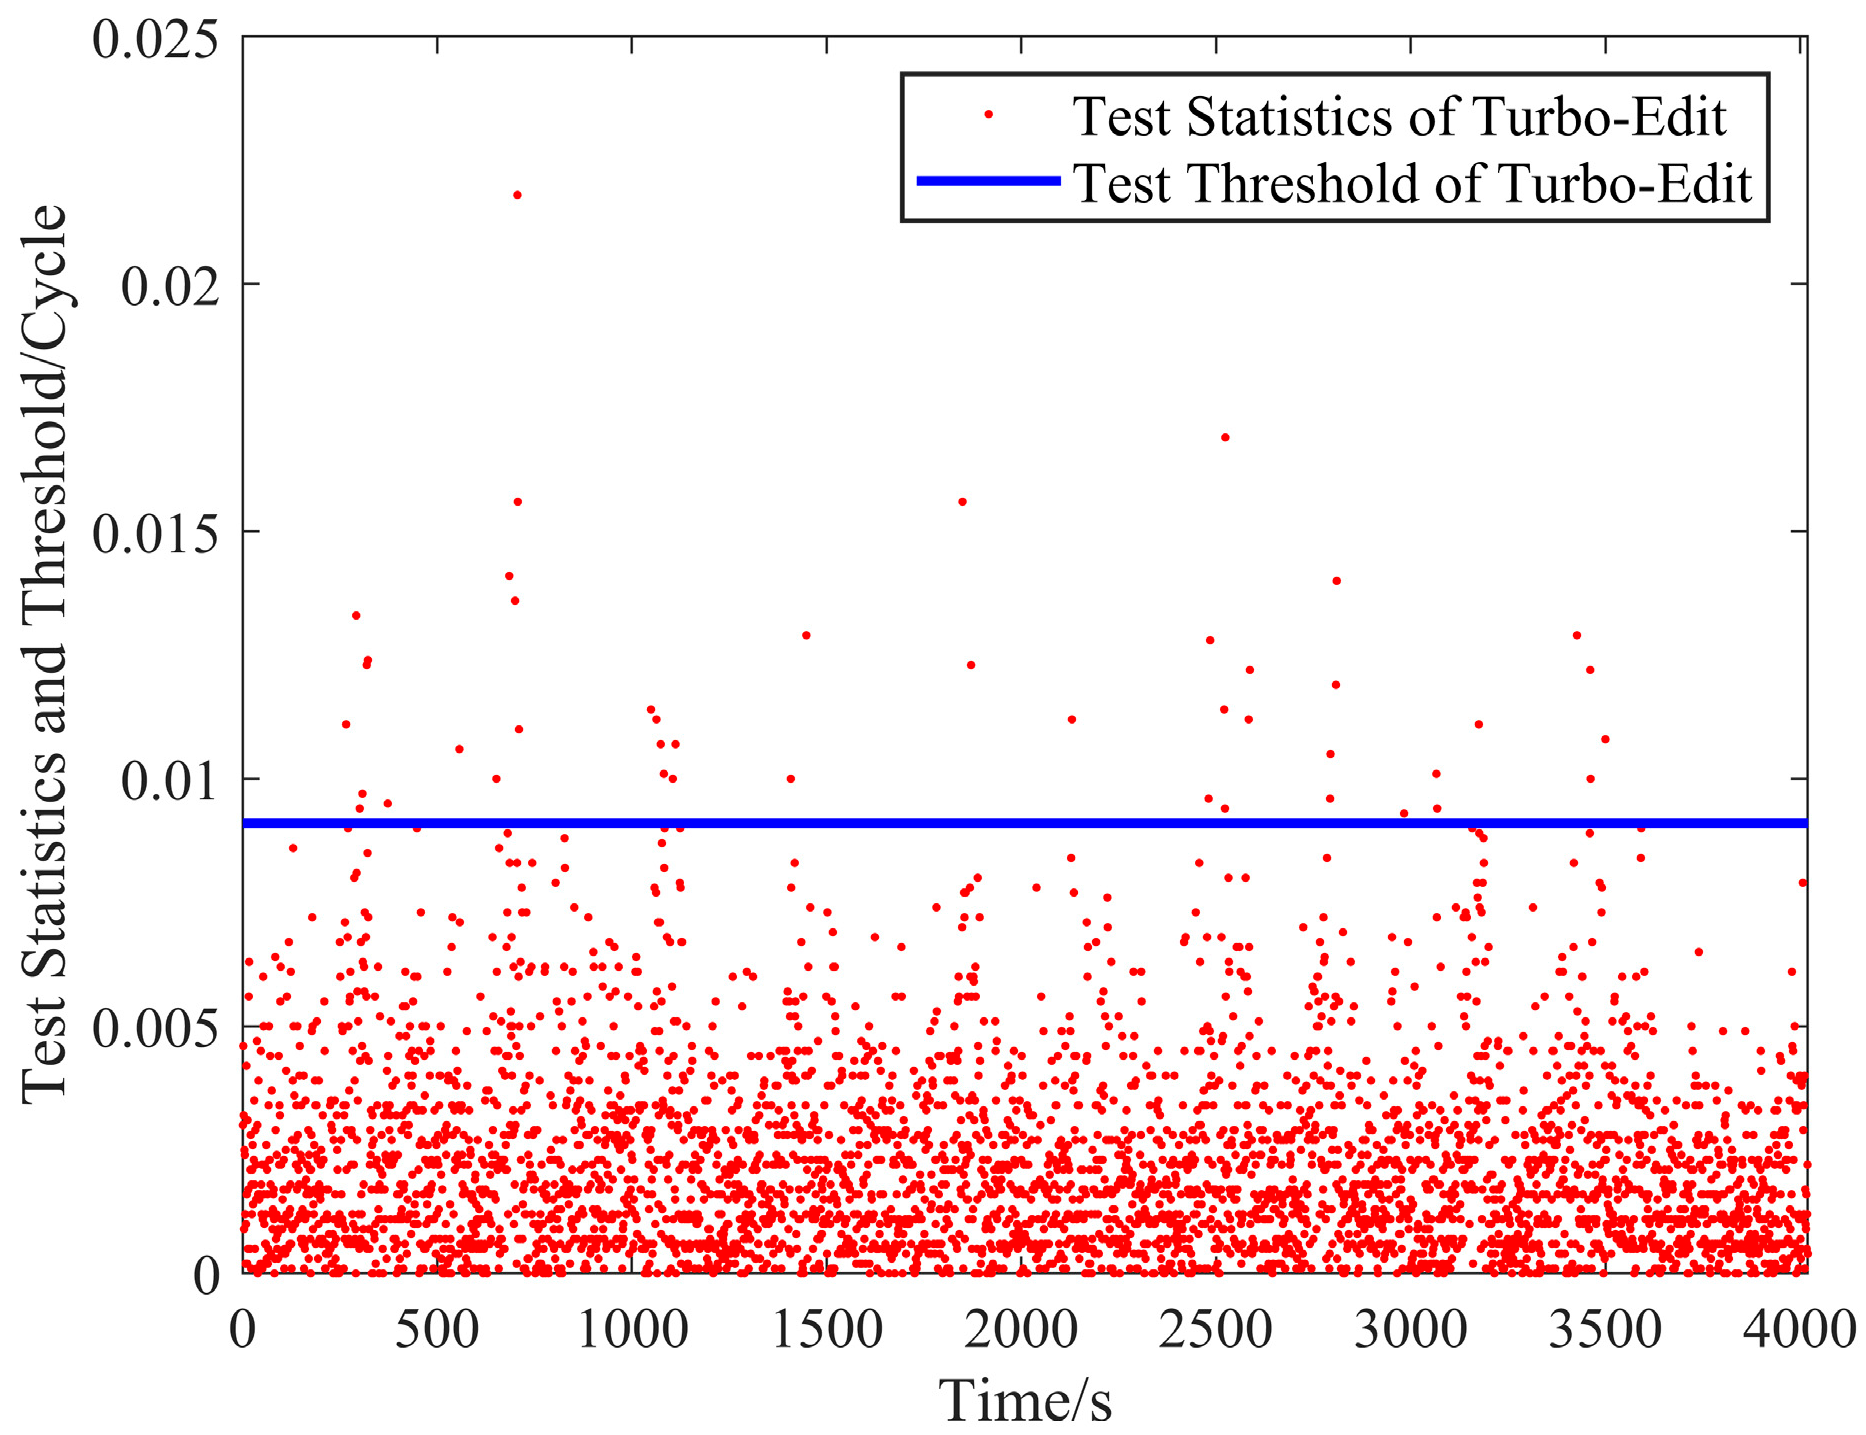
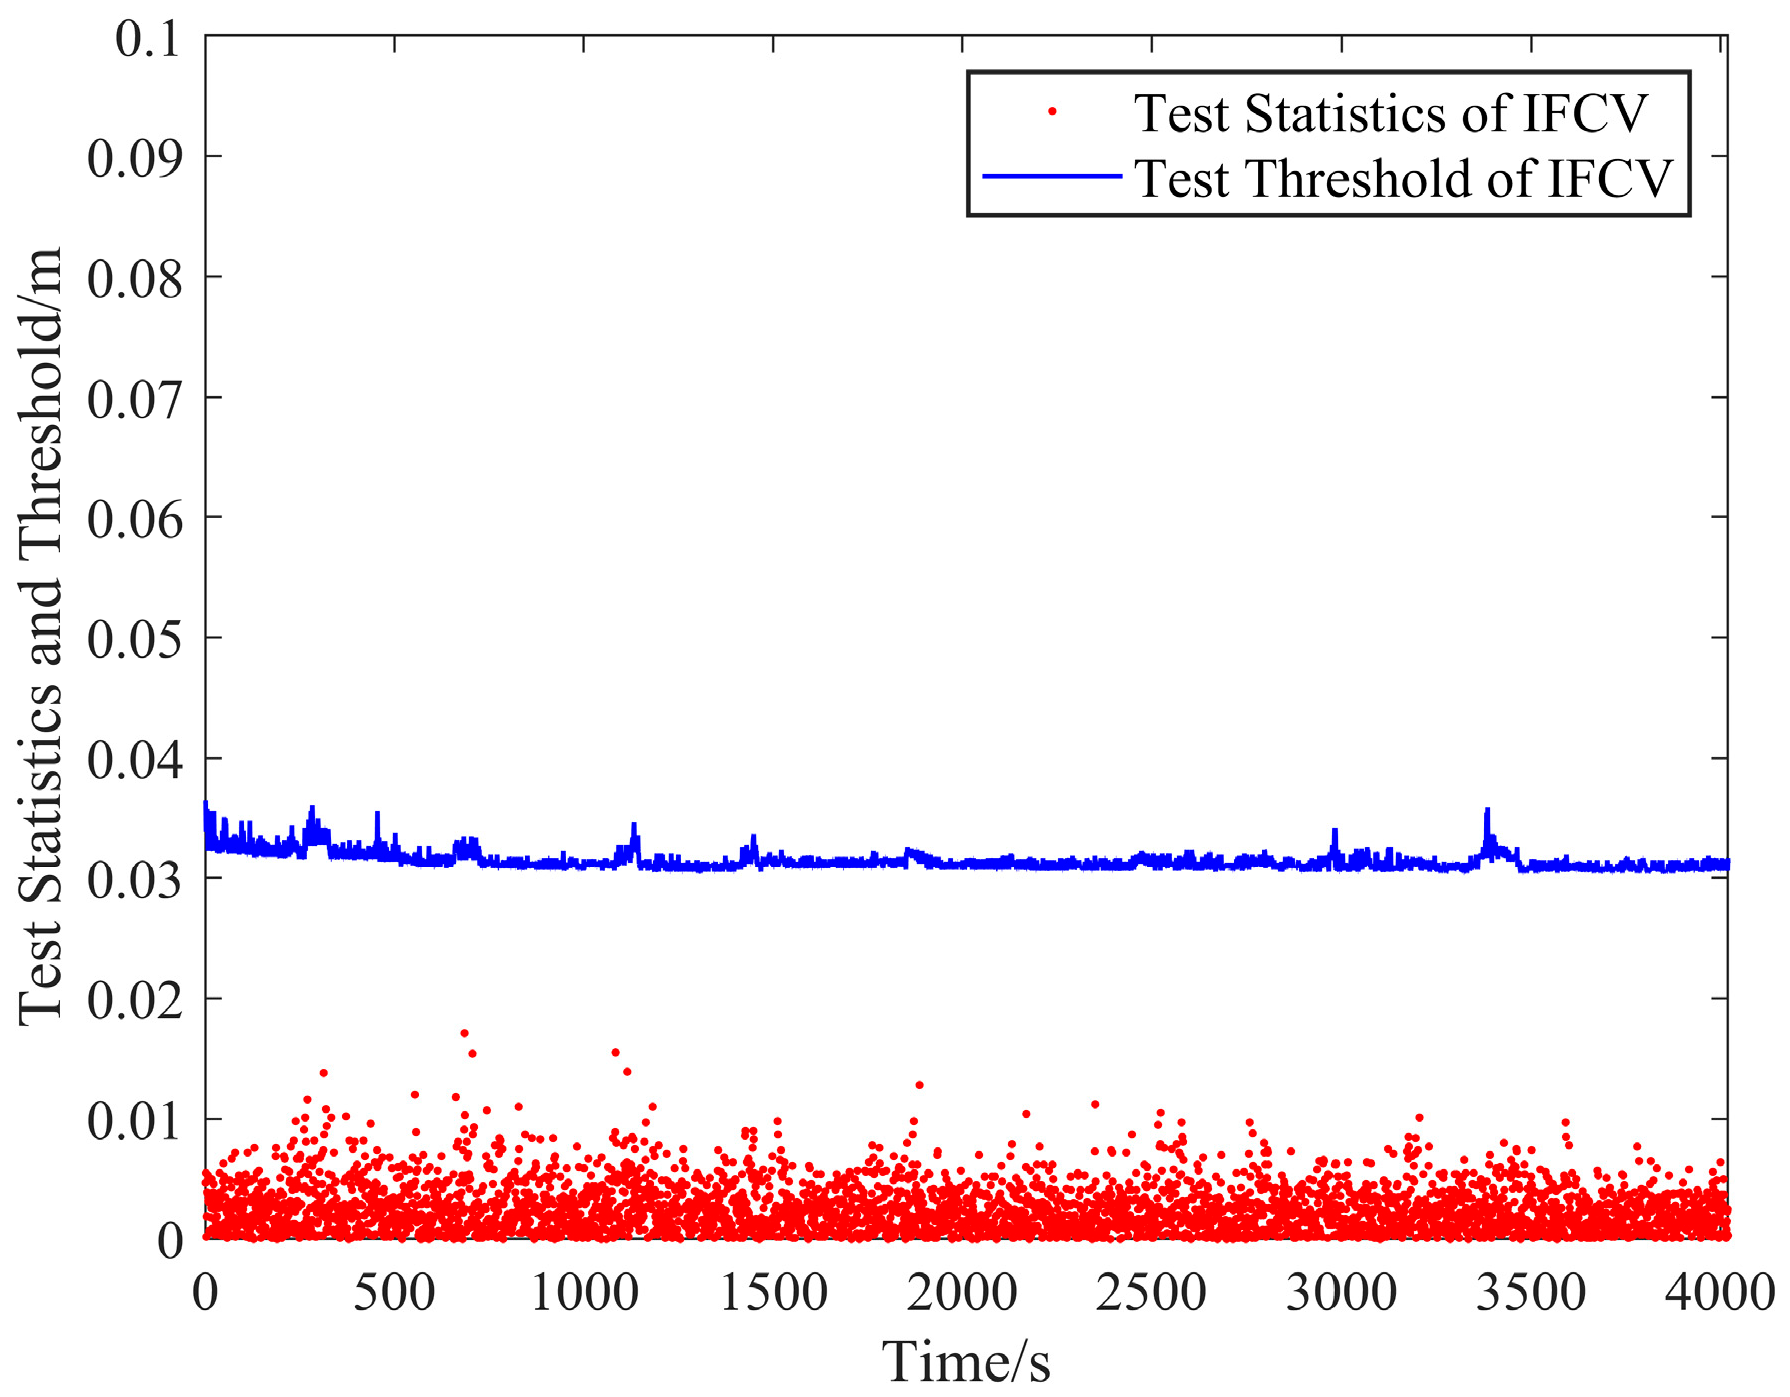
The test statistics, thresholds and false alarm rate (FAR) are shown in Figure 9 and Figure 10 and Table 1.
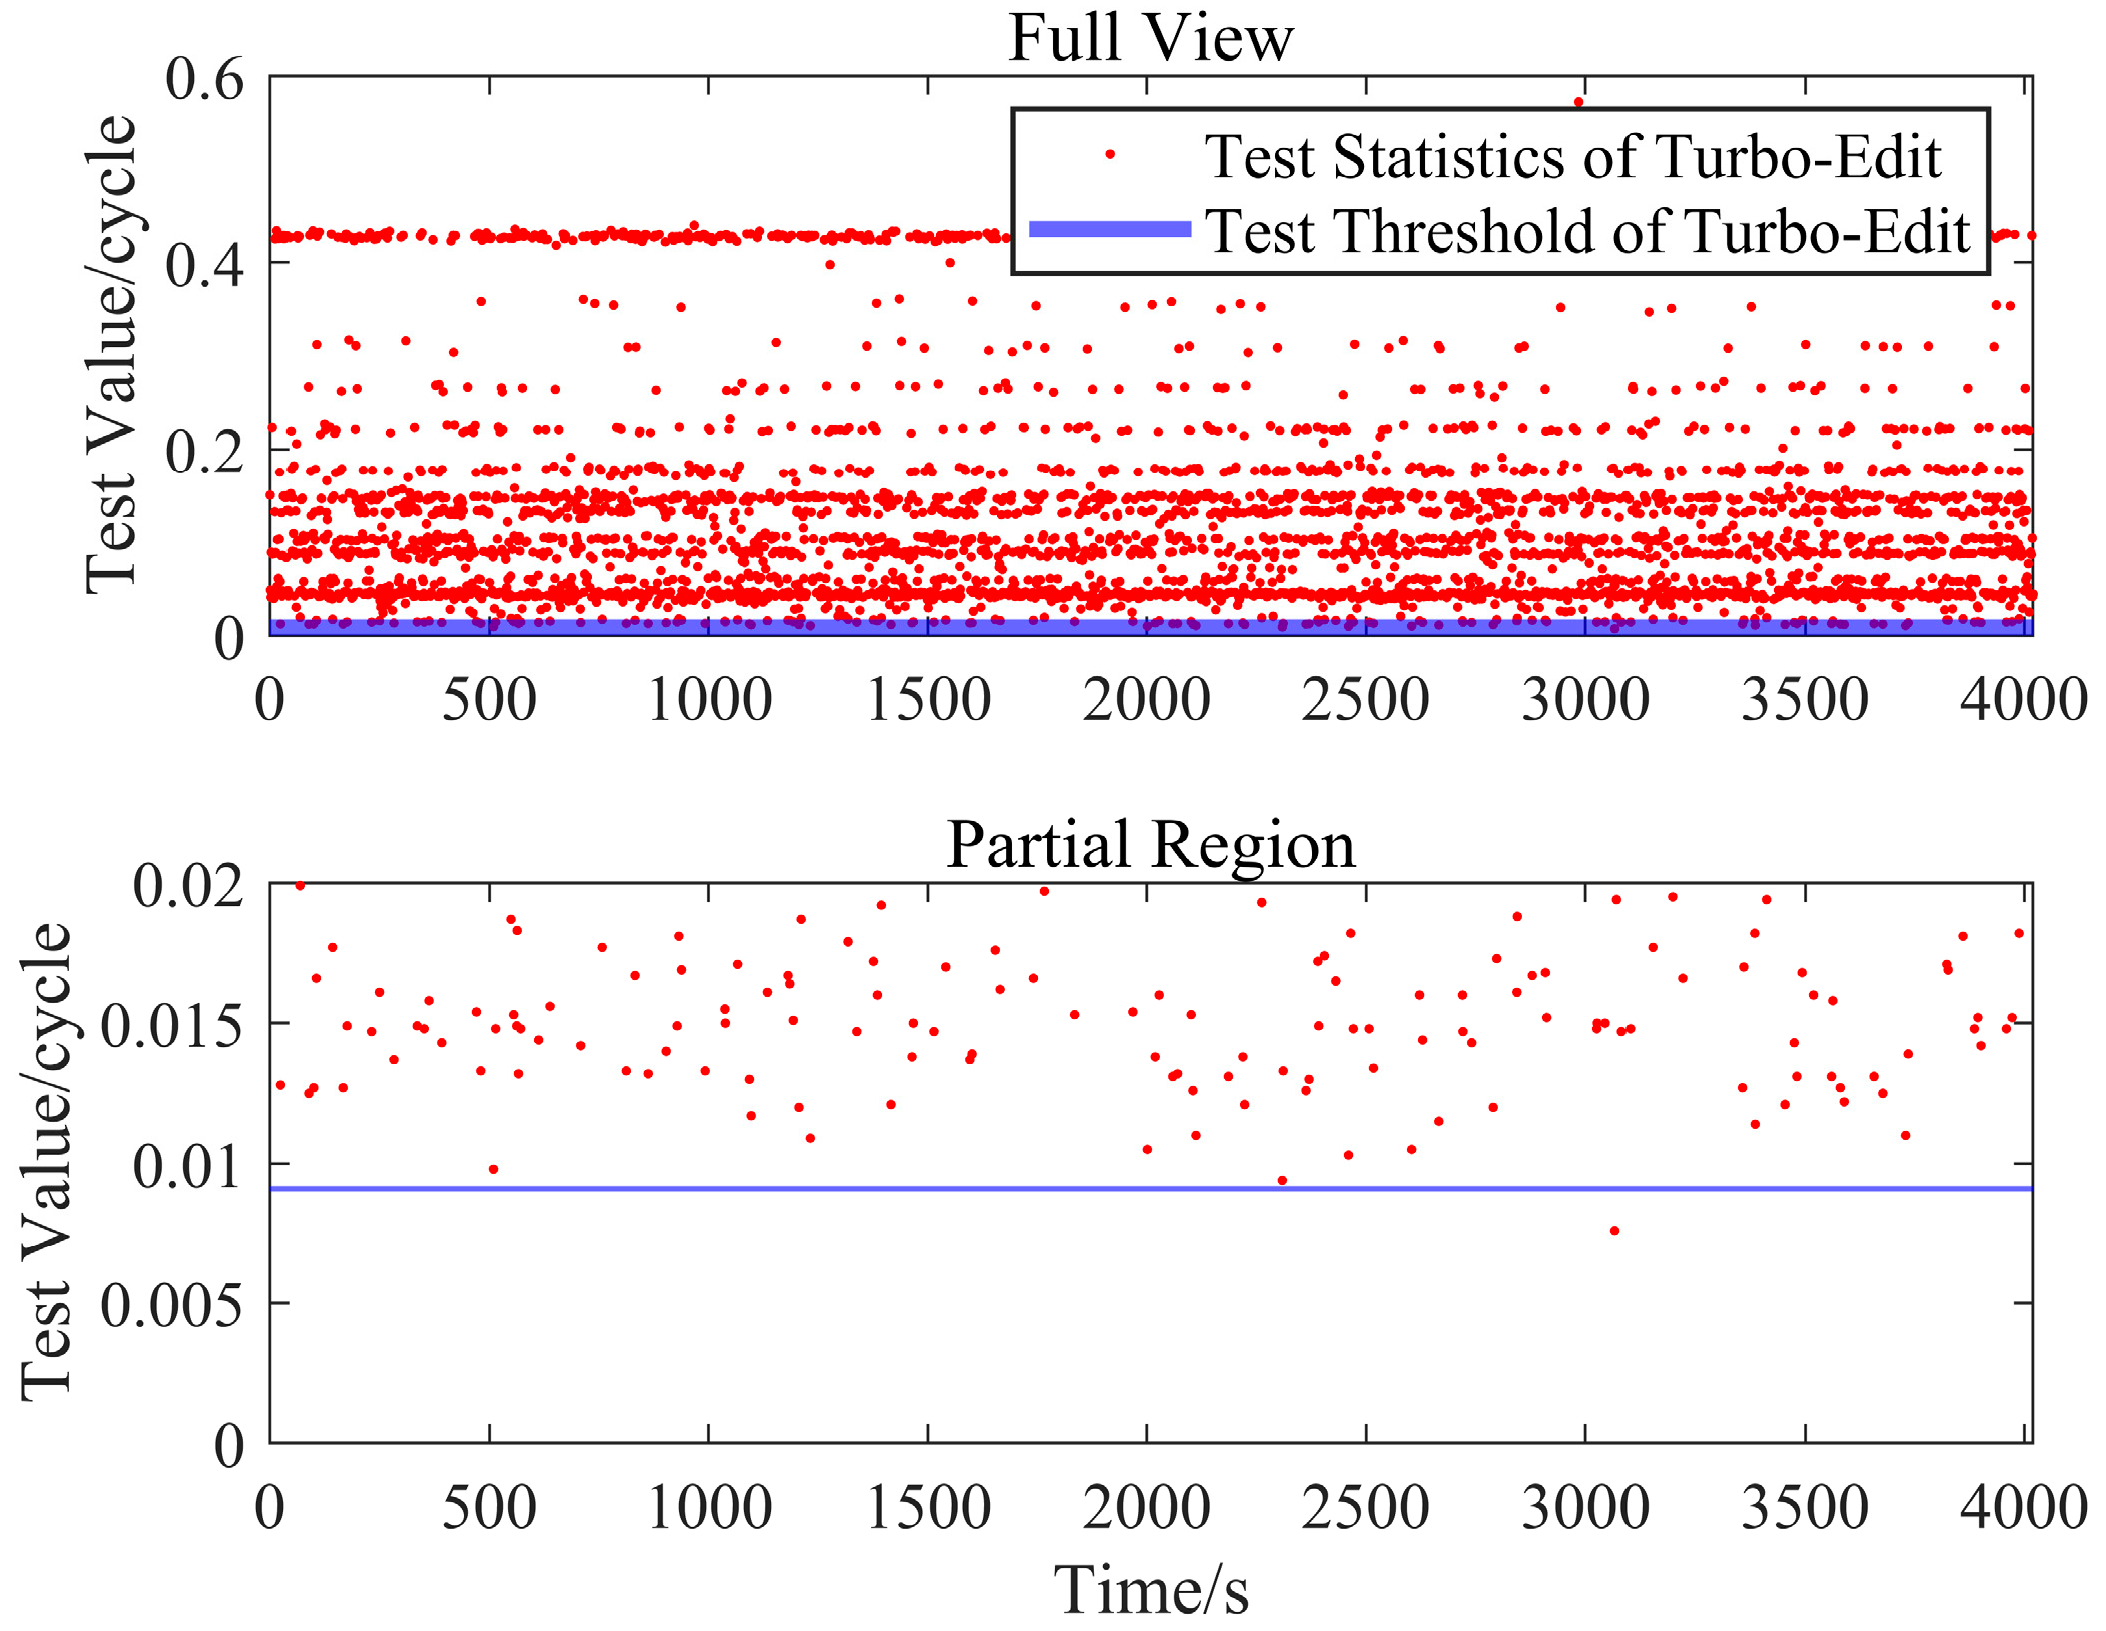
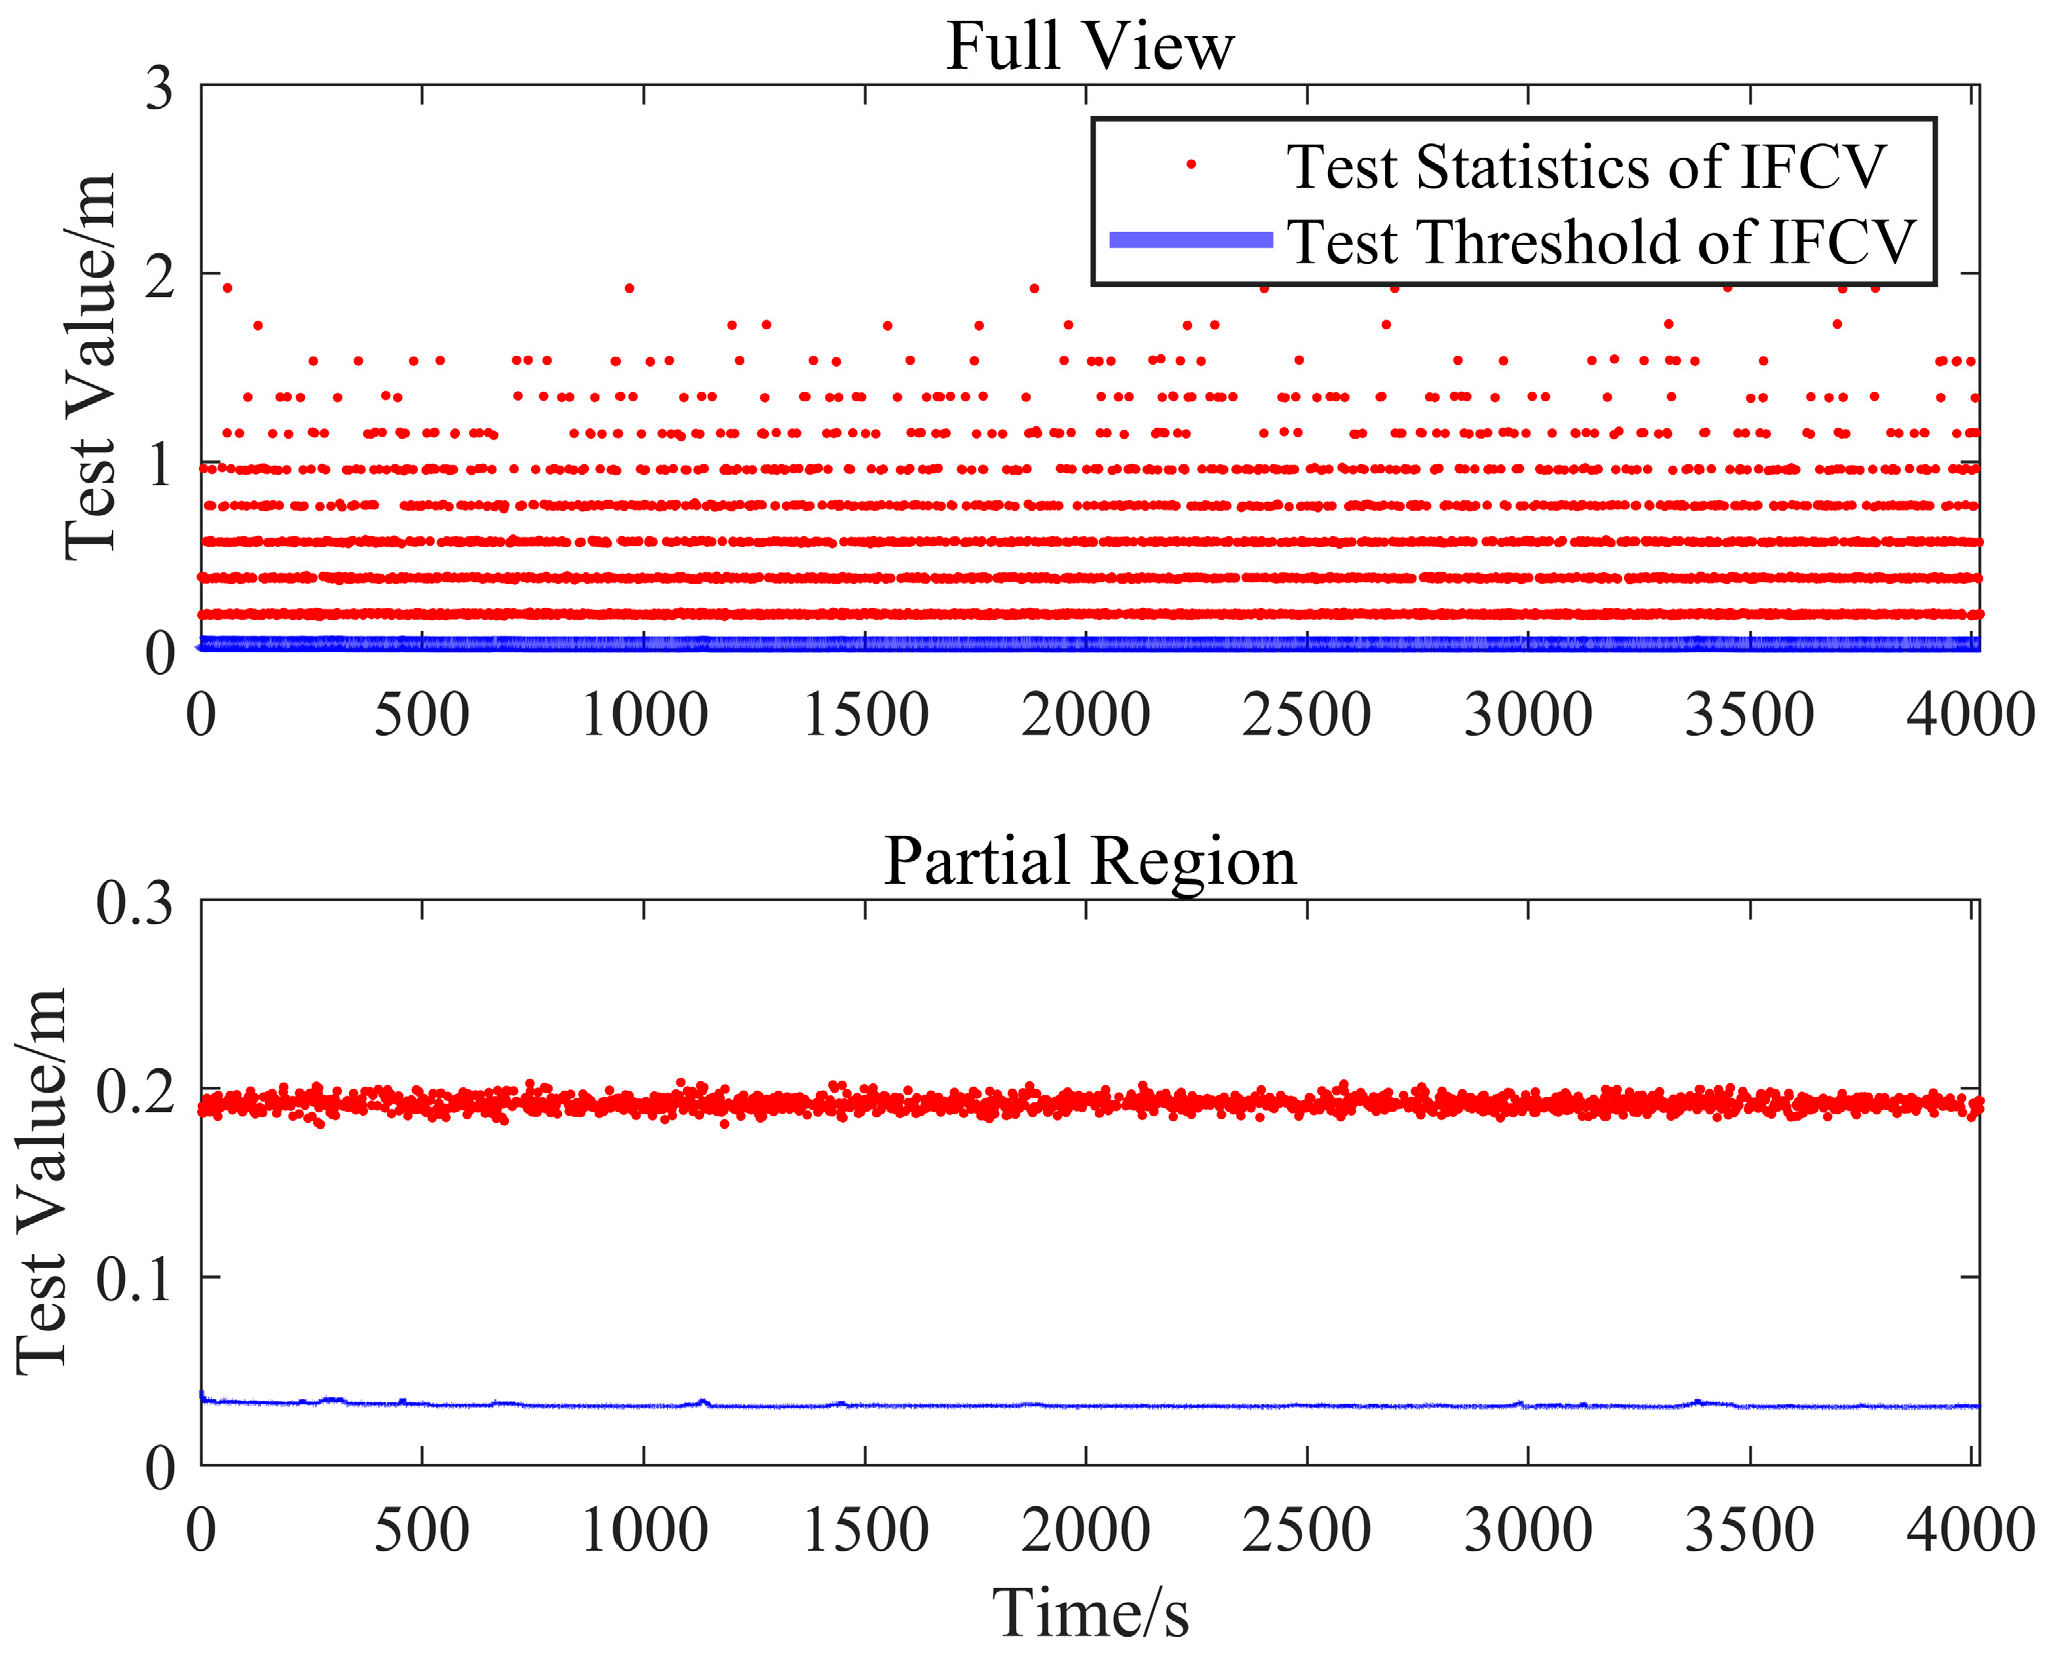
As illustrated in Figure 9, the test statistics of the Turbo-Edit method occasionally exceed the threshold even in the absence of injected cycle slips, resulting in false alarm events. Conversely, Figure 10 demonstrates that all test statistics of the IFCV method remain below the dynamically adjusted test thresholds, which adapts to variations in visible satellite count and geometry configuration, thereby eliminating false alarms across diverse observation environments. The quantitative comparison in Table 1 reveals that the false alarm rate of the IFCV method is 0%, outperforming the 1.1% rate of the Turbo-Edit method.

4.2.2. Performance Validation with Specific Cycle Slips

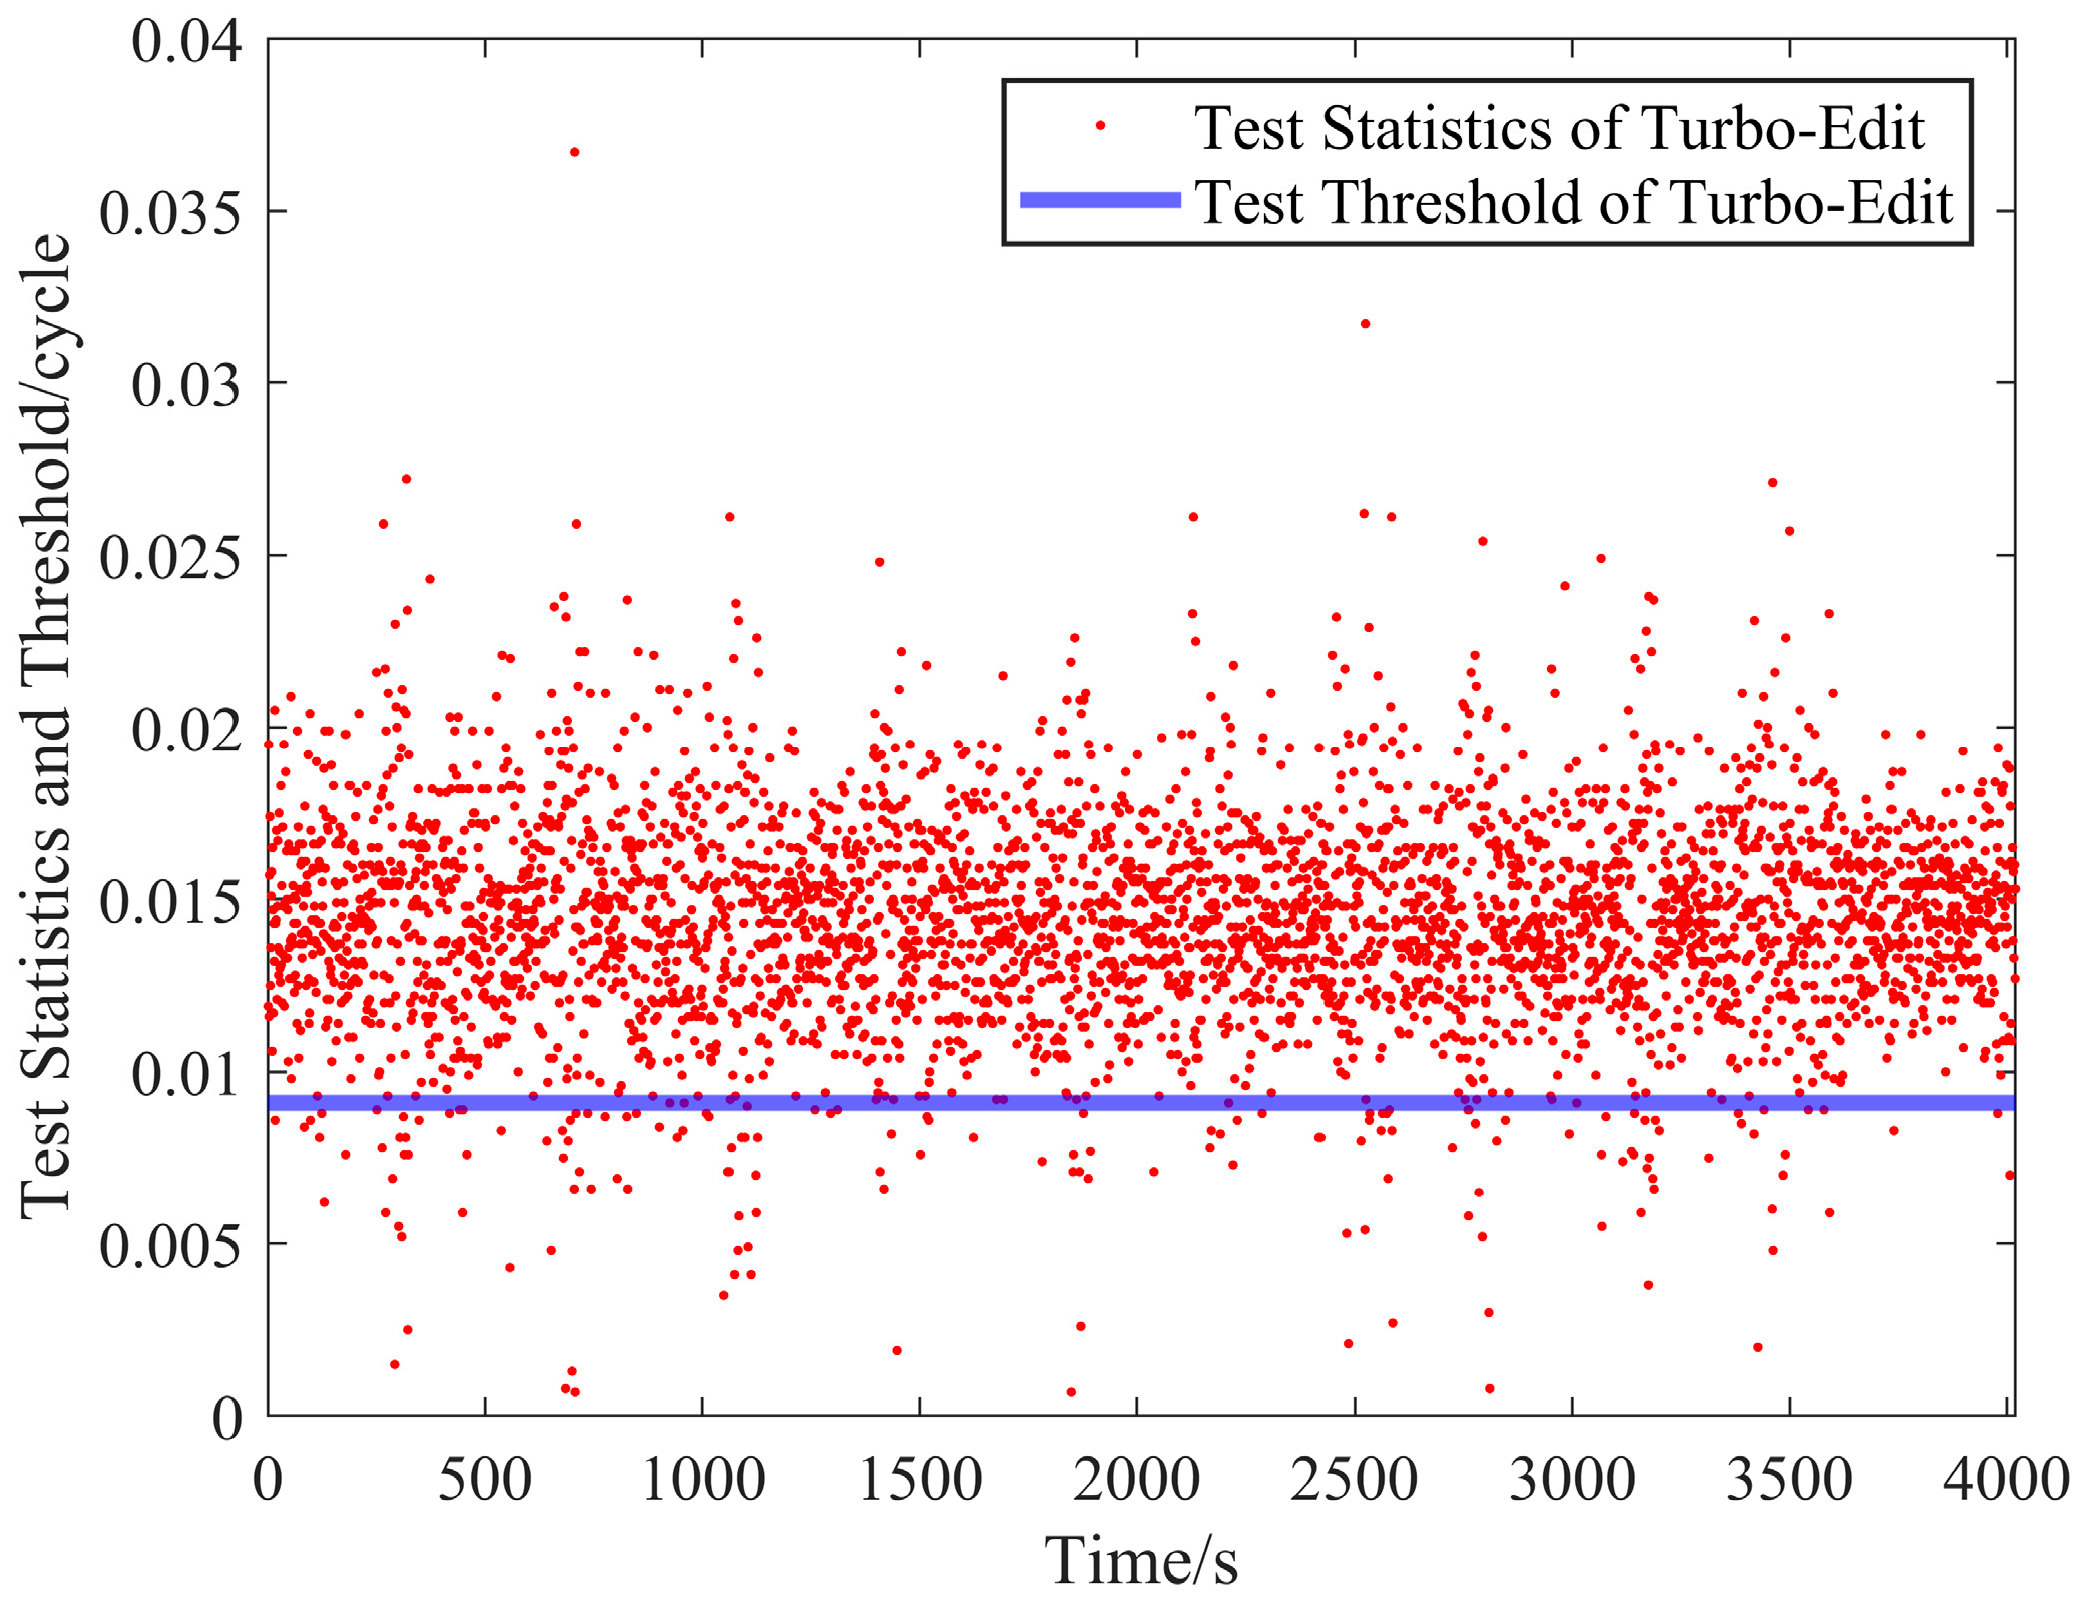
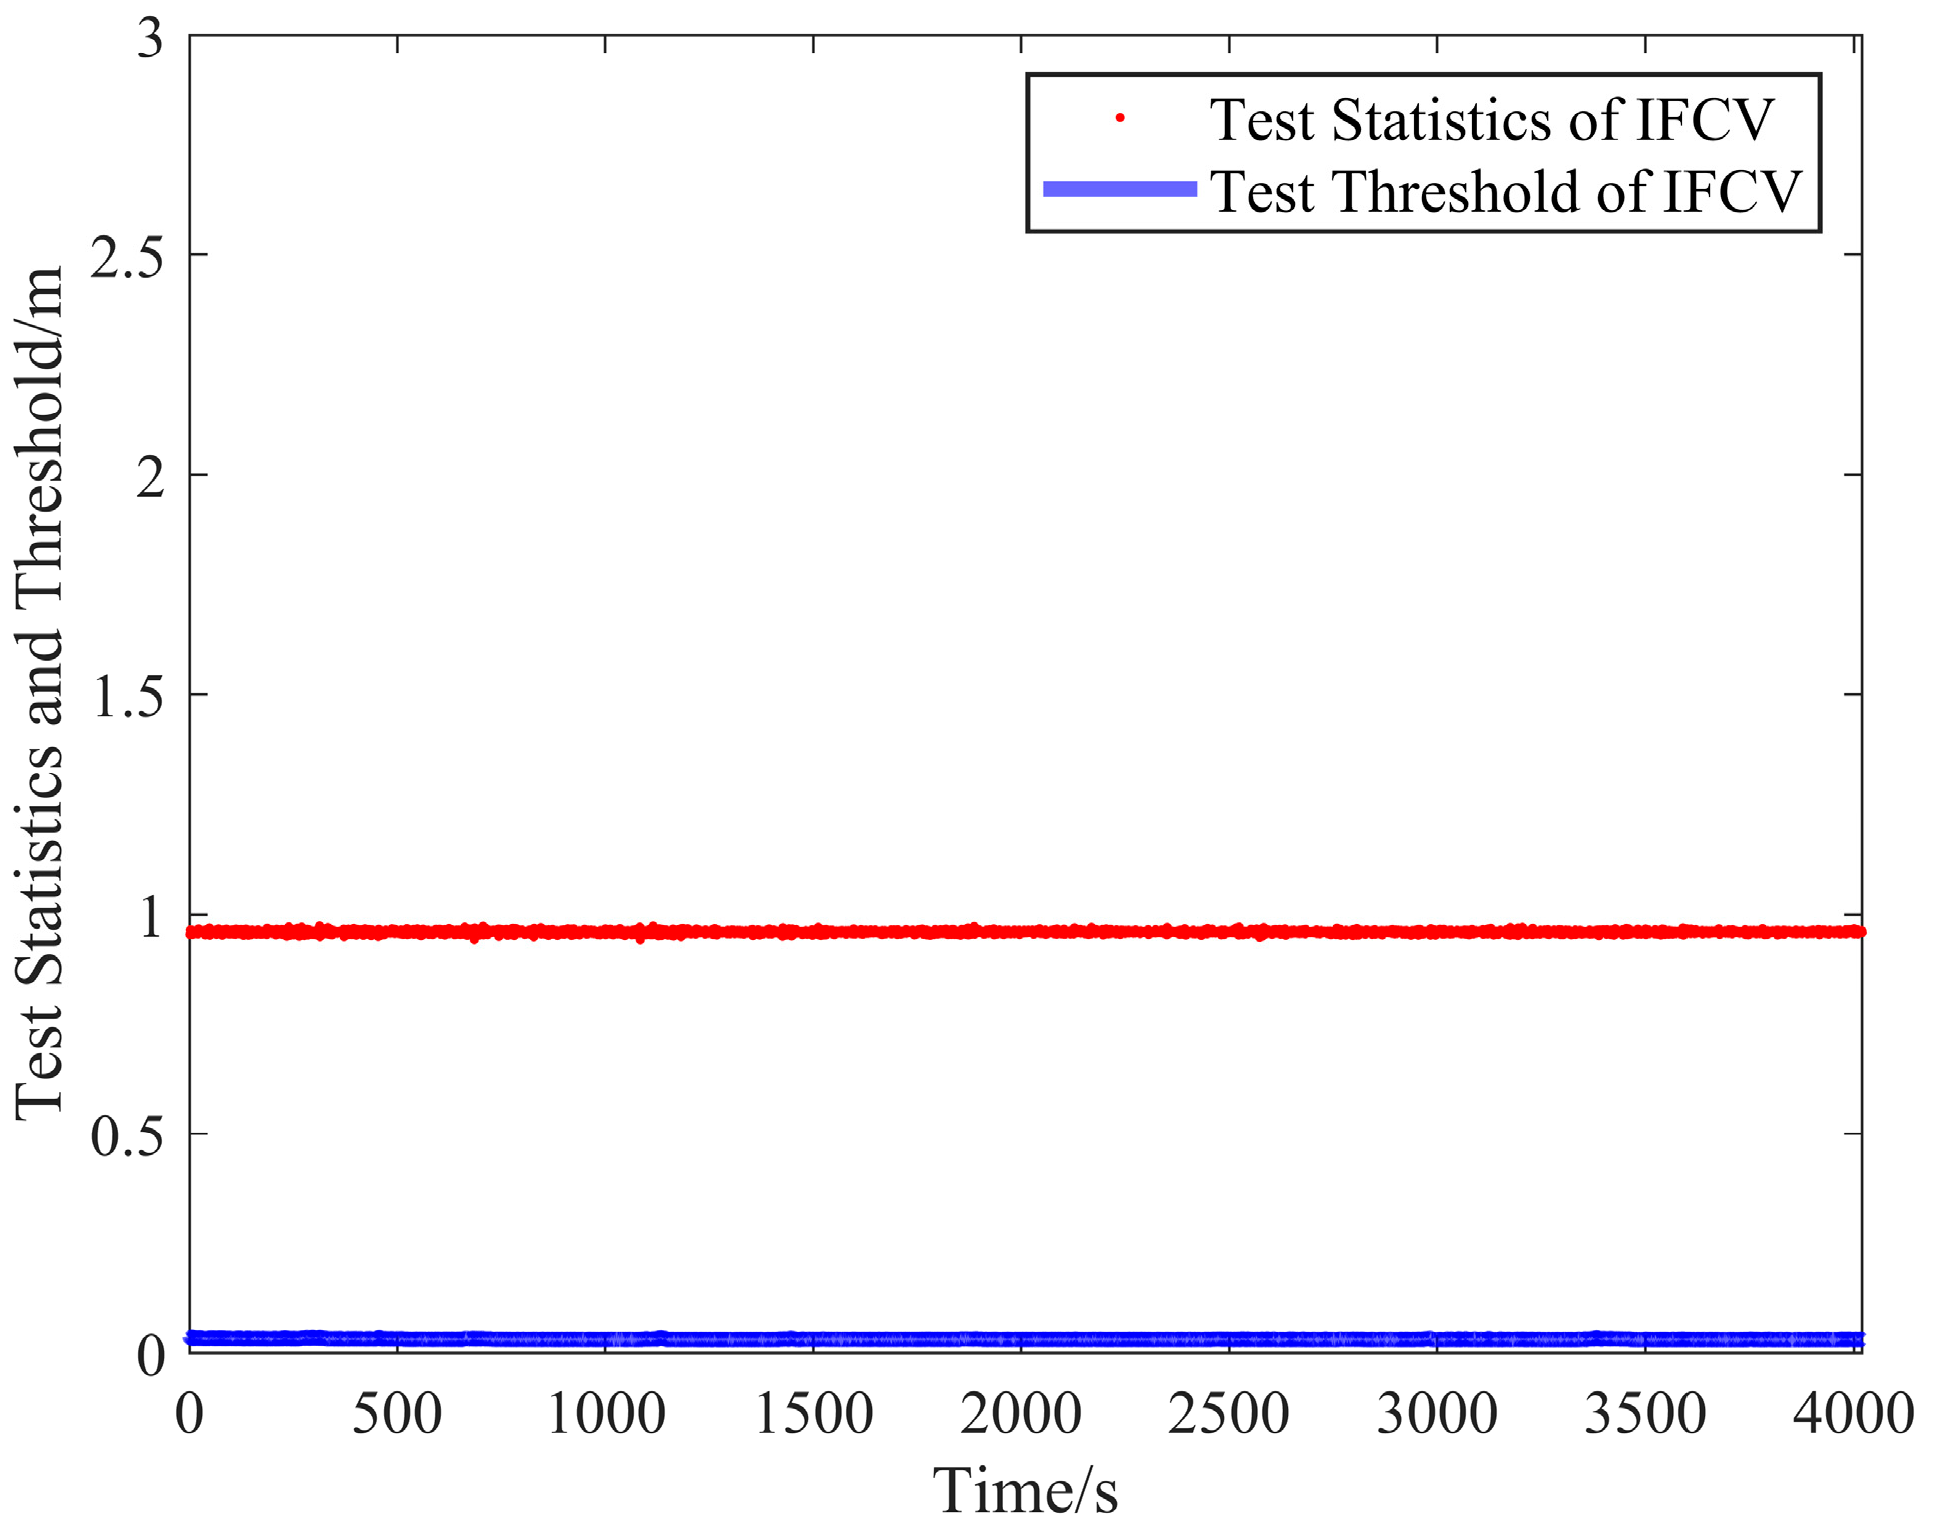
Under the conditions of Scheme B injecting specific cycle slips (5, 4), the statistical results are presented in Figure 11 and Figure 12 and Table 2.
As illustrated in Figure 11, a minority of test statistics from the Turbo-Edit method fall below the test thresholds, indicating the occurrence of missed detection events. Conversely, as shown in Figure 12, all test statistics of the IFCV method consistently exceed the test thresholds with no missed detection events observed. Due to the injection of constant-value cycle slips, the test statistics of IFCV remain nearly constant. The quantitative results in Table 2 reveal that under specific slip ratios (5, 4), the missed detection rate of the IFCV method is 0%, significantly lower than the 3.89% rate of the Turbo-Edit method. This superior performance stems from the IFCV method’s core design: distinct test statistics and adaptive test thresholds are engineered for observations across different frequencies of the same satellite, and the cycle slip detection processes for each frequency are performed independently. Consequently, this methodology fundamentally circumvents the limitation in detecting specific slip ratios that challenge the conventional Turbo-Edit approach.

4.2.3. Performance Validation with Random Cycle Slips

Under Scheme C with randomly injected cycle slips (magnitudes approximately following normal distribution, as shown in Figure 13), the statistical results of both methods are presented in Figure 14 and Figure 15.
As illustrated in Figure 14, a minority of test statistic from the Turbo-Edit method fall below the test thresholds, resulting in missed detection events. Conversely, Figure 15 demonstrates that all test statistics of the IFCV method exceed the test thresholds, with no missed detection events observed. The quantitative results in Table 3 reveal that both methods achieve a cycle slip detection success rate exceeding 99% under randomly introduced slips, indicating robust detection capabilities for conventional and novel approaches alike. Notably, however, the Turbo-Edit method exhibits a higher missed detection rate than the IFCV method due to its susceptibility to specific slip ratios (e.g., integer combinations challenging for geometry-free models).

4.3. Impact of Cycle Slip Detection Methods on Positioning Errors

To compare the effects of Turbo-Edit and IFCV methods on precise relative positioning errors, and to evaluate their performance in handling simultaneous cycle slips across multiple frequencies, cycle slips were artificially injected into observations on two frequencies (B1I and B3I) of the MEO satellites C11 and C12 (added only at even epochs to avoid identical cycle slips in consecutive epochs). As in Section 4.2, specific and random cycle slips were separately injected.
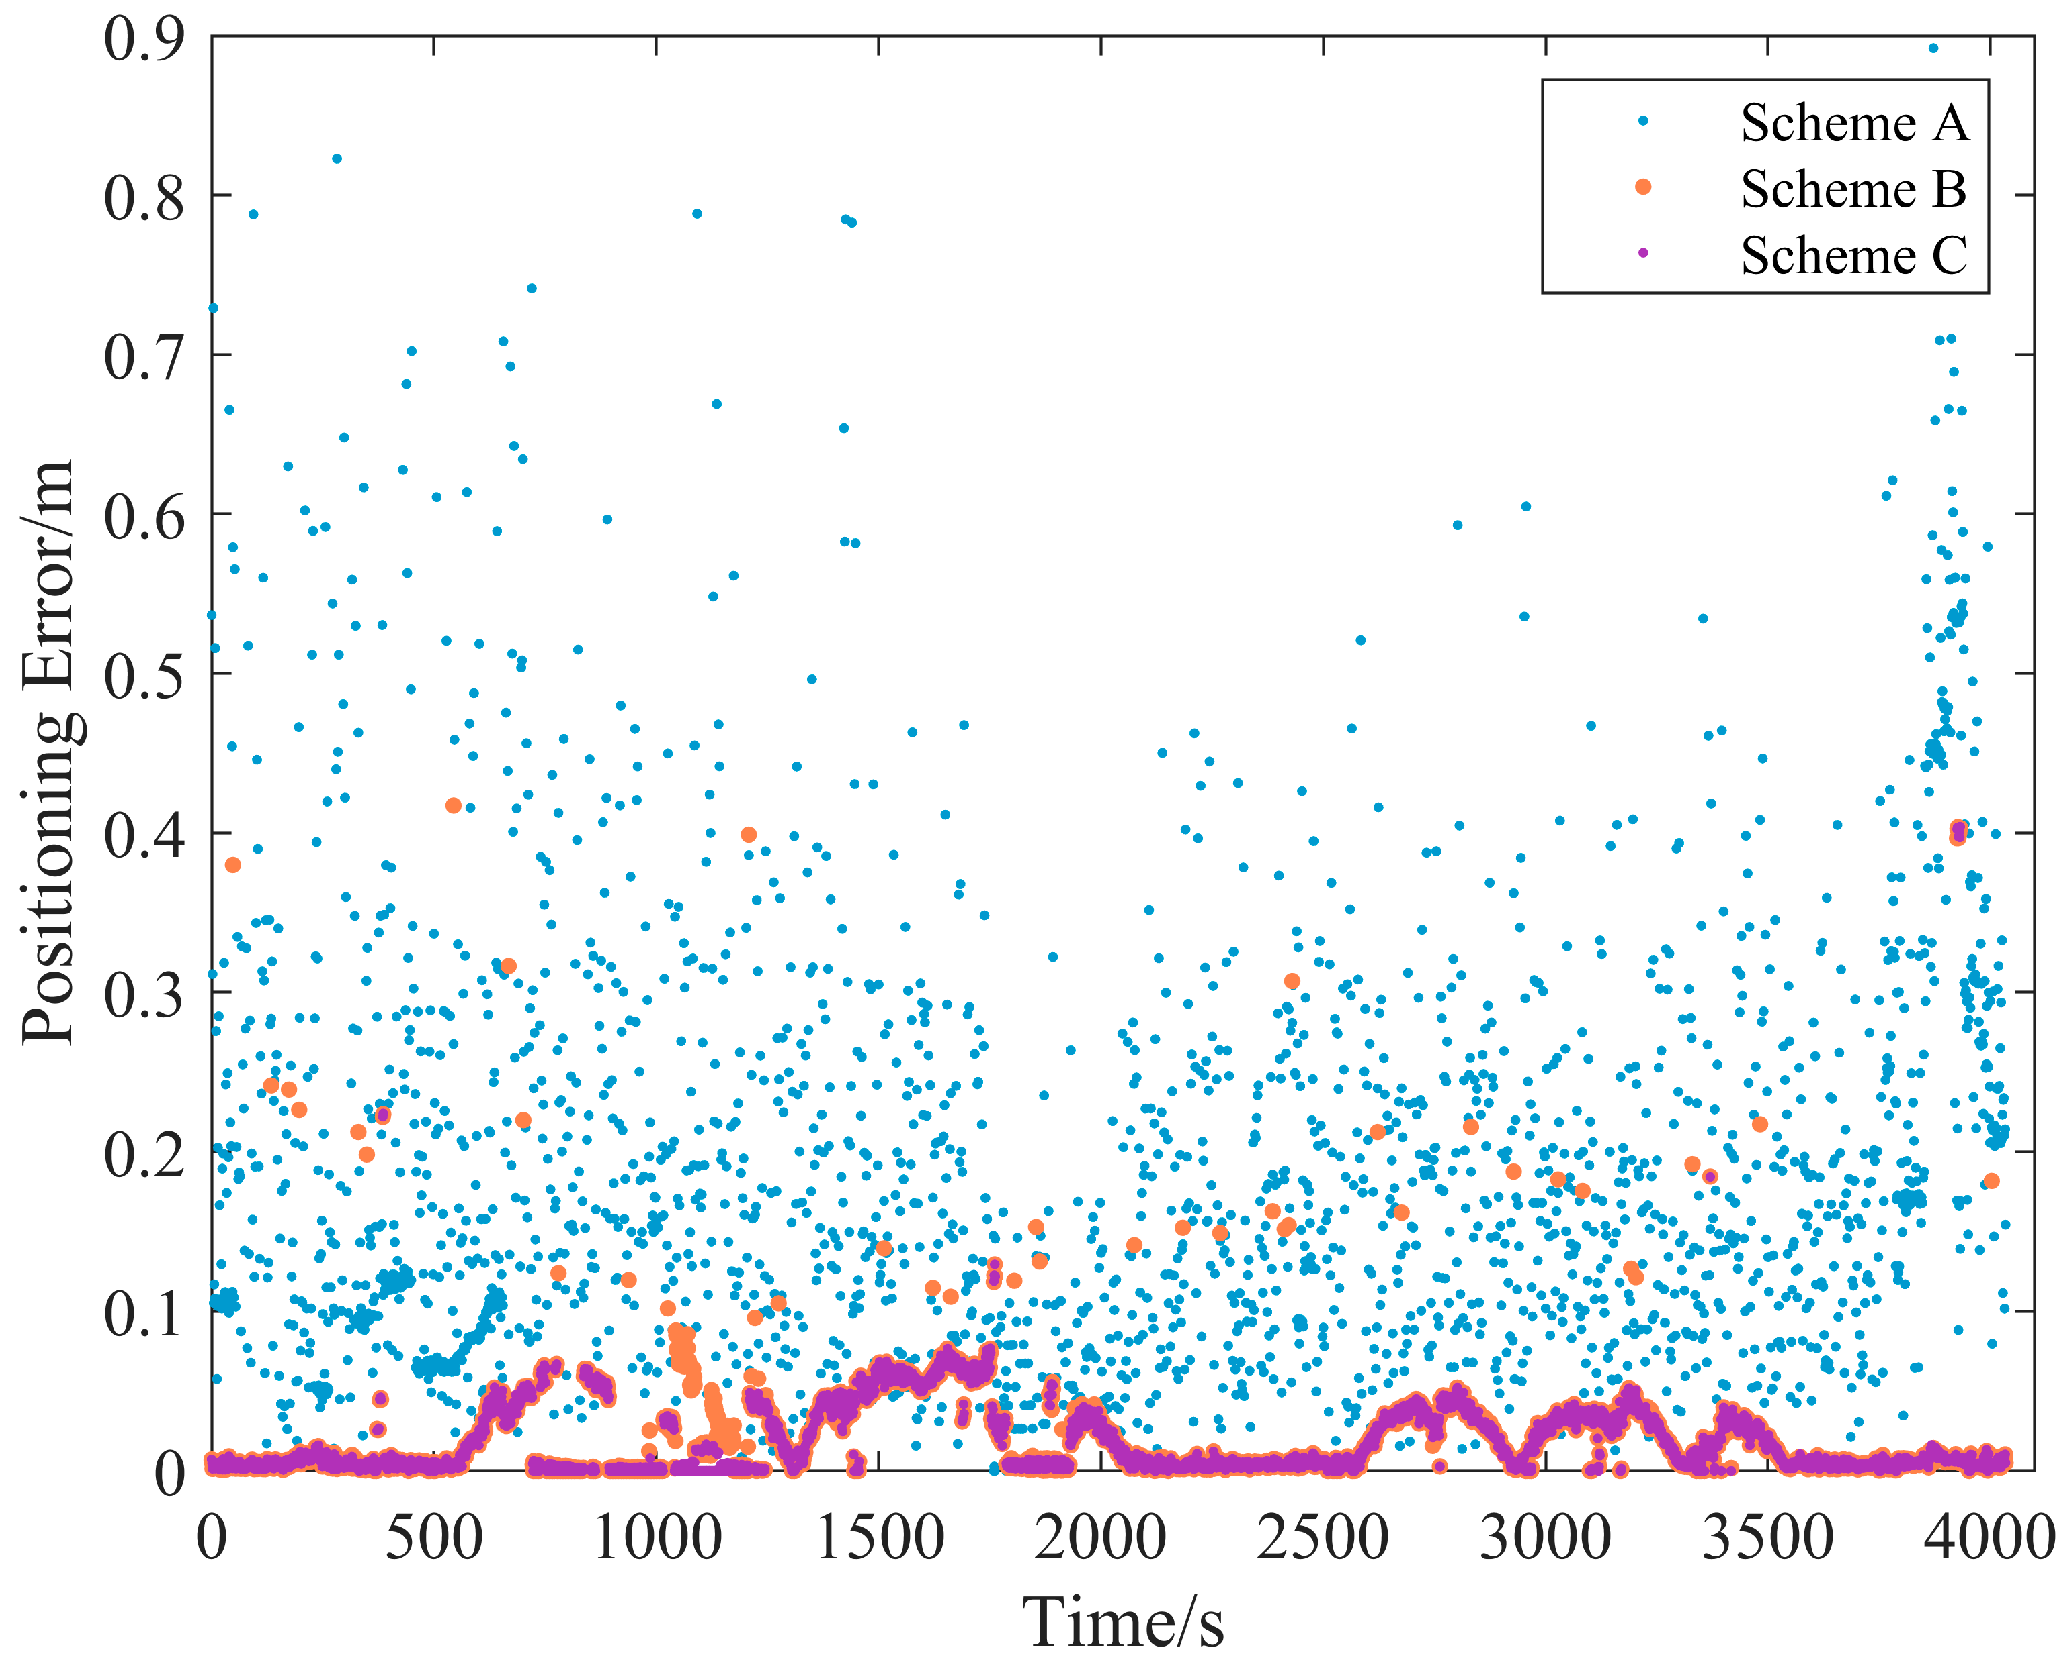
The positioning errors of three schemes were statistically analyzed (using RTKLIB 2.4.3 software solutions under slip-free conditions as the true value):
Scheme A: No cycle slip detection.
Scheme B: Cycle slips detected by the Turbo-Edit method.
Scheme C: Cycle slips detected by the IFCV method.
The precise relative positioning program operates in fix–hold mode. Upon a cycle slip being detected, the corresponding carrier phase observations and ambiguity parameters are excluded, with ambiguity resolution reinitialized at the next epoch.

4.3.1. Analysis of Positioning Errors with Specific Cycle Slips

Statistical results of positioning errors after injecting specific cycle slips on two frequencies are presented below:
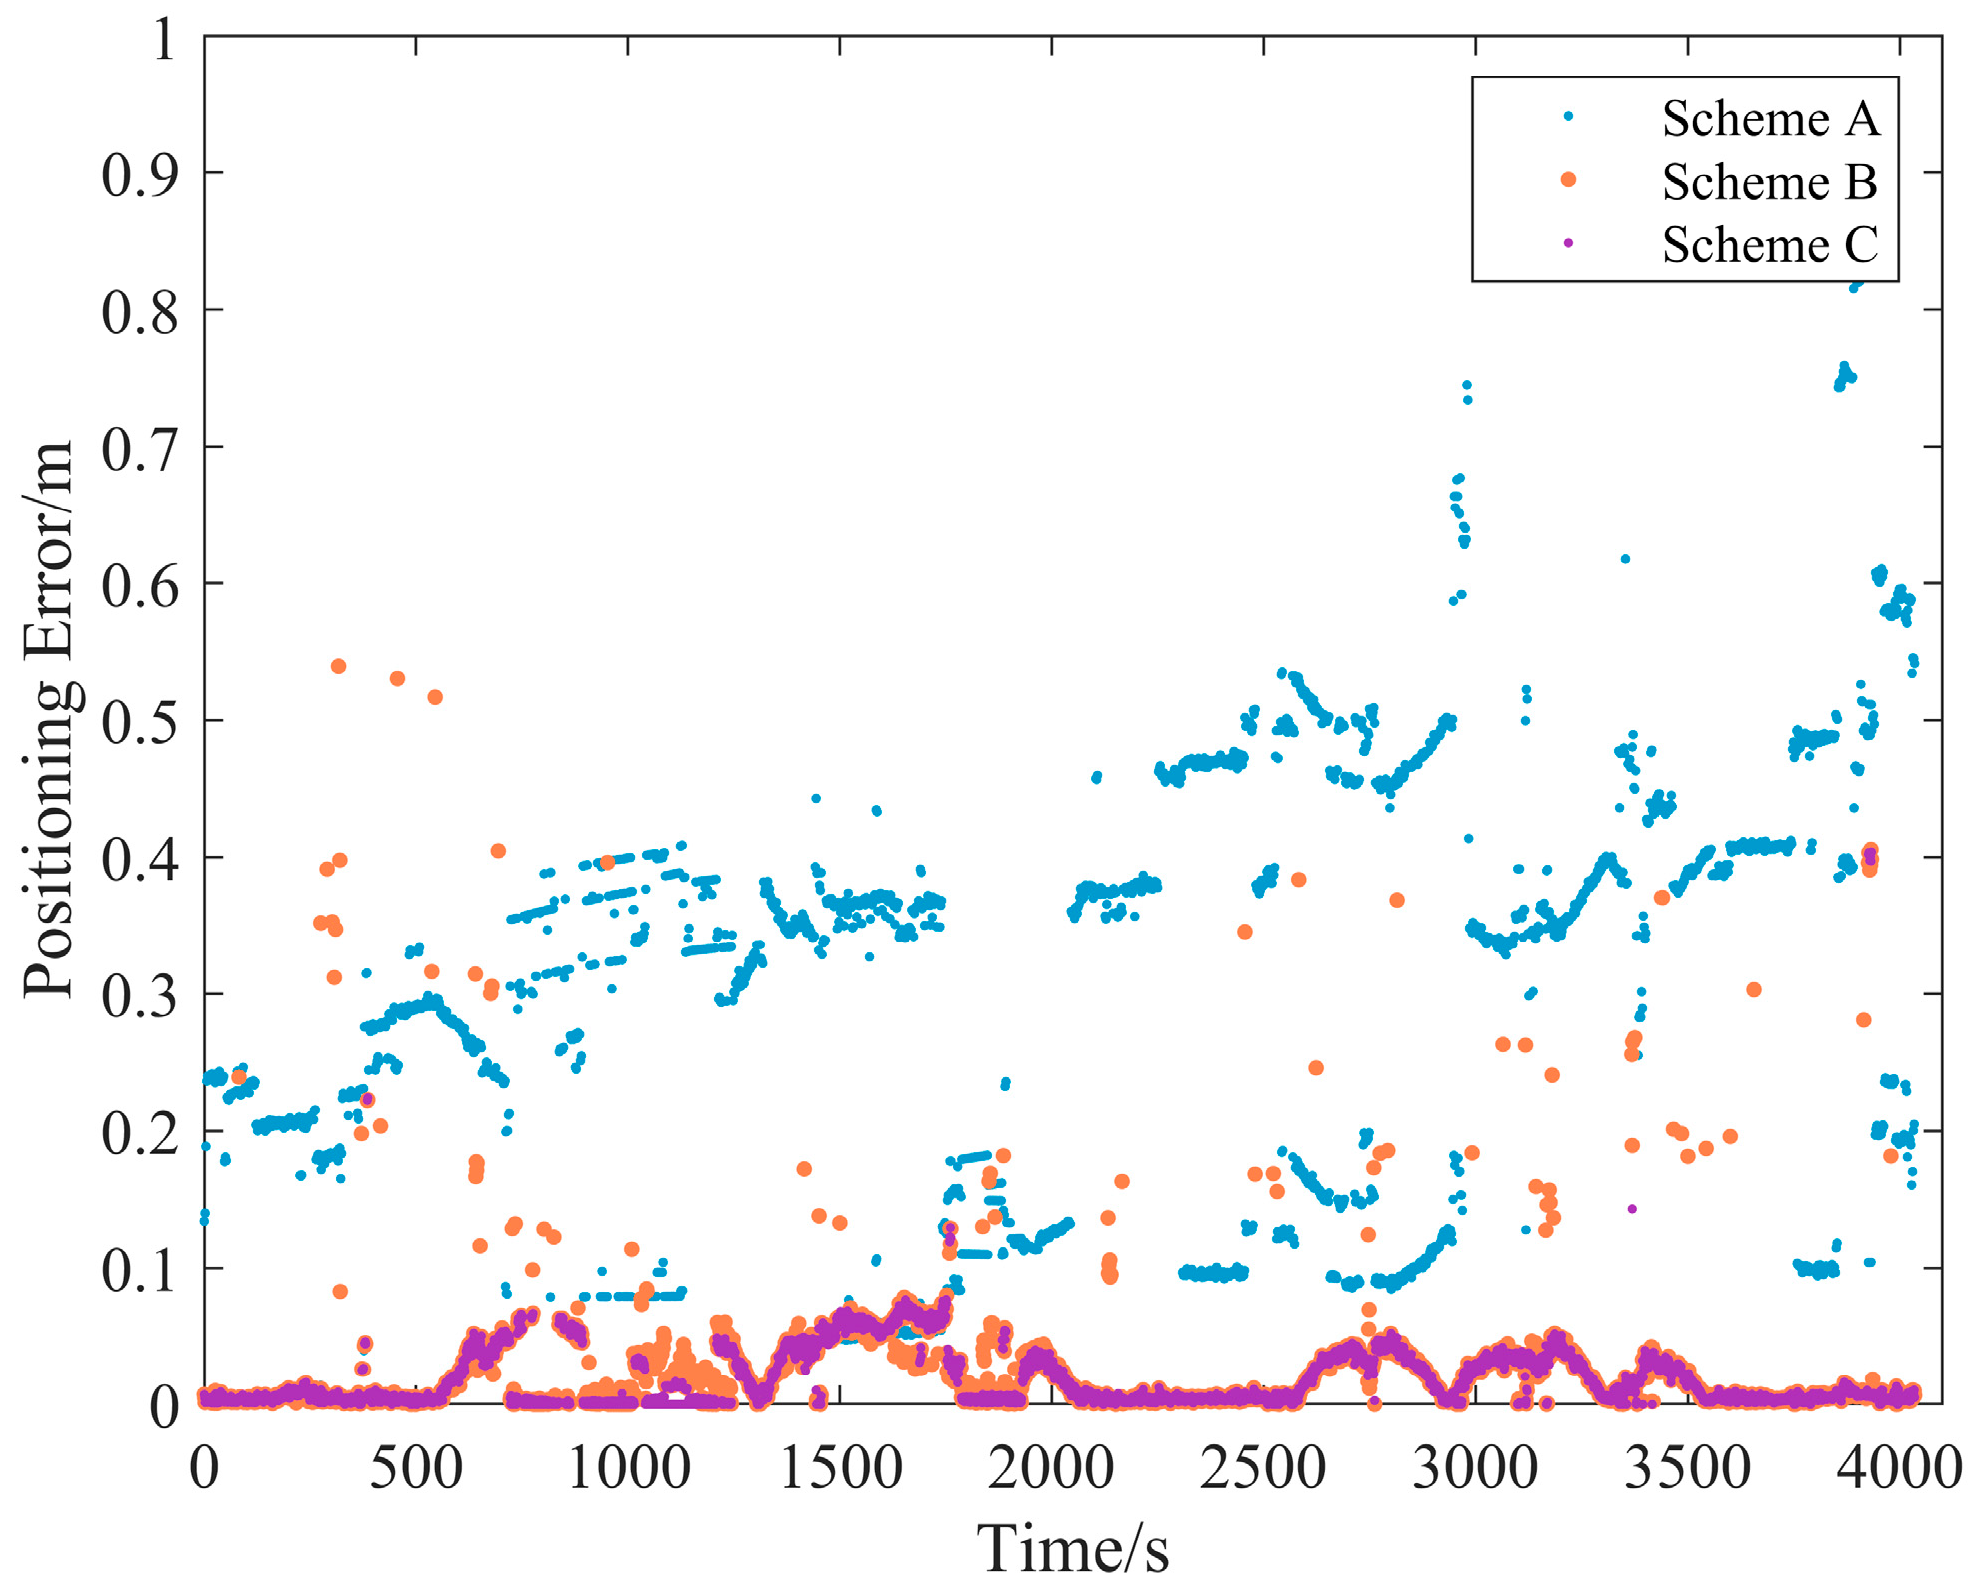
As demonstrated in Figure 16 and Figure 17, Scheme A (without cycle slip detection) exhibits significant relative positioning errors after injecting specific cycle slips, whereas Scheme B (based on Turbo-Edit) significantly reduces these errors, albeit with sporadic large deviations at limited epochs. These deviations align with the missed detection events observed in Figure 11 and Table 2. Conversely, Scheme C (employing the IFCV method) maintains minimal positioning errors, attributable to its accurate detection capability for specific cycle slips, consistent with the conclusions from Figure 12 and Table 2. The quantitative results in Table 4 further reveal that Scheme A yields decimeter-level relative positioning errors, confirming that cycle slips directly degrade fix–hold mode accuracy; Scheme B suffers frequent error jumps due to Turbo-Edit’s higher missed detection rate (as statistically validated in Table 2); and Scheme C achieves centimeter-level error recovery, reducing positioning errors by 32.35% compared to Scheme B.

4.3.2. Analysis of Positioning Errors with Random Cycle Slips

Random cycle slips were simultaneously added to carrier phase observations on two frequencies (B1I and B3I) of the MEO satellites C11 and C12 (with distribution variance matching Figure 13); the statistical results are presented below.
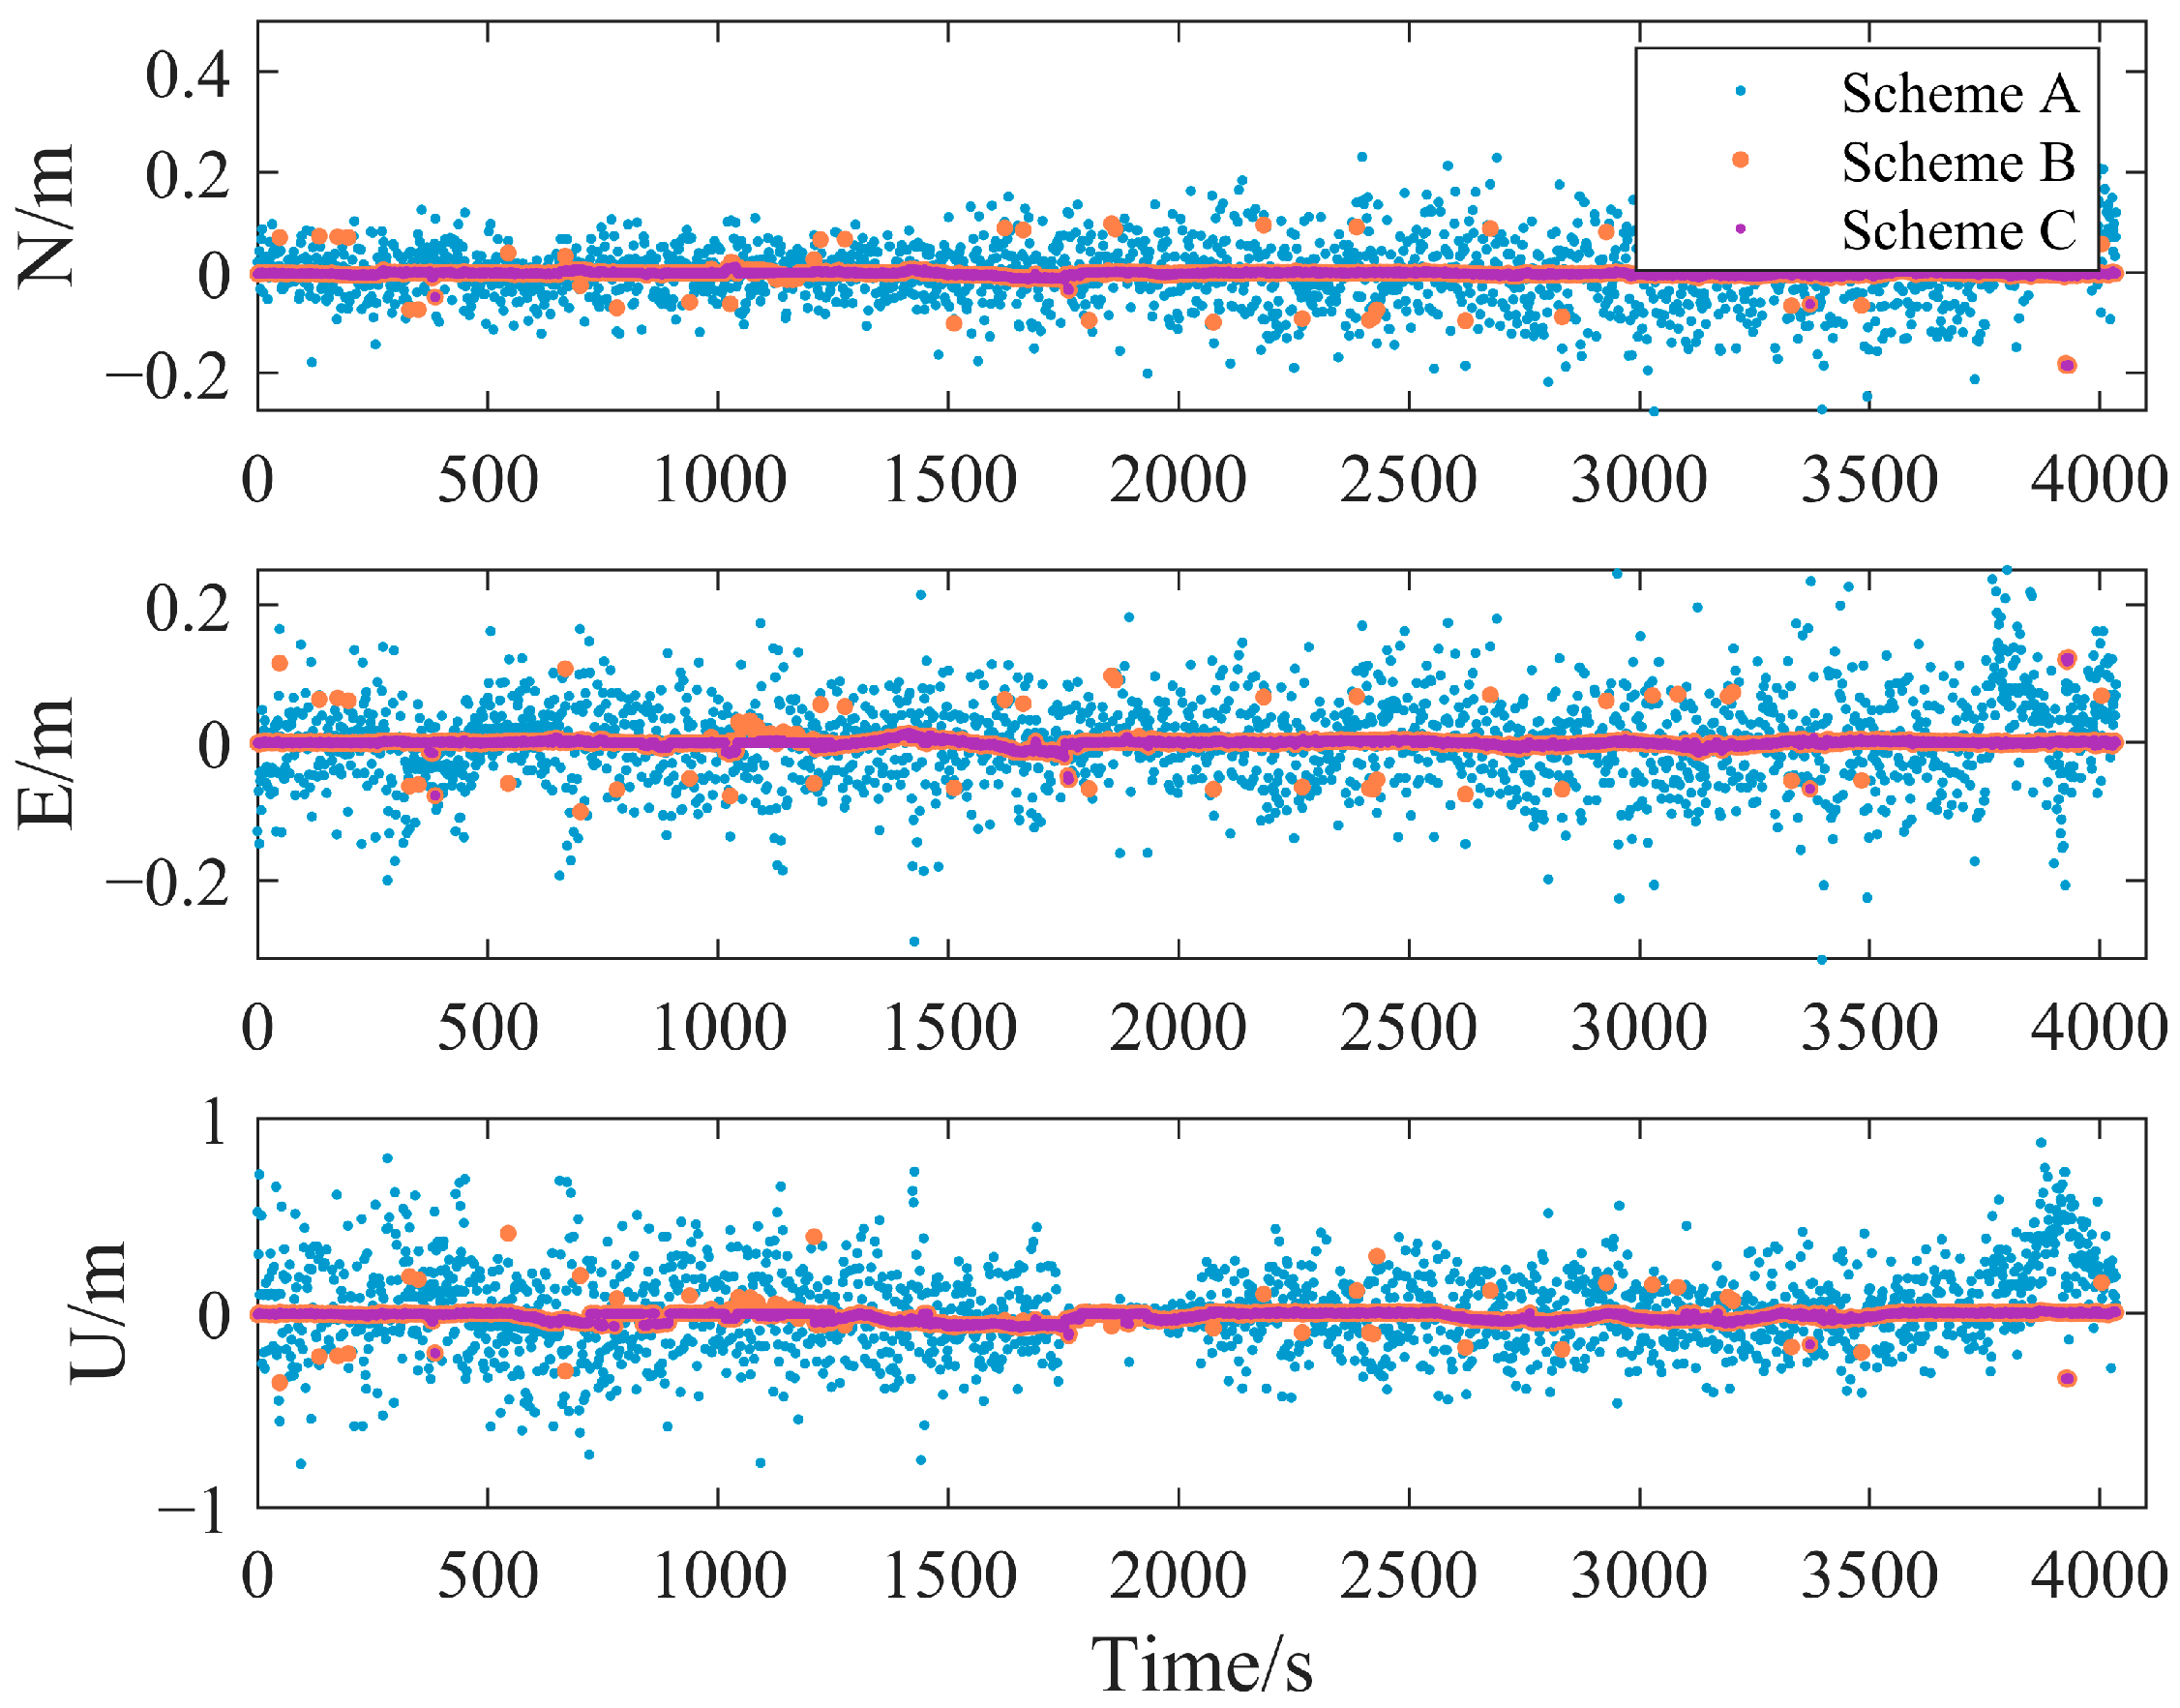
Figure 18 and Figure 19 demonstrate that Turbo-Edit (Scheme B) effectively detected and excluded random slips, restoring centimeter-level accuracy. However, as indicated in Table 5, the IFCV method achieved higher detection success rates, reducing positioning errors by 23.3% compared with Scheme B. During the experiment, the exclusion of satellites C11 and C12 resulted in a reduction in the number of available satellites, consequently leading to discrepancies between the relative positioning results of Scheme C and those obtained from RTKLIB.
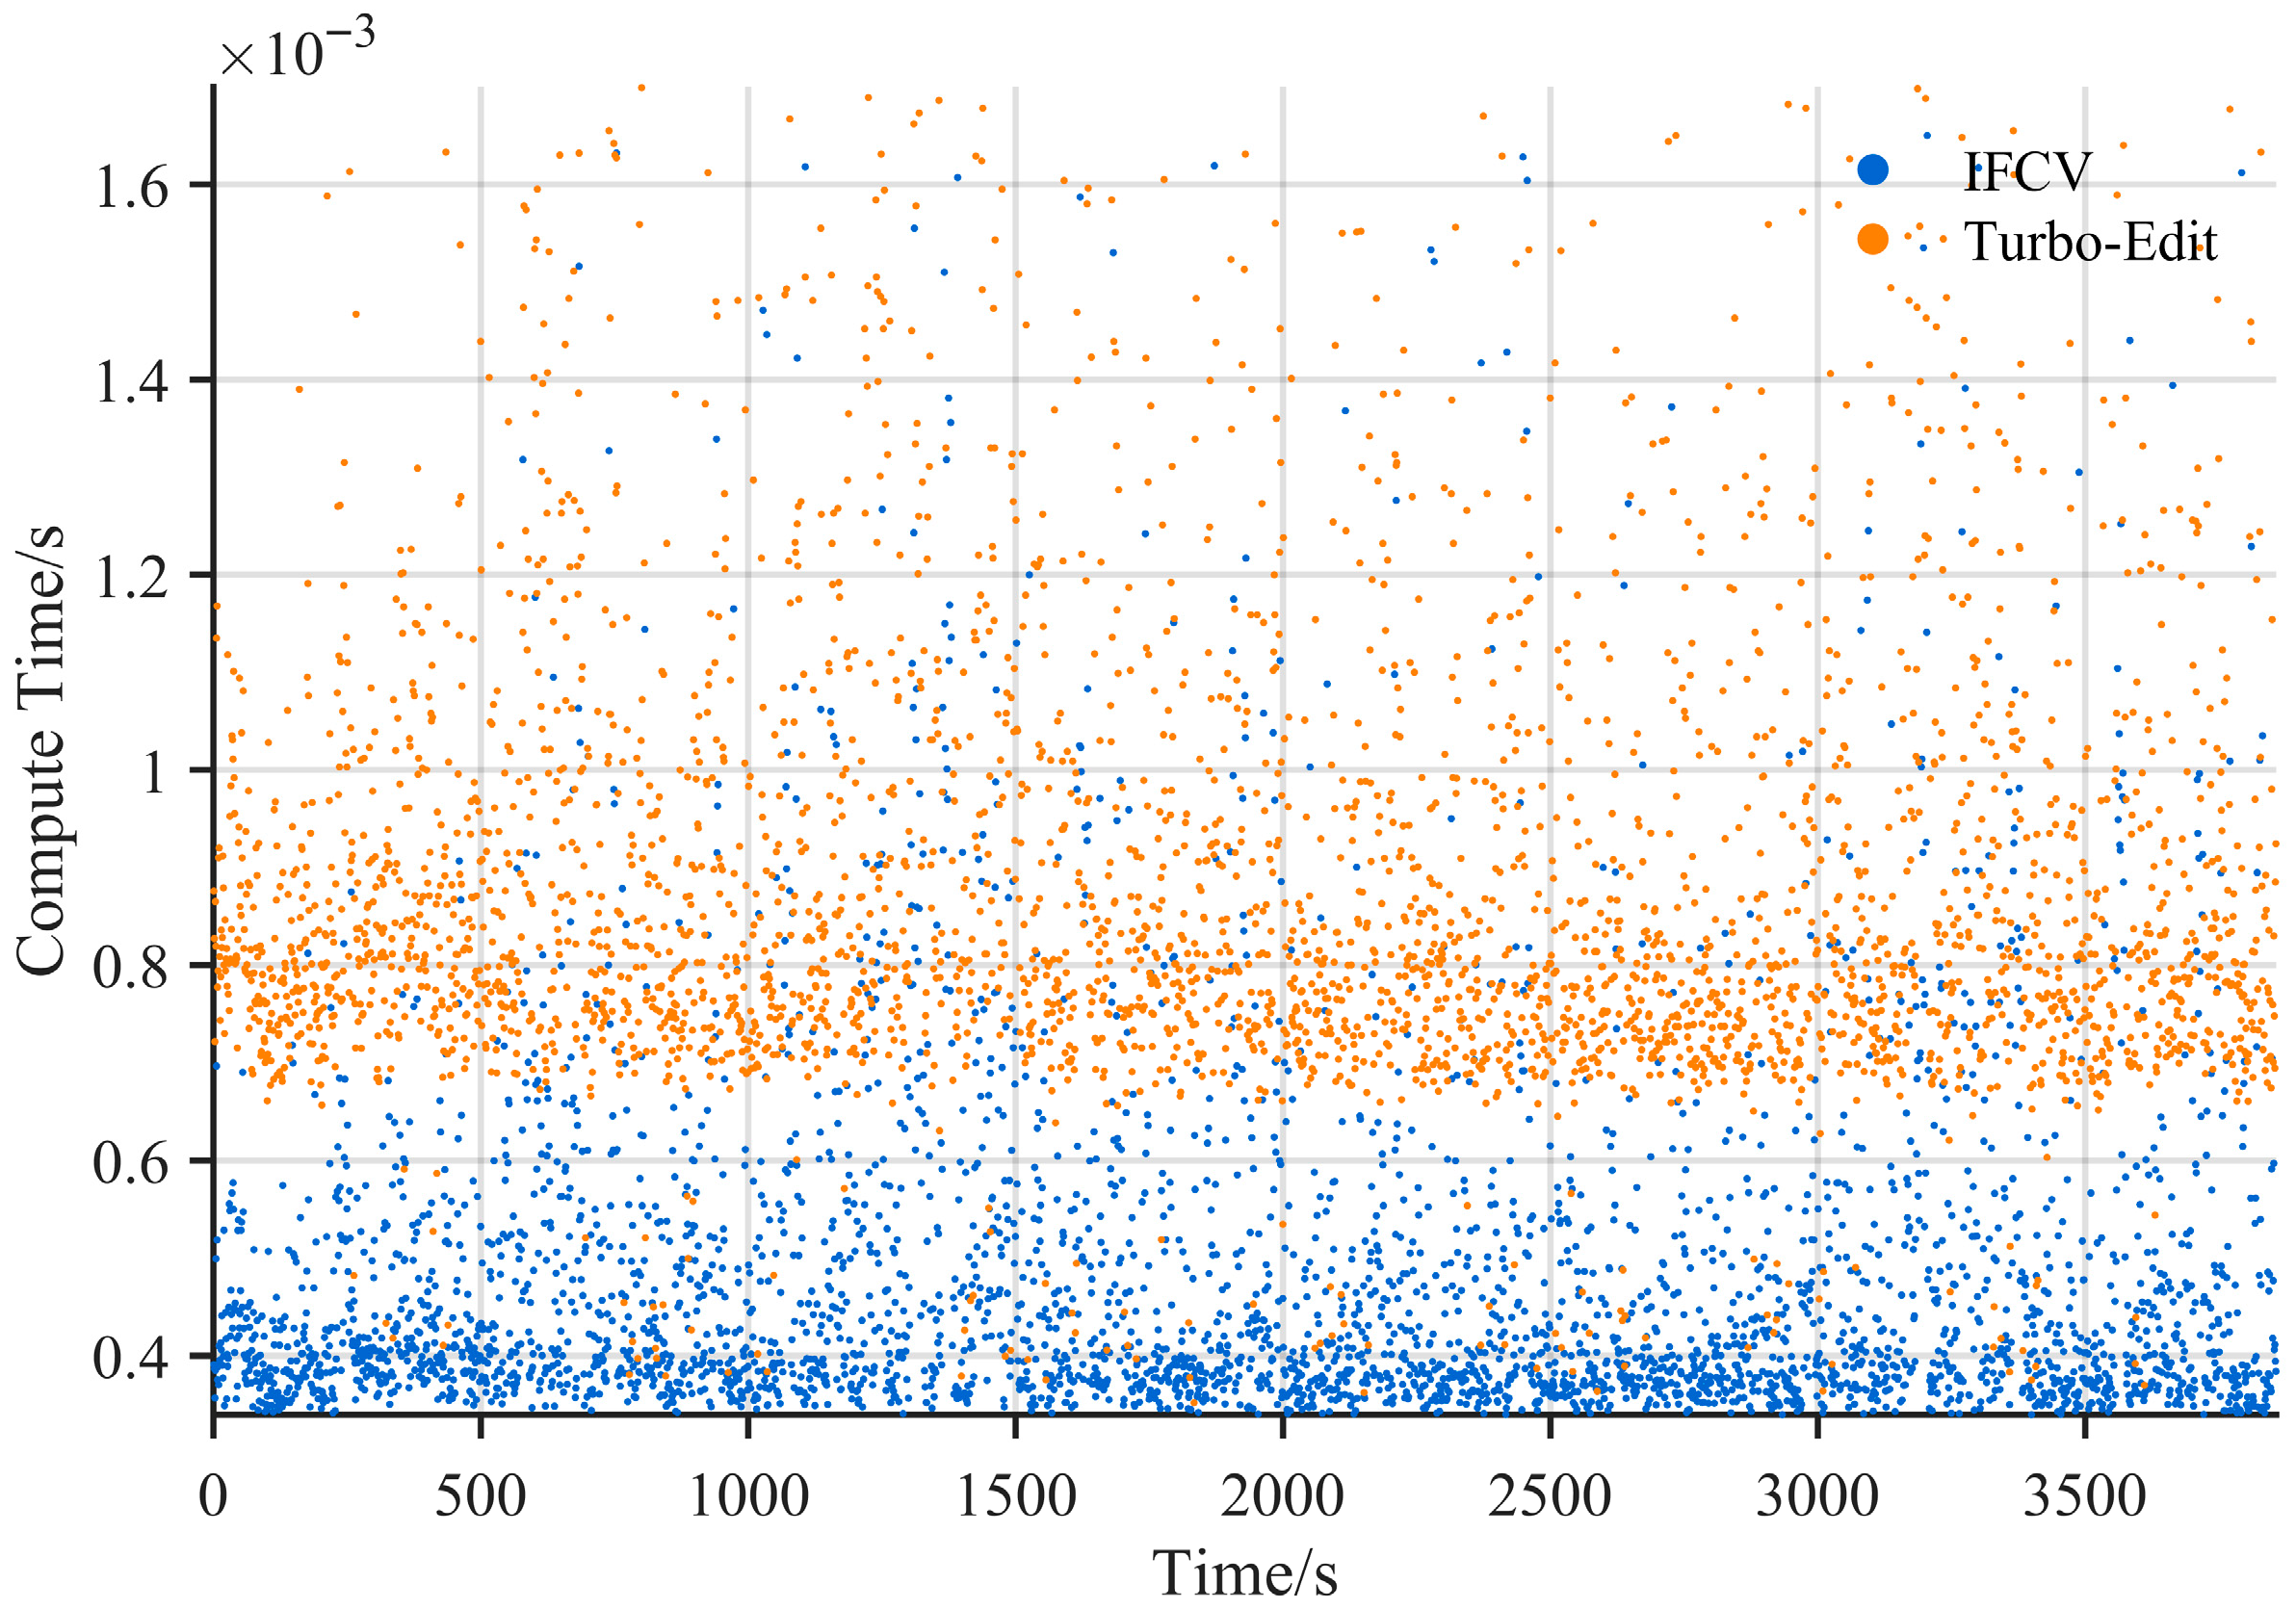
To compare the computational efficiency of the IFCV and Turbo-Edit methods, the processing time per epoch for both methods was recorded and subsequently visualized via scatter plots (as shown in Figure 20). The experiment was conducted on a Lenovo Y9000P laptop operating in balanced mode, which is made by Lenovo Group Ltd in Hefei, China, with hardware specifications as follows (Lenovo, Beijing, China):
CPU: 13th Gen Intel® Core™ i9-13900HX;
RAM: 16 GB SK Hynix DDR5 5600 MHz dual-channel;
GPU: NVIDIA GeForce RTX™ 4060 Laptop.
As observed from Figure 20 and Table 6, the IFCV method exhibits reduced average processing time per epoch compared to the Turbo-Edit method, with maximum, minimum, and average computation times reduced by 15.04%, 8.57%, and 48.04%, respectively. This efficiency improvement stems from the distinct computational loads of the two approaches; the Turbo-Edit method combines the MW and GF methods for cycle slip detection, inherently requiring higher computational complexity due to dual-metric parallel processing, while despite employing two least-squares estimation operations, the IFCV method maintains low overhead owing to smaller matrix dimensions for inversion computations, thereby avoiding significant time penalties.

5. Discussion

Three experimental sets were conducted to evaluate the false alarm rate (FAR), missed detection rate (MDR), and positioning error impacts of the Turbo-Edit and IFCV methods for cycle slip detection. In Set 1 (no cycle slips injected), Turbo-Edit exhibited a FAR of 1.1%, while IFCV showed no false alarm events. For Set 2 (specific slip ratios added to carrier-phase observations of satellites C11 and C12), Turbo-Edit achieved a detection success rate of 96.11% with an MDR of 3.89% and a positioning error of 4.69 cm. In contrast, IFCV accurately detected all cycle slips, yielding a significantly lower positioning error of 3.17 cm. This confirms Turbo-Edit’s weaker sensitivity to specific slip ratios, which increased positioning errors, whereas IFCV reduced relative positioning errors by 32.41%. In Set 3 (randomly injected cycle slips), both methods demonstrated high efficacy: Turbo-Edit attained a 99.98% success rate with a 3.83 cm positioning error, while IFCV achieved 100% detection accuracy and a 3.02 cm positioning error. Notably, IFCV’s average computation time of 0.53 ms was 48.04% lower than Turbo-Edit’s 1.02 ms, underscoring its computational efficiency. Additionally, IFCV’s capability to identify specific cycle slips enabled the selective exclusion of the affected channel while preserving observations from the unaffected channel on the same satellite, thereby enhancing observation data utility. Critical limitations: the observed 0% FAR and MDR for IFCV are attributed to limited test duration and ideal observation conditions; extended operation or complex environments may induce minor detection failures.

6. Conclusions

This study proposes an inter-frequency cross-validation (IFCV) method for cycle slip detection in carrier phase observations. The IFCV method constructs high-precision predicted values of double-differenced carrier-phase observations between consecutive epochs and stations using least-squares estimation. The predicted values are then compared with actual observations to generate test statistics, enabling accurate and efficient cycle slip detection. In scenarios with specific cycle slip ratios, IFCV reduced the root mean square error (RMSE) of precise relative positioning from 4.69 cm to 3.17 cm compared to the conventional Turbo-Edit method. For randomly introduced slips, IFCV further lowered the RMSE from 3.83 cm to 3.02 cm while reducing the average computation time from 1.02 ms to 0.53 ms. These results demonstrate IFCV’s superior performance in both scenarios.
The IFCV method shows potential for precision relative positioning applications such as aircraft landing, UAV formation flight, and vehicle–road collaborative navigation, owing to its high detection accuracy and efficiency. However, its limitations must be acknowledged: In challenging environments (e.g., urban canyons or severe electromagnetic interference), where concurrent multiple cycle slips may occur in carrier-phase observations, IFCV may exhibit detection failures due to degraded observation quality. Additionally, constrained by its algorithmic principles, IFCV is applicable only to relative positioning scenarios and cannot monitor cycle slips in single-receiver scenarios.
Future research will focus on three directions: experimental validation in complex environments (e.g., urban canyons and tree canopy occlusion) to comprehensively evaluate IFCV’s detection robustness; and integration with multi-sensor systems (e.g., inertial navigation and visual odometry) to enhance slip detection accuracy and anti-interference capabilities; and analysis of integrity risks by leveraging the independence between predicted and actual observations to characterize the posterior error distribution in the measurement domain after IFCV, thereby assessing its impact on positioning integrity.

7. Patents

A patent has been formalized in China (patent number: ZL 2024 1 1172715.5) based on the work reported in this paper.

Author Contributions

Conceptualization, J.W.; methodology, Z.L. and D.W.; software, D.W.; validation, Z.L., J.W. and D.W.; formal analysis, Z.L.; investigation, Z.L. and D.W.; resources, J.W.; data curation, Z.L. and D.W.; writing—original draft preparation, Z.L.; writing—review and editing, Z.L., J.W. and D.W.; visualization, D.W.; supervision, J.W.; project administration, J.W. All authors have read and agreed to the published version of the manuscript.

Funding

This research received no external funding.

Data Availability Statement

The raw data supporting the conclusions of this article will be made available by the authors on request.

Conflicts of Interest

The authors declare no conflicts of interest.

Abbreviations

The following abbreviations are used in this manuscript:
CDFCumulative distribution function
DDDouble-differenced
FARFalse alarm rate
GFGeometry-free
GNSSGlobal navigation satellite system
IARInteger ambiguity resolution
IFCVInter-frequency cross-validation
INSInertial navigation system
LAMBDALeast-squares ambiguity decorrelation adjustment
LOSLine-of-sight
MDRMissing detection rate
MEOMedium earth orbit
MWMelbourne–Wübbena
PPPPrecise point positioning
RTKReal-time kinematics
SDSingle-differenced
UAVUnmanned aerial vehicle
UGVUnmanned ground vehicle

Appendix A

The Appendix details the linearization derivation of Equation (7).
The initial baseline vector is denoted as Δ r A B 0 . Δ r A B and δ Δ r A B are the true value and correction value of the baseline vector, respectively, such that Δ r A B = Δ r A B 0 + δ Δ r A B . The linearized double-differenced (DD) carrier phase measurement equation is expressed as
λ φ A B ( t 1 ) λ φ A B ( t 0 ) r j ( T 1 ) r A ( t 1 ) Δ r A B 0 ( t 1 ) r j ( T 1 ) r A ( t 1 ) r j ( T 0 ) r A ( t 0 ) Δ r A B 0 ( t 0 ) r j ( T 0 ) r A ( t 0 ) = r j 0 ( T 1 ) δ Δ r A B ( t 1 ) + r j 0 ( T 0 ) δ Δ r A B ( t 0 ) + c δ t A B ( t 1 ) δ t A B ( t 0 ) + ε A B , δ t
where r j 0 ( T 1 ) is the unit line-of-sight (LOS) from the user station to j th satellite at epoch T 1 , and r j 0 ( T 0 ) is the LOS from the user station to j th satellite at epoch T 0 :
r j 0 ( T 1 ) = r j ( T 1 ) r A ( t 1 ) Δ r A B 0 ( t 1 ) r j ( T 1 ) r A ( t 1 ) Δ r A B 0 ( t 1 )
r j 0 ( T 0 ) = r j ( T 0 ) r A ( t 0 ) Δ r A B 0 ( t 0 ) r j ( T 0 ) r A ( t 0 ) Δ r A B 0 ( t 0 )
The variations in the unit LOS vectors between the two epochs are defined as Δ r j 0 = r j 0 ( T 1 ) + r j 0 ( T 0 ) . The variation in the baseline correction vector between two stations and two epochs is defined as δ Δ r A B , Δ t = δ Δ r A B ( t 1 ) δ Δ r A B ( t 0 ) . Thus, the two items r j 0 ( T 1 ) δ Δ r A B ( t 1 ) + r j 0 ( T 0 ) δ Δ r A B ( t 0 ) in Equation (A1) are converted to
( r j 0 ( T 0 ) + Δ r j 0 ) ( δ Δ r A B ( t 0 ) + δ Δ r A B , Δ t ) + r j 0 ( T 0 ) δ r A B ( t 0 ) = r j 0 ( T 0 ) δ Δ r A B , Δ t + Δ r j 0 δ r A B ( t 0 ) + Δ r j 0 δ Δ r A B , Δ t
where Δ r j 0 δ r A B ( t 0 ) and Δ r j 0 δ Δ r A B , Δ t are second-order negligible terms. Thus, the linearized Equation (A1) is converted to
λ φ A B ( t 1 ) λ φ A B ( t 0 ) r j ( T 1 ) r A ( t 1 ) Δ r A B 0 ( t 1 ) r j ( T 1 ) r A ( t 1 ) r j ( T 0 ) r A ( t 0 ) Δ r A B 0 ( t 0 ) r j ( T 0 ) r A ( t 0 ) = r j 0 ( T 0 ) δ Δ r A B , Δ t + c δ t A B ( t 1 ) δ t A B ( t 0 ) + ε A B , δ t

References

  1. Chen, D.; Ye, S.; Xia, F.; Cheng, X.; Zhang, H.; Jiang, W. A multipath mitigation method in long-range RTK for deformation monitoring. GPS Solut. 2022, 26, 96. [Google Scholar] [CrossRef]
  2. Hou, P.; Zhang, B. Decentralized GNSS PPP-RTK. J. Geod. 2023, 97, 72. [Google Scholar] [CrossRef]
  3. Celis, R.d.; Solano-Lopez, P.; Barroso, J.; Cadarso, L. Neural Network-Based Ambiguity Resolution for Precise Attitude Estimation with GNSS Sensors. IEEE Trans. Aerosp. Electron. Syst. 2024, 60, 6702–6716. [Google Scholar] [CrossRef]
  4. Gu, S.; Fang, L.; Jiang, W. Multiple integer candidates ambiguity resolution: A unification ambiguity resolution algorithm. Satell. Navig. 2024, 5, 21. [Google Scholar] [CrossRef]
  5. Berntorp, K.; Weiss, A.; Cairano, S.D. Integer Ambiguity Resolution by Mixture Kalman Filter for Improved GNSS Precision. IEEE Trans. Aerosp. Electron. Syst. 2020, 56, 3170–3181. [Google Scholar] [CrossRef]
  6. Breitsch, B.; Morton, Y.T.; Rino, C.; Xu, D. GNSS Carrier Phase Cycle Slips Due to Diffractive Ionosphere Scintillation: Simulation and Characterization. IEEE Trans. Aerosp. Electron. Syst. 2020, 56, 3632–3644. [Google Scholar] [CrossRef]
  7. Xu, H.; Chen, X.; Ou, J.; Yuan, Y. Single-station single-frequency GNSS cycle slip estimation with receiver clock error increment and position increment constraints. GPS Solut. 2024, 28, 117. [Google Scholar] [CrossRef]
  8. Jia, C.; Liu, Y.; Li, H. Single-frequency cycle slip detection and repair for a standalone GNSS receiver using a common-antenna-based dual-board design. GPS Solut. 2024, 28, 183. [Google Scholar] [CrossRef]
  9. Li, Q.; Dong, Y.; Wang, D.; Wu, J.; Zhang, L. Real-Time Precise DGNSS/INS Integrated Relative Positioning with High Output Rate and Low Broadcast Rate for Kinematic-to-Kinematic Applications. Remote Sens. 2022, 14, 2053. [Google Scholar] [CrossRef]
  10. Shi, D.; Yuan, W.; Li, S.; Wu, N.; Ng, D.W.K. Cycle-Slip Detection and Correction for Carrier Phase Synchronization in Coded Systems. IEEE Commun. Lett. 2021, 25, 113–116. [Google Scholar] [CrossRef]
  11. Chang, G.; Xu, T.; Yao, Y.; Wang, Q. Adaptive Kalman filter based on variance component estimation for the prediction of ionospheric delay in aiding the cycle slip repair of GNSS triple-frequency signals. J. Geod. 2018, 92, 1241–1253. [Google Scholar] [CrossRef]
  12. Li, B.; Liu, T.; Nie, L.; Qin, Y. Single-frequency GNSS cycle slip estimation with positional polynomial constraint. J. Geod. 2019, 93, 1781–1803. [Google Scholar] [CrossRef]
  13. Li, Q.; Dong, Y.; Wang, D.; Zhang, L.; Wu, J. A real-time inertial-aided cycle slip detection method based on ARIMA-GARCH model for inaccurate lever arm conditions. GPS Solut. 2021, 25, 26. [Google Scholar] [CrossRef]
  14. Zhang, W.; Wang, J. A real-time cycle slip repair method using the multi-epoch geometry-based model. GPS Solut. 2021, 25, 60. [Google Scholar] [CrossRef]
  15. Breitsch, B.; Morton, Y.J. A Batch Algorithm for GNSS Carrier Phase Cycle Slip Correction. IEEE Trans. Geosci. Remote Sens. 2022, 60, 5702224. [Google Scholar] [CrossRef]
  16. Xu, X.; Nie, Z.; Wang, Z.; Zhang, Y. A Modified TurboEdit Cycle-Slip Detection and Correction Method for Dual-Frequency Smartphone GNSS Observation. Sensors 2020, 20, 5756. [Google Scholar] [CrossRef]
  17. Zeng, J.; Geng, J.; Li, G.; Tang, W. Improving cycle slip detection in ambiguity-fixed precise point positioning for kinematic LEO orbit determination. GPS Solut. 2024, 28, 135. [Google Scholar] [CrossRef]
  18. Li, W.; Song, S.; Bai, T.; Cheng, N.; Zhou, W.; Yu, C. Mitigating the impacts of ionospheric irregularities on GPS precise positioning by refined cycle slip threshold. GPS Solut. 2025, 29, 128. [Google Scholar] [CrossRef]
  19. Wei, L.; Haitian, J.; Yuan, H.; NaiYuan, L.; Shengzheng, W. A method for detecting cycle slips in GNSS high-precision positioning for USVs. Ocean Eng. 2024, 313, 119634. [Google Scholar] [CrossRef]
  20. Lee, C.-h.; Kim, E. Cycle Slip Detection of Single-Frequency Measurements in Drone Platforms. Eng. Proc. 2023, 54, 13. [Google Scholar]
  21. Li, Q.; Wang, D.; Wu, J.; Wang, L. New approach for integrity risk evaluation based on expected acceptable region for carrier-phase-based precise relative positioning. GPS Solut. 2025, 29, 70. [Google Scholar] [CrossRef]
  22. Wang, J.; Huang, D. GPS/BDS triple-frequency cycle slip detection and repair based on moving window global search method. Sci. Rep. 2024, 14, 6615. [Google Scholar] [CrossRef]
  23. Xiao, K.; Zhu, X.; Zhang, L.; Sun, F.; Zhou, P.; Li, W. Cycle slip detection and repair method towards multi-frequency BDS-3/INS tightly coupled integration in kinematic surveying. J. Geod. 2024, 98, 111. [Google Scholar] [CrossRef]
  24. Zhen, D.; Knedlik, S.; Loffeld, O. Real-time cycle-slip detection and determination for multiple frequency GNSS. In Proceedings of the 2008 5th Workshop on Positioning, Navigation and Communication, Hannover, Germany, 27 March 2008; pp. 37–43. [Google Scholar]
  25. Liu, Z. A new automated cycle slip detection and repair method for a single dual-frequency GPS receiver. J. Geod. 2011, 85, 171–183. [Google Scholar] [CrossRef]
  26. Nie, S.; Zhao, X.; Chen, J.; Liu, C. A modified cycle slip detection and repair method for Galileo quad/pent-frequency observations. Phys. Scr. 2025, 100, 045009. [Google Scholar] [CrossRef]
  27. Zhou, H.; Wang, L.; Fu, W.; Li, T.; Li, W.; Chen, R. Real-time GNSS triple-frequency cycle slip detection using three optimal linear combinations. GPS Solut. 2023, 27, 142. [Google Scholar] [CrossRef]
  28. Li, B.; Qin, Y.; Li, Z.; Lou, L. Undifferenced Cycle Slip Estimation of Triple-Frequency BeiDou Signals with Ionosphere Prediction. Mar. Geod. 2016, 39, 348–365. [Google Scholar] [CrossRef]
  29. Deng, C.; Cui, J.; Tang, W.; Zou, X.; Shu, L. Reliable real-time triple-frequency cycle slip detection and recovery with adaptive detection thresholds. Meas. Sci. Technol. 2019, 30, 055007. [Google Scholar] [CrossRef]
  30. Zeng, T.; Sui, L.; Xu, Y.; Jia, X.; Xiao, G.; Tian, Y.; Zhang, Q. Real-time triple-frequency cycle slip detection and repair method under ionospheric disturbance validated with BDS data. GPS Solut. 2018, 22, 62. [Google Scholar] [CrossRef]
Figure 1. Technical roadmap based on the proposed IFCV method.
Remotesensing 17 02856 g001
Figure 2. Algorithm flowchart based on the proposed IFCV approach.
Remotesensing 17 02856 g002
Figure 3. Precise relative positioning system architecture.
Remotesensing 17 02856 g003
Figure 4. The base station.
Remotesensing 17 02856 g004
Figure 5. GNSS antenna installation position.
Remotesensing 17 02856 g005
Figure 6. The user station.
Remotesensing 17 02856 g006
Figure 7. Aircraft’s flight trajectory.
Remotesensing 17 02856 g007
Figure 8. The number of visible satellites during the flight.
Remotesensing 17 02856 g008
Figure 9. Test statistic and threshold of Turbo-Edit without cycle slip injection.
Remotesensing 17 02856 g009
Figure 10. Test statistic and threshold of IFCV without cycle slip injection.
Remotesensing 17 02856 g010
Figure 11. Test statistic and threshold of Turbo-Edit with specific cycle slips.
Remotesensing 17 02856 g011
Figure 12. Test statistic and threshold of IFCV with specific cycle slips.
Remotesensing 17 02856 g012
Figure 13. Histogram of randomly injected cycle slips in Scheme C.
Remotesensing 17 02856 g013
Figure 14. Test statistic and threshold of Turbo-Edit with random cycle slips.
Remotesensing 17 02856 g014
Figure 15. Test statistic and threshold of IFCV with random cycle slips.
Remotesensing 17 02856 g015
Figure 16. Three-dimensional positioning error curves with specific cycle slips.
Remotesensing 17 02856 g016
Figure 17. Three-dimensional positioning error curves with specific cycle slips.
Remotesensing 17 02856 g017
Figure 18. Three-dimensional positioning error curves with random cycle slips.
Remotesensing 17 02856 g018
Figure 19. Three-dimensional positioning error curves with random cycle slips.
Remotesensing 17 02856 g019
Figure 20. Computational time distribution with random cycle slips.
Remotesensing 17 02856 g020
Table 1. Comparison of cycle slip false alarm rate (FAR).
Turbo-EditIFCV
Number of total epochs40354035
Number of false alarm epochs440
False alarm rate 1.1%0%
Table 2. Cycle slip detection success rate and MDR with specific cycle slips.
Turbo-EditIFCV
Number of total epochs40354035
Number of successful detection epochs38784035
Detection success rate96.11%100%
Number of missing detection epochs1570
Missing detection rate3.89%0%
Table 3. Cycle slip detection success rate and MDR with random cycle slips.
Turbo-EditIFCV
Number of total epochs40354035
Number of successful detection epochs40344035
Detection success rate99.98%100%
Number of missing detection epochs10
Missing detection rate0.02%0%
Table 4. Relative positioning errors with specific cycle slips.
N Err (cm)E Err (cm)D Err (cm)3D RMSE (cm)
Scheme A6.212.7827.3328.16
Scheme B1.461.434.224.69
Scheme C0.860.682.983.17
Table 5. Relative positioning errors with random cycle slips.
N Err (cm)E Err (cm)D Err (cm)3D RMSE (cm)
Scheme A5.964.8316.4218.12
Scheme B1.161.013.513.83
Scheme C0.860.682.823.02
Table 6. Computational time statistics with random cycle slips.
Maximum (ms)Minimum (ms)Mean (ms)
Turbo-Edit 16.820.351.02
IFCV14.290.320.53
Disclaimer/Publisher’s Note: The statements, opinions and data contained in all publications are solely those of the individual author(s) and contributor(s) and not of MDPI and/or the editor(s). MDPI and/or the editor(s) disclaim responsibility for any injury to people or property resulting from any ideas, methods, instructions or products referred to in the content.