Article

Driving Analyses of the Effects of Climate Change and Human Activity on the Ecological Environmental Quality of the North China Plain

1
School of Surveying and Geoinformation Engineering, East China University of Technology, Nanchang 330013, China
2
Key Laboratory of Mine Environmental Monitoring and Improving Around Poyang Lake of Ministry of Natural Resources, Nanchang 330013, China
3
Key Laboratory of Watershed Ecological Process and Information in Jiangxi Province, Nanchang 330013, China
4
Chinese Academy of Sciences, Beijing 100864, China
5
School of Information and Electronics, Beijing Institute of Technology, Beijing 100081, China
*
Author to whom correspondence should be addressed.
These authors contributed equally to this work.
Remote Sens. 2025, 17(16), 2839; https://doi.org/10.3390/rs17162839
Submission received: 4 July 2025 / Revised: 12 August 2025 / Accepted: 13 August 2025 / Published: 15 August 2025

Abstract

Understanding the dynamic changes in the quality of the ecological environment and its potential driving forces is essential for protecting regional ecosystems and promoting sustainable development. In this study, we developed an improved remote sensing ecological index (IRSEI) by integrating the kernel normalized difference vegetation index (kNDVI) with an abundance index (AI) and conducted a comprehensive analysis of the spatiotemporal evolution of the quality of the ecological environment in the North China Plain (NCP) from 2000 to 2020. A multistep driving analysis framework was established to identify key climatic factors via the XGBoost algorithm and to quantify the effects of climate change and human activities through partial correlation analysis and a multiple regression residual model. The results indicate the following: (1) From 2000 to 2020, the ecological quality of the NCP significantly improved, with the average IRSEI increasing from 0.41 to 0.45. The proportion of areas with “good” or “excellent” ecological quality increased, revealing a south–north gradient, with higher values in the southern part and lower values in the northern part of the NCP. (2) Among the key climatic variables, surface temperature was significantly negatively correlated with the IRSEI, whereas atmospheric pressure and evapotranspiration were significantly positively correlated. (3) Approximately 51.97% of the ecological quality changes were jointly driven by climate change and human activities, with the contribution of human activities (28.80%) exceeding that of climate change (19.23%). These findings provide a scientific basis for understanding the driving mechanisms behind ecological environment changes and support ecological restoration and coordinated human–environment development in the context of climate change.

1. Introduction

The North China Plain (NCP) serves as a crucial ecological barrier and economic core region in northern China [1], playing a vital role in national food security, regional economic growth, and public well-being. As a climate-sensitive area and a pivotal link between the eastern and western regions, the ecological environment profoundly influences development patterns and the efficiency of resource allocation [2]. A region’s rich biodiversity and vital ecosystem services are fundamental to maintaining ecological balance and promoting sustainable development [3]. Scientifically assessing the quality of the ecological environment of the NCP is crucial for understanding the mechanisms of climate change response, optimizing resource allocation, and serving as a key pathway for ensuring food security, preserving ecological barriers, and advancing the construction of a beautiful China.
With the advancement of remote sensing technology, multisource remote sensing data, which are characterized by wide spatial coverage and long-term observations, have provided a novel technical approach for assessing the ecological environment [4,5]. Early assessments of ecological conditions primarily relied on single remote sensing indices [6,7], which, although capable of reflecting certain local ecological characteristics, failed to represent the overall regional ecological status. In response, researchers have proposed comprehensive evaluation frameworks, such as the ecological index (EI) and the pressure–state–response (PSR) model [8,9]. However, these methods face challenges, including data integration difficulties, subjectivity in index weighting, and limited regional adaptability. To address these issues, Xu [10] introduced the remote sensing ecological index (RSEI), which integrates greenness, wetness, dryness, and heat indicators via principal component analysis (PCA). This approach reduces subjective interference through dimensionality reduction and feature extraction and has been widely applied because of its objectivity and stability [11,12]. Nevertheless, the RSEI has certain limitations. The normalized difference vegetation index (NDVI), a core component of the RSEI, is prone to saturation in areas with high vegetation cover [13,14]. Furthermore, as a generalized index, the RSEI often shows reduced performance in ecosystems with complex structures and high biodiversity, such as forests and wetlands, resulting in distorted evaluations [15]. To improve assessment accuracy, this study proposes an improved remote sensing ecological index (IRSEI). To address the saturation problem of the NDVI in densely vegetated areas, the kernel normalized difference vegetation index (kNDVI) [16], known for its strong robustness and resistance to saturation, is introduced as a substitute to increase vegetation monitoring accuracy. Additionally, to enrich the ecological meaning of the index, an abundance index (AI) is incorporated on the basis of the EI framework [17], capturing aspects of biological abundance. The construction of the IRSEI enhances the adaptability of the index to complex ecosystems and provides a more reliable technical foundation for dynamic ecological monitoring and scientific research.
Spatial heterogeneity, often referred to as the second law of geography [18], plays a critical role in understanding the evolution of the quality of the ecological environment. Investigating the driving mechanisms behind such spatial heterogeneity holds significant scientific value. Climate change and human activities have been widely recognized as the primary drivers affecting the ecological environment [19]. Previous studies have employed geographic detectors to quantify the explanatory power of climatic factors for spatial differentiation [20], structural equation modeling (SEM) to examine direct and indirect effects [21], and machine learning methods to evaluate the contributions of various factors [22]. Existing studies have predominantly focused on the individual effects of various factors, lacking a systematic analysis of the combined driving mechanisms of climate change and human activities. Traditional machine learning algorithms often struggle to meet the demands of large-scale, long-term ecological studies, particularly in analyzing the complex roles of climatic drivers [23]. Under the context of climate change, the effects of multiple climatic factors on regional ecological environment quality are inherently complex. Traditional methods often exhibit limited explanatory power and fail to adequately capture the intricate relationships within such datasets. To address these limitations, machine learning models such as Random Forest have been applied; however, these approaches typically require considerable computational resources and large datasets for large-scale applications, and they still encounter difficulties in effectively interpreting nonlinear relationships. In contrast, XGBoost offers distinct advantages, including efficient processing of high-dimensional, nonlinear datasets with multicollinearity, reduced demands on computational resources and data, and enhanced interpretability of nonlinear interactions [24]. Furthermore, it demonstrates superior capacity to capture complex driving mechanisms and improve predictive accuracy, yet its results require interpretation through statistical methods [25]. Partial correlation analysis can control for the influence of other variables [26], enabling more accurate identification of the true relationships between specific drivers and ecological outcomes. Moreover, residual analysis based on multiple regression is commonly used to quantify the combined influence of climate change and human activities on vegetation [27]. However, traditional residual analysis is often simplified into a bivariate model of temperature and precipitation [28], which overlooks the locational characteristics of the study area and the roles of other climatic factors. To overcome these limitations, this study proposes a multistep analytical framework for disentangling driving forces. This framework integrates XGBoost for key factor identification, partial correlation analysis for isolating individual factor effects, and multiple regression residual analysis for separating the contributions of climate change and human activities. By combining the strengths of machine learning and traditional statistical approaches, this integrated method ensures both accuracy and interpretability, offering a systematic approach to uncover the driving mechanisms of ecological environment change in the NCP.
This study utilizes the Google Earth Engine (GEE) platform to calculate the improved remote sensing ecological index (IRSEI) and establishes a multistep driving force analysis framework with the following objectives: (1) to investigate the spatiotemporal evolution of the IRSEI in the NCP from 2000 to 2020; (2) to clarify the relative importance of various climatic factors affecting ecological environment changes in the study area and quantify the driving effects of key climatic variables on ecological quality; and (3) to reveal the driving mechanisms of ecological change under the combined influences of climate change and human activities. Conducting ecological environment quality research in this region is highly important for maintaining ecosystem balance, conserving biodiversity, and actively responding to climate change.

2. Materials and Methods

2.1. Study Area

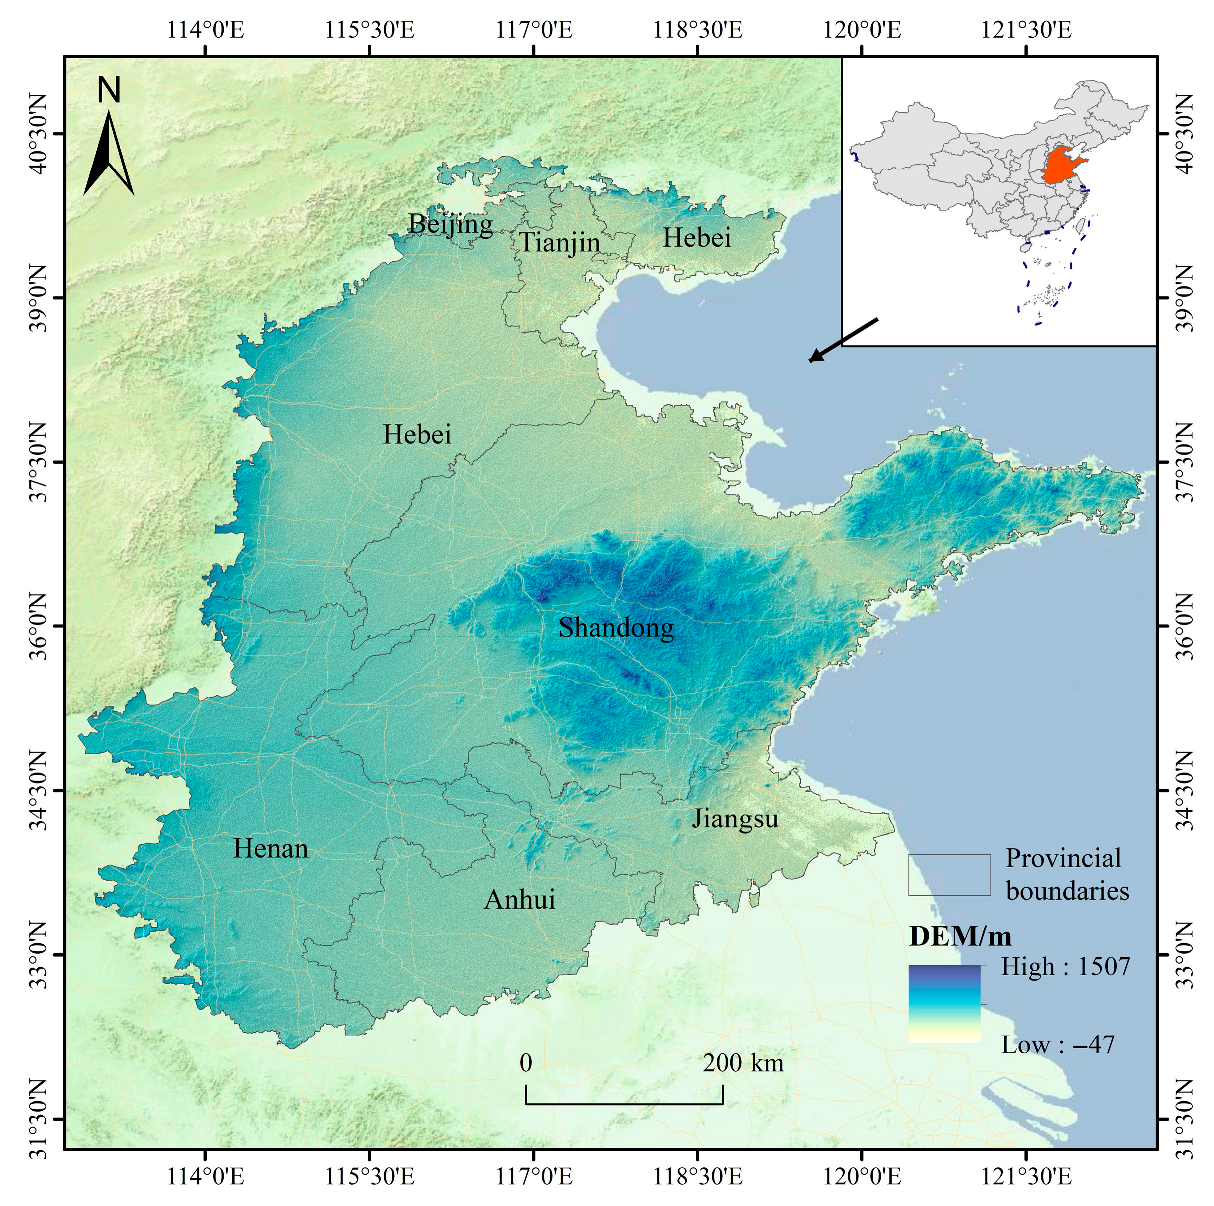
The NCP (Figure 1) is located in eastern China and spans from approximately 32°N to 40°N and 114°E to 121°E. It is bounded by the Yanshan Mountains to the north, the Huai River to the south, the Bohai Sea and Yellow Sea to the east, and the Taihang Mountains to the west. Characterized by flat terrain and fertile soils, the region has a temperate monsoon climate, making it highly suitable for agricultural activities [29]. As a major grain-producing area and one of the most densely populated regions in China, the North China Plain has long experienced high ecological pressure due to rapid urbanization and intensive farmland reclamation [30], resulting in a fragile ecosystem. Investigating the ecological environment quality of this region can provide a scientific basis for sustainable regional development and the formulation of effective ecological conservation strategies. Furthermore, the findings may offer valuable insights for ecological assessments in other regions.

2.2. Methodology

In this study, the IRSEI is calculated via the GEE platform, MODIS data, and land use data to quantify the quality of the ecological environment in the NCP and analyze its spatial and temporal variations. Second, a multistep driving analysis framework was established to identify and quantify the driving forces of ecological environment quality. The detailed workflow is illustrated in Figure 2.

2.3. Remote Sensing Data and Preprocessing

The datasets used in this study include MODIS imagery, land use data, the vector boundary of the North China Plain (NCP), and climatic driving factors, as detailed in Table 1. MODIS data from June to September during the period 2000–2020 were selected, and preprocessing steps—such as cloud removal, water masking, and spatial cropping—were conducted on the GEE platform. All MODIS data were resampled to a spatial resolution of 1 km using bilinear interpolation. The NCP boundary was derived from the delineated crop cultivation area. Climate data with relatively coarse resolutions were interpolated via the kriging method and subsequently resampled and clipped to a 1 km resolution. All vector and raster datasets were projected to the WGS 1984 UTM Zone 50 N coordinate system to ensure spatial consistency.

2.4. Improved RSEI Indicator Construction

The remote sensing ecological index (RSEI), developed by Xu, is used to quantify ecological environmental quality by integrating four key indicators: greenness, wetness, heat, and dryness [31], as detailed below.
RSEI = f(NDVI,WET,NDBSI,LST)
where the RSEI is the remote sensing ecological index; the NDVI is the normalized difference vegetation index; the WET is the humidity component derived from the tasseled cap transformation; the NDBSI refers to the normalized difference built-up soil index; and LST denotes the land surface temperature.
The kNDVI was employed in place of the traditional NDVI to represent the greenness component. The wetness indicator (WET) was derived from the tasseled cap transformation. The dryness indicator, the normalized difference building-soil index (NDBSI), was constructed by integrating the soil index (SI) and the index-based built-up index (IBI), effectively capturing surface dryness conditions. Land surface temperature (LST) was used as the heat component, while the abundance index (AI) was introduced to represent biological richness. These components collectively form the basis of the improved remote sensing ecological index (IRSEI), as illustrated in Equation (2).
IRSEI = f(kNDVI,WET,NDBSI,LST,AI)
where the IRSEI is the improved remote sensing ecological index, the kNDVI is the kernel normalized difference vegetation index, and the AI refers to the abundance index.
Specifically, the kNDVI exhibits enhanced robustness and stability across various latitudes and climatic zones, significantly outperforming traditional vegetation indices such as the NDVI in monitoring vegetation dynamics. Therefore, the kNDVI was selected as the greenness component in this study. The abundance index (AI), derived from China’s land cover dataset (CLCD), possesses strong ecological relevance and serves as a critical indicator of ecosystem status. However, the AI is not included in the original RSEI model. Accordingly, on the basis of the Technical Specifications for Ecological Environment Status Evaluation (HJ 192-2015) and the relevant literature [32], the AI was computed from land use data and incorporated into the IRSEI framework. The specific formulation of the index is provided in Table 2.
To account for the differences in scale and units among the indicators, all the ecological variables were normalized to a dimensionless range of [0, 1]. Principal component analysis (PCA) was then applied to integrate these indicators, with the first principal component (PC1) selected to represent the overall ecological index. The resulting IRSEI values were subsequently normalized again to a scale of 0–1, where higher values indicate better ecological quality and lower values reflect poorer conditions. According to the Technical Specifications for Ecological Environment Status Evaluation (HJ 192-2015) and existing ecological quality classification standards [33], the IRSEI values were categorized into five intervals: [0, 0.2), [0.2, 0.4), [0.4, 0.6), [0.6, 0.8), and [0.8, 1.0], corresponding to the ecological quality levels of “Poor”, “Fair”, “Moderate”, “Good”, and “Excellent”, respectively.
The ecological quality index (EQI) was formally introduced in the Technical Guidelines for the Assessment of Beautiful China Initiative (GB/T 44056-2024) [34], issued in 2024. By integrating multiple ecological factors, the EQI quantitatively reflects the overall quality and health of ecosystems. As a comprehensive ecological assessment tool, it plays a significant role in ecological research, land management, and environmental protection. Although the construction of the RSEI primarily draws upon the framework of the ecological index (EI), the EQI has become a core metric in the evaluation system for the Beautiful China initiative. Therefore, in this study, a comparative analysis between the IRSEI and EQI was conducted to further validate the rationality and applicability of the IRSEI, For comparability, the EQI was normalized to a dimensionless scale ranging from 0 to 1, as illustrated in Equation (3).
EQI = (LAI + FVC + GPP)/3 * 100
where LAI is the leaf area index, FVC is the fraction of vegetation cover, and GPP is gross primary productivity.

2.5. Spatiotemporal Change Analysis of Ecological Environmental Quality

The Theil–Sen median method is a robust, nonparametric approach for estimating monotonic trends, whereas the Mann–Kendall (MK) test is a widely used nonparametric statistical method that does not require assumptions of normality or linearity. The combination of the Theil–Sen estimator and the Mann–Kendall test is commonly employed for trend analysis in long-term time series data [35]. The IRSEI data used in this study were aggregated to an annual scale, thereby substantially reducing the influence of autocorrelation on trend detection. Although the modified Mann–Kendall (MK) test has advantages in addressing autocorrelated data [36], for methodological robustness, the combination of Theil–Sen median estimation with the traditional MK test was considered more appropriate. The corresponding equations are presented as follows:
β = m e d i a n ( x j x i j i ) , j > i
where x i and x j are the ith and the jth time series data, respectively; β is the slope of the linear trend; β greater than 0 indicates an increasing trend in ecological quality; and β less than 0 indicates a decreasing trend in ecological quality.
Z = S / V a r S ( S > 0 ) 0 ( S = 0 ) ( S + 1 ) / V a r S ( S < 0 )
S = i = 1 n 1 j = i + 1 n s i g n x j x i
V a r ( S ) = n ( n 1 ) ( 2 n + 5 ) / 18
where Z is the standardized statistic; var(S) is the variance; and n is the number of data points in the series.
To better study the trend of the IRSEI, the trend of the IRSEI was categorized into 9 classes with reference to previous studies [37], as shown in Table 3.

2.6. Multistep Driven Analysis Framework

To systematically investigate the driving mechanisms of climate change and human activities on the quality of the ecological environment, this study develops a multistep driving analysis framework based on XGBoost, partial correlation analysis, and multiple linear regression residual modeling. Specifically, (1) XGBoost is employed to identify key climatic factors influencing ecological quality; (2) partial correlation analysis is used to quantify the independent effects and directions of these key factors; and (3) a multiple linear regression residual model is constructed using the selected climatic variables to separate and quantify the respective contributions of climate change and human activities. This framework provides an in-depth understanding of the driving forces shaping the quality of the ecological environment in the NCP.

2.6.1. Importance Analysis of Climate Factors

Extreme gradient boosting (XGBoost) was used to evaluate the importance of each climatic factor in determining ecosystem quality by calculating the tree gain (Gain). During the construction of each decision tree, XGBoost assesses how much each climatic variable contributes to the reduction in the objective function’s loss—namely, the prediction error of the IRSEI—when splitting nodes. The algorithm selects the variable that maximizes the information gain for each split [38]. The gain attributed to each climatic factor is determined by the magnitude of loss reduction it achieves within each tree, and these gains are cumulatively aggregated across all trees to derive the total contribution of each factor to the IRSEI model, thereby quantifying its overall importance.

2.6.2. Correlation Analysis of Factors

Simple correlation analysis may fail to accurately capture the interrelationships among variables. In contrast, partial correlation analysis enables the examination of the relationship between two variables [39] while controlling for the influence of other confounding variables. This method helps reveal the true underlying associations between variables and is calculated via the following equation:
R x y = i = 1 n x i x ¯ y i y ¯ / ( i = 1 n x i x ¯ 2 i = 1 n y i y ¯ 2 )
R x y , z = ( R x y R x z R y z ) / ( 1 R x z 2 1 R y z 2 )
where x i and y i are the values of the two variables in year I; x and y are the mean values of the two variables in the first year; R x y , z is the partial correlation coefficient between the dependent variable x and the independent variable y under the condition that the independent variable z is fixed; and R x z and R y z are the correlation coefficients between the two variables.

2.6.3. Separating the Impacts of Climate Change and Human Activity

Previous studies have demonstrated that changes in the quality of the ecological environment of the NCP are driven primarily by climatic factors and the intensity of human activities [40]. Residual analysis based on multiple regression models is widely used to quantitatively distinguish the impacts of climate change and human activities on vegetation dynamics [41]. Building upon the outputs of the XGBoost model, a multiple linear regression approach was employed, wherein residual analysis was used to separate the effects of climatic variables from anthropogenic influences on ecological quality. Under the assumption of no other external drivers, the regression model captures the relationship between selected climate variables and the IRSEI, with the residuals—representing the difference between observed and predicted IRSEI values—attributed to human activities [42]. Specifically, the IRSEI was used as the dependent variable, whereas land surface temperature (LST), atmospheric pressure (AP), potential evapotranspiration (PET), and precipitation (PRE) served as independent variables in constructing the regression model. The predicted IRSEI values thus reflect the influence of climate change. The residuals were then utilized to evaluate the contributions of human activities, and the respective driving forces of climate change and anthropogenic activities were quantified by analyzing the temporal trends of these residuals.
IRSEICC = a * LST + b * AP + c * PET + d * PRE + e
IRSEIHA = IRSEIobs − IRSEICC
where IRSEICC, IRSEIobs, and IRSEIHA represent the IRSEI predicted, the IRSEI observed, and the IRSEI residual values, respectively, and a, b, c, d, and e represent the regression model parameters.

2.6.4. Determination of Driving Factors and Their Impacts

The trend rates of IRSEICC and IRSEIHA were calculated according to Equations (10) and (11), which illustrate the IRSEI change trends during the growing season under the influences of climate change (CC) and human activities (HAs) [43], respectively. A positive β (>0) indicates that climate change or human activities contribute to an improvement in ecological quality, whereas a negative β (<0) suggests a deterioration in ecological quality. The dominant driving forces behind the IRSEI changes in the NCP were identified, as summarized in Table 4, and the relative contributions of climate change and human activities to these changes were quantitatively assessed.

3. Results

3.1. Model Rationality

As a remote sensing ecological quality assessment model, the improved IRSEI integrates five key indicators—greenness, wetness, heat, dryness, and biological abundance—via principal component analysis (PCA). This approach enables an objective reflection of regional ecological quality while avoiding the uncertainties associated with subjective weighting schemes. As shown in Table 5, the contribution rate of the first principal component (PC1) consistently exceeds 75%, indicating high stability and strong information concentration in PC1, which captures the majority of the variance among the five indicators. Among the component loadings, the kNDVI, WET, and AI exhibit positive loadings, whereas LST and the NDBSI show negative loadings. Notably, the kNDVI and NDBSI have the highest absolute loadings, suggesting that greenness and dryness are the most effective indicators for characterizing the ecological quality of the NCP. Although the AI has relatively low positive loading, it plays an important complementary role in the multidimensional assessment system. Overall, the IRSEI constructed via PCA effectively captures the ecological quality of the NCP. The evaluation results are consistent with actual ecological conditions [44], confirming the model’s scientific validity and accuracy.
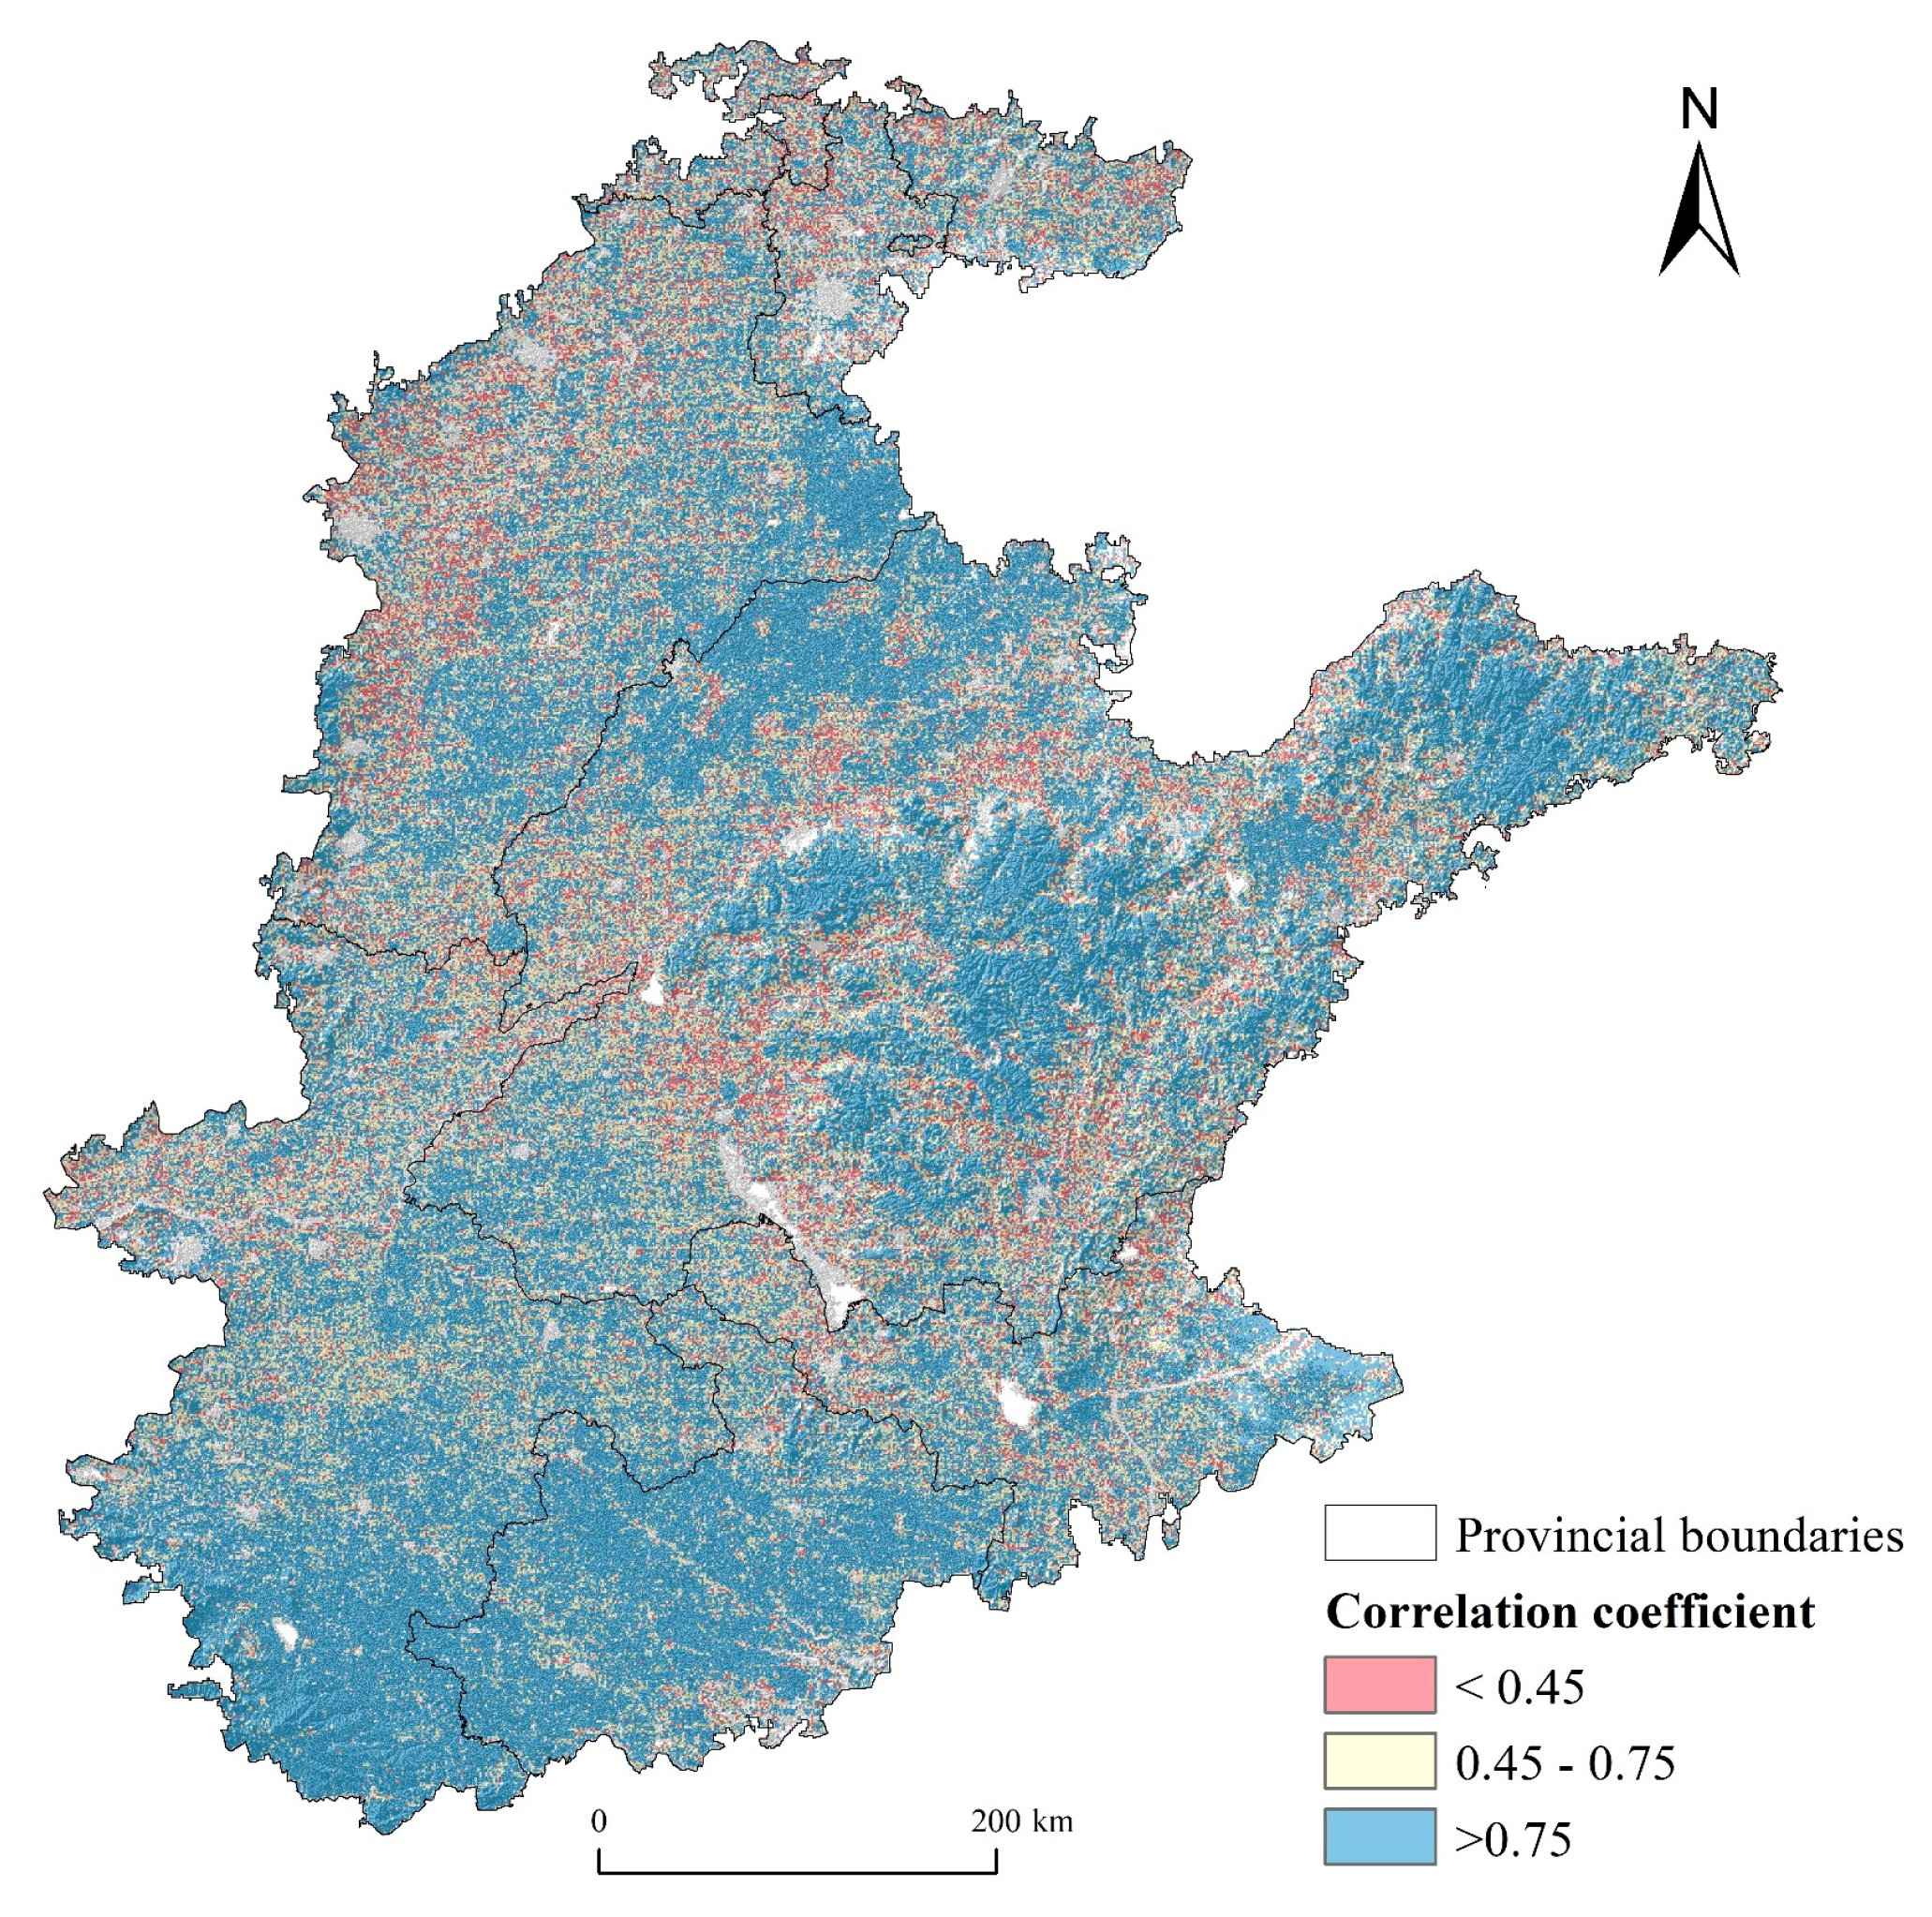
To evaluate the reliability of the IRSEI model, the correlation between the RSEI and IRSEI was examined (Figure 3). The results indicated a Pearson correlation coefficient of 0.82 and an R2 of 0.72, suggesting a strong and significant relationship between the two indices. Spatially, the correlation coefficients were generally high, except in the central plains, parts of cultivated land and forest in the northern region, and around the Taishan Mountains, where values dropped below 0.45. This reduction is primarily attributed to NDVI saturation in dense vegetation areas, which causes the RSEI to underestimate ecological quality. In contrast, the IRSEI incorporates the kNDVI to mitigate this saturation effect, enabling a more accurate representation of vegetation coverage. Furthermore, in areas near the northern Taihang Mountains and parts of the Taishan Mountains, the newly introduced abundance index in the IRSEI better reflects biodiversity richness, thereby enhancing ecological quality assessment accuracy.
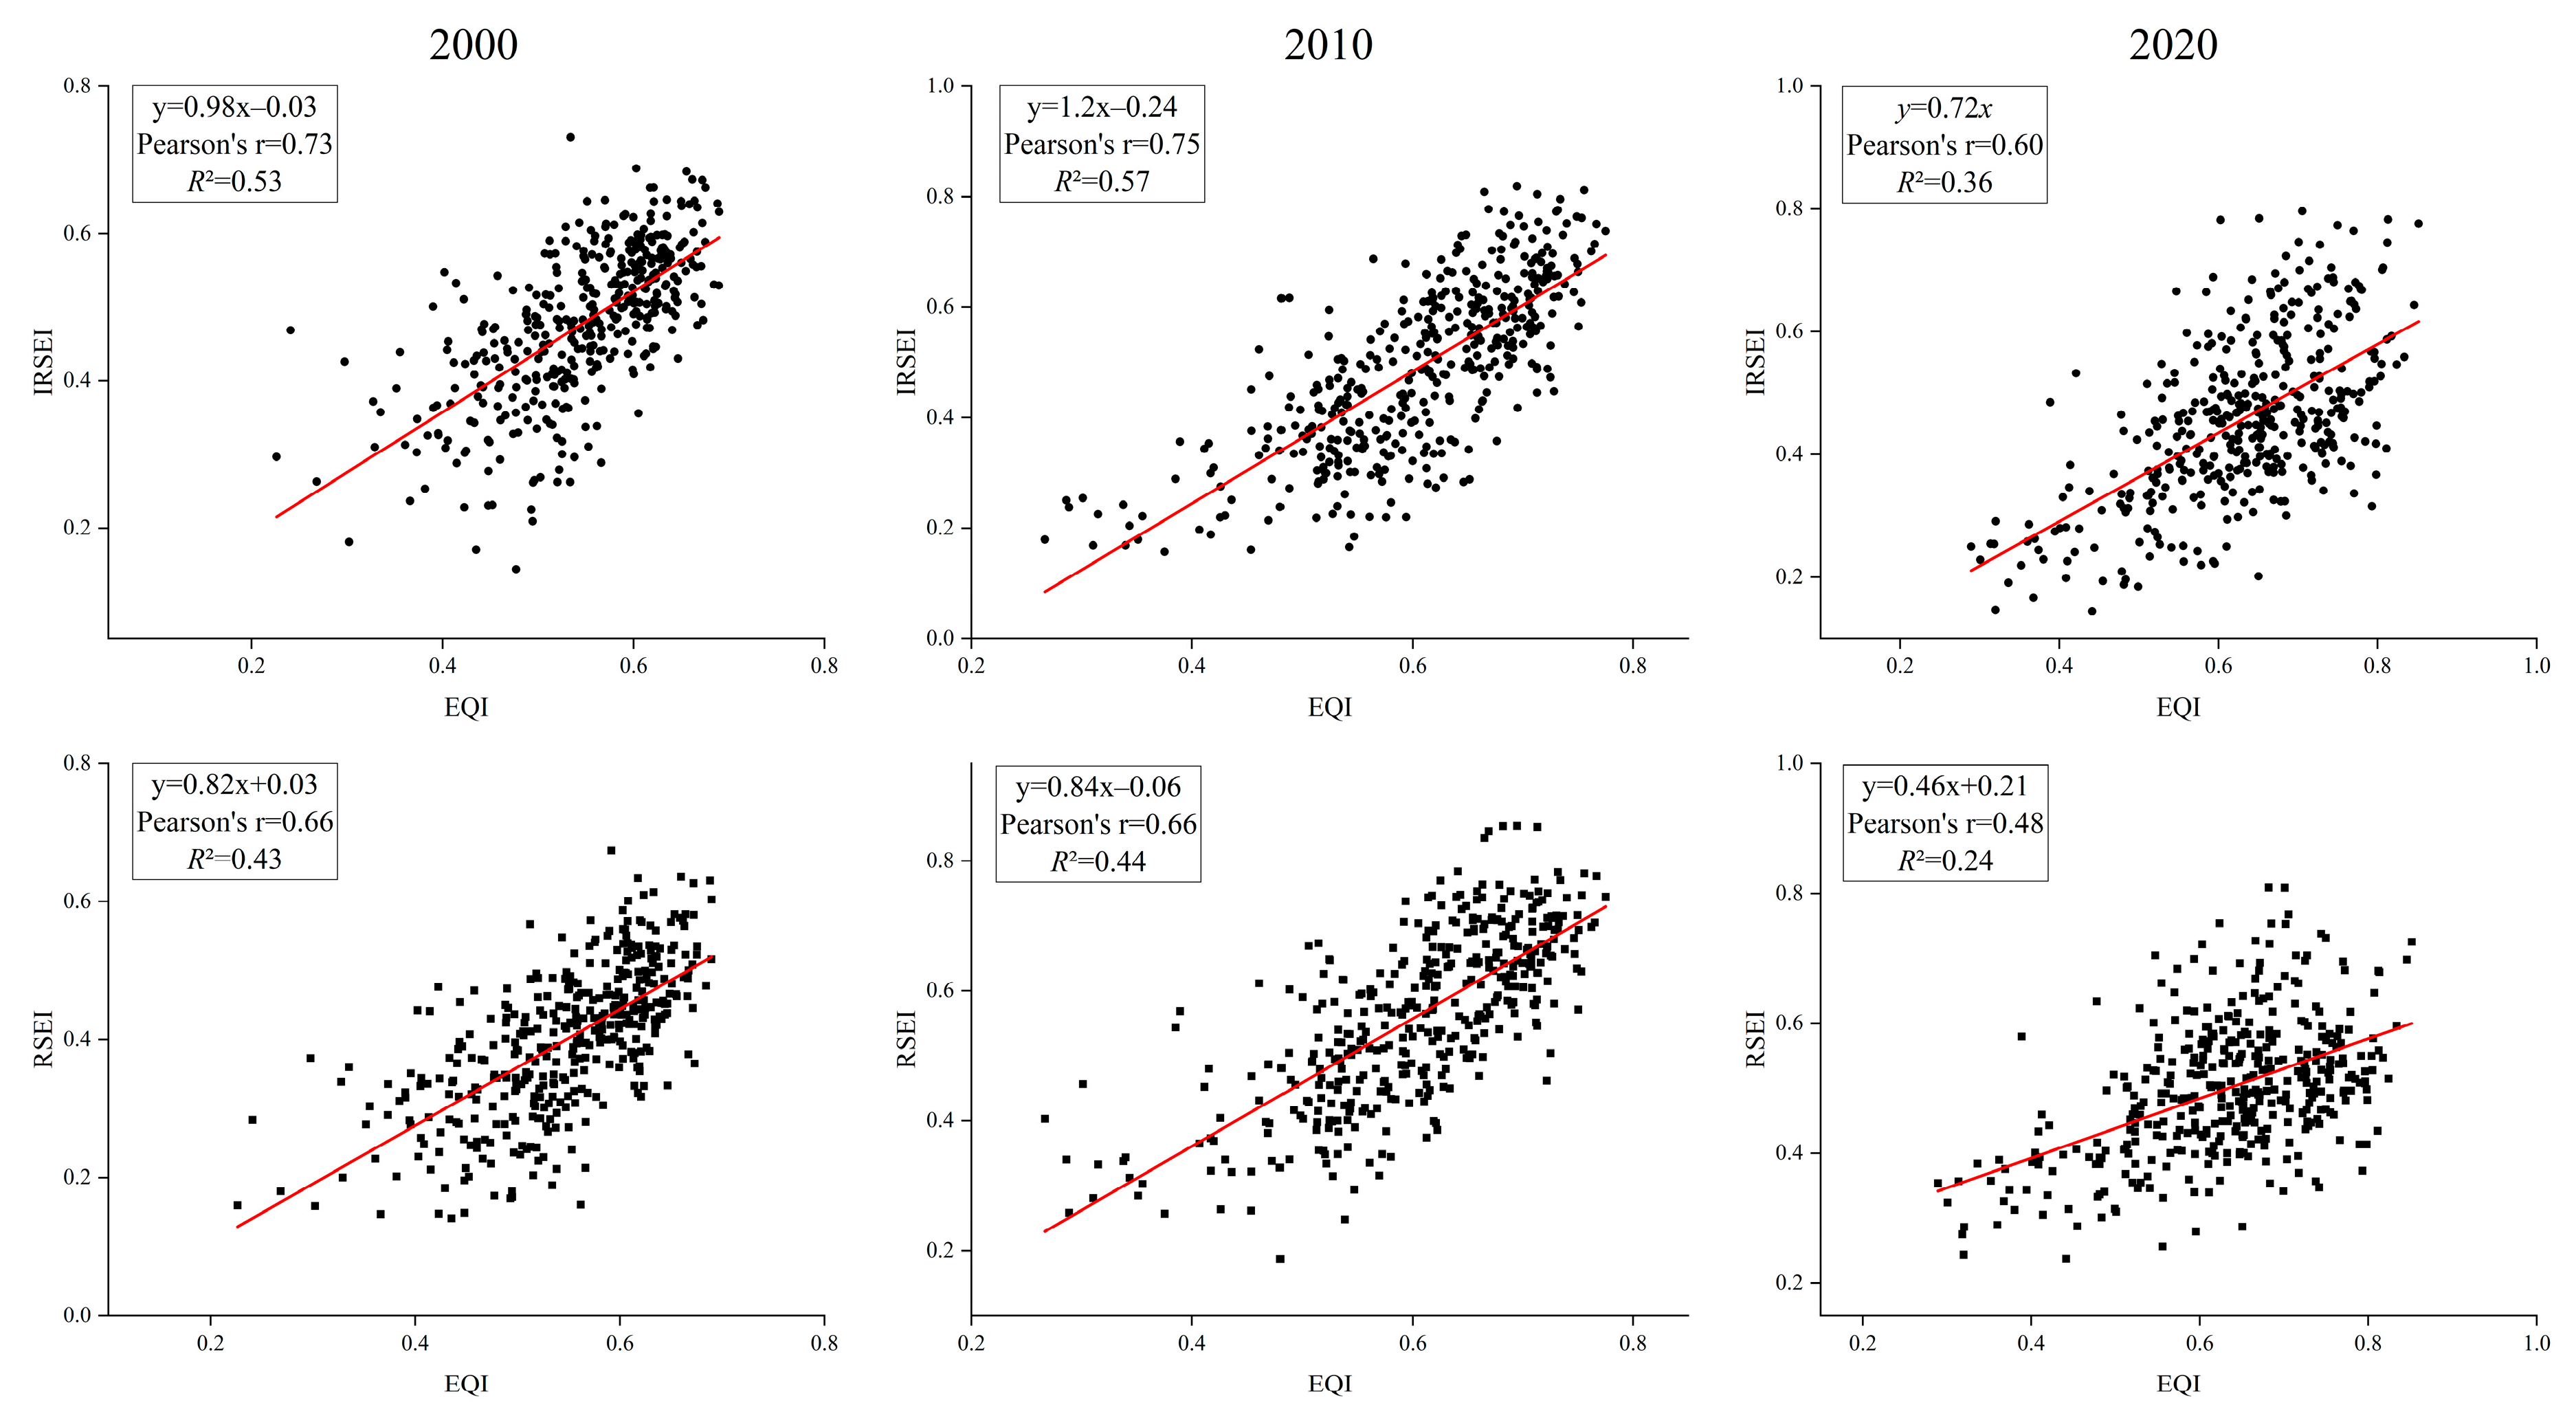
Figure 4 presents the correlation between the EQI and both the IRSEI and RSEI based on random point sampling. Comparing the Pearson correlation coefficients for the EQI with the two indices in 2000, 2010, and 2020 reveals that IRSEI consistently outperformed RSEI, with values of 0.73, 0.75, and 0.60, compared to 0.66, 0.66, and 0.48, respectively, indicating a higher and more stable response of the IRSEI to EQI, particularly evident in 2010. Regarding the determination coefficients, the IRSEI achieved values of 0.53, 0.57, and 0.36, exceeding RSEI’s 0.43, 0.44, and 0.24, demonstrating its superior explanatory power for EQI variability. Regression analysis further shows that the slopes of the IRSEI regressions were consistently higher and closer to 1 than those of the RSEI across all years, suggesting that the IRSEI provides more accurate estimates of ecological environment quality.
Several improved versions of the RSEI model have been proposed, resulting in derivative models such as the MRSEI, NRSEI, and DRSEI [45]. These models typically address specific ecological issues or regional characteristics by incorporating factors such as air quality, drought, salinization, or nonlinear features. They offer advantages in ecological assessments tailored to particular contexts, enabling more precise characterization of ecological conditions in those scenarios. However, their evaluation metrics are often highly dependent on regional background, leading to reduced explanatory power and limited generalizability, which constrains their application across diverse ecological types. In contrast, the IRSEI developed in this study is designed as a generalized ecological quality assessment model applicable to multi-ecotype regions; therefore, direct comparison with these scenario-specific models is not necessary.
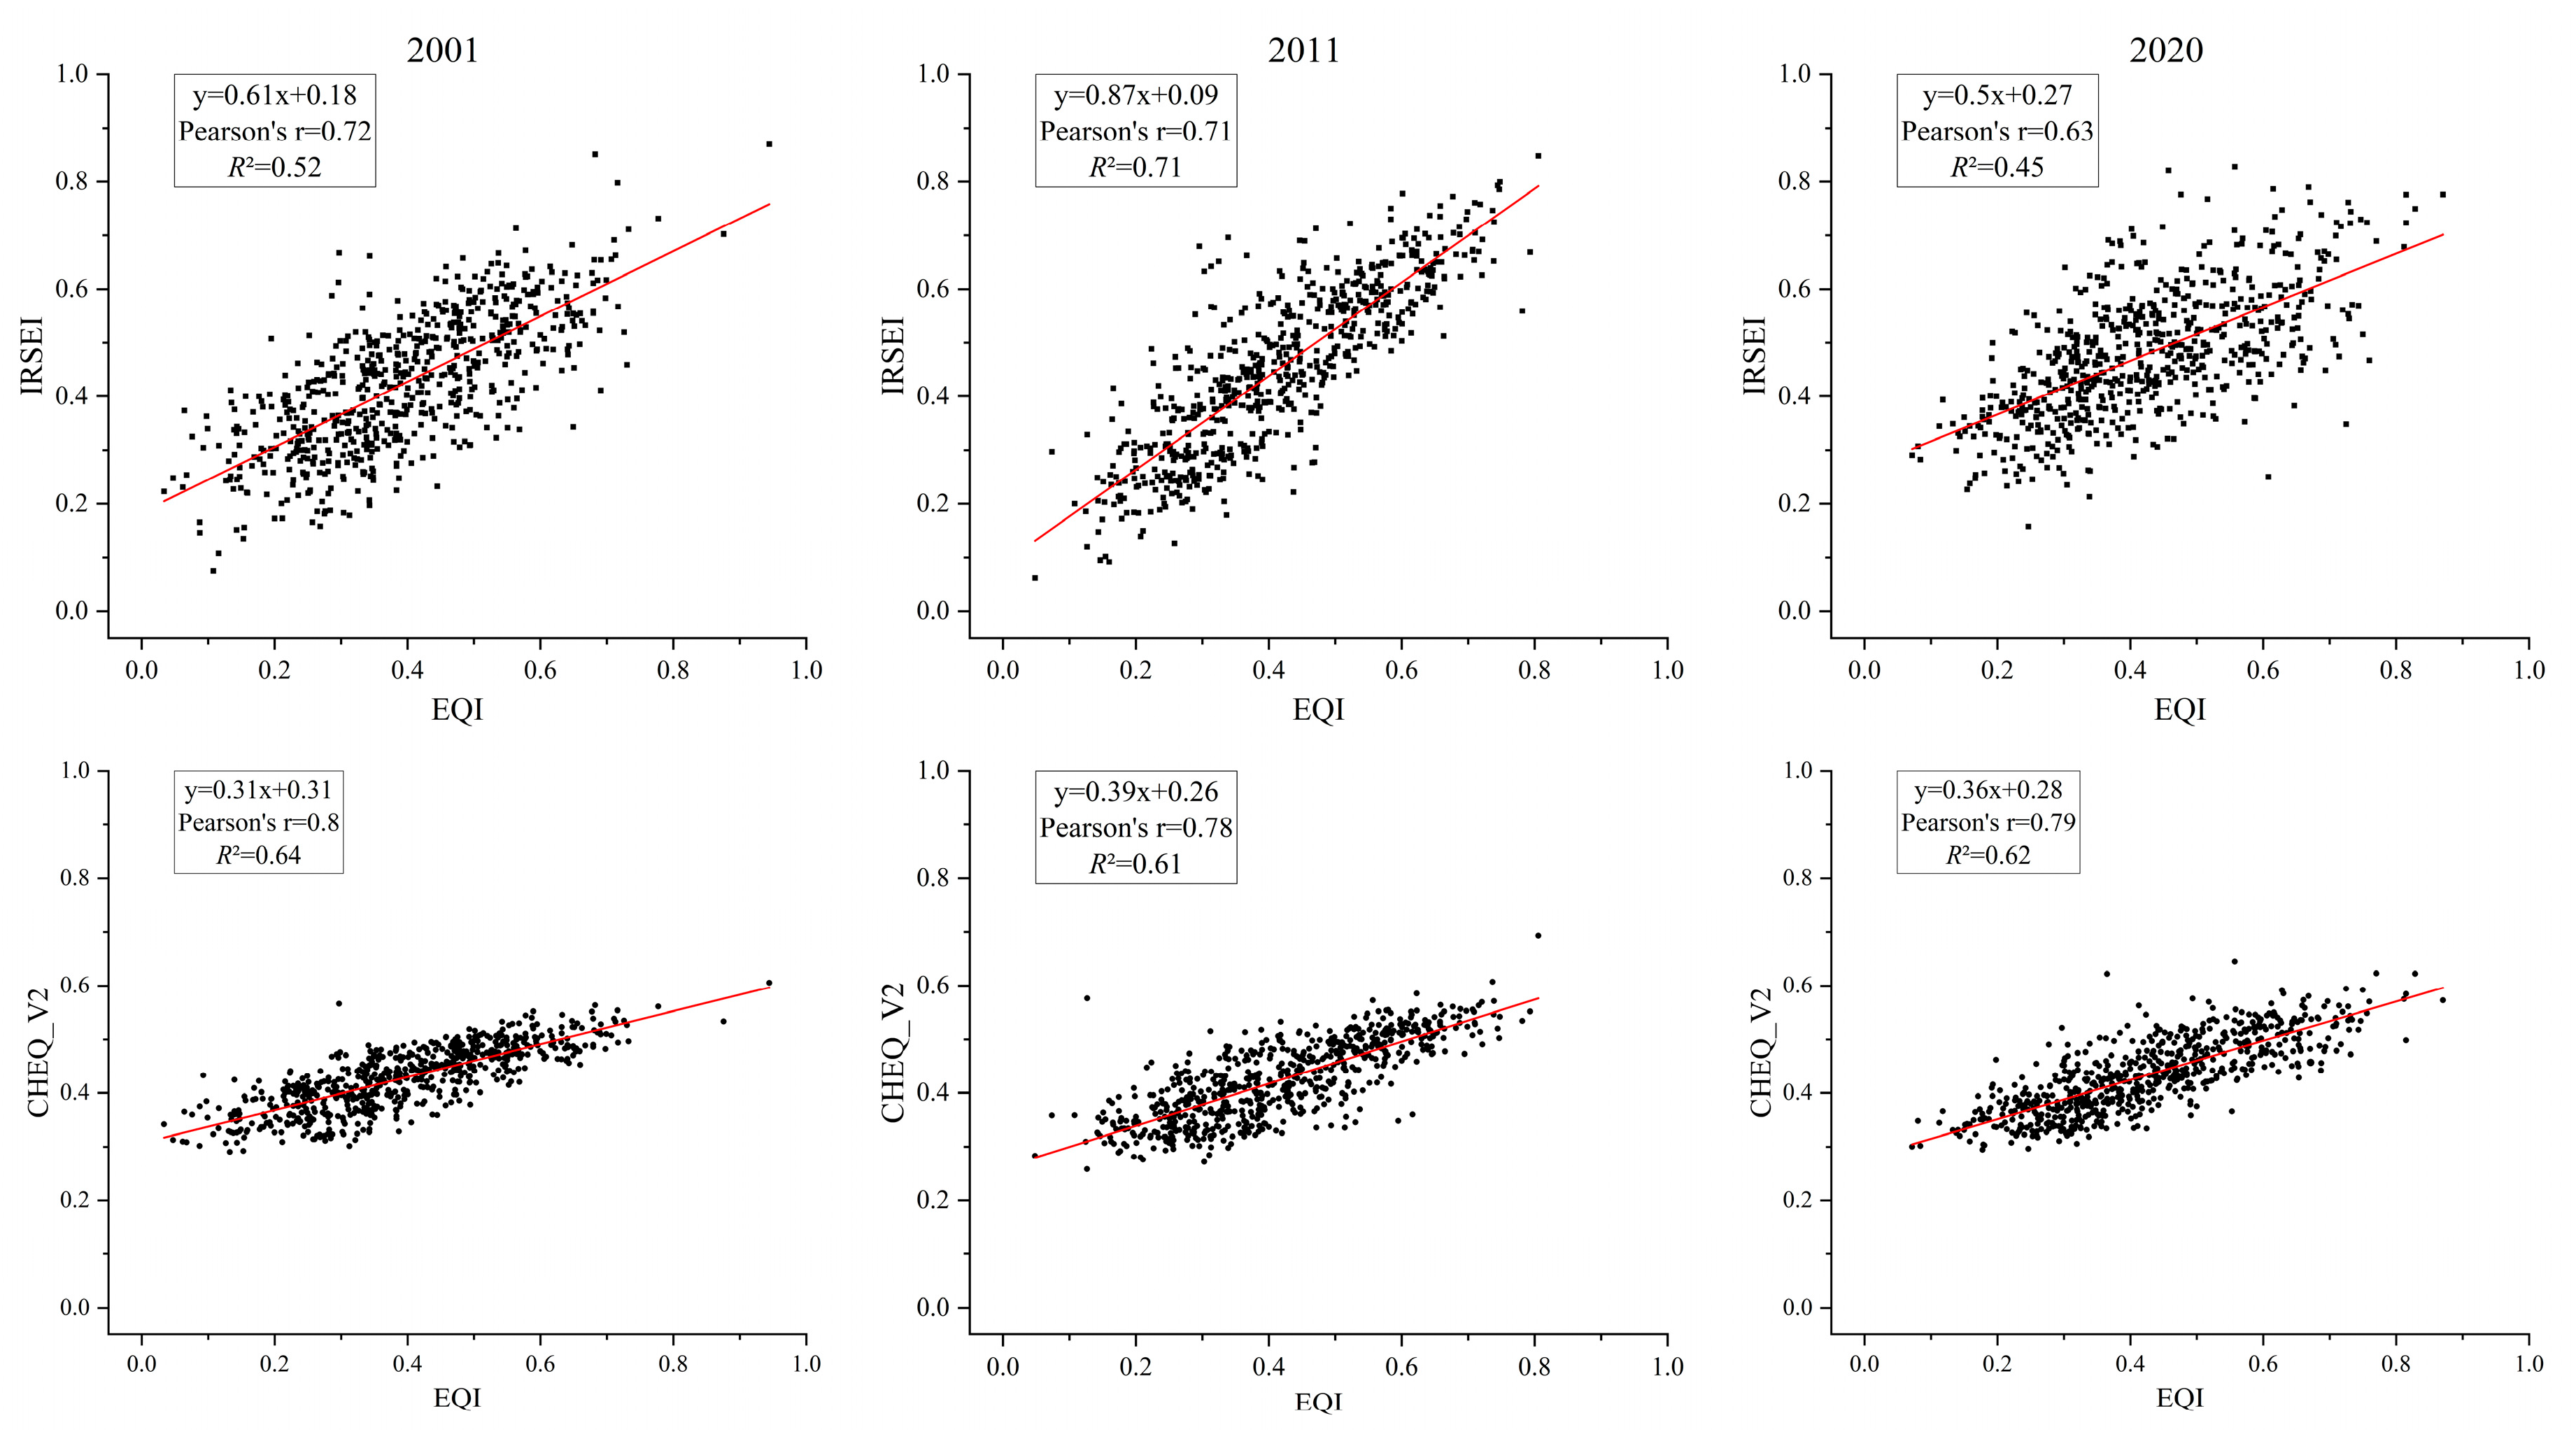
The China Historical High-resolution Ecological Quality (CHEQ) dataset [46], specifically developed for a regional-scale ecological assessment in China, provides a comprehensive and accurate representation of regional ecological characteristics. In this study, the evaluation results of CHEQ and the IRSEI were compared using randomly sampled points (Figure 5). CHEQ exhibited high correlation and goodness-of-fit across the three selected years, with slightly better fitting performance than the IRSEI overall. However, its regression slopes were consistently below 0.4 for all years, indicating a systematic overestimation bias, particularly underestimating the EQI in medium to high ecological quality areas. This bias is primarily attributed to CHEQ’s heavy reliance on the NDVI, which tends to saturation in densely vegetated regions, thereby failing to adequately reflect true ecological quality. By contrast, although the IRSEI demonstrated slightly lower goodness-of-fit in some years, its regression slopes were consistently closer to 1, reaching 0.87 in 2011, suggesting that it more accurately captures EQI variation magnitudes and objectively reflects actual ecological environment quality.
In summary, the IRSEI model proposed in this study enhances monitoring accuracy in biodiversity-rich regions by incorporating the kNDVI and abundance index (AI) while retaining the generalizability and operability of the original RSEI. It achieves comprehensive characterization of regional ecological environment quality and demonstrates superior adaptability and stability, particularly in densely vegetated and mountainous areas. This makes the IRSEI a more robust and representative alternative indicator for ecological quality monitoring in the NCP.

3.2. Ecological Quality of the North China Plain

Table 6 presents the statistical characteristics of the IRSEI in the NCP from 2000 to 2020. The analysis revealed that the mean IRSEI increased from 0.40 in 2000 to 0.45 in 2020, accompanied by a rise in the median from 0.41 to 0.45, indicating an overall improvement in ecological quality across the region. However, the standard deviation also increased from 0.12 to 0.14, suggesting a growing spatial disparity in ecological conditions. The kurtosis value decreased from −0.19 to −0.31, reflecting a flatter and more dispersed distribution of IRSEI values, with fewer extreme observations. Moreover, the skewness shifted from −0.11 to 0.15, indicating a transition to a right-skewed distribution, with a higher frequency of extreme values at the upper end. In summary, while the ecological quality of the NCP has notably improved over the past two decades, the spatial heterogeneity and distribution asymmetry of the IRSEI have intensified.
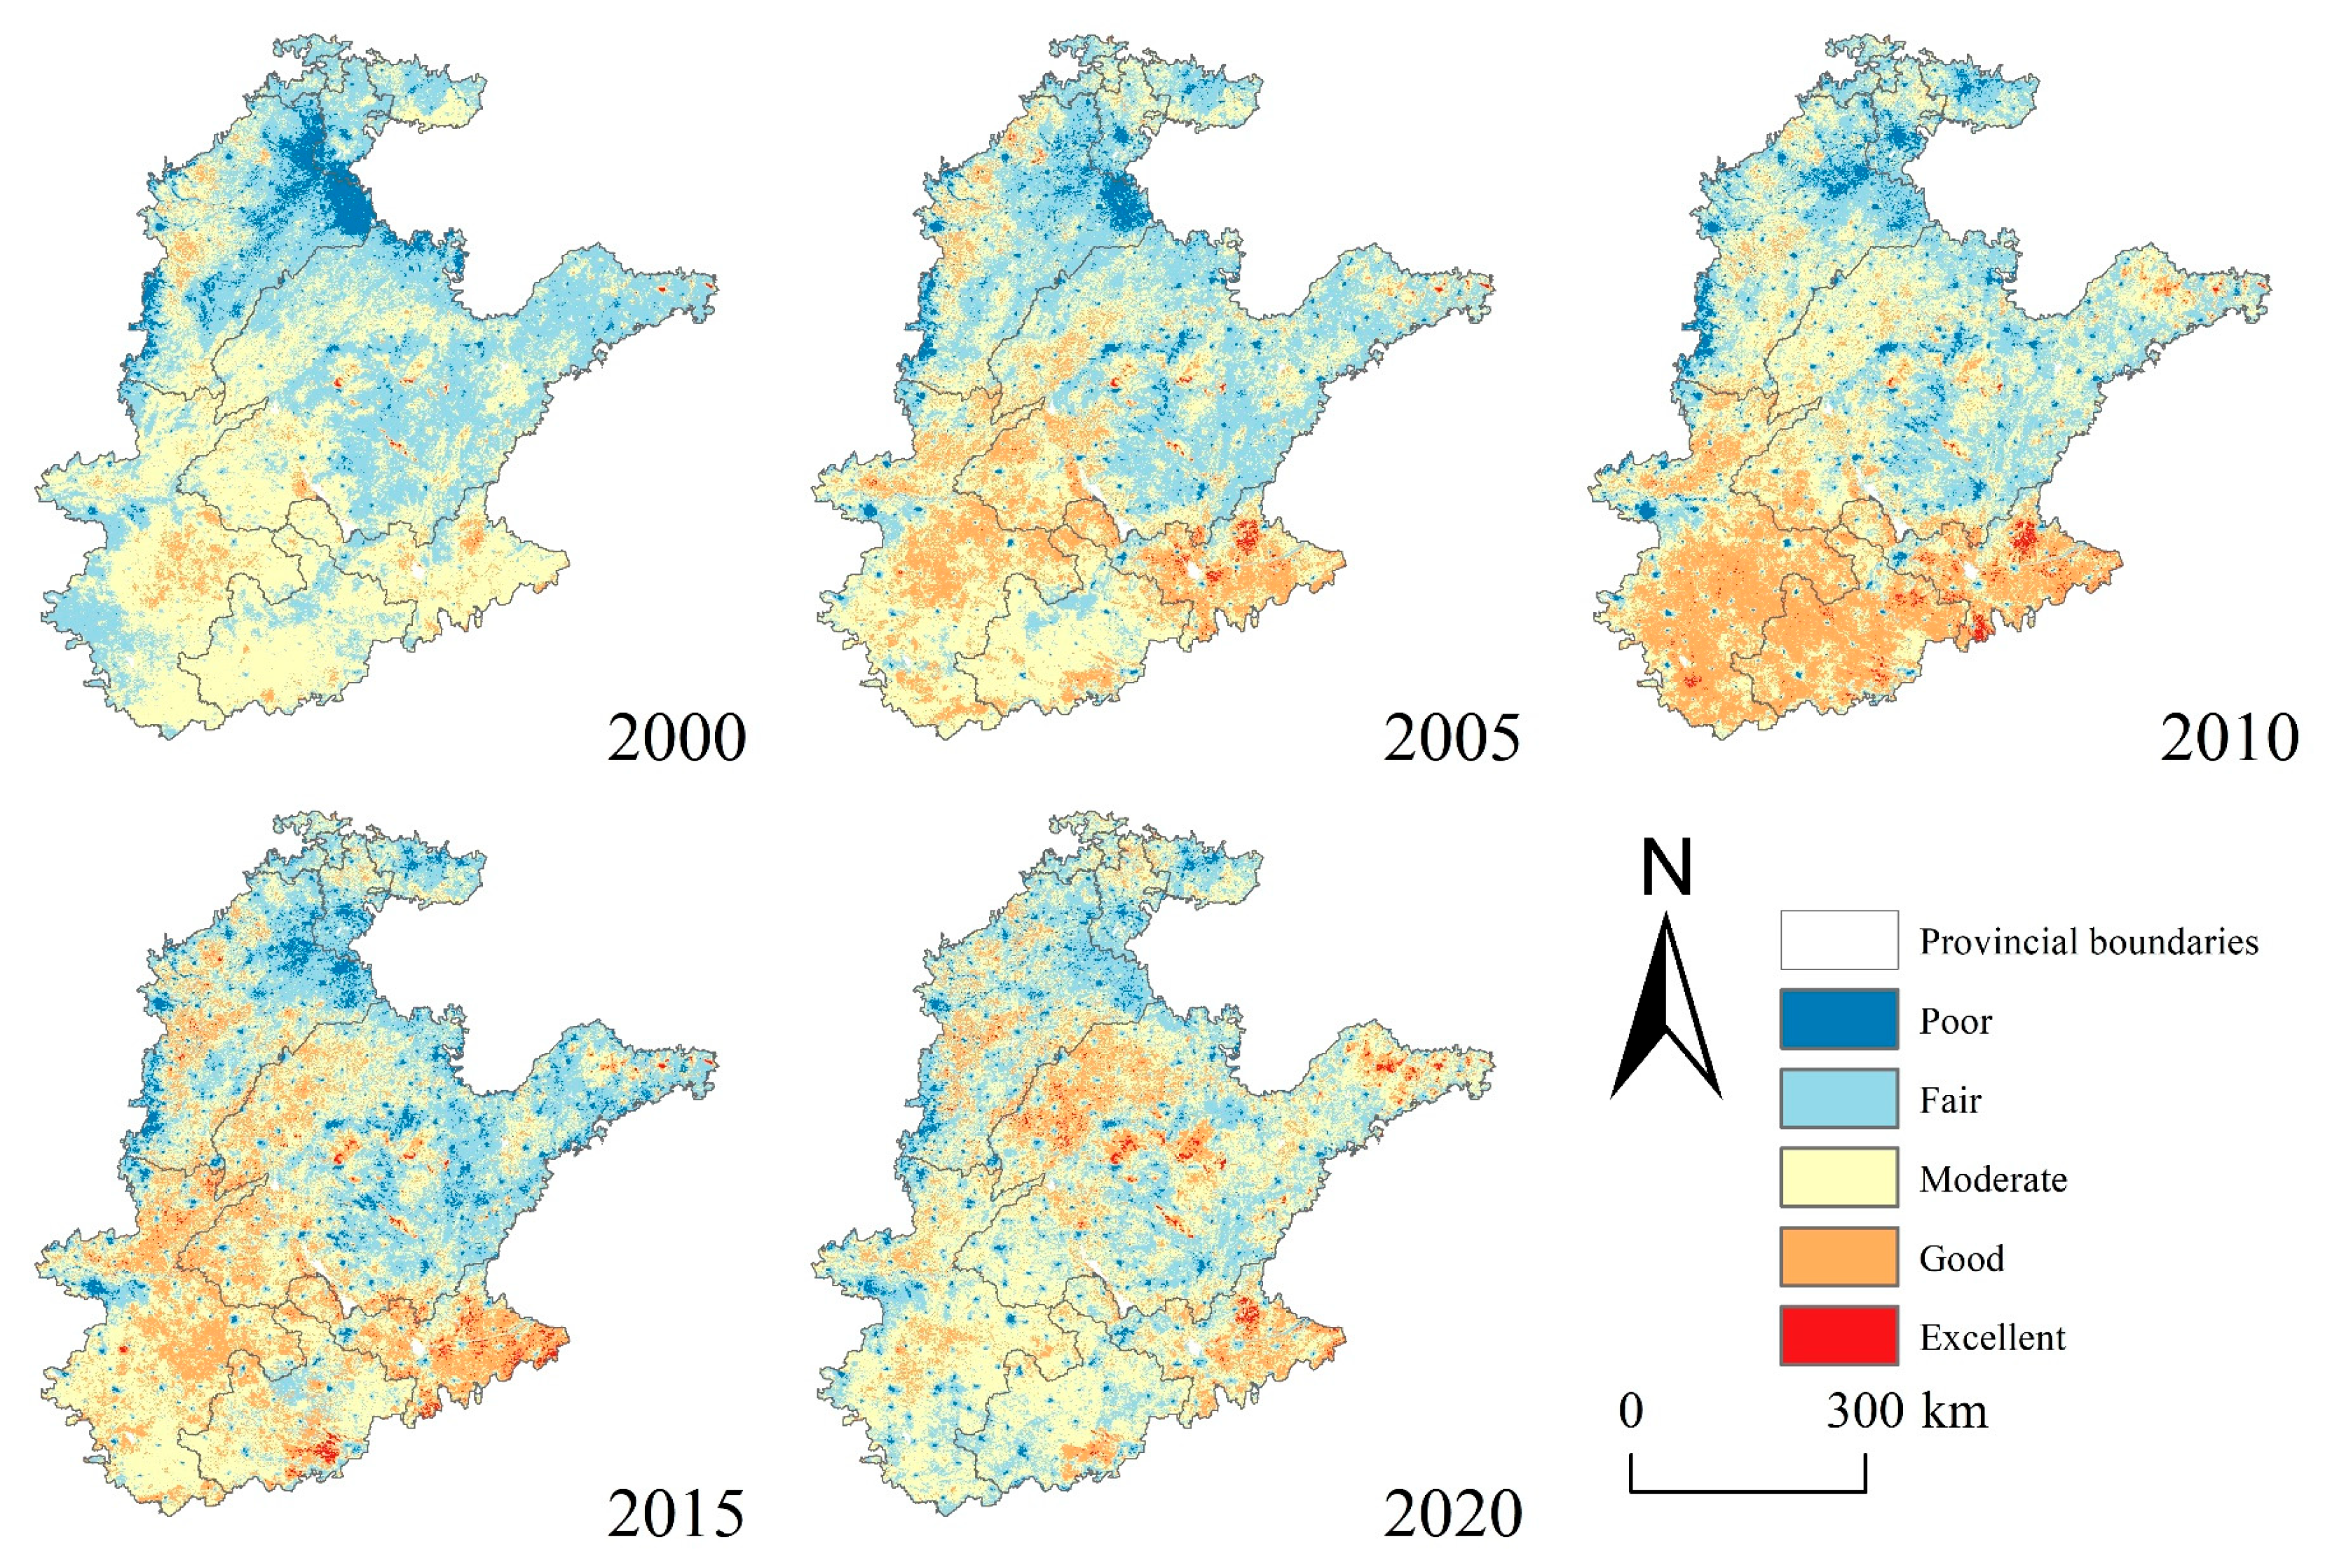
Figure 6 shows the spatial distribution patterns of the IRSEI across the NCP from 2000 to 2020. In 2000, moderate IRSEI levels were primarily observed in the southern and central regions, whereas the northern and eastern regions presented relatively low ecological quality. By 2005, high-value zones had become concentrated in the southeastern and central core areas, with persistently low levels in the northern region. In 2010, the southern and central regions maintained high IRSEI values, forming a contiguous high-quality belt extending toward the eastern part of the NCP, accompanied by a notable reduction in low-value areas in the north. By 2015, the central high-value region had continued to expand, whereas the southern region experienced a significant decline in ecological quality, with low-value areas predominantly distributed along the northern and western margins. In 2020, the spatial pattern became more balanced, characterized by widespread moderate IRSEI values. High-value areas were dispersed across the eastern, central, and southwestern regions, whereas low-value areas remained concentrated in the north, west, and parts of the central-eastern NCP.
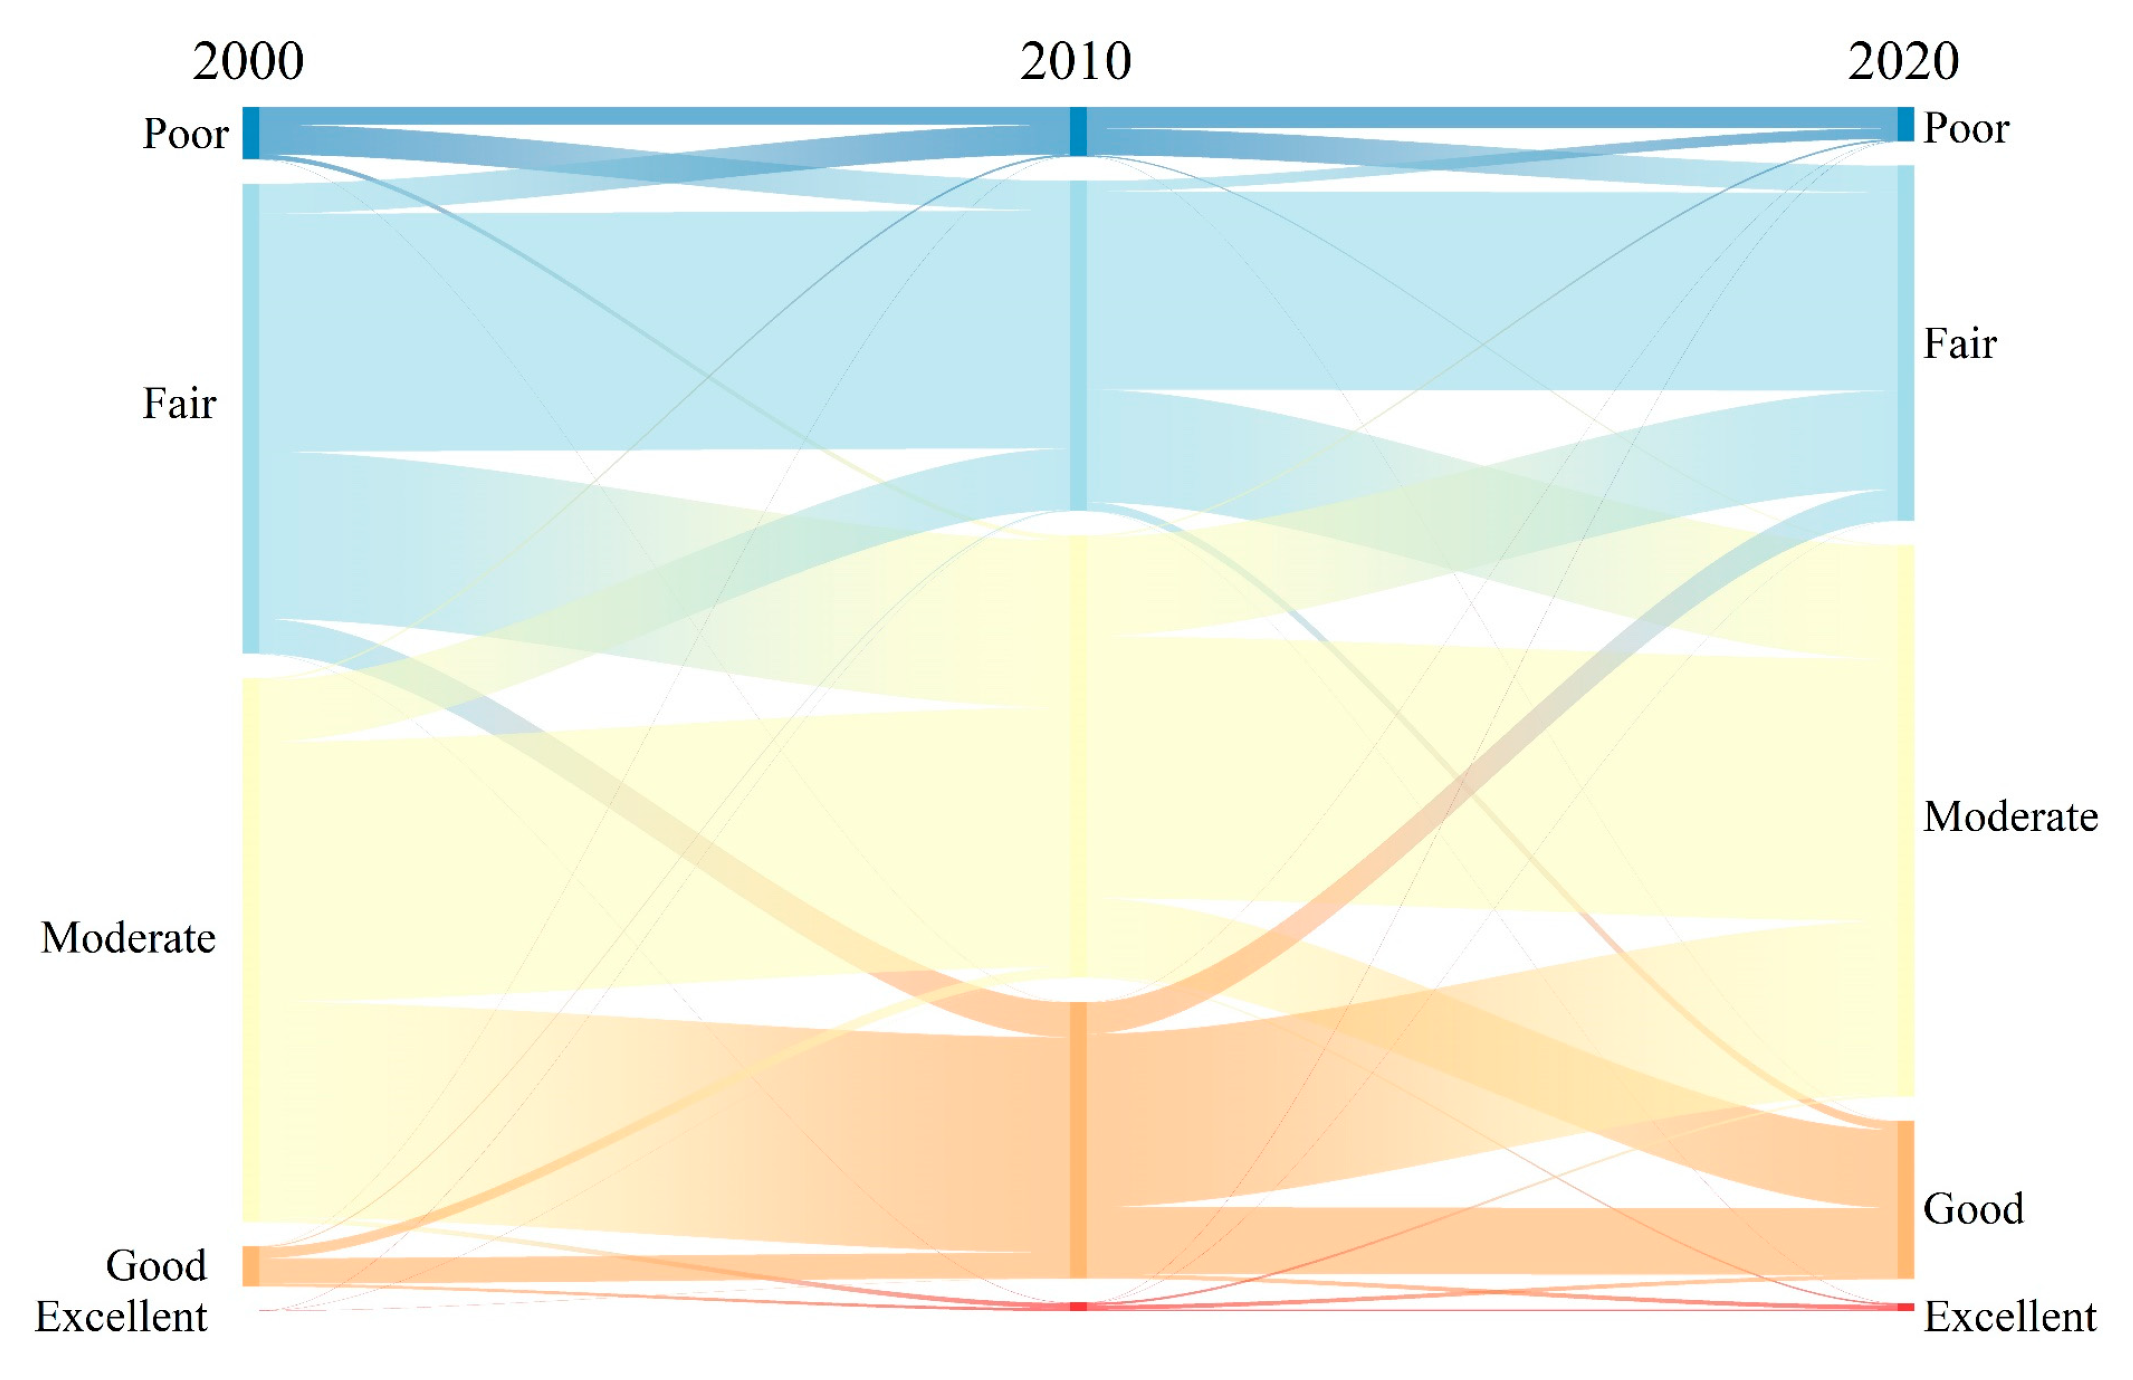
Sankey diagrams (Figure 7) illustrate the transitions of IRSEI levels in the NCP for 2000, 2010, and 2020. Between 2000 and 2010, some areas initially classified as “extremely poor” improved to the “poor” category, whereas others experienced further degradation. However, the overall proportion of “extremely poor” regions remained relatively stable. Notably, a considerable portion of “poor” areas improved, with nearly one-third transitioning to the “moderate” category. Areas with “moderate” ecological quality largely advanced to the “better” and “excellent” categories, indicating a general enhancement in ecological conditions, particularly with a substantial increase in the “better” class. From 2010 to 2020, the area classified as “extremely poor” continued to shrink, shifting predominantly into the “poor” and “moderate” categories. Similarly, many “poor” regions further improved to “moderate” or “better” levels, reflecting a continued upward trend in ecological quality. While the extent of “moderate” areas remained relatively stable, some regions experienced degradation. The “better” category experienced a slight decline during this period.
Overall, from 2000 to 2020, both the “extremely poor” and “poor” IRSEI regions experienced significant reductions, indicating a broad improvement in environmental quality. Regions previously categorized as “moderate” gradually transitioned to higher quality levels, with the “better” category exhibiting the most pronounced growth. The continued expansion of both the “excellent” and “moderate” classes underscores a marked enhancement in ecological quality across the NCP.
Figure 8 shows the spatial trends of the IRSEI across the NCP from 2000 to 2020. The analysis reveals that areas exhibiting nonsignificant improvement constitute the largest proportion (28.30%), predominantly located in the southern and central parts of the region. Areas with highly significant improvement (21.56%) are concentrated mainly in the north-central and eastern regions. Significantly improved (11.06%) and marginally improved (5.67%) areas are primarily found in the southern portion of the study area. In contrast, regions with highly significant degradation (5.65%) are scattered and are largely distributed across urban agglomerations in the northern, central, western, and southern parts of the NCP. Significantly degraded (3.74%) and nonsignificantly degraded (15.60%) areas are typically distributed around these severely degraded zones. Slightly degraded regions (2.09%) and areas with no significant change (6.33%) appear sporadically throughout the study area. The observed spatial heterogeneity suggests that areas experiencing highly significant degradation are closely associated with central urban districts. However, some urban core areas also demonstrate highly significant ecological improvement, highlighting the dual role of human activities—both constructive and detrimental—in influencing ecological conditions.

3.3. Drivering Force Analysis

3.3.1. Importance Ranking of Climate Factors

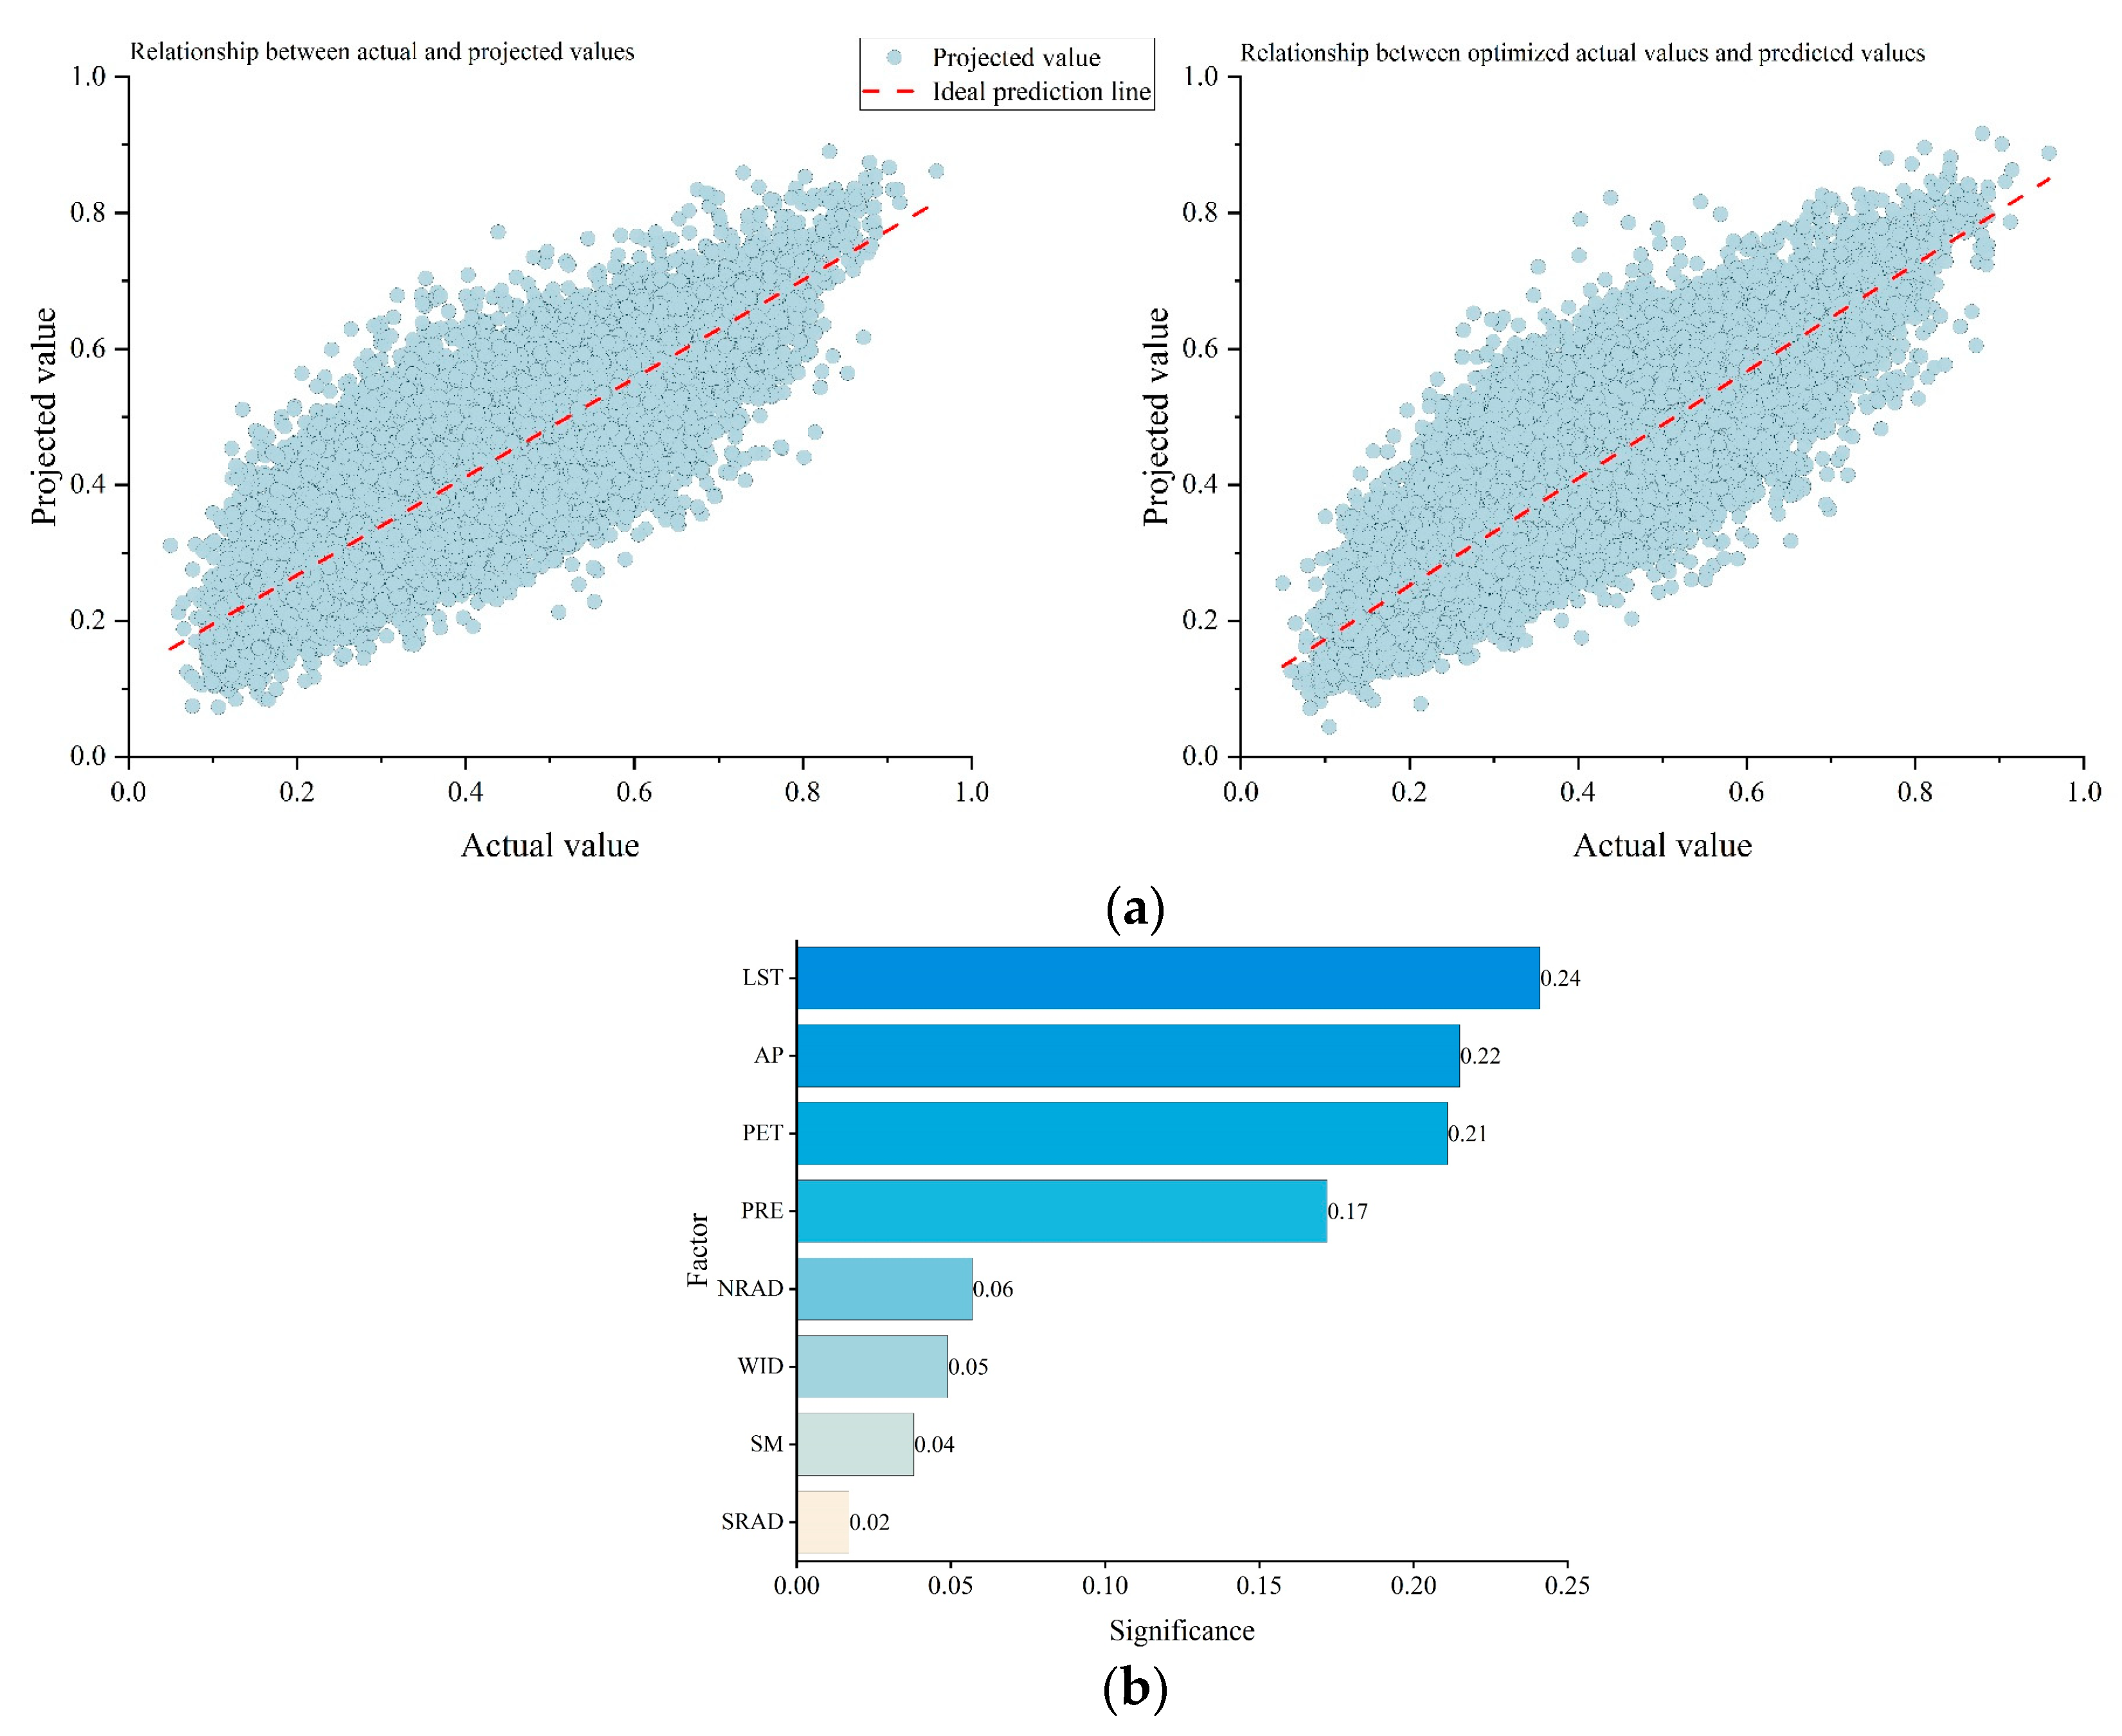
In this study, the hyperparameters of the XGBoost regression model were optimized via the grid search technique. Figure 9a displays the relationships between the observed and predicted IRSEI values before and after hyperparameter optimization. After fine-tuning, the root mean square error (RMSE) on the test dataset decreased from 0.0651 to 0.0603, indicating a significant improvement in prediction accuracy. The results confirm that hyperparameter tuning substantially enhances both the performance and generalization capability of the XGBoost model, underscoring its applicability for evaluating the importance of climatic factors influencing the IRSEI.
Figure 9b presents the importance rankings of the climate variables as determined by the optimized XGBoost model. The horizontal axis denotes the relative importance of each climate factor. The surface temperature, atmospheric pressure, and potential evapotranspiration presented the highest importance scores, at 0.241, 0.215, and 0.211, respectively. Precipitation follows with an importance score of 0.172. In contrast, net radiation (NRAD), wind speed (WID), soil moisture (SM), and shortwave radiation (SRAD) have relatively low importance values, with values of 0.057, 0.049, 0.038, and 0.017, respectively. These results indicate that the ecological quality of the NCP is influenced primarily by surface temperature, atmospheric pressure, potential evapotranspiration, and precipitation—factors that play critical roles in shaping the regional ecological environment.

3.3.2. Correlation Analysis of Key Climate Factors

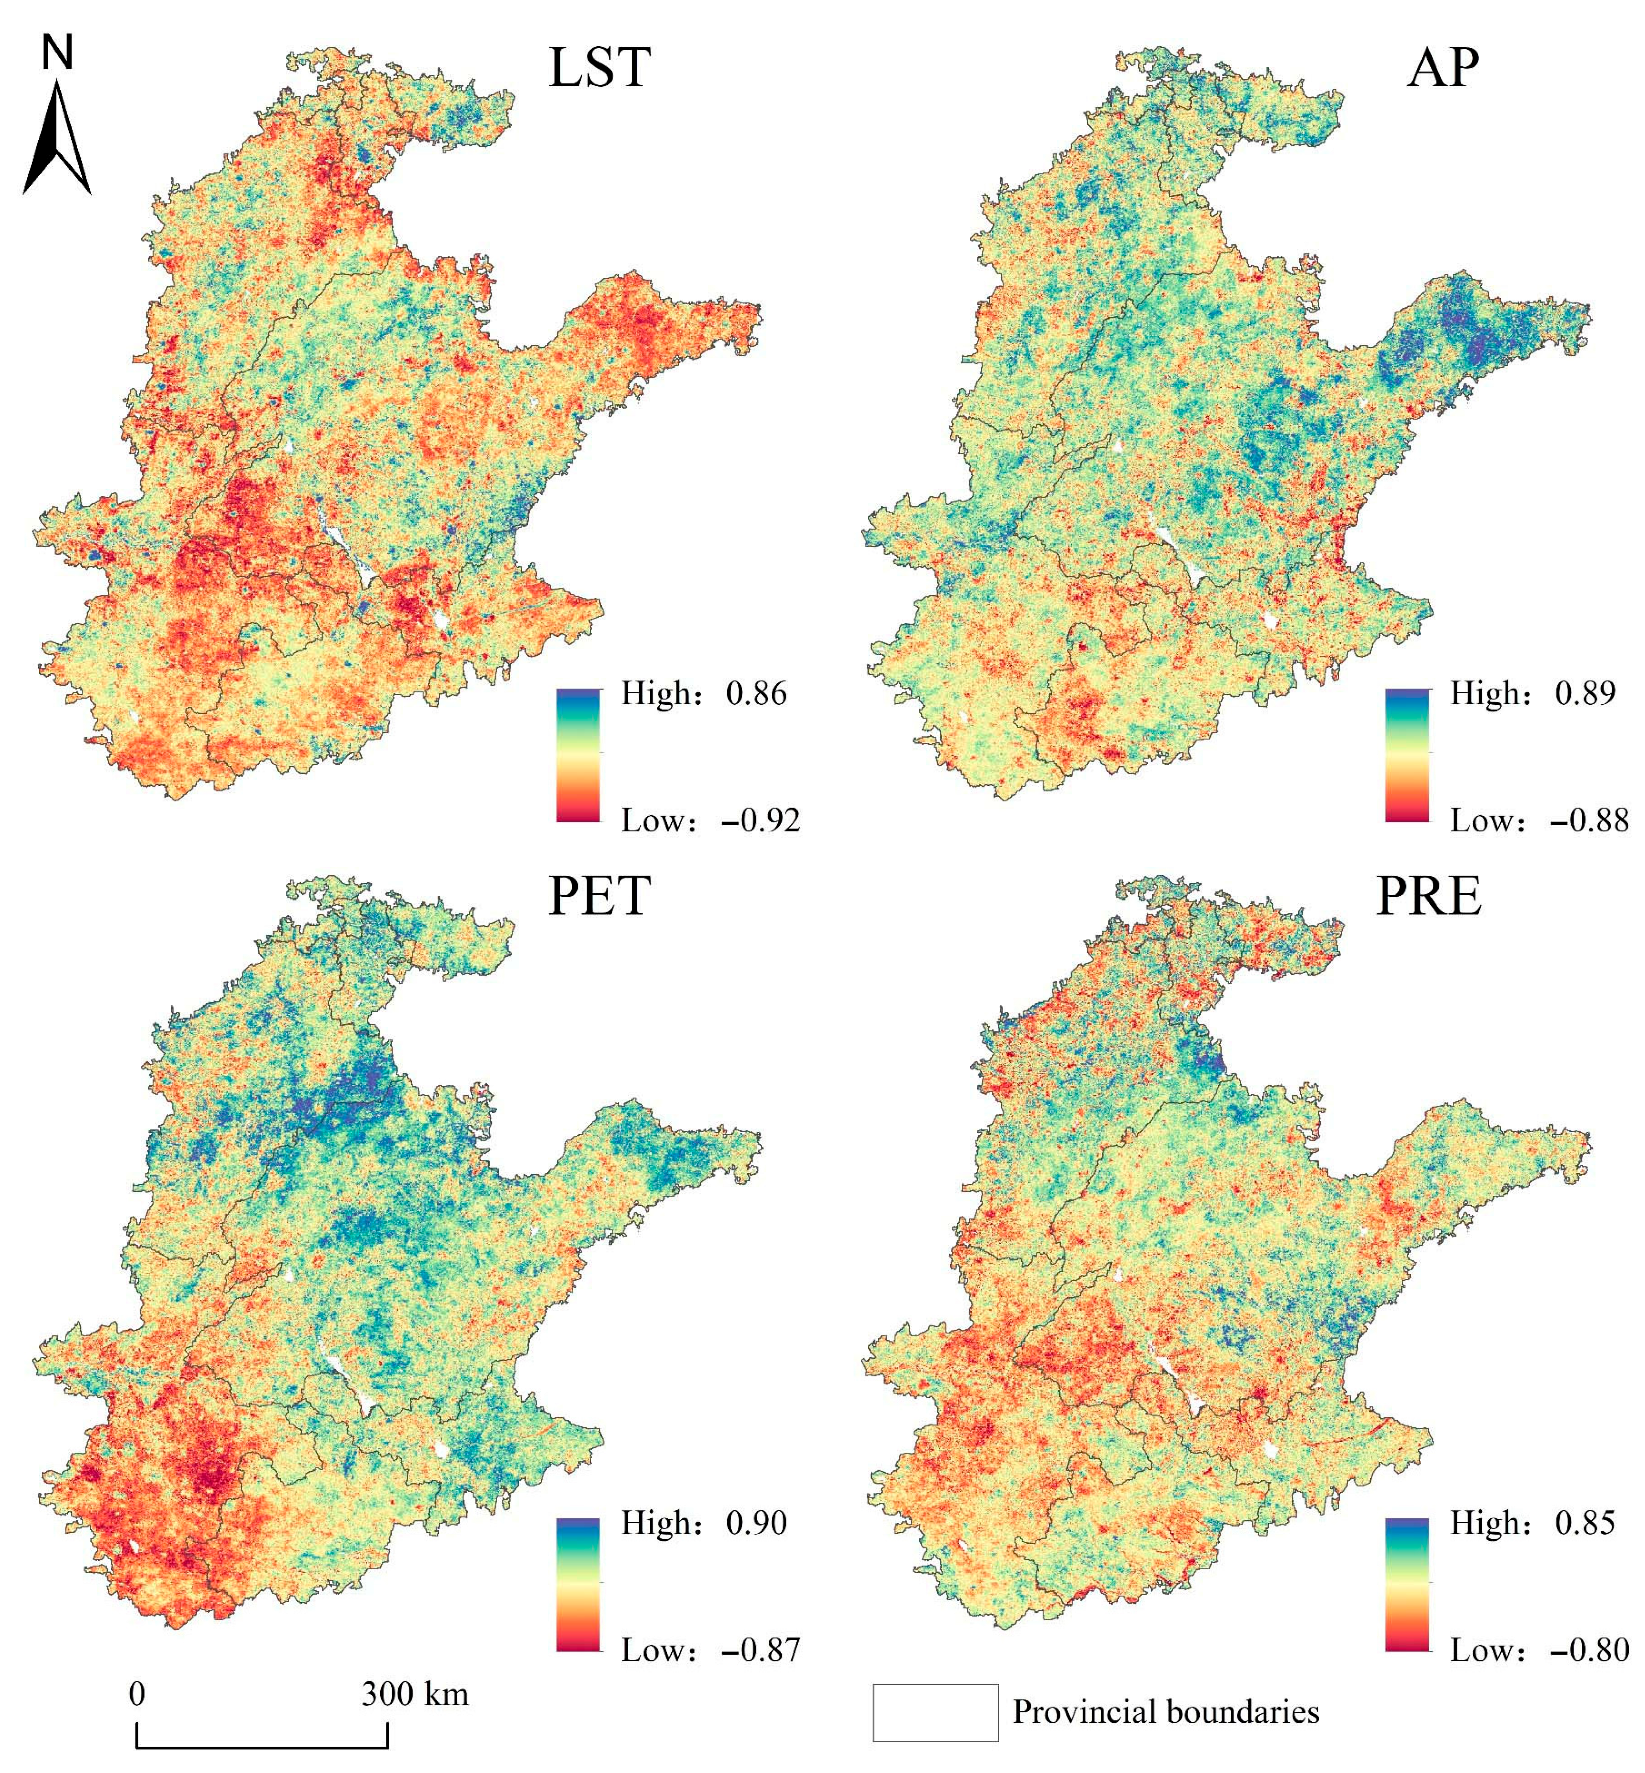
On the basis of the partial correlation coefficients and the importance rankings of the climate factors, four key variables—surface temperature, atmospheric pressure, potential evapotranspiration, and precipitation—were selected for further analysis. The results indicate significant correlations between the IRSEI and the four selected climate variables across the NCP from 2000 to 2020. Figure 10 shows the spatial distributions of the partial correlation coefficients for these key factors. The surface temperature exhibited a significant negative correlation with the IRSEI, with approximately 78.13% of the study area showing this negative association, particularly in the central and northern regions. Atmospheric pressure has a positive correlation with the IRSEI in 72.38% of the region, with a relatively uniform spatial distribution. The areas with negative correlations are located mainly in the southern part of the study area. Potential evapotranspiration is positively correlated with the IRSEI in 62.56% of the region, although with marked spatial heterogeneity. Positive correlation areas are primarily concentrated in the central, northern, and eastern regions, whereas negative correlations are observed in the southern and western regions. The relationship between precipitation and the IRSEI is more complex: 51.96% of the region has a negative correlation, whereas 48.04% has a positive correlation. Spatially, the areas with negative correlations are predominantly located in the central, western, and northern parts of the NCP, while the areas with positive correlations are mainly distributed in the east-central region.

3.3.3. Driving Effects of Climate Change and Human Activities on Ecosystem Quality

Multiple regression residual analysis was conducted to distinguish the impacts of climate change and human activities on the IRSEI, and the results are presented in Figure 11. The spatial effects of climate change, human activities, and their combined influence on the IRSEI changes show considerable variation across the NCP. Among the study area, 51.97% is influenced by the combined effects of climate change and human activities, with 37.01% of these areas showing positive effects, mainly in the southern and north-central regions, whereas 14.96% exhibit negative effects, concentrated in the south-central and northern areas. Human activities alone contribute to 18.99% of the increase in the IRSEI, particularly in the southern and western regions, whereas climate change accounts for 13.37% of the increase, mainly in the northern and southern regions. In 15.67% of the area, the IRSEI decreases due to climate change and human activities, with climate-driven reductions affecting 5.86% of the area, which is more widely distributed, and human activity-driven reductions accounting for 9.81%, which are concentrated in southern NCP and parts of northern NCP. The remaining regions show sporadic reductions.
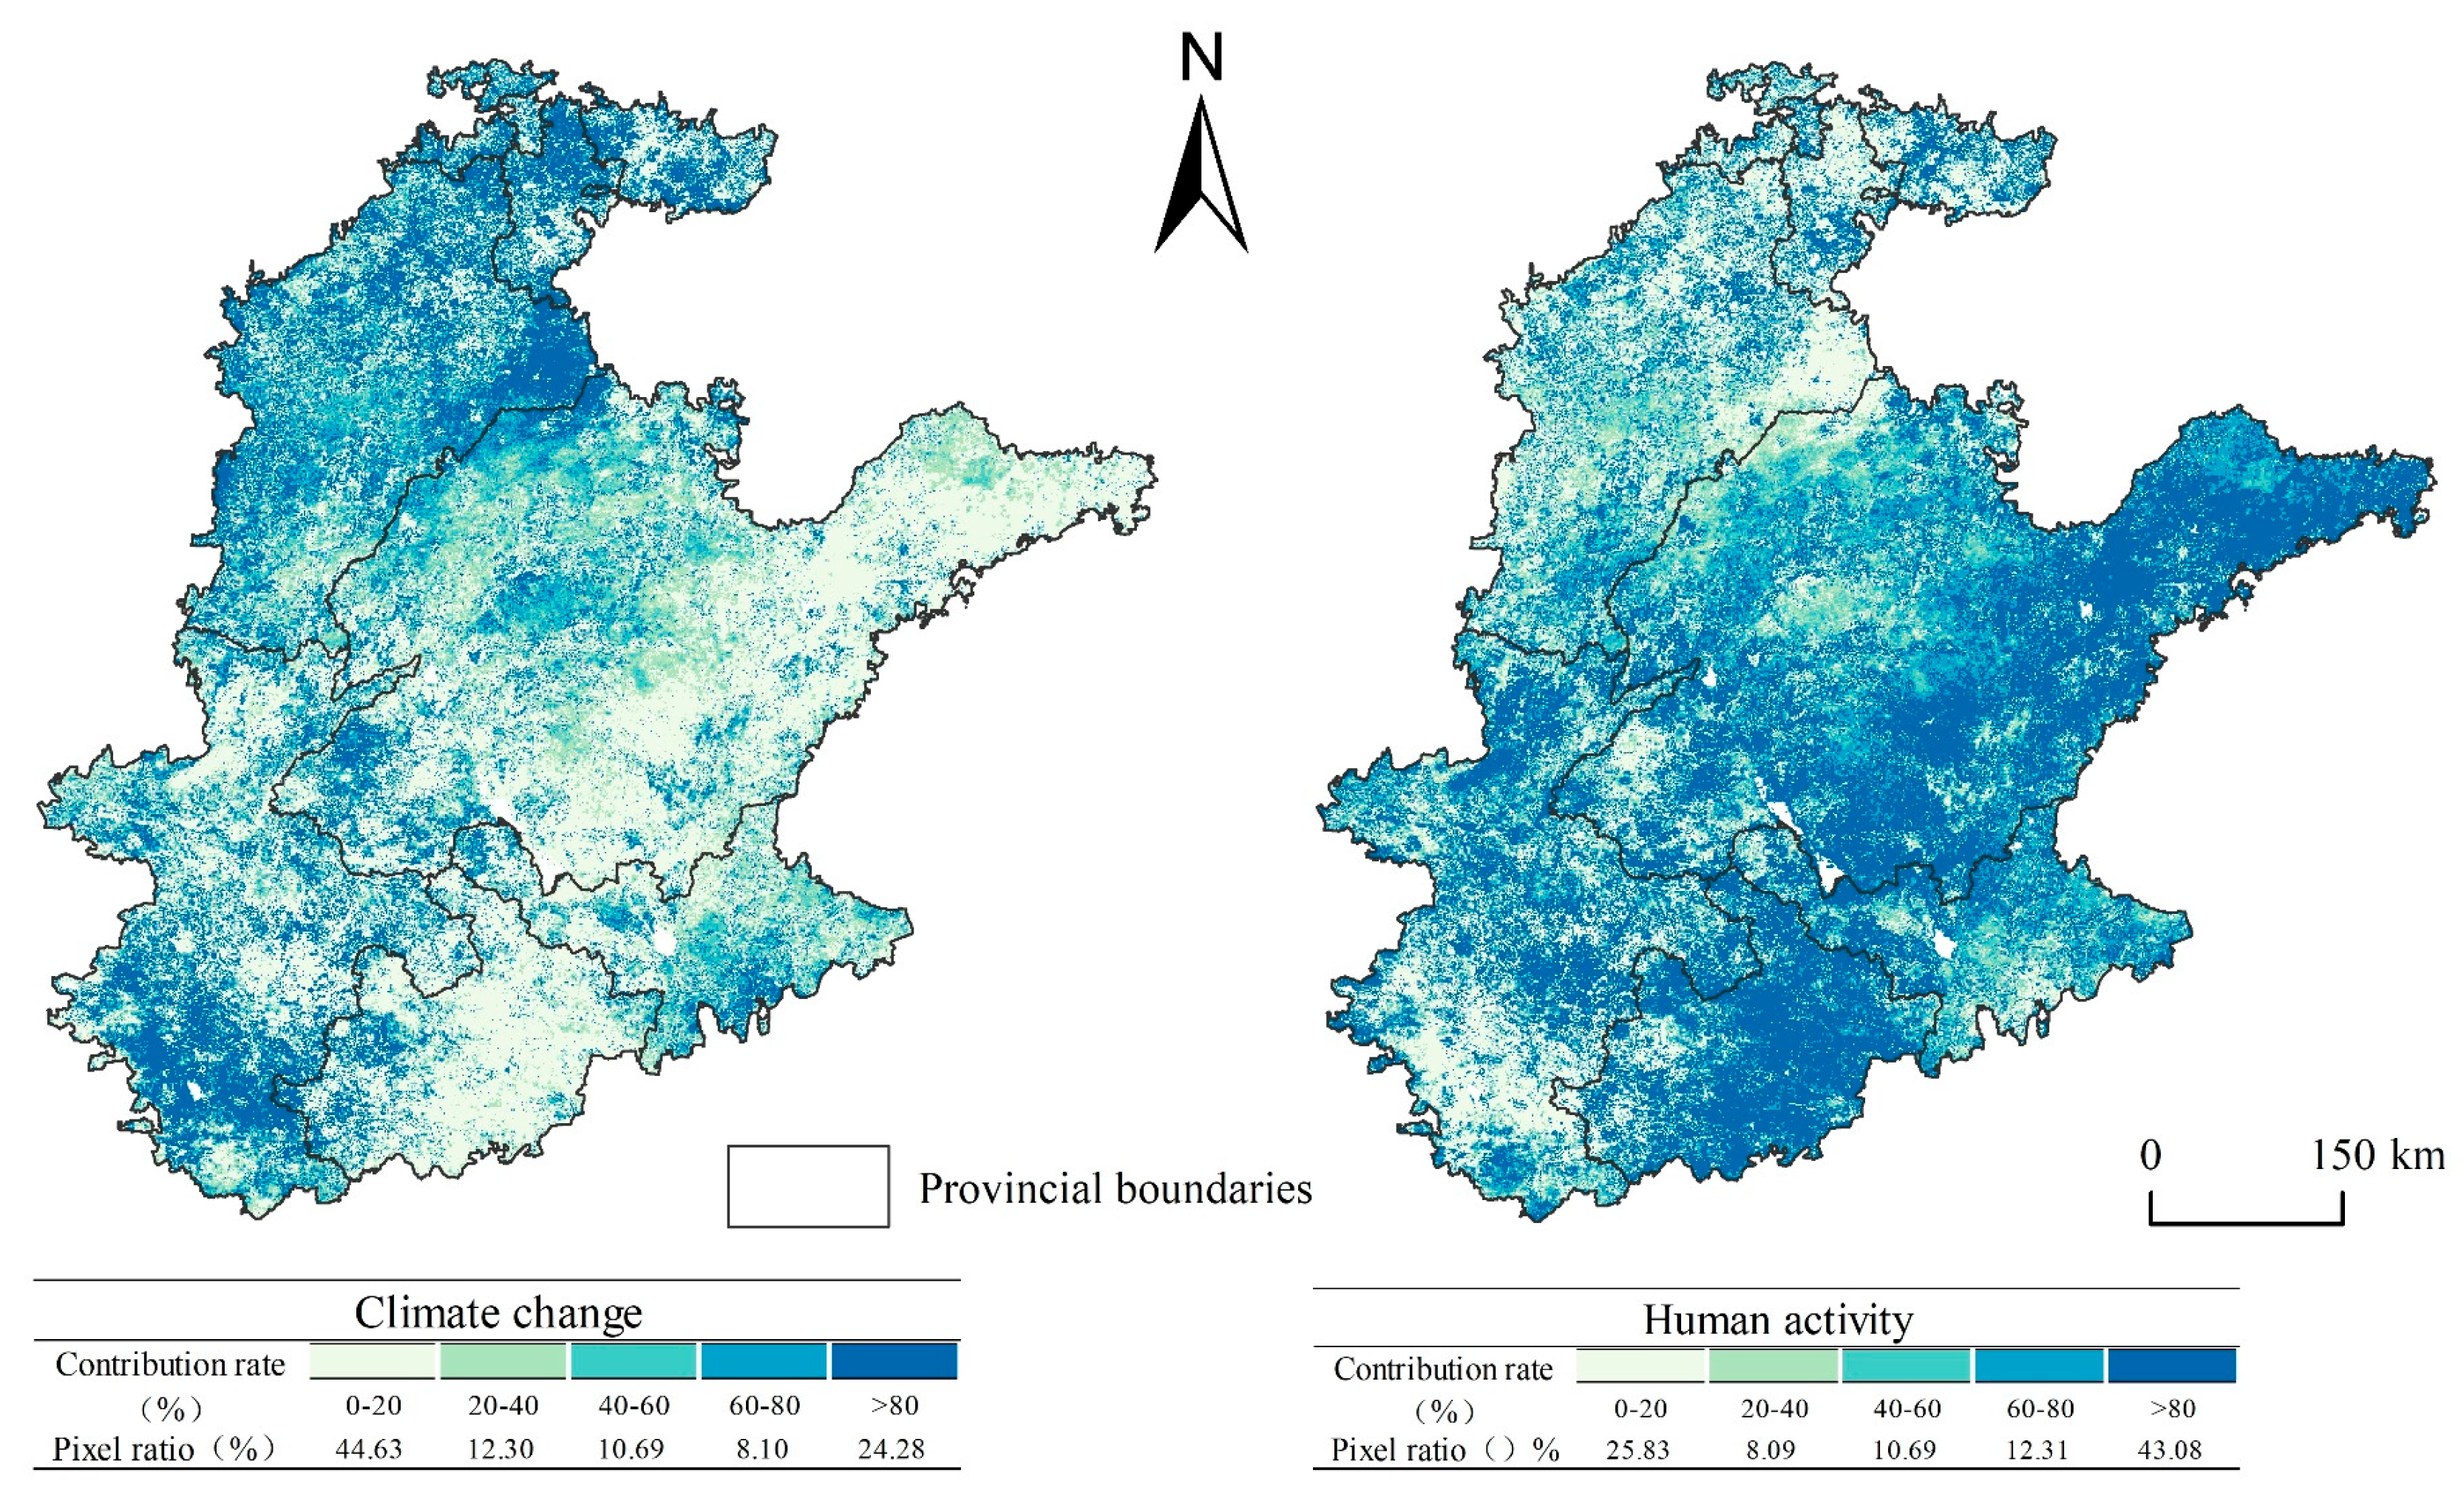
Figure 12 shows the spatial distributions of the contribution rates of climate change and human activities to the variation in the IRSEI across the NCP. The influence of climate change is generally more pronounced in the western regions and weaker in the east. Areas with climate contribution rates between 0% and 20% constitute 44.63% of the total area and are predominantly located in the eastern, east-central, and southeastern parts of the NCP. Regions where the contribution of climate change exceeds 80% cover 24.28% of the area and are mainly concentrated in the western, northern, and southern regions. Contribution rates between 20–40%, 40–60%, and 60–80% are primarily distributed across the central region, collectively accounting for 31.09% of the total area.
In contrast, the contribution of human activities to the IRSEI changes exhibited an inverse spatial pattern, with higher contributions observed in the eastern regions and lower contributions in the west. Areas where human activities contribute more than 80% to the variation in the IRSEI encompass 43.08% of the total area, whereas those with contributions between 60% and 80% account for 12.31%, which are primarily distributed in the eastern, central, and southeastern regions. Areas with contribution rates ranging from 20% to 40% and 40% to 60% represent 18.78% of the study area and are located mainly in the north-central and southern regions. The regions with the lowest contribution rates from human activities (0% to 20%) are concentrated mainly in the southwestern and northern areas, accounting for 25.83% of the total area.

4. Discussion

4.1. Spatial and Temporal Changes in Ecosystem Quality

The findings demonstrate a significant improvement in ecological quality across the NCP from 2000 to 2020, which is consistent with previous research [47,48]. Temporally, this 21-year period can be divided into distinct phases. From 2000 to 2018, the ecological quality exhibited an overall increasing trend, although changes during the early years (2000–2007) were relatively limited. The year 2007 marked a critical turning point, corresponding to the implementation of national ecological restoration policies. Although restoration efforts commenced as early as 2000, their initial impact was modest, resulting in only a slight improvement in ecological conditions. After 2007, with the initiation of China’s “ecological civilization” strategy and a series of large-scale environmental projects, the ecological quality improved substantially [49]. However, following 2018, factors such as rapid urbanization, energy exploitation, overdevelopment, and rising temperatures contributed to a slight decline in ecological conditions [50]. Despite this recent downturn, the overall ecological environment has significantly improved over the past two decades.
Spatially, the ecological quality of the NCP was generally relatively high in southern NCP and relatively low in northern NCP. In 2000, much of the region experienced poor ecological conditions. By 2010, notable improvements were observed, particularly in the southern Jiangsu, Anhui, and Henan Provinces. The Beijing–Tianjin–Hebei (BTH) region, although showing some signs of recovery, continues to lag behind [51]. After 2010, as ecological restoration projects advanced, spatial disparities in ecological quality gradually diminished, and overall improvements became more pronounced. Nevertheless, ongoing urban expansion and land use transformation in the BTH area led to persistent ecological degradation. In contrast, the southern regions, characterized by higher precipitation, favorable temperatures, and more suitable vegetation and land use types, consistently demonstrated superior ecological quality, thereby maintaining southern–northern disparity.

4.2. Driving Mechanisms

As a typical monsoon-driven agricultural region, the ecological quality of the NCP is strongly influenced by climatic factors such as temperature, atmospheric pressure, potential evapotranspiration, and precipitation. Temperature exerts a negative impact on the IRSEI, as warming accelerates soil moisture loss, increases evapotranspiration, and elevates drought frequency, thereby inhibiting vegetation growth. Potential evapotranspiration and atmospheric pressure generally show positive effects across most areas, except in the southern region during summer, where excessive evapotranspiration may cause soil moisture imbalance. The uneven spatial and temporal distribution of precipitation leads to localized waterlogging or nutrient leaching, restricting vegetation growth and ecological restoration. Collectively, these complex climatic patterns intensify the spatial heterogeneity of ecological quality.
The NCP is densely populated and economically developed, with human activities exerting substantial impacts on the ecosystem [52]. Urbanization is most pronounced in the eastern and southern areas, where land development, industrial emissions, and land-use changes have weakened ecosystem stability and buffering capacity. In contrast, the western and northern regions experience slower economic growth and urban expansion, resulting in lower human disturbance and relatively higher levels of ecosystem protection. However, due to poor baseline ecological conditions and sparse vegetation, overall ecological vulnerability remains high, necessitating strengthened conservation and restoration efforts.
Climate change and human activities jointly shape the spatial heterogeneity of ecological quality across the NCP. The northern and western arid regions, characterized by scarce precipitation and high evaporation, suffer from severe ecological degradation driven by water scarcity and soil infertility. Although human disturbances are relatively mild, these ecosystems retain potential for recovery. Conversely, the southern and eastern regions benefit from favorable climatic conditions and stronger ecological foundations, yet face increasing ecosystem pressures due to the combined impacts of urban expansion, land conversion, and climate change.

4.3. Limitations of the Study

This study has several limitations. The spatial and temporal resolutions of the remote sensing data employed constrain the ability to effectively capture sudden disturbances and short-term ecological responses. Although the IRSEI integrates artificial intelligence techniques to enhance the biological relevance of ecological indicators, it still exhibits limitations in regional adaptability, indicator stability, and the accurate representation of ecological processes. Furthermore, while multivariate residual analysis quantifies the overall directional influence and contribution of climate change and human activities, it cannot differentiate the specific magnitudes of their positive and negative effects. Future research should focus on improving the detection of abrupt disturbances and short-term ecological dynamics, optimizing IRSEI’s adaptability and ecological process representation at regional scales, and refining the separation of positive and negative contributions from climate and anthropogenic drivers.
5. Conclusions

On the basis of the Improved Remote Sensing Ecological Index (IRSEI), this study provides a comprehensive analysis of the spatial and temporal variations in the quality of the ecological environment and its driving mechanisms in the North China Plain (NCP) from 2000 to 2020. The main conclusions are as follows:
(1)
The overall ecological quality of the NCP significantly increased during the study period, with the average IRSEI increasing from 0.40 to 0.45. The proportion of areas rated as “good” or “excellent” increased notably, exhibiting a clear spatial pattern with higher ecological quality in the southern regions and lower quality in the north.
(2)
Key climatic factors influencing ecological quality include surface temperature, atmospheric pressure, evapotranspiration, and precipitation. The surface temperature was negatively correlated with the IRSEI, whereas the atmospheric pressure and evapotranspiration were positively correlated. The relationship between precipitation and the IRSEI is complex and spatially variable.
(3)
Approximately 51.97% of the region’s ecological quality changes were jointly driven by climate change and human activities, with the contribution of human activities (28.80%) exceeding that of climate change (19.23%).
Overall, climate change and human activities were the primary drivers of ecological quality variation, with human activities playing a more prominent role and climate change exerting a relatively weaker impact. Our findings lay a scientific foundation for clarifying the driving mechanisms of ecological environment changes and underpin ecological restoration as well as coordinated human–environment development against the backdrop of climate change.

Author Contributions

Conceptualization, Z.W. and S.W. (Shuting Wang); Methodology, Z.W. and Y.G.; Software, Z.W. and Y.H.; Validation, S.W. (Shuting Wang) and Y.H.; Formal Analysis, Z.W. and S.W. (Shuting Wang); Investigation, S.W. (Shuting Wang) and Y.H.; Resources, Z.W. and L.S.; Data Curation, S.W. (Siyao Wang) and L.S.; Writing—Original Draft Preparation, Z.W. and S.W. (Shuting Wang); Writing—Review and Editing, Z.W. and Y.G.; Visualization, S.W. (Shuting Wang) and Y.H.; Supervision, Y.G.; Project Administration, Y.H. and S.W. (Siyao Wang); Funding Acquisition, Z.W. and Y.G. All authors have read and agreed to the published version of the manuscript.

Funding

This research was funded by East China University of Technology, the Jiangxi Province Postgraduate Innovation Special Project (YC2024-S487), and the Open Fund Project of the Key Laboratory of Mine Environmental Monitoring and Improving around Poyang Lake of the Ministry of Natural Resources, East China University of Technology (MEMI-2023-15).

Data Availability Statement

The remote sensing imagery and part of the climatic data were accessed via the Google Earth Engine, https://earthengine.google.com (accessed on 15 February 2025), while additional climatic data were obtained from the National Tibetan Plateau Data Center, and land use data were obtained from Zenodo, https://zenodo.org (accessed on 15 February 2025). The data that support the findings of this study are available from the corresponding author upon reasonable request.

Conflicts of Interest

The authors declare that they have no conflicts of interest.

Abbreviations

The following abbreviations are used in this manuscript:
NCPNorth China Plain
IRSEIImproved remote sensing ecological index
kNDVIKernel normalized difference vegetation index
CCClimate change
HAsHuman activities

References

  1. Li, J.; Lei, H. Tracking the spatio-temporal change of planting area of winter wheat-summer maize cropping system in the North China Plain during 2001–2018. Comput. Electron. Agric. 2021, 187, 106222. [Google Scholar] [CrossRef]
  2. Zhang, H.-L.; Zhao, X.; Yin, X.-G.; Liu, S.-L.; Xue, J.-F.; Wang, M.; Pu, C.; Lal, R.; Chen, F. Challenges and adaptations of farming to climate change in the North China Plain. Clim. Change 2015, 129, 213–224. [Google Scholar] [CrossRef]
  3. Jia, R.; Zhou, J.; Chu, J.; Shahbaz, M.; Yang, Y.; Jones, D.L.; Zang, H.; Razavi, B.S.; Zeng, Z. Insights into the associations between soil quality and ecosystem multifunctionality driven by fertilization management: A case study from the North China Plain. J. Clean. Prod. 2022, 362, 132265. [Google Scholar] [CrossRef]
  4. Ariken, M.; Zhang, F.; Chan, N.W.; Kung, H.-T. Coupling coordination analysis and spatio-temporal heterogeneity between urbanization and eco-environment along the Silk Road Economic Belt in China. Ecol. Indic. 2021, 121, 107014. [Google Scholar] [CrossRef]
  5. Diaz-Gonzalez, F.A.; Vuelvas, J.; Correa, C.A.; Vallejo, V.E.; Patino, D. Machine learning and remote sensing techniques applied to estimate soil indicators–review. Ecol. Indic. 2022, 135, 108517. [Google Scholar] [CrossRef]
  6. Jiang, L.; Liu, Y.; Wu, S.; Yang, C. Analyzing ecological environment change and associated driving factors in China based on NDVI time series data. Ecol. Indic. 2021, 129, 107933. [Google Scholar] [CrossRef]
  7. Patel, S.; Indraganti, M.; Jawarneh, R.N. A comprehensive systematic review: Impact of Land Use/Land Cover (LULC) on Land Surface Temperatures (LST) and outdoor thermal comfort. Build. Environ. 2024, 249, 111130. [Google Scholar] [CrossRef]
  8. Zhou, S.; Ye, J.; Li, J.; Zhang, G.; Duan, Y. Identifying intrinsic drivers to changes in riparian ecosystem services by using PSR framework: A case study of the Grand Canal in Jiangsu, China. Environ. Dev. 2022, 43, 100728. [Google Scholar] [CrossRef]
  9. Li, S.; Liu, C.; Ge, C.; Yang, J.; Liang, Z.; Li, X.; Cao, X. Ecosystem health assessment using PSR model and obstacle factor diagnosis for Haizhou Bay, China. Ocean Coast. Manag. 2024, 250, 107024. [Google Scholar] [CrossRef]
  10. Xu, X.H. A remote sensing index for assessment of regional ecological changes. China Environ. Sci. 2013, 33, 889–897. [Google Scholar]
  11. Xiong, Y.; Xu, W.; Lu, N.; Huang, S.; Wu, C.; Wang, L.; Dai, F.; Kou, W. Assessment of spatial–temporal changes of ecological environment quality based on RSEI and GEE: A case study in Erhai Lake Basin, Yunnan province, China. Ecol. Indic. 2021, 125, 107518. [Google Scholar] [CrossRef]
  12. Chen, N.; Cheng, G.; Yang, J.; Ding, H.; He, S. Evaluation of urban ecological environment quality based on improved RSEI and driving factors analysis. Sustainability 2023, 15, 8464. [Google Scholar] [CrossRef]
  13. Mutanga, O.; Masenyama, A.; Sibanda, M. Spectral saturation in the remote sensing of high-density vegetation traits: A systematic review of progress, challenges, and prospects. ISPRS J. Photogramm. Remote Sens. 2023, 198, 297–309. [Google Scholar] [CrossRef]
  14. Huang, S.; Tang, L.; Hupy, J.P.; Wang, Y.; Shao, G. A commentary review on the use of normalized difference vegetation index (NDVI) in the era of popular remote sensing. J. For. Res. 2021, 32, 1–6. [Google Scholar] [CrossRef]
  15. Liu, Y.; Xiang, W.; Hu, P.; Gao, P.; Zhang, A. Evaluation of ecological environment quality using an improved remote sensing ecological index model. Remote Sens. 2024, 16, 3485. [Google Scholar] [CrossRef]
  16. Camps-Valls, G.; Campos-Taberner, M.; Moreno-Martínez, Á.; Walther, S.; Duveiller, G.; Cescatti, A.; Mahecha, M.D.; Muñoz-Marí, J.; García-Haro, F.J.; Guanter, L. A unified vegetation index for quantifying the terrestrial biosphere. Sci. Adv. 2021, 7, eabc7447. [Google Scholar] [CrossRef]
  17. Ministry of Ecology and Environment the People’s Republic of China. Technical Criterion for Ecosystem Status Evaluation; Ministry of Ecology and Environment the People’s Republic of China: Beijing, China, 2015.
  18. Zhu, Q.; Cai, Y. Integrating ecological risk, ecosystem health, and ecosystem services for assessing regional ecological security and its driving factors: Insights from a large river basin in China. Ecol. Indic. 2023, 155, 11. [Google Scholar] [CrossRef]
  19. Tuoku, L.; Wu, Z.; Men, B. Impacts of climate factors and human activities on NDVI change in China. Ecol. Inform. 2024, 81, 102555. [Google Scholar] [CrossRef]
  20. Shamuxi, A.; Han, B.; Jin, X.; Wusimanjiang, P.; Abudukerimu, A.; Chen, Q.; Zhou, H.; Gong, M. Spatial pattern and driving mechanisms of dryland landscape ecological risk: Insights from an integrated geographic detector and machine learning model. Ecol. Indic. 2025, 172, 113305. [Google Scholar] [CrossRef]
  21. Gu, Z.; Chen, X.; Ruan, W.; Zheng, M.; Gen, K.; Li, X.; Deng, H.; Chen, Y.; Liu, M. Quantifying the direct and indirect effects of terrain, climate and human activity on the spatial pattern of kNDVI-based vegetation growth: A case study from the Minjiang River Basin, Southeast China. Ecol. Inform. 2024, 80, 102493. [Google Scholar] [CrossRef]
  22. Zhang, X.; Jia, W.; He, J. Spatial and temporal variation of ecological quality in northeastern China and analysis of influencing factors. J. Clean. Prod. 2023, 423, 138650. [Google Scholar] [CrossRef]
  23. Georgati, M.; Hansen, H.S.; Keßler, C. Random Forest Variable Importance Measures for Spatial Dynamics: Case Studies from Urban Demography. ISPRS Int. J. Geo-Inf. 2023, 12, 460. [Google Scholar] [CrossRef]
  24. Bacanin, N.; Perisic, M.; Jovanovic, G.; Damaeviius, R.; Stanisic, S.; Simic, V.; Zivkovic, M.; Stojic, A. The explainable potential of coupling hybridized metaheuristics, XGBoost, and SHAP in revealing toluene behavior in the atmosphere. Sci. Total Environ. 2024, 929, 13. [Google Scholar] [CrossRef]
  25. Li, J.; An, X.; Li, Q.; Wang, C.; Yu, H.; Zhou, X.; Geng, Y.-a. Application of XGBoost algorithm in the optimization of pollutant concentration. Atmos. Res. 2022, 276, 106238. [Google Scholar] [CrossRef]
  26. Ren, Z.; Tian, Z.; Wei, H.; Liu, Y.; Yu, Y. Spatiotemporal evolution and driving mechanisms of vegetation in the Yellow River Basin, China during 2000–2020. Ecol. Indic. 2022, 138, 108832. [Google Scholar] [CrossRef]
  27. Jiang, W.; Niu, Z.; Wang, L.; Yao, R.; Gui, X.; Xiang, F.; Ji, Y. Impacts of drought and climatic factors on vegetation dynamics in the Yellow River Basin and Yangtze River Basin, China. Remote Sens. 2022, 14, 930. [Google Scholar] [CrossRef]
  28. Pei, H.; Liu, M.; Jia, Y.; Zhang, H.; Li, Y.; Xiao, Y. The trend of vegetation greening and its drivers in the Agro-pastoral ecotone of northern China, 2000–2020. Ecol. Indic. 2021, 129, 108004. [Google Scholar] [CrossRef]
  29. Wang, X.; Lei, H.; Li, J.; Huo, Z.; Zhang, Y.; Qu, Y. Estimating evapotranspiration and yield of wheat and maize croplands through a remote sensing-based model. Agric. Water Manag. 2023, 282, 108294. [Google Scholar] [CrossRef]
  30. Kang, S.; Eltahir, E.A. North China Plain threatened by deadly heatwaves due to climate change and irrigation. Nat. Commun. 2018, 9, 2894. [Google Scholar] [CrossRef]
  31. Xu, H. A remote sensing urban ecological index and its application. Acta Ecol. Sin 2013, 33, 7853–7862. [Google Scholar]
  32. Maimaitituersun, A.; Yang, H.; Aobuliaisan, N.; Maimaitiaili, K.; Chenyu, O. Assessing subtle changes in arid land river basin ecological quality: A study utilizing the PIE engine platform and RSEI. Ecol. Indic. 2025, 170, 113035. [Google Scholar] [CrossRef]
  33. Gan, X.; Du, X.; Duan, C.; Peng, L. Evaluation of Ecological Environment Quality and Analysis of Influencing Factors in Wuhan City Based on RSEI. Sustainability 2024, 16, 5809. [Google Scholar] [CrossRef]
  34. State Administration for Market Regulation; Standardization Administration of China. Technical Guidelines for Evaluation of Beautiful China Construction; State Administration for Market Regulation; Standardization Administration of China: Beijing, China, 2024.
  35. Su, Y.; Lu, C.-Y.; Huang, Y.-F.; Su, Y.-L.; Wang, Z.-L.; Lei, Y.-F. Quantitative analysis of spatio-temporal evolution characteristics of seasonal average maximum temperature and its influence by atmospheric circulation in China from 1950 to 2019. Huan Jing Ke Xue Huanjing Kexue 2023, 44, 3003–3016. [Google Scholar] [PubMed]
  36. Singh, R.; Sah, S.; Das, B.; Jaiswal, R.; Singh, A.K.; Reddy, K.S.; Pathak, H. Innovative and polygonal trend analysis of temperature in agro climatic zones of India. Sci. Rep. 2024, 14, 29914. [Google Scholar] [CrossRef]
  37. Yan, X.; Li, J.; Shao, Y.; Hu, Z.; Yang, Z.; Yin, S.; Cui, l. Driving forces of grassland vegetation changes in Chen Barag Banner, Inner Mongolia. GIScience Remote Sens. 2020, 57, 753–769. [Google Scholar] [CrossRef]
  38. Li, Z. Extracting spatial effects from machine learning model using local interpretation method: An example of SHAP and XGBoost. Comput. Environ. Urban Syst. 2022, 96, 101845. [Google Scholar] [CrossRef]
  39. Gu, Y.; Pang, B.; Qiao, X.; Xu, D.; Li, W.; Yan, Y.; Dou, H.; Ao, W.; Wang, W.; Zou, C. Vegetation dynamics in response to climate change and human activities in the Hulun Lake basin from 1981 to 2019. Ecol. Indic. 2022, 136, 108700. [Google Scholar] [CrossRef]
  40. Shi, H.; Umair, M. Balancing agricultural production and environmental sustainability: Based on economic analysis from North China Plain. Environ. Res. 2024, 252, 118784. [Google Scholar] [CrossRef]
  41. Wei, X.; Yang, J.; Luo, P.; Lin, L.; Lin, K.; Guan, J. Assessment of the variation and influencing factors of vegetation NPP and carbon sink capacity under different natural conditions. Ecol. Indic. 2022, 138, 108834. [Google Scholar] [CrossRef]
  42. Wang, Y.; Tong, X.; Li, J.; Yang, M.; Wang, Y. Impacts of Climate Change and Human Activities on Vegetation Productivity in China. Remote Sens. 2025, 17, 1724. [Google Scholar] [CrossRef]
  43. Jin, K.; Wang, F.; Han, J.; Shi, S.; Ding, W. Contribution of climatic change and human activities to vegetation NDVI change over China during 1982–2015. Acta Geogr. Sin. 2020, 75, 961–974. [Google Scholar]
  44. Yuan, B.; Fu, L.; Zou, Y.; Zhang, S.; Chen, X.; Li, F.; Deng, Z.; Xie, Y. Spatiotemporal change detection of ecological quality and the associated affecting factors in Dongting Lake Basin, based on RSEI. J. Clean. Prod. 2021, 302, 126995. [Google Scholar] [CrossRef]
  45. Lima, L.B.; Franca Rocha, W.J.S.; Souza, D.T.M.; Lobão, J.S.B.; De Santana, M.M.M.; Cambui, E.C.B.; Vasconcelos, R.N. Urban Quality: A Remote-Sensing-Perspective Review. Urban Sci. 2025, 9, 31. [Google Scholar] [CrossRef]
  46. Xu, D.; Yang, F.; Yu, L.; Zhou, Y.; Li, H.; Ma, J.; Huang, J.; Wei, J.; Xu, Y.; Zhang, C. Quantization of the coupling mechanism between eco-environmental quality and urbanization from multisource remote sensing data. J. Clean. Prod. 2021, 321, 128948. [Google Scholar] [CrossRef]
  47. Guo, J.; Xu, D.; Xu, J.; Zhu, R.; Li, N. Long time-series and high-frequency ecological evaluation of Henan section of the Yellow River. Glob. Ecol. Conserv. 2025, 57, e03351. [Google Scholar] [CrossRef]
  48. Zhang, T.; Yang, R.; Yang, Y.; Li, L.; Chen, L. Assessing the urban eco-environmental quality by the remote-sensing ecological index: Application to Tianjin, North China. ISPRS Int. J. Geo-Inf. 2021, 10, 475. [Google Scholar] [CrossRef]
  49. Lu, B.; Yue, S. A study on the mechanism of environmental information disclosure oriented to the construction of ecological civilization in China. Sustainability 2022, 14, 6378. [Google Scholar] [CrossRef]
  50. Zheng, K.; Tan, L.; Sun, Y.; Wu, Y.; Duan, Z.; Xu, Y.; Gao, C. Impacts of climate change and anthropogenic activities on vegetation change: Evidence from typical areas in China. Ecol. Indic. 2021, 126, 107648. [Google Scholar] [CrossRef]
  51. Zou, Y.; Chen, W.; Li, S.; Wang, T.; Yu, L.; Xu, M.; Singh, R.P.; Liu, C.-Q. Spatio-Temporal Changes in Vegetation in the Last Two Decades (2001–2020) in the Beijing–Tianjin–Hebei Region. Remote Sens. 2022, 14, 3958. [Google Scholar] [CrossRef]
  52. Ge, W.; Deng, L.; Wang, F.; Han, J. Quantifying the contributions of human activities and climate change to vegetation net primary productivity dynamics in China from 2001 to 2016. Sci. Total Environ. 2021, 773, 145648. [Google Scholar] [CrossRef]
Figure 1. Study area overview.
Remotesensing 17 02839 g001
Figure 2. Technical flowchart of the study.
Remotesensing 17 02839 g002
Figure 3. Spatial distribution of correlation coefficients between the IRSEI and RSEI.
Remotesensing 17 02839 g003
Figure 4. Comparison of the correlations between the EQI and the IRSEI and RSEI.
Remotesensing 17 02839 g004
Figure 5. Comparison of the correlations between the EQI and the IRSEI and CHEQ_V2.
Remotesensing 17 02839 g005
Figure 6. Distributions of the IRSEI from 2000 to 2020.
Remotesensing 17 02839 g006
Figure 7. IRSEI rating variation Sankey chart.
Remotesensing 17 02839 g007
Figure 8. Trends of the IRSEI from 2000 to 2020 (values in parentheses indicate the percentage of the total area of the region occupied by each trend significance level).
Remotesensing 17 02839 g008
Figure 9. Ranking the importance of climate factors; (a) optimization results of the XGBoost model; (b) ranking results of climate factor importance with the XGBoost method.
Remotesensing 17 02839 g009
Figure 10. Partial correlation coefficients of key climate factors.
Remotesensing 17 02839 g010
Figure 11. Spatial distributions of the drivers of changes in the environmental quality of the NCP from 2000 to 2020 (CC and HA represent climatic change and human activities, respectively).
Remotesensing 17 02839 g011
Figure 12. Spatial distributions of the contributions of climate change and human activities to changes in the ecological quality of the NCP from 2000 to 2020.
Remotesensing 17 02839 g012
Table 1. Data introduction.
DataTime ScaleResolutionUnitSource
MOD09A1June to September from 2000 to 2020500 mGEE platform MODIS series products
MOD11A21000 m
MOD13A1500 m
land use data2000–202030 mZenodo
precipitation1000 mmmNational Tibetan Plateau Data Center
surface temperature°C
potential evapotranspirationmm
soil moisture11,132 mmmGEE Platform ERA5-LAND dataset
wind speedm/s
atmospheric pressurePa
short-wave radiationJ/m2
net thermal radiationJ/m2
China historical high-resolution ecological quality2001–2020500 mNational Earth System Science Data Center
Table 2. Index calculation formula.
IndexFormula
kNDVI NDVI = ( B N I R   B R ) / (   B N I R +   B R ) = 0.0001BNDVI
k N D V I = t a n h ( B N I R B R ) / 2 σ 2
k N D V I = t a n h ( N D V I 2 )
WET WET = 0.1147 B R e d + 0.2489 B N I R l + 0.2408 B B l u e + 0.3132 B G r e e n 0.3122 B N I R 2 0.6416 B S W I R l 0.5087 B S W I R 2
NDBSI S I = ( B N I R + B R ) ( B N I R + B B ) / ( B N I R + B R ) + ( B N I R + B B )
I B I = 2 B S W I R 1 / B S W I R 1 + B N I R B N I R / B N I R + B R + B G / B G + B S W I R 1 2 B S W I R 1 / B S W I R 1 + B N I R + B N I R / B N I R + B R + B G / B G + B S W I R 1
LSTLST = 0.02BLST − 273.15
AI AI = ( 0.35 F + 0.21 G + 0.28 W + 0.11 C + 0.04 B + 0.01 × U ) / A r e a
where BNDVI is the NDVI band of the MOD13A1 data; BRed, BNIR, BBlue, BGreen, BSWIR1, and BSWIR2 correspond to the 1~4, 6, and 7 bands of the MOD09A1 data, respectively; σ is the distance parameter controlling the distance between the NIR and IR bands, which can be simplified as σ = 0.5 (BNIR − BRed); BLST is the LST band of the MOD11A2 data; F, G, W, C, B, and U represent the areas of forestland, grassland, water body, farmland, built-up area, and unused land, respectively, within the statistical area; and Area is the total area of the statistical area.
Table 3. Trend significance level classification.
Sen SlopeMK InspectTrends
β ≤ −0.0005|Z| ≥ 2.58Very significant degraded
2.58 > |Z| ≥ 1.96Significant degraded
1.96 > |Z| ≥ 1.65Slightly significant degraded
1.65 > |Z|No significant degraded
−0.0005 < β < 0.0005 Basically unchanged
β ≥ 0.00051.65 > |Z|No significant improved
1.96 > |Z| ≥ 1.65Slightly significant improved
2.58 > |Z| ≥ 1.96Significant improved
|Z| ≥ 2.58Very significant improved
Table 4. Identification criterion and contribution calculation of the drivers.
β(IRSEIobs)DriversIdentification CriterionContribution
β(IRSEIcc)β(IRSEIHA)Climate ChangeHuman Activities
>0CC&HA>0>0 β ( R S E I c c ) / β ( R S E I o b s ) β ( R S E I H A ) / β ( R S E I o b s )
CC>0<01000
HA<0>00100
<0CC&HA<0<0 β ( R S E I c c ) / β ( R S E I o b s ) β ( R S E I H A ) / β ( R S E I o b s )
CC<0>01000
HA>0<00100
Table 5. IRSEI first principal component contribution rate and payload value of each component.
YearPC1/%kNDVIWETLSTNDBSIAIYearPC1/%kNDVIWETLSTNDBSIAI
200078.820.767 0.176 −0.390 −0.477 0.094 201181.330.921 0.112 −0.297 −0.222 0.098
200181.720.754 0.251 −0.404 −0.453 0.080 201278.530.892 0.099 −0.354 −0.258 0.121
200279.380.844 0.215 −0.363 −0.330 0.087 201381.890.923 0.082 −0.343 −0.144 0.111
200379.550.887 0.146 −0.372 −0.229 0.092 201483.810.901 0.120 −0.280 −0.305 0.104
200475.690.852 0.158 −0.384 −0.315 0.114 201583.080.891 0.102 −0.324 −0.297 0.103
200583.220.896 0.147 −0.303 −0.286 0.094 201683.870.857 0.132 −0.410 −0.278 0.119
200676.50.873 0.142 −0.314 −0.341 0.108 201784.60.896 0.095 −0.368 −0.225 0.113
200783.240.935 0.130 −0.232 −0.234 0.087 201879.340.884 0.075 −0.345 −0.291 0.155
200882.520.939 0.106 −0.242 −0.217 0.103 201980.450.889 0.123 −0.313 −0.305 0.124
200982.420.901 0.148 −0.286 −0.289 0.099 202077.210.914 0.066 −0.254 −0.295 0.154
201082.440.898 0.115 −0.360 −0.221 0.096
Table 6. IRSEI statistical data from 2000 to 2020.
YearMeanMedianS.D.KurtosisSkewnessYearMeanMedianS.D.KurtosisSkewness
20000.400.400.12−0.19−0.1120110.460.460.16−0.390.07
20010.420.410.13−0.430.1520120.440.450.13−0.32−0.12
20020.400.400.13−0.080.1620130.460.460.16−0.730.08
20030.420.420.14−0.420.0920140.460.470.16−0.660.12
20040.400.390.120.200.3720150.460.460.16−0.700.07
20050.450.450.14−0.570.0220160.460.460.14−0.190.24
20060.400.400.13−0.360.2020170.480.480.15−0.56−0.07
20070.450.450.17−0.690.1120180.440.440.130.080.21
20080.440.420.15−0.400.2420190.440.430.15−0.410.13
20090.430.420.15−0.580.1220200.450.450.14−0.310.14
20100.480.480.16−0.48−0.10
Disclaimer/Publisher’s Note: The statements, opinions and data contained in all publications are solely those of the individual author(s) and contributor(s) and not of MDPI and/or the editor(s). MDPI and/or the editor(s) disclaim responsibility for any injury to people or property resulting from any ideas, methods, instructions or products referred to in the content.