Article

Radiometric Correction of Stray Radiation Induced by Non-Nominal Optical Paths in Fengyun-4B Geostationary Interferometric Infrared Sounder Based on Pre-Launch Thermal Vacuum Calibration

1
Shanghai Institute of Technical Physics, Chinese Academy of Sciences, Shanghai 200083, China
2
State Key Laboratory of Infrared Physics, Shanghai Institute of Technical Physics, Chinese Academy of Sciences, 500 Yutian Road, Shanghai 200083, China
3
University of Chinese Academy of Sciences, Beijing 100049, China
*
Author to whom correspondence should be addressed.
Remote Sens. 2025, 17(16), 2828; https://doi.org/10.3390/rs17162828
Submission received: 10 June 2025 / Revised: 3 August 2025 / Accepted: 13 August 2025 / Published: 14 August 2025
(This article belongs to the Special Issue Radiometric Calibration of Satellite Sensors Used in Remote Sensing)

Abstract

The Geostationary Interferometric Infrared Sounder (GIIRS) onboard the Fengyun-4B satellite plays a critical role in numerical weather prediction and extreme weather monitoring. To meet the requirements of quantitative remote sensing and high-precision operational applications for radiometric calibration accuracy, this study, based on pre-launch calibration experiments, conducts a novel modeling analysis of the coupling between stray radiation at the input side and the system’s nonlinearity, and proposes a correction method for nonlinear coupling errors. This method explicitly models and physically traces the calibration residuals caused by stray radiation introduced via non-nominal optical paths under the effect of system nonlinearity, which are related to the radiance of the observed target. Experimental results show that, within the brightness temperature range of 200–320 K, the calibration bias is reduced from approximately 0.7 to 0.3–0.4 K, with good consistency and stability observed across channels and pixels.

1. Introduction

The Geostationary Interferometric Infrared Sounder (GIIRS) onboard the Fengyun-4 (FY-4) series satellites is the world’s first hyperspectral remote sensing payload based on Fourier transform principles deployed in geostationary orbit [1]. The instrument acquires high-spectral-resolution upwelling infrared radiance spectra via interferometry, enabling high-accuracy retrievals of key atmospheric parameters such as temperature profiles, water vapor distributions, and vector wind fields, thereby providing high-quality initial conditions for medium- and high-resolution numerical weather prediction systems [2]. Ensuring excellent calibration accuracy and consistency of the data products is fundamental to achieving these applications, with radiometric calibration accuracy being the key factor affecting the retrieval precision of temperature and humidity as well as the effectiveness of data assimilation [3,4].
On-orbit radiometric calibration errors remain one of the principal bottlenecks limiting the performance of spaceborne remote sensing instruments, among which the system’s nonlinear response constitutes a major source of error. The nonlinearity primarily arises from the infrared detector itself and its associated circuitry. Various hardware-level strategies have been proposed to mitigate system nonlinearities, including designing dual-output interferometer architectures to suppress nonlinear signal components [5], modifying series resistance configurations or introducing positive feedback loops to reduce photoconductive detector nonlinearity [6,7], and switching detector biasing from constant-current to constant-voltage mode to improve linearity [8]. However, hardware enhancements are typically constrained by device structure and operating conditions, leading to limited adaptability under multi-condition, multi-channel, and thermally complex spaceborne observation scenarios [9]. As a result, current mainstream approaches rely on physics-based software correction methods to compensate for system nonlinearities.
Currently, radiometric calibration models of on-orbit Fourier Transform Spectrometers (FTSs) generally treat the nonlinear response as a “black box” process, modeling and correcting it solely based on the overall nonlinear behavior at the system output. Specifically, systems such as TANSO-FTS and TANSO-FTS-2 model the entire interferogram output as the nonlinear subject, performing direct current (DC) offset removal and gain correction first, followed by error compensation using interferogram-level nonlinear coefficients obtained from pre-launch calibration experiments [10,11,12]. The CrIS system, on the other hand, constructs a nonlinear model in the frequency domain based on the overall output spectrum. This method extracts the DC component from deep space (DS) observations, computes DC values under different observation modes using spectral integrals, and determines nonlinear coefficients from ground experiments to achieve frequency-domain nonlinear compensation [13,14,15]. Similarly, FY-3D/HIRAS and FY-3E/HIRAS-II also develop nonlinear models based on the overall spectral response. Due to the use of AC-coupled circuits that block DC components, these systems estimate DC values via empirical models and derive in-band nonlinear correction coefficients using responsivity consistency analysis across multiple temperature points and residual analysis from variable-temperature blackbody calibration [16,17]. For the GIIRS system, prior studies have explored various strategies for modeling and correcting the overall output signal nonlinearity. For instance, some approaches analyze the degree of nonlinearity through residual responses in theoretically zero-response spectral bands and fit ideal out-of-band spectra to extract nonlinear coefficients for frequency-domain error compensation [18,19]. Other studies attempt to build nonlinear models in the spectral domain based on responsivity consistency [20], or correct errors by modeling differences in responsivity under varying incident energy conditions [9]. In summary, although existing calibration methods have made some progress in nonlinear correction, they mostly focus on the overall system output and fail to adequately address coupling errors induced by interfering radiation at the radiation input side under system nonlinearity. Pre-launch thermal vacuum calibration experiments for GIIRS revealed radiation interference introduced via non-nominal optical paths that correlate with pupil radiance. Such interference, when coupled with nonlinearity, leads to systematic calibration bias. Moreover, unlike most FTS systems operating in low Earth orbit, GIIRS in geostationary orbit faces enhanced input side radiative perturbations due to severe thermal environment fluctuations, exacerbating the risk of coupling error impacts [21].
To address the aforementioned issue, this study proposes an extended radiometric calibration method targeting the coupling mechanism between stray radiation at the radiation input side and the system’s nonlinear response. The method is based on the complex-domain Two-Point Radiometric Calibration principle and incorporates the system’s nonlinear characteristics, innovatively introducing radiative modeling of non-nominal optical paths to establish a per-wavenumber and per-pixel coupling calibration model. By explicitly separating the interference radiation components, quantitative correction of system bias is achieved. This method requires no additional observational resources and exhibits strong engineering applicability and adaptability, making it particularly suitable for long-term, high-precision quantitative remote sensing operations under complex thermal environments.
The proposed method is validated using five representative thermal condition datasets from pre-launch calibration experiments of the FY-4B GIIRS instrument. Results show that, within the brightness temperature range of 200–320 K, the proposed correction approach significantly improves radiometric calibration accuracy and demonstrates promising potential in both operational applicability and precision enhancement.

2. Materials and Methods

2.1. Two-Point Radiometric Calibration Model

During on-orbit operations, the GIIRS onboard the FY-4 satellite performs periodic observations of high- and low-temperature radiometric references to calibrate each channel and retrieve the absolute radiance of the observed target [22]. However, due to the complex internal optical configuration and the presence of multiple thermal radiation sources, the interferometric signal received by the detector consists not only of the target radiance component but also of superimposed emissions from various thermal contributors. Neglecting these radiation contributions and their associated phase interference can significantly degrade the accuracy of radiometric calibration. Based on the origin and modulation path of the radiation, four principal types of radiation contributions can be identified [20]:
1.
External radiation via the main optical path: Emitted from the target scene, modulated by the primary optical path, and containing valid spectral information of the observed target.
2.
Thermal emission from fore-optics: Originating from optical components before the interferometer (e.g., scanning mirrors, collimating telescopes). Their thermal emissions follow a path similar to that of the target signal, resulting in modulated interferometric signals with phase characteristics closely aligned with the primary target radiance.
3.
Thermal emission from aft-optics: Emissions from optical components located after the interferometer. Part of this radiation directly reaches the detector as an unmodulated DC term, while a portion is re-modulated via reverse paths, generating interferometric signals with a phase shift of approximately 180° relative to the main path signal.
4.
Internal emission from interferometer components: Thermal radiation from internal optical elements (e.g., beam splitters) that undergo modulation and introduce interferometric signals with complex phase characteristics.
These radiation components coherently superpose in the interferogram, making it difficult to isolate their spectral and phase characteristics in the frequency domain, thereby compromising the subsequent radiometric calibration accuracy [23]. As highlighted by Revercomb, when additional radiation sources within the interferometric system exhibit significant phase deviation from the main path signal, failure to account for inter-component phase differences and calibrating solely based on spectral magnitude can lead to substantial calibration errors [24]. Therefore, it is essential to develop a calibration model in the complex spectral domain, incorporating the phase terms of each radiation flux component to enable more accurate radiometric correction.
In this study, radiation that is modulated by the nominal optical path and enters the detector from external targets is defined as “effective radiation”, while all radiation introduced through non-nominal paths is collectively referred to as “background radiation”. Under this radiation classification framework, the system sequentially observes the cold blackbody ( C B B ) reference source, the hot blackbody ( H B B ) reference source, and the observed target ( m ), and obtains their corresponding raw complex spectra S C B B , S H B B , S m . The system responsivity R is then derived from the known radiances of the reference sources. Subsequently, the contribution of background radiation L 0 to the target spectrum S m is removed using the CBB response, allowing the retrieval of the target’s absolute radiance L [25]. Assuming linear instrument response and temporally stable background radiation during the observation cycle, equivalent phases are assigned to both effective and background radiation, leading to the formulation of the following complex-domain Two-Point Calibration model [26]:
S H B B = R × | L H B B | × e x p ( i × φ e x ) + | L 0 | × e x p ( i × φ i n )
S C B B = R × | L C B B | × e x p ( i × φ e x ) + | L 0 | × e x p ( i × φ i n )
S m = R × | L | × e x p ( i × φ e x ) + | L 0 | × e x p ( i × φ i n )
L H B B , L C B B , and L represent the absolute radiances of the hot reference source, cold reference source, and the observed target, respectively. L 0 denotes the absolute radiance of the background radiation. The operator · represents the modulus, while φ e x and φ i n correspond to the equivalent phases of the effective radiation and the background radiation, respectively. Here, i denotes the imaginary unit. Based on the above definitions, the system spectral responsivity R and the absolute radiance L of the observed target can be derived using Equations (1)–(3):
R = S H B B S C B B L H B B L C B B
L = S m c R + L C B B
Here, S m c = S m S C B B , where the subscript “mc” denotes the differential spectrum after the removal of background radiation. S m c represents the original complex spectral difference between the observed target and the cold reference source, with the contribution of background radiation removed. The Two-Point Radiometric Calibration model introduces a phase compensation term, which effectively suppresses the impact of background radiation on calibration and improves the radiometric consistency and physical interpretability of hyperspectral data. It should be noted that considerable system nonlinearity remains after the application of Two-Point Radiometric Calibration. Moreover, the model is established under the assumption that the phase and radiance of background radiation remain constant under thermally stable conditions. The validity and applicability of this assumption will be discussed in subsequent sections.

2.2. Nonlinear Correction Based on Response Function Modeling

To comprehensively investigate the nonlinear response characteristics of the long-wave channel in the GIIRS system equipped with photoconductive HgCdTe detectors, and their impact on radiometric calibration accuracy, it is necessary to begin with the nonlinear interferometric signal and analyze its representation in the frequency domain. The GIIRS instrument adopts a time-modulated Fourier Transform Infrared (FTIR) spectrometer architecture. Incident radiation is split by a beam splitter into two coherent beams with identical vibration directions and frequencies. These beams are reflected by a fixed mirror and a moving mirror, respectively, and subsequently interfere. The resulting interference pattern is then focused onto the infrared detector. The motion of the moving mirror introduces a varying optical path difference between the two beams, generating a time-dependent interferogram with a continuously changing optical path difference at the detector [27]. The long-wave detection channel of the system spans a wavenumber range of 680–1130 cm−1 and is equipped with a photoconductive HgCdTe detector, whose performance is limited by carrier lifetime. When the incident photon flux exceeds approximately 1019 photons·cm−2·s−1, significant nonlinear response characteristics emerge [28]. Under actual observation conditions, when the energy focused by the collimated optical system surpasses this threshold, nonlinear distortion in the output signal becomes inevitable [29].
The system’s nonlinear response is generally expressed as a polynomial relationship between the detector’s nonlinear output interferogram of the target radiation ( I m ) and the corresponding linear input interferogram ( I ) at the detector [30]:
I m = a 0 + a 1 × I + a 2 × I 2 + a 3 I 3 +
The coefficients a 0 , a 1 , a 2 , and a 3 represent the nonlinear terms of different polynomial orders. Most studies have shown that including up to the second-order nonlinearity achieves an optimal trade-off between model accuracy and interpretability [9,16,17,20]. In addition, since the interferogram undergoes two convolution operations during spectral detection, the in-band signal distortion cannot be precisely quantified. Therefore, this study retains terms up to the second order for modeling and analysis. Considering that the GIIRS signal is transmitted through an AC-coupled amplification circuit, the DC component is blocked by the circuit. The interferogram I in Equation (6) can thus, be decomposed into a DC component and an AC component for simplification, i.e., I = I d c + I a c , where the DC-related terms a 0 , a 1 I d c , and a 2 I d c 2 are eliminated due to the blocking characteristics of the circuit:
I m N o n = a 1 + 2 a 2 I d c × I a c + a 2 I a c 2
I m N o n represents the output signal after DC blocking, considering the second-order nonlinearity of ImI_mIm. The notation “Non” indicates nonlinearity-related physical quantities, while “Lin”, “ac”, and “dc” correspond to linear, alternating current, and direct current components, respectively. According to the spectral modulation principle of Fourier transform spectrometers, the interferogram and the original spectrum are a Fourier transform pair [31]. By applying a Fourier transform to the output:
S m N o n = ( a 1 + 2 a 2 I d c ) × S m a c + a 2 × S m a c S m a c
S m N o n denotes the nonlinear raw spectrum output by the system, and S m a c represents the Fourier-transformed spectrum of the linear input interferometric signal. As shown in Equation (8), the nonlinearity modulates the in-band spectral terms by the DC component and introduces a self-convolution term in the frequency domain. The self-convolution components are primarily distributed in the low-frequency region (0–500 cm−1) and the second-harmonic region (1300–2340 cm−1), and thus, do not interfere with the GIIRS long-wave in-band spectral range. Figure 1 presents the raw spectral outputs of the GIIRS system under observed blackbody brightness temperatures of 200 K, 260 K, and 320 K, with the subfigures clearly illustrating the out-of-band spectrum induced by nonlinearity.
Neglecting the out-of-band self-convolution term, Equation (8) can be approximated as:
S m N o n = ( a 1 + 2 × a 2 × I d c ) × S m a c
The signal S m a c is mapped to radiometric quantities through the system responsivity function:
S m a c = R L i n × L T
L T = L + L 0
L T denotes the absolute radiance of the total incident radiation entering the detection system, which consists of the absolute radiance of the effective target radiation L and the absolute radiance of the background radiation L 0 . R L i n represents the linear system responsivity. A mapping relationship is established between the total incident absolute radiance L T and the observed spectrum under nonlinear response S m N o n using the nonlinear responsivity R N o n , enabling quantitative modeling of the system’s nonlinear response:
S m N o n = R N o n × L T
Based on Equations (9), (10), and (12), the nonlinear system responsivity R N o n can be expressed as:
R N o n = ( a 1 + 2 × a 2 × I d c ) × R L i n
Considering that the DC component of the interferogram typically lies in the low-flux region, and under 100% modulation, its value corresponds to half of the interferogram peak at zero optical path difference, and it is relatively less affected by nonlinearity. Therefore, the nonlinear DC signal I m d c is used as an approximation to replace the linear DC signal I d c , K is a constant [9]:
I d c I m d c = K × v = v l v h S m N o n ( v )
In the linear system, R L i n is a constant. Let v l and v h denote the lower and upper bounds of the effective wavenumber range in the longwave region. By substituting Equation (14) into Equation (13), and defining A 1 = 2 a 2 K × R L i n and A 0 = a 1 × R L i n , the nonlinear responsivity can be further expressed as:
R N o n = A 1 × v = v l v h S m N o n v + A 0
Using the least squares method, the nonlinear coefficients A 1 and A 0 can be estimated based on Equation (15), yielding a responsivity correction associated with the radiance of the observed target. The resulting corrected responsivity is then incorporated into the nonlinear correction process, in conjunction with the complex-domain Two-Point Radiometric Calibration described in Equation (5):
L N o n = S m c N o n R N o n + L C B B
L N o n denotes the absolute radiance of the observed target after nonlinear correction. Let S m c N o n = S m N o n S C B B , where S m c N o n represents the nonlinear raw complex spectral difference between the observed target and the cold reference source, with the contribution of background radiation removed, as used in the Two-Point Calibration model.

2.3. Principles of Parasitic Radiation Correction

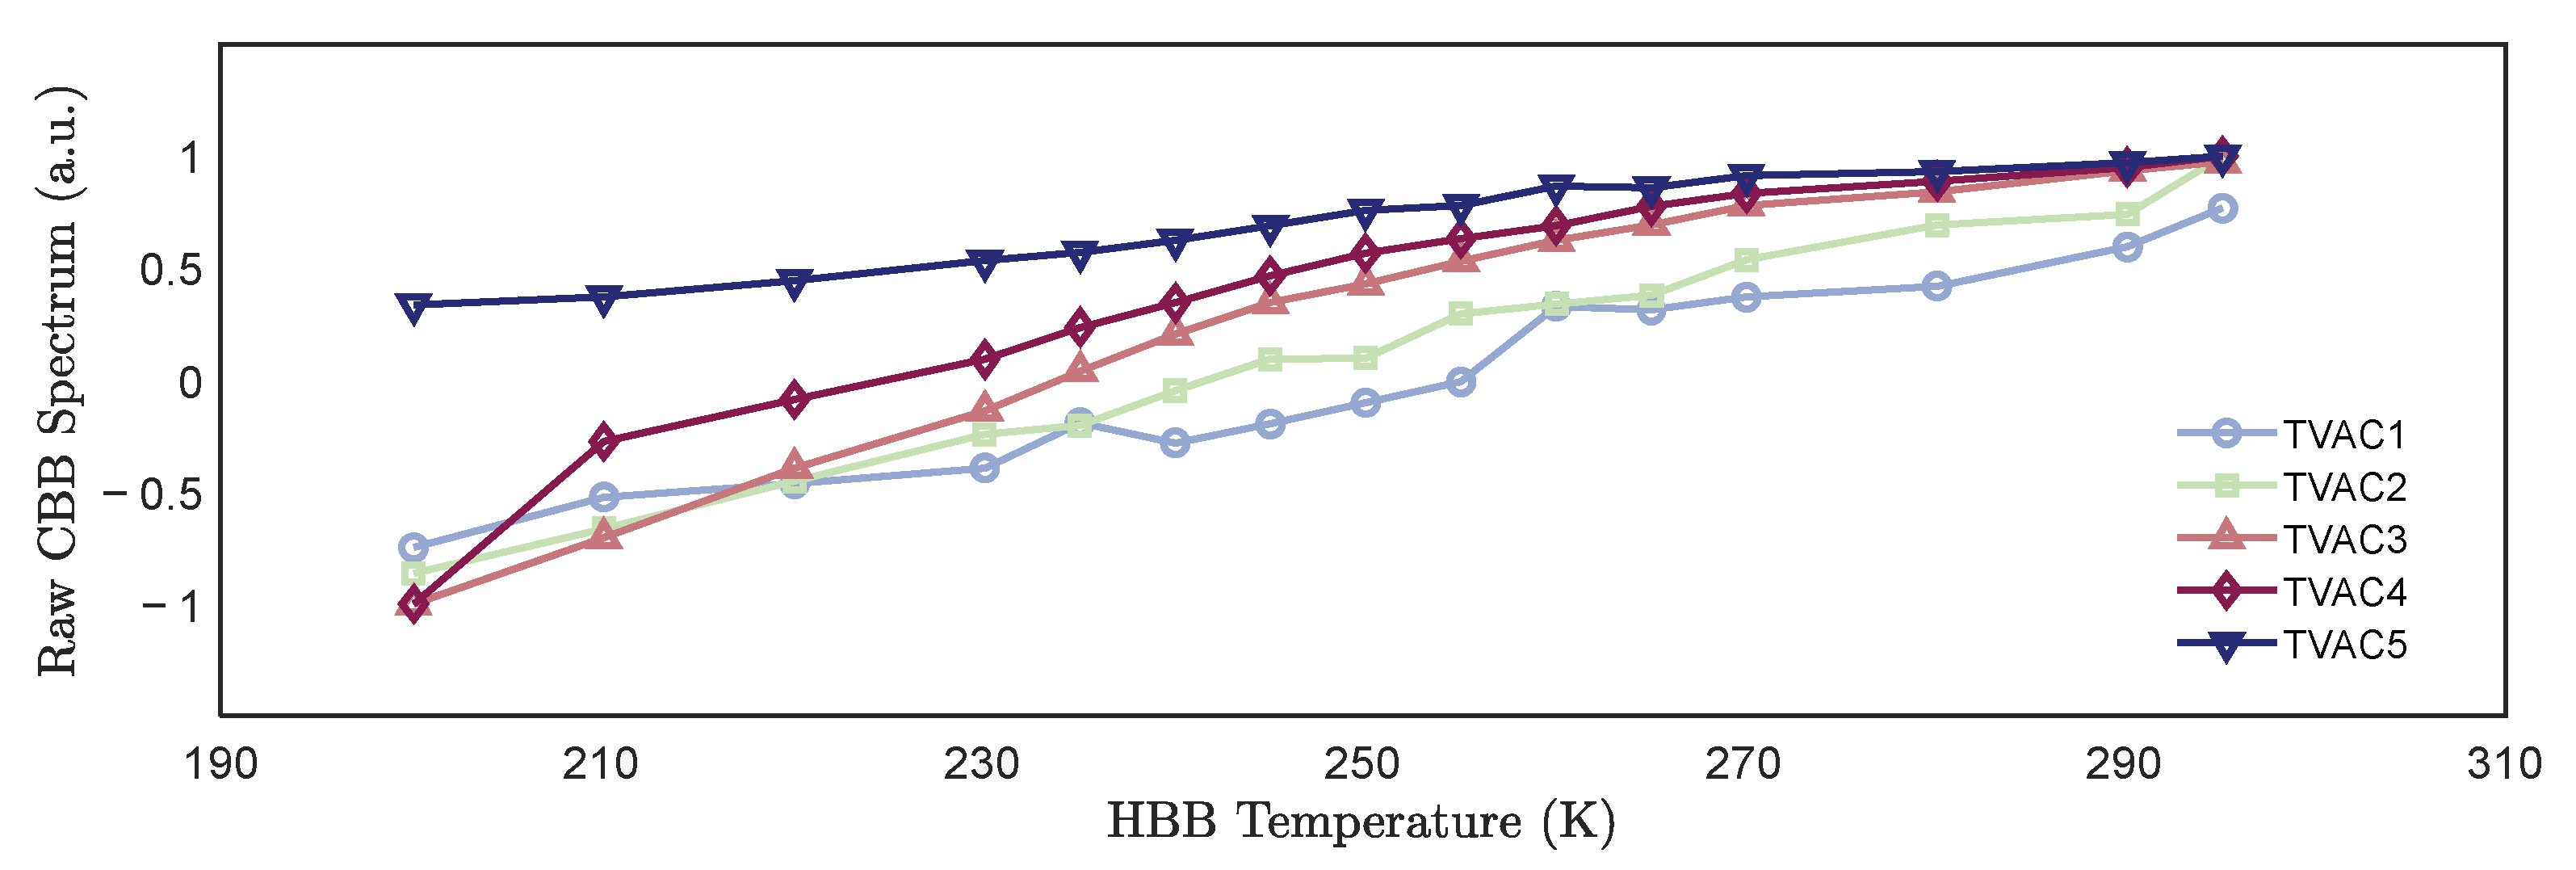
Existing radiometric calibration models for FTS instruments typically assume that the background radiation of the detection system remains stable during the observation period. Based on this assumption, background suppression and nonlinear error correction are carried out. However, pre-launch calibration experiments of GIIRS revealed that, even when the cold blackbody temperature remains constant, the observed spectrum of the cold blackbody exhibits systematic variations with changes in the target radiance when the scan mirror points to hot blackbodies of different temperatures. This experimental result contradicts the assumption of background stability and indicates the presence of additional radiation interference within the system that is correlated with the target radiance but not accounted for in the existing models.
Further analysis indicates that such interference primarily originates from stray radiation introduced via non-nominal optical paths, which can be categorized as follows [23]: (1) External Parasitic Reflection Radiation: Partial thermal exchange occurs between certain external structures (e.g., the baffle) and the blackbody, generating thermal radiation associated with the blackbody’s radiance. Due to the non-ideal emissivity of the blackbody, a portion of this radiation is reflected at the blackbody surface and, subsequently, coupled into the detection system along the main optical path [32]. (2) Internal Parasitic Path Radiation: A portion of the target radiation propagates through non-nominal internal optical paths within the instrument and reaches the detector [33,34]. (3) A fixed difference in the pupil-viewing angles between the cold and hot reference sources exists during observations. Under certain conditions, this angular mismatch can lead to stray radiation interference that is correlated with the target radiance [35]. The above-mentioned radiation is superimposed on the effective signal at the input of the detector, resulting in radiation interference that correlates with the radiance of the observed target. This type of interference is collectively referred to in this paper as “parasitic radiation” (PR).
PR further couples with the system’s nonlinear response, becoming concealed within the overall system output. However, existing radiometric calibration methods primarily focus on modeling and compensating for the global nonlinearity in the output signal [9,10,13], and thus, have difficulty effectively distinguishing and correcting the compound error arising from the coupling between input side radiation interference and system nonlinearity. To address this issue, this study shifts the error analysis upstream to the radiation incidence stage, systematically revealing for the first time, the coupling mechanism between PR at the radiation input side and the system’s nonlinear response. Based on this, a source-end coupling modeling and compensation framework is proposed, enabling explicit characterization and quantitative correction of the nonlinear coupling terms.

2.3.1. Physical Modeling of Parasitic Radiation

To clearly characterize the coupling relationship between parasitic radiation and the radiation from the observed target, the system output spectrum S m M a i n X is modeled as the superposition of the primary optical path signal and the non-nominal path interference components [36].
S m M a i n X = S m M a i n + S m X = R × L T + S m X
In this expression, S m M a i n X denotes the system output spectrum corresponding to the radiation from the primary optical path L T , while S m X represents the additional spectral component introduced by parasitic radiation. The superscript “X” is used to indicate physical quantities affected by parasitic radiation, including the observed spectrum, system spectral responsivity, and absolute radiance. Correspondingly, “Main” refers to quantities associated with the nominal optical path, and “MainX” represents the composite response resulting from the superposition of radiation along both the nominal and non-nominal paths.
Following the modeling approach proposed by Gerace and Montanaro, this study represents the parasitic radiation term as a weighted function of the system output. Considering the structural invariance of the parasitic path during the observation process and the negligible spectral crosstalk along its transmission path, the two-dimensional weighting coefficient matrix W j , k —where indices j and k denote the response channel and the corresponding interfering channel, respectively—is simplified to a wavenumber-dependent function W v [37]:
S m X = W v × S m M a i n X
The system output resulting from both the nominal and non-nominal optical paths at a given wavenumber is denoted as S E v :
S E v = S m M a i n X = S m M a i n + W v × S m M a i n X
Physically, W v   describes the influence strength of parasitic radiation on the system output at a given wavenumber v , quantifying the contribution of parasitic radiation energy per unit spectral interval to the system response.
By combining with the spectral responsivity R , the absolute radiance of parasitic radiation L X is given by:
L X = S m X R
By combining Equations (18)–(20), the expression can be further rewritten as:
L X = X 1 × S E v
Here, X 1 = W v R . Finally, by incorporating Equations (17) and (20), the system output accounting for the influence of parasitic radiation is given by:
S m M a i n X = R × L T + L X

2.3.2. Modeling and Correction of Parasitic Radiation Coupling Error Under Nonlinear System Response

To further account for the coupling between the system’s nonlinear response and the parasitic radiation at the detector input, this study proposes an innovative correction model for nonlinear parasitic radiation coupling errors. Based on Equations (12) and (22), the system response affected by both nonlinearity and parasitic radiation, denoted as S m N o n X is given by:
S m N o n X = R N o n × L N o n X + L 0 + L X
Here, L N o n X denotes the true radiance of the observed target after removing the influence of parasitic radiation. The subscript “NonX” indicates physical quantities under a nonlinear system with parasitic radiation considered. Let b 2 = A 1 × X 1 and b 1 = A 0 × X 1 , and define E as the integrated value of the system output over the longwave spectral range. Then, by combining Equations (15) and (21), the interference term S X , resulting from the coupling of parasitic radiation with the system’s nonlinear response, is given by:
S X = R N o n × L X = b 2 × E × S E v + b 1 × S E v + b 0
The coefficients b 2 and b 1 represent the coupling strength parameters between system nonlinearity and parasitic radiation, and are determined by least-squares fitting. The coefficient b 0 serves as a compensation term for the fitting bias and other uncertainties such as thermal drift from the surrounding environment. Finally, by combining Equations (16) and (24), the interference term induced by the nonlinear coupling of parasitic radiation is removed, yielding the absolute radiance of the observed target after parasitic radiation correction under a nonlinear system, denoted as L N o n X :
L N o n X = S m c N o n X S X R N o n + L C B B
Here, S m c N o n X = S m N o n X S C B B . S m c N o n X represents the nonlinear complex spectral difference between the observed target and the CBB after background radiation removal and considering the influence of parasitic radiation in the Two-Point Radiometric Calibration model. L N o n X denotes the absolute radiance of the observed target after correction for the nonlinear coupling effect of parasitic radiation.

3. Results

To systematically evaluate the effectiveness and applicability of the proposed radiometric correction method in improving infrared calibration accuracy, this study utilizes thermal vacuum (TVAC) calibration data acquired prior to launch from the Geostationary Interferometric Infrared Sounder (GIIRS) onboard the FY-4B satellite. A complete three-stage calibration framework was designed and implemented, consisting of:
(1)
Two-Point Radiometric Calibration (TPRC)—to suppress the influence of background radiation and its associated phase error on the system response;
(2)
Nonlinearity (NL) correction based on the spectral responsivity model—to reduce system errors primarily induced by detector nonlinearity; and
(3)
Parasitic Radiation (PR) correction—to compensate for the error components arising from radiation propagated through non-nominal optical paths and coupled via the system’s nonlinear response.
Through quantitative comparisons of the multi-stage calibration results, the stability of calibration accuracy under varying thermal control conditions and the physical soundness of the proposed model are systematically validated. Furthermore, the final calibration accuracy is compared against current mainstream radiometric calibration approaches, confirming its accuracy gain and practical benefits in real calibration procedures.

3.1. Thermal Vacuum Calibration Experiment Design and Thermal Condition Configuration

To simulate the diverse thermal environments that the satellite may encounter during on-orbit operations, five representative thermal control conditions were designed (see Table 1). By adjusting the temperatures of the scan mirror, cooling components, insulation structures, and radiators, the internal background radiation of the instrument under different thermal coupling states was reproduced. In the ground-based experiments, a cold blackbody with a constant temperature of approximately 77 K was used as the low-temperature reference source. A hot blackbody was used as the high-temperature reference source, with brightness temperatures ranging from 200.15 to 320.15 K. Twenty temperature gradient points were set within this range (see Table 2), covering the main brightness temperature distribution of the observed scenes.
During the experiment, the detection system periodically switched its field of view by means of a two-dimensional scan mirror, alternately observing the CBB and HBB to collect hyperspectral data under multiple brightness temperatures and thermal states. The subsequent sections of this paper will evaluate the performance of the proposed calibration method under various thermal conditions based on these experimental datasets, with a focus on assessing the applicability and stability of the parasitic radiation correction under complex thermal backgrounds.

3.2. Two-Point Radiometric Calibration and Nonlinearity Correction Based on Spectral Responsivity

Under thermally stable system conditions, two blackbodies at 70 K and 300.15 K were used as cold and hot reference sources, respectively, to construct a Two-Point Radiometric Calibration model and perform nonlinearity correction based on the spectral responsivity model. Given that the GIIRS system exhibits independent response characteristics in the wavenumber and detector pixel dimensions, the calibration can be independently performed along both axes. Based on Equations (5) and (16), the nonlinear correction coefficients for each pixel were derived using a least-squares fitting method, enabling the implementation of both TPRC and NL correction. To ensure the physical accuracy of the radiative input, all blackbody brightness temperatures used in the experiment are actual brightness temperatures after spectral calibration across wavenumbers. The corrected brightness temperature is defined as the reference observed brightness temperature.
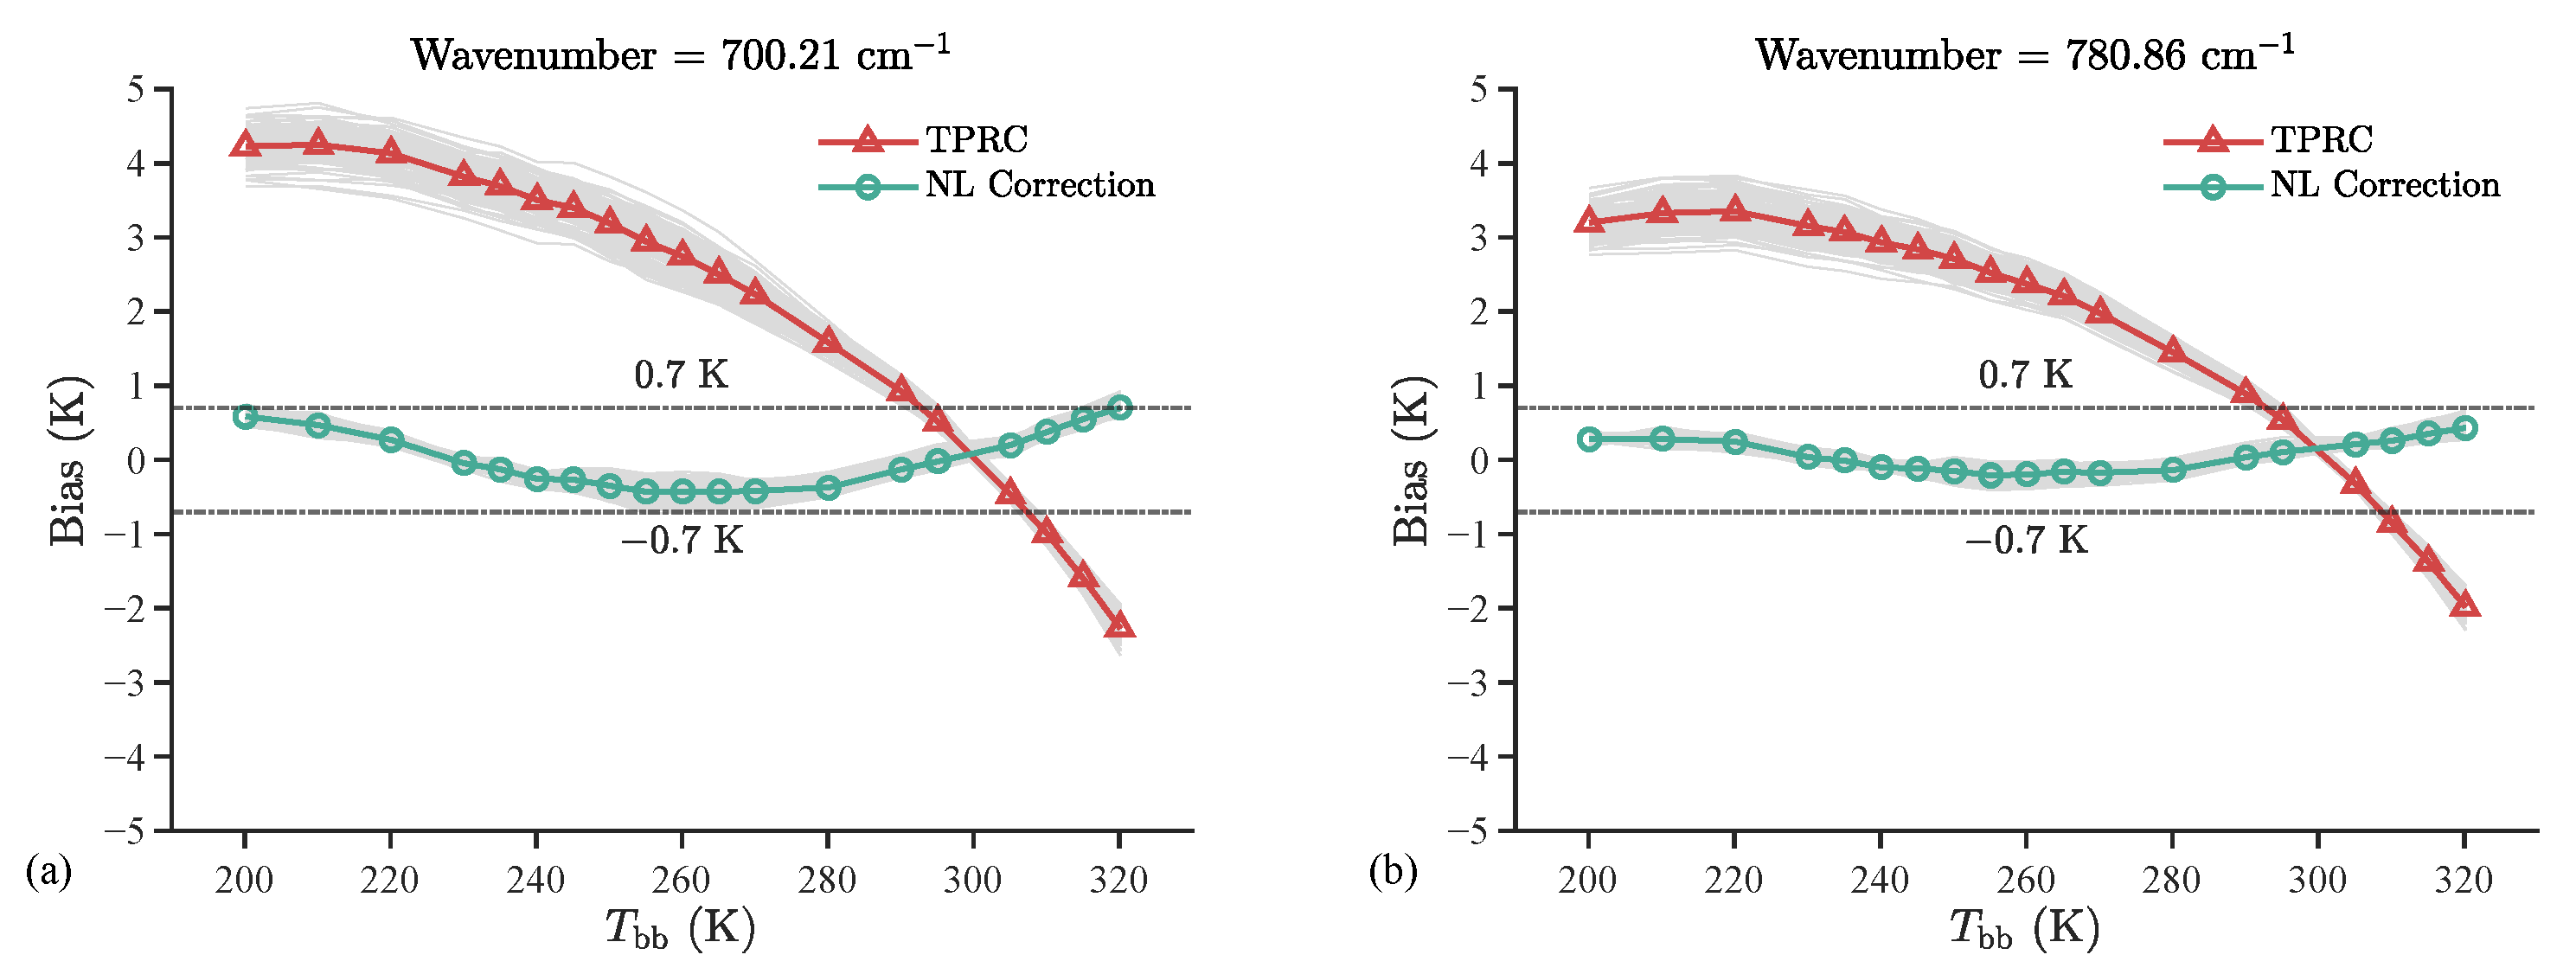
Within the brightness temperature range of 200.15–320.15 K, 124 valid detector pixels (with defective or abnormally responding pixels excluded) were selected for statistical evaluation of single-wavenumber brightness temperature deviations. As shown in Figure 2, the TPRC results exhibit a noticeable systematic nonlinearity error: when the target brightness temperature is lower than that of the hot reference source, the calibrated brightness temperature is overestimated; conversely, it is underestimated when the target temperature is higher than the reference. After applying NL correction, this nonlinear bias is significantly reduced—the maximum deviation in the low brightness temperature range is reduced from approximately 4 K to within 0.7 K. However, residual systematic deviations still exist in the calibrated results, showing a brightness-temperature-dependent trend that first decreases and then increases. This behavior indicates that conventional NL correction has limitations in fully characterizing the complex nonlinear response behavior of the system.

3.3. Correction of Parasitic Radiation

To further eliminate the brightness temperature-dependent residuals that remain after NL correction, this study proposes a novel parasitic radiation correction method based on physical modeling. This method constructs a physical model describing the nonlinear coupling of parasitic radiation introduced via non-nominal optical paths, enabling the identification of residual spectral components introduced by such effects and establishing a corresponding compensation model for the system output. Based on Equation (25), parasitic radiation correction coefficients for each longwave channel pixel under different TVAC thermal conditions were derived using a least-squares fitting approach over the brightness temperature range of 200.15–320.15 K, using measured spectral data. Considering that the parasitic radiation path remains relatively stable across different thermal conditions, the correction coefficients are theoretically expected to be consistent. The results confirm good consistency among different conditions; therefore, the mean value is adopted as the final correction coefficient. The parameter b 0 is independently derived from the measured spectrum of the 300.15 K blackbody under each thermal condition and serves to compensate for systematic errors caused by model approximations, as well as to absorb minor fluctuations induced by thermal environmental perturbations.
After applying the PR correction, the calibration accuracy was further quantitatively evaluated. Figure 3 presents the mean single-wavenumber brightness temperature deviations for all detector pixels within the 200–320 K range under thermal vacuum conditions TVAC1–TVAC5. The results demonstrate that PR correction effectively suppresses the residual systematic deviation trends remaining after NL correction, reducing the mean brightness temperature deviation from approximately 0.7 K to around 0.3 K. Compared with conventional Two-Point Radiometric Calibration and NL correction, the proposed method achieves a significant improvement in calibration performance.

3.4. Comprehensive Evaluation of the Longwave Channel

To comprehensively evaluate the stability and applicability of the proposed parasitic radiation PR correction method under various thermal conditions and observed brightness temperatures, the analysis scope is extended from a single wavenumber to the entire longwave channel. On this basis, a representative detector pixel (FOV-73) was selected, and the calibration performance under different correction strategies was systematically compared across three typical brightness temperature scenarios (260.15 K, 280.15 K, and 320.15 K), combined with five thermal vacuum conditions (TVAC1–TVAC5).
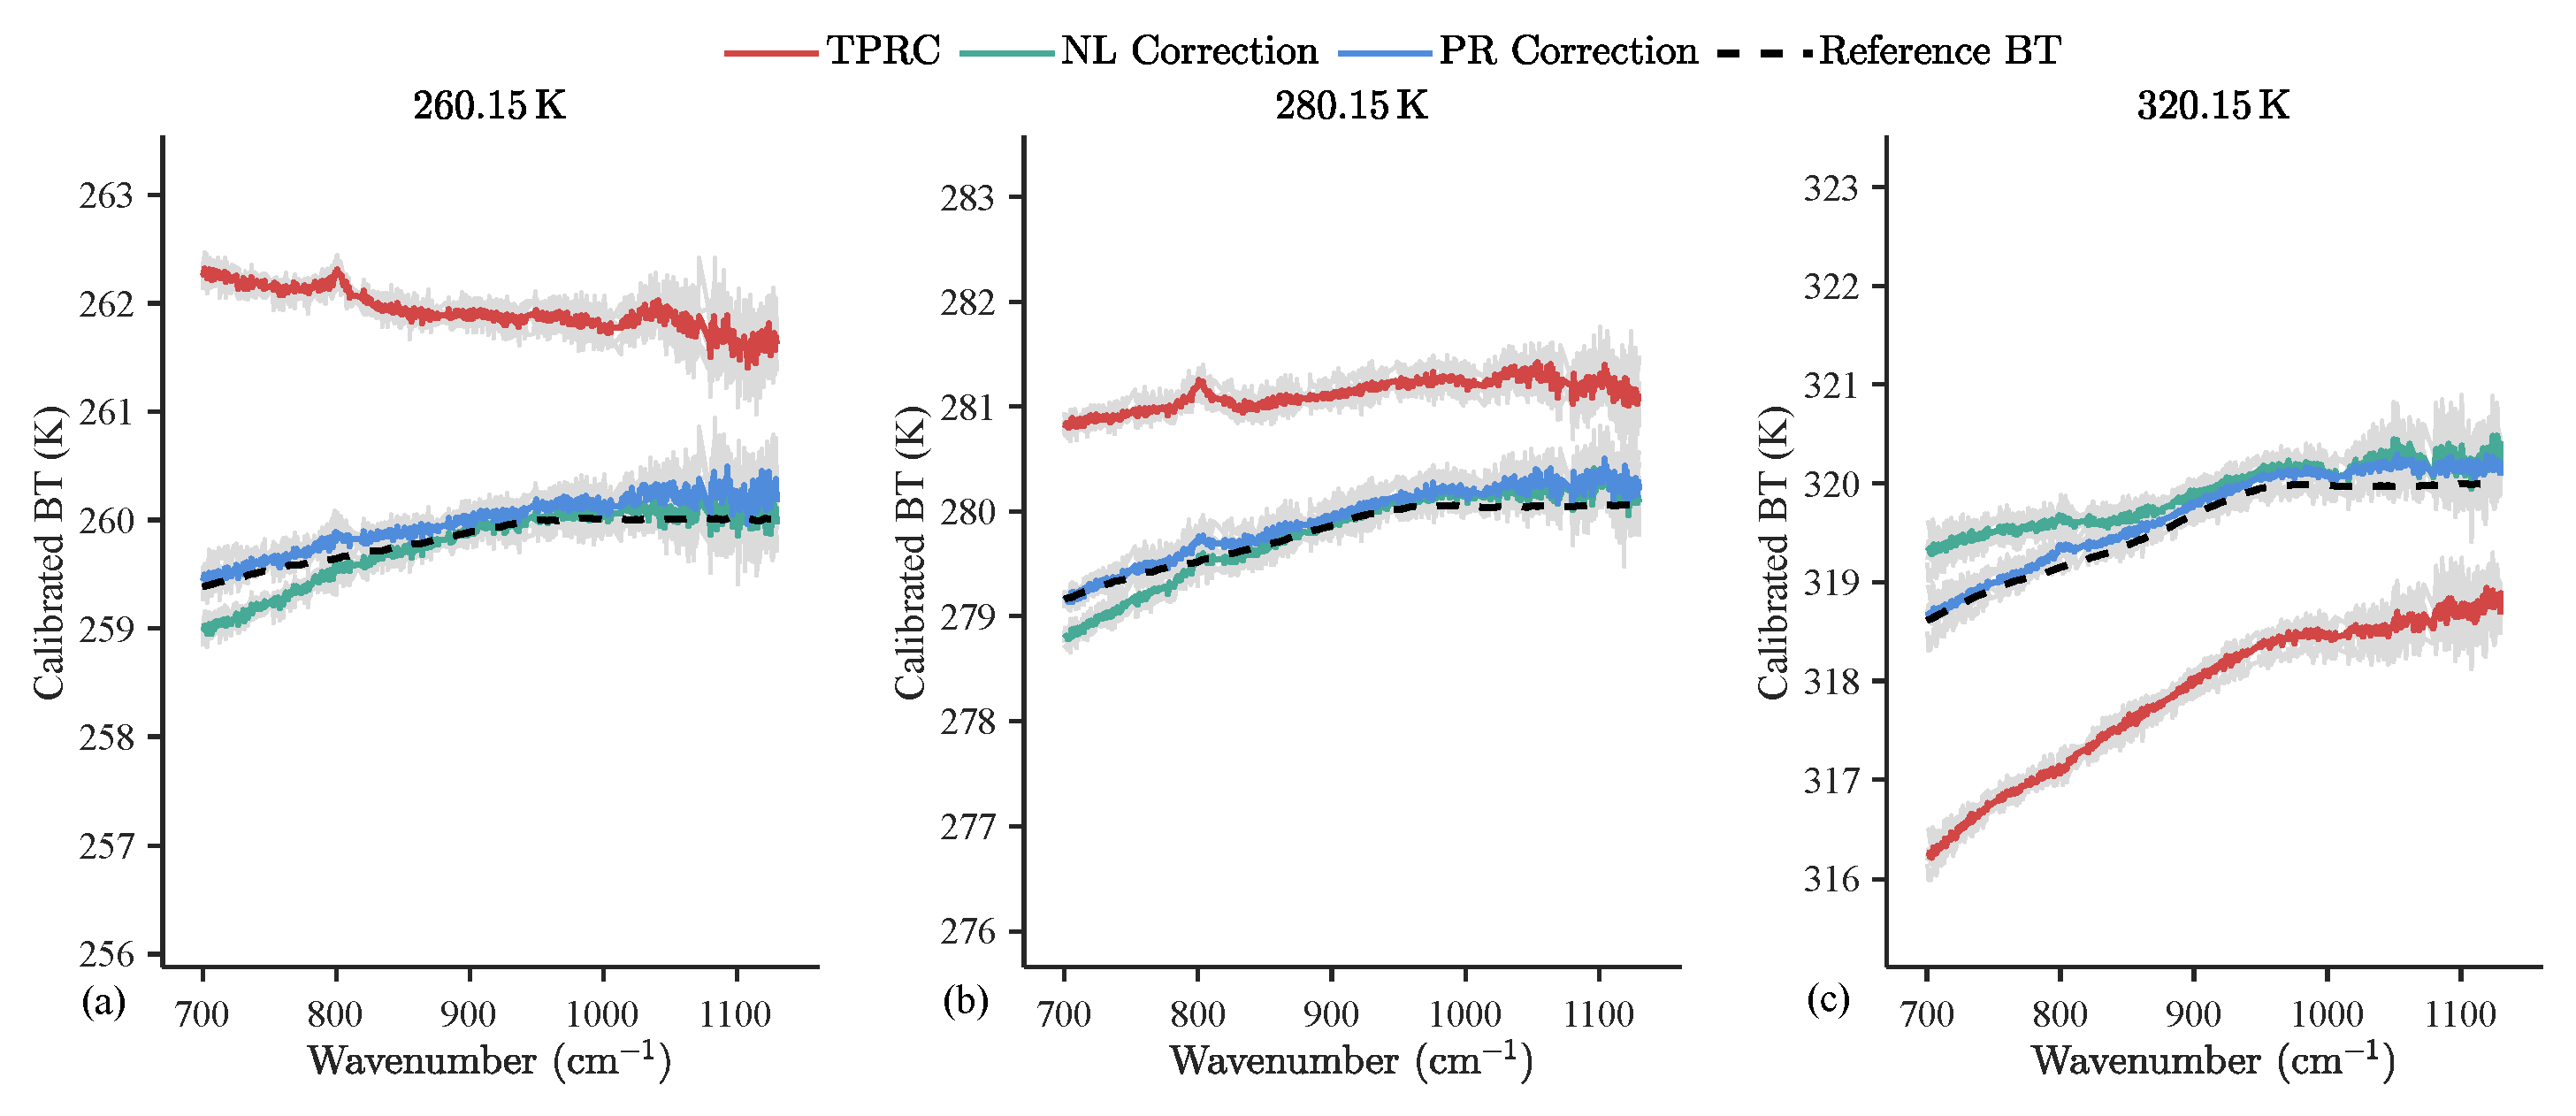
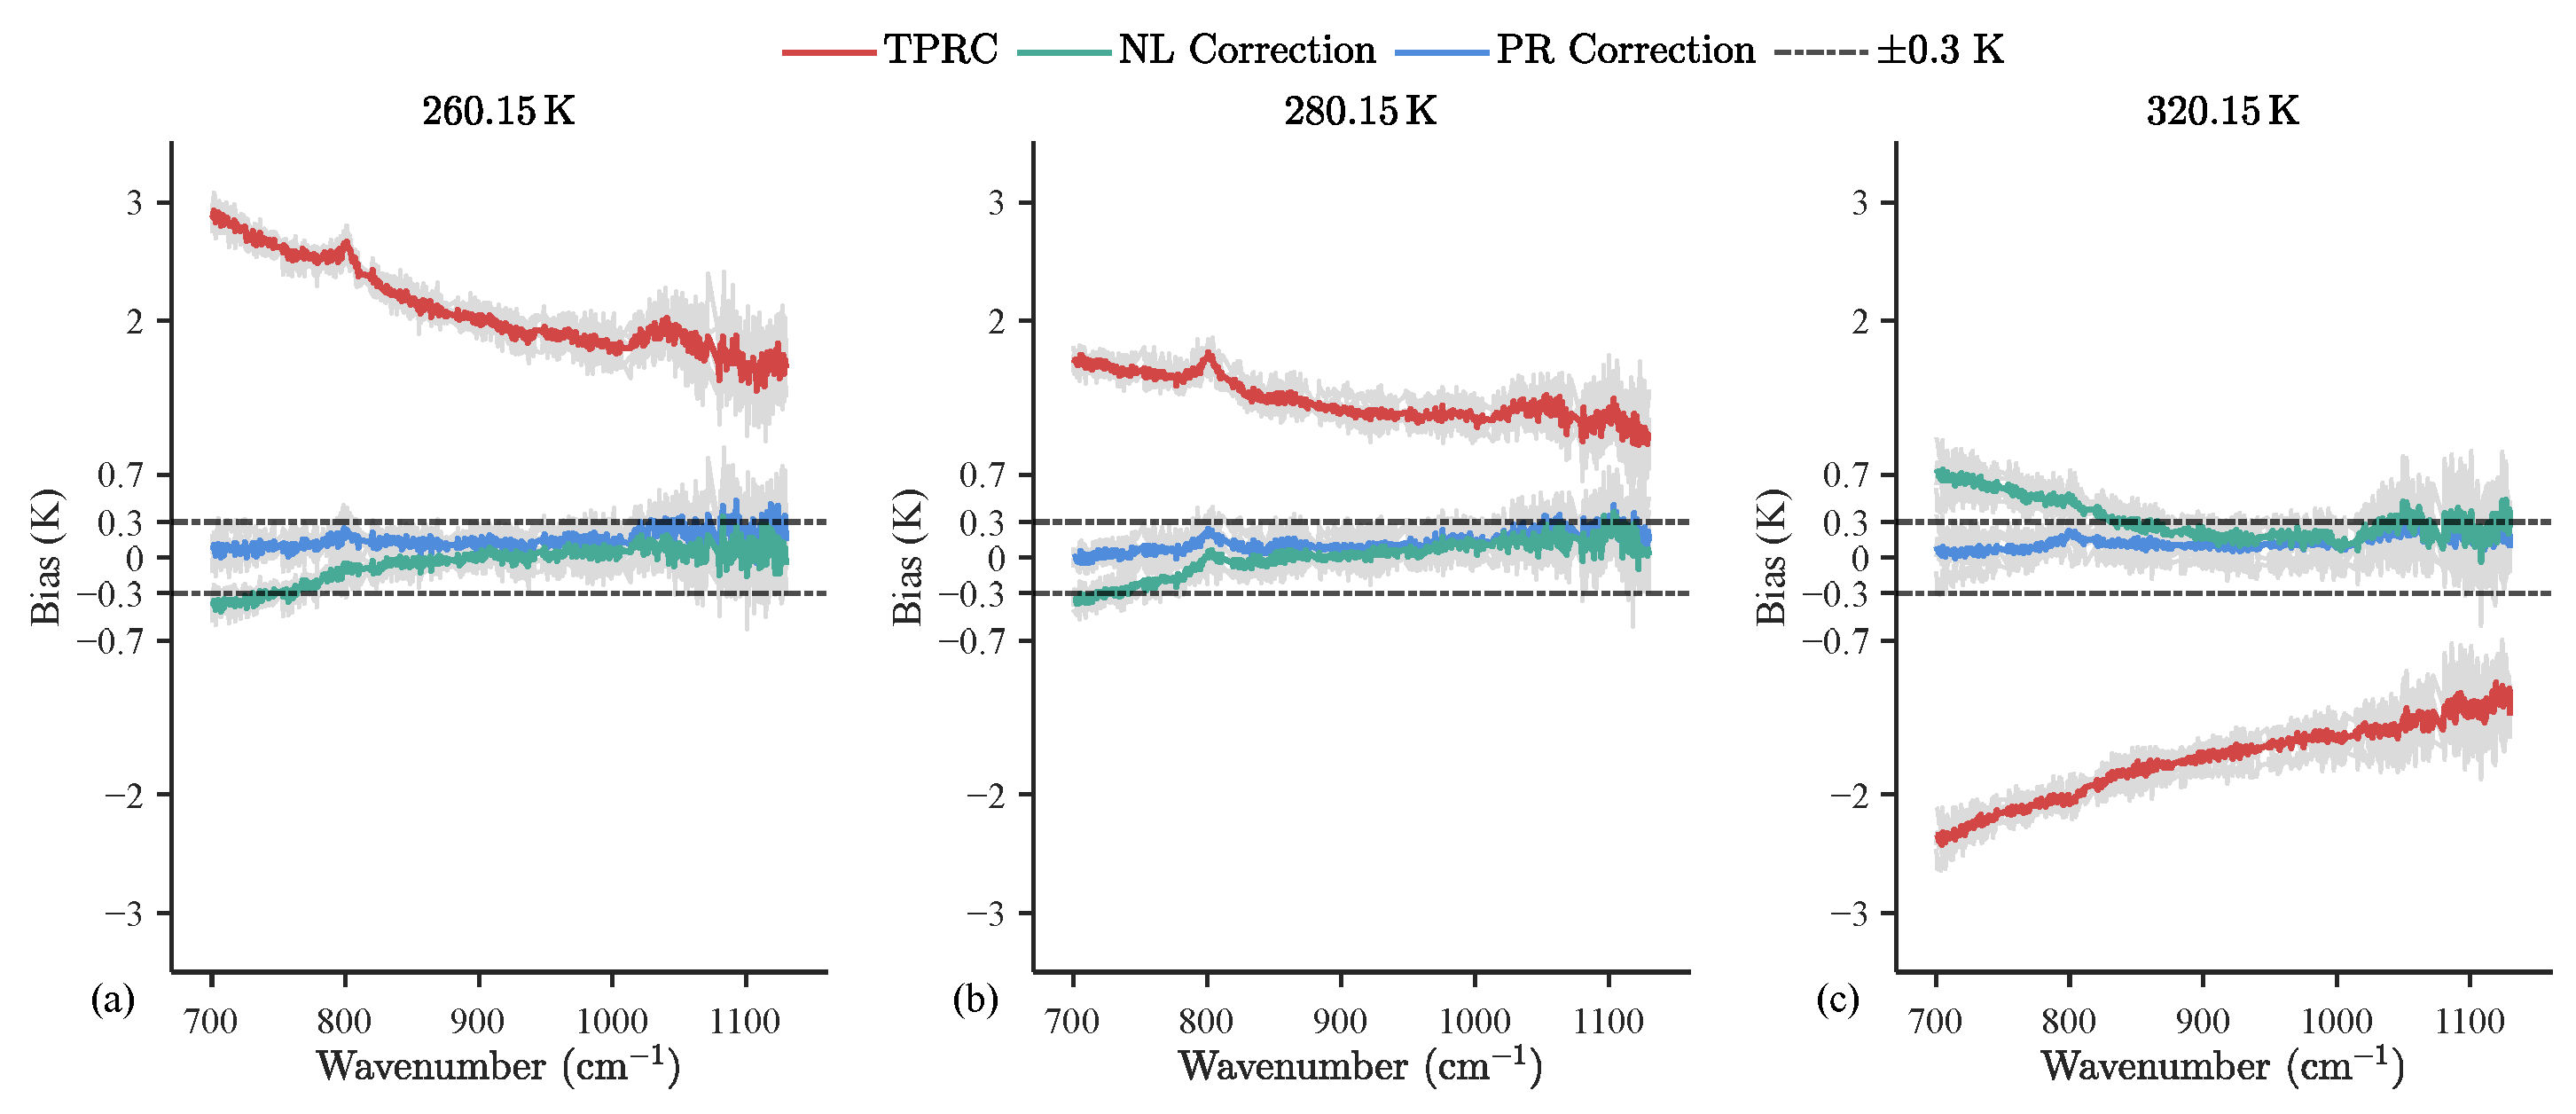
As shown in Figure 4, the system responses obtained using different correction strategies exhibit significant discrepancies under identical physical conditions. The Two-Point Radiometric Calibration and NL correction methods have limited capability in suppressing systematic errors. In contrast, the PR correction demonstrates improved brightness temperature consistency and convergence across multiple thermal states. To further quantify the error characteristics of each method, the calibration bias distributions of the three correction strategies were statistically analyzed for the FOV-73 pixel. As illustrated in Figure 5, the 700–900 cm−1 spectral region is identified as a parasitic radiation-sensitive band. Within this range, incident-radiation-dependent deviations remain after NL correction. Specifically, brightness temperature deviations tend to be negative at lower target temperatures (260.15 K, 280.15 K), and positive at higher target temperature (320.15 K). In contrast, the PR correction effectively suppresses this deviation trend and improves the calibration accuracy from approximately 0.7 K to within 0.3 K.
A systematic evaluation covering multiple thermal states was further conducted to comprehensively validate the performance of the proposed parasitic radiation (PR) correction method. This evaluation spans all longwave channels under five thermal vacuum (TVAC) conditions (TVAC1–TVAC5), 20 preset blackbody temperature points, and 124 valid spatial pixels. The corresponding results, along with the nonlinear response analysis based on pre-launch TVAC calibration data of the GIIRS onboard the FY-4B satellite, indicate that within the observed brightness temperature range of 200–320 K, existing nonlinearity NL correction methods can consistently constrain the calibration error to within approximately 0.7 K [9,20]. Therefore, this error level is used as a performance baseline in this study to quantitatively evaluate the improvement brought by PR correction under various thermal conditions.
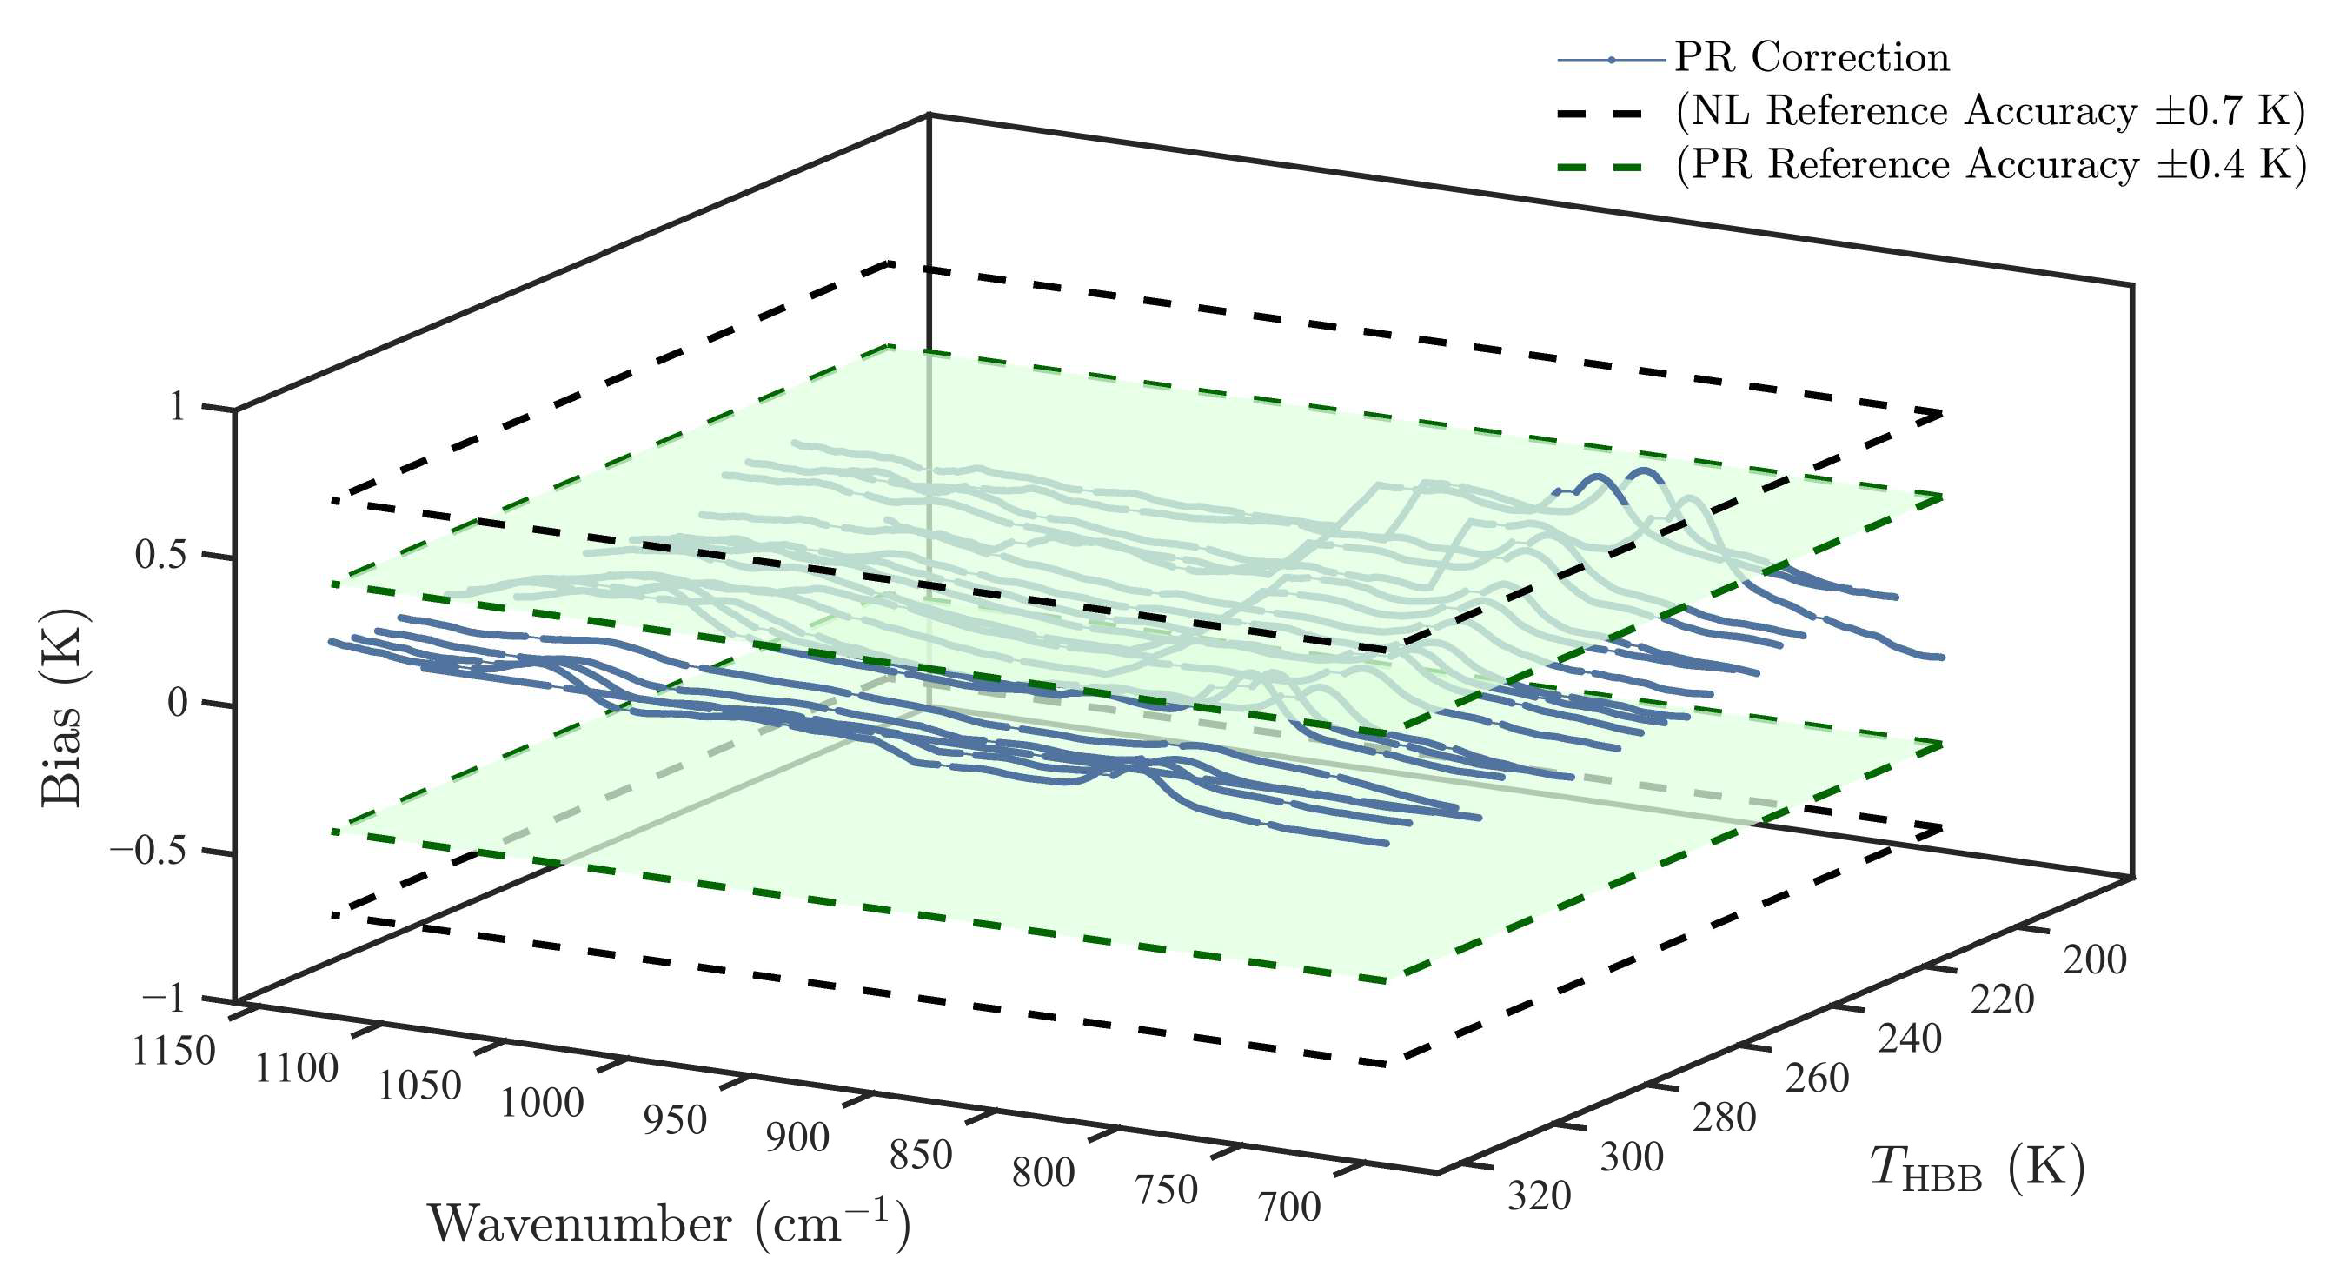
As shown in Figure 6, the application of PR correction in the parasitic radiation-sensitive spectral range of 700–900 cm−1 significantly improves the calibration accuracy in the low brightness temperature region (200–235 K), with most channels showing deviations below 0.4 K, except for a few outliers at low brightness temperatures. In the mid-to-high brightness temperature range (240–320 K), the correction results are more stable, and deviations remain consistently below 0.4 K. This demonstrates that the proposed method offers robust temperature adaptability and spectral consistency across a wide brightness temperature range. (Defective pixels and anomalous channels have been excluded from this analysis.)
To further evaluate the improvement in calibration accuracy offered by the PR correction method compared to existing algorithms and to assess its stability across the full field of view, a statistical analysis was conducted on the brightness temperature deviations of all detector pixels under a target brightness temperature of 280 K. As shown in Figure 7, the systematic deviations associated with target radiance observed in panel (a) are largely eliminated in panel (b) following the application of PR correction. Except for a few channels with inherently low responsivity, the calibration errors for all pixels are confined within 0.4 K. These results demonstrate that the proposed method achieves excellent spatial consistency and robustness across the FOV, making it well suited for high-accuracy radiometric calibration scenarios.

4. Discussion

Based on the prelaunch thermal vacuum calibration data of GIIRS, this study proposes a correction framework for composite errors resulting from the coupling between radiation introduced via non-standard optical paths and the system’s inherent nonlinear response. Using the 0.7 K calibration accuracy achieved by existing methods as a benchmark, the proposed method is systematically validated under representative thermal conditions, demonstrating its effectiveness in suppressing brightness temperature deviations and highlighting its advantage in calibration accuracy improvement.

4.1. Analysis of Detector Nonlinearity and Two-Point Radiometric Calibration Errors

The Two-Point Radiometric Calibration model is suitable for systems with stable spectral responsivity. However, as shown in Figure 2 and Figure 4, when only two-point calibration is applied, the longwave channels of GIIRS exhibit significant brightness temperature biases: calibrated temperatures are overestimated when the target temperature is lower than the hot reference source, and underestimated when it is higher. These systematic errors mainly stem from the electrical and material characteristics of the photoconductive mercury cadmium telluride (PC-HgCdTe) detectors. Under quasi-constant current biasing, the resistance variation in these detectors exhibits a limited ability to be converted into output voltage in a strictly linear manner; additionally, at high incident radiance levels, the shortening of carrier lifetime in the detector material causes the responsivity to decrease with increasing radiance.
Due to these nonlinearities, the Two-Point Calibration model, constructed with fixed hot and cold reference sources, is insufficient to characterize the detector response across a wide brightness temperature dynamic range, limiting its calibration accuracy. To address this issue, a NL correction algorithm based on spectral responsivity modeling is introduced in this study to effectively suppress detector-dominated nonlinear error sources. After NL correction, the brightness temperature bias is reduced from approximately 4 K to within 0.7 K, significantly improving calibration accuracy. However, residual non-monotonic trends with respect to target brightness temperature remain (see Figure 3 and Figure 5), which have also been observed in multiple independent calibration studies [9,20]. This suggests the existence of unmodeled radiative interference mechanisms within the system, necessitating further investigation into their physical origins and correction approaches.

4.2. Validation of Calibration Accuracy Enhancement Achieved by PR Correction

During the thermal vacuum (TVAC) experiments, unexpected inter-spectral response fluctuations were observed in the cold blackbody channels as the hot blackbody temperature varied. As shown in Figure 8, the average normalized spectral response of the CBB pixels within the 700–900 cm−1 band increases with the HBB temperature, despite the CBB temperature remaining constant. This behavior indicates the presence of non-ideal energy coupling mechanisms in the instrument that are correlated with the radiance of the observed target. The primary source of this coupling is thermal emissions from external structural components associated with the HBB, which is reflected off the CBB surface and, subsequently, enters the detection system. Additionally, a portion of the radiance propagates to the detector through internal non-nominal optical paths, violating the fundamental assumption of background radiance stability in conventional calibration models. Previous studies have also identified such optical stray radiation effects in on-orbit GIIRS observations, manifesting as anomalous responses in deep space background pixels. This further confirms the widespread presence and on-orbit impact of parasitic radiation [38].
To address the calibration residuals introduced by parasitic radiation under nonlinear system responses, this study proposes a physically based correction method. The proposed method innovatively shifts the modeling of nonlinear errors to the radiative input stage, systematically revealing the coupling mechanism between parasitic radiation and nonlinear response, and establishes a source-end modeling and compensation framework. Based on structural analysis and system responsivity models, the parasitic radiation correction introduces an interpretable PR response term into the original calibration process, enabling the separation and correction of parasitic contributions from the total signal without additional measurements. The method is modular and can be seamlessly integrated with conventional two-point radiometric calibration and nonlinear correction, forming a three-stage complementary calibration framework that significantly improves calibration accuracy and stability.
To evaluate the effectiveness of the proposed method, a quantitative comparison and accuracy assessment was conducted using the 0.7 K calibration accuracy achieved by previous studies on the GIIRS longwave channel as the reference benchmark [9,20]. As shown in Figure 3, in channels sensitive to parasitic interference, the PR correction further improves the calibration accuracy from 0.7 K to better than 0.3 K. Figure 4 and Figure 5 demonstrate that the three-stage calibration process (two-point calibration + NL correction + PR correction) effectively suppresses systematic deviations across the full spectral range. After NL correction, the calibration error is reduced from the initial 3–4 K to below 0.7 K; following PR correction, the accuracy is further improved to within 0.3 K. In the 700–900 cm−1 spectral region, and under multiple thermal control conditions (TVAC1–TVAC5), the proposed method exhibits excellent stability and inter-channel consistency, eliminating the target radiation-related systematic deviations that remained after NL correction. Statistical analyses over all thermal conditions, spectral bands, brightness temperatures, and pixels (Figure 6 and Figure 7) show that the PR correction stabilizes the brightness temperature error within 0.4 K for the vast majority of channels, outperforming the 0.7 K accuracy achieved by existing approaches.

4.3. Evaluation of Methodological Boundaries and Prospects for Model Extension

Although the proposed parasitic radiation correction method has achieved significant improvements in radiometric calibration accuracy for the longwave channel of the FY-4B GIIRS, several issues remain to be addressed, offering key directions for future research:
(1)
Calibration accuracy in the low brightness temperature range: Due to the high sensitivity of parasitic radiation interference in the 700–900 cm−1 spectral region, the PR correction yields relatively poor performance in other channels with low brightness temperatures. Future efforts should focus on model refinement across all longwave channels and the optimization of ground-based thermal simulation experiments through the integration of more on-orbit thermal condition data, in order to more realistically replicate the in-orbit thermal environment. In parallel, the calibration brightness temperature range should be extended—particularly for observed targets with temperatures below 200 K—to improve calibration accuracy and robustness in this low-temperature regime.
(2)
On-orbit adaptability and dynamic update mechanism of calibration coefficients: The temperature-variable blackbodies used in pre-launch calibration possess stable radiative characteristics. However, during in-orbit operations, target radiance exhibits substantial spatiotemporal variability, and the coupling behavior of parasitic radiation may vary with observation scenarios, scan mirror angles, and thermal field conditions. Future efforts should incorporate key instrument parameters—such as temperature field distributions and scan mirror orientations—into the development of a dynamic correction model that characterizes the temporal and spatial variations in parasitic radiation effects. Moreover, long-term changes in instrument response due to thermal drift and aging must be taken into account. It is recommended that periodic in-orbit calibrations using temperature-variable blackbodies to update both nonlinear and parasitic radiation correction coefficients are performed in real time, thereby maintaining high-accuracy radiometric performance over the instrument’s operational lifespan.
(3)
Optical modeling of parasitic radiation paths: The geometric structure and energy transfer mechanisms of parasitic radiation paths have not yet been systematically validated via optical simulations. Future studies should integrate optical modeling and radiative transfer simulations to quantify the coupling properties of non-nominal paths, with validation through ground-based experiments to enhance physical realism and correction accuracy.
(4)
Cross-platform applicability: The proposed method is primarily designed for infrared Fourier spectrometers with significant nonlinear responses (e.g., photoconductive HgCdTe detectors). Future work should investigate its applicability and generalization to other infrared sensing platforms, supporting broader demands for infrared radiometric calibration.

5. Conclusions

This study proposes a compensation method for nonlinear coupling errors caused by parasitic radiation at the radiation input side, aiming to enhance the calibration accuracy of GIIRS infrared hyperspectral data and meet the increasing demands of quantitative remote sensing applications. Based on the thermal vacuum calibration experiments conducted prior to the launch of FY-4B, the nonlinear response characteristics of GIIRS and its coupling effects with parasitic radiation were systematically analyzed. The results reveal that conventional nonlinear modeling focused solely on overall system output exhibits limitations in addressing coupling errors introduced at the input stage.
To overcome this, the error modeling is shifted upstream to the radiative input stage. A novel coupling model between input-side parasitic radiation and the system’s nonlinear response is developed for the first time, forming the basis for an explicit, source-end correction framework. The proposed integrated calibration procedure includes (1) Two-Point Radiometric Calibration based on hot and cold blackbodies to suppress background radiation and phase-induced perturbations; (2) Nonlinear error modeling and correction driven by system spectral responsivity, aimed at compensating detector-dominated nonlinear deviations; (3) PR-induced error correction based on physical modeling and source attribution. This method exhibits strong engineering adaptability, can be seamlessly integrated into existing onboard calibration workflows, and does not require additional observation resources.
Experimental results show that within the brightness temperature range of 200–320 K, the proposed method effectively reduces the residual calibration error from approximately 0.7 to 0.3–0.4 K. It significantly improves channel-wise consistency and pixel-level spatial stability, thereby enhancing the application potential of GIIRS data in high-precision quantitative remote sensing.

Author Contributions

Conceptualization, X.L. and Y.Z. (Yaopu Zou); methodology, X.L., Y.Z. (Yaopu Zou), L.L. and J.Y.; software, X.L.; validation, X.L. and Y.Z. (Yaopu Zou); formal analysis, X.L.; investigation, X.L. and Y.Z. (Yuanshu Zhang); resources, C.H., Y.Z. (Yaopu Zou), Y.Z. (Yuanshu Zhang), X.L., J.Y. and L.L.; data curation, C.H., Y.Z. (Yaopu Zou), Y.Z. (Yuanshu Zhang), X.L., J.Y. and L.L.; writing—original draft preparation, X.L. and Y.Z. (Yaopu Zou); writing—review and editing, X.L.; visualization, X.L.; supervision, X.L. and Y.Z. (Yaopu Zou); project administration, X.L., C.H., L.L. and Y.Z. (Yaopu Zou); funding acquisition, Y.Z. (Yaopu Zou). All authors have read and agreed to the published version of the manuscript.

Funding

This research was funded by the Youth Innovation Promotion Association, Chinese Academy of Sciences (CAS), grant number 2023252. The APC was funded by the same source.

Data Availability Statement

The datasets generated and analyzed during the current study are available from the corresponding author upon reasonable request.

Conflicts of Interest

The authors declare no conflicts of interest.

References

  1. Hua, J.; Wang, Z.; Duan, J.; Li, L.; Zhang, C.; Wu, X.; Fan, Q.; Chen, R.; Sun, X.; Zhao, L. Review of Geostationary Interferometric Infrared Sounder. Chin. Opt. Lett. 2018, 16, 111203. [Google Scholar] [CrossRef]
  2. Huang, P.; Guo, Q.; Han, C. Research on retrieval of temperature profile on cloud based on FY-4A/GIIRS data. Laser Optoelectron. Prog. 2021, 58, 1701002. [Google Scholar]
  3. Xu, X.; Han, W.; Gao, Z.; Li, J.; Yin, R. Retrieval of Atmospheric Temperature Profiles from FY-4A/GIIRS Hyperspectral Data Based on TPE-MLP: Analysis of Retrieval Accuracy and Influencing Factors. Remote Sens. 2024, 16, 1976. [Google Scholar] [CrossRef]
  4. Yang, W.; Chen, Y.; Bai, W.; Sun, X.; Zheng, H.; Qin, L. Evaluation of Temperature and Humidity Profiles Retrieved from Fengyun-4B and Implications for Typhoon Assimilation and Forecasting. Remote Sens. 2023, 15, 5339. [Google Scholar] [CrossRef]
  5. Guelachvili, G.I. Distortion free interferograms in Fourier transform spectroscopy with nonlinear detectors. Appl. Opt. 1986, 25, 4644. [Google Scholar] [CrossRef]
  6. Schindler, R. Nonlinearity correction circuit for photoconductive detector. NASA Tech. Briefs 1986, 10, 47. [Google Scholar]
  7. Rahmelow, K. Electronic influences on an infrared detector signal: Nonlinearity and amplification. Appl. Opt. 1997, 36, 2123–2132. [Google Scholar] [CrossRef]
  8. Carter, R.O.; Lindsay, N.E.; Beduhn, D. A Solution to Baseline Uncertainty Due to MCT Detector Nonlinearity in FT-IR. Appl. Spectrosc. 1990, 44, 1147–1151. [Google Scholar] [CrossRef]
  9. Zou, Y.; Feng, X.; Han, C.; Li, L.; Liang, X.; Qian, J.; Li, X. Research on nonlinear correction algorithm of Fourier transform spectrometer based on responsivity correction. J. Infrared Millim. Waves 2023, 42, 369–376. [Google Scholar] [CrossRef]
  10. Suto, H.; Kataoka, F.; Knuteson, R.O.; Shiomi, K.; Kikuchi, N.; Kuze, A. Updated spectral radiance calibration on TIR bands for TANSO-FTS-2 onboard GOSAT-2. Atmos. Meas. Tech. 2022, 15, 5399–5413. [Google Scholar] [CrossRef]
  11. Kuze, A.; Suto, H.; Shiomi, K.; Urabe, T.; Nakajima, M.; Yoshida, J.; Kawashima, T.; Yamamoto, Y.; Kataoka, F.; Buijs, H. Level 1 algorithms for TANSO on GOSAT: Processing and on-orbit calibrations. Atmos. Meas. Tech. 2012, 5, 2447–2467. [Google Scholar] [CrossRef]
  12. Kuze, A.; Suto, H.; Shiomi, K.; Kawakami, S.; Tanaka, M.; Ueda, Y.; Deguchi, A.; Yoshida, J.; Yamamoto, Y.; Kataoka, F. Update on GOSAT TANSO-FTS performance, operations, and data products after more than 6 years in space. Atmos. Meas. Tech. 2016, 9, 2445–2461. [Google Scholar] [CrossRef]
  13. Knuteson, R.; Tobin, D.; Revercomb, H.; Taylor, J.; DeSlover, D.; Borg, L. Suomi NPP/JPSS Cross-Track Infrared Sounder (CrIS): Non-Linearity Assessment and On-Orbit Monitoring. In Proceedings of the 93rd AMS Annual Meeting, Austin, TX, USA, 6–10 January 2013. [Google Scholar]
  14. Han, Y.; Revercomb, H.; Cromp, M.; Gu, D.; Johnson, D.; Mooney, D.; Scott, D.; Strow, L.; Bingham, G.; Borg, L. Suomi NPP CrIS measurements, sensor data record algorithm, calibration and validation activities, and record data quality. J. Geophys. Res. Atmos. 2013, 118, 12734–12748. [Google Scholar] [CrossRef]
  15. NASA. Joint Polar Satellite System (JPSS) Cross Track Infrared Sounder (CrIS) Sensor Data Records (SDR) Algorithm Theoretical Basis Document (ATBD); NASA: Washington, DC, USA, 2014. [Google Scholar]
  16. Wu, C.; Qi, C.; Hu, X.; Gu, M.; Yang, T.; Xu, H.; Lee, L.; Yang, Z.; Zhang, P. FY-3D HIRAS Radiometric Calibration and Accuracy Assessment. IEEE Trans. Geosci. Remote Sens. 2020, 58, 3965–3976. [Google Scholar] [CrossRef]
  17. Yang, T.; Gu, M.; Shao, C.; Wu, C.; Qi, C.; Hu, X. Nonlinearity correction of FY-3E HIRAS-II in pre-launch thermal vacuum calibration tests. J. Infrared Millim. Waves 2022, 41, 597–607. [Google Scholar] [CrossRef]
  18. Yang, M.; Zou, Y.; Zhang, L.; Han, C. Nonlinear effects of the Fourier transform spectrometer detector and its correction. Infrared Laser Eng. 2017, 46, 1023001–1023007. [Google Scholar] [CrossRef]
  19. Yang, M.; Zou, Y.; Zhang, L.; Han, C. Correction to Nonlinearity in Interferometric Data and Its Effect on Radiometric Calibration. Chin. J. Lasers 2017, 44, 110002. [Google Scholar] [CrossRef]
  20. Li, L.; Ni, Z.; Qi, C.; Yang, L.; Han, C. Pre-launch radiometric calibration of geostationary interferometric infrared sounder on FengYun-4B satellite. Acta Opt. Sin. 2022, 42, 0630001. [Google Scholar] [CrossRef]
  21. Lee, L.; Wu, C.; Qi, C.; Hu, X.; Yuan, M.; Gu, M.; Shao, C.; Zhang, P. Solar Contamination on HIRAS Cold Calibration View and the Corrected Radiance Assessment. Remote Sens. 2021, 13, 3869. [Google Scholar] [CrossRef]
  22. Chen, R.; Gao, C.; Wu, X.; Zhou, S.; Hua, J.; Ding, L. Application of FY-4 atmospheric vertical sounder in weather forecast. J. Infrared Millim. Waves 2019, 38, 285–289. [Google Scholar]
  23. Ben, C.; Shen, H.; Yu, X.; Meng, L.; Cheng, H.; Jia, P. Stray Light Analysis and Suppression for an Infrared Fourier Imaging Spectrometer. Photonics 2024, 11, 173. [Google Scholar] [CrossRef]
  24. Revercomb, H.E.; Buijs, H.; Howell, H.B.; LaPorte, D.D.; Smith, W.L.; Sromovsky, L.A. Radiometric calibration of IR Fourier transform spectrometers: Solution to a problem with the High-Resolution Interferometer Sounder. Appl. Opt. 1988, 27, 3210–3218. [Google Scholar] [CrossRef]
  25. Yin, S.; Ying, X.; Chen, H.; Chen, Z.; Xiang, L. Study on Nonuniformity Online Calibration and Correction of Fourier Transform Infrared Imaging Spectrometer. Infrared Technol. 2014, 36, 567–572. [Google Scholar]
  26. Liu, J.; Li, Z.; Li, J.; Liu, L.; Guo, H.; Wang, J. Phase Characterizing and Processing in Fourier Transform Spectroscopy. Spectrosc. Spectr. Anal. 2020, 40, 3328–3335. [Google Scholar]
  27. Yue, S.; Lai, J.; You, W.; Bo, W.; Liu, P.; Jun, Q. Analysis and elimination of glitch peak disturbance in time-modulated FTIR imaging spectrometers. In Proceedings of the Eighth Symposium on Novel Photoelectronic Detection Technology and Applications, Kunming, China, 9–11 November 2021; SPIE: Bellingham, WA, USA, 2022; pp. 46–53. [Google Scholar]
  28. Bartoli, F.; Allen, R.; Esterowitz, L.; Kruer, M. Auger-limited carrier lifetimes in HgCdTe at high excess carrier concentrations. J. Appl. Phys. 1974, 45, 2150. [Google Scholar] [CrossRef]
  29. Sun, Y.; Xu, L.; Shen, X.; Jin, L.; Xu, H.; Cheng, X.; Wang, Y.; Liu, W.; Liu, J. High-order nonlinear response correction method for infrared radiation detector. Acta Phys. Sin. 2021, 70, 060701. [Google Scholar] [CrossRef]
  30. Lachance, R. Non-linearity correction of FTIR instruments. In Proceedings of the Fifth Workshop of Infrared Emission Measurements by FTIR, Québec City, QC, Canada, 9–11 February 2000. [Google Scholar]
  31. Ding, R.; Shu, H.; Zhang, P.; Cui, J.Y.; Guan, Z.; Wang, B.; Lei, Z.G. Research on Multi-Channel Weak Interference Signal Detection Circuit of Fourier Transform Infrared Spectrometer; SPIE: Bellingham, WA, USA, 2021. [Google Scholar]
  32. Yousef, S.G.; Sperfeld, P.; Metzdorf, J. Measurement and calculation of the emissivity of a high-temperature black body. Metrologia 2000, 37, 365. [Google Scholar] [CrossRef]
  33. Carli, B.; Palchetti, L.; Raspollini, P. Effect of beam-splitter emission in Fourier-transform emission spectroscopy. Appl. Opt. 1999, 38, 7475–7480. [Google Scholar] [CrossRef]
  34. Russwurm, G.M.; Childers, J.W.; Thompson, E.L., Jr. Effects of stray light in FTIR instruments on open-path measurements. In Proceedings of the Optical Sensing for Environmental and Process Monitoring, McLean, VA, USA, 7–10 November 1994; SPIE: Bellingham, WA, USA, 1995; pp. 339–346. [Google Scholar]
  35. Liu, H. Study on the Key Technologies of Spectral Calibration for Airborne Hyperspectral Imager. Ph.D. Thesis, University of Chinese Academy of Sciences, Beijing, China, 2020. [Google Scholar]
  36. Dussarrat, P.; Deschamps, G.; Dehnavi, S.; Theodore, B.; Coppens, D. Impact of straylight in Michelson Fourier transform spectrometers. In Proceedings of the International Conference on Space Optics—ICSO 2022; SPIE: Bellingham, WA, USA, 2023; pp. 2272–2283. [Google Scholar]
  37. Gerace, A.; Montanaro, M. Derivation and validation of the stray light correction algorithm for the thermal infrared sensor onboard Landsat 8. Remote Sens. Environ. 2017, 191, 246–257. [Google Scholar] [CrossRef]
  38. Dussarrat, P.; Burrows, C. Preparing for the Exploitation of MTG-S IRS in NWP Using FY4-A GIIRS Observations; European Centre for Medium Range Weather Forecasts: Reading, UK, 2022. [Google Scholar]
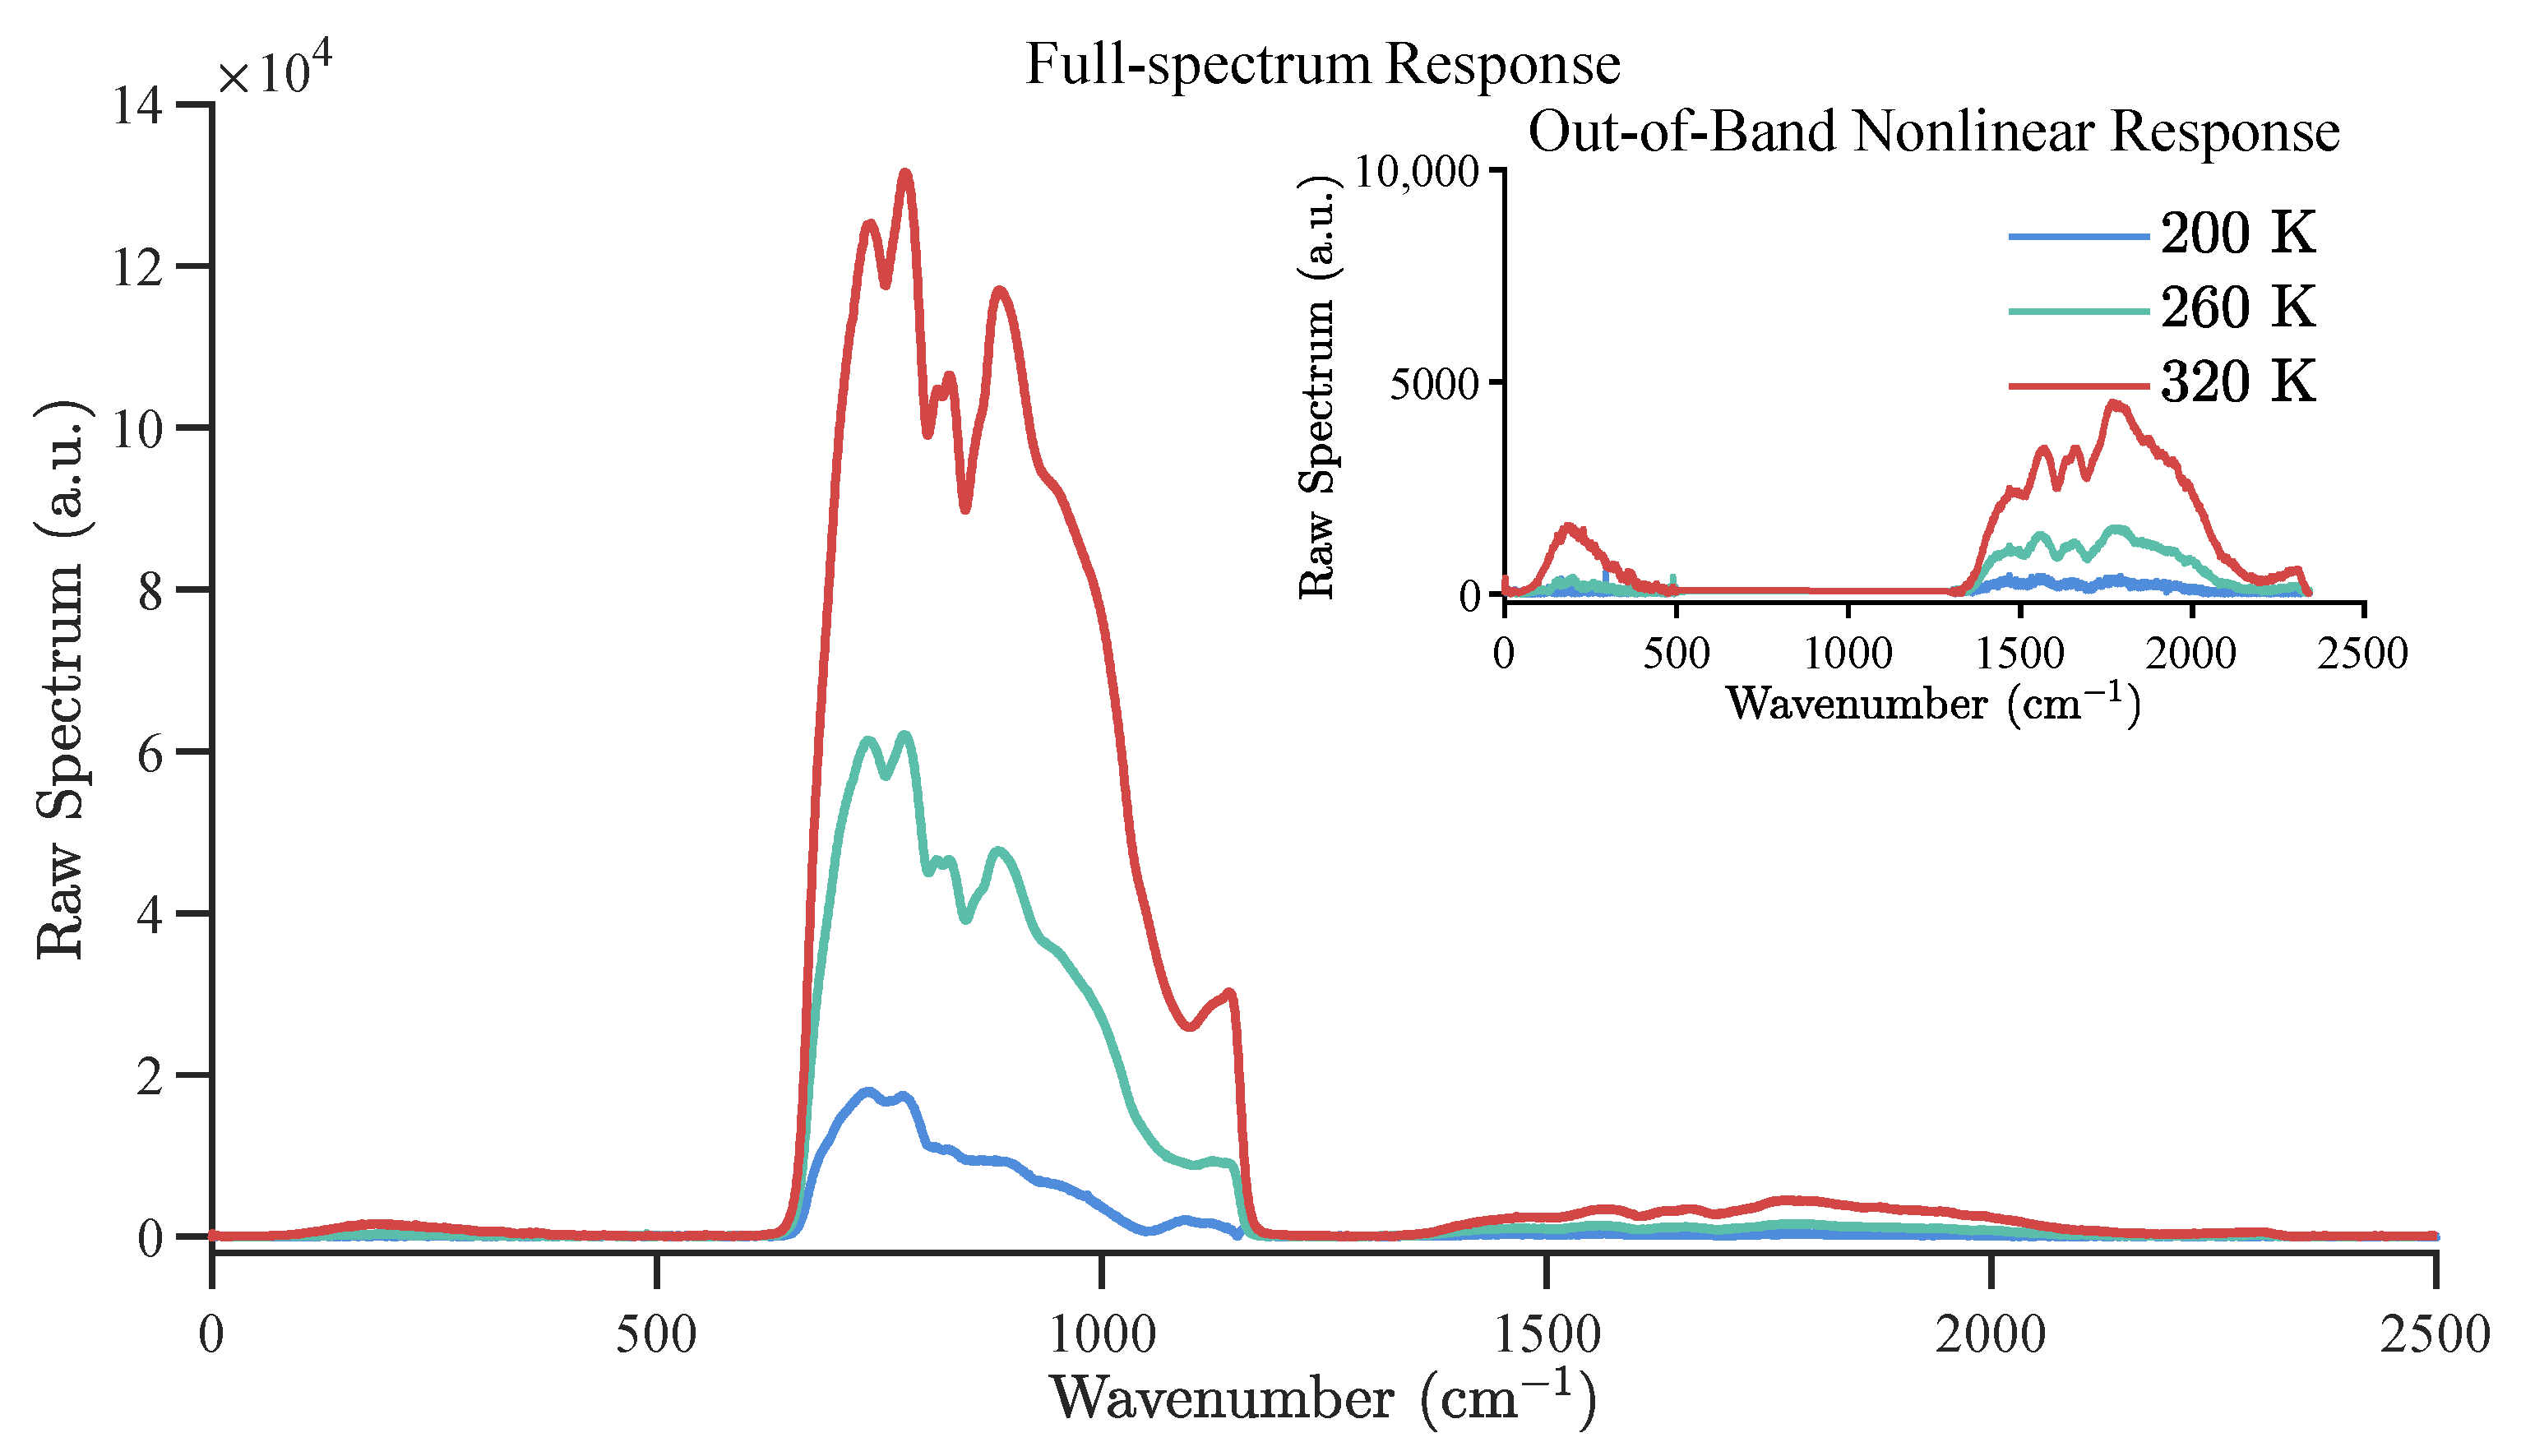
Figure 1. Nonlinear raw spectra obtained during pre-launch radiometric calibration experiments of the GIIRS instrument.
Remotesensing 17 02828 g001
Figure 2. Comparison of brightness temperature deviations before and after nonlinearity correction under TVAC conditions. The dark red curve indicates the mean deviation derived from the Two-Point Radiometric Calibration using the 300.15 K blackbody as the hot reference source. The dark green curve shows the mean deviation after applying the NL correction. The gray curve represents the statistical distribution of brightness temperature deviations for all pixels using both methods. Results are based on observations from two interference-sensitive channels under thermal vacuum conditions TVAC1–TVAC5, involving 124 valid detector pixels. (a) 700.21 cm−1; (b) 780.86 cm−1.
Remotesensing 17 02828 g002
Figure 3. Comparison of brightness temperature deviations after NL correction and PR correction under TVAC conditions. The dark green curve represents the mean brightness temperature deviation after nonlinearity (NL) correction, while the dark blue curve shows the mean deviation after parasitic radiation (PR) correction. The gray curve indicates the statistical distribution of deviations across all detector pixels for both methods. The results are based on observations from two interference-sensitive channels under thermal vacuum conditions TVAC1–TVAC5, involving 124 valid detector pixels. (a) 700.21 cm−1; (b) 780.86 cm−1.
Remotesensing 17 02828 g003
Figure 4. Brightness temperature calibration results under three different calibration strategies. The black dashed line represents the reference observed brightness temperature. The gray shaded area indicates the brightness temperature distribution range across multiple thermal conditions for different calibration strategies. The blue, green, and red solid lines correspond to the mean brightness temperature outputs obtained using PR correction, NL correction, and Two-Point Radiometric Calibration, respectively. The observed targets are blackbodies at 260.15 K, 280.15 K, and 320.15 K. Results are based on observations from pixel FOV-73 under thermal vacuum conditions TVAC1–TVAC5. (a) 260.15K; (b) 280.15K; (c) 320.15K.
Remotesensing 17 02828 g004
Figure 5. Brightness temperature deviations under three different calibration strategies. The gray shaded area indicates the distribution range of brightness temperature deviations across multiple thermal conditions for the different calibration strategies. The blue, green, and red solid lines represent the mean deviations from the reference observed brightness temperature, obtained using PR correction, NL correction, and Two-Point Radiometric Calibration, respectively. The observed targets are blackbodies at 260.15 K, 280.15 K, and 320.15 K. Results are based on observations from pixel FOV-73 under thermal vacuum conditions TVAC1–TVAC5. (a) 260.15K; (b) 280.15K; (c) 320.15K.
Remotesensing 17 02828 g005
Figure 6. Mean brightness temperature deviations after PR correction across all detector pixels in the 700–900 cm−1 spectral range under TVAC1–TVAC5 conditions (200–320 K). The blue curve represents the mean brightness temperature deviations after PR correction in the longwave band for the full 200–320 K target brightness temperature range under all TVAC1–TVAC5 thermal conditions. The black dashed line denotes the 0.7 K accuracy reference level achievable with NL correction, while the green plane indicates the 0.4 K deviation threshold representing the accuracy limit achieved after PR correction.
Remotesensing 17 02828 g006
Figure 7. Statistical distribution of brightness temperature deviations for all detector pixels at a target brightness temperature of 280 K under TVAC1–TVAC5 conditions. (a) Results after applying NL correction using existing calibration methods; (b) Results after further applying PR correction. The blue curves represent the mean brightness temperature deviations for all pixels in the longwave band under TVAC1–TVAC5 conditions at a target temperature of 280 K. The black dashed lines indicate the 0.7 K accuracy reference level after NL correction, while the green planes represent the target accuracy range of deviations within 0.4 K achieved after PR correction.
Remotesensing 17 02828 g007
Figure 8. Average normalized spectral response of the cold blackbody as a function of the hot blackbody temperature. Results are based on measurements from 124 valid pixels under TVAC1–TVAC5 thermal conditions.
Remotesensing 17 02828 g008
Table 1. Ground-based thermal vacuum radiometric calibration test condition settings.
TVAC1 (°Celsius)TVAC2TVAC3TVAC4TVAC5
Scanning Mirror261313540
North Cooling Plate1000−1020
Thermal Insulation Cover2−810−1112
North Radiating Plate−151212−2019
South Radiating Plate−10−10−10−4020
Table 2. Temperature settings of blackbody for radiometric calibration.
NO.THBB(K)TCBB(K)
1200.15376.717
2210.15176.684
3220.15276.418
4230.15276.561
5235.15176.369
6240.15076.351
7245.14976.408
8250.15276.374
9255.15076.381
10260.15176.406
11265.15176.390
12270.15176.440
13280.15176.437
14290.15176.462
15295.14976.501
16300.15177.531
17305.15177.345
18310.15077.304
19315.15077.280
20320.15177.258
Disclaimer/Publisher’s Note: The statements, opinions and data contained in all publications are solely those of the individual author(s) and contributor(s) and not of MDPI and/or the editor(s). MDPI and/or the editor(s) disclaim responsibility for any injury to people or property resulting from any ideas, methods, instructions or products referred to in the content.