Article

Improving the Assimilation of T-TREC-Retrieved Wind Fields with Iterative Smoothing Constraints During Typhoon Linfa

1
Haidian District Meteorological Service, Beijing 100080, China
2
China Meteorological Administration Training Centre, Beijing 100081, China
3
Key Laboratory of Meteorological Disaster, Ministry of Education (KLME), Joint International Research Laboratory of Climate and Environment Change (ILCEC), Collaborative Innovation Center on Forecast and Evaluation of Meteorological Disasters (CIC-FEMD), Nanjing University of Information Science & Technology, Nanjing 210044, China
4
Nanjing Meteorological Bureau, Nanjing 210019, China
*
Author to whom correspondence should be addressed.
Remote Sens. 2025, 17(16), 2821; https://doi.org/10.3390/rs17162821
Submission received: 18 May 2025 / Revised: 8 August 2025 / Accepted: 11 August 2025 / Published: 14 August 2025

Abstract

Enhancing radar data assimilation at cloud-resolving scales is essential for advancing typhoon analysis and forecasting. This study focuses on Typhoon Linfa, the 10th Pacific Typhoon of 2015, and proposes T-TREC-IS (Typhoon Circulation Tracking Radar Echo by Correlations with Iterative Smoothing), an enhanced version of the T-TREC algorithm. The enhancement incorporates an iterative smoothing constraint into the T-TREC algorithm, which improves the continuity of the retrieved wind field and mitigates the effects of velocity aliasing in radar data, thereby increasing the operational feasibility of the method. Building on this improvement, we evaluate the effectiveness of assimilating the T-TREC-IS-retrieved wind field for analyzing and forecasting Typhoon Linfa. The results demonstrate that the iterative smoothing constraint effectively filters out velocity de-aliasing errors during radar data quality control, enhances wind field intensity near the typhoon core, and retrieves the typhoon circulation more accurately. The refined wind field exhibits improved consistency and continuity, resulting in superior performance in subsequent assimilation analyses and forecasts.

1. Introduction

Globally, typhoons rank among the most destructive and hazardous weather phenomena, posing significant threats to lives, property, and socioeconomic stability. On an annual basis, China endures at least seven typhoons making landfall, ranking it among the countries with the highest storm incidence and exposing it to exceptionally severe disasters [1,2,3]. Therefore, accurately monitoring and forecasting typhoons and associated heavy rainfall is crucial for safeguarding lives and minimizing socioeconomic losses. As numerical weather prediction systems and assimilation methodologies evolve, typhoon track forecasts have become more reliable [4,5,6,7,8,9]. However, precise forecasting of typhoon intensity and associated precipitation remains a major challenge [10]. The primary reason is insufficient high-resolution observations over the ocean to capture the meso- and small-scale vortex structures and intensities within typhoons [11,12]. Radar and satellite, as key remote sensing platforms, provide high-resolution data in both temporal and spatial dimensions [13]. Radar observation, in particular, can accurately depict the microphysical and thermodynamic structures of the atmosphere, which are critical for optimizing the model’s initial conditions. However, radar data assimilation techniques are not yet fully mature, and challenges in data quality control hinder the comprehensive utilization of radar data [14]. Although numerous quality-control methods have been developed, such as the IVAP-based de-aliasing method [15], the automated de-aliasing for data assimilation (ADDA) scheme [16], and the region-based recursive de-aliasing (R2D2) algorithm [17], no single approach can guarantee complete removal of velocity folding under all conditions. Residual aliasing still impairs assimilation performance. Hence, optimizing radar data assimilation techniques at the cloud-resolving scale is essential for improving the accuracy of typhoon analysis and forecast.
In recent years, direct assimilation of Doppler radial velocity into numerical models—using three-dimensional or four-dimensional variational methods (3DVAR/4DVAR), ensemble Kalman filters (EnKF), or hybrid variational (Hybrid)—has been confirmed to deliver substantial enhancements in storm structure, intensity estimation, and track forecasting [18,19,20,21,22,23,24]. However, radial velocity only includes the wind field component along the radar’s radial direction, making it challenging for direct assimilation to accurately analyze the wind field component perpendicular to the radar beam [25,26,27]. Consequently, retrieval-based assimilation of radar data has gained considerable attention as a complementary approach. Balancing ease of implementation, operational practicality, and computational demands has led to the widespread adoption of GBVTD (ground-based velocity track display) and TREC (tracking radar echo by correlation) techniques as the primary strategies for retrieving typhoon circulation wind fields.
GBVTD is a retrieval method based on radial velocity that uses geometric relationships and Fourier series transformations to derive the axisymmetric and asymmetric tangential circulation structures within the typhoon core [28,29]. However, GBVTD also has limitations in practical applications, such as its inability to reasonably retrieve the environmental mean wind field, the need to satisfy geometric constraints of the algorithm, sensitivity to velocity aliasing, and limited coverage of radial velocity observation. Subsequent extensions, such as EGBVTD (extended ground-based velocity track display) for environmental mean wind recovery [30], GVTD (generalized VTD) for mitigation of geometric constraints [31], and GrVTD (gradient velocity track display) for reduced aliasing sensitivity [32], have addressed some issues but still struggle to provide broad spatial coverage.
Alongside these radial-velocity-based techniques, reflectivity-based methods provide circulation details over a wider area. In the TREC (tracking radar echo by correlation) approach, three-dimensional horizontal wind vectors are obtained by correlating successive radar echo positions and inferring their displacement over time. It was first proposed by Rinehart and Garvey [33] and applied to retrieve the flow field within storms. Tuttle and Gall [34] were the first to introduce the TREC method into typhoon studies. However, due to the typically strong and uniformly distributed radar echoes in the eyewall region of typhoons, the TREC method tends to significantly underestimate the wind field in this region. To address this issue, Harasti et al. [35] enhanced the TREC method by converting the Cartesian coordinates to the polar coordinates centered on the typhoon, using sector-shaped search units to conduct counterclockwise searches. This adjustment mitigated the underestimation caused by radial wind shear passing through analysis units and the highly curved motion in the eyewall region under the Cartesian coordinates. Subsequently, Wang et al. [36] proposed the T-TREC method, which incorporates radial velocity as an additional retrieval constraint into the TREC method. This approach objectively selects tangential search ranges and establishes a wind field correlation matrix, effectively addressing the underestimation issue caused by the relatively uniform radar echoes in the typhoon eyewall region. Despite the progress made by the T-TREC algorithm, its retrieval accuracy strongly depends on the quality of radar data and is highly sensitive to velocity aliasing. Correcting weakly retrieved radial velocity directly with observed radial velocity can result in discontinuity within the wind field.
Building on these retrieval advances, multiple studies have assimilated T-TREC-retrieved wind into numerical models. In a landmark study, Li et al. [26] integrated wind vectors retrieved by the T-TREC algorithm into the WRF-3DVAR system to assess the influence on both the analysis and the subsequent forecast of Typhoon Meranti (2010). The results demonstrated that T-TREC-retrieved wind field assimilation outperformed radial velocity assimilation; however, the difference between the two was smaller when the typhoon approached the radar. Wang et al. [37] employed the EnKF method to assimilate T-TREC-retrieved wind field and radar radial velocity separately, reaching conclusions similar to those of Li et al. [26]. In separate investigations, Li et al. [38] and Wang et al. [39] demonstrated that the joint assimilation of horizontal wind field obtained via the T-TREC algorithm alongside conventional radar radial velocity observations leads to marked enhancements in both the depiction and prediction of tropical cyclone structure and track. Although these studies confirm the advantages of T-TREC-retrieved wind, residual aliasing errors and spatial discontinuities still limit optimal assimilation performance.
This study introduces iterative smoothing constraints into T-TREC to improve wind-field continuity and demonstrates its effectiveness through WRF-3DVAR assimilation experiments. The remainder of this paper is organized as follows. Section 2 details the methodologies and case study, covering the typhoon case, radar data preprocessing, enhancements to the T-TREC algorithm, and the assimilation framework. Section 3 presents the results and analysis, focusing on the effectiveness of the T-TREC-IS algorithm and its performance in typhoon analysis and forecasting. Section 4 offers conclusions and discusses the broader implications.

2. Case and Methodologies

2.1. Overview of Typhoon Linfa

Typhoon Linfa formed over the northwest Pacific, east of the Philippines, at 1200 UTC on 2 July 2015, exhibiting considerable complexity and uncertainty during its development. By 1200 UTC on 3 July, Linfa had turned northwestward toward northern Luzon Island. Later that day, at 2100 UTC, the National Meteorological Center (NMC) of the China Meteorological Administration (CMA) upgraded Linfa to a severe tropical storm. At approximately 2000 UTC on 4 July, Linfa made landfall along the northeastern coast of Luzon Island in the Philippines, with maximum sustained winds near its center reaching 25 m s−1. By 0000 UTC on 5 July, the NMC downgraded Linfa to a tropical storm but subsequently upgraded it again to a severe tropical storm at 0900 UTC on the same day. Starting on 6 July, Linfa moved steadily northward at a speed of about 10 km h−1. By 8 July, it shifted to a more westward trajectory, gradually approaching the eastern coast of Guangdong Province. At 1200 UTC, Linfa intensified into a typhoon, with maximum wind speeds increasing to 35 m s−1. The system then accelerated and shifted to a northwesterly path. At 0400 UTC on 9 July, Linfa made landfall in Jiadong Town, Lufeng City, Guangdong Province, with a maximum wind force of 12 and a central pressure of 970 hPa. Following landfall, the storm weakened rapidly to a tropical depression. By 2100 UTC on 9 July, the NMC ceased tracking the storm.

2.2. Radar Data Preprocessing

Observations were acquired with the new-generation S-band Doppler weather radar positioned in Shantou, Guangdong (STRD). This radar implements the VCP21 scan strategy, generating a complete volume every six minutes. Each volume consisted of nine elevation sweeps at 0.5°, 1.5°, 2.4°, 3.3°, 4.3°, 6.0°, 9.9°, 14.6°, and 19.5°. Reflectivity data extended to 460 km with 1 km gate spacing, while radial velocity data reached 230 km with 250 m gates; both variables were sampled at 1° azimuthal resolution. The velocity field was Nyquist-limited to approximately 26 m s−1, and its unambiguous range was 150 km. To enhance data accuracy, the Py-ART library [40] in Python (version 3.9) was utilized to perform quality control on the raw radar data prior to use. The processing included velocity de-aliasing, as well as the removal of isolated noise points, ground clutter, and secondary echoes. In this paper, the observation error of radar radial velocity is specified as 2 m s−1 [15,41].

2.3. Introduction to the T-TREC-IS Algorithm

The T-TREC algorithm jointly leverages radar reflectivity and radial velocity to retrieve wind fields. First, the quality-controlled radar reflectivity and radial velocity are interpolated from the polar coordinates to Cartesian coordinates with horizontal and vertical grid resolution of 1 km, which produces CAPPI data. Then, referring to the weak echo center identification method proposed by Chang et al. [42], the typhoon center is objectively determined, and the CAPPI data, originally centered on the radar location, is transformed to the polar coordinates centered on the typhoon, with a horizontal radius of 300 km. Tuttle and Gall [34] emphasized that the size of the TREC analysis unit ought to be roughly half the diameter of the echo feature. Using a larger scale degrades the spatial resolution of the retrieved wind field, while an excessively small-scale results in too few observation points to reliably determine wind vectors. Wang et al. [37] found that the size of the analysis unit is related to the typhoon’s intensity and size: smaller, stronger typhoons require smaller analysis units, whereas larger, weaker typhoons necessitate larger units. Based on the echo characteristic of Typhoon Linfa, this study selected a sectoral grid resolution of 10 km × 25 km (radial × tangential). The specific T-TREC wind field retrieval algorithm followed the methodology described by Wang et al. [36].
CAPPI reflectivity data is used at a fixed height from two radar scans spaced 6 min apart. The earlier-scan CAPPI field is divided into sectoral grid cells, and each cell is cross-correlated with identically sized cells within a defined search area in the later scan, producing a matrix of reflectivity cross-correlation coefficients. Next, a velocity weight is assigned to each later-scan cell based on its searching distance from the reference position. The total correlation for each cell is then computed as the product of its reflectivity cross-correlation coefficient and its velocity weight. The cell with the highest total correlation is selected as the end point of the initial retrieved T-TREC wind vector. Wind speed is calculated from the displacement between the two cell positions divided by the time interval. Projecting this wind vector onto the radar’s radial direction yields two components: the retrieved radial velocity and the tangential velocity. Wherever the absolute value of retrieved radial velocity is weaker than that of the observed radial velocity, the observed value is substituted while preserving the retrieved tangential velocity. The substituted radial and original tangential components are then recombined and transformed back into the Cartesian coordinate system to produce the final T-TREC-retrieved wind field.
The T-TREC-IS algorithm builds on the T-TREC method by introducing iterative smoothing constraint. The iterative smoothing constraint method refers to the principle of 3DVAR and optimizes the solution through successive minimization steps to enhance the continuity and smoothness of the retrieved wind field. The detailed procedure is outlined below:
The initial estimate of the retrieved radial velocity is defined as
V r   t t r e c 0 = d x r × u 0 + d y r × v 0 ,
where  u 0 , v 0 represents the initial retrieved T-TREC wind vector,  d x and  d y are the distance components of  u 0 , v 0 from the radar center along the x-axis and y-axis, respectively,  r is the straight-line distance from  u 0 , v 0 to the radar center, and  V r   t t r e c 0 is the radial velocity retrieved by projecting the T-TREC wind vector  u 0 , v 0 onto the radar radial direction.
The retrieved radial wind component  V r   t t r e c 0 is then compared with the radar radial velocity  V r . Specifically, at each grid cell  i , j , the observed radial velocity  V r o b s i , j is first averaged over a 5 × 5 neighborhood:
V r 0 i , j = 1 25 m = 2 2 n = 2 2 V r o b s i + m , j + n .
This local mean is then adjusted toward the observed value according to
V r i , j = V r 0 i , j + μ V r o b s i , j V r 0 i , j ,
with  μ serving as a relaxation coefficient that controls the update magnitude.  V r   denotes the resulting spatially smoothed observed radial velocity at grid cell  i , j .
If  V r   t t r e c 0 < V r , iterative smoothing correction is applied to incrementally adjust the retrieved value toward the observed magnitude while preserving spatial continuity.
First, the wind speed and wind direction of the retrieved T-TREC wind vector are calculated separately.
S p d 0 = u 0 2 + v 0 2
D i r = atan 2 v 0 , u 0 × 180 π
In the equation,  S p d 0 denotes the wind speed corresponding to the retrieved T-TREC wind vector  u 0 , v 0 , while  D i r represents the wind direction corresponding to the retrieved T-TREC wind vector  u 0 , v 0 .
Assuming the retrieved T-TREC vector has the correct direction but an underestimated speed, the wind speed  S p d 0 is incrementally increased by a fixed step during each iteration (while keeping the wind direction unchanged) to obtain the updated wind speed  S p d m , as follows:
S p d m = S p d 0 + m × s ,
where  m denotes the number of iterations, and  s specifies a constant step length.
The updated wind speed components  u m and  v m are calculated as
u m = S p d m × sin D i r × π 180.0
v m = S p d m × cos D i r × π 180.0
The updated retrieved wind vector is mapped onto the radar radial direction to yield the updated retrieved radial velocity  V r   t t r e c m . The objective function is defined as the absolute residual between the retrieved radial velocity and the corresponding observed radial velocity. The wind speed components corresponding to the minimum value of the objective function  F are then determined by
F = d x r × u m + d y r × v m V r .
When  F < ε or  m > β , the iteration stops, and the final typhoon wind is obtained as the output. Here,  ε represents the convergence threshold, and  β represents the iteration count threshold.
The final retrieved wind field is output as a CAPPI product, structured on a 5 km × 5 km horizontal grid and 1 km vertical layers, covering the atmospheric layer between 1 km and 8 km above ground.

2.4. Assimilation Methodology

Developed by NCAR, the WRFDA system supports the 3DVAR, 4DVAR, and Hybrid assimilation techniques. This study applied the 3DVAR scheme, which formulates a cost function. Numerical iterative algorithms were employed to minimize the cost function, swiftly yielding an analysis-time atmospheric state that most closely represents actual conditions. Formally, the cost function is expressed as follows:
J = x x b T B 1 x x b + y 0 H x T R 1 y 0 H x .
In this formulation,  x denotes the vector representing the analyzed atmospheric state,  x b is the state vector of the background field,  y 0 represents the state vector of the observation field, and  B and  R are the covariance matrices for background errors and observation errors, respectively. The observation operator  H functions to map the prognostic variables from the model’s analysis state into the same coordinate system and variables as the observations, thereby facilitating a coherent assessment of discrepancies between the measured data and the analysis output.
The T-TREC-retrieved wind data provides comprehensive horizontal wind circulation information, including both the u and v components, which directly corresponds to the model variables. As a result, this study did not require the construction of an additional observation operator; the data could be assimilated directly into the WRF-3DVAR system as standard sounding inputs. It should be emphasized that radar data mainly depict mesoscale or finer atmospheric structures, whose typical spatial influence is considerably more limited than that captured by standard upper-air soundings. Therefore, during the assimilation process, it is necessary to adjust the horizontal scale factor for radar data to ensure that the influence range is more appropriate and to optimize the assimilation of the retrieved wind field.
To calculate the background error covariance matrix  B , this study adopted the NMC method [43]. The matrix  B includes control variables for horizontal wind (u, v), surface pressure, temperature, humidity, plus hydrometeor mixing ratios (cloud water, rainwater, snow, graupel, ice), and vertical velocity component (w) [44]. This approach quantifies background error statistics by calculating the difference between two WRF forecasts that are initialized simultaneously but valid at distinct lead times—typically a 12 h and a 24 h forecast—and then averaging these differences over a one-month period. For this study, the WRF model forecasts for July 2015 were used for the calculation, and the control variable framework employed the UV wind control variable scheme (CV7) [23,45].

3. Results and Analysis

3.1. Evaluation of the Retrieved Wind Field Quality

To minimize the impact of terrain and ground clutter, this study focused on analyzing the retrieved wind field near the 3 km level. Figure 1 illustrates the wind field retrieved by T-TREC and T-TREC-IS, superimposed with radar reflectivity at three different time points. The results demonstrate that, in both algorithms, the retrieved wind field included velocity components perpendicular to the radar’s radial direction, effectively filling in areas with missing radial velocity. In T-TREC, the cyclonic circulation around the eye was clearly captured, but notable gaps appeared in regions of weak reflectivity, and individual vectors exhibited localized scatter due to residual aliasing and coverage gaps (Figure 1a–c). By introducing iterative smoothing, the wind field became markedly more continuous and coherent. Aliasing-induced noise was suppressed, yielding a smoother eyewall signature (Figure 1d–f).
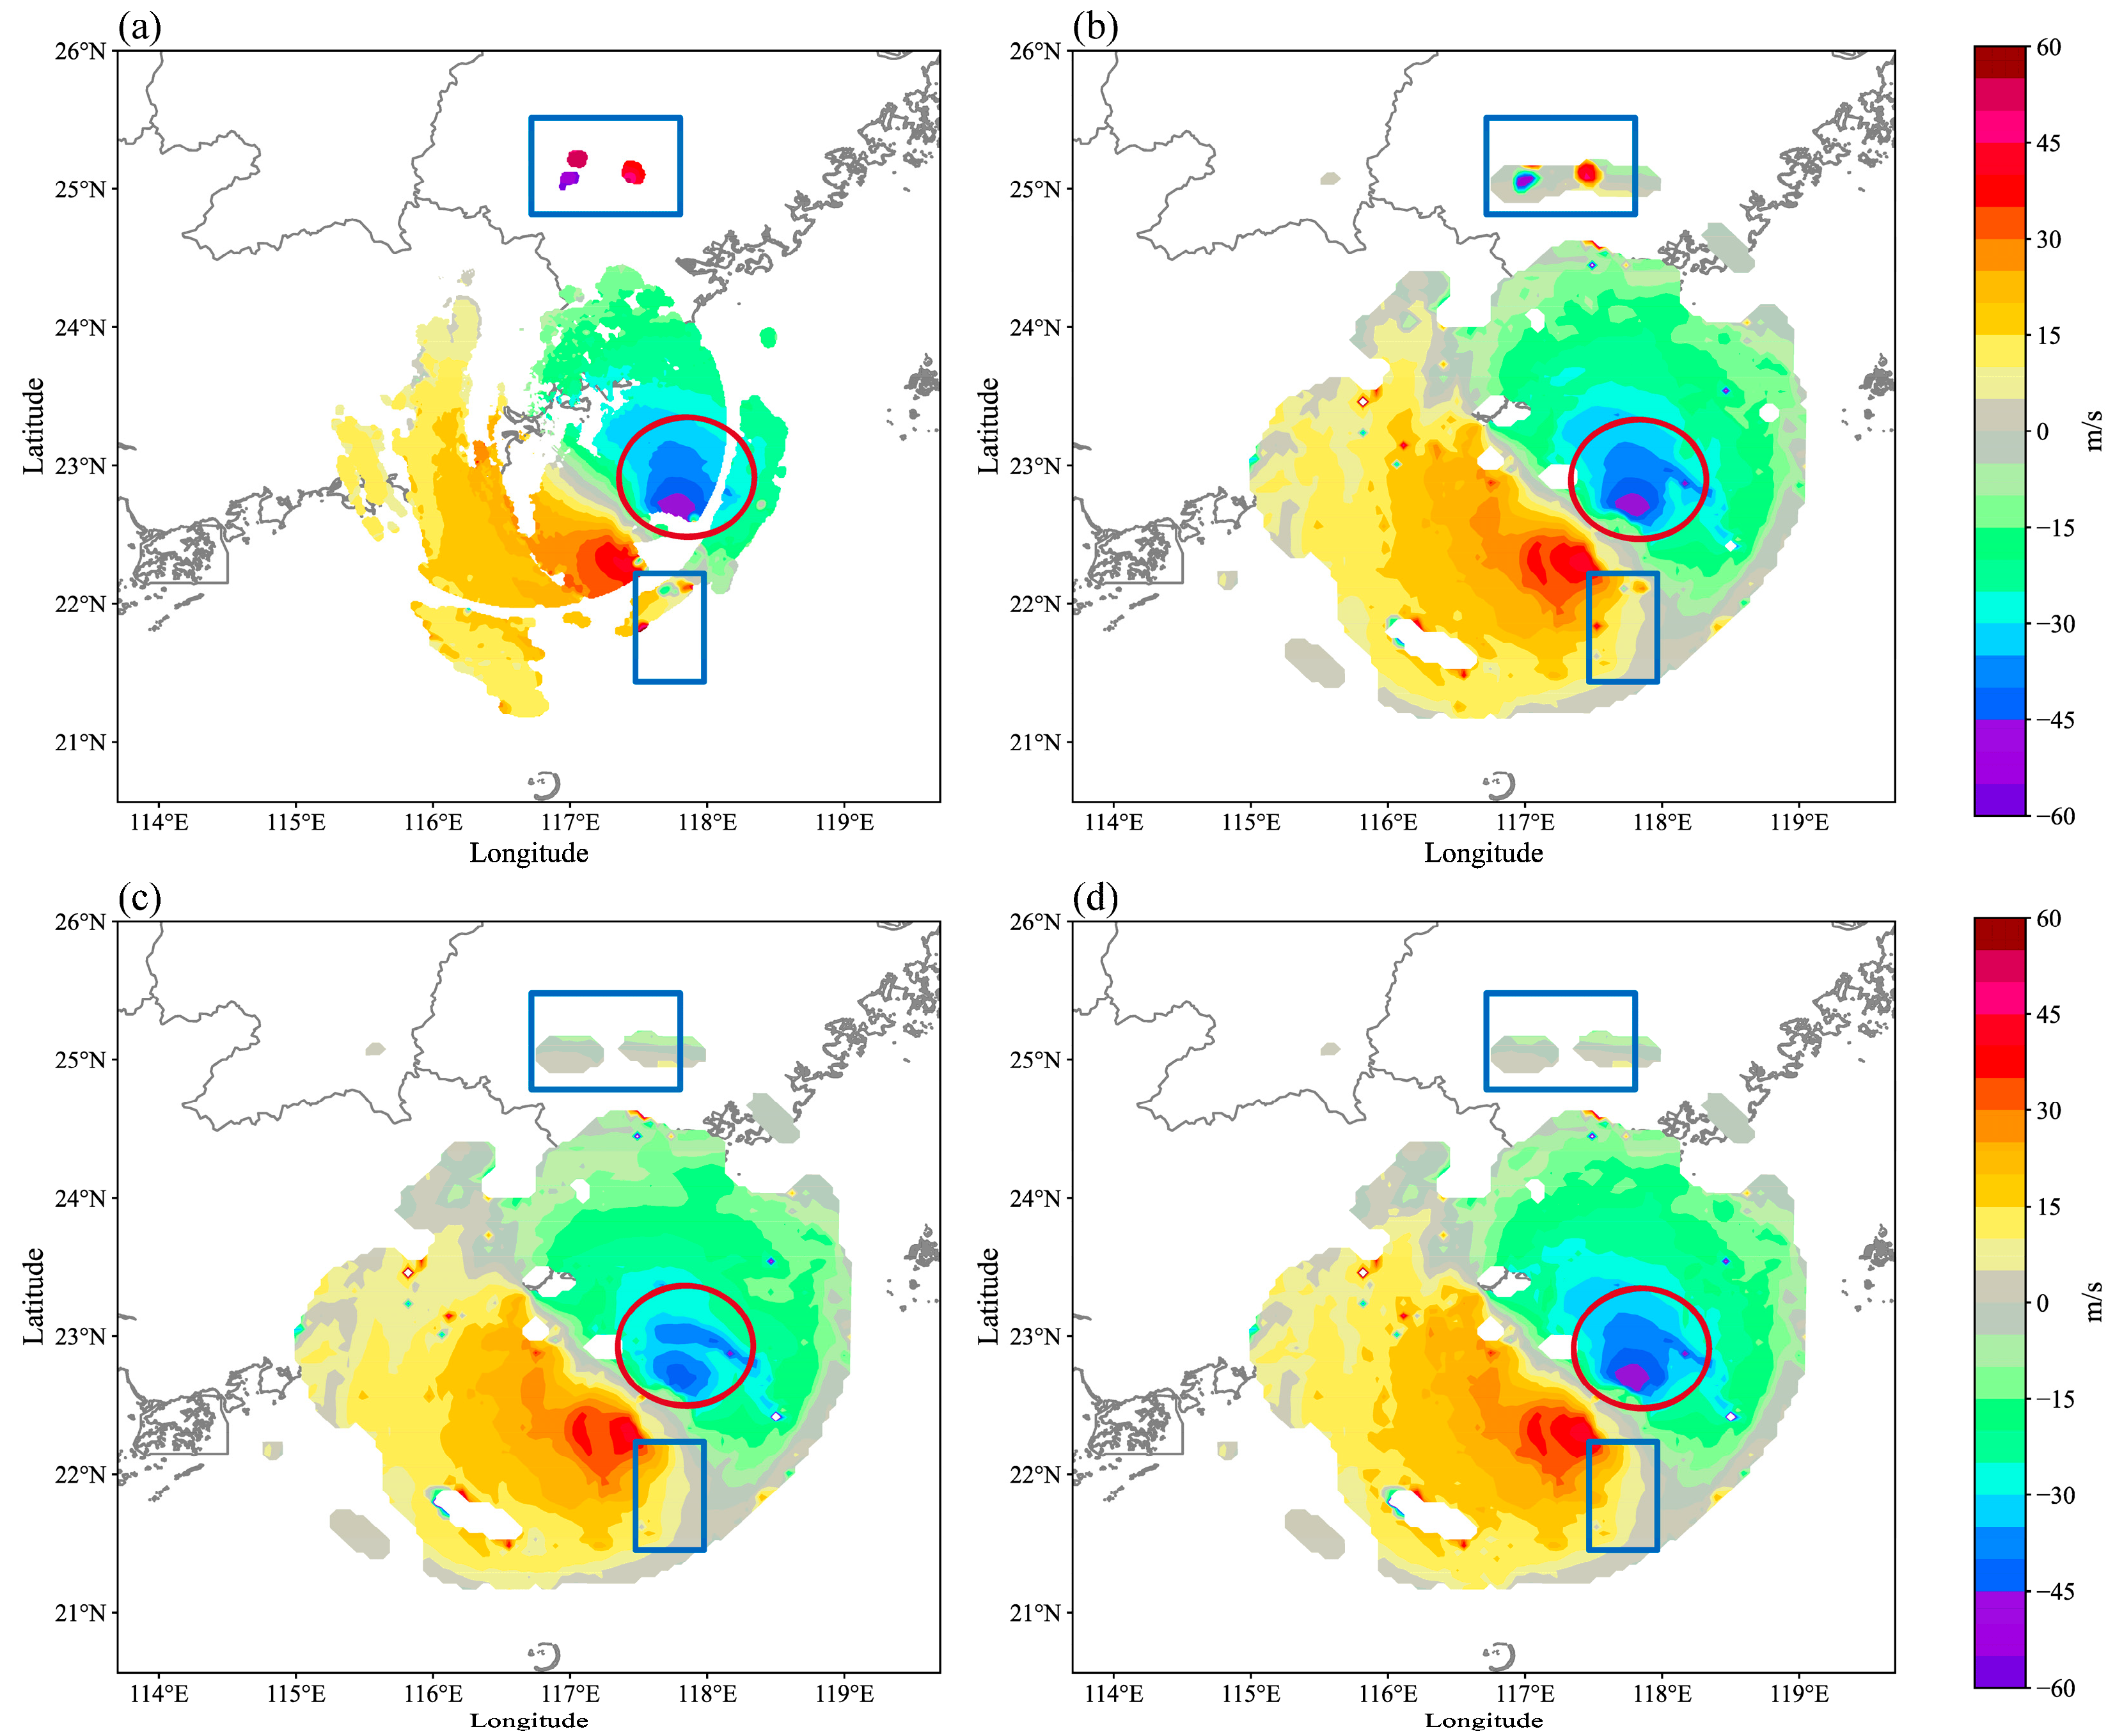
Figure 2 presents the radar-observed radial velocity alongside the radial velocity derived from projecting the retrieved wind onto the radar radial direction at an altitude of 3 km, recorded at 1800 UTC on 8 July 2015. At this time, Typhoon Linfa was fully within the observation range of the STRD radar reflectivity (see Figure 1a). Nevertheless, STRD radial velocity measurements captured only a portion of the typhoon’s inner core (Figure 2a). The observed radial velocity coverage was approximately half that of the reflectivity, extending about 230 km, and exhibiting an incomplete dipole pattern with significant areas of missing data.
Projecting the retrieved wind field onto radial components within a 230 km radius yielded a pattern that closely resembles the observed radial velocity field while presenting a more coherent dipole signature. However, as indicated in Figure 2a, the limited adaptability of the radar quality control algorithm resulted in some false or excessive filtering during radial velocity de-aliasing. Consequently, the T-TREC method, which directly replaces weak retrieved radial velocity values with observed values, led to the emergence of erroneous de-aliased radial velocity points in the retrieved wind field (Figure 2b). This resulted in discontinuities within the wind field, causing inconsistencies among meteorological elements and imbalances in wind–pressure relationships during analysis, ultimately affecting the applicability of the results.
If the direct replacement of radial velocity in T-TREC is not employed, the overall intensity of the retrieved wind field is significantly underestimated (Figure 2c), which further undermines the accuracy of the analysis. However, as shown in Figure 2d, after implementing the iterative smoothing constraint method proposed in this study, erroneous points in the de-aliased radial velocity during radar data quality control were eliminated. This adjustment strengthened the wind field intensity near the typhoon’s inner core compared to Figure 2c, facilitating a more accurate reconstruction of the typhoon’s circulation. Overall, this approach improves the coherence and continuity of the wind field, thus enhancing the feasibility and stability of operational applications.
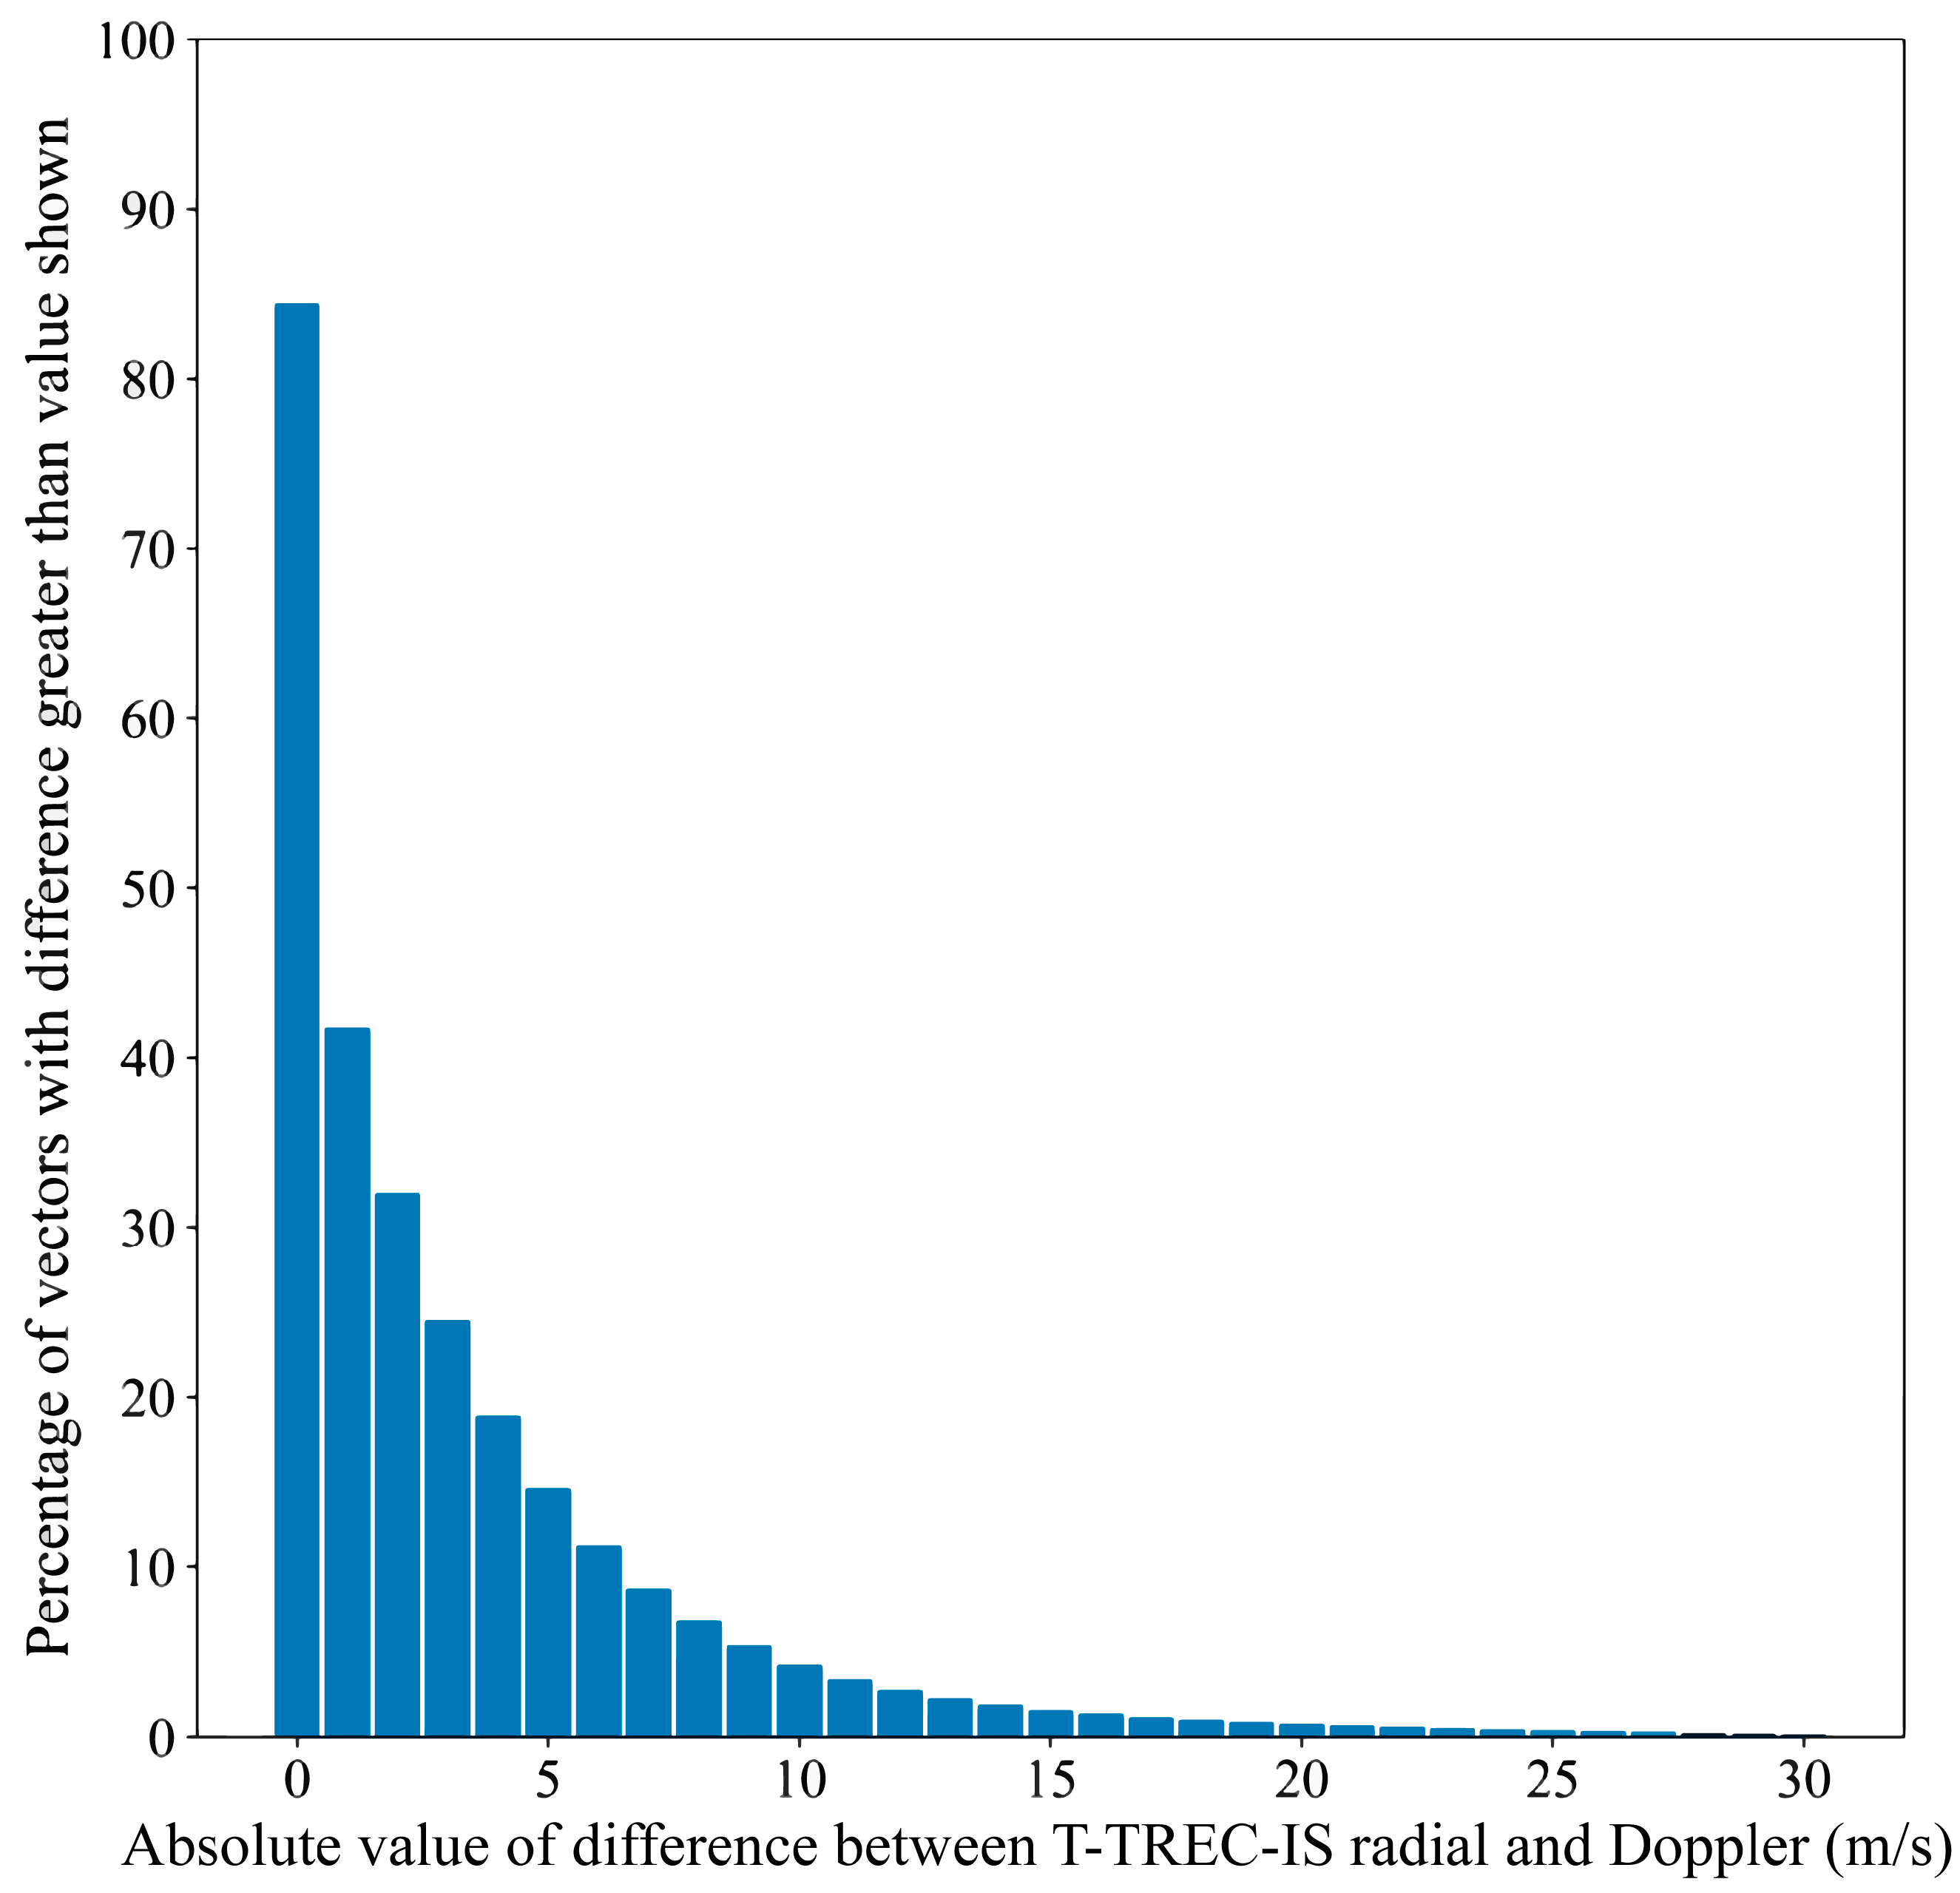
To quantitatively evaluate the retrieval error, this section presents a cumulative bar chart of the absolute error percentage between the radial velocity component of the T-TREC-IS-retrieved wind and the radar-observed radial velocity, recorded hourly from 1800 UTC on 8 July to 0000 UTC on 9 July 2015 (Figure 3). The horizontal axis represents the absolute difference between the radial velocity component of the T-TREC-IS-retrieved wind and the radar-observed radial velocity, while the vertical axis shows the percentage of retrieved wind vectors whose absolute error exceeds the corresponding value on the horizontal axis. The analysis result indicates that the retrieved radial velocity was generally close to the radar-observed value in most cases. However, a small number of wind vectors exhibited large errors (exceeding 15 m s−1), potentially indicating that the retrieval method failed to accurately capture the actual wind field under certain conditions. Overall, approximately 82% of the errors were within 4 m s−1, with a total root mean square deviation (RMSD) of 3.92 m s−1 between the radial velocity component of all retrieved wind and the observed radial velocity. This suggests that the T-TREC-IS algorithm reasonably reconstructs the typhoon circulation. Considering the radar-observed radial velocity error, the retrieval error is set to 4.92 m s−1.

3.2. Experimental Setup

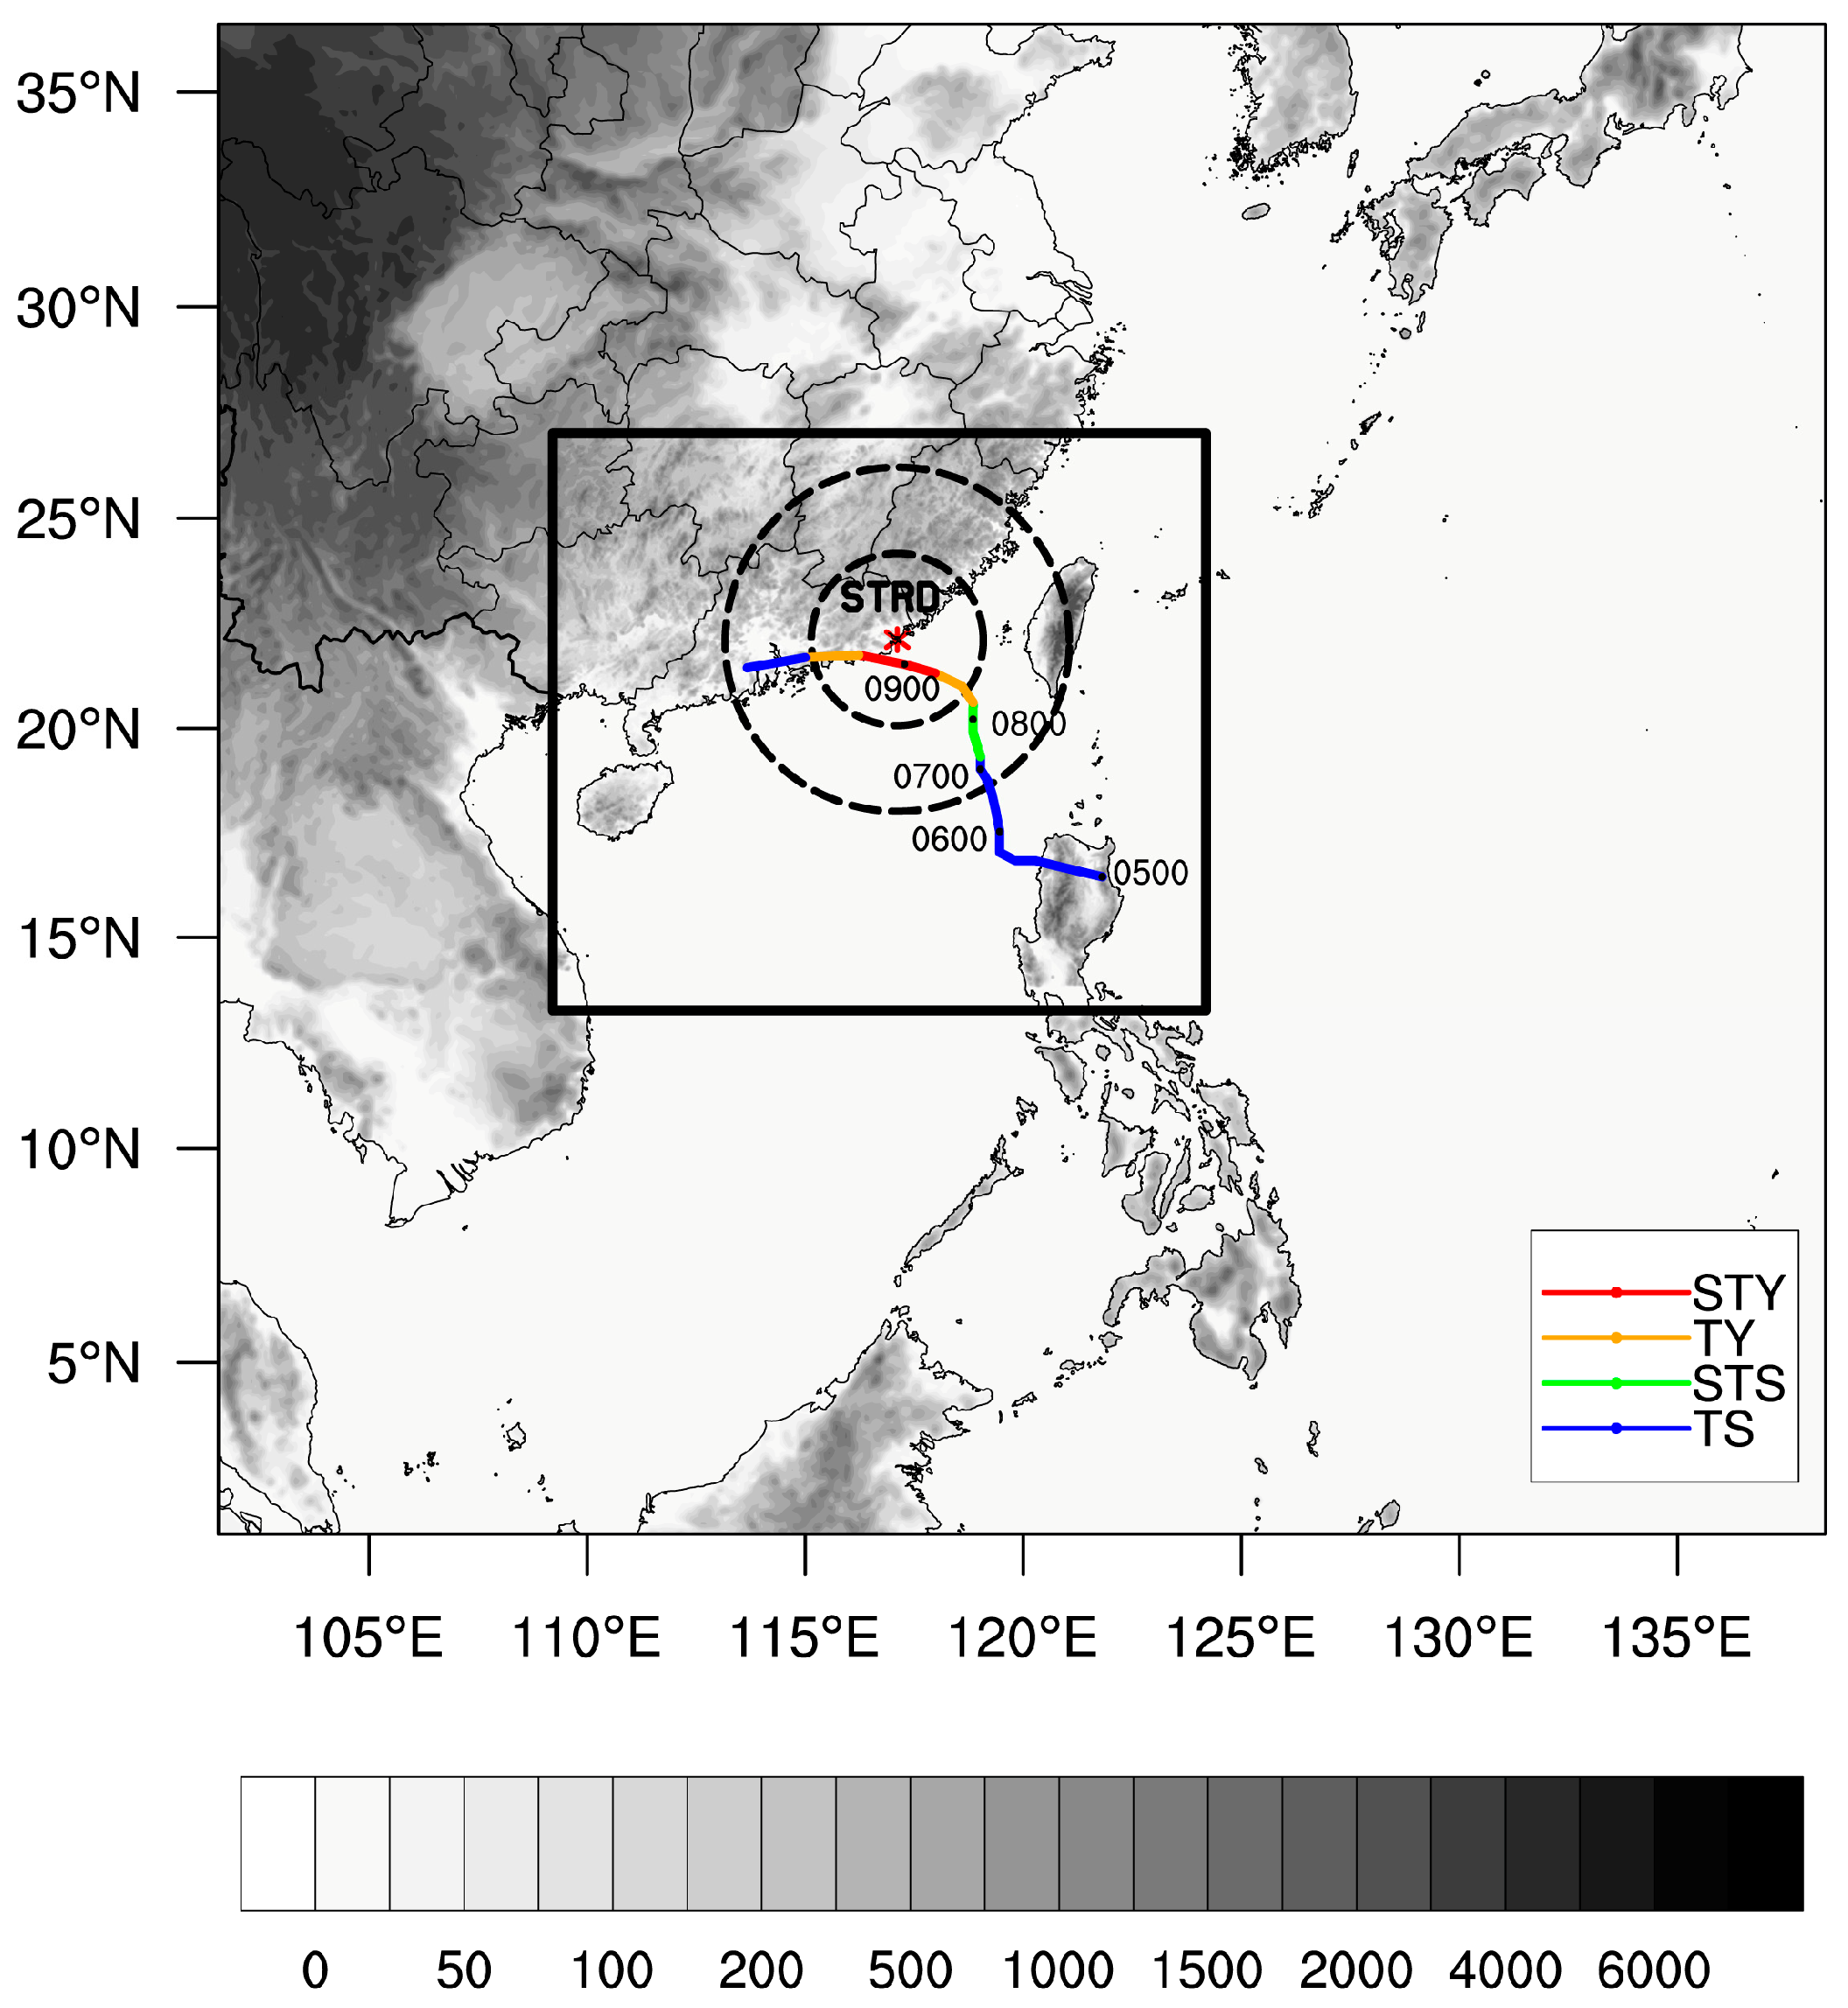
In this study, the forecast model used was WRF Version 4.3 (Advanced Research), and data assimilation was performed with its 3DVAR module. The initial and boundary conditions were sourced from the global data assimilation system (GDAS)/final analysis (FNL) data provided by the NCAR, with a spatial resolution of 0.25° × 0.25°. Figure 4 shows the experimental simulation area with two nested domains that share a central coordinate of 119.97°E, 19.96°N. The outer domain (d01) employed a 481 × 451 grid at a 9 km horizontal resolution, while the inner domain (d02) refined this to a 586 × 517 grid at a 3 km horizontal resolution. Vertically, the atmosphere was divided into 51 levels, with the model top located at 10 hPa. The suite of physical schemes comprised the WRF single-moment 6-class microphysical scheme; the fifth-generation Pennsylvania State University-NCAR mesoscale model (MM5) similarity scheme for surface layer processes; the New Tiedtke cumulus parameterization scheme; the rapid radiative transfer model for global climate models (RRTMG) longwave and shortwave radiation scheme; the Noah land surface model scheme for land surface processes; and the Yonsei University scheme for planetary boundary layer processes [46].
As outlined in Table 1 and depicted in Figure 5, this study comprised three numerical experiments. The control experiment (CTRL) was initialized at 0600 UTC on 8 July 2015 and integrated forward for 36 h, terminating at 1200 UTC on 9 July. Two assimilation experiments spun up for 12 h starting at 0600 UTC on 8 July to create the background field for assimilation at the initial time. From 1800 UTC on 8 July to 0000 UTC on 9 July, the WRF-3DVAR assimilation system assimilated retrieved wind data every hour. The two assimilation experiments separately assimilated the T-TREC-retrieved wind data (ExpTTREC) and the T-TREC-IS wind data (ExpTTREC_IS). Finally, both assimilation experiments proceeded with a 12 h forecast that began at 0000 UTC and ended at 1200 UTC on 9 July. Due to the addition of the iterative smoothing constraint algorithm, the RMSD of the T-TREC-IS method was slightly larger compared to the T-TREC method. In this study, the observation error for the T-TREC-retrieved wind was set to 4 m s−1. To ensure that radar observation effectively updated the model background field, a horizontal scale factor sensitivity test was conducted for the retrieved wind assimilation experiments. By adjusting the horizontal scale factor of the background error covariance, the corresponding analysis increments were compared. The final horizontal scale factor for the retrieved wind assimilation experiments was determined to be 0.3.

3.3. Impact of Assimilation on the Analysis Field

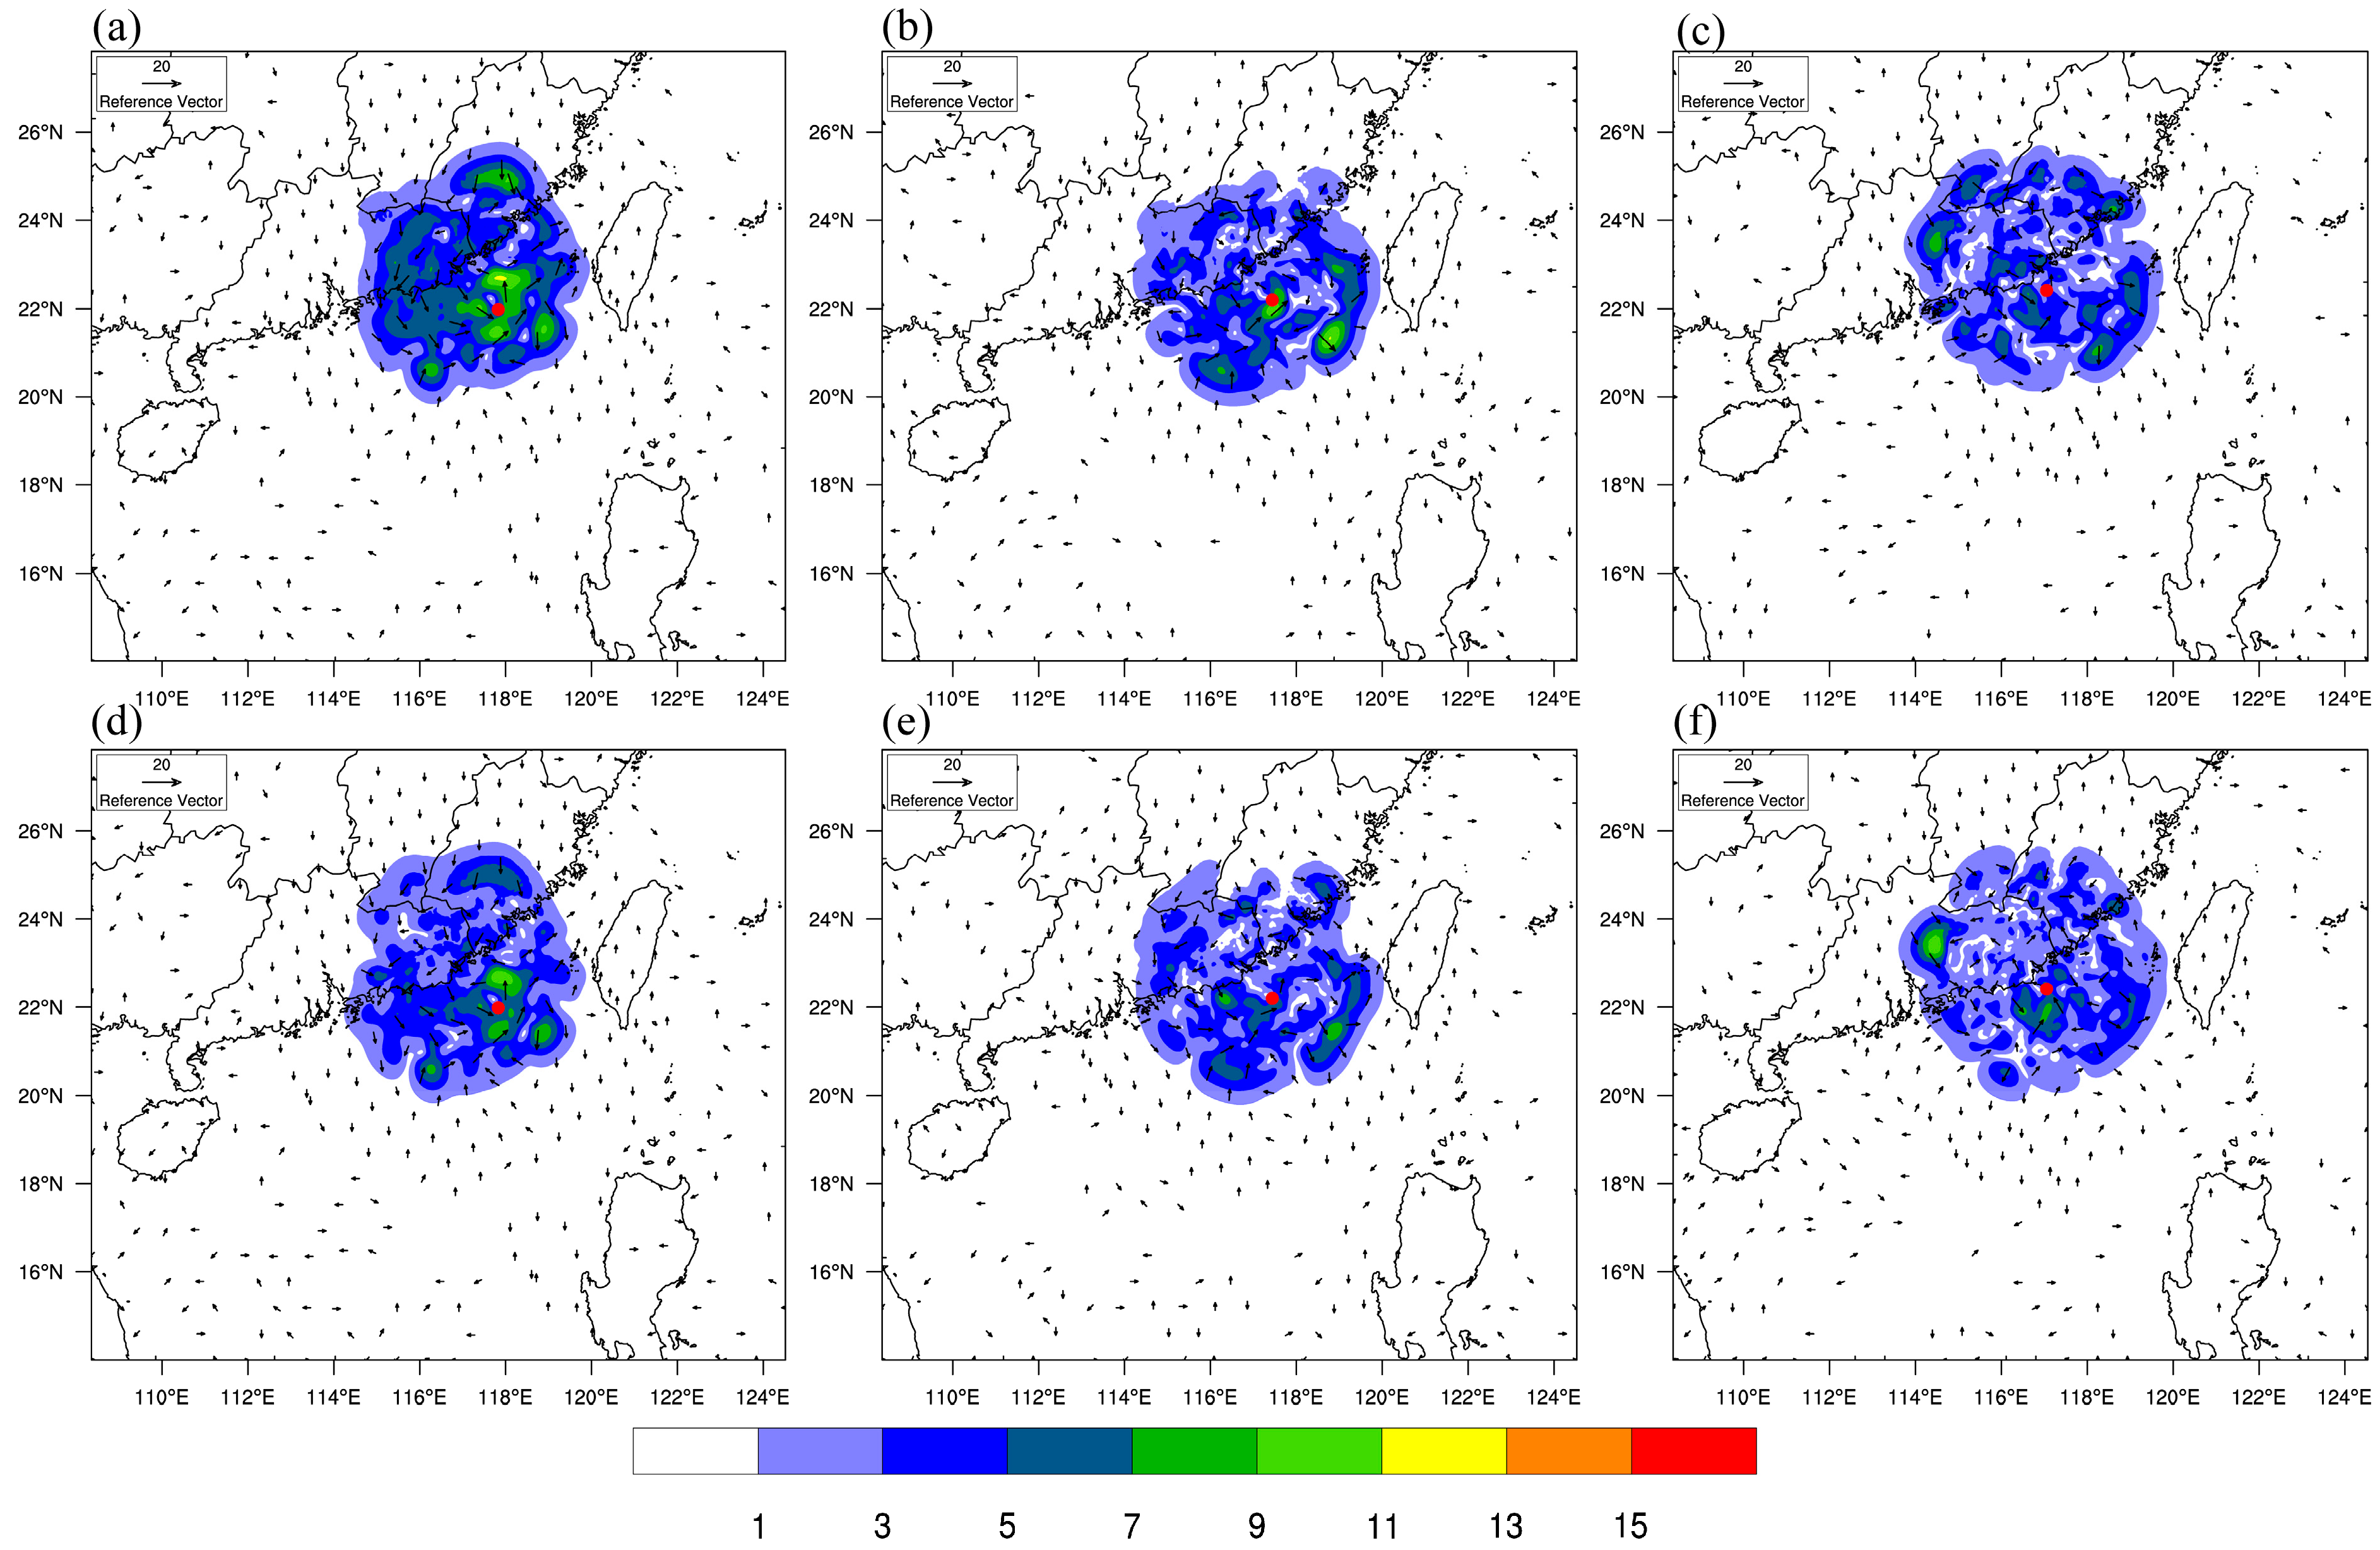
To visually compare the improvement in wind field assimilation achieved by the iterative smoothing constraint, Figure 6 shows the 700 hPa wind field increment from the ExpTTREC and ExpTTREC_IS experiments at three different analysis time points. The comparison reveals that, at the initial analysis time, both experiments exhibited significant cyclonic wind field increments near the CMA-observed typhoon center (indicated by the red dot), with increased typhoon intensity compared to the CTRL experiment. In Figure 6a, the cyclonic increment around the typhoon center covers a large area, with deeper wind speed increment colors (indicating stronger wind speed increment) and concentrated wind vectors, suggesting that the ExpTTREC experiment had a stronger adjustment effect on the wind field near the typhoon center. In contrast, Figure 6d shows more dispersed cyclonic increment, with lighter wind speed increment colors, suggesting that the ExpTTREC_IS experiment had a weaker adjustment effect. This difference may be attributed to the iterative smoothing constraint, which made the wind field more continuous. As a result, excessive increments were avoided during assimilation, leading to a weaker impact on the background field compared to the T-TREC method. By 2100 UTC 8 July (Figure 6b,e), ExpTTREC still applied stronger increments around the observed center than ExpTTREC_IS. However, by 0000 UTC 9 July (Figure 6c,f), the typhoon circulation lay largely within the radar coverage, reducing the need for smoothing; both experiments converged on similar increment patterns and magnitudes. Thus, the advantage of T-TREC-IS over T-TREC is most pronounced during the early assimilation steps, when incomplete coverage and aliasing errors would otherwise produce overly large or scattered corrections.
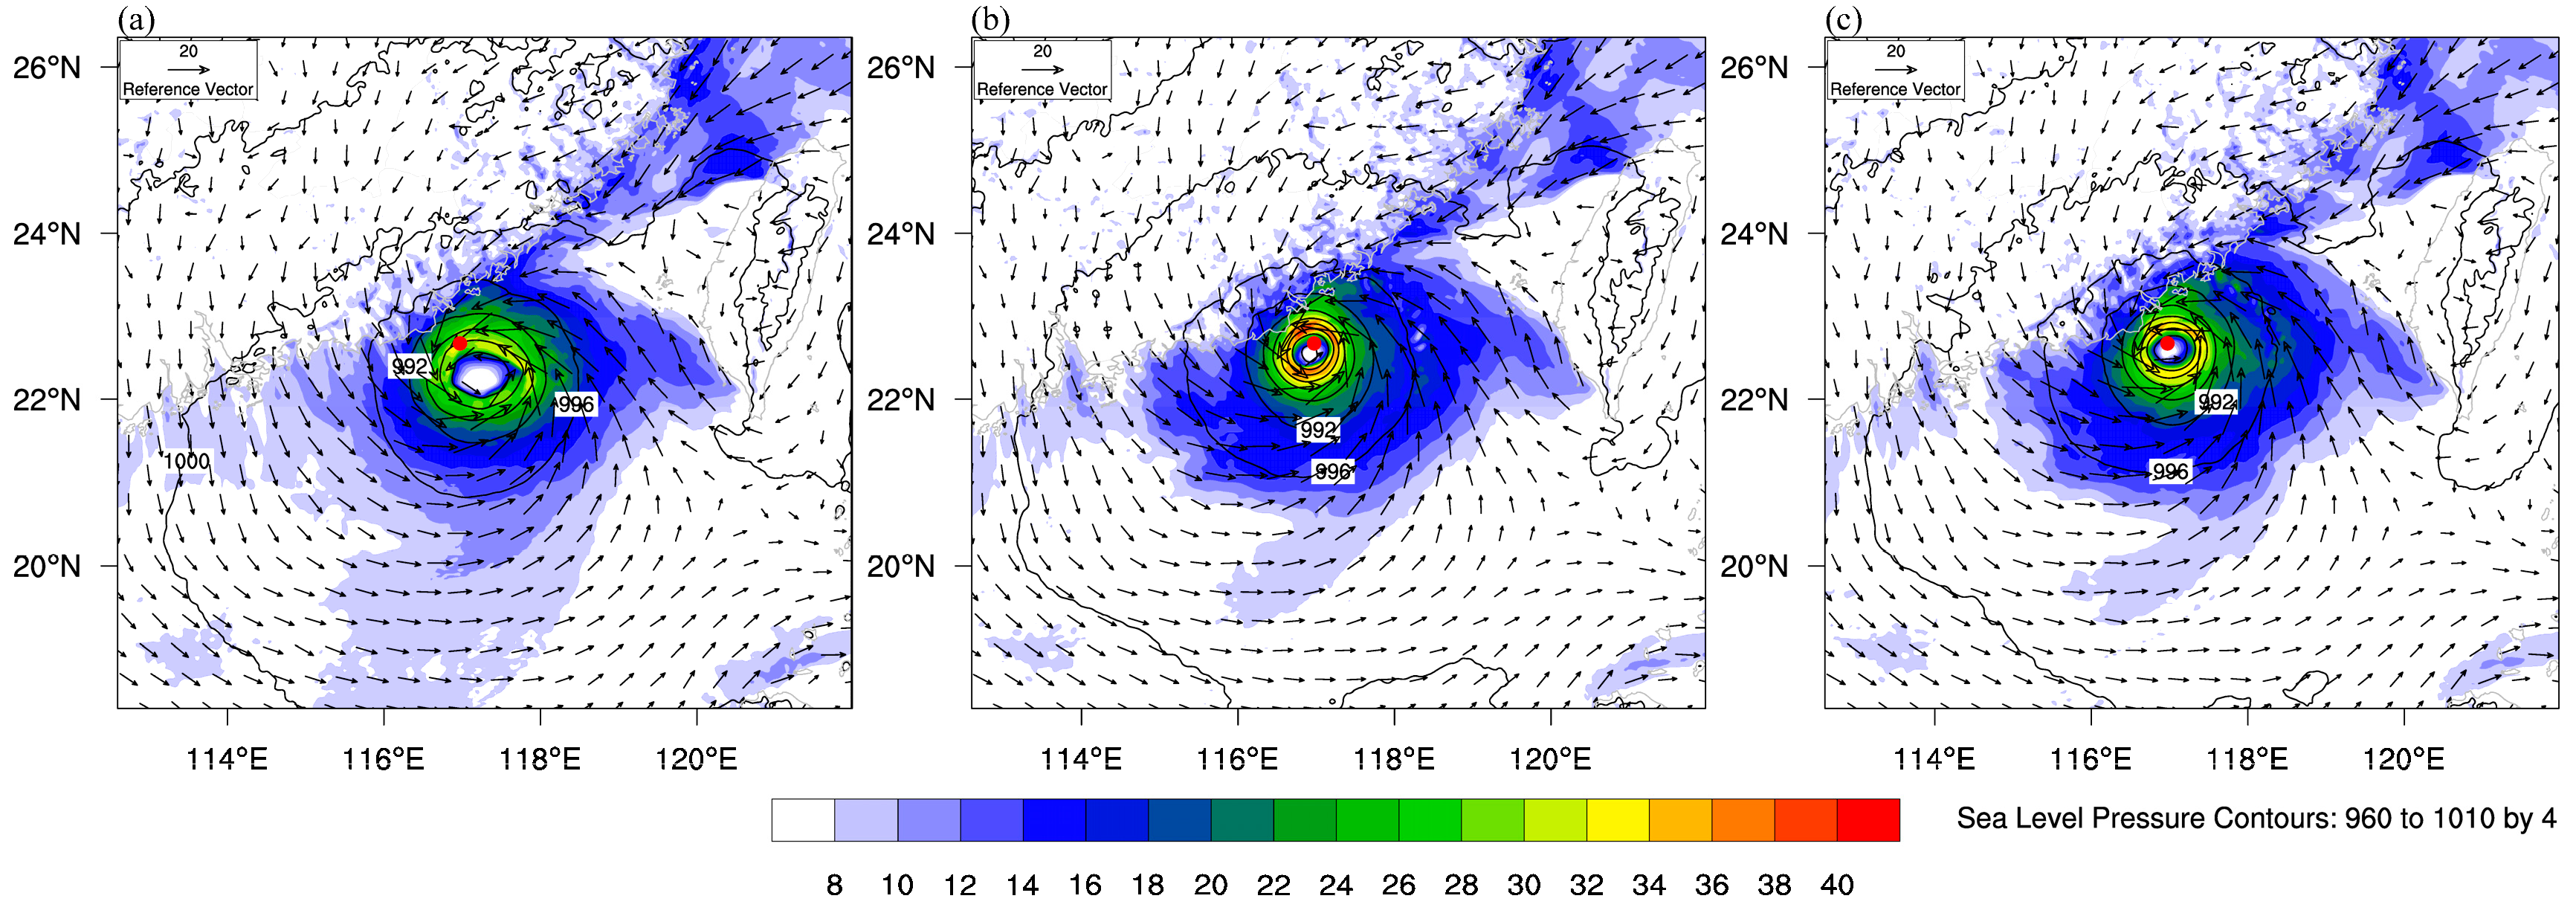
Sea level pressure (SLP) coupled with the 10 m wind field constitutes a fundamental diagnostic for gauging typhoon intensity. At the concluding assimilation time shown in Figure 7, the CMA recorded a minimum SLP of 970 hPa and maximum surface winds (MSW) of 35 m s−1. In the CTRL results, the analyzed isobars encircling the storm core are relatively far apart, reflecting a weak pressure gradient. As a result, the 10 m wind speeds remain low, and the cyclone’s eye appears unusually broad and indistinct, indicating underrepresentation of the storm’s true intensity. The typhoon center’s position significantly deviates from the CMA’s observation, with the minimum sea level pressure (MSLP) approximately 978 hPa and the MSW about 33 m s−1, indicating a noticeably weaker typhoon intensity compared to the actual observation. In Figure 7b, the isobars in the SLP appear much denser, especially near the typhoon center, indicating a stronger pressure gradient and wind speed reaching up to 38 m s−1. The typhoon eye appears more compact and distinct, with its position closer to the observed typhoon center. The typhoon intensity is significantly enhanced compared to the CTRL but remains slightly stronger than the CMA’s observation. The ExpTTREC_IS produced the MSLP and MSW closest to the observed values. The size and clarity of the typhoon eye are similar to those in the ExpTTREC, but the typhoon eye position exhibits less deviation from the observed center, indicating higher accuracy in simulating the typhoon location. Overall, both the ExpTTREC and ExpTTREC_IS demonstrated substantial improvement in capturing the structure and intensity of the typhoon, with the iterative smoothing constraint yielding superior results.
To further investigate the vertical structure of the typhoon, Figure 8 presents the azimuthally averaged tangential wind speed at 0000 UTC on 9 July 2015 for three experiments: CTRL, ExpTTREC, and ExpTTREC_IS. In the CTRL experiment, the region of high wind speeds near the typhoon eyewall was relatively small, and the horizontal gradient of the tangential wind speed was weak. The maximum azimuthally averaged tangential wind speed was measured at only 35 m s−1, situated approximately 65 km from the typhoon center. Additionally, the vertical structure of the typhoon core appears quite shallow. In contrast, the ExpTTREC experiment showed a significant increase in azimuthally averaged tangential wind speed. The high wind speed region near the eyewall was more pronounced, and the tangential wind near the eye exhibited a stronger horizontal gradient. The maximum wind speed in this experiment reached 45 m s−1, located around 30 km from the typhoon center. Furthermore, the area where wind speeds exceeded 30 m s−1 extended vertically up to 8 km, indicating a deep and well-developed typhoon structure. The ExpTTREC_IS experiment exhibited a high wind speed structure similar to that of ExpTTREC. However, it is noteworthy that in ExpTTREC_IS, the strong wind region was more concentrated at lower altitudes, suggesting a different vertical distribution of wind speeds compared to the original experiment. This analysis highlights the impact of the different methodologies on the characterization of the typhoon’s wind field and vertical structure.

3.4. Impact of Assimilation on Deterministic Forecast

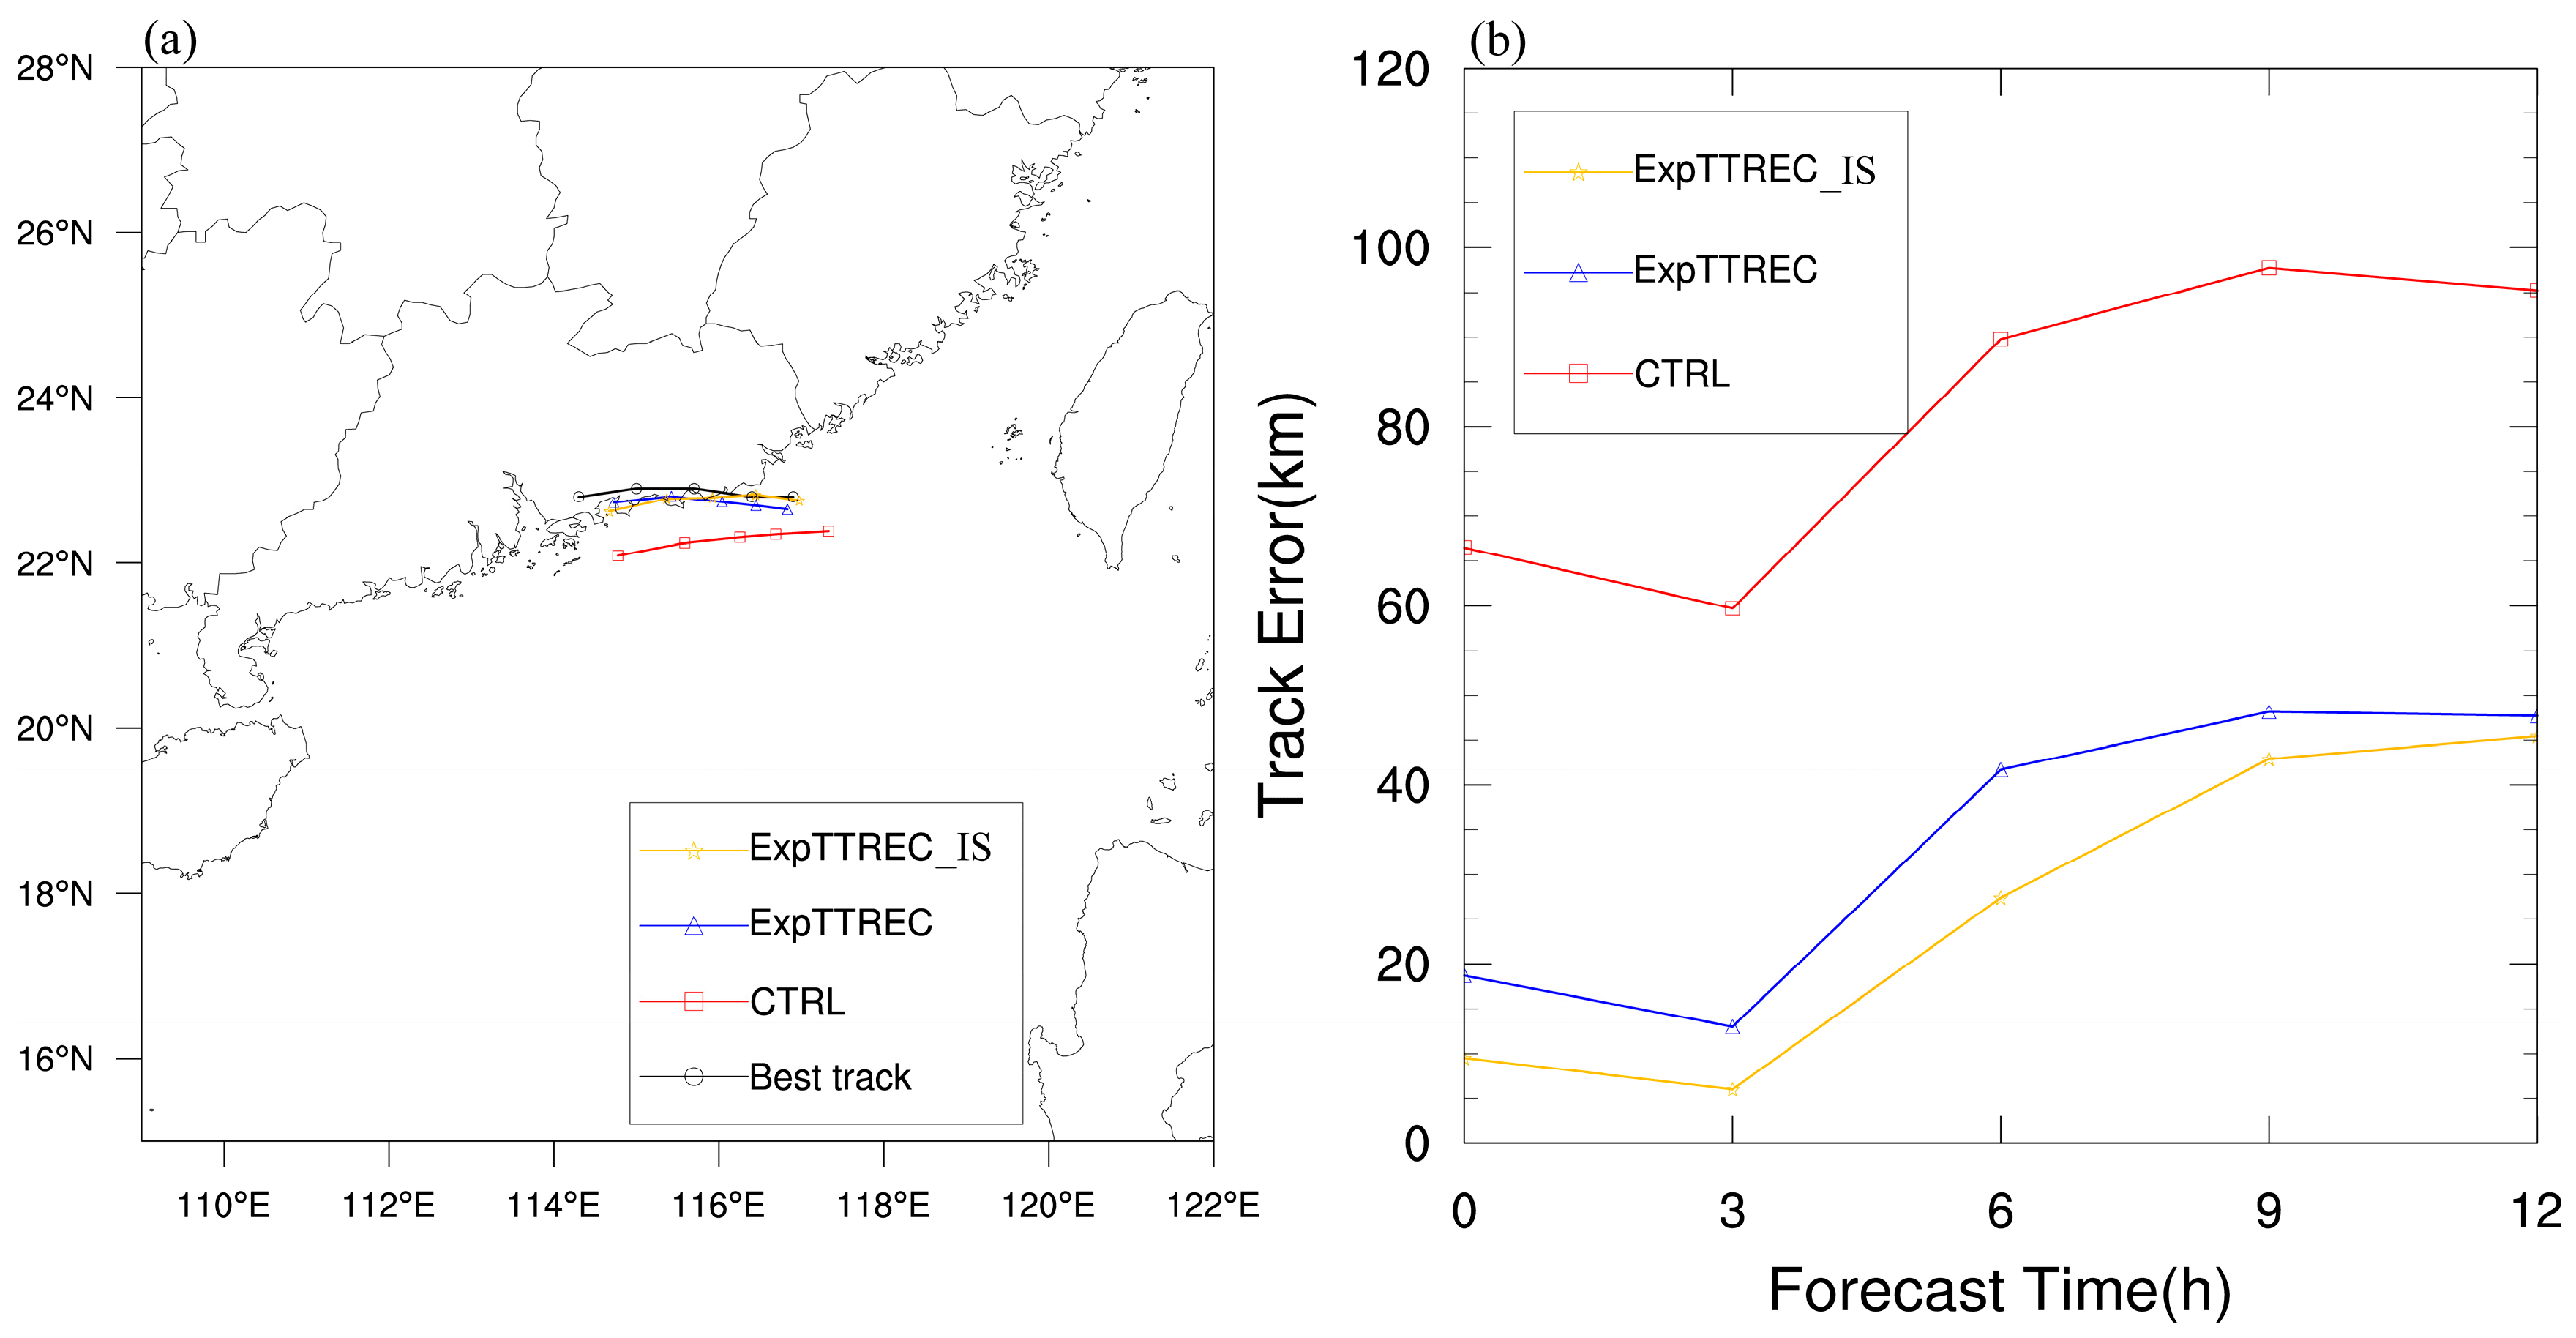
Figure 9a depicts 12 h track predictions for Typhoon Linfa, spanning 0000–1200 UTC on 9 July 2015. Tracks generated by the CTRL, ExpTTREC, and ExpTTREC_IS are set against the CMA’s best track. Vortex positions were defined by the MSLP at each analysis time. Figure 9b displays the track deviations from all three experiments in comparison to the CMA’s best track, providing a quantitative assessment of how assimilating the retrieved wind field impacts typhoon forecast accuracy. The results indicate that Typhoon Linfa moved westward and made landfall in Guangdong Province, China. In the CTRL experiment, which did not assimilate any data, the forecast track significantly deviated southward from the observed track, maintaining the typhoon center over the ocean throughout its track. This resulted in an average 12 h track error of 81.8 km.
In contrast, the ExpTTREC experiment, which incorporated the T-TREC-retrieved wind field, reduced the average track error to 33.9 km, demonstrating a substantial improvement in forecast accuracy. Furthermore, the ExpTTREC_IS experiment achieved an even lower average track error of 26.3 km, along with a slight increase in the typhoon’s movement speed. The forecast track in ExpTTREC_IS not only aligns most closely with the CMA’s best track but also exhibits a slower growth rate in track error over time. This underscores the effectiveness of the iterative smoothing constraint method in enhancing the assimilation of the T-TREC-retrieved wind field, ultimately leading to more accurate forecasts of the typhoon’s path.
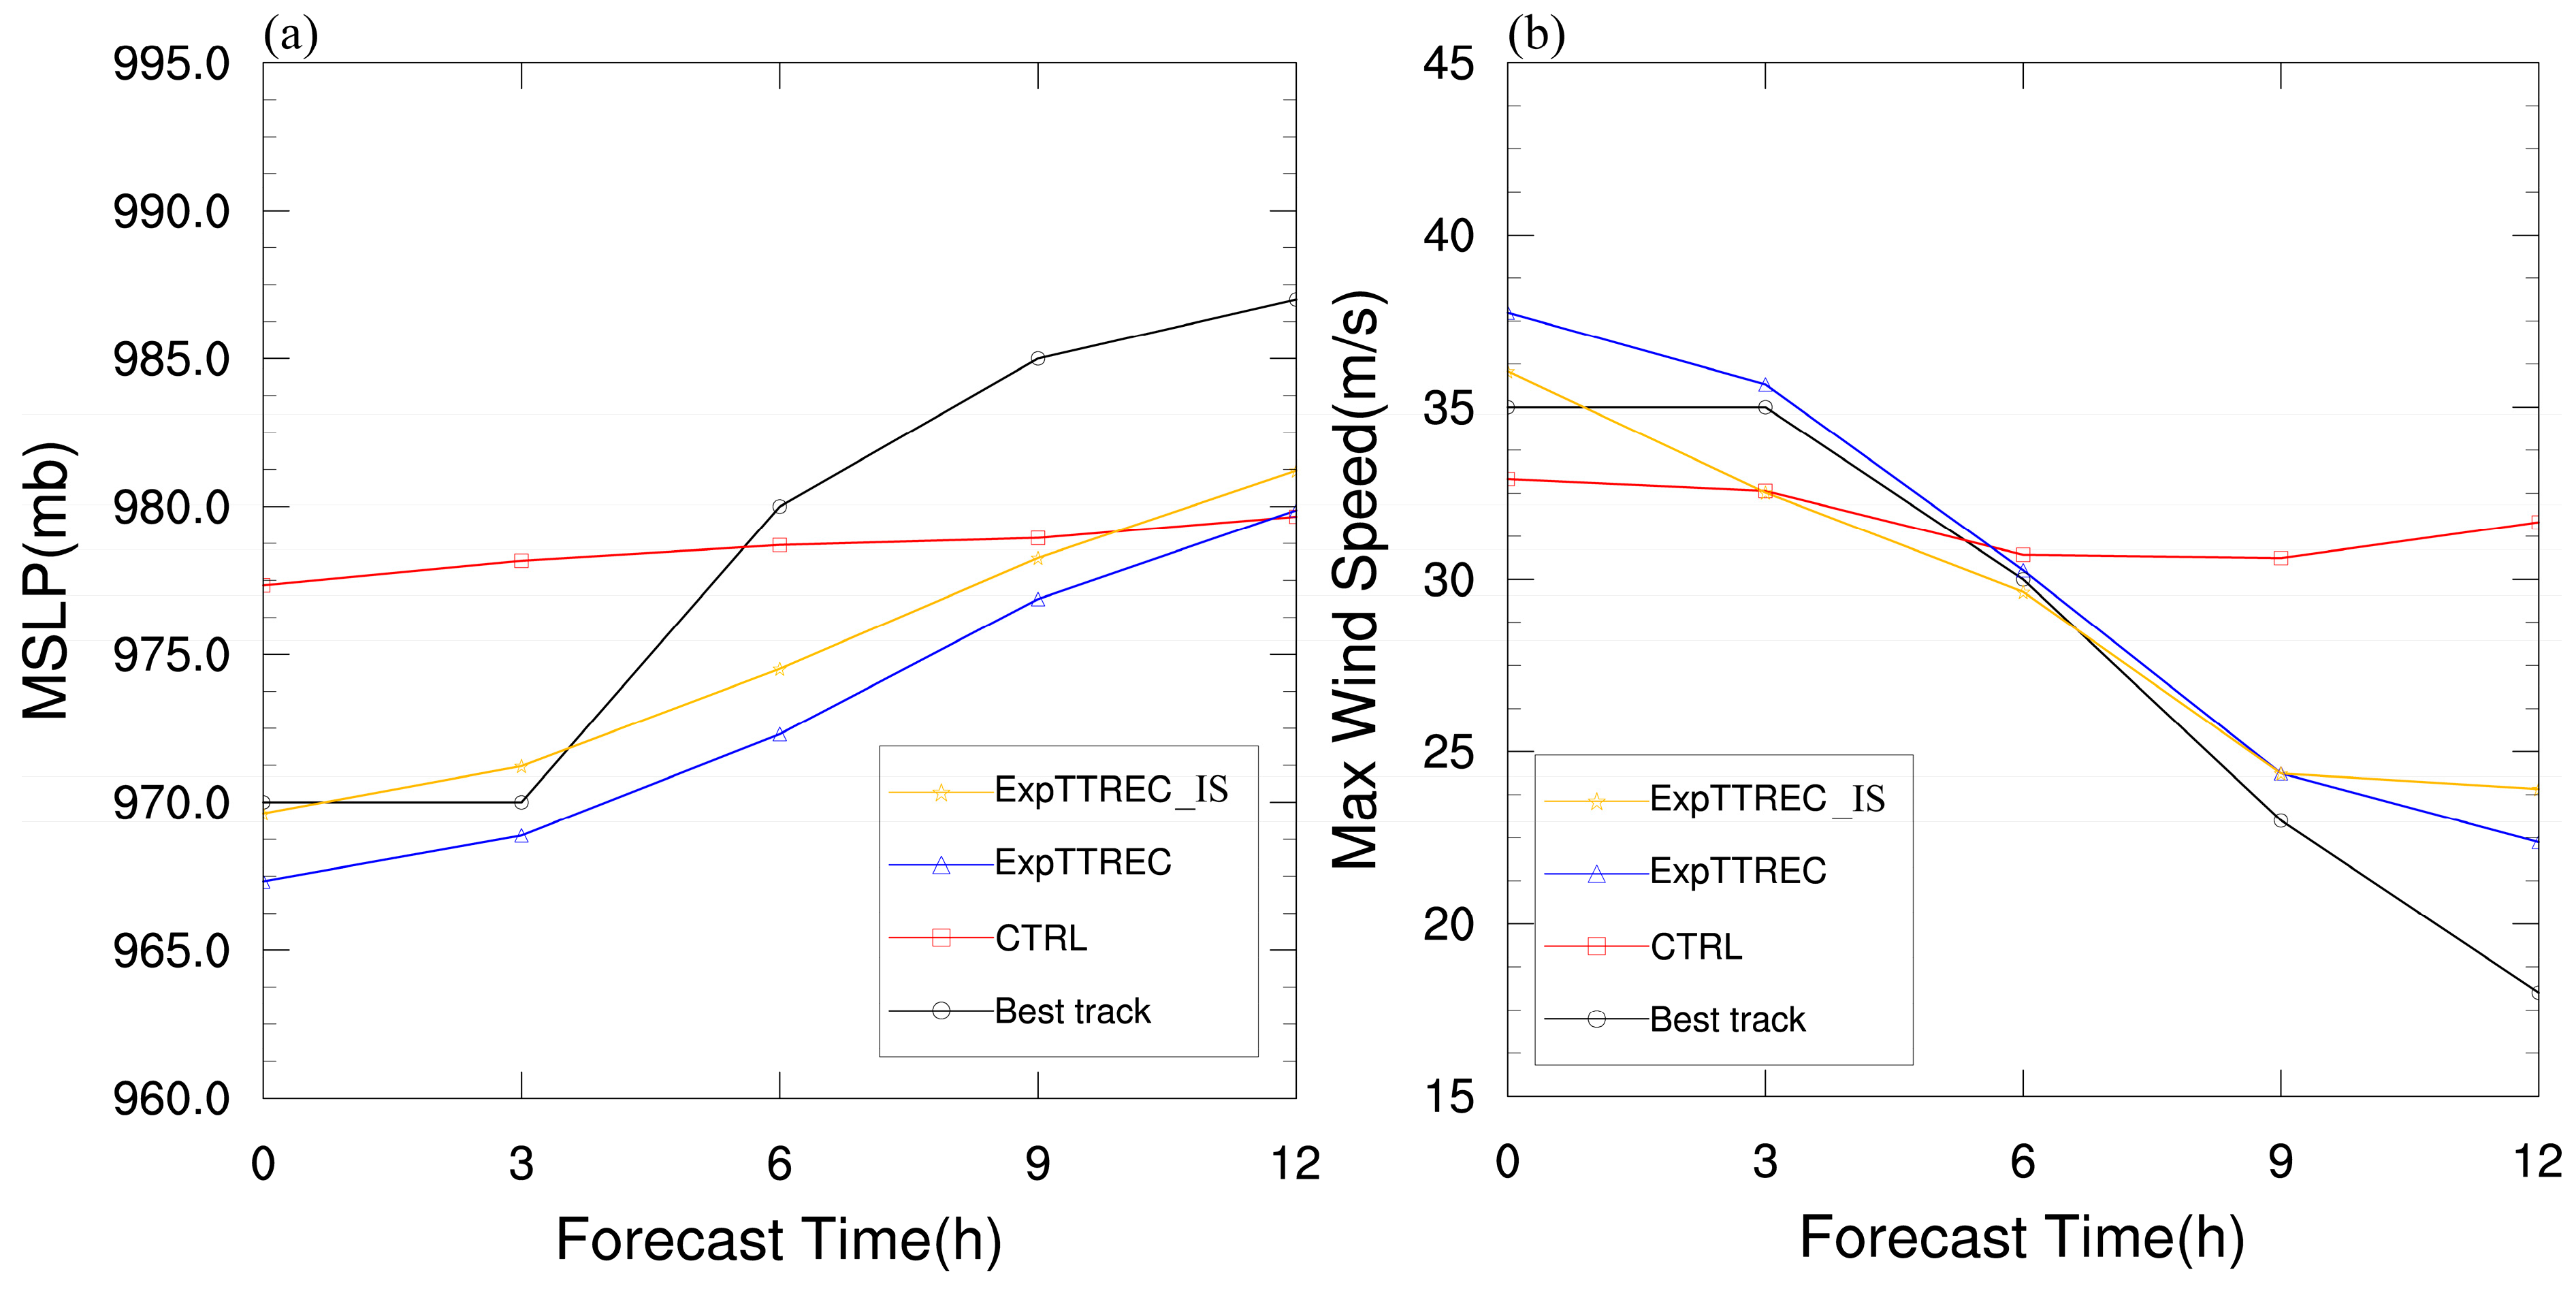
MSLP and MSW are crucial parameters for characterizing typhoon intensity. Figure 10 compares the MSLP and MSW from the CTRL, ExpTTREC, and ExpTTREC_IS experiments with the best observations from the CMA. At 0000 UTC on 9 July, the CMA recorded an MSLP of 970 hPa and an MSW of 35 m s−1. Following landfall, the MSLP gradually increased while the MSW decreased. During the early forecast period, the CTRL experiment significantly underestimated the intensity of the typhoon, resulting in a higher MSLP and a lower MSW. This underestimation is attributed to its weak initial vortex structure. However, in the mid-to-late forecast period, the CTRL predicted a stronger intensity than the best observation, showing a lower MSLP and a higher MSW. This discrepancy arises because the CTRL forecasted a more southern track, keeping the typhoon over the ocean, where reduced surface friction allows for a stronger storm compared to over land. In contrast, the ExpTTREC experiment aligns more closely with the observed intensity trend, effectively capturing the weakening of the typhoon after landfall. Throughout the forecast period, ExpTTREC predicted a lower MSLP and a higher MSW, indicating a stronger typhoon than observed. The ExpTTREC_IS experiment not only reproduced the observed intensity trend but also demonstrated the closest agreement with the observed MSLP and MSW during the early forecast period, accurately reflecting the typhoon’s structure and intensity. Notably, the accuracy of the MSLP forecast remains consistent throughout the forecast period, maintaining small deviations from the observations. Although the MSW was slightly overestimated in the final forecast period, the overall results underscore the positive impact of the iterative smoothing constraint on maintaining assimilation and enhancing forecast effectiveness. This highlights the importance of advanced assimilation techniques in improving the accuracy of typhoon intensity predictions.
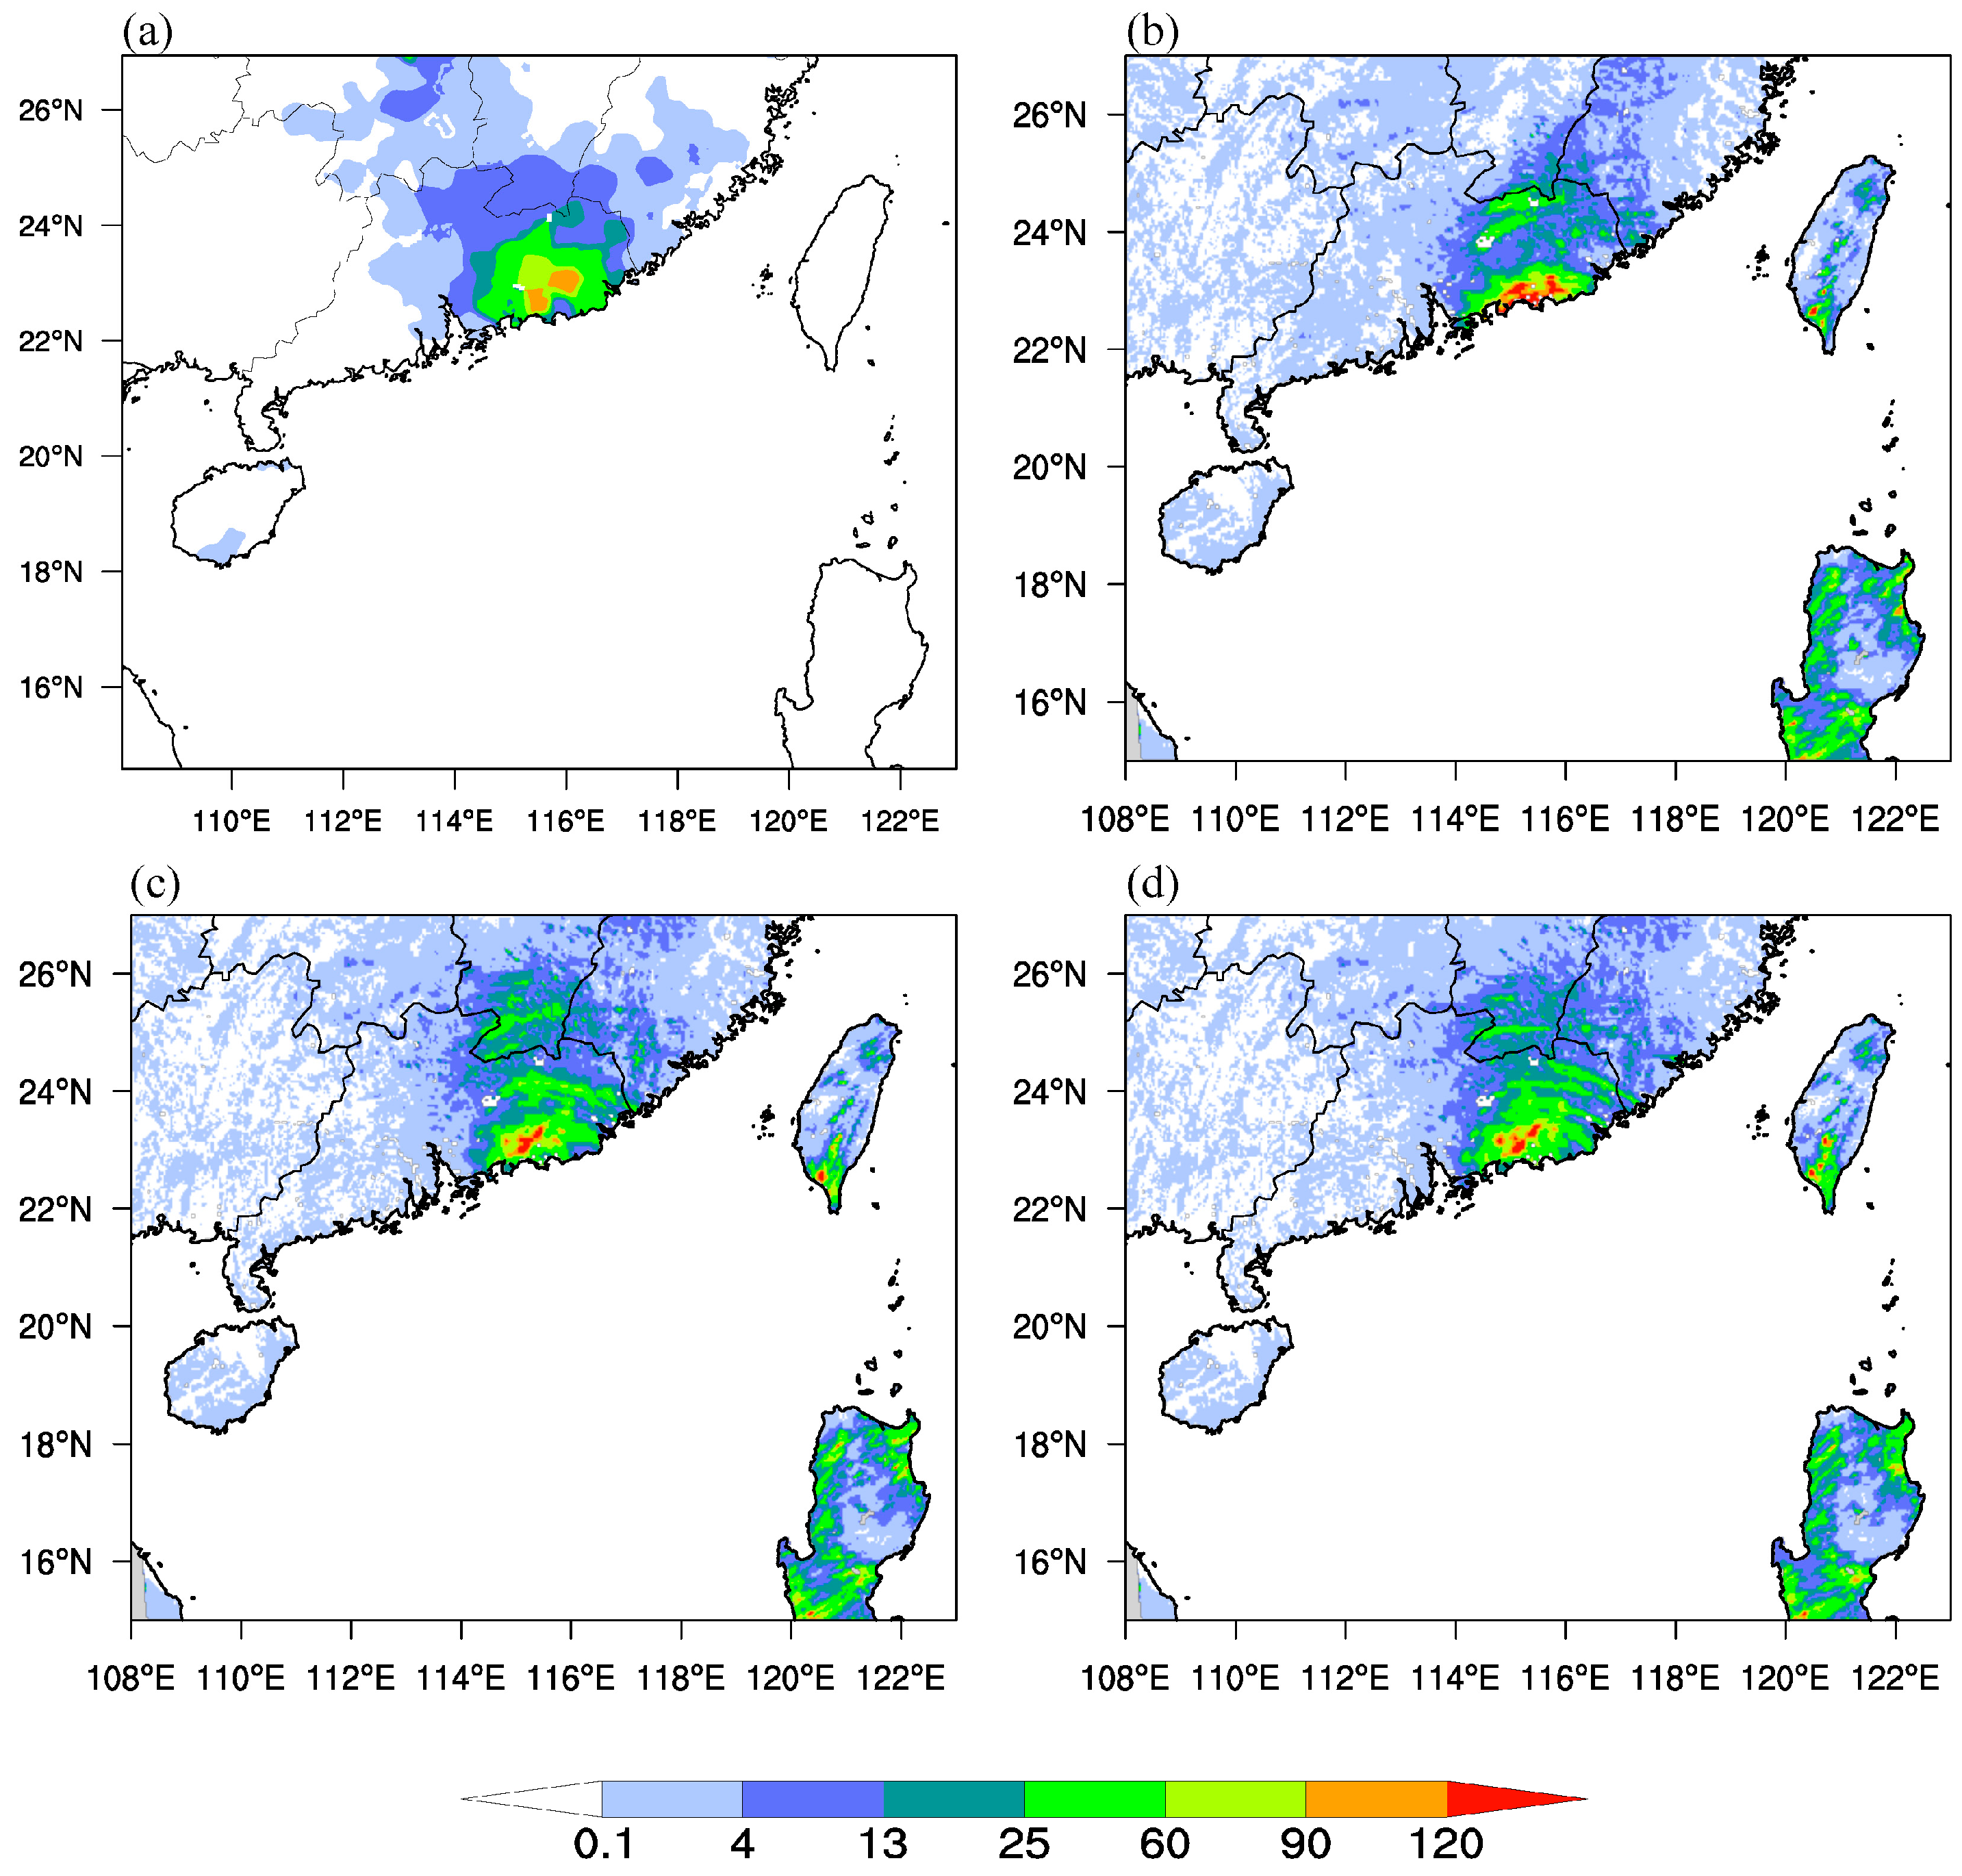
In the 6 h accumulated precipitation distribution from 0600 UTC to 1200 UTC on 9 July 2015, Figure 11a illustrates the precipitation recorded by China’s surface automatic meteorological stations, highlighting a heavy rainfall region concentrated along the southeastern coast of Guangdong Province, where rainfall reached torrential levels. Figure 11b presents the CTRL experiment, which shows notable deviations in both the distribution and intensity of precipitation compared to the observations. The CTRL predicted a precipitation area that is shifted southward, with an overestimation of precipitation intensity. This bias is likely due to the typhoon track remaining farther south over the ocean, where reduced surface friction can enhance precipitation intensity. In contrast, the ExpTTREC experiment (Figure 11c) showed significant improvements in addressing this bias, with a precipitation distribution that is much closer to the observed data. However, it still overestimated precipitation intensity, particularly predicting excessive rainfall over northern Guangdong Province, which was not observed. The ExpTTREC_IS experiment (Figure 11d) further enhanced the accuracy of both precipitation distribution and intensity. It effectively corrected the excessive rainfall prediction in northern Guangdong that was seen in ExpTTREC, aligning more closely with the observed precipitation patterns. This improvement suggests that the enhanced continuity of the retrieved wind field, facilitated by the iterative smoothing constraint, positively impacts precipitation forecasts in the assimilation process. Overall, the iterative approach demonstrates a clear benefit in refining the accuracy of precipitation predictions associated with Typhoon Linfa.
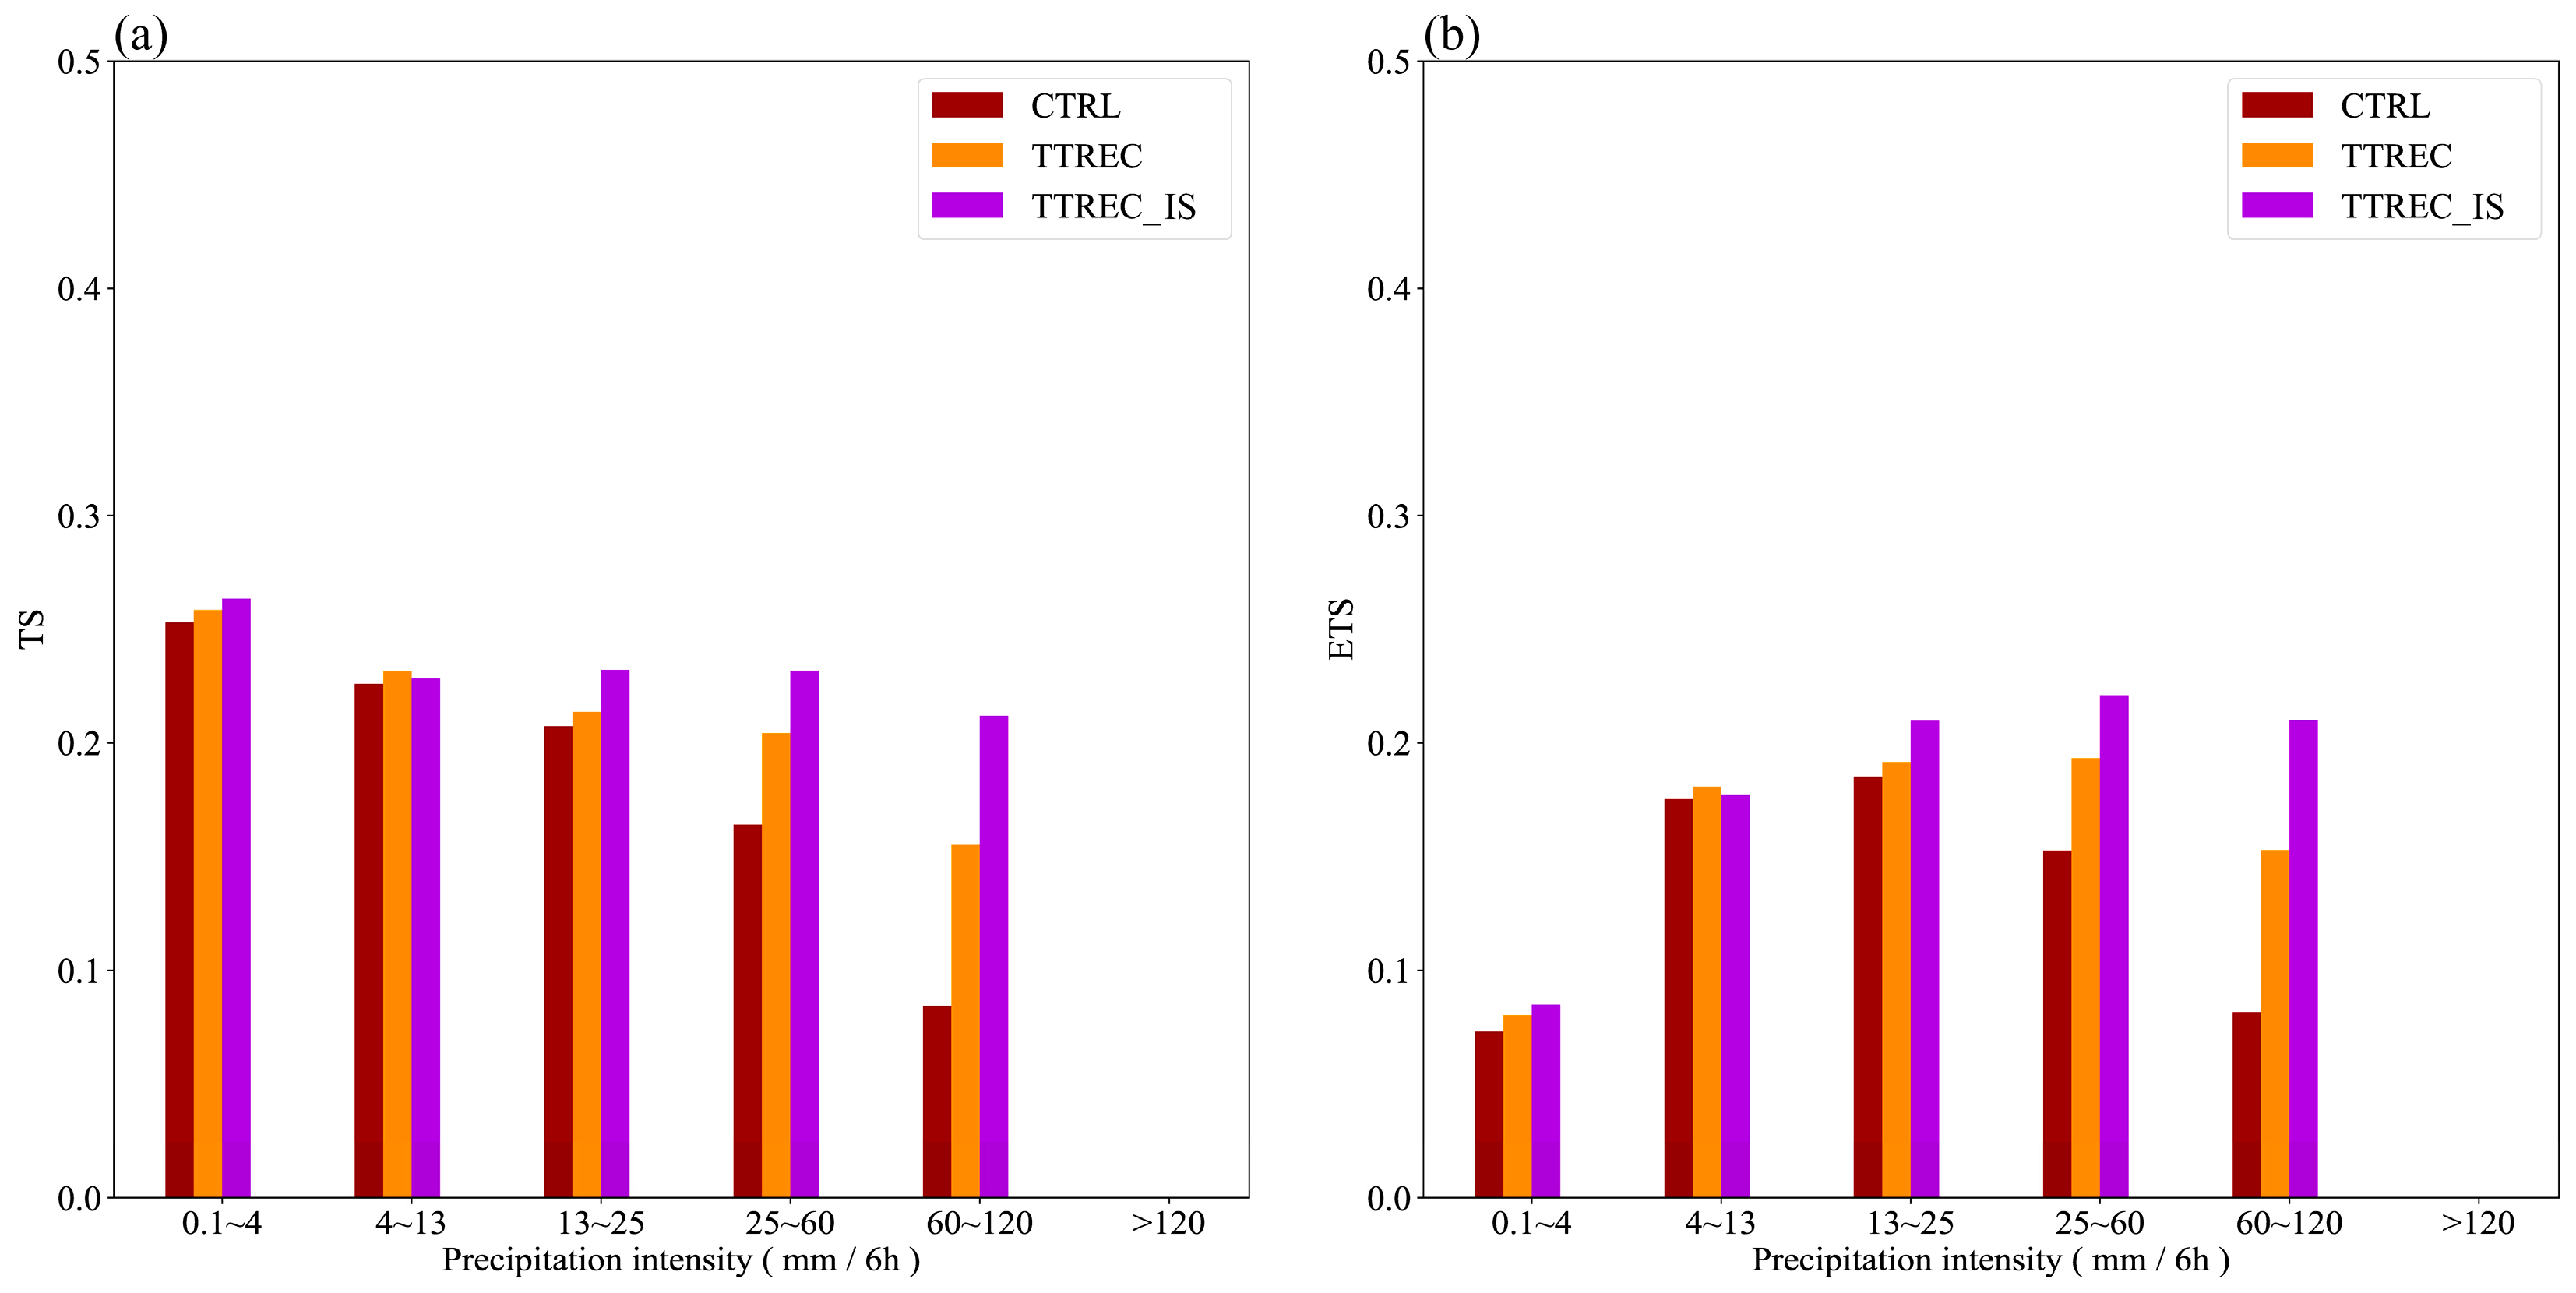
In the quantitative analysis of precipitation forecast skill for the three experiments, two evaluation metrics—Threat Score (TS) and Equitable Threat Score (ETS)—were employed to assess performance. As illustrated in Figure 12, both the ExpTTREC and ExpTTREC_IS experiments achieved higher TS and ETS scores across all precipitation thresholds compared to the CTRL experiment. This indicates that the assimilation of the retrieved wind field significantly enhanced the accuracy of precipitation forecasts. The analysis revealed that as precipitation intensity increased, the TS and ETS scores for the CTRL experiment gradually declined. This trend highlights the inherent challenges numerical models face when forecasting heavy precipitation events. However, after integrating the retrieved wind field data, both ExpTTREC and ExpTTREC_IS showed marked improvements in forecasting skill for heavy precipitation compared to the CTRL. Notably, as the precipitation threshold increased, ExpTTREC_IS exhibited a distinct advantage over ExpTTREC in predicting intense precipitation. This suggests that the iterative smoothing approach not only improves overall forecast accuracy but also enhances the model’s ability to capture the nuances of heavy rainfall events more effectively. The results underscore the importance of advanced assimilation techniques in improving the skill of precipitation forecasts, particularly for extreme weather events.

4. Conclusions and Discussion

The accuracy of the T-TREC method is notably sensitive to velocity aliasing, which can lead to discontinuities in the wind field when weakly retrieved radial velocities are directly corrected using observed data. To mitigate these challenges, this study proposes a T-TREC-IS algorithm that incorporates an iterative smoothing constraint. This improvement was evaluated within the framework of analyzing and forecasting Typhoon Linfa, using the WRF model and the WRF-3DVAR assimilation system.
The T-TREC-retrieved wind field effectively includes velocity components that are perpendicular to the radar radial direction, compensating for regions where radial velocity data may be missing. By utilizing the proposed iterative smoothing constraint, errors in the de-aliased radial velocity are effectively eliminated during radar data quality control, resulting in a strengthened wind field intensity near the typhoon’s inner core. This improvement facilitates a more accurate reconstruction of the typhoon’s cyclonic circulation, enhancing the overall continuity and consistency of the wind field.
Assimilating the T-TREC-IS-retrieved wind field refines the structure of the typhoon’s wind field, generating realistic cyclonic wind increments that further bolster the structure and intensity of the typhoon’s inner core. This process provides a more accurate initial field for model forecasting. The iterative smoothing constraint improves the continuity of the retrieved wind field, aiding in the reduction of excessive increments during assimilation. As a result, the increment of the T-TREC-IS method on wind field assimilation is relatively weaker compared to the T-TREC approach.
The assimilation of the T-TREC-IS-retrieved wind field led to a forecast track that aligns closely with the best track, exhibiting a slower increase in track error. It also accurately captured the typhoon’s structure and intensity, with the minimum sea level pressure and maximum surface wind speed in the early forecast period closely matching observed data. This improvement in track and intensity forecasting translates to better precipitation forecasts, particularly in terms of magnitude and distribution for heavy precipitation events.
However, it is important to note that the T-TREC-IS algorithm operates under the assumption that the retrieved wind field maintains a correct wind direction during the iterative smoothing process. This assumption may introduce deviations from actual conditions, which warrants further investigation into its specific impacts. Additionally, this study focused on a single case of a typhoon, limiting the generalizability of the results. Further validation is needed to evaluate the applicability of these findings to other typhoon cases.
Moreover, due to time and computational constraints, the study utilized the WRF-3DVAR assimilation system and relied solely on radar data from the Shantou station in Guangdong Province. In future work, we will integrate multi-radar network data (such as the Guangdong coastal S-band radar network) to expand observational coverage, and explore hybrid ensemble-variational (Hybrid En3DVAR) and flow-dependent background error methods (such as EnKF) to enhance the assimilation of mesoscale structures in typhoons.

Author Contributions

Conceptualization, H.B. and H.F.; methodology, A.S.; software, H.B. and C.L.; validation, H.B., C.L. and Y.M.; formal analysis, H.B. and H.F.; investigation, A.S.; resources, H.F.; data curation, J.C.; writing—original draft preparation, H.B.; writing—review and editing, H.B. and H.F.; visualization, A.S.; supervision, H.F. and A.S.; project administration, H.F.; funding acquisition, H.F. All authors have read and agreed to the published version of the manuscript.

Funding

This research was primarily funded by the National Key Research and Development Program of China grant number 2022YFC3004103, Chinese National Natural Science Foundation grant number 42475157, 42375018, U2142203, General Program of Jiangsu Meteorological Bureau (KM202310 and KM202409), Postgraduate Research & Practice Innovation Program of Jiangsu Province (KYCX25_1592), Open Fund of Fujian Key Laboratory of Severe Weather and Key Laboratory of Straits Severe Weather grant number 2024KFKT04, China Meteorological Administration Tornado Key Laboratory grant number TKL202306, TKL202302, Beijige Funding from Jiangsu Research Institute of Meteorological Science grant number BJG202503, the Open Fund of State Key Laboratory of Remote Sensing Science grant number OFSLRSS20232, the Shanghai Typhoon Research Foundation grant number TFJJ202107.

Data Availability Statement

The data utilized in this study are not publicly available due to privacy restrictions but can be obtained by reaching out to the corresponding author.

Acknowledgments

We gratefully acknowledge the High Performance Computing Center of Nanjing University of Information Science & Technology for their substantially support of this research.

Conflicts of Interest

The authors declare no conflicts of interest.

References

  1. Meng, Z.; Zhang, F.; Luo, D.; Tan, Z.; Fang, J.; Sun, J.; Shen, X.; Zhang, Y.; Wang, S.; Han, W.; et al. Review of Chinese atmospheric science research over the past 70 years: Synoptic meteorology. Sci. China Earth Sci. 2019, 62, 1946–1991. [Google Scholar] [CrossRef]
  2. Shu, A.; Shen, F.; Jiang, L.; Zhang, T.; Xu, D. Assimilation of Clear-sky FY-4A AGRI radiances within the WRFDA system for the prediction of a landfalling Typhoon Hagupit (2020). Atmos. Res. 2023, 283, 106556. [Google Scholar] [CrossRef]
  3. Shen, F.; Min, J. Assimilating AMSU-A radiance data with the WRF Hybrid En3DVAR system for track predictions of Typhoon Megi (2010). Adv. Atmos. Sci. 2015, 32, 1231–1243. [Google Scholar] [CrossRef]
  4. Schwartz, C.S.; Liu, Z.; Huang, X.-Y.; Kuo, Y.-H.; Fong, C.-T. Comparing Limited-Area 3DVAR and Hybrid Variational-Ensemble Data Assimilation Methods for Typhoon Track Forecasts: Sensitivity to Outer Loops and Vortex Relocation. Mon. Weather Rev. 2013, 141, 4350–4372. [Google Scholar] [CrossRef]
  5. Lei, L.; Whitaker, J.S.; Bishop, C. Improving Assimilation of Radiance Observations by Implementing Model Space Localization in an Ensemble Kalman Filter. J. Adv. Model. Earth Syst. 2018, 10, 3221–3232. [Google Scholar] [CrossRef]
  6. Zhang, J.A.; Kalina, E.A.; Biswas, M.K.; Rogers, R.F.; Zhu, P.; Marks, F.D. A Review and Evaluation of Planetary Boundary Layer Parameterizations in Hurricane Weather Research and Forecasting Model Using Idealized Simulations and Observations. Atmosphere 2020, 11, 1091. [Google Scholar] [CrossRef]
  7. Shu, A.; Shen, F.; Li, H.; Min, J.; Luo, J.; Xu, D.; Chen, J. Impacts of assimilating polarimetric radar KDP observations with an ensemble Kalman filter on analyses and predictions of a rainstorm associated with Typhoon Hato (2017). Q. J. R. Meteorol. Soc. 2025, 151, e4943. [Google Scholar] [CrossRef]
  8. Song, L.; Shen, F.; Shao, C.; Shu, A.; Zhu, L. Impacts of 3DEnVar-Based FY-3D MWHS-2 Radiance Assimilation on Numerical Simulations of Landfalling Typhoon Ampil (2018). Remote Sens. 2022, 14, 6037. [Google Scholar] [CrossRef]
  9. Xu, D.; Zhang, X.; Min, J.; Shen, F. Impacts of assimilating all-sky FY-4A AGRI satellite infrared radiances on the prediction of Super Typhoon In-Fa during the period with abnormal changes. J. Geophys. Res. Atmos. 2024, 129, e2024JD040784. [Google Scholar] [CrossRef]
  10. Christophersen, H.; Sippel, J.; Aksoy, A.; Baker, N.L. Recent advancements for tropical cyclone data assimilation. Ann. N. Y. Acad. Sci. 2022, 1517, 25–43. [Google Scholar] [CrossRef]
  11. Snyder, C.; Zhang, F. Assimilation of Simulated Doppler Radar Observations with an Ensemble Kalman Filter. Mon. Weather Rev. 2003, 131, 1663–1677. [Google Scholar] [CrossRef]
  12. Zhang, F.; Weng, Y.; Sippel, J.A.; Meng, Z.; Bishop, C.H. Cloud-Resolving Hurricane Initialization and Prediction through Assimilation of Doppler Radar Observations with an Ensemble Kalman Filter. Mon. Weather Rev. 2009, 137, 2105–2125. [Google Scholar] [CrossRef]
  13. Shen, F.; Song, L.; Min, J.; He, Z.; Shu, A.; Xu, D.; Chen, J. Impact of Assimilating Pseudo-Observations Derived from the “Z-RH” Relation on Analyses and Forecasts of a Strong Convection Case. Adv. Atmos. Sci. 2025, 42, 1010–1025. [Google Scholar] [CrossRef]
  14. Fabry, F.; Meunier, V. Why Are Radar Data so Difficult to Assimilate Skillfully? Mon. Weather Rev. 2020, 148, 2819–2836. [Google Scholar] [CrossRef]
  15. Liang, X.; Xie, Y.; Yin, J.; Luo, Y.; Yao, D.; Li, F. An IVAP-Based Dealiasing Method for Radar Velocity Data Quality Control. J. Atmos. Ocean. Technol. 2019, 36, 2069–2085. [Google Scholar] [CrossRef]
  16. He, G.; Sun, J.; Ying, Z.; Zhang, L. A Radar Radial Velocity Dealiasing Algorithm for Radar Data Assimilation and its Evaluation with Observations from Multiple Radar Networks. Remote Sens. 2019, 11, 2457. [Google Scholar] [CrossRef]
  17. Feldmann, M.; James, C.N.; Boscacci, M.; Leuenberger, D.; Gabella, M.; Germann, U.; Wolfensberger, D.; Berne, A. R2D2: A Region-Based Recursive Doppler Dealiasing Algorithm for Operational Weather Radar. J. Atmos. Ocean. Technol. 2020, 37, 2341–2356. [Google Scholar] [CrossRef]
  18. Zhao, K.; Xue, M. Assimilation of coastal Doppler radar data with the ARPS 3DVAR and cloud analysis for the prediction of Hurricane Ike (2008). Geophys. Res. Lett. 2009, 36, L1280. [Google Scholar] [CrossRef]
  19. Li, Y.; Wang, X.; Xue, M. Assimilation of Radar Radial Velocity Data with the WRF Hybrid Ensemble–3DVAR System for the Prediction of Hurricane Ike (2008). Mon. Weather Rev. 2012, 140, 3507–3524. [Google Scholar] [CrossRef]
  20. Dong, J.; Xue, M. Assimilation of radial velocity and reflectivity data from coastal WSR-88D radars using an ensemble Kalman filter for the analysis and forecast of landfalling hurricane Ike (2008). Q. J. R. Meteorol. Soc. 2013, 139, 467–487. [Google Scholar] [CrossRef]
  21. Xu, D.; Shen, F.; Min, J. Effect of background error tuning on assimilating radar radial velocity observations for the forecast of hurricane tracks and intensities. Meteorol. Appl. 2020, 27, e1820. [Google Scholar] [CrossRef]
  22. Chen, J.; Xu, D.; Shu, A.; Song, L. The Impact of Radar Radial Velocity Data Assimilation Using WRF-3DVAR System with Different Background Error Length Scales on the Forecast of Super Typhoon Lekima (2019). Remote Sens. 2023, 15, 2592. [Google Scholar] [CrossRef]
  23. Shen, F.; Xu, D.; Min, J. Effect of momentum control variables on assimilating radar observations for the analysis and forecast for Typhoon Chanthu (2010). Atmos. Res. 2019, 230, 104622. [Google Scholar] [CrossRef]
  24. Shen, F.; Xue, M.; Min, J. A comparison of limited-area 3DVAR and ETKF-En3DVAR data assimilation using radar observations at convective scale for the prediction of Typhoon Saomai (2006). Meteorol. Appl. 2017, 24, 628–641. [Google Scholar] [CrossRef]
  25. Zhao, K.; Li, X.; Xue, M.; Jou, B.J.-D.; Lee, W.-C. Short-term forecasting through intermittent assimilation of data from Taiwan and mainland China coastal radars for Typhoon Meranti (2010) at landfall. J. Geophys. Res. Atmos. 2012, 117, D0610. [Google Scholar] [CrossRef]
  26. Li, X.; Ming, J.; Wang, Y.; Zhao, K.; Xue, M. Assimilation of T-TREC-retrieved wind data with WRF 3DVAR for the short-term forecasting of typhoon Meranti (2010) near landfall. J. Geophys. Res. Atmos. 2013, 118, 10361–10375. [Google Scholar] [CrossRef]
  27. Xu, D.; Chen, J.; Li, H.; Shen, F.; He, Z. The impact of radar radial velocity data assimilation using variational and EnKF systems on the forecast of Super Typhoon Hato (2017) with Rapid Intensification. Atmos. Res. 2025, 314, 107748. [Google Scholar] [CrossRef]
  28. Zhao, K.; Lin, Q.; Lee, W.-C.; Qiang Sun, Y.; Zhang, F. Doppler Radar Analysis of Triple Eyewalls in Typhoon Usagi (2013). Bull. Am. Meteorol. Soc. 2016, 97, 25–30. [Google Scholar] [CrossRef]
  29. Shimada, U.; Kubota, H.; Yamada, H.; Cayanan, E.O.; Hilario, F.D. Intensity and Inner-Core Structure of Typhoon Haiyan (2013) near Landfall: Doppler Radar Analysis. Mon. Weather Rev. 2018, 146, 583–597. [Google Scholar] [CrossRef]
  30. Liou, Y.-C.; Wang, T.-C.; Lee, W.-C.; Chang, Y.-J. The Retrieval of Asymmetric Tropical Cyclone Structures Using Doppler Radar Simulations and Observations with the Extended GBVTD Technique. Mon. Weather Rev. 2006, 134, 1140–1160. [Google Scholar] [CrossRef]
  31. Jou, B.J.-D.; Lee, W.-C.; Liu, S.-P.; Kao, Y.-C. Generalized VTD Retrieval of Atmospheric Vortex Kinematic Structure. Part I: Formulation and Error Analysis. Mon. Weather Rev. 2008, 136, 995–1012. [Google Scholar] [CrossRef]
  32. Wang, M.; Zhao, K.; Lee, W.-C.; Jou, B.J.-D.; Xue, M. The Gradient Velocity Track Display (GrVTD) Technique for Retrieving Tropical Cyclone Primary Circulation from Aliased Velocities Measured by Single-Doppler Radar. J. Atmos. Ocean. Technol. 2012, 29, 1026–1041. [Google Scholar] [CrossRef]
  33. Rinehart, R.E.; Garvey, E.T. Three-dimensional storm motion detection by conventional weather radar. Nature 1978, 273, 287–289. [Google Scholar] [CrossRef]
  34. Tuttle, J.; Gall, R. A Single-Radar Technique for Estimating the Winds in Tropical Cyclones. Bull. Am. Meteorol. Soc. 1999, 80, 653–668. [Google Scholar] [CrossRef]
  35. Harasti, P.R.; McAdie, C.J.; Dodge, P.P.; Lee, W.-C.; Tuttle, J.; Murillo, S.T.; Marks, F.D. Real-Time Implementation of Single-Doppler Radar Analysis Methods for Tropical Cyclones: Algorithm Improvements and Use with WSR-88D Display Data. Weather Forecast. 2004, 19, 219–239. [Google Scholar] [CrossRef]
  36. Wang, M.; Zhao, K.; Wu, D. The T-TREC technique for retrieving the winds of landfalling typhoon in China. Acta Meteorol. Sin. 2010, 25, 114–124. [Google Scholar] [CrossRef]
  37. Wang, M.; Xue, M.; Zhao, K.; Dong, J. Assimilation of T-TREC-Retrieved Winds from Single-Doppler Radar with an Ensemble Kalman Filter for the Forecast of Typhoon Jangmi (2008). Mon. Weather Rev. 2014, 142, 1892–1907. [Google Scholar] [CrossRef]
  38. Li, X.; Wang, Y.; Ming, J.; Mei, H.; Wang, W.; Zhou, J. A combined radar data assimilation strategy of radial velocity and retrieved wind and its impact on the forecasting of tropical cyclone Chanthu (2010). Meteorol. Mon. 2016, 42, 649–663. [Google Scholar]
  39. Wang, M.; Xue, M.; Zhao, K. The impact of T-TREC-retrieved wind and radial velocity data assimilation using EnKF and effects of assimilation window on the analysis and prediction of Typhoon Jangmi (2008). J. Geophys. Res. Atmos. 2016, 121, 259–277. [Google Scholar] [CrossRef]
  40. Helmus, J.J.; Collis, S.M. The Python ARM Radar Toolkit (Py-ART), a Library for Working with Weather Radar Data in the Python Programming Language. J. Open Res. Softw. 2016, 4, 25. [Google Scholar] [CrossRef]
  41. Shen, F.; Min, J.; Xu, D. Assimilation of radar radial velocity data with the WRF Hybrid ETKF–3DVAR system for the prediction of Hurricane Ike (2008). Atmos. Res. 2016, 169, 127–138. [Google Scholar] [CrossRef]
  42. Chang, P.-L.; Jong-Dao Jou, B.; Zhang, J. An Algorithm for Tracking Eyes of Tropical Cyclones. Weather Forecast. 2009, 24, 245–261. [Google Scholar] [CrossRef]
  43. Parrish, D.F.; Derber, J.C. The National Meteorological Center’s Spectral Statistical-Interpolation Analysis System. Mon. Weather Rev. 1992, 120, 1747–1763. [Google Scholar] [CrossRef]
  44. Shen, F.; Song, L.; He, Z.; Xu, D.; Chen, J.; Huang, L. Impacts of adding hydrometeor control variables on the radar reflectivity data assimilation for the 6–8 August 2018 mesoscale convective system case. Atmos. Res. 2023, 295, 107012. [Google Scholar] [CrossRef]
  45. Shen, F.; Song, L.; Li, H.; He, Z.; Xu, D. Effects of different momentum control variables in radar data assimilation on the analysis and forecast of strong convective systems under the background of northeast cold vortex. Atmos. Res. 2022, 280, 106415. [Google Scholar] [CrossRef]
  46. Bian, H.; Min, J.; Shen, F. Application of Radar Radial Velocity Data Assimilation in the Forecasts of Typhoon Linfa Based on Different Horizontal Length Scale Factors. Atmosphere 2023, 14, 582. [Google Scholar] [CrossRef]
Figure 1. Radar reflectivity (shaded, dBZ) overlaid with wind vectors retrieved by T-TREC (ac) and T-TREC-IS (df) at 3 km altitude at (a,d) 1800 UTC on 8 July 2015, (b,e) 2100 UTC on 8 July 2015, and (c,f) 0000 UTC on 9 July 2015 (red dot indicates the location of STRD).
Remotesensing 17 02821 g001
Figure 2. Radial velocity at 3 km altitude at 1800 UTC on 8 July 2015: (a) STRD-observed radial velocity, (b) radial velocity projected from the T-TREC-retrieved wind onto the radar radial direction, (c) radial velocity projected from the T-TREC-retrieved wind without observational correction, and (d) radial velocity projected from the T-TREC-IS-retrieved wind. The blue squares and red circles indicate the areas where the differences are more pronounced.
Remotesensing 17 02821 g002
Figure 3. Cumulative bar chart of the absolute error percentage between the radial velocity component of the T-TREC-IS-retrieved wind and the radar-observed radial velocity, recorded hourly from 1800 UTC on 8 July to 0000 UTC on 9 July 2015.
Remotesensing 17 02821 g003
Figure 4. The experimental simulation domain (shaded areas represent terrain height, unit: m) and CMA’s best track of Typhoon Linfa from 0000 UTC on 5 July to 1800 UTC on 9 July 2015 is shown. Track markers are color-coded by intensity class: tropical storm (TS), severe tropical storm (STS), typhoon (TY), and super-typhoon (STY). The radar’s corresponding influence radius is shown (the location of STRD is marked with an asterisk; the inner dashed circle (230 km) delineates the radial velocity range, and the outer dashed circle (460 km) defines the reflectivity range [43].
Remotesensing 17 02821 g004
Figure 5. Flow chart of the experiments.
Remotesensing 17 02821 g005
Figure 6. Wind field increment at 700 hPa for ExpTTREC (ac) and ExpTTREC_IS (df) at (a,d) 1800 UTC 8 July 2015, (b,e) 2100 UTC 8 July 2015, and (c,f) 0000 UTC 9 July 2015 (the red symbol marks the typhoon center as recorded by CMA).
Remotesensing 17 02821 g006
Figure 7. Sea level pressure plotted with black contour lines, and the 10 m wind field—color-filled to denote wind speed—is displayed at 0000 UTC on 9 July 2015 for (a) CTRL, (b) ExpTTREC, and (c) ExpTTREC_IS experiments (the red dot indicates the typhoon center observed by CMA).
Remotesensing 17 02821 g007
Figure 8. Azimuthally averaged tangential wind speed at 0000 UTC on 9 July 2015 for (a) CTRL, (b) ExpTTREC, and (c) ExpTTREC_IS.
Remotesensing 17 02821 g008
Figure 9. (a) Forecast tracks produced by the CTRL, ExpTTREC, and ExpTTREC_IS experiments, plotted against the CMA’s best track; (b) the temporal evolution of track errors for all three experiments in relation to the CMA’s best track.
Remotesensing 17 02821 g009
Figure 10. (a) Comparative minimum sea level pressure and (b) maximum surface wind from the three experiments versus the CMA’s best observation.
Remotesensing 17 02821 g010
Figure 11. Maps of 6 h accumulated precipitation (mm) from 0600 UTC to 1200 UTC on 9 July 2015 for (a) surface automatic meteorological stations, (b) CTRL, (c) ExpTTREC, and (d) ExpTTREC_IS.
Remotesensing 17 02821 g011
Figure 12. (a) TS score and (b) ETS score for the 6 h accumulated precipitation from 0600 UTC to 1200 UTC on 9 July 2015 for the three experiments. The horizontal axis represents precipitation thresholds (mm).
Remotesensing 17 02821 g012
Table 1. Experimental schemes.
NumberNameSchemes
1CTRLNo data assimilation
2ExpTTRECT-TREC-retrieved wind data assimilation
3ExpTTREC_IST-TREC-IS-retrieved wind data assimilation
Disclaimer/Publisher’s Note: The statements, opinions and data contained in all publications are solely those of the individual author(s) and contributor(s) and not of MDPI and/or the editor(s). MDPI and/or the editor(s) disclaim responsibility for any injury to people or property resulting from any ideas, methods, instructions or products referred to in the content.