Article

PolSAR-SFCGN: An End-to-End PolSAR Superpixel Fully Convolutional Generation Network

1
Key Laboratory of Intelligent Perception and Image Understanding of Ministry of Education, School of Artificial Intelligence, Xidian University, Xi’an 710071, China
2
School of Engineering, Xidian University, Xi’an 710071, China
3
54th Research Institute of China Electronics Technology Group Corporation, Shijiazhuang 050081, China
*
Author to whom correspondence should be addressed.
Remote Sens. 2025, 17(15), 2723; https://doi.org/10.3390/rs17152723
Submission received: 19 May 2025 / Revised: 1 August 2025 / Accepted: 4 August 2025 / Published: 6 August 2025

Abstract

Polarimetric Synthetic Aperture Radar (PolSAR) image classification is one of the most important applications in remote sensing. The impressive superpixel generation approaches can improve the efficiency of the subsequent classification task and restrain the influence of the speckle noise to an extent. Most of the classical PolSAR superpixel generation approaches use the features extracted manually and even only consider the pseudocolor images. They do not make full use of polarimetric information and do not necessarily lead to good enough superpixels. The deep learning methods can extract effective deep features but they are difficult to combine with superpixel generation to achieve true end-to-end training. Addressing the above issues, this study proposes an end-to-end fully convolutional superpixel generation network for PolSAR images. It integrates the extraction of polarization information features and the generation of PolSAR superpixels into one step. PolSAR superpixels can be generated based on deep polarization feature extraction and need no traditional clustering process. Both the performance and efficiency of generations of PolSAR superpixels can be enhanced effectively. The experimental results on various PolSAR datasets show that the proposed method can achieve impressive superpixel segmentation by fitting the real boundaries of different types of ground objects effectively and efficiently. It can achieve excellent classification performance by connecting a very simple classification network, which is helpful to improve the efficiency of the subsequent PolSAR image classification tasks.

1. Introduction

Polarimetric Synthetic Aperture Radar (PolSAR) is an indispensable sensor in Earth observation, which is a radar system that uses electromagnetic waves for imaging. Due to the powerful ability of PolSAR to achieve all-weather earth observation without being affected by adverse weather conditions, it is also widely used in various scenarios. Unlike the traditional Synthetic Aperture Radar (SAR) system, PolSAR can work in a variety of different polarization modes and collect the scattering information of targets in different directions. It can retain the details of targets to a large extent and obtain rich information [1,2,3]. PolSAR image classification refers to the use of algorithms or models to extract and process the scattering, spatial, and other information of pixels to obtain the categories, so as to obtain the types of actual ground objects corresponding to the pixels. The pixel-level classification techniques [4,5] extract the polarization features pixel by pixel and attempt to label each pixel independently. At the same time, the speckle noise generated by the coherent imaging mechanism affects the classification performance of PolSAR images. Therefore, the classification methods based on superpixels have attracted widespread attention [6,7,8]. Superpixels are generated by over-segmentation techniques commonly used as a preprocessing step in computer vision applications. The superpixel generation algorithms aim to over-segment images into many small, meaningful regions to achieve a low/middle-level image representation [9,10,11].
The existing superpixel generation approaches can be divided into clustering-based methods and graph-based methods. The clustering-based methods are relatively common, mainly including SLIC [12], LSC [13], and SEEDS [14]. The graph-based methods usually include Ncuts [15] and ERS [16]. Compared with the pixel-level operations, the superpixel-based operations retain the structural information in the images and improve the computational efficiency by replacing a huge number of pixels with hundreds of superpixels [17,18]. However, the traditional superpixel generation approaches are difficult to integrate with deep learning techniques. The standard convolutional operations for image processing are typically defined on the regular grid lattices. When they operate over irregular superpixel blocks, the efficiency of computation becomes low. Furthermore, the existing superpixel generation algorithms are non-differentiable, which leads to the incorporation of non-differentiable modules into network architectures. It is impossible to calculate the gradient values during the training of the end-to-end networks. Thus, most superpixel generation approaches via deep learning are multi-phase, which are not convenient to train and time-consuming [19,20]. In [21], a deep neural network was used to extract features, while the superpixels were generated by using a soft K-means clustering method. To deal with this problem, an end-to-end network was proposed to generate the superpixels for computer vision tasks without any clustering procedure [22]. In the PolSAR image interpretation field, several segmentation approaches can achieve superpixel segmentation by adding a maximum pixel number in the generation of segmentation regions [23,24]. Most of the current PolSAR superpixel generation approaches are improvements in classical methods, such as scattering decomposition-based methods [25,26,27]. These approaches require the manual design of features for superpixel segmentation and use discrete optimization methods to search the pixel-superpixel associations, which makes them non-differentiable. Although some works have been proposed based on deep learning, they still require a clustering process and consume a large amount of computational resources [6]. Additionally, quite a few existing algorithms only consider pseudocolor images, which convert and present the polarization information in the form of color images to generate superpixels. These methods ignore some useful polarization information, such as the scattering information that contains features like surface roughness, shape, orientation, and so on. Since the differences exist in the polarization scattering features of different types of ground objects, the inability to make full use of the polarization features of the PolSAR images always leads to inaccurate analyses and further affects the qualities of superpixels.
To address the above issues, this study proposes an end-to-end PolSAR superpixel fully convolutional generation network (PolSAR-SFCGN). It makes deep feature extraction through deep learning and PolSAR superpixel generation into one step without any traditional clustering procedures, which can improve the efficiency of PolSAR superpixel generation based on deep learning effectively. PolSAR-SFCGN constructs a fully convolutional neural network by using a universal encoder–decoder structure to generate superpixels. The encoder can extract deep features of PolSAR images based on the polarization coherence matrix, while the decoder can generate PolSAR superpixels with the deep polarization features. By optimizing a loss function based on cross-entropy and superpixel compactness via a differentiable association matrix on the regular grids, we can generate PolSAR superpixels with the consideration of maintaining the boundary information and the compactness of the superpixels. The shapes of superpixels are regular in the homogeneous regions with a single type of ground object, while the superpixels around the boundaries of different types of ground objects sacrifice a certain degree of compactness to keep the boundary details. PolSAR-SFCGN is helpful to enhance the efficiency and guarantee the performance of the subsequent PolSAR image classification tasks.
The rest of this paper is organized as follows. The related works of PolSAR superpixel segmentation and deep learning-based superpixel generation approaches are introduced first. Then, the detailed descriptions of PolSAR-SFCGN are given in Section 3. In Section 4, the experimental results are presented and analyzed. Section 5 displays the discussions of the experimental results. Finally, this work is concluded in Section 6.

2. Related Works

2.1. Superpixel Generation for PolSAR Images

Superpixel generation is an over-segmentation of images that is formed by grouping the image pixels based on the low-level image properties. They provide a perceptually meaningful tessellation of image content, thereby reducing the number of image primitives for subsequent image processing. Owing to their representational and computational efficiency, the superpixels have become an established low or midlevel image representation and are widely used in computer vision tasks such as object detection [28,29], semantic segmentation [30,31], saliency estimation [32,33,34,35], optical flow estimation [36,37,38,39], depth estimation [40], tracking [41], etc. The superpixels are especially widely used in traditional energy minimization frameworks, where a low number of image primitives greatly reduces the optimization complexity.
In the field of PolSAR interpretation, there are a variety of approaches proposed for superpixel segmentation. Table 1 categorizes the representative superpixel generation algorithms for PolSAR images. Unlike optical images, PolSAR images contain rich information that represents the scattering information of ground objects. A number of PolSAR superpixel generation approaches have been developed by introducing the scattering information into the traditional generation techniques. In [42,43], an average coherence matrix represented the polarimetric information, and the nearest distance in traditional superpixels was replaced by the Wishart hypothesis test distance. In [44], the polarimetric information was represented by the vectors consisting of the upper triangular part of the coherency matrix and Yamaguchi decomposition. The vectors were used by a traditional superpixel segmentation algorithm to generate PolSAR superpixels. Cao et al. [45] adopted the coherency matrix to represent the polarimetric information and used the algorithm in [43] to generate superpixels. In [46], an improved Wishart distance was introduced, and the Pauli decomposition that represented polarimetric information was used as an input to the modified superpixel generation algorithm. In [47], the polarimetric information of pixels was represented by the coherence matrices. PolSAR superpixels were generated by introducing four classical dissimilarity statistical distances of PolSAR data into a traditional superpixel generation algorithm. The above PolSAR superpixel generation approaches considered various distance metrics to measure the similarities of pixels, such as the Euclidean distances [48,49] and the statistical model-based distances [43,50,51]. It is common to represent the polarimetric information with a coherency matrix or scattering coefficients extracted by the polarimetric decomposition theorem. The various distance metrics are defined on the obtained polarimetric information. In addition, the fuzzy superpixels-based algorithms were applied for PolSAR images to reduce the misclassification rate, where the pixels were grouped into pixels of homogeneous appearance and the undetermined pixels [8,42]. Guo et al. [8] proposed a polarimetric scattering information-based adaptive fuzzy superpixel generation for PolSAR image classification. The correlation of pixels’ polarimetric scattering information was considered through fuzzy rough set theory to generate superpixels. In [52], a multiobjective evolutionary superpixel segmentation was proposed for PolSAR image classification. It contained an automatic optimization layer and a fine segmentation layer, which could determine the suitable superpixel number automatically and further improve the qualities of superpixels by fully using the boundary information of good-quality superpixels in the evolution process for generating PolSAR superpixels. Most of the existing PolSAR superpixel generation approaches can be seen as improved versions of classical superpixel generation methods by extracting features manually. The manual feature extraction relies on people’s experiences and understanding to select appropriate features. Meanwhile, these methods use the discrete optimization strategies to find the pixel-superpixel associations, which makes them non-differentiable. Many traditional superpixel generation algorithms are non-differentiable. Inspired by the excellent feature extraction capability of deep learning, some works have been proposed to generate PolSAR superpixels via deep learning. Wang et al. [6] proposed a superpixel sampling network for PolSAR images (PolSAR-SSN). Although it could extract the deep features of PolSAR images automatically, it still required a SLIC-based clustering process and consumed a large amount of computational resources.

2.2. Deep Learning-Based Superpixel Generation

In recent years, deep learning has achieved superior performance in a wide range of computer vision tasks. However, it is not easy to introduce deep learning into superpixel generation directly. The standard convolution operations in deep neural networks are usually defined on the regular grid lattices and become inefficient when operating on the irregular superpixel lattices. Additionally, when using deep neural networks to extract features automatically, non-differentiable superpixel generation leads to the incorporation of the non-differentiable modules into the network architectures, which makes it impossible to calculate the gradient values during the training of the networks. Regarding the above issues, a superpixel sampling network (SSN) [21] was proposed as a differentiable algorithm by relaxing the nearest neighbor constraints presented in SLIC. PolSAR-SSN [6] was an improvement inspired by SSN for PolSAR images. SSN allowed the deep neural network to extract features of superpixels instead of using traditional manual feature extraction. Then, these deep features were passed onto the differentiable SLIC that generated the superpixels by an iterative clustering. Although SSN and PolSAR-SSN could generate impressive superpixels, they only used the networks for feature extraction and still required a SLIC-based clustering procedure to generate the superpixels, which consumed a large amount of computational resources and time. Specifically, the clustering performances always rely on the initializations, such as the initial clustering centers. Meanwhile, the differentiable clustering process uses the continuous dense matrix multiplication, which requires considerable memory. In this regard, Yang et al. [22] proposed a superpixel segmentation with fully convolutional networks (SFCN). It used a standard encoder–decoder design with skip connections to predict the superpixel association map. The encoder took a colorful image as the input and produced the high-level feature maps through the convolutional network. With the features from the corresponding encoder layers, the decoder then gradually upsampled the feature maps via the deconvolutional layers to make the final prediction. Through the above operations, SFCN transformed superpixel segmentation into an end-to-end deep learning task, which could directly obtain superpixel segmentation results without the need for additional clustering operations.
In this work, we design a PolSAR superpixel generation network based on SFCN. Compared with SFCN, PolSAR-SFCGN aims to extend to the task of superpixel segmentation, assisting PolSAR image classification. Instead of the RGB features of the optical images in SFCN, the polarization features are fully considered and utilized to extract the deep polarization features automatically by the convolutional layers in the encoder. Thus, it can better fit the real boundaries in PolSAR images and enhance resistance to noise when generating superpixels. With the extracted deep polarization features, PolSAR superpixels are generated by the deconvolutional layers in the decoder without any additional clustering processes. It can improve the efficiency and performance of superpixel generation impressively and facilitate subsequent PolSAR image classification tasks. Furthermore, among the existing deep learning-based PolSAR superpixel generation methods, SSN and PolSAR-SSN adopt the seeds-based initialization strategy, while SFCN and PolSAR-SFCGN employ the rectangular regions-based initialization strategy. Compared with the seed-based initialization, the rectangular regions-based initialization can generate the superpixels with more regular shapes. The quantity and distribution of these superpixels are controllable. These superpixels are naturally more compatible with the convolutional networks that require the regular inputs, thus being more suitable for integration with subsequent PolSAR image classification tasks.

3. Methodology

3.1. Overall Framework

As shown in Figure 1, PolSAR-SFCGN is a superpixel generation network and can be combined with the subsequent classification networks directly. PolSAR-SFCGN is defined on a fully convolutional network with an encoder–decoder structure, and its input is the processed polarization coherence matrix. After the training of PolSAR-SFCGN, with the obtained PolSAR superpixels, the subsequent classification network can be trained for PolSAR image classification. It is noted that the classification network can be replaced and designed specifically according to the detailed requirements in the practical applications.

3.2. Learning Superpixels on Regular Grids

In the superpixel generation module, we use a superpixel generation strategy on the regular grids. A common strategy is to first partition the image with H × W size by using a regular grid of size h × w . Then, we treat each grid as the initial superpixel. The superpixels can be generated by finding the mapping that assigns each pixel to one superpixel. If the pixel p belongs to the superpixel i , the corresponding value in the pixel-superpixel association matrix equals to one; otherwise, it is set as zero. Thus, the pixel-superpixel association matrix A can be calculated by
A p , S = arg min i { 1 , 2 , , m } D ( I p , c s )
where I p is the feature vector of pixel p . c s is the center of superpixel S . m is the number of the superpixels, and D denotes the distance between two feature vectors.
In the practical applications, even if the number of superpixels is small, the calculations of the mapping associations between each pixel and other superpixels are still prohibitively expensive. In order to reduce the computational complexity, only nine superpixels blocks around a given pixel p are considered for allocation. As shown in Figure 2, for each pixel in the white box, only the surrounding superpixels in the orange box are considered for computing the association. Consequently, the mapping can be written as a tensor A Z H × W × N p , where Z is the integer set. N p represents the number of the associated superpixels that need to be considered when assigning pixels to superpixels, and N p = 9 . It can bring down the size of association matrix A from n × m to n × 9 , where n is the number of pixels. It is efficient in terms of both computation and memory. It should be noted that the association matrix A obtained by the above strategy is non-differentiable, which cannot be used for the end-to-end training of deep neural networks. It is also difficult to combine with the subsequent classification tasks. In order to make the objective function differentiable, we adopt a soft correlation mapping Q R H × W × N p , where the elements in Q represent the probabilities of the pixels being assigned to each superpixel S N P . The values of the elements in Q falls into the interval of [ 0 , 1 ] , and Q can be calculated by
Q p , S = exp ( D ( I p , c s ) )
Finally, the superpixels can be generated by assigning each pixel p to the superpixel with the highest probability.

3.3. Network Structure of PolSAR-SFCGN

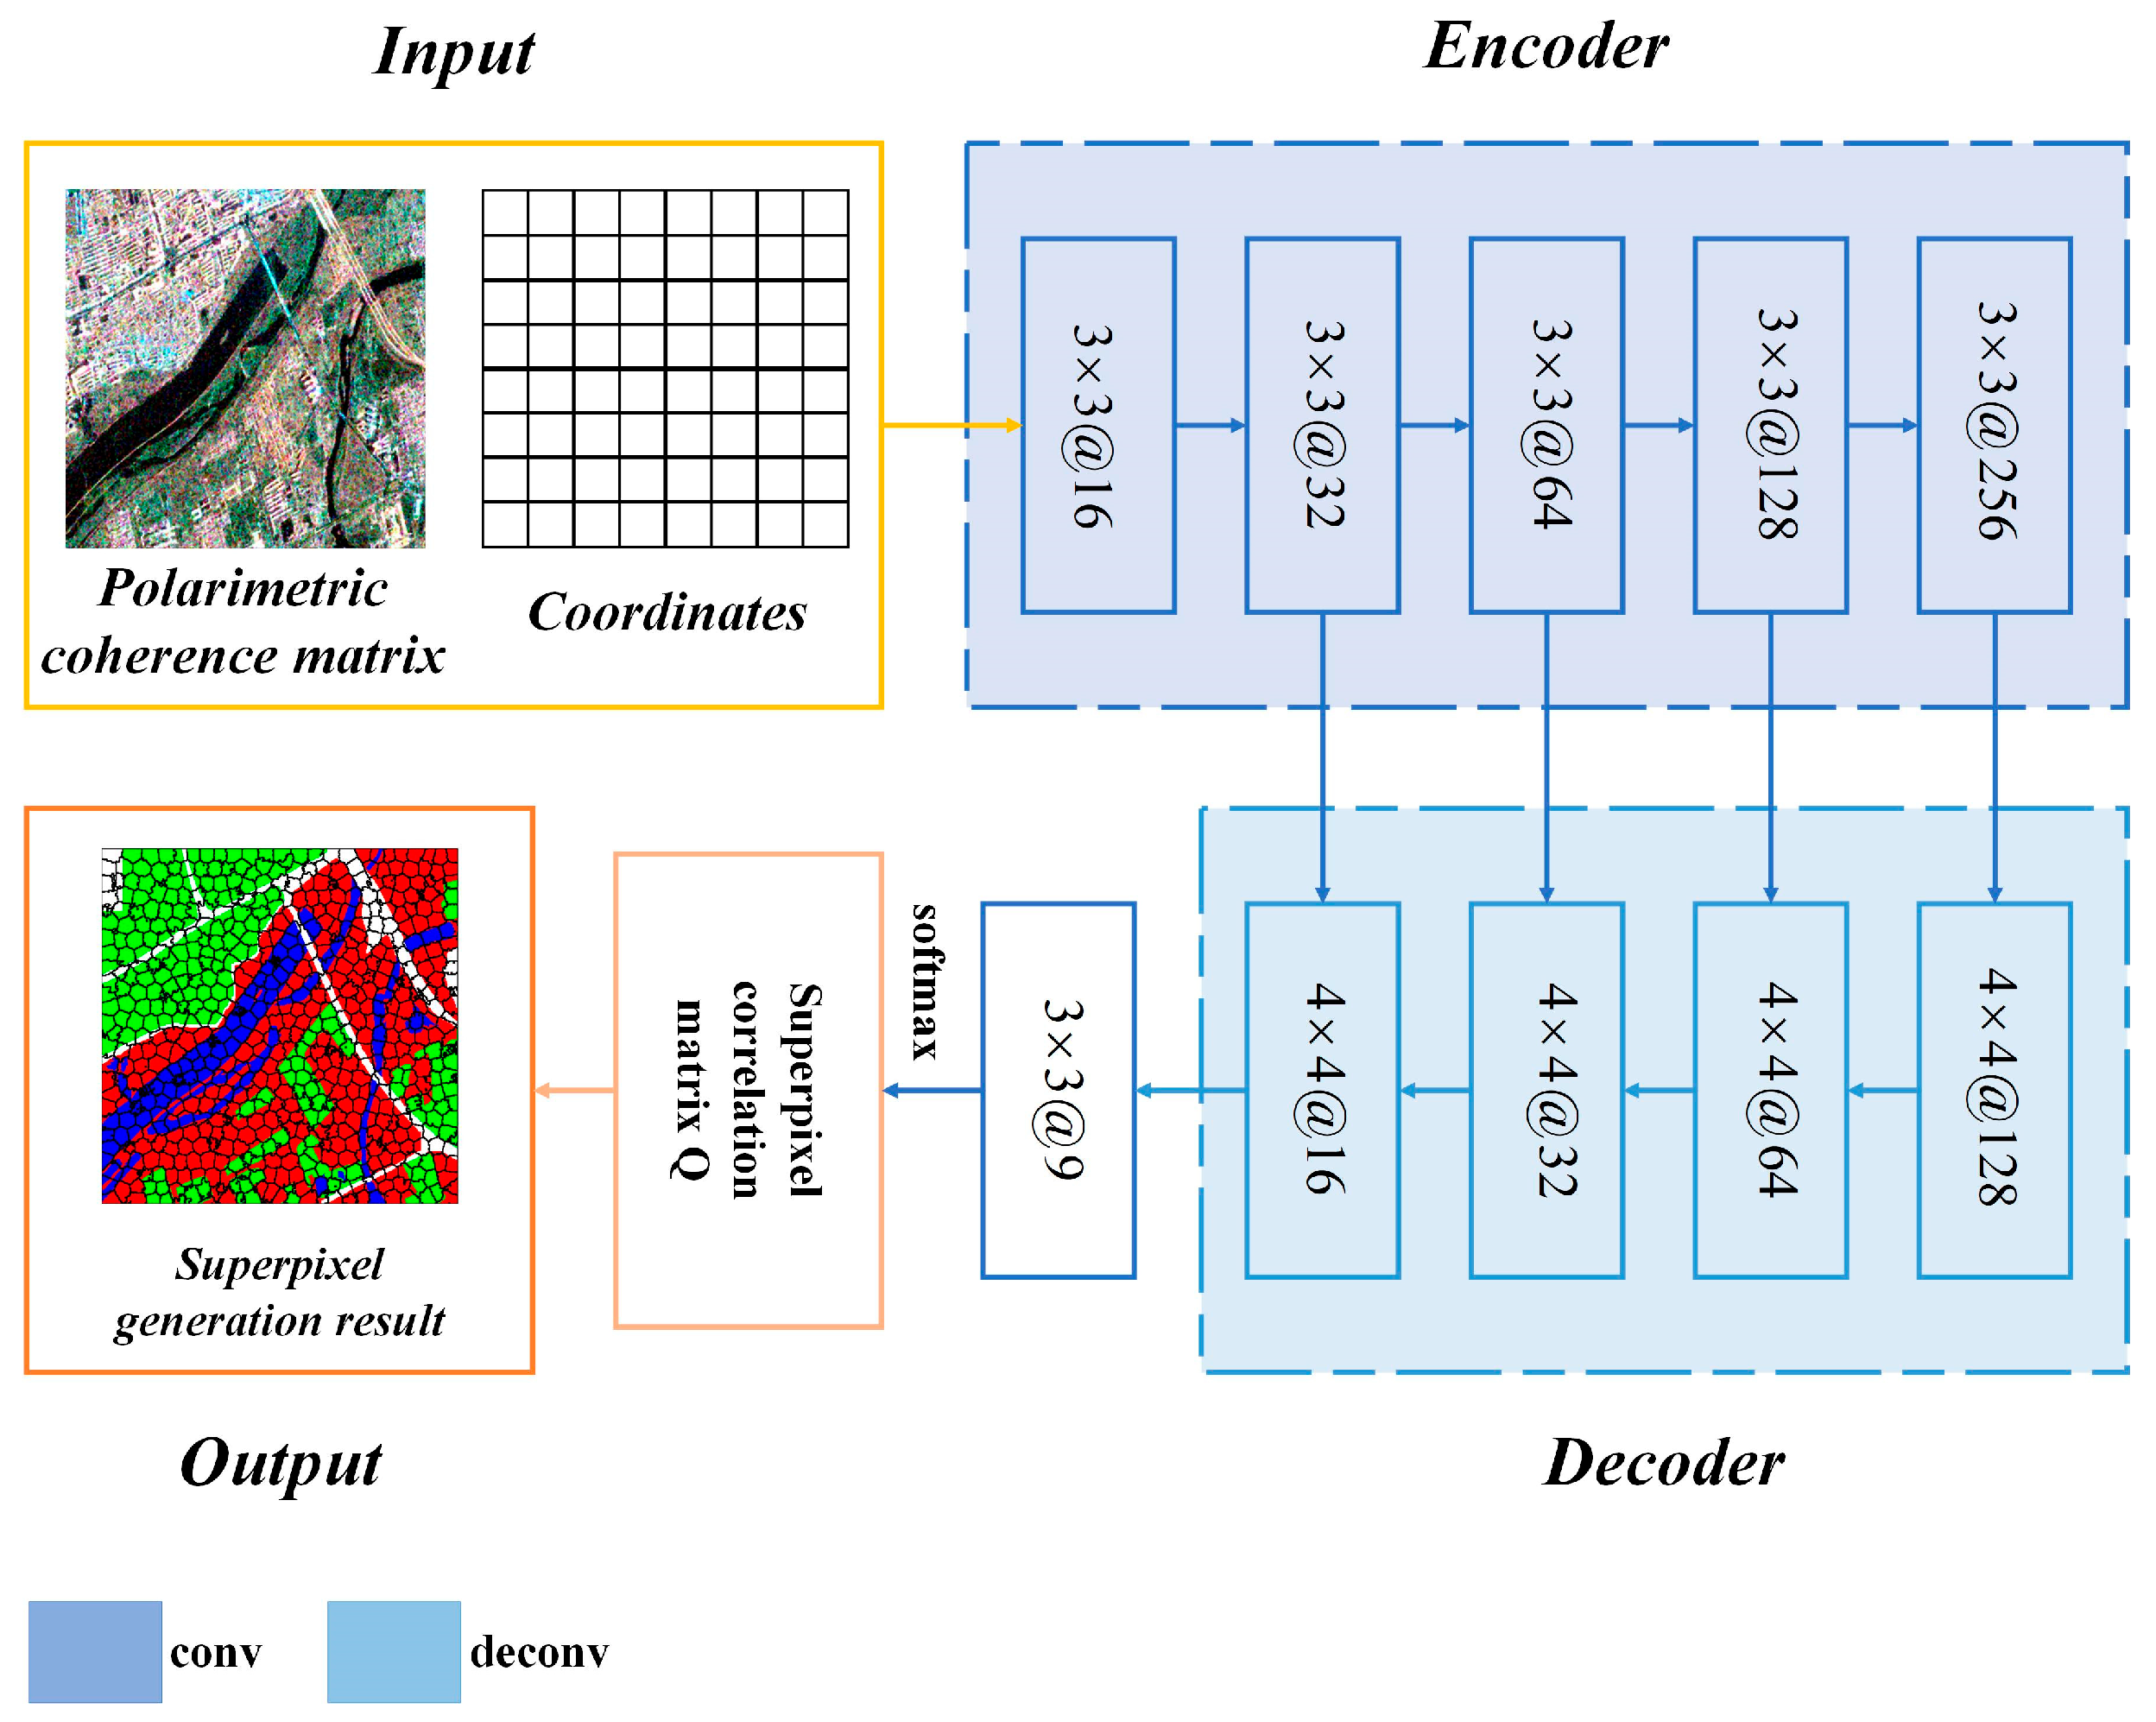
Figure 3 shows the network structure of the superpixel generation network in PolSAR-SFCGN. As shown in Figure 3, we use a standard encoder–decoder with skip connections to predict superpixel association Q . The encoder takes the polarimetric features of PolSAR images based on the polarimetric coherence matrix and associate it with the position information of each pixel as the input. The polarimetric coherence matrix T can be obtained by vectorizing the Sinclair matrix S c using the Pauli basis matrix [53], where the polarimetric measurement vector k can be calculated by
k = 1 2 [ S c H H + S c V V , S c V V S c H H , S c H V + S c V H , i ( S c H V S c V H ) ] , w h e r e S c = S c H H S c H V S c V H S c V V
The polarimetric coherence matrix can be calculated by T = k × k + , where + represents the conjugate transposition. Besides the polarization features of the pixels, the position information of the pixels in PolSAR images is also used to generate superpixels, which aims to clarify the spatial relationships between the pixels and assist in the boundary positioning. Then, the feature vector of each pixel can be represented as follows:
t p = [ T 11 , T 22 , T 33 , Re [ T 12 ] , Im [ T 12 ] , Re [ T 13 ] , Im [ T 13 ] , Re [ T 23 ] , Im [ T 23 ] , r o w , c o l ]
where T i j are the elements in the polarimetric coherence matrix T and i , j = 1 , 2 , 3 . Re [ ] and Im [ ] represent the real and imaginary parts, respectively. r o w and c o l denote the positional coordinate of each pixel.
In the superpixel generation network, the encoder for PolSAR image feature extraction consists of five convolutional layers with the kernel size of three and the channel numbers of 16, 32, 64, 128, and 256, respectively. During the convolution process, the input of the convolutional layer is appropriately filled according to the size of feature map. In the decoder, the feature map is gradually upsampled through four deconvolution layers and correlated with the output features of previous corresponding convolutional layers to obtain final superpixel prediction. Leaky ReLU is used for all layers except the prediction layer, and the superpixel correlation matrix Q is ultimately generated through softmax. With the above encoder–decoder network, PolSAR-SFCGN can achieve an end-to-end superpixel generation for PolSAR images. It combines feature extraction and superpixel generation into one step and needs no clustering procedure to calculate the soft association matrix Q . PolSAR-SFCGN not only obtains excellent PolSAR superpixels by deep polarization features but also improves the efficiency of the deep learning-based superpixel generation.

3.4. Loss Function of PolSAR-SFCGN

Assuming f ( p ) is the polarization feature corresponding to a given pixel p in PolSAR-SFCGN, p = [ r o w , c o l ] T represents the position of pixel p , and the feature vector is t p = [ f ( p ) , r o w , c o l ] . After obtaining the superpixel correlation Q , we can compute the center c s = ( u s , l s ) of any superpixel s , where u s is the feature vector and l s is the position vector. The detailed calculations of u s and l s can be given by
u s = p : s N P f ( p ) q s ( p ) / p : s N P q s ( p )
l s = p : s N p p q s ( p ) / p : s N P q s ( p )
where N p is the set of the surrounding superpixels for pixel p and q s ( p ) is the network predicted probability of pixel p being associated with the superpixel S . In Equation (5), each sum is taken over all the pixels with a possibility to be assigned to the superpixel S . Then, the reconstructed features f ( p ) and positions p of any pixel p can be calculated by
f ( p ) = s N p u s q s ( p ) , p = s N p l s q s ( p )
Then, the loss function of PolSAR-SFCGN can be calculated by the summation of two terms. The first item encourages the trained model to group pixels with similar attributes of ground objects, while the second item enforces the spatial compactness of superpixels. In this work, we select the one-hot encoding vector of ground truth labels and use cross-entropy E ( , ) as the distance measure mentioned in Equation (1), and the loss function is calculated by
L ( Q ) = p E ( f ( p ) , f ( p ) ) + l m Δ S | | p p | | 2
Δ S is the superpixel sampling interval related to the initial regular grid size. l m is a weight set as 5 × 10 5 .
By optimizing the above loss function, PolSAR-SFCGN prefers to obtain the regular superpixels in the homogeneous regions with a single type of ground object and fit the real boundaries better around the boundaries of different types of ground objects. It considers the maintaining of boundary details and the compactness of superpixel simultaneously in the generation of superpxiels.

3.5. PolSAR Image Classification via PolSAR-SFCGN

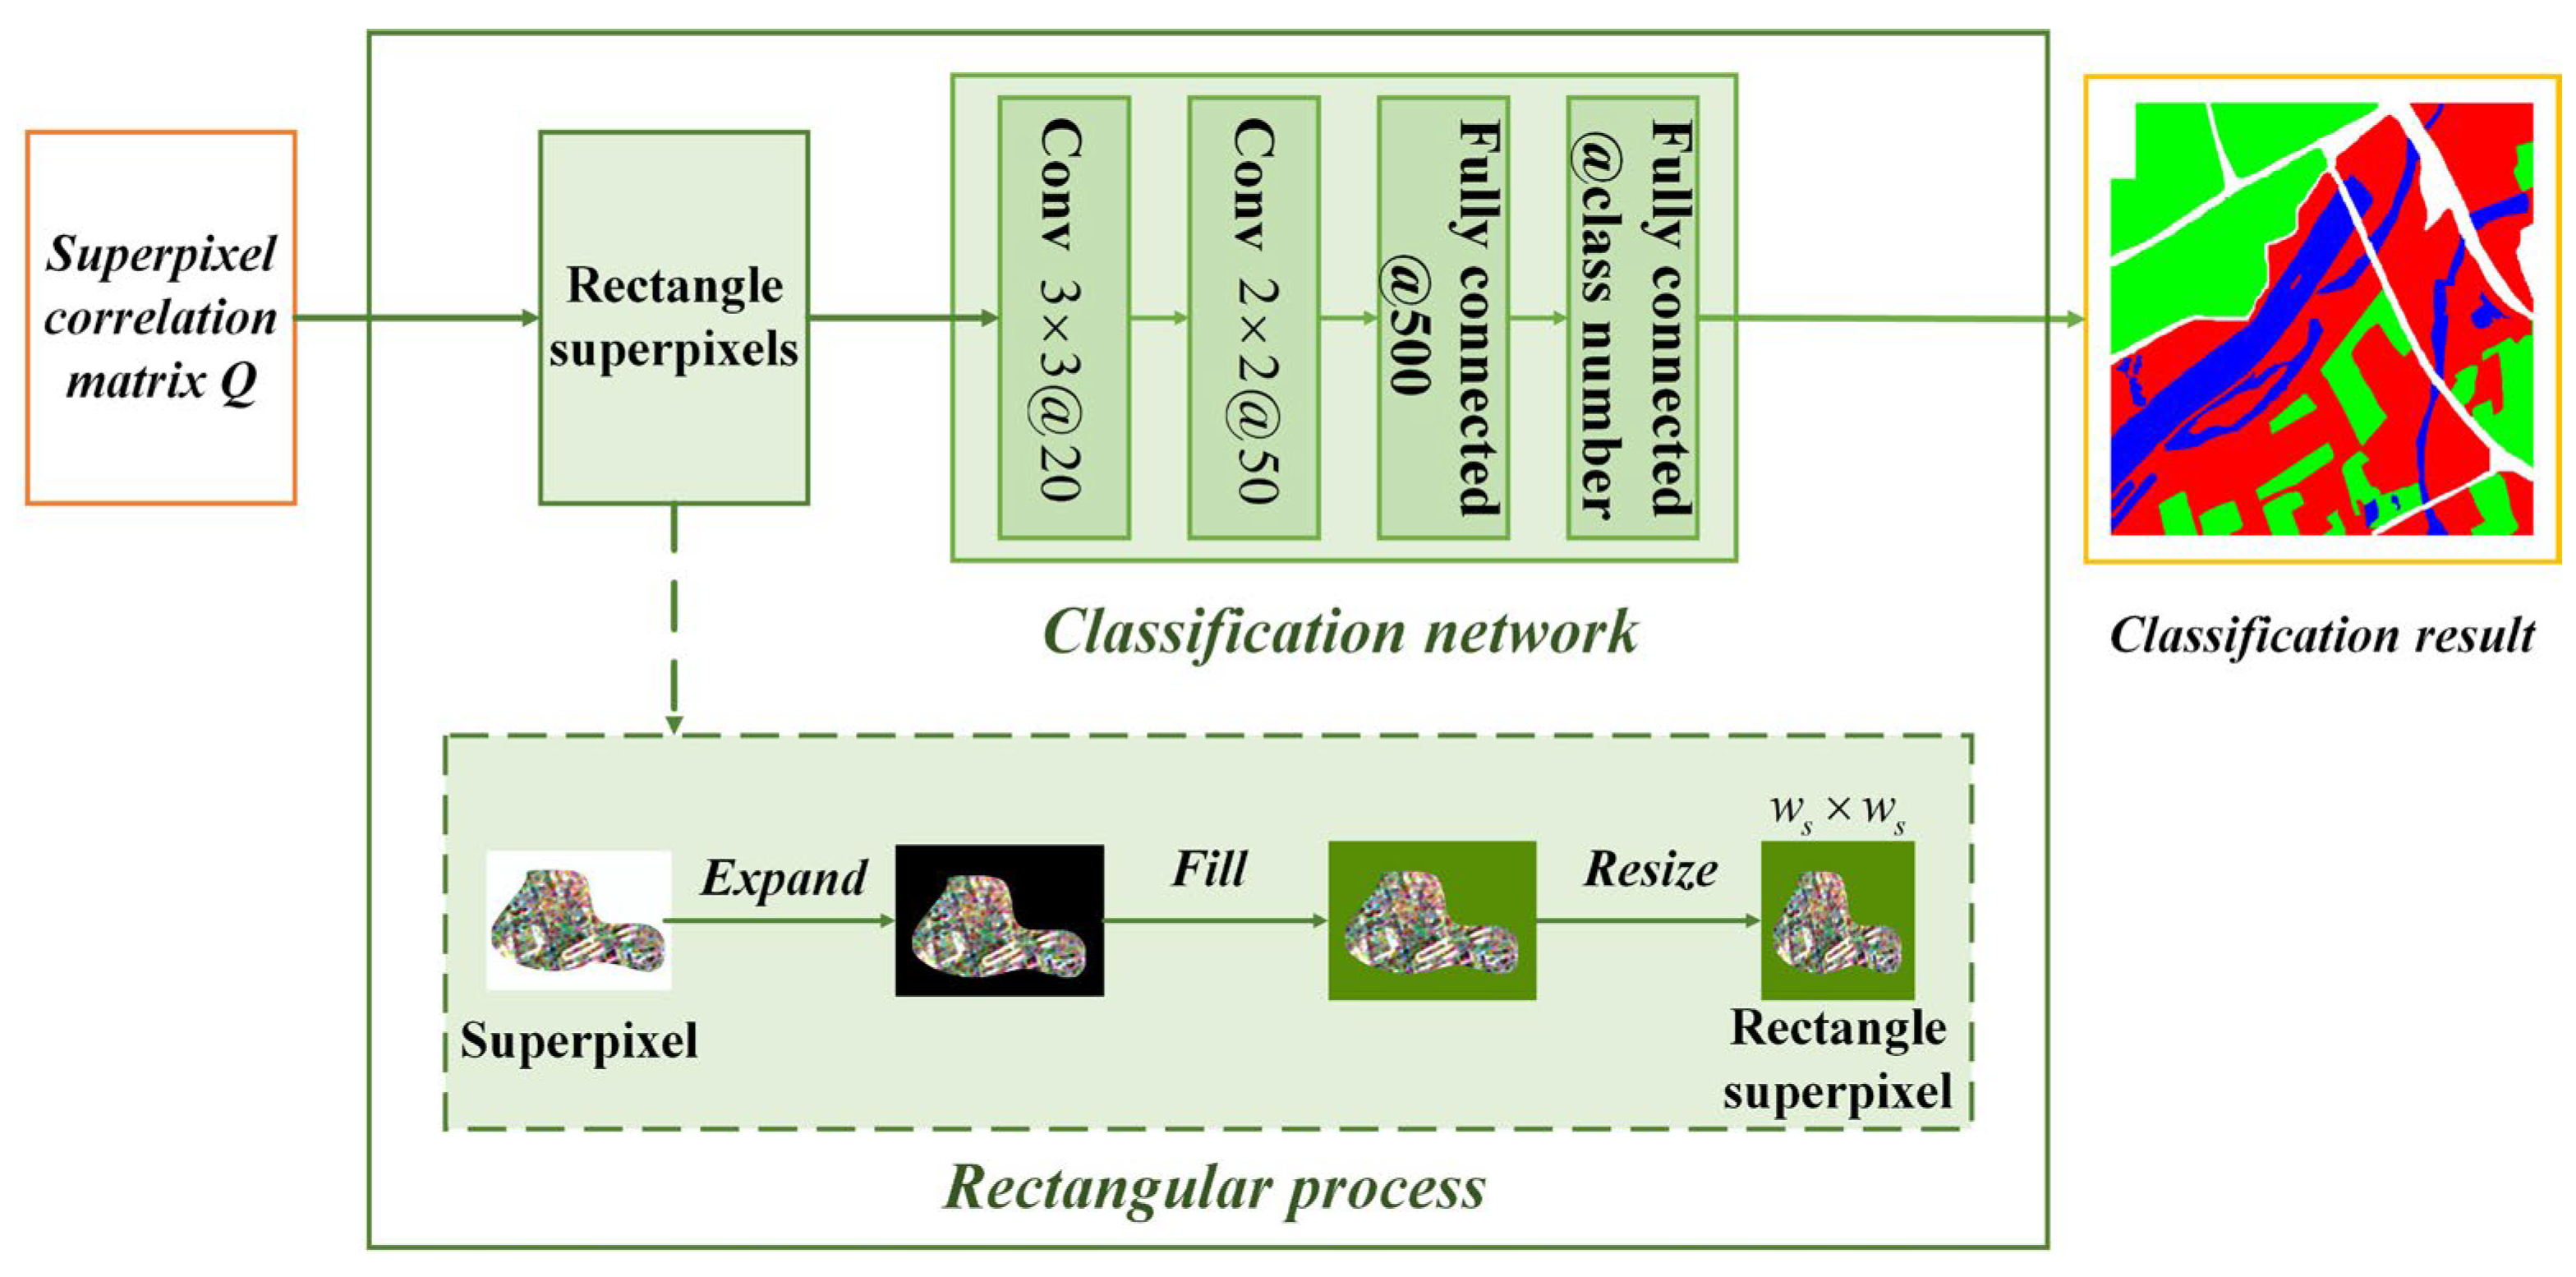
Figure 4 shows the subsequence procedures of the rectangular process and the classification network with the superpixels generated by PolSAR-SFCGN. Here, we just use a very simple and classical convolutional network in PolSAR-CNN [54] as the classification network. The classification networks can be replaced by other complex and effective architectures according to the practical requirements.
The classification network consists of two convolutional layers and two fully connected layers. The convolutional kernel sizes are 3 × 3 and 2 × 2 , respectively. The number of channels is 20 and 50, respectively. After each convolutional layer, a layer of max pooling is added. We use a rectangle algorithm to convert the irregular superpixel blocks into rectangular inputs of adjustable sizes [6]. As shown in Figure 4, for each irregular superpixel, the average value of the features in the superpixel is computed first. Then, the superpixel is expanded to a rectangular shape, and the average value is used to fill the empty areas. Finally, the expanded superpixel is input to the classification network, which is resized to the shape of d p × w s × w s . Here, d p is the feature dimension and w s is the size of the rectangle superpixel.

4. Experimental Studies

4.1. Experimental Settings

(1)
PolSAR image datasets
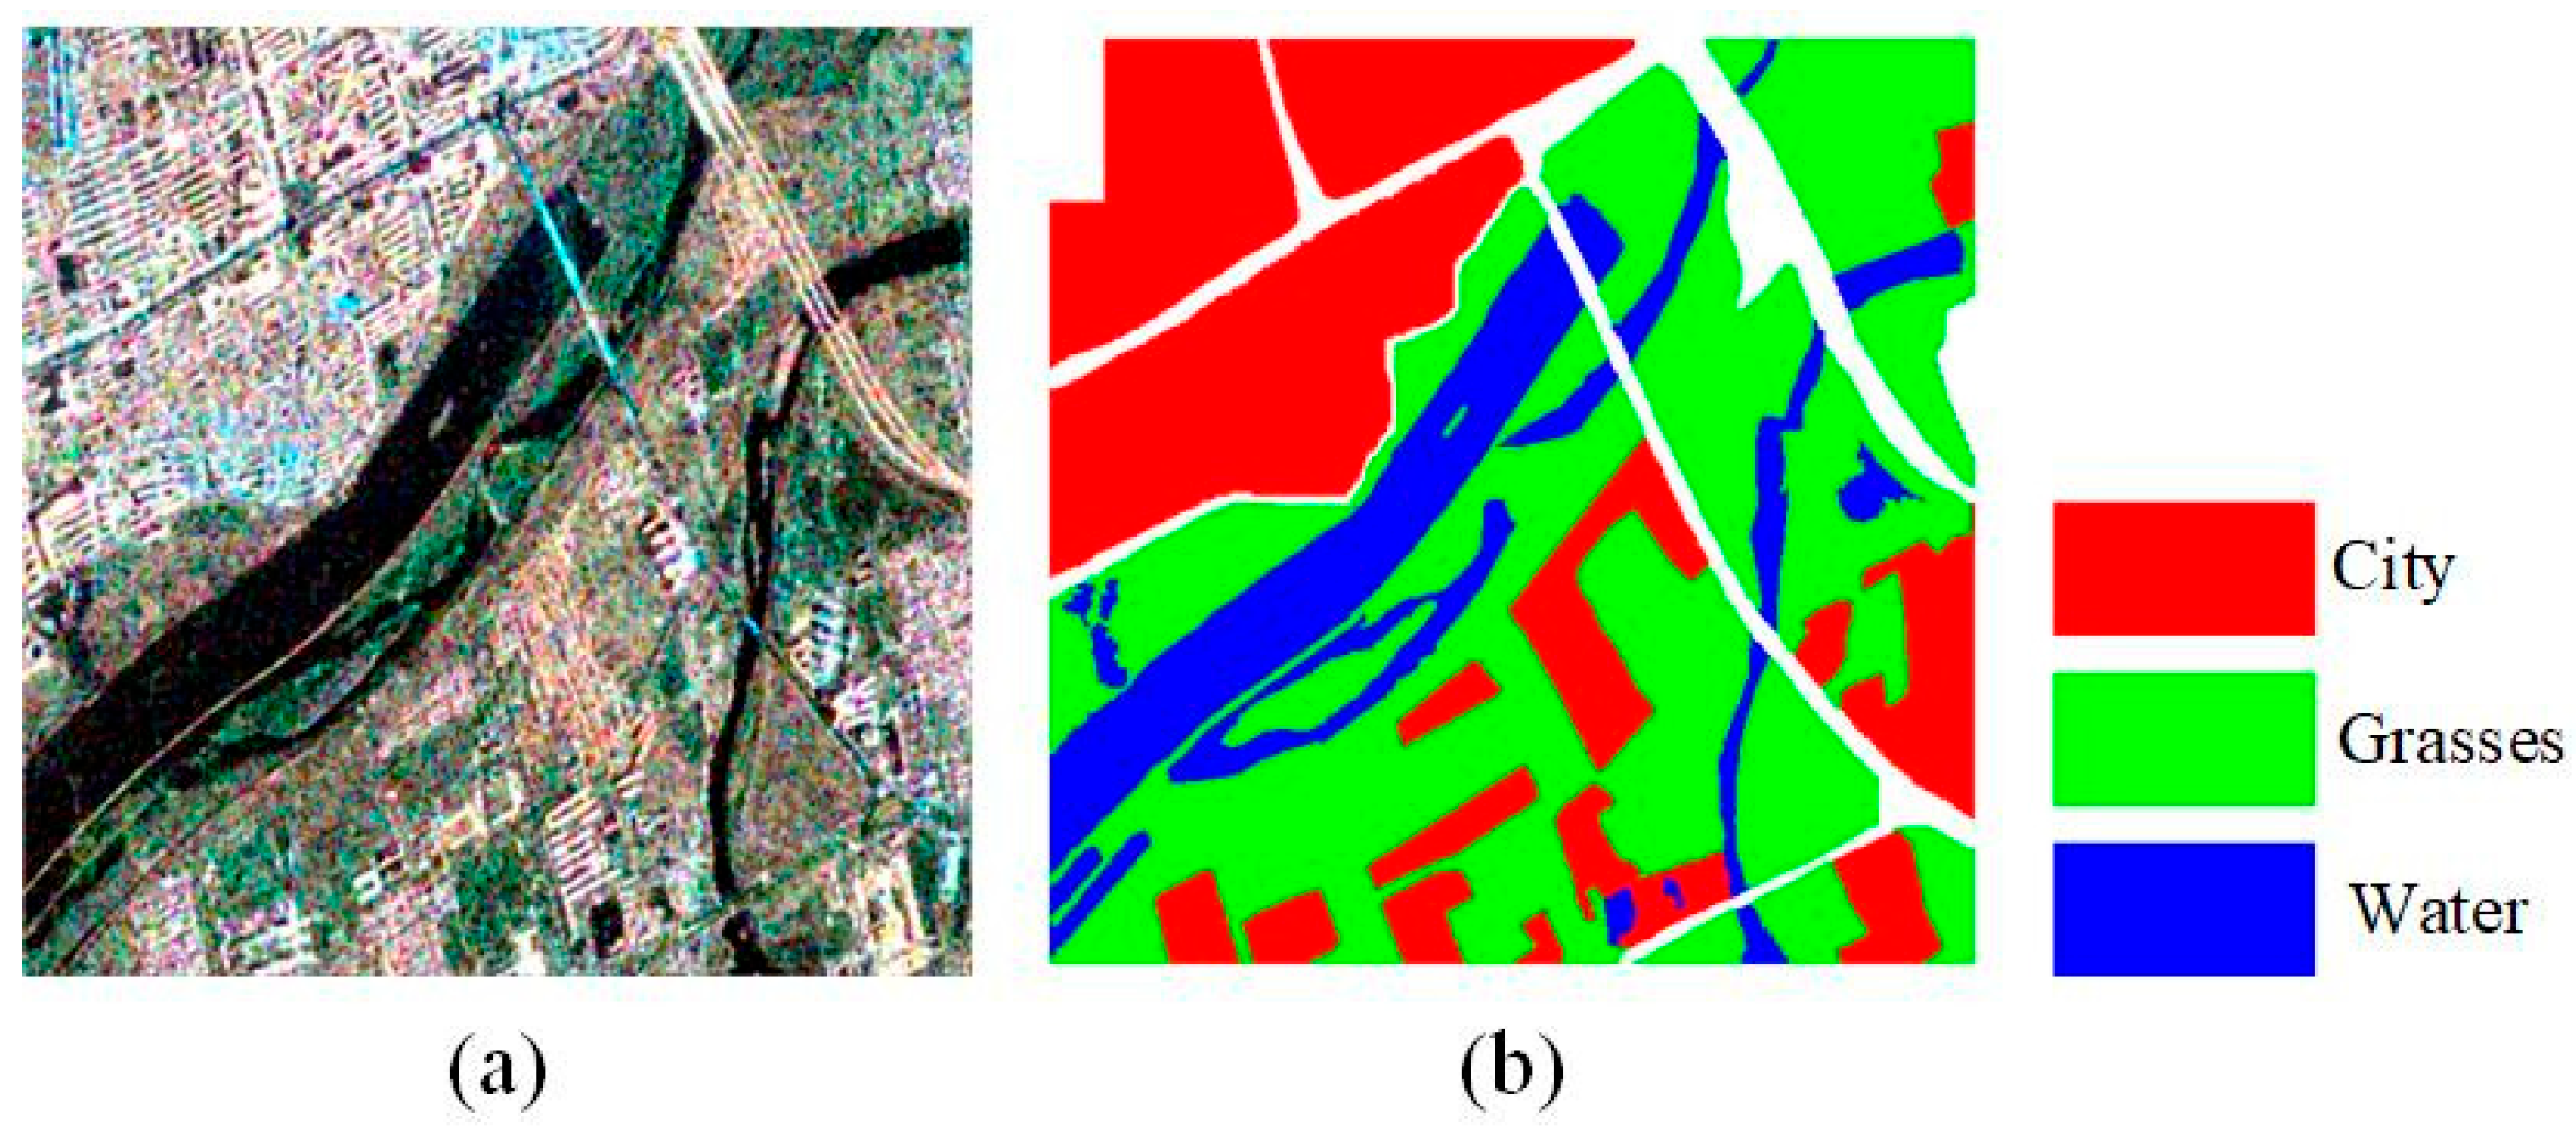
We use the San Francisco dataset, the Oberpfaffenhofen dataset, and the Xi’an dataset to validate the performance of PolSAR-SFCGN. Figure 5, Figure 6 and Figure 7 show the Pauli maps and the ground truth maps of three PolSAR datasets. The PolSAR image of the San Francisco dataset [55] was collected in the United States by the RADARSAT-2 in 2008, with a resolution of 10   m × 5   m and a C-band. The image size is 1895 × 1419 . It contains five types of ground objects, namely buildings, ocean, urban, vegetation, and bare soil. The total number of labeled samples is 1,886,740. The PolSAR image of the Oberpfaffenhofen dataset [56] was collected in Germany by the ESAR airborne platform in 1999, with a resolution of a 3   m × 3   m L-band. The image size is 1300 × 1200 . It contains three types of ground objects, namely build-up area, woodland, and open area. The total number of labeled samples is 1,385,269. The PolSAR image of the Xi’an dataset [57] was obtained in the Weihe River region of Xi’an by the RADARSAT-2, with a resolution of 8   m × 8   m and an image size of 512 × 512 . It contains three types of ground objects, namely Grass, City, And Water.
(2)
Metrics
In order to evaluate the performance of superpixel generation quantitatively, three classical superpixel segmentation evaluation metrics are used, which are Boundary Recall (BR), Undersegmentation Error (UE), and Compactness (CO), respectively. Let S = { S j } j = 1 K 1 and G = { G i } i = 1 K 2 be the partitions of the same image I : x n I ( x n ) , 1 n N , where S and G represent the superpixel segmentation result and the ground truth segmentation, respectively. BR is the most commonly used metric to asses boundary adherence given ground truth. Let F N G , S and T P G , S be the numbers of false negative and true positive boundary pixels in S with respect to G , respectively. The calculation of BR can be written as
B R ( G , S ) = T P ( G , S ) T P ( G , S ) + F N ( G , S )
Overall, the higher BR represents better boundary adherence with respect to the ground truth boundaries. In practice, a boundary pixel in S is matched to an arbitrary boundary pixel in G within a local neighborhood of size 2 r + 1 2 , with r being 0.0025 times the image diagonal rounded to the next integer.
UE measures the “leakage” of superpixels with respect to G , which also measures boundary adherence implicitly. Here, “leakage” refers to the overlap of superpixels with multiple, nearby ground truth segments. The calculation of UE can be written as
U E ( G , S ) = 1 | G | G i ( S j G i | S j | ) | G i | | G i |
where the inner term represents the “leakage” of superpixel S j with respect to G . The lower UE refers to less “leakage” with respect to the ground truth, which means the lower UE is better.
CO has been introduced to evaluate the compactness of superpixels, as follows:
C O ( G , S ) = 1 N S j | S j | 4 π A ( S j ) P ( S j )
CO compares the area A ( S j ) of each superpixel S j with the area of a circle with same perimeter P ( S j ) and the higher CO is better.
To evaluate achievable classification accuracy of superpixels and the performance of real subsequent classification quantitively, four classification metrics are utilized in the experiments. Besides the classification accuracies for each type of ground object, overall accuracy (OA), average accuracy (AA), and Kappa coefficient for whole classification result are observed, respectively.
(3)
Comparison approaches and parameter settings
In order to ensure the effectiveness and diversity of the comparison experiments, we select both the clustering-based methods and the graph-based methods, while the state-of-the-art deep learning-based approaches are also selected. Specifically, we use six popular superpixel segmentation algorithms as the comparison approaches: SLIC [12], PolSAR-SLIC [47], LSC [13], ERS [16], PolSAR-SSN [6], and SFCN [27]. SLIC and LSC are two classical clustering-based superpixel segmentation algorithms. PolSAR-SLIC is an improved SLIC algorithm for PolSAR images. ERS is a classical graph-based superpixel segmentation algorithm. SFCN is an impressive deep learning-based superpixel segmentation approach. PolSAR-SSN is an advanced deep learning-based superpixel segmentation for PolSAR image classification.
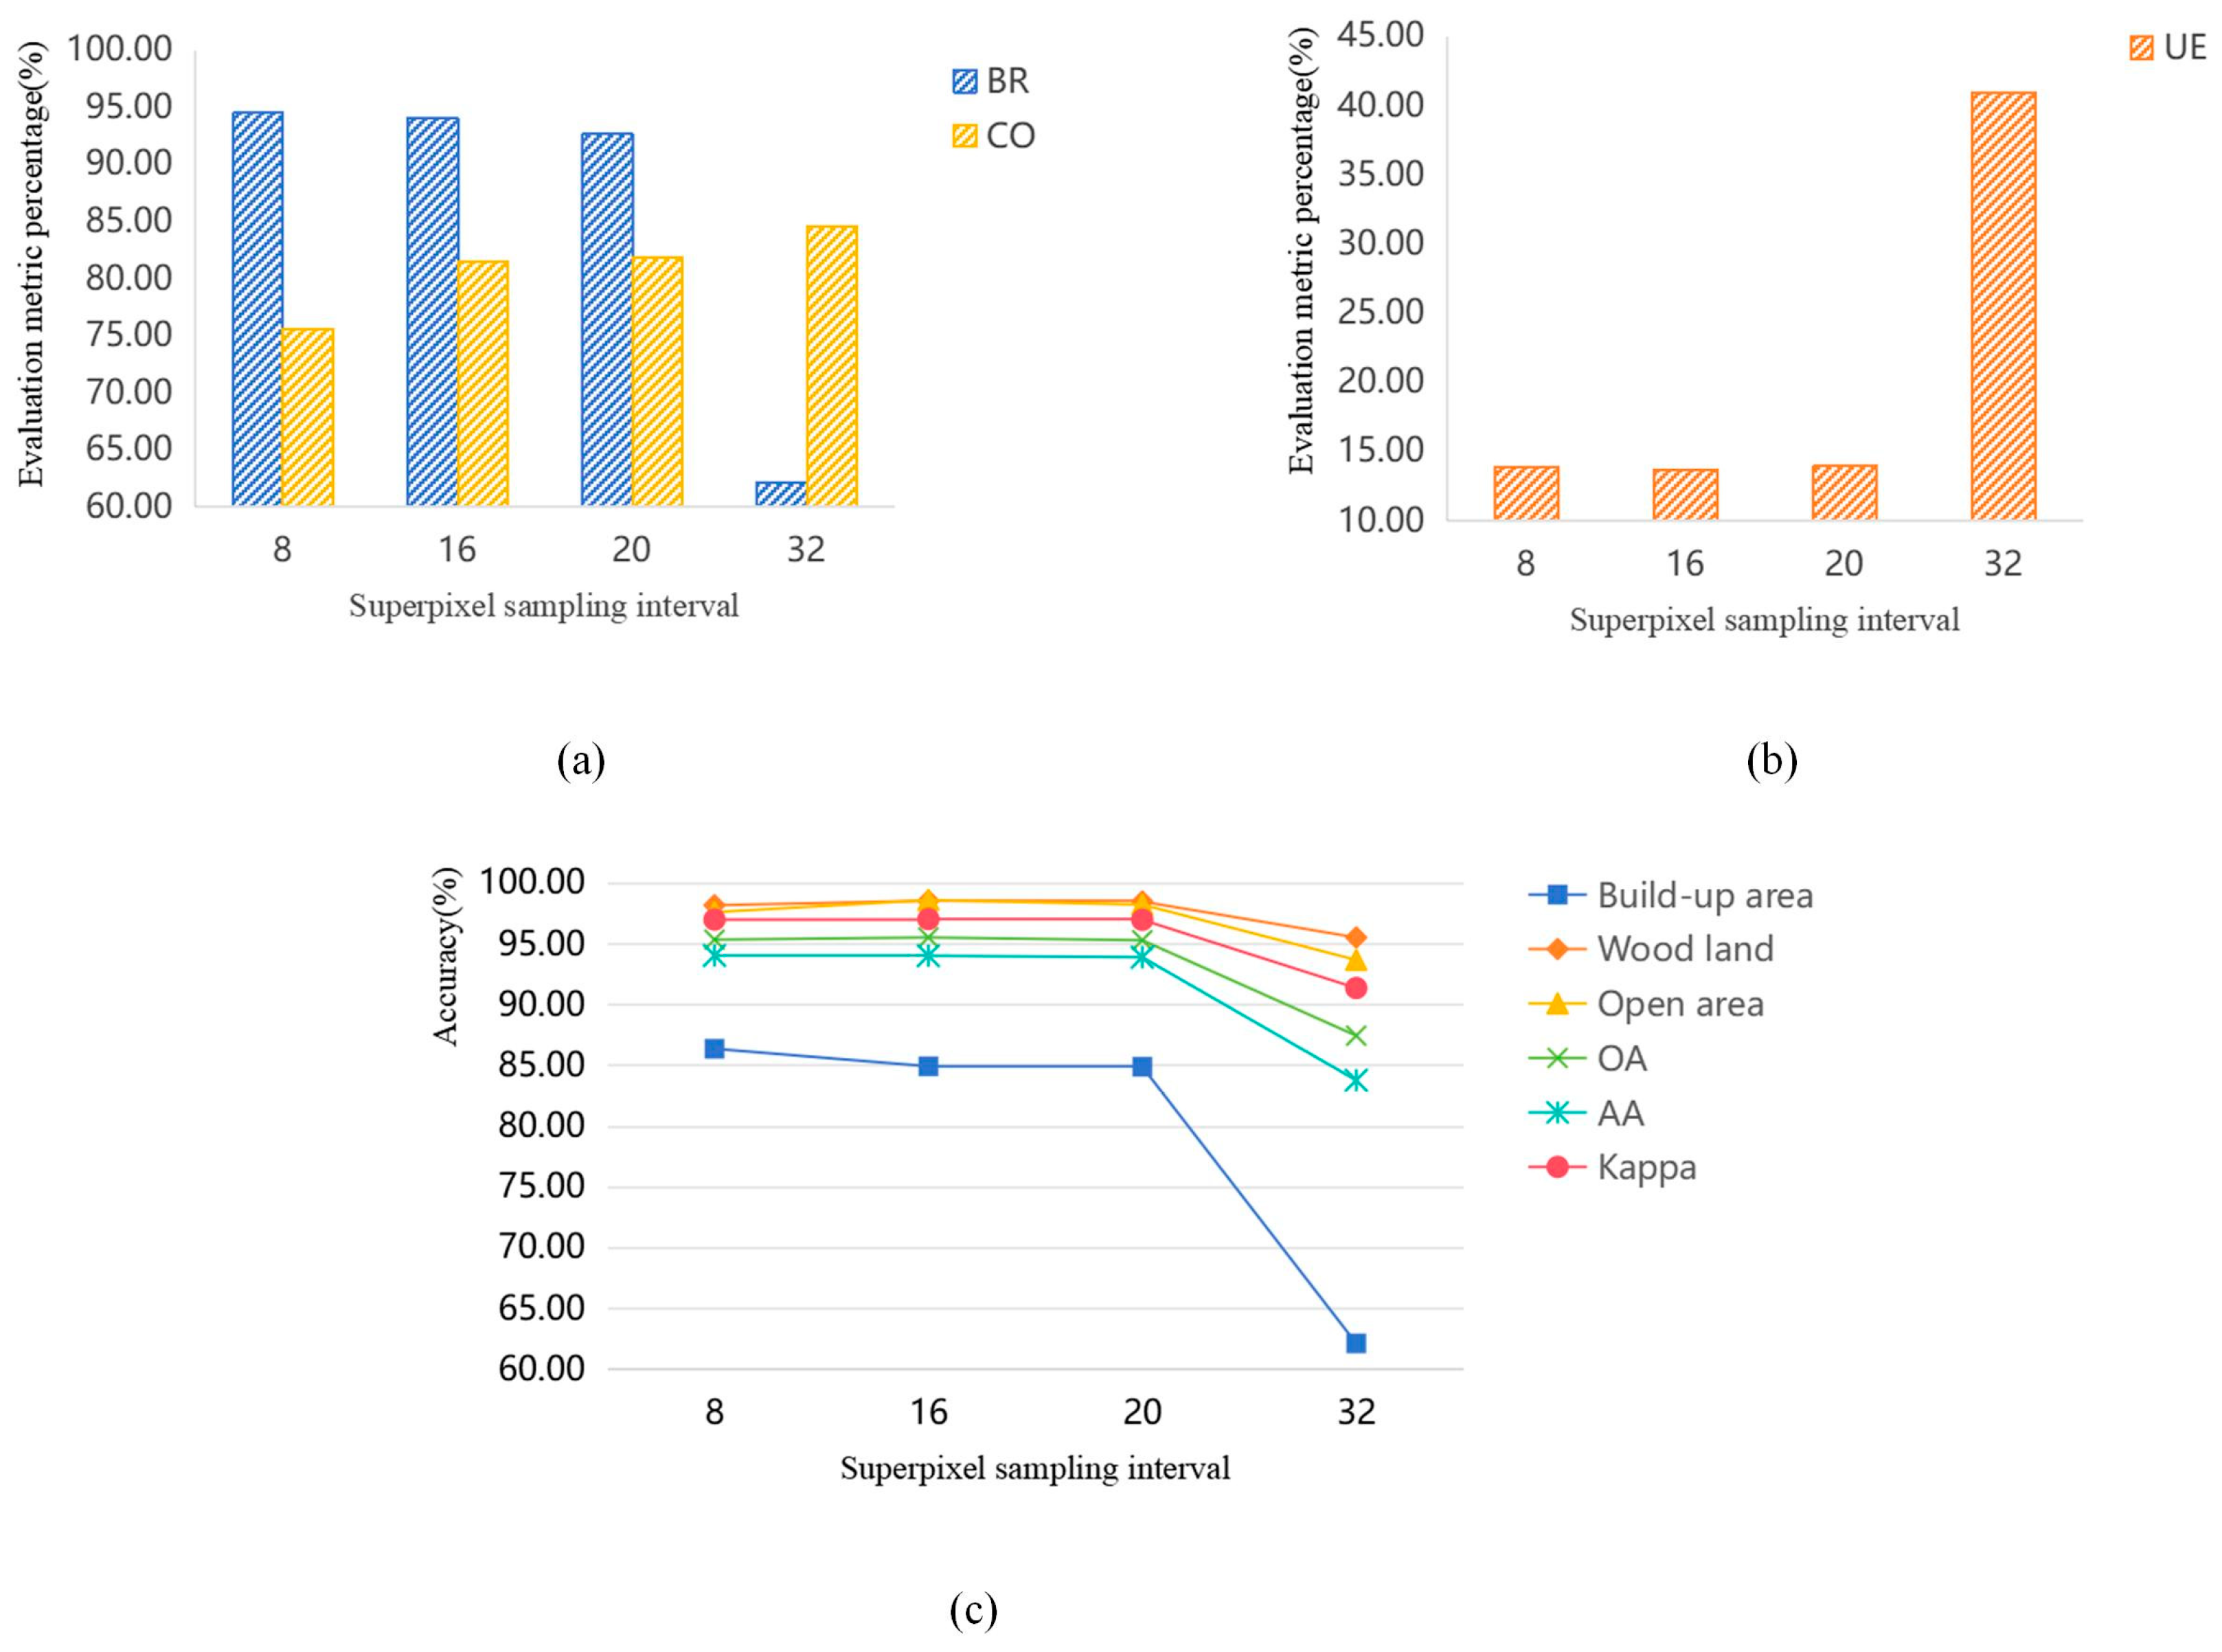
In the superpixel generation, the setting of the superpixel sampling interval affects the size of final superpixels, which also has an impact on the subsequent classification tasks. To illustrate the sensitivity of the superpixel sampling interval in PolSAR-SFCGN, we conduct the experiments on the Oberpfaffenhofen dataset with the superpixel sampling interval set as 8, 16, 20 and 32, respectively. The numerical superpixel segmentation results are shown in Figure 8. When the superpixel sampling interval is set to 8 and 16, the values of BR and UE are close. The values of CO are better when the superpixel sampling interval is set to 16 and 20, but the value of BR is a bit lower when the superpixel sampling interval is set to 20. The superpixel blocks are compacter when the superpixel sampling interval is set to 32 but its BR, UE, and the achievable classification metrics become worse. Obviously, PolSAR-SFCGN is not very sensitive when the superpixel sampling interval is set to no more than 20. Additionally, Figure 9 shows the visual superpixel generation results obtained by PolSAR-SFCGN with different values of superpixel sampling interval. Figure 10 presents the magnified images of the selected regions in the visual superpixel generation results.
When the superpixel sampling interval equals 8, the generated superpixels have a good ability for boundary fitting. However, the quantity of the superpixels is not a small number, which increases the computational cost of both superpixel generation and the subsequent classification task. When the superpixel sampling interval equals 16, the generated superpixels have regular rectangular shapes while maintaining good compactness and boundary fitting ability. As the superpixel blocks grow larger, despite an improvement in compactness, there is an increase in the misalignment between the superpixel blocks and the real boundaries. Meanwhile, the ability to fit complex boundaries decreases, and the situations where a single superpixel block contains more than one type of ground object begin to emerge. As shown in Figure 10, when the superpixel sampling interval equals 32, the generated superpixels have insufficient fitting performances on the complex boundaries, and a number of superpixel blocks contain several types of ground objects. Considering the performance and efficiency simultaneously, we set the superpixel sampling interval to 16 in PolSAR-SFCGN.
In the comparison experiments, considering the number of superpixels, the initial superpixel size Δ S × Δ S is set as 16 × 16 for all contestant algorithms. Unlike LSC and SLIC, the superpixel number of ERS is set based on initial superpixel size and image size, which are set to 10,000, 6000, and 1000 in the three datasets, respectively. In the training phase of PolSAR-SFCGN, the input images are randomly selected with the sizes of 640 × 640 , 640 × 640 and 320 × 320 on the San Francisco dataset, the Oberpfaffenhofen dataset, and the Xi’an dataset, respectively. The training iteration number of PolSAR-SFCGN is set to 10,000 with a learning rate of 1 × 10 4 , and the learning rate decays to 5 × 10 5 when the iteration number exceeds 5000. In the training phase of PolSAR-SSN, the input images are randomly selected with a size of 320 × 320 as inputs on all three datasets, which is consistent with the original settings in the paper of PolSAR-SSN [6]. The training iteration number of PolSAR-SSN is set to 10,000 with a learning rate of 1 × 10 4 . In the testing phase of PolSAR-SFCGN and PolSAR-SSN, the entire PolSAR images are used as the inputs.
In order to further observe and analyze the qualities of superpixels fairly, the simple classification network described in Section 3.5 is used to obtain the subsequent classification results for PolSAR-SFCGN and other superpixel generation approaches. In the classification experiments with the obtained superpixels, the input rectangular superpixel block size is set to 16 consistently with the superpixel sampling interval. For each type of ground object in the datasets, 30% of superpixels are sampled as the training set, and the other superpixels are used as the test samples. Additionally, we compare the classification results obtained by the above superpixel generation approaches with PolSAR-CNN [54], which is a pixel-based classification network for PolSAR images. In PolSAR-CNN, for each type of ground object in the datasets, 30% of pixels are sampled as the training set, and the other pixels are used as the test samples. For all these contestant approaches, we use the Adam optimizer with the cross-entropy loss function. The initial learning rate is 1 × 10 3 , and the training ends when the learning rate decays to 5 × 10 6 .

4.2. Analyses of Experiments on PolSAR Superpixel Generation

4.2.1. Superpixel Generation Results on the San Francisco Dataset

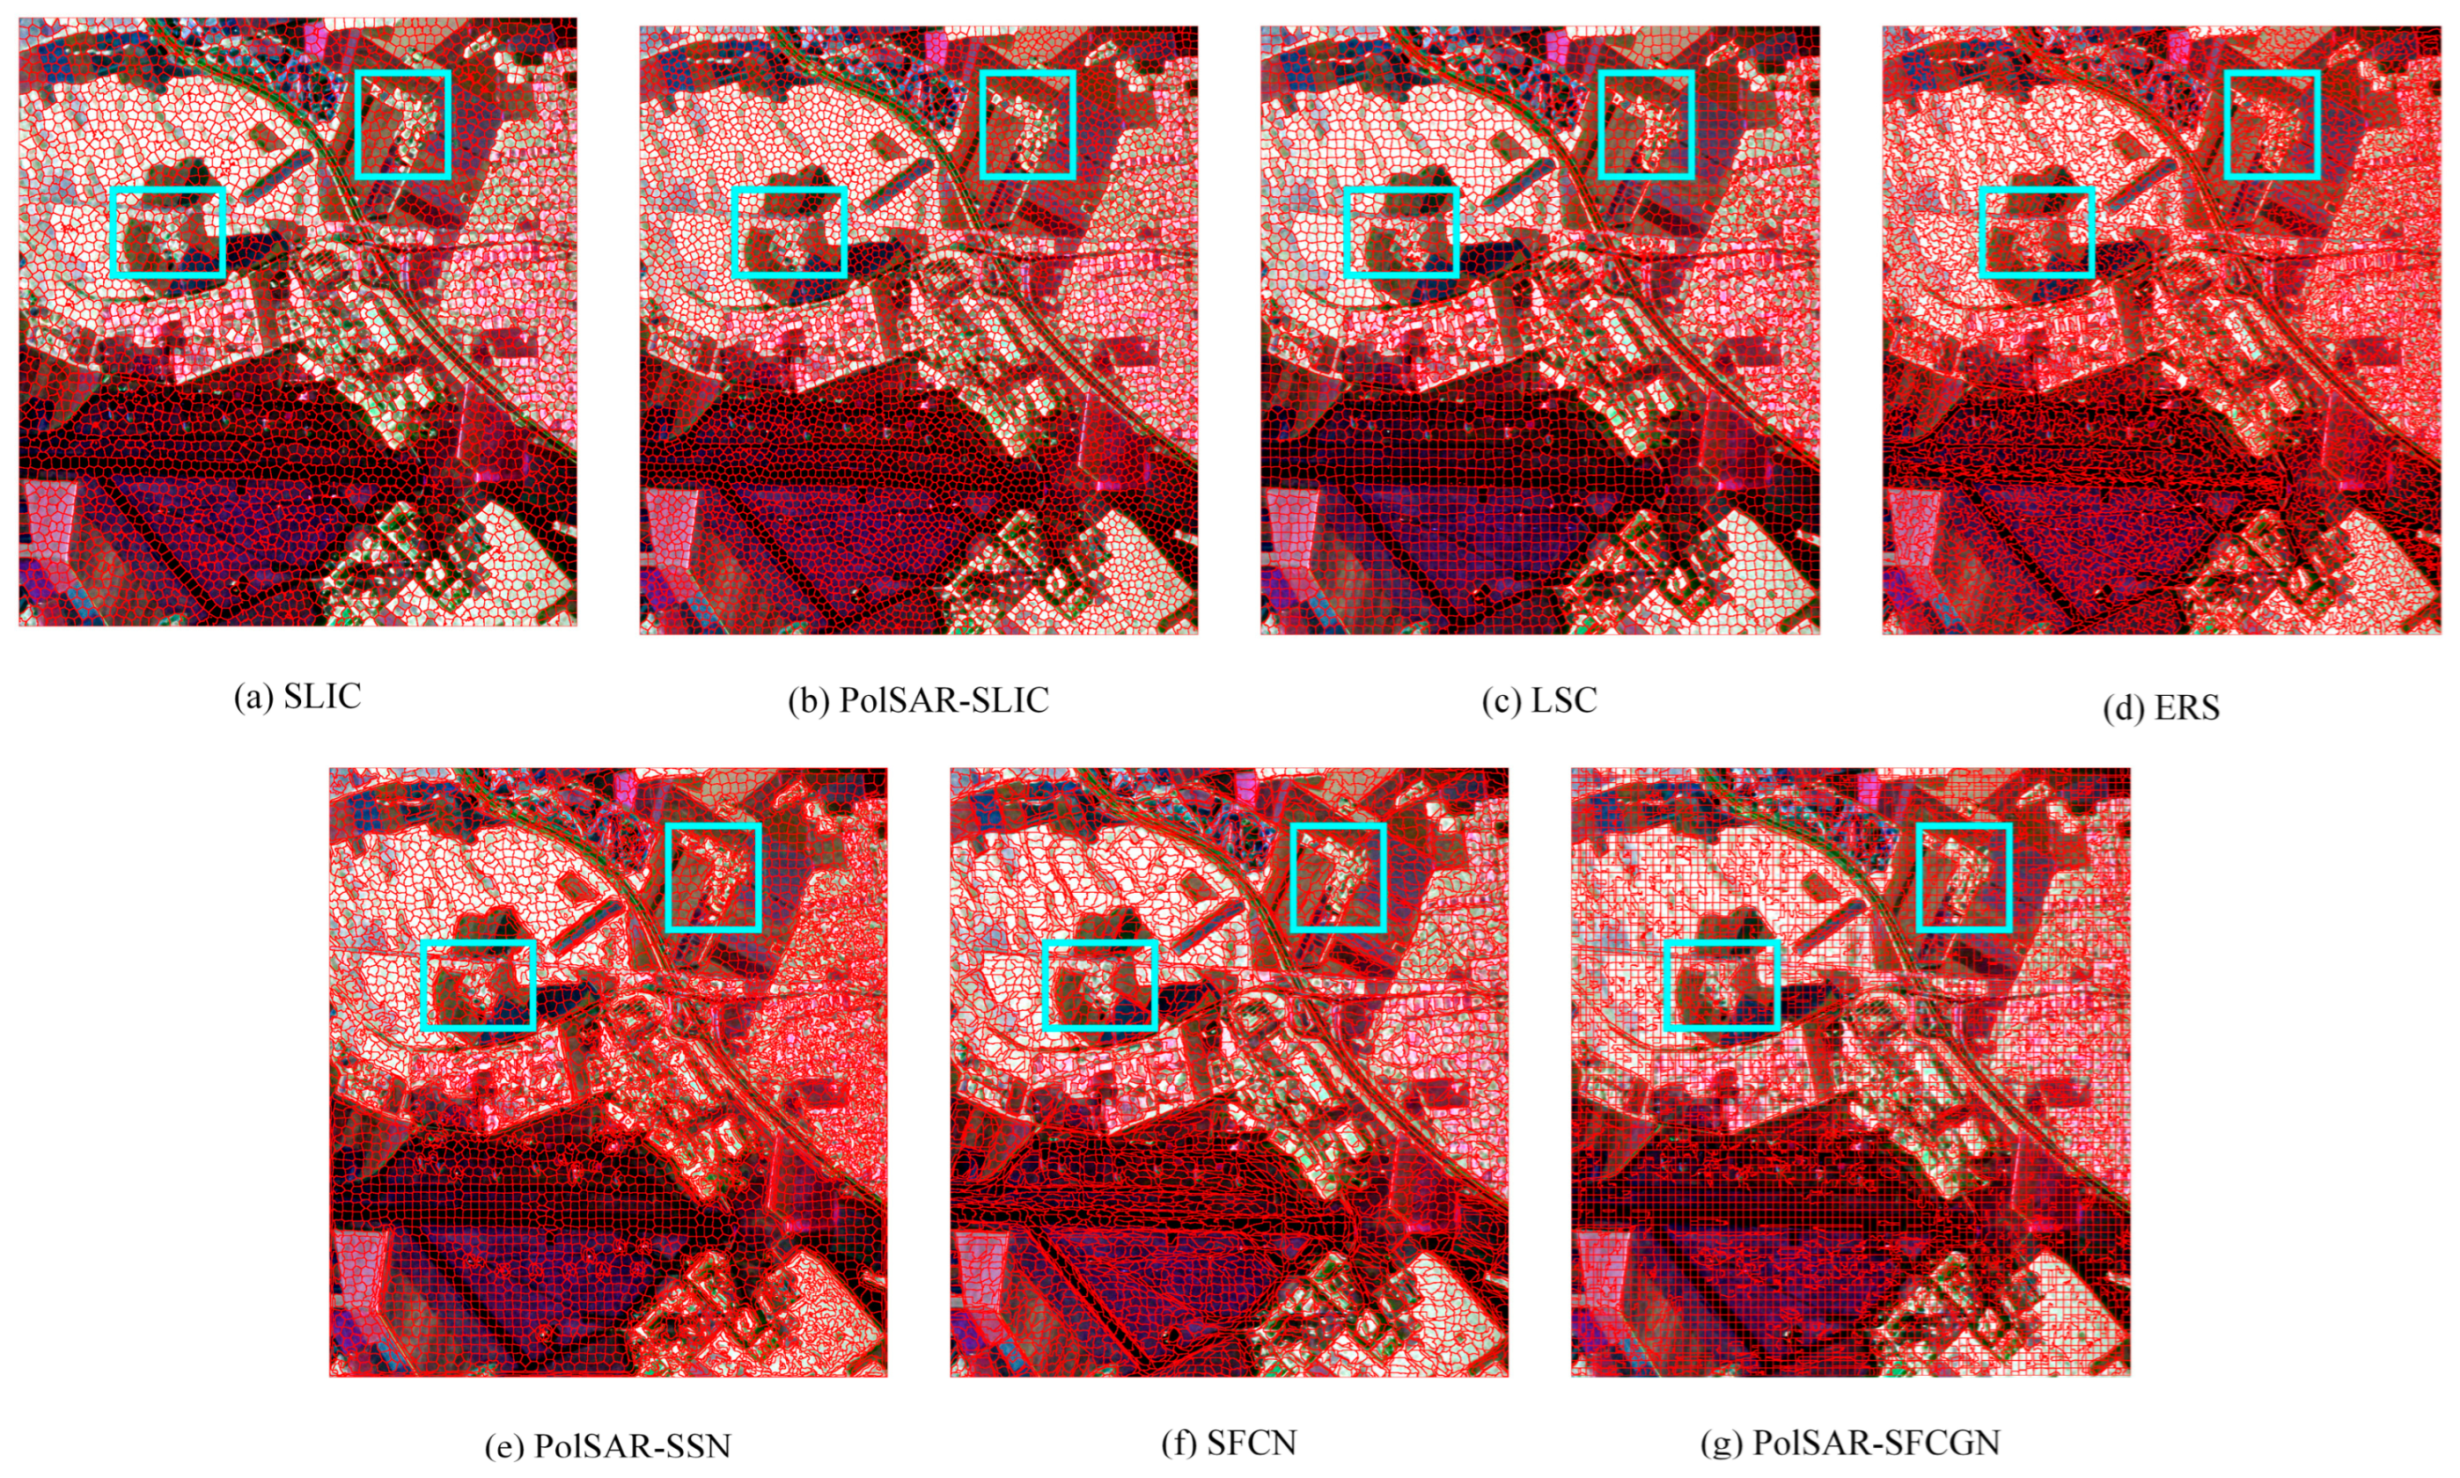
The numerical results of PolSAR-SFCGN and the comparison algorithms on the San Francisco dataset are shown in Table 2. The visual superpixel generation results and the enlarged images of several selected regions are shown in Figure 11 and Figure 12. As shown in Table 2, LSC and ERS have good BR and UE metrics but their CO metrics are very low. It verifies that the compactness of the superpixels obtained by these two methods is poor. SLIC and PolSAR-SLIC have high CO values but low BR and UE values, which indicates that the superpixels generated by SLIC and PolSAR-SLIC are mostly compact and even sacrifice fitting boundaries sometimes. The deep learning-based algorithms have stable and high-quality superpixel segmentation performances. Although their CO values are slightly inferior to SLIC, they can better fit the real boundaries of different types of ground objects. PolSAR-SFCGN has the best values of BR and UE, which indicates that PolSAR-SFCGN has obtained the superpixels that can better fit the real boundaries. The UE metric decreased by 17.8% compared with PolSAR-SSN, while it had a decrease of up to 26.49% compared with the traditional methods. In terms of the achievable classification accuracies, the deep learning-based methods have significant advantages. Compared with PolSAR-SSN, PolSAR-SFCGN achieves the best results in all classification metrics, where OA, AA, and Kappa are improved by 2.94%, 1.22%, and 1.66%, respectively. Compared with SFCN, PolSAR-SFCGN has significant improvements on all metrics, where the values of OA, AA, and Kappa are improved by 6.07%, 5.39%, and 7.70%, respectively. It further verifies the excellent boundary fitting ability of PolSAR-SFCGN.
As shown in Figure 11 and Figure 12, the segmentation results of three classical superpixel segmentation algorithms have varying degrees of small-sized irregular superpixel blocks. The superpixels obtained by LSC and ERS have especially irregular and non-compact shapes. The superpixels generated by SLIC, PolSAR-SLIC, PolSAR-SSN, and SFCN are relatively regular and compact, but their boundary fitting abilities are not good enough. The superpixels generated by PolSAR-SFCGN fit the real boundaries better, and most of the superpixel blocks only contain the pixels belonging to one type of ground object, which is consistent with its higher classification metrics in Table 2.

4.2.2. Superpixel Generation Results on the Oberpfaffenhofen Dataset

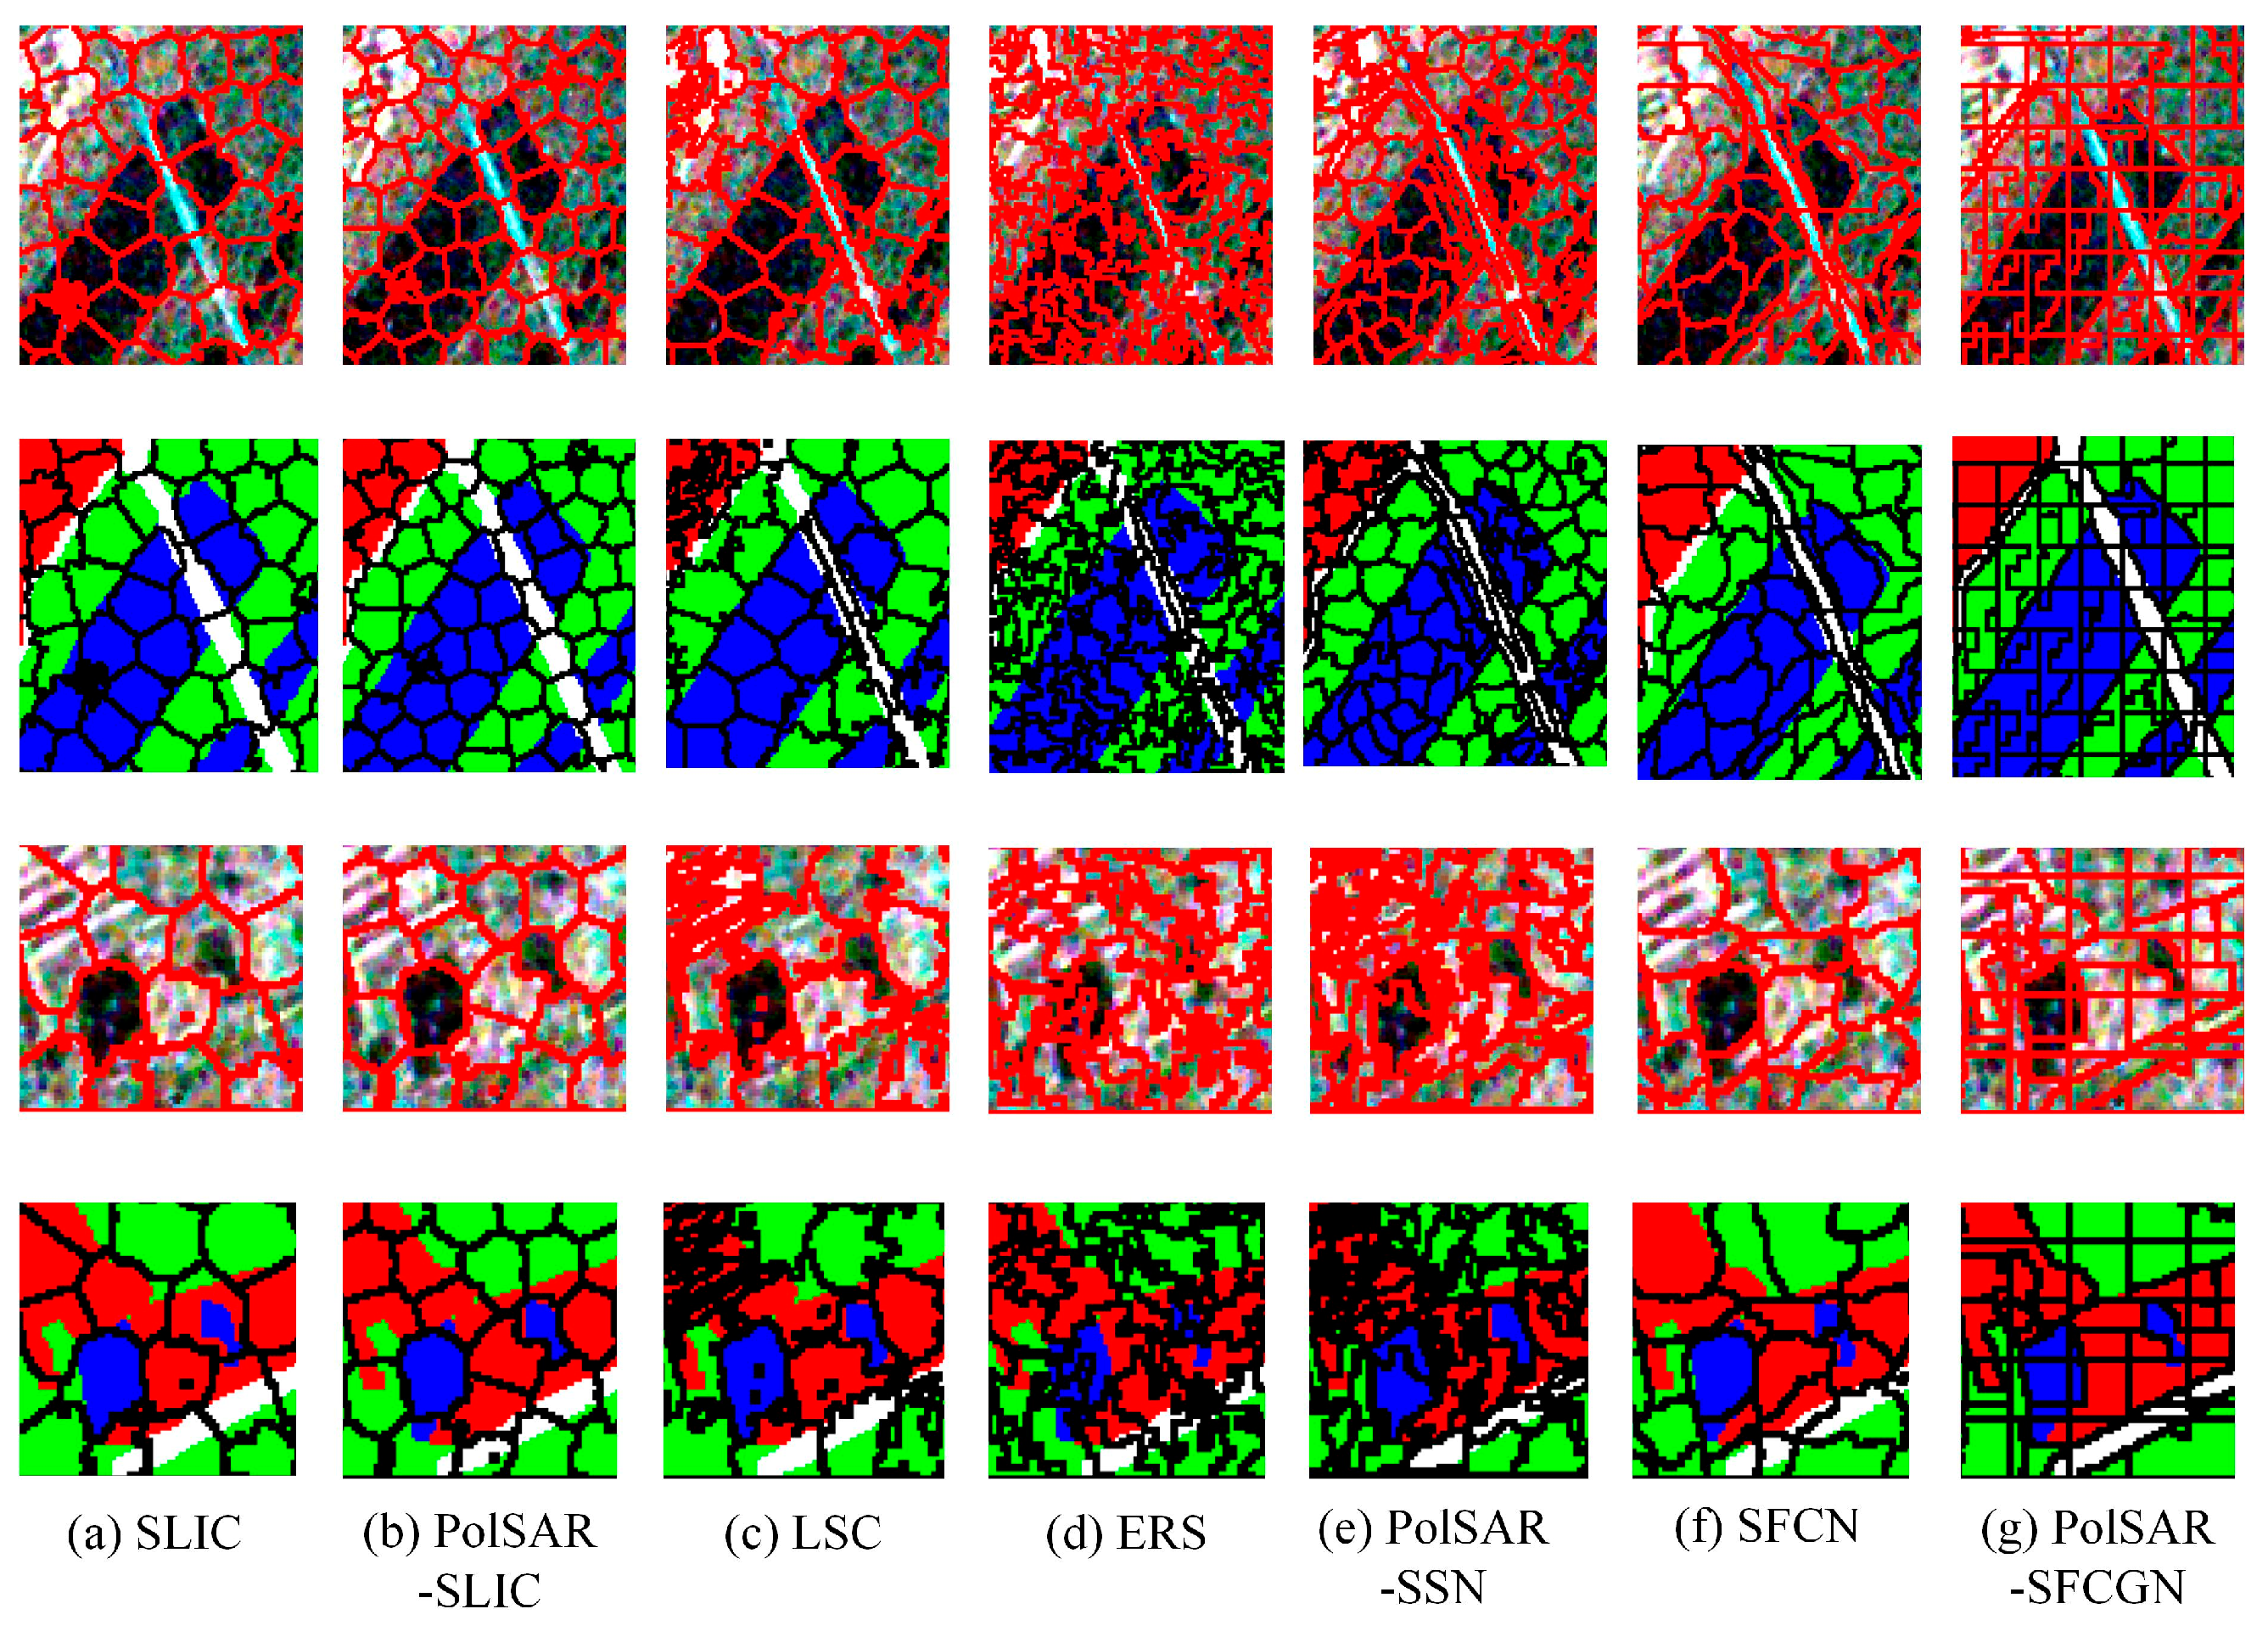
Table 3 gives the numerical results of PolSAR-SFCGN and the comparison algorithms on the Oberpfaffenhofen dataset. The visual superpixel segmentation results and the enlarged images of the selected regions are shown in Figure 13 and Figure 14. As given in Table 3, except for SLIC and PolSAR-SLIC, all other algorithms have nice BR and UE metrics. For the CO metrics, PolSAR-SLIC and PolSAR-SFCGN perform better than other approaches. PolSAR-SFCGN has the best BR and UE metrics. The UE value decreased by 3.05% compared with PolSAR-SSN, while it decreased by up to 10.94% compared to the traditional methods. Compared with SFCN, the values of BR and CO metrics of PolSAR-SFCGN increased by 13.41% and 24.45%, respectively, while the UE value decreased by 10.05%. In terms of achievable classification accuracies, PolSAR-SFCGN achieves the best results in all classification metrics, where OA, AA, and Kappa are improved by 2.94%, 1.22%, and 1.66%, respectively. It indicates that the superpixels of PolSAR-SFCGN possess the best boundary fitting capability with excellent compactness.
As shown in Figure 13 and Figure 14, the visual superpixel generation results on the Oberpfaffenhofen dataset are relatively regular and compact except for the build-up area region. LSC has the worst performance in the build-up area region. Compared with other comparison methods, PolSAR-SFCGN fits well with the real boundaries and has more regular superpixel blocks. In addition, most of the superpixel blocks of PolSAR-SFCGN contain pixels with only one type of ground object. It also implies significant improvements in achievable classification metrics of PolSAR-SFCGN.

4.2.3. Superpixel Generation Results on the Xi’an Dataset

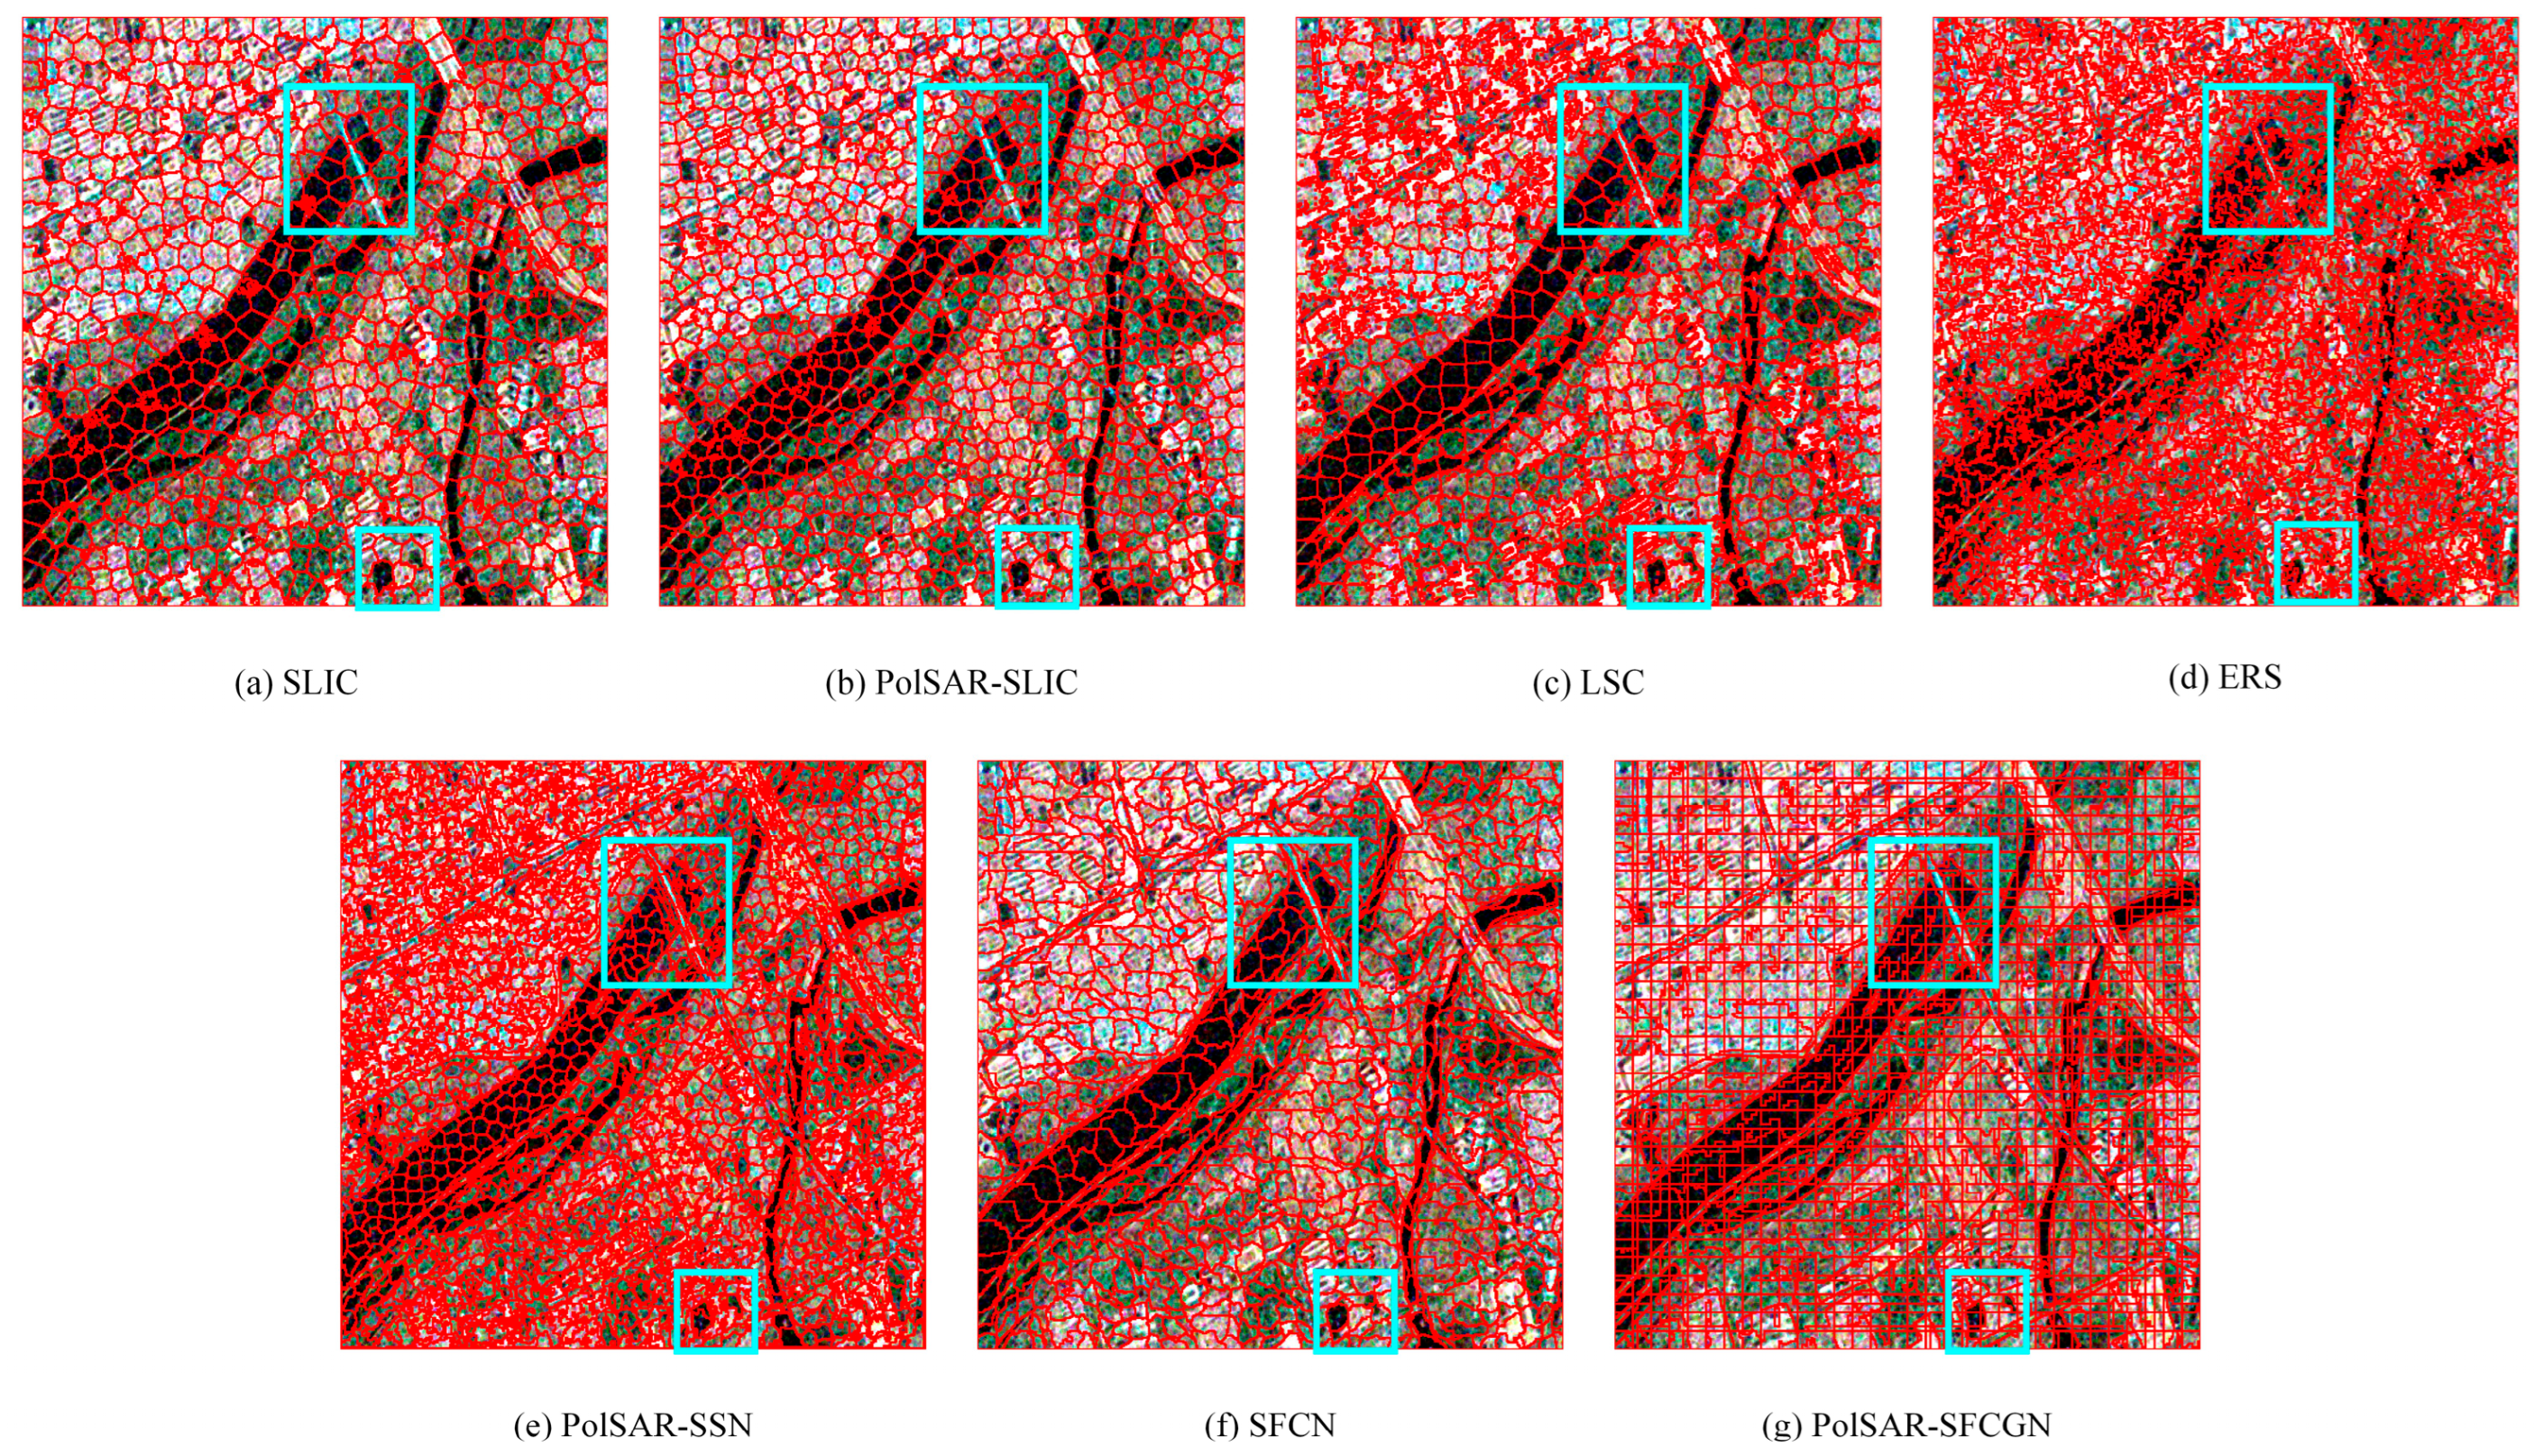
The numerical superpixel generation results on the Xi’an dataset are shown in Table 4. The visual superpixel segmentation results and enlarged images of selected regions are shown in Figure 15 and Figure 16.
In Table 4, compared with the traditional methods, the deep learning-based methods have more stable performances as well as better UE metrics and achievable classification accuracies. Meanwhile, PolSAR-SFCGN achieves the best results on all these metrics. Compared with PolSAR-SSN and SFCN, the BR values of PolSAR-SFCGN increase by 0.11% and 15.93%. Compared with PolSAR-SSN, the UE value of PolSAR-SFCGN decreases by 6.97%, which especially decreases by more than 33.78% when compared with other algorithms. Additionally, the CO metric of PolSAR-SFCGN is improved by 21.7% compared with the second-best algorithm. In terms of achievable classification metrics, PolSAR-SFCGN’s OA, AA, and Kappa values are improved by 0.98%, 1.59%, and 1.57%. The above analyses indicate that the superpixels obtained by PolSAR-SFCGN are mostly compact and fit the real boundaries of ground objects. As shown in Figure 15 and Figure 16, the superpixels of PolSAR-SFCGN are more regular and compact, while the shapes and sizes of superpixels are also relatively uniform. The superpixels of PolSAR-SFCGN have better boundary fitting, and each superpixel contains fewer pixels of different categories.

4.3. Analyses of Experiments on PolSAR Image Classification

4.3.1. Classification Results on the San Francisco Dataset

Table 5 shows the numerical classification results of PolSAR-SFCGN and the comparison algorithms with a simple convolutional network on the San Francisco dataset. Three deep learning-based methods have significant performance. Compared with PolSAR-SSN and SFCN, PolSAR-SFCGN has the highest values of OA, AA, and Kappa metrics and performs the best on most of the ground objects. PolSAR-CNN achieves the best performance on the type of Ocean, while PolSAR-SFCGN achieves the second-best performance. But PolSAR-SFCGN performs much better than PolSAR-CNN on other types of ground objects. Compared with SFCN, PolSAR-SFCGN achieves enhanced classification accuracies on all types of ground objects. It indicates that PolSAR-SFCGN, using the deep polarization features extracted from the polarization coherence matrix, is more suitable for the subsequent PolSAR image classification task.
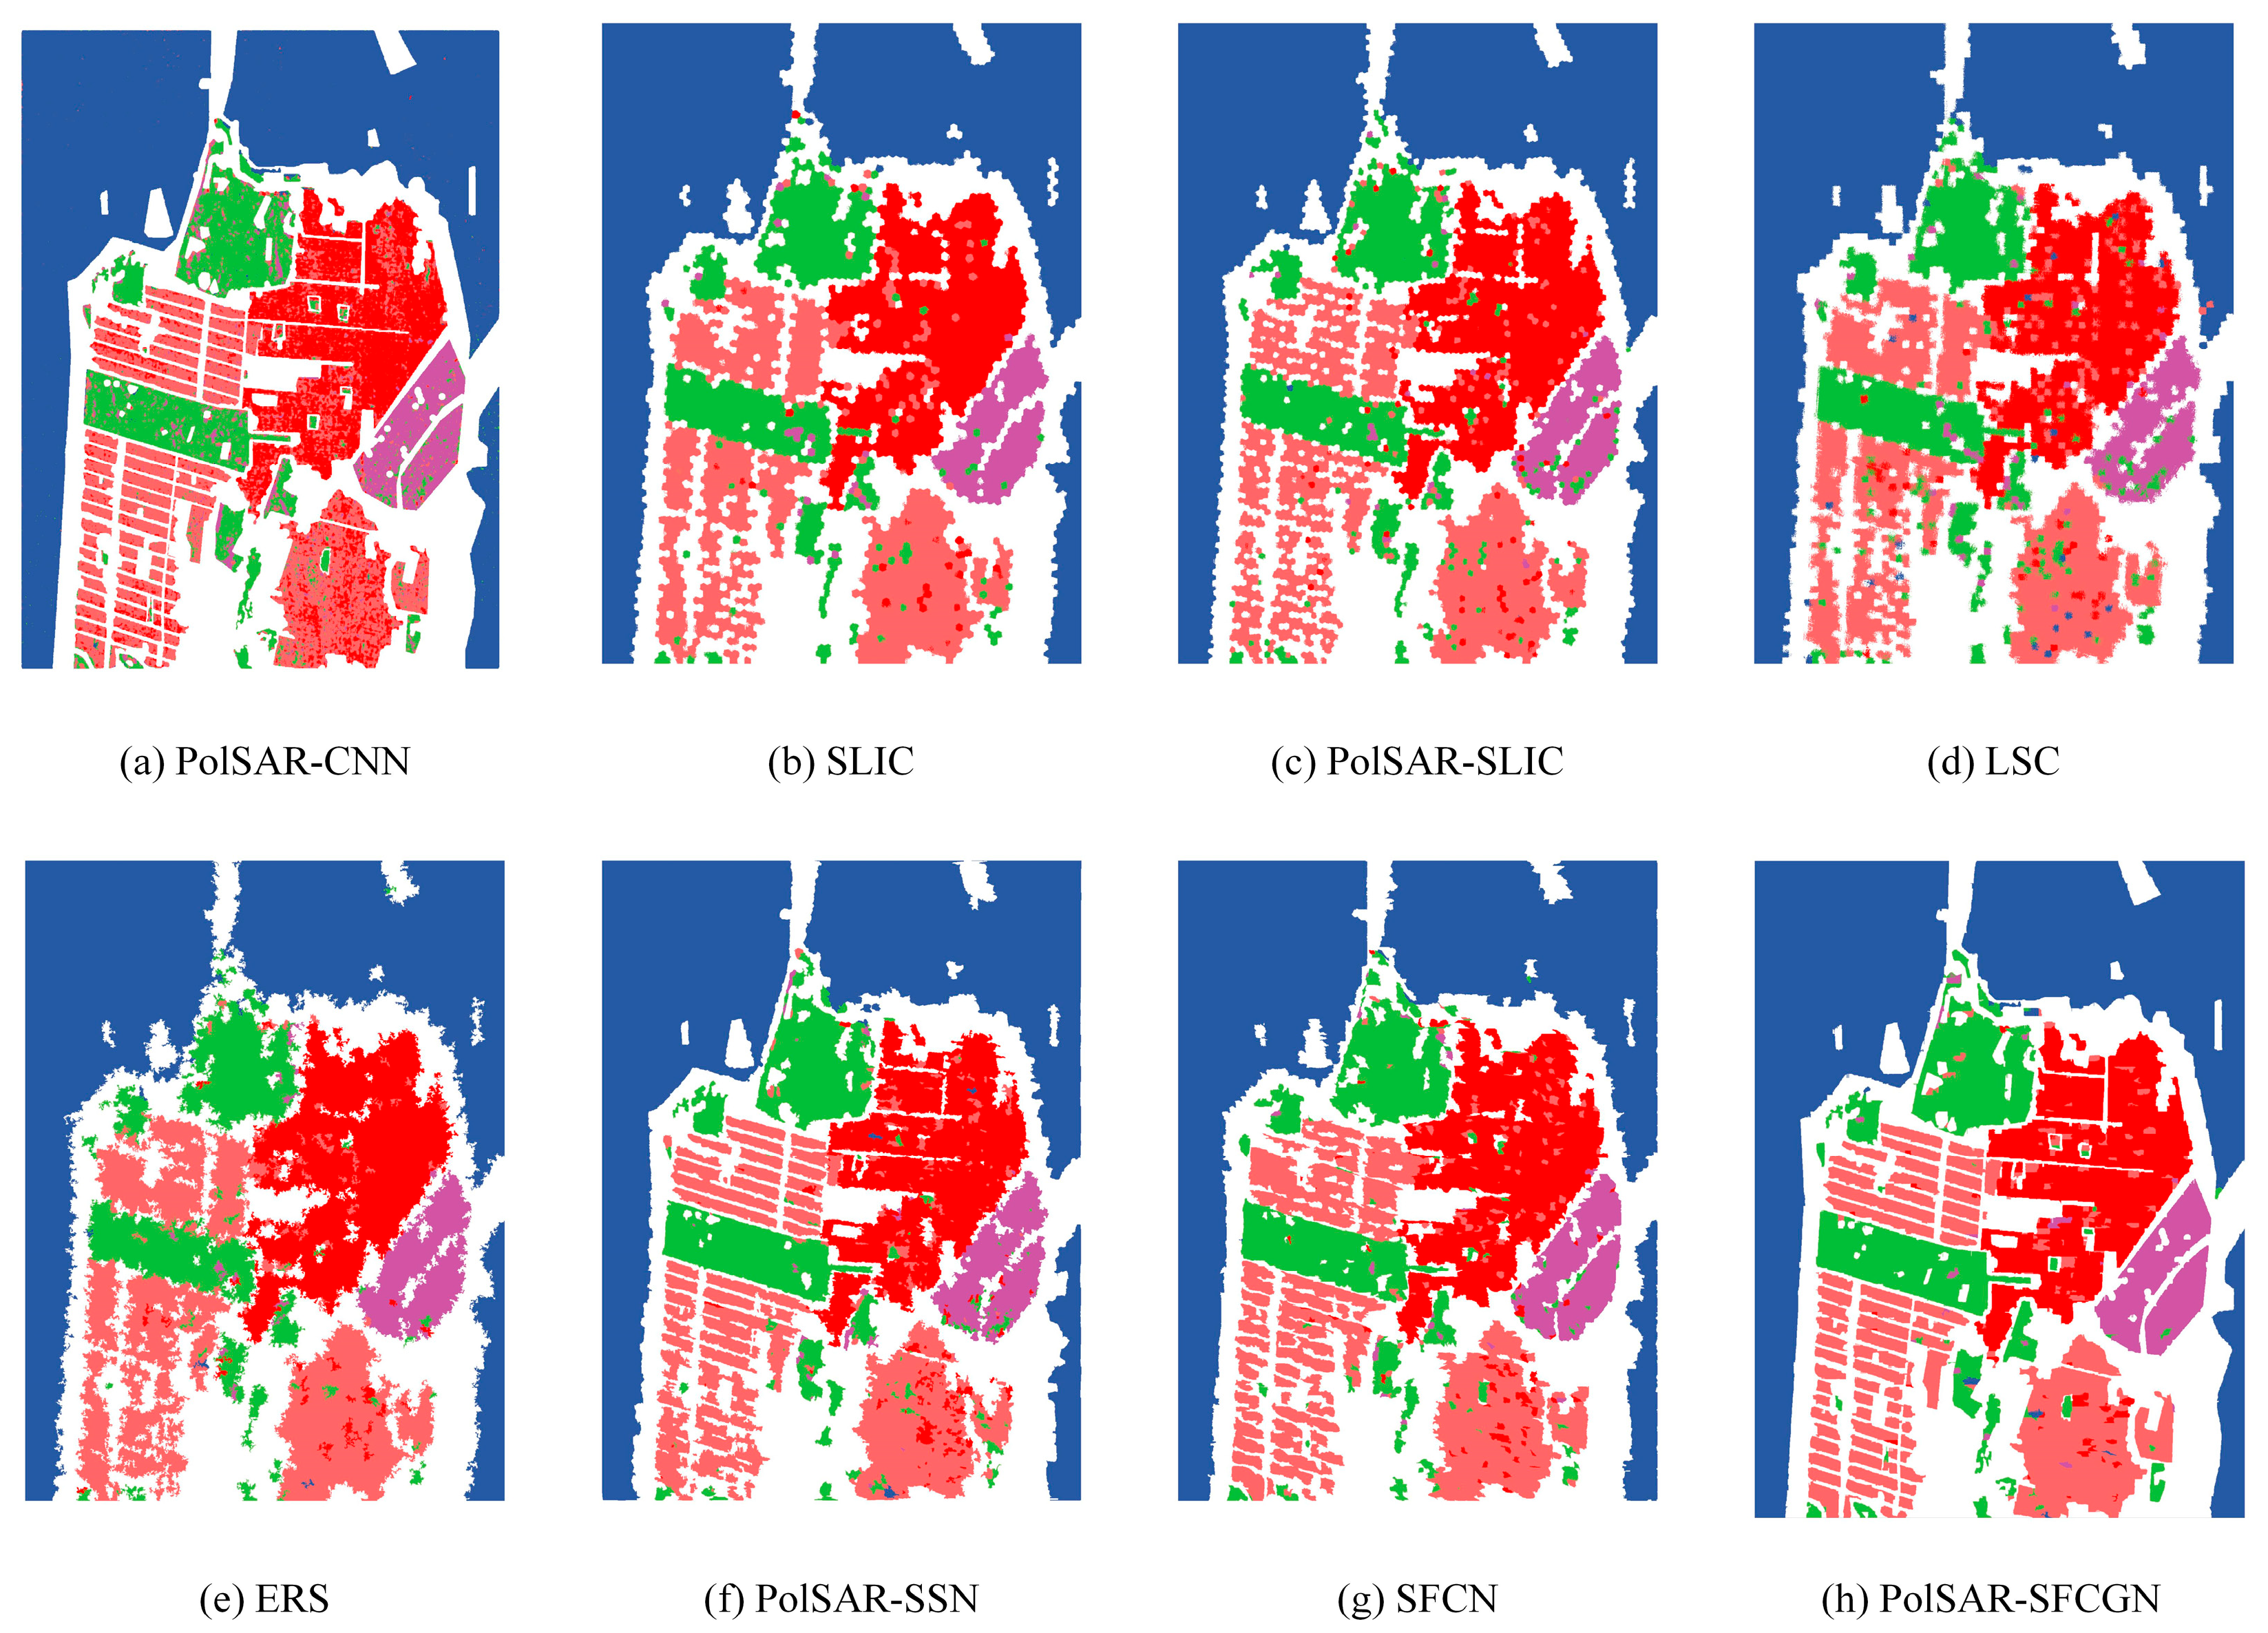
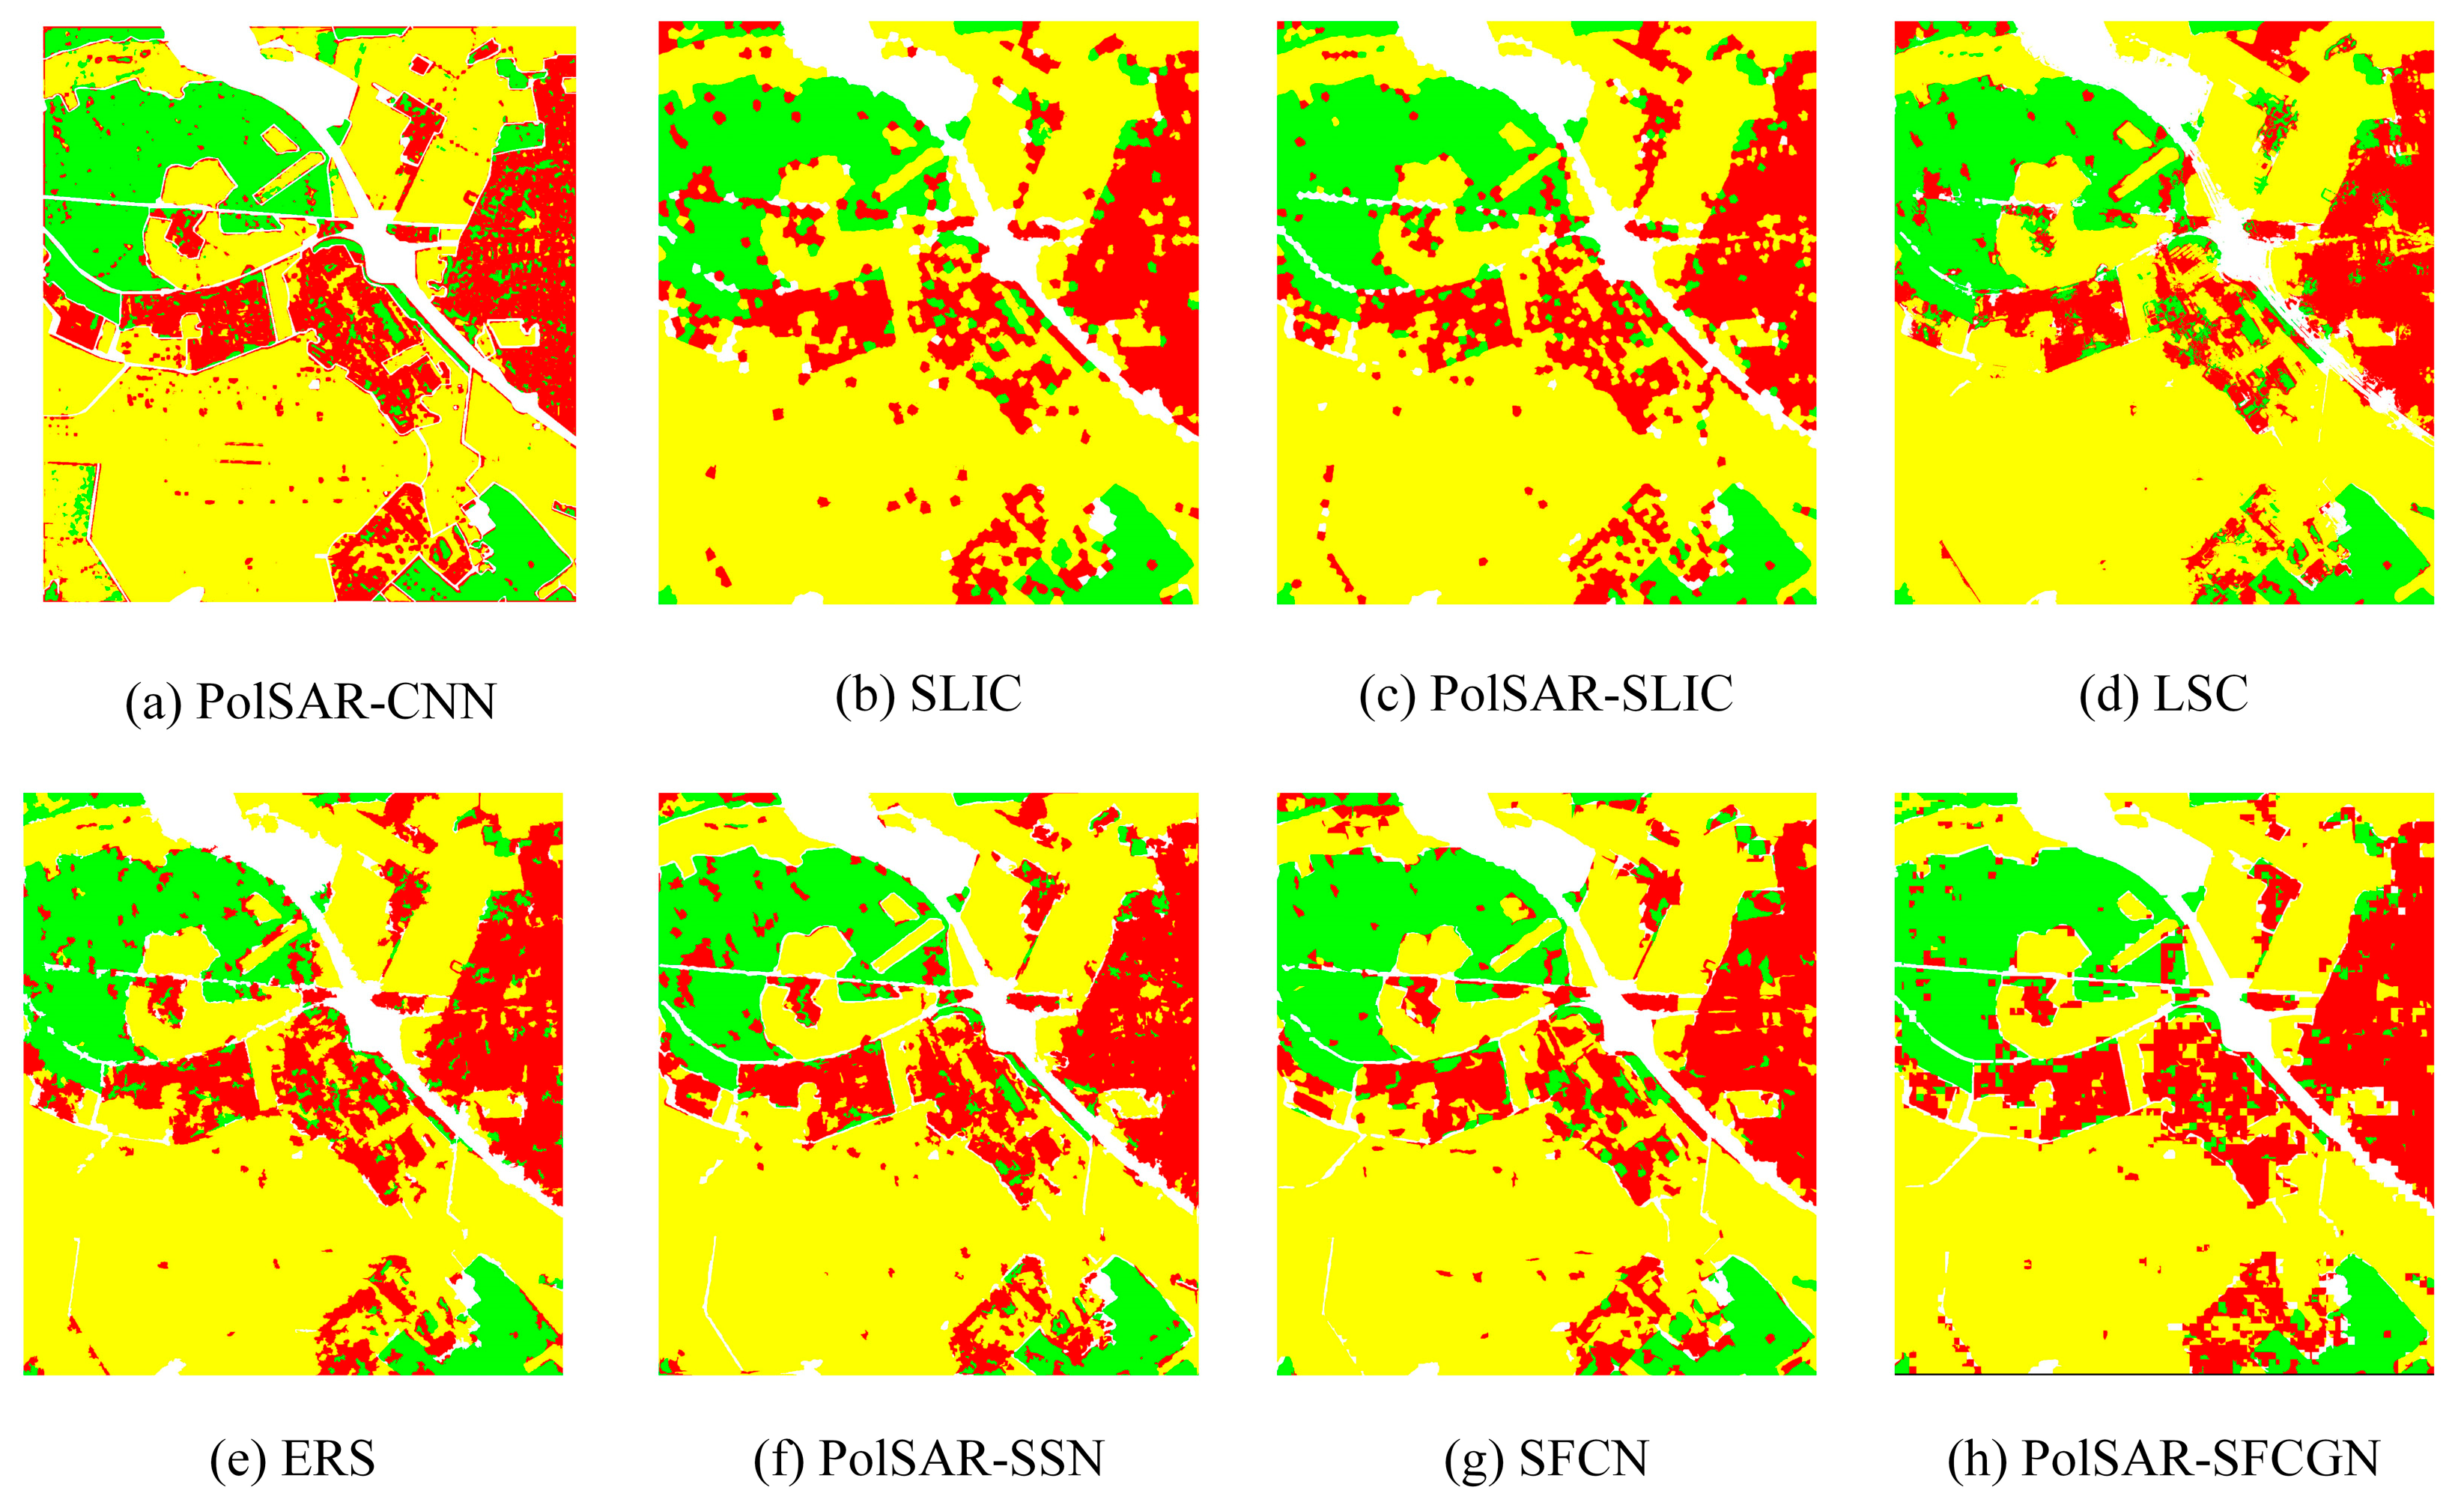
Figure 17 shows the visual classification results of various comparison algorithms and PolSAR-SFCGN on the San Francisco dataset. PolSAR-CNN and LSC have a number of misclassified samples with scattered distributions. SLIC, PolSAR-SLIC, and ERS have a large number of centrally distributed misclassified samples. In the classification results of PolSAR-SSN, SFCN, and PolSAR-SFCGN, most of the pixels are classified with correct labels, while the misclassifications are very concentrated. PolSAR-SSN misclassifies multiple types of ground objects. PolSAR-SFCGN misclassifies some pixels belonging to the Urban area as the Buildings area. Compared with PolSAR-SSN and SFCN, PolSAR-SFCGN has fewer and more concentrated misclassified pixels. In the superpixel-based classification results, some ground objects are classified as the background, especially three types of ground objects, namely Urban, Buildings, and Vegetation. It is related to the fact that some superpixels contain most of the pixels belonging to the background and are regarded as background. PolSAR-SFCGN is affected less by the impure superpixels and obtains clear and smooth boundaries between different types of ground objects.

4.3.2. Classification Results on the Oberpfaffenhofen Dataset

Table 6 gives the numerical classification results of PolSAR-SFCGN and other comparison algorithms on the Oberpfaffenhofen dataset. All these algorithms have quite nice classification performances on the Open area, but their classification performances on the Build-up area are not good. The superpixel-based approaches performed are not good enough in the Woodland area. PolSAR-SFCGN has the highest classification accuracy on the Build-up area. Although it does not yield the best accuracy on the Open area, the difference between it and the best approach is less than 0.8%. Thus, PolSAR-SFCGN obtains the highest values of OA, AA, and Kappa among all these contestant approaches. Figure 18 shows the visual classification results of various comparison algorithms and PolSAR-SFCGN on the Oberpfaffenhofen dataset. The classification result of PolSAR-CNN contains a significant number of discretely distributed misclassified samples. The traditional superpixel-based methods have a large number of centrally distributed misclassified samples. In the classification results of PolSAR-SSN, SFCN, and PolSAR-SFCGN, most of the pixels are classified with the correct type labels, while the misclassifications are concentrated in the Woodland areas. But these superpixel-based methods misclassify the pixels in some small regions of woodland next to the relatively large regions of Build-up area easily. It is consistent with the observation that the classification metrics of these methods on the type of woodland in Table 5 are much lower than their achievable classification accuracies in Table 3.

4.3.3. Classification Results on the Xi’an Dataset

Table 7 shows the numerical classification results of PolSAR-SFCGN and the comparison algorithms on the Xi’an dataset. These contestant approaches, except ERS, have high classification performances on the type of Water, especially LSC. But it misclassifies the other two ground objects as Water and obtains the worst values of OA and AA. PolSAR-SFCGN has the highest classification accuracies for most of the ground objects and the highest values of OA, AA, and Kappa. Compared with the pixel-based PolSAR-CNN, the traditional superpixel generation methods could not achieve good enough classification performances, which indicates that the classification results are greatly affected by the qualities of the superpixels. Since SFCN does not consider the polarization features, it also does not perform well enough for PolSAR image classification. PolSAR-SSN and PolSAR-SFCGN achieve certain performance improvements on the basis of PolSAR-CNN. The classification accuracies on the types of Grass and City obtained by PolSAR-SFCGN are improved by 7.03% and 2.24%, respectively, while the OA, AA, and Kappa metrics are improved by 3.84%, 2.11%, and 4.63%, respectively. All these metrics are also higher than PolSAR-SSN. PolSAR-SFCGN has stable classification performances on different types of ground objects.
Figure 19 shows the visual classification results of various comparison algorithms and PolSAR-SFCGN on the Xi’an dataset. There is a serious misclassification phenomenon in the classification result of LSC. It classifies a large number of ground objects as Water area, which corresponds to the observation that LSC performs very well on Water area but poorly on other types of ground objects in Table 7. PolSAR-SSN and PolSAR-SFCGN misclassify some pixels belonging to the Water area as the Grass area. These small superpixels of Water area may be suppressed and misclassified by the surrounding relatively big superpixels of Grass area in the classification, which leads to the disconnection of some Water area and reduces the classification accuracy of the Water area. A large number of misclassified pixels also exist in the classification results of SLIC, PolSAR-SLIC, ERS, and SFCN. The misclassified pixels of these methods are concentrated, which is related to the shapes and distributions of their superpixels. In the classification result of PolSAR-CNN, the misclassified pixels are scattered. In the classification results of PolSAR-SSN and PolSAR-SFCGN, most of the pixels are classified with the correct labels, while the misclassifications are very concentrated. Compared with PolSAR-SSN, PolSAR-SFCGN has fewer and more concentrated misclassified pixels.

5. Discussion

With the superpixel segmentation results on three PolSAR image datasets, it can be seen that PolSAR-SFCGN has the best segmentation results for all the metrics on both the Oberpfaffenhofen dataset and the Xi’an dataset. Due to the rich PolSAR information in the San Francisco dataset, the CO value of PolSAR-SFCGN is slightly lower, but PolSAR-SFCGN can fit the real boundaries better and has obtained the best results in all other metrics. It indicates that PolSAR-SFCGN obtains the superpixel segmentation results that are more in line with the real boundaries, instead of merely pursuing the compactness of the superpixels. These experimental results indicate that the superpixels generated by PolSAR-SFCGN can fit well with the real boundaries, while most of the superpixel blocks only contain the pixels of one type of ground object, which is related to its learning of deep polarization information. In the classification results of the superpixel-based methods via deep learning, most of the pixels are classified with correct labels, while the misclassifications are concentrated. PolSAR-SFCGN has the highest classification accuracies on most of the ground objects and the highest values of OA, AA, and Kappa metrics. It verifies that the superpixels generated by PolSAR-SFCGN can ensure the performance and efficiency of subsequent PolSAR image classification effectively.
In order to further analyze the performance of PolSAR-SFCGN, we compare the training and test time costs of two deep learning-based superpixel generation approaches on three PolSAR image datasets in Table 8. PolSAR-SFCGN has a shorter test time and generates superpixels quickly. Compared with PolSAR-SSN, PolSAR-SFCGN reduced the time consumption by almost 80% and improved the training speed significantly. In the superpixel segmentation phase of PolSAR-SSN, the continuous dense matrix multiplication is used in the differential SLIC, and this phase still requires a considerable amount of memory. In PolSAR-SFCGN, we can combine the polarimetric feature extraction and the superpixel generation into one step, which greatly reduces the consumption of computing resources and training costs. Furthermore, Table 9 gives the time costs of training and testing in the classifications of PolSAR-SFCGN and the pixel-level classification method PolSAR-CNN. The training time of PolSAR-SFCGN is lower than that of PolSAR-CNN on all three datasets, especially with a particularly significant reduction in the datasets with large sizes (such as the San Francisco dataset). In terms of the test time for generating classification results, the advantage of PolSAR-SFCGN is extremely impressive. For all three datasets, the test time of PolSAR-SFCGN is less than one second, while the minimum test time of PolSAR-CNN is 18.29 s. It indicates that PolSAR-SFCGN has greatly improved the efficiency of PolSAR image classification by converting the pixel-level operations into the region-level operations.
We also use t-tests to verify the difference between PolSAR-SSN and PolSAR-SFCGN with the superpixel segmentation results obtained by five independent runs on the Oberpfaffenhofen dataset. As shown in Table 10, PolSAR-SFCGN outperforms PolSAR-SSN on all these metrics. Figure 20 shows the box plots of different metrics of superpixel segmentation achieved by PolSAR-SFCGN and PolSAR-SSN on the Oberpfaffenhofen dataset. Especially, PolSAR-SFCGN has significant improvements on the metrics of UE, CO, Woodland, and AA. Additionally, the coherent imaging principle of PolSAR and the multi-scatterer characteristics of ground objects lead to the multiplicative speckle noise in PolSAR images, which has a significant impact on the performance of PolSAR image processing and interpretation. With the visual and numerical results of superpixel generation and subsequent classification on different PolSAR image datasets, it is observed that PolSAR-SFCGN can achieve excellent performance and efficiency simultaneously for PolSAR images by extracting deep polarimetric features with the end-to-end framework.
In this work, we use PolSAR-CNN, a very simple classification network, to show the classification performance with the superpixels of PolSAR-SFCGN. In order to further analyze the performance of PolSAR-SFCGN with different classification networks, we use two other popular classification networks for PolSAR image classification here. DSNet [58] is a dense convolutional neural network based on depthwise separable convolution. PDAS [59] is a gradient descent-based neural architecture search method, which can obtain three different classification networks for three PolSAR datasets, respectively. With the superpixels of PolSAR-SFCGN, the classification results obtained by PolSAR-CNN, DSNet, and PDAS are presented in Table 11 and Figure 21. On the San Francisco dataset, DSNet achieves the optimal results in terms of the classification accuracies for four types of ground objects as well as the OA, AA, and Kappa metrics. PolSAR-SFCGN is the second-best approach, which performs best on the type of Bare soil. The parameter number of DSNet is almost twice as much as that of PolSAR-CNN. On the Oberpfaffenhofen dataset, PDAS performs the best and has the highest parameter number. PolSAR-CNN is the second-best and performs best on the type of Open area. DSNet performs the worst, which has a large number of samples misclassified as the Build-up area in Figure 21. On the Xi’an dataset, DSNet is slightly better, and the other two approaches also achieve good results. With the above observations, it can be seen that different classification networks can achieve good performances with the superpixels of PolSAR-SFCGN on three PolSAR image datasets. It can achieve higher performance by designing the matching networks by fully considering the scene characteristics and the task requirements.

6. Conclusions

In this study, we propose an end-to-end superpixel generation network for PolSAR images. PolSAR-SFCGN constructs a fully convolutional neural network by adopting a universal encoder–decoder structure. The encoder extracts deep features based on the polarization coherence matrix, and the decoder generates excellent PolSAR superpixels by the extracted deep polarization features. The whole process of PolSAR superpixel generation needs no clustering procedure, which can improve the efficiency of superpixel generation based on deep learning significantly. Compared with the classical and state-of-the-art superpixel segmentation approaches, PolSAR-SFCGN has outstanding performance in relation to various PolSAR datasets. It can obtain the superpixels that mostly contain only one type of ground object and fit the real boundaries between different types of ground objects better. Compared with the advanced PolSAR superpixel segmentation approach based on deep learning, PolSAR-SFCGN can reduce the time cost and improve the efficiency of generating superpixels impressively. Additionally, PolSAR-SFCGN can achieve pretty good classification performances on various PolSAR datasets, just combined with a very simple classification network. In our future work, we will try to explore effective polarization features and incorporate the complex-valued convolutional operations and attention mechanisms into PolSAR-SFCGN to further enhance its performance on deep polarimetric feature extraction. We will also try to apply PolSAR-SFCGN for other complex interpretation tasks.

Author Contributions

Conceptualization, M.Z.; Methodology, M.Z. and L.L.; Software, J.S.; Validation, M.Z. and J.S.; Investigation, J.Z. and B.C.; Writing–original draft, M.Z. and J.S.; Writing–review & editing, M.Z., J.S. and J.F.; Supervision, W.Z. All authors have read and agreed to the published version of the manuscript.

Funding

This work was supported in part by the Key Research and Development Program of Shaanxi: No. 2024CY-GJHX-14 and in part by the National Natural Science Foundation of China: No. 62271374 and No. 62176200.

Data Availability Statement

The data are contained within the paper.

Conflicts of Interest

All the authors declare no conflicts of interest.

References

  1. Lee, J.S.; Pottier, E. Polarimetric Radar Imaging: From Basics to Applications; M: CRC Press: Boca Raton, FL, USA, 2017. [Google Scholar]
  2. Ren, S.; Zhou, F. Semi-supervised classification for PolSAR data with multi-scale evolving weighted graph convolutional network. IEEE J. Sel. Top. Appl. Earth Obs. Remote Sens. 2021, 14, 2911–2927. [Google Scholar] [CrossRef]
  3. Paek, S.W.; Balasubramanian, S.; Kim, S.; Weck, O. Small-satellite synthetic aperture radar for continuous global biospheric monitoring: A review. Remote Sens. 2020, 12, 2546. [Google Scholar] [CrossRef]
  4. Wang, L.; Xu, X.; Dong, H.; Gui, R.; Yang, R.; Pu, F. Exploring convolutional lstm for polsar image classification. In Proceedings of the IEEE International Geoscience and Remote Sensing Symposium, Valencia, Spain, 22–27 July 2018; pp. 8452–8455. [Google Scholar]
  5. Cheng, X.; Huang, W.; Gong, J. An unsupervised scattering mechanism classification method for PolSAR images. IEEE Geosci. Remote Sens. Lett. 2014, 11, 1677–1681. [Google Scholar] [CrossRef]
  6. Wang, L.; Hong, H.; Zhang, Y.; Wu, J.; Ma, L.; Zhu, Y. PolSAR-SSN: An end-to-end superpixel sampling network for PolSAR image Classification. IEEE Geosci. Remote Sens. Lett. 2022, 19, 4505305. [Google Scholar] [CrossRef]
  7. Li, T.; Peng, D.; Chen, Z.; Guo, B. Superpixel-level CFAR detector based on truncated gamma distribution for SAR images. IEEE Geosci. Remote Sens. Lett. 2021, 18, 1421–1425. [Google Scholar] [CrossRef]
  8. Guo, Y.; Jiao, L.; Qu, R.; Sun, Z.; Wang, S. Adaptive fuzzy learning superpixel representation for PolSAR image classification. IEEE Trans. Geosci. 2022, 60, 5217818. [Google Scholar] [CrossRef]
  9. Wang, Z.; Yang, Y. A non-iterative clustering based soft segmentation approach for a class of fuzzy images. Appl. Soft Comput. 2017, 70, 988–999. [Google Scholar] [CrossRef]
  10. Wang, Z. A new approach for robust segmentation of the noisy or textured images. SIAM J. Imaging Sci. 2016, 9, 1409–1436. [Google Scholar] [CrossRef]
  11. Ren, X.; Malik, J. Learning a classification model for segmentation. In Proceedings of the Computer Vision and Pattern Recognition CVPR, Nice, France, 13–16 October 2003; pp. 10–17. [Google Scholar] [CrossRef]
  12. Liu, Y.; Yu, C.; Yu, M.; He, Y. Manifold slic: A fast method to compute content-sensitive superpixels. In Proceedings of the Computer Vision and Pattern Recognition CVPR, Las Vegas, NV, USA, 27–30 June 2016; pp. 651–659. [Google Scholar]
  13. Li, Z.; Chen, J. Superpixel segmentation using linear spectral clustering. In Proceedings of the Computer Vision and Pattern Recognition CVPR, Boston, MA, USA, 7–12 June 2015; pp. 1356–1363. [Google Scholar]
  14. Bergh, M.; Boix, X.; Gool, L. Seeds: Superpixels extracted via energy-driven sampling. In Proceedings of the European Conference on Computer Vision ECCV, Florence, Italy, 7–13 October 2012; pp. 298–314. [Google Scholar]
  15. Shi, J.; Malik, J. Normalized cuts and image segmentation. IEEE Trans. Pattern Anal. Mach. Intell. 2000, 22, 888–905. [Google Scholar] [CrossRef]
  16. Liu, M.-Y.; Tuzel, O.; Ramalingam, S.; Chellappa, R. Entropy rate superpixel segmentation. In Proceedings of the Computer Vision and Pattern Recognition CVPR, Colorado Springs, CO, USA, 20–25 June 2011; pp. 2097–2104. [Google Scholar] [CrossRef]
  17. Boix, X.; Gonfaus, J.; Van de Weijer, J. Harmony potentials: Fusing global and local scale for semantic image segmentation. Int. J. Comput. Vis. 2012, 96, 83–102. [Google Scholar] [CrossRef]
  18. Shen, J.; Du, Y.; Wang, W.; Li, X. Lazy random walks for superpixel segmentation. IEEE Trans. Image Process. 2014, 23, 1451–1462. [Google Scholar] [CrossRef]
  19. Gadde, R.; Jampani, V.; Kiefel, M.; Kappler, D.; Gehler, P. Superpixel convolutional networks using bilateral inceptions. In Proceedings of the ECCV, Amsterdam, The Netherlands, 11–14 October 2016. [Google Scholar]
  20. Kwak, S.; Suha; Hong, S.; Han, B. Weakly supervised semantic segmentation using superpixel pooling network. In Proceedings of the AAAI, San Francisco, CA, USA, 4–9 February 2017. [Google Scholar]
  21. Jampani, V.; Sun, D.; Liu, M.Y.; Yang, M.H.; Kautz, J. Superpixel sampling networks. In Proceedings of the European Conference on Computer Vision ECCV, Munich, Germany, 8–14 September 2018; pp. 352–368. [Google Scholar]
  22. Yang, F.; Sun, Q.; Jin, H.; Zhou, Z. Superpixel segmentation with fully convolutional networks. In Proceedings of the 2020 IEEE/CVF CVPR, Seattle, WA, USA, 13–19 June 2020; pp. 13961–13970. [Google Scholar]
  23. Lang, F.; Yang, J.; Li, D.; Zhao, L.; Shi, L. Polarimetric SAR Image Segmentation Using Statistical Region Merging. IEEE Geosci. Remote Sens. Lett. 2014, 11, 509–513. [Google Scholar] [CrossRef]
  24. Bi, H.; Xu, L.; Cao, X.; Xue, Y.; Xu, Z. Polarimetric SAR Image Semantic Segmentation With 3D Discrete Wavelet Transform and Markov Random Field. IEEE Trans. Image Process. 2020, 29, 6601–6614. [Google Scholar] [CrossRef]
  25. Quan, S.; Xiang, D.; Wang, W.; Xiong, B.; Kuang, G. Scattering Feature-Driven Superpixel Segmentation for Polarimetric SAR Images. IEEE J. Stars 2021, 14, 2173–2183. [Google Scholar] [CrossRef]
  26. Wang, J.; Quan, S.; Xing, S.; Li, Y. PSO-based Fine Polarimetric Decomposition for Ship Scattering Characterization. ISPRS J. Photogramm. 2024, 220, 18–31. [Google Scholar] [CrossRef]
  27. Xiang, D.; Tang, T.; Quan, S.; Guan, D.; Su, Y. Adaptive Superpixel Generation for SAR Images with Linear Feature Clustering and Edge Constraint. IEEE Trans. Geosci. Remote Sens. 2019, 57, 3873–3889. [Google Scholar] [CrossRef]
  28. Shu, G.; Dehghan, A.; Shah, M. Improving an object detector and extracting regions using superpixels. In Proceedings of the Computer Vision and Pattern Recognition CVPR, Portland, OR, USA, 23–28 June 2013; pp. 3721–3727. [Google Scholar]
  29. Yan, J.; Yu, Y.; Zhu, X.; Lei, Z.; Li, S.Z. Object detection by labeling superpixels. In Proceedings of the Computer Vision and Pattern Recognition CVPR, Boston, MA, USA, 7–12 June 2015; pp. 5107–5116. [Google Scholar]
  30. Gould, S.; Rodgers, J.; Cohen, D. Multi-class segmentation with relative location prior. Int. J. Comput. Vis. 2008, 80, 300–316. [Google Scholar] [CrossRef]
  31. Sharma, A.; Tuzel, O.; Liu, M.Y. Recursive context propagation network for semantic scene labeling. In Proceedings of the Neural Information Processing Systems NIPS, Montreal, QC, Canada, 8–13 December 2014. [Google Scholar]
  32. He, S.; Lau, R.W.; Liu, W.; Huang, Z.; Yang, Q. SuperCNN: A superpixelwise convolutional neural network for salient object detection. Int. J. Comput. Vis. 2015, 115, 330–344. [Google Scholar] [CrossRef]
  33. Perazzi, F.; Kr, P.; Pritch, Y.; Hornung, A. Saliency filters: Contrast based filtering for salient region detection. In Proceedings of the Computer Vision and Pattern Recognition CVPR, Providence, RI, USA, 16–21 June 2012; pp. 733–740. [Google Scholar]
  34. Yang, C.; Zhang, L.; Lu, H.; Ruan, X.; Yang, M.H. Saliency detection via graph based manifold ranking. In Proceedings of the Computer Vision and Pattern Recognition CVPR, Portland, OR, USA, 23–28 June 2013. [Google Scholar]
  35. Zhu, W.; Liang, S.; Wei, Y.; Sun, J. Saliency optimization from robust background detection. In Proceedings of the Computer Vision and Pattern Recognition CVPR, Columbus, OH, USA, 23–28 June 2014. [Google Scholar]
  36. Hu, Y.; Song, R.; Li, Y.; Rao, P.; Wang, Y. Highly accurate optical flow estimation on superpixel tree. Image Vis. Comput. 2016, 52, 167–177. [Google Scholar] [CrossRef]
  37. Lu, J.; Yang, H.; Min, D.; Do, M.N. Patch match filter: Efficient edge-aware filtering meets randomized search for fast correspondence field estimation. In Proceedings of the Computer Vision and Pattern Recognition CVPR, Portland, OR, USA, 23–28 June 2013; pp. 1854–1861. [Google Scholar]
  38. Sun, D.; Liu, C.; Pfister, H. Local layering for joint motion estimation and occlusion detection. In Proceedings of the Computer Vision and Pattern Recognition CVPR, Columbus, OH, USA, 24–27 June 2014; pp. 1098–1105. [Google Scholar]
  39. Yamaguchi, K.; McAllester, D.; Urtasun, R. Robust monocular epipolar flow estimation. In Proceedings of the Computer Vision and Pattern Recognition CVPR, Portland, OR, USA, 23–28 June 2013; pp. 1862–1869. [Google Scholar]
  40. Van den Bergh, M.; Carton, D.; Van Gool, L. Depth SEEDS: Recovering incomplete depth data using superpixels. In Proceedings of the WACV, Clearwater Beach, FL, USA, 15–17 January 2013; pp. 363–368. [Google Scholar]
  41. Yang, F.; Lu, H.; Yang, M.H. Robust superpixel tracking. IEEE Trans. Image Process. 2014, 23, 1639–1651. [Google Scholar] [CrossRef] [PubMed]
  42. Guo, Y.; Sun, Z.; Qu, R.; Jiao, L.; Liu, F.; Zhang, X. Fuzzy superpixels based semi-supervised similarity-constrained CNN for PolSAR image classification. Remote Sens. 2020, 12, 1694. [Google Scholar] [CrossRef]
  43. Qin, F.; Guo, J.; Lang, F. Superpixel segmentation for polarimetric SAR imagery using local iterative clustering. IEEE Geosci. Remote Sens. Lett. 2015, 12, 13–17. [Google Scholar]
  44. Geng, J.; Ma, X.; Fan, J.; Wang, H. Semisupervised classification of polarimetric SAR image via superpixel restrained deep neural network. IEEE Geosci. Remote Sens. Lett. 2018, 15, 122–126. [Google Scholar] [CrossRef]
  45. Cao, Y.; Wu, Y.; Li, M.; Liang, W.; Zhang, P. PolSAR image classification using a superpixel-based composite kernel and elastic net. Remote Sens. 2021, 13, 380. [Google Scholar] [CrossRef]
  46. Gadhiya, T.; Roy, A.K. Superpixel-driven optimized Wishart network for fast PolSAR image classification using global k-means algorithm. IEEE Trans. Geosci. Remote Sens. 2020, 58, 97–109. [Google Scholar] [CrossRef]
  47. Yin, J.; Wang, T.; Du, Y.; Liu, X.; Zhou, L.; Yang, J. SLIC superpixel segmentation for polarimetric SAR images. IEEE Trans. Geosci. Remote Sens. 2021, 60, 5201317. [Google Scholar] [CrossRef]
  48. Liu, F.; Shi, J.; Jiao, L.; Liu, H.; Yang, S.; Wu, J. Hierarchical semantic model and scattering mechanism based PolSAR image classification. Pattern Recognit. 2016, 59, 325–342. [Google Scholar] [CrossRef]
  49. Hou, B.; Yang, C.; Ren, B.; Jiao, L. Decomposition-feature-iterative-clustering-based superpixel segmentation for PolSAR image classification. IEEE Geosci. Remote Sens. Lett. 2018, 15, 1239–1243. [Google Scholar] [CrossRef]
  50. Feng, J.; Cao, Z.; Pi, Y. Polarimetric contextual classification of PolSAR images using sparse representation and superpixels. Remote Sens. 2014, 6, 7158–7181. [Google Scholar] [CrossRef]
  51. Hou, B.; Kou, H.; Jiao, L. Classification of polarimetric SAR images using multilayer autoencoders and superpixels. IEEE J. Sel. Top. Appl. Earth Obs. Remote Sens. 2016, 9, 3072–3081. [Google Scholar] [CrossRef]
  52. Chu, B.; Zhang, M.; Ma, K.; Liu, L.; Wan, J.; Chen, J.; Chen, J.; Zeng, H. Multiobjective Evolutionary Superpixel Segmentation for PolSAR Image Classification. Remote Sens. 2024, 16, 854. [Google Scholar] [CrossRef]
  53. Cloude, S.R.; Pottier, E. A review of target decomposition theorems in radar polarimetry. IEEE Trans. Geosci. Remote Sens. 1996, 34, 498–518. [Google Scholar] [CrossRef]
  54. Zhou, Y.; Wang, H.; Xu, F.; Jin, Y. Polarimetric SAR image classification using deep convolutional neural networks. IEEE Geosci. Remote Sens. Lett. 2016, 13, 1935–1939. [Google Scholar] [CrossRef]
  55. Liu, X.; Jiao, L.; Liu, F.; Zhang, D.; Tang, X. PolSF: PolSAR image datasets on San Francisco. In Proceedings of the International Conference on Information Systems ICIS, Xi’an, China, 28–31 October 2022; pp. 214–219. [Google Scholar]
  56. Liu, B.; Hu, H.; Wang, H.; Wang, K. Superpixel-based classification with an adaptive number of classes for polarimetric SAR images. IEEE Trans. Geosci. Remote Sens. 2013, 51, 907–924. [Google Scholar] [CrossRef]
  57. Xie, W.; Jiao, L.; Biao, H.; Ma, W.; Zhao, J. POLSAR Image Classification via Wishart-AE Model or Wishart-CAE Model. IEEE J. STARS 2017, 10, 3604–3615. [Google Scholar] [CrossRef]
  58. Shang, R.; He, J.; Wang, J.; Xu, K.; Jiao, L.; Stolkin, R. Dense connection and depthwise separable convolution based CNN for polarimetric SAR image classification. Knowl. Based Syst. 2020, 194, 105542. [Google Scholar] [CrossRef]
  59. Dong, H.; Zou, B.; Zhang, L.; Zhang, S. Automatic design of CNNs via differentiable neural architecture search for PolSAR image classification. IEEE Trans. Geosci. Remote Sens. 2020, 58, 6362–6375. [Google Scholar] [CrossRef]
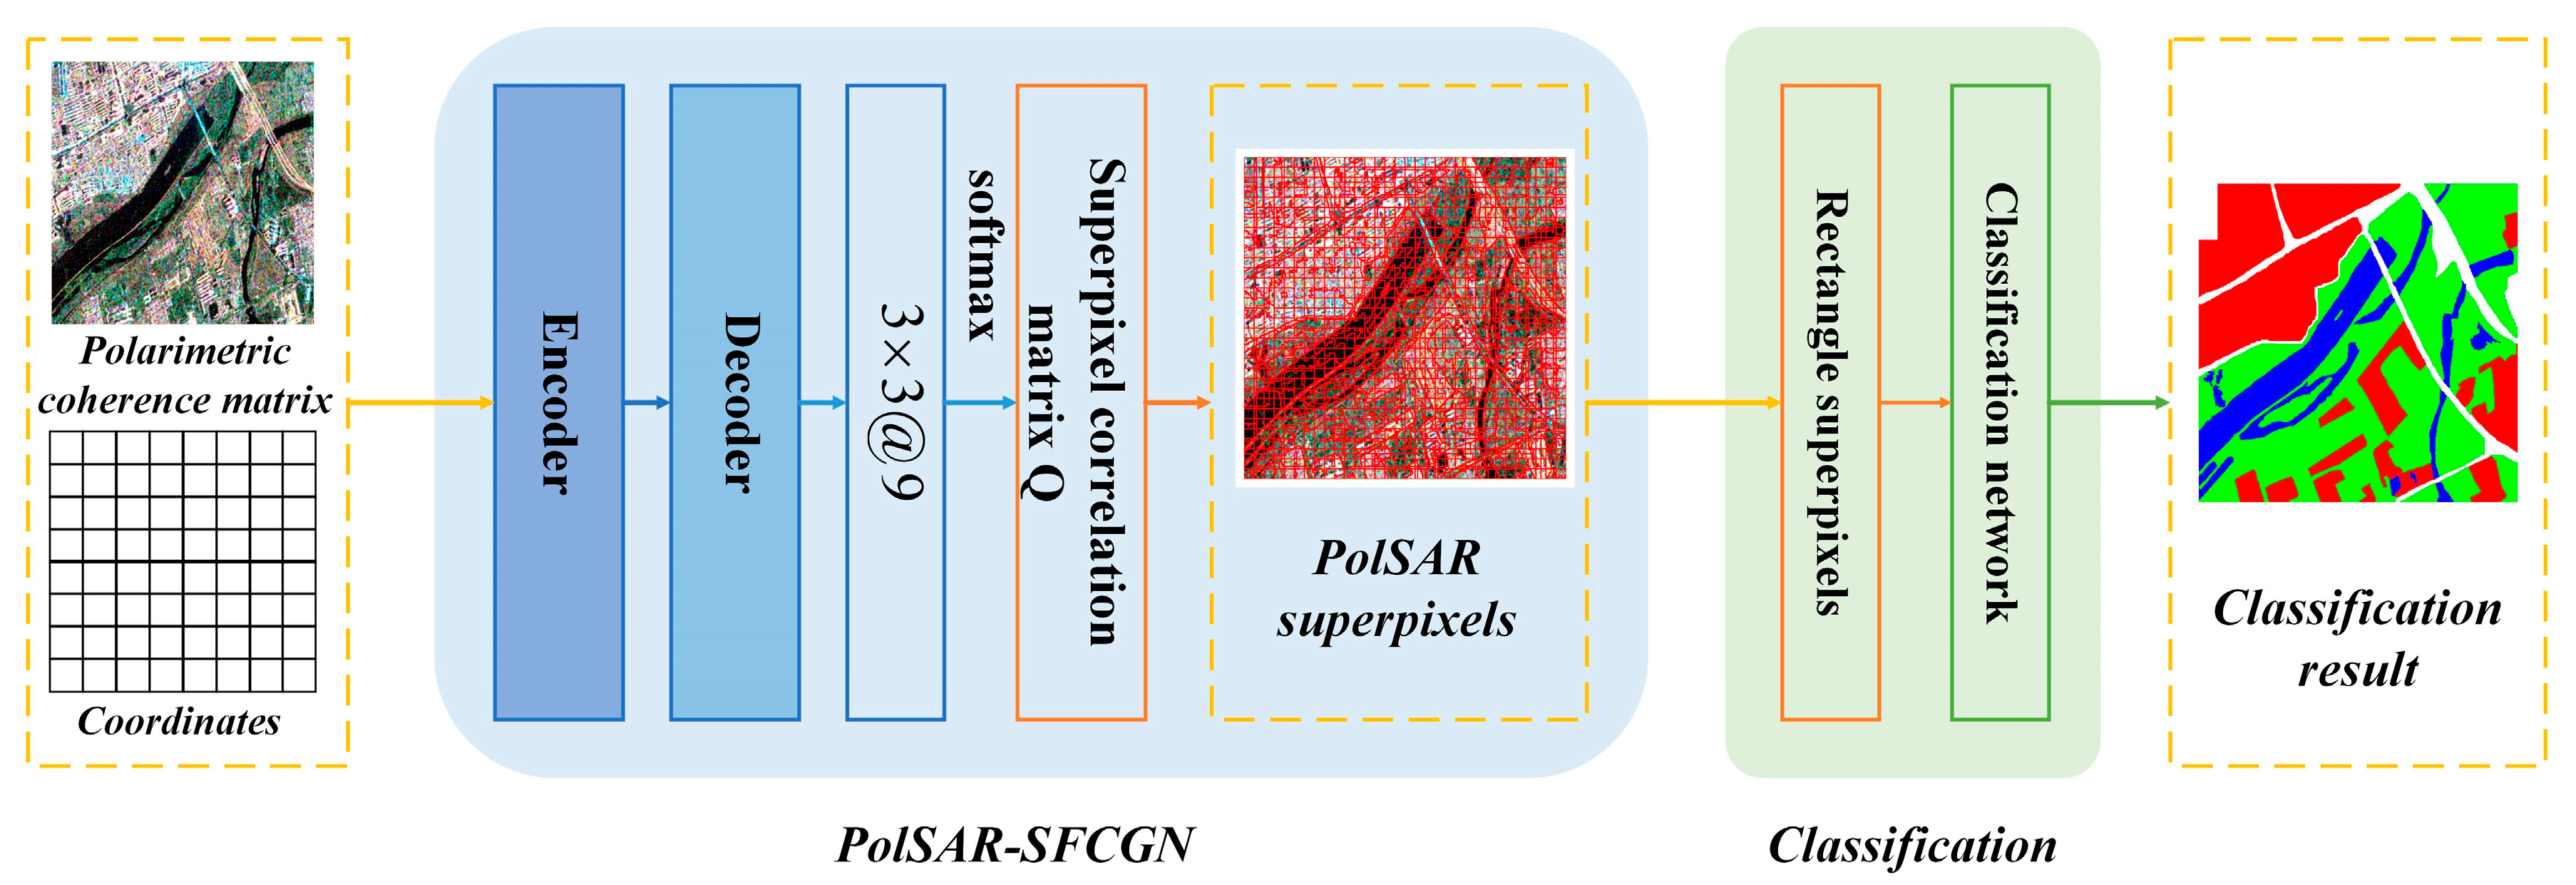
Figure 1. The overall framework of PolSAR-SFCGN for PolSAR image classification.
Remotesensing 17 02723 g001
Figure 2. The illustration of calculating the mapping association between the pixels and the superpixels. For each pixel in the white box, we consider nine grid cells in the orange box for assignment.
Remotesensing 17 02723 g002
Figure 3. The network structure of superpixel generation in PolSAR-SFCGN.
Remotesensing 17 02723 g003
Figure 4. The rectangular process and the classification network.
Remotesensing 17 02723 g004
Figure 5. The San Francisco dataset. (a) The pauli RGB map. (b) The ground truth map.
Remotesensing 17 02723 g005
Figure 6. The Oberpfaffenhofen dataset. (a) The pauli RGB map. (b) The ground truth map.
Remotesensing 17 02723 g006
Figure 7. The Xi’an dataset. (a) The pauli RGB map. (b) The ground truth map.
Remotesensing 17 02723 g007
Figure 8. The performances of PolSAR-SFCGN with different values of the superpixel sampling interval on the Oberpfaffenhofen dataset. (a) Superpixel generation metrics of BR and CO. (b) Superpixel generation metric of UE. (c) Achievable classification accuracies.
Remotesensing 17 02723 g008
Figure 9. The visual superpixel generation results obtained by PolSAR-SFCGN with different values of the superpixel sampling interval on the Oberpfaffenhofen dataset. (a) Superpixel result with the superpixel sampling interval value 8. (b) Superpixel result with the superpixel sampling interval value 16. (c) Superpixel result with the superpixel sampling interval value 20. (d) Superpixel result with the superpixel sampling interval value 32.
Remotesensing 17 02723 g009
Figure 10. The selected regions in the superpixel generation results obtained by PolSAR-SFCGN with different values of superpixel sampling intervals on the Oberpfaffenhofen dataset.
Remotesensing 17 02723 g010
Figure 11. The visual superpixel generation results on the San Francisco dataset.
Remotesensing 17 02723 g011
Figure 12. The selected regions in the superpixel generation results on the San Francisco dataset.
Remotesensing 17 02723 g012
Figure 13. The visual superpixel generation results on the Oberpfaffenhofen dataset.
Remotesensing 17 02723 g013
Figure 14. The selected regions in the superpixel generation results on the Oberpfaffenhofen dataset.
Remotesensing 17 02723 g014
Figure 15. The visual superpixel segmentation results on the Xi’an dataset.
Remotesensing 17 02723 g015
Figure 16. The selected regions in the superpixel generation results on the Xi’an dataset.
Remotesensing 17 02723 g016
Figure 17. The visual classification results on the San Francisco dataset.
Remotesensing 17 02723 g017
Figure 18. The visual classification results on the Oberpfaffenhofen dataset.
Remotesensing 17 02723 g018
Figure 19. The visual classification results on the Xi’an dataset.
Remotesensing 17 02723 g019
Figure 20. The boxplots of different metrics of superpixel segmentation by PolSAR-SFCGN and PolSAR-SSN on the Oberpfaffenhofen dataset. (a) The boxplots of BR metric. (b) The boxplots of UE metric. (c) The boxplots of CO metric. (d) The boxplots of Build-up area metric. (e) The boxplots of Wood land metric. (f) The boxplots of Open area metric. (g) The boxplots of OA metric. (h) The boxplots of AA metric. (i) The boxplots of Kappa metric.
Remotesensing 17 02723 g020
Figure 21. Visual results of different classification networks with the superpixels of PolSAR-SFCGN.
Remotesensing 17 02723 g021
Table 1. The categories of PolSAR superpixel generation approaches.
Types of MethodsFeaturesMain IdeasAdvantages and Disadvantages
Improved
traditional
approaches
[43]Average
Coherence
matrix
Replace the nearest distance in SLIC with a Wishart hypothesis test distance.Introduce polarimetric information into superpixel segmentation but do have not good enough performances.
[45]Coherency
matrix
Introduce a coherency matrix into SLIC.
[46]Pauli
decomposition
Use a Wishart distance and design a global K-means superpixel segmentation.
[47]Coherency
matrix
Introduce four classical dissimilarity statistical distances of PolSAR images.
Fuzzy superpixels-based approaches[8]Pauli
decomposition
and H/A/Alpha
decomposition
Consider the correlation among pixels’ polarimetric scattering information through fuzzy rough set theory to generate superpixels. Update the ratio of undetermined pixels dynamically and adaptively.Generate the improved fuzzy superpixels to yield pure superpixels but need to manually design the features and still use the traditional generation strategies.
[42]Average
Coherence
matrix
Propose fuzzy superpixels to forcefully reduce the generated mixed superpixels.
Mult objective evolution based
approach
[52]Coherency
matrix
Optimize the similarity information within the superpixels and the differences among the superpixels simultaneously. Improve the qualities of superpixels by fully using the boundary information of good-quality superpixels.Determine the suitable number of superpixels automatically and generate high-quality superpixels but the evolution process is time-consuming.
Deep
Learning-based
approach
[6]Coherency
matrix
Deep neural networks are used to extract deep features, and the superpixels are generated by using soft K-means clustering. Still use the clustering technique to generate superpixels.
Table 2. The numerical superpixel generation results on the San Francisco dataset. (↑ means that the larger value is better, and means that the smaller value is better.)
Metric (%)SLICPolSAR-
SLIC
LSCERSPolSAR-
SSN
SFCNPolSAR-
SFCGN
BR67.7362.2385.3685.8080.7871.5197.83
UE33.9926.8334.9439.2525.3028.067.50
CO57.9766.1316.8917.4754.8157.5153.01
Bare soil91.2487.6381.7481.0396.9386.6598.50
Ocean98.2994.8491.8191.9098.1195.6899.81
Urban94.7698.5998.3797.9095.8698.5499.01
Buildings88.5494.4493.9793.4197.1995.4498.04
Vegetation88.3688.3089.0288.5296.9790.7198.57
OA94.3792.9090.8490.3096.1993.0699.13
AA92.2492.7690.9890.5597.5793.4098.79
Kappa89.3091.5889.0687.9696.9790.9398.63
Table 3. The numerical superpixel generation results on the Oberpfaffenhofen dataset (↑ means that the larger the value is better, and means that the smaller the value is better).
Metric (%)SLICPolSAR-
SLIC
LSCERSPolSAR-
SSN
SFCNPolSAR-
SFCGN
BR65.0771.0588.4189.5493.8580.6994.10
UE31.2026.0129.2124.6316.7423.7413.69
CO71.2678.6567.5241.5961.4157.0481.49
Build-up area61.6764.4865.1669.6583.2371.9484.90
Woodland97.1697.5196.9697.3497.4496.5898.52
Open area97.1997.4597.7997.2197.7297.0798.58
OA89.2490.1190.1491.1194.3691.2495.50
AA85.3486.4886.6488.0692.8088.5394.00
Kappa91.8892.6592.6993.9096.8994.1497.01
Table 4. The numerical superpixel generation results on the Xi’an dataset (↑ means that the larger value is better, and means that the smaller value is better).
Metric (%)SLICPolSAR-
SLIC
LSCERSPolSAR-
SSN
SFCNPolSAR-
SFCGN
BR74.9473.2083.9290.1199.5783.7599.68
UE58.5345.2454.3261.1215.5842.398.61
CO61.6773.1239.0423.9556.9058.0783.37
Grass88.7969.8859.3157.4396.9374.4598.41
City92.9690.9989.7389.3698.1191.7399.03
Water85.3892.4093.0789.0895.8693.7297.23
OA89.7589.2187.6585.7797.1990.5898.45
AA89.0484.4280.7078.6296.9786.6498.22
Kappa83.1185.9084.2685.6996.1987.5797.78
Table 5. The numerical classification results on the San Francisco dataset (↑ means that the larger value is better).
Metric (%)PolSAR-CNNSLICPolSAR-
SLIC
LSCERSPolSAR-
SSN
SFCNPolSAR-
SFCGN
Bare soil87.0289.7485.0683.5389.7785.6091.1297.67
Ocean99.8198.3598.5898.2897.9198.6398.5399.76
Urban78.2288.3588.9581.7089.7890.1888.9792.15
Buildings79.3085.4084.1081.5884.8786.0786.7994.73
Vegetation83.7883.1084.2082.6478.8487.7986.8593.64
OA90.1192.1292.0190.0289.4993.0693.0496.77
AA85.6388.9988.1885.5588.2389.6590.4595.59
Kappa92.2786.1887.6483.7484.6189.4188.2796.27
Table 6. The numerical classification results on the Oberpfaffenhofen dataset (↑ means that the larger value is better).
Metric (%)PolSAR-CNNSLICPolSAR-
SLIC
LSCERSPolSAR-SSNSFCNPolSAR-SFCGN
Build-up area79.4672.0872.1664.8175.8377.7373.8782.81
Woodland92.0084.7289.8187.8786.1183.1889.2989.80
Open area93.0896.0295.5296.9696.2296.2596.1496.17
OA89.5187.9488.6687.2889.2489.1789.3391.64
AA88.1884.2785.8383.2186.0585.7286.4489.59
Kappa73.3976.7578.2875.2080.0582.3881.0486.12
Table 7. The numerical classification results on the Xi’an dataset (↑ means that the larger value is better).
Metric (%)PoSAR-CNNSLICPolSAR-
SLIC
LSCERSPolSAR-
SSN
SFCNPolSAR-
SFCGN
Grass83.7469.3980.8325.3781.2390.2981.8890.77
City91.9080.7978.6070.3579.7891.7179.4894.14
Water92.7091.7088.7298.9377.5385.7990.5189.79
OA↑87.9776.7781.2352.3380.1690.1282.3391.81
AA↑89.4580.6382.7264.8879.5189.2683.9691.56
Kappa83.7964.4670.5338.4566.8785.9672.6388.42
Table 8. Time costs of deep learning-based PolSAR superpixel generation approaches.
DatasetsTime CostPolSAR-SSNPolSAR-SFCGN
San Francisco Train time (h)19.0134.303
Test time (s)8.8380.830
OberpfaffenhofenTrain time (h)18.2092.361
Test time (s)7.9420.929
Xi’anTrain time (h)17.8731.984
Test time (s)4.7900.558
Table 9. Time costs of classification in PolSAR-SFCGN and PolSAR-CNN.
DatasetsTime CostPolSAR-CNNPolSAR-SFCGN
San Francisco Train time (s)44.1428.57
Test time (s)130.330.51
OberpfaffenhofenTrain time (s)29.5322.37
Test time (s)84.270.29
Xi’anTrain time (s)14.5212.36
Test time (s)18.290.05
Table 10. t-tests between PolSAR-SFCGN and PolSAR-SSN on the Oberpfaffenhofen dataset. (↑ means that the larger value is better, and ↓ means that the smaller value is better).
MetricsPolSAR-SSNPolSAR-SFCGNp Value
BR↑93.16 ± 0.2993.25 ± 0.410.8082
UE↓15.69 ± 0.5313.96 ± 0.520.0054 *
CO↑67.82 ± 14.7284.42 ± 15.840.0002 *
Build-up area84.15 ± 0.4684.77 ± 0.700.236
Woodland97.36 ± 0.0198.05 ± 0.080.0008 *
Open area97.43 ± 0.0397.76 ± 0.230.1879
OA↑94.79 ± 0.0694.99 ± 0.110.314
AA↑92.71 ± 0.0293.53 ± 0.130.0015 *
Kappa↑96.03 ± 0.2496.54 ± 0.180.1166
* p < 0.05.
Table 11. Numerical results of different classification networks with the superpixels of PolSAR-SFCGN. (↑ means that the larger value is better, and ↓ means that the smaller value is better).
San
Francisco
Bare SoilOceanUrbanBuildingsVegetationOA↑AA↑Kappa↑Parameter
Number(M)
PolSAR-SFCGN97.6799.7692.1594.7393.6496.7795.5996.270.13
DSNet97.4399.9592.4396.5893.7097.2696.0296.780.24
PDAS97.2299.7689.8294.8391.0496.1094.5495.641.01
Oberpfa-
ffenhofen
Build-up AreaWoodlandOpen Area--OA↑AA↑Kappa↑Parameter
number(M)
PolSAR-SFCGN82.8189.8096.17--91.6489.5986.120.13
DSNet79.7285.2595.91--89.8686.9683.700.24
PDAS83.7893.5496.03--92.5291.1287.331.14
Xi’anGrassCityWater--OA↑AA↑Kappa↑Parameter
number(M)
PolSAR-SFCGN90.7794.1489.79--91.8191.5688.420.13
DSNet91.7392.4492.65--92.1292.2888.840.24
PDAS89.3794.8691.29--91.5791.8288.131.95
Disclaimer/Publisher’s Note: The statements, opinions and data contained in all publications are solely those of the individual author(s) and contributor(s) and not of MDPI and/or the editor(s). MDPI and/or the editor(s) disclaim responsibility for any injury to people or property resulting from any ideas, methods, instructions or products referred to in the content.