Article

Monitoring Irish Coastal Heritage Destruction: A Case Study from Inishark, Co. Galway, Ireland

1
The School of Computing and Department of Anthropology, University of Wyoming, Laramie, WY 82071, USA
2
The Department of Anthropology, The University of Notre Dame, Notre Dame, IN 46556, USA
3
School of Archaeology, University College Dublin, D04 C1P1 Dublin, Ireland
4
Independent Researcher, H91 V12K Inishbofin, Ireland
*
Author to whom correspondence should be addressed.
Remote Sens. 2025, 17(15), 2709; https://doi.org/10.3390/rs17152709
Submission received: 24 April 2025 / Revised: 25 July 2025 / Accepted: 26 July 2025 / Published: 5 August 2025

Abstract

Coastal erosion poses an acute threat to cultural heritage resources, particularly in island contexts where erosional and degradational threats can be amplified by increased exposure and sea-level changes. We present a generalizable, best-practice approach that integrates multi-temporal, multi-resolution, and inconsistently ground-controlled data to demonstrate how suites of remotely sensed data can be integrated under real-world constraints. This approach is used to conduct a longitudinal analysis of cultural resources on the island of Inishark, Western Ireland. Results show evidence of significant and potentially accelerating shoreline erosion and structural loss within the past century, with rates of erosion ranging from 0.15 to 0.3 m/year along shorelines and 3–5 m2/year for structures. Outcomes demonstrate the utility and importance of an integrative data approach for cultural resource management.

1. Introduction: Coastal Erosion and Remote Sensing as a Cultural Heritage Management Tool

Coastal erosion poses an acute threat to cultural heritage resources, particularly in island contexts where sea-level changes and high-energy storms can result in coastal flooding and massive erosional events. The threat of coastal erosion on cultural resources has been observed globally [1,2,3,4,5], as well as regionally across Ireland and Britain [6,7,8]. Ultimately, the protection and management of cultural and heritage resources is focused on multiple interwoven objectives—identifying and describing cultural heritage on the ground, identifying and assessing threats to cultural heritage, considering the value(s) of cultural resources, making decisions about what to protect, and executing a plan for managing that protection [9]. This task has become more complicated and intensive as the scope of archaeological inquiry, and the regulations governing the protection of heritage resources, has increased [10]. As a result, Cultural Resource Management (hereafter CRM) has become a time- and cost-intensive activity, usually involving long-term documentation of cultural resources and, in many instances, some form of ongoing monitoring. Customarily, monitoring has been—and continues to be—undertaken by archaeologists through site visitation and reflection upon how the current conditions contrast with historical observations, such as the degree of surface disturbance or coastal erosion. Increasingly, however, archaeologists and cultural resource managers can rarely meet these objectives given fiscal and personnel limitations. Therefore, it is imperative that we make efficient use of modern technologies to fulfill the demands of monitoring risks to cultural heritage sites.
Over the past several decades, remote sensing technologies have become increasingly cost effective and archaeologists have become adept users, pioneering captivating applications of platform and sensor technologies to better understand the human past [11,12,13]. While some of the most popular applications leverage remote sensing to detect new archaeological sites [14,15,16,17,18], remote sensing also represents a critical opportunity for managing known cultural heritage resources. These opportunities are highlighted by the increasing availability of publicly accessible remote sensing. While these data are valuable resources, they are gathered under diverse research objectives with different sensors, forms of ground control, and study applications. Therefore, under the real-world constraint of increasing risks to cultural resources and disparate, but valuable suites of remotely sensed data, it is critical to develop best-practice approaches for integrative, applied research.
To demonstrate the utility of remote sensing for CRM, we employ a suite of historic, archaeological, and remotely sensed data to document the destruction of known cultural heritage in a historic village on the island of Inishark, Co. Galway, Ireland. Through this case study, we demonstrate that even when conducted through a non-systematic research design, remote sensing can prove invaluable insights for monitoring and managing heritage resources. Combining historical data, photogrammetry, and LiDAR, we illustrate how remote sensing provides insights on the rate and severity of coastal erosion.
The island of Inishark (Figure 1), County Galway, is located nearly 12.9 km (8 mi) from mainland Ireland and is one of a series of coastal islands along the shores of north-western Galway. Geographically, the island is approximately 2.5 km long east–west and no more than 1.2 km wide from north to south. Rising from the lower, and more protected, southern and eastern sides of the island to cliffs of at least 100–150 m in height along the western and northern sides, the entirely treeless island exists as an exposed and challenging location for human occupation.
Due to topographical and environmental constraints—wind exposure, uneven ground, and variable soil quality—the majority of human habitation was located on the southeastern end of Inishark (Figure 1 and Figure 2). Occupation began at least in the Early Bronze Age, with extensive archaeological remains from the 7–13th centuries, significantly less from the 13–17th centuries, and then again extensive archaeological remains from the 18–20th centuries. During the latest phase of occupation, from the 1780s to 1960, the settlement was concentrated in a village that was home to upwards of 250 people in the 1840’s [19]. In October 1960, the last inhabitants left Inishark. Today, Inishark contains a palimpsest of cultural resources that range from buried cultural heritage deposits from the Bronze Age to monuments from an early medieval ecclesiastical settlement, to around 40 standing dry-laid stone buildings that represent the latest phase of occupation [19]. Although access to Inishark remains possible, the remote location, weather conditions with high winds and rain, and the cost and logistics of in-person site revisitation make attempts to monitor and manage cultural resources on Inishark difficult. At the same time, however, remote sensing allows researchers to conduct condition assessments of cultural resources across the island. When collected longitudinally, these data help us better understand the rate of coastal erosion on Inishark, the linkages between the destruction of high-risk coastal cultural heritage on Inishark and winter storms, and advance conversations about how to protect and manage Irish coastal heritage in general.

2. Materials and Methods

Since 2008, members of the Cultural Landscapes of the Irish Coast research project (CLIC) have witnessed the destruction of abandoned historical buildings and shoreline areas on Inishbofin, Inishark [20]. Furthermore, Achill Island on the west coast of Ireland has been confronted by the episodic destruction of cultural heritage along coastal settings. Using Inishark as a case study to understand the deterioration and destruction of cultural heritage, we employed three remotely sensed datasets—LiDAR, photogrammetry, and satellite imagery—to consider multiple case study locations. Data from these areas were gathered over different years, had variable resolutions, and were gathered to fulfill different research objections. In conjunction with historical maps and ground photography, these data provided a foundation for understanding some dimensions of the destruction of cultural heritage on Inishark and the implication for future deterioration.
In a perfect world, remote sensing for CRM would involve a systematic long-term program of remote surveys that use the same platforms, sensors, fixed ground-control points, and pre- and post-processing procedures to image cultural resources. Gathering data through such a program would mean any variance between surveys could be confidently attributed to changes in cultural resources rather than differences in data collection. In most instances, however, archaeological remote sensing falls short of this type of experimental control, usually due to budgetary limitations and complex or challenging field environments. Moreover, as in many other archaeological projects, our CLIC research is primarily focused on documentation of cultural heritage through archaeological excavation, with our study of coastal erosion and deterioration of standing architecture being secondary.
While the challenge of meeting experimental standards is an important obstacle that requires continued attention, it does not mean that archaeologists are unable to make effective use of remote sensing. Rather, archaeological remote sensing should (and does) embrace a “best-case-manageable” approach, which usually involves aggregating data collected at different times, with different sensors, and variable ground control [15,21,22]. In such a context, the methodological aim is to collect longitudinal data of cultural resources, link these data to specific, measurable events that impact resources, and develop management plans to minimize future impacts. In this paper, we outline how we have employed this strategy (e.g., tying together multi-sensor, multitemporal datasets) to document on-going coastal erosion on the island of Inishark and assess future threats to cultural resources. The data used in this study included airborne LiDAR, uncrewed aerial system (UAS) photogrammetry, satellite imagery, and historic maps.
Airborne LiDAR was conducted by BK-Fugro during a single flight (350 m altitude) in 2010 using a FLI-MAP 1000 system. The LiDAR data were acquired at a resolution of 4–20 pts/m2 and processed by Anthony Corns of the Discovery Programme to create a digital surface model (DSM) with a resolution of approximately 16 ppm2 (~25 cm). Given sparse vegetation and clear visualization of the built environment, ground points were not classified. The UAS photogrammetry was acquired on 9 July 2018, using a DJI Mavic with a 1/2.3″ CMOS sensor (12 megapixels) via three automated flights flown at an altitude of 50 m. Given its ease of use, Pix4D mapping software was used to transform aerial photographs (n = 636) into an orthomosaic and DSM with a resolution of 1.94 cm. The Pix4D workflow involved creating tie points and a densified point cloud with full-scale images and creating the orthomosaic and/or DSM using noise filtering, surface smoothing, and inverse distance weighting. To expand the temporal depth of comparative data, static images of satellite imagery from 2010, 2015, 2019, 2021, and 2023 were accessed in Google Earth Pro [23,24], and historic maps from 1838 and 1898 were digitized [25].
The LiDAR-based DSM, photogrammetric outputs, satellite images, and historic maps were integrated by creating cross-referential tie points and using these tie points to co-register survey products. This process began by co-registering the two highest resolution datasets: the LiDAR-based DSM and the UAS imagery. To begin with, six locations were established from easily recognizable features within the LiDAR-based DSM and used as post hoc tie points. Each LiDAR-derived tie point was tagged to 2–10 UAS photographs (mean = 6 photographs/tie point), enabling the photogrammetric outputs to be co-registered against the LiDAR survey. It was not possible to conduct a more rigorous data integration approach, such as co-registering point clouds, which has been effective for heritage management [26,27,28,29], because the point cloud data derived during the LiDAR survey were not available.
Variance between detected locations across datasets was measured by deriving an additional series of easily recognizable points within both LiDAR and UAS outputs. The distances between these locations was measured (in cm) and tabulated to calculate the root-mean-square error (RMSE) between datasets (Table 1). Critically, this measure was used to evaluate the difference in object locations between pairs of remotely sensed data and not the difference between real-world objects and a single remotely sensed data element. Consequently, the RMSE reported in Table 1 should be interpreted as the associated error in measuring distances between shared locations across datasets and is thus potentially additive to the native spatial resolution and error of each individual remotely sensed dataset.
Following co-registration of the LiDAR and photogrammetric data, satellite images and historic maps were co-registered against the LiDAR data using the LiDAR-based tie points. Specifically, the six tie points used for LiDAR-to-photogrammetric co-registration were used as tie points for manually georeferencing the static satellite images and historic maps in QGIS [30]. Through this process, all data were co-registered against the LiDAR data. Following georeferencing, the RMSEs between all remaining pairs of remotely sensed data were measured (Table 1). Due to a change in the extents of compared data, the number of locations used to measure RMSE between each pair of data varied. Additionally, given the lack of undiagnostic features in the 1838 map, the RMSE could not be calculated. The 1838 map, however, was the least accurate in relation to other remotely sensed data
Once co-registered, features of interest, such as the island shoreline, were hand digitized as vector objects in QGIS. The shoreline was annotated from five datasets: the 1838 and 1898 historic maps, the 2010 LiDAR DSM, 2018 photogrammetric DSM, and the 2023 satellite imagery. In the 1838 map, the shoreline was clearly delineated as a solid black line. Although a similar symbology was used in the 1898 map, the solid black line was accompanied by a series of dashed lines (potentially indicating areas of undercutting, exposed cliff bands, or similar shoreline feature) that made it more difficult to discern the true shoreline. In both instances, the solid black line was traced with relative confidence as the location of the shoreline at that point in time. For the 2010 LiDAR and 2018 photogrammetric data, 10 cm contour lines were derived in QGIS for each study area, and the densest concentration of contours that could be traced along the extent of the islands’ edge were extracted. The mean line for each group was isolated to delineate the shoreline. This approach was used rather than isolating the 0 m contour because of imperfect ground control and because the 0 m contour line did not consistently correspond to the water’s edge. This is particularly true near cliffs, where the island’s edge could sit several meters above a steep drop-off to sea level.
Using the same process for the 2010 and 2018 DSMs ensured that the shoreline could be independently identified for each year. Fortunately, the 2010 and 2018 shorelines often had very similar elevations. Consequently, it was possible to measure horizontal changes in shorelines with relative confidence that changes were not being inflated, by comparing two dramatically different elevation profiles (e.g., comparing 2 m above sea level versus 20 m above sea level). For example, in study area #4, 19 contours were extracted from the LiDAR DSM, representing elevation from 3.6 to 5.3 m, and the 4.6 m elevation line was used to indicate the shoreline. Alternatively, 49 contour lines were extracted from the photogrammetric DSM, representing elevation from 2.2 to 7.0 m, and the 4.5 m elevation line was used to indicate the shoreline.
The 2023 shoreline was annotated by manually altering the 2010 LiDAR shoreline where field observations and 2023 satellite imagery indicated changes in the shoreline location. Finally, to place all of these materials into a physical context, we drew upon traditional archaeological datasets, including field surveys of key areas and terrestrial photography, to document changing shorelines and landscapes.

3. Results: Significant Shoreline Retreat and Structural Loss Since the 1920s

As outlined elsewhere [19], today the village of Inishark is characterized by around 40 standing buildings, constructed and used between the 1780s and the 1950s, including residential buildings, outbuildings, two schools, and a church. Residential architecture built before 1910 typically contained two rooms, was constructed with dry-stone construction, bonded walls, and the roofs thatched with organic materials. Buildings constructed after 1910 typically had more rooms, at least one chimney, and were built with a combination of gravel, concrete, and tile roofs. Buildings constructed in the 1930s as part of the Gaeltacht development were constructed with stone-built walls and concrete, had multiple rooms, and tile roofs. Historic photographs detail a relatively rapid degradation of standing architecture after occupation had ended. By 1980, all pre-1910 structures had lost their thatch roofs due to wind, rain, and rotting of timbers, yet many of the walls remained standing with minimal leaning. Alternatively, post-1910 structure roofs lasted 50–60 years whereas interior and exterior walls, which were rarely bonded during construction, are in much worse shape than the pre-1910 buildings. In some cases, entire post-1910s buildings have fallen down.

3.1. Study Area #1 and #2

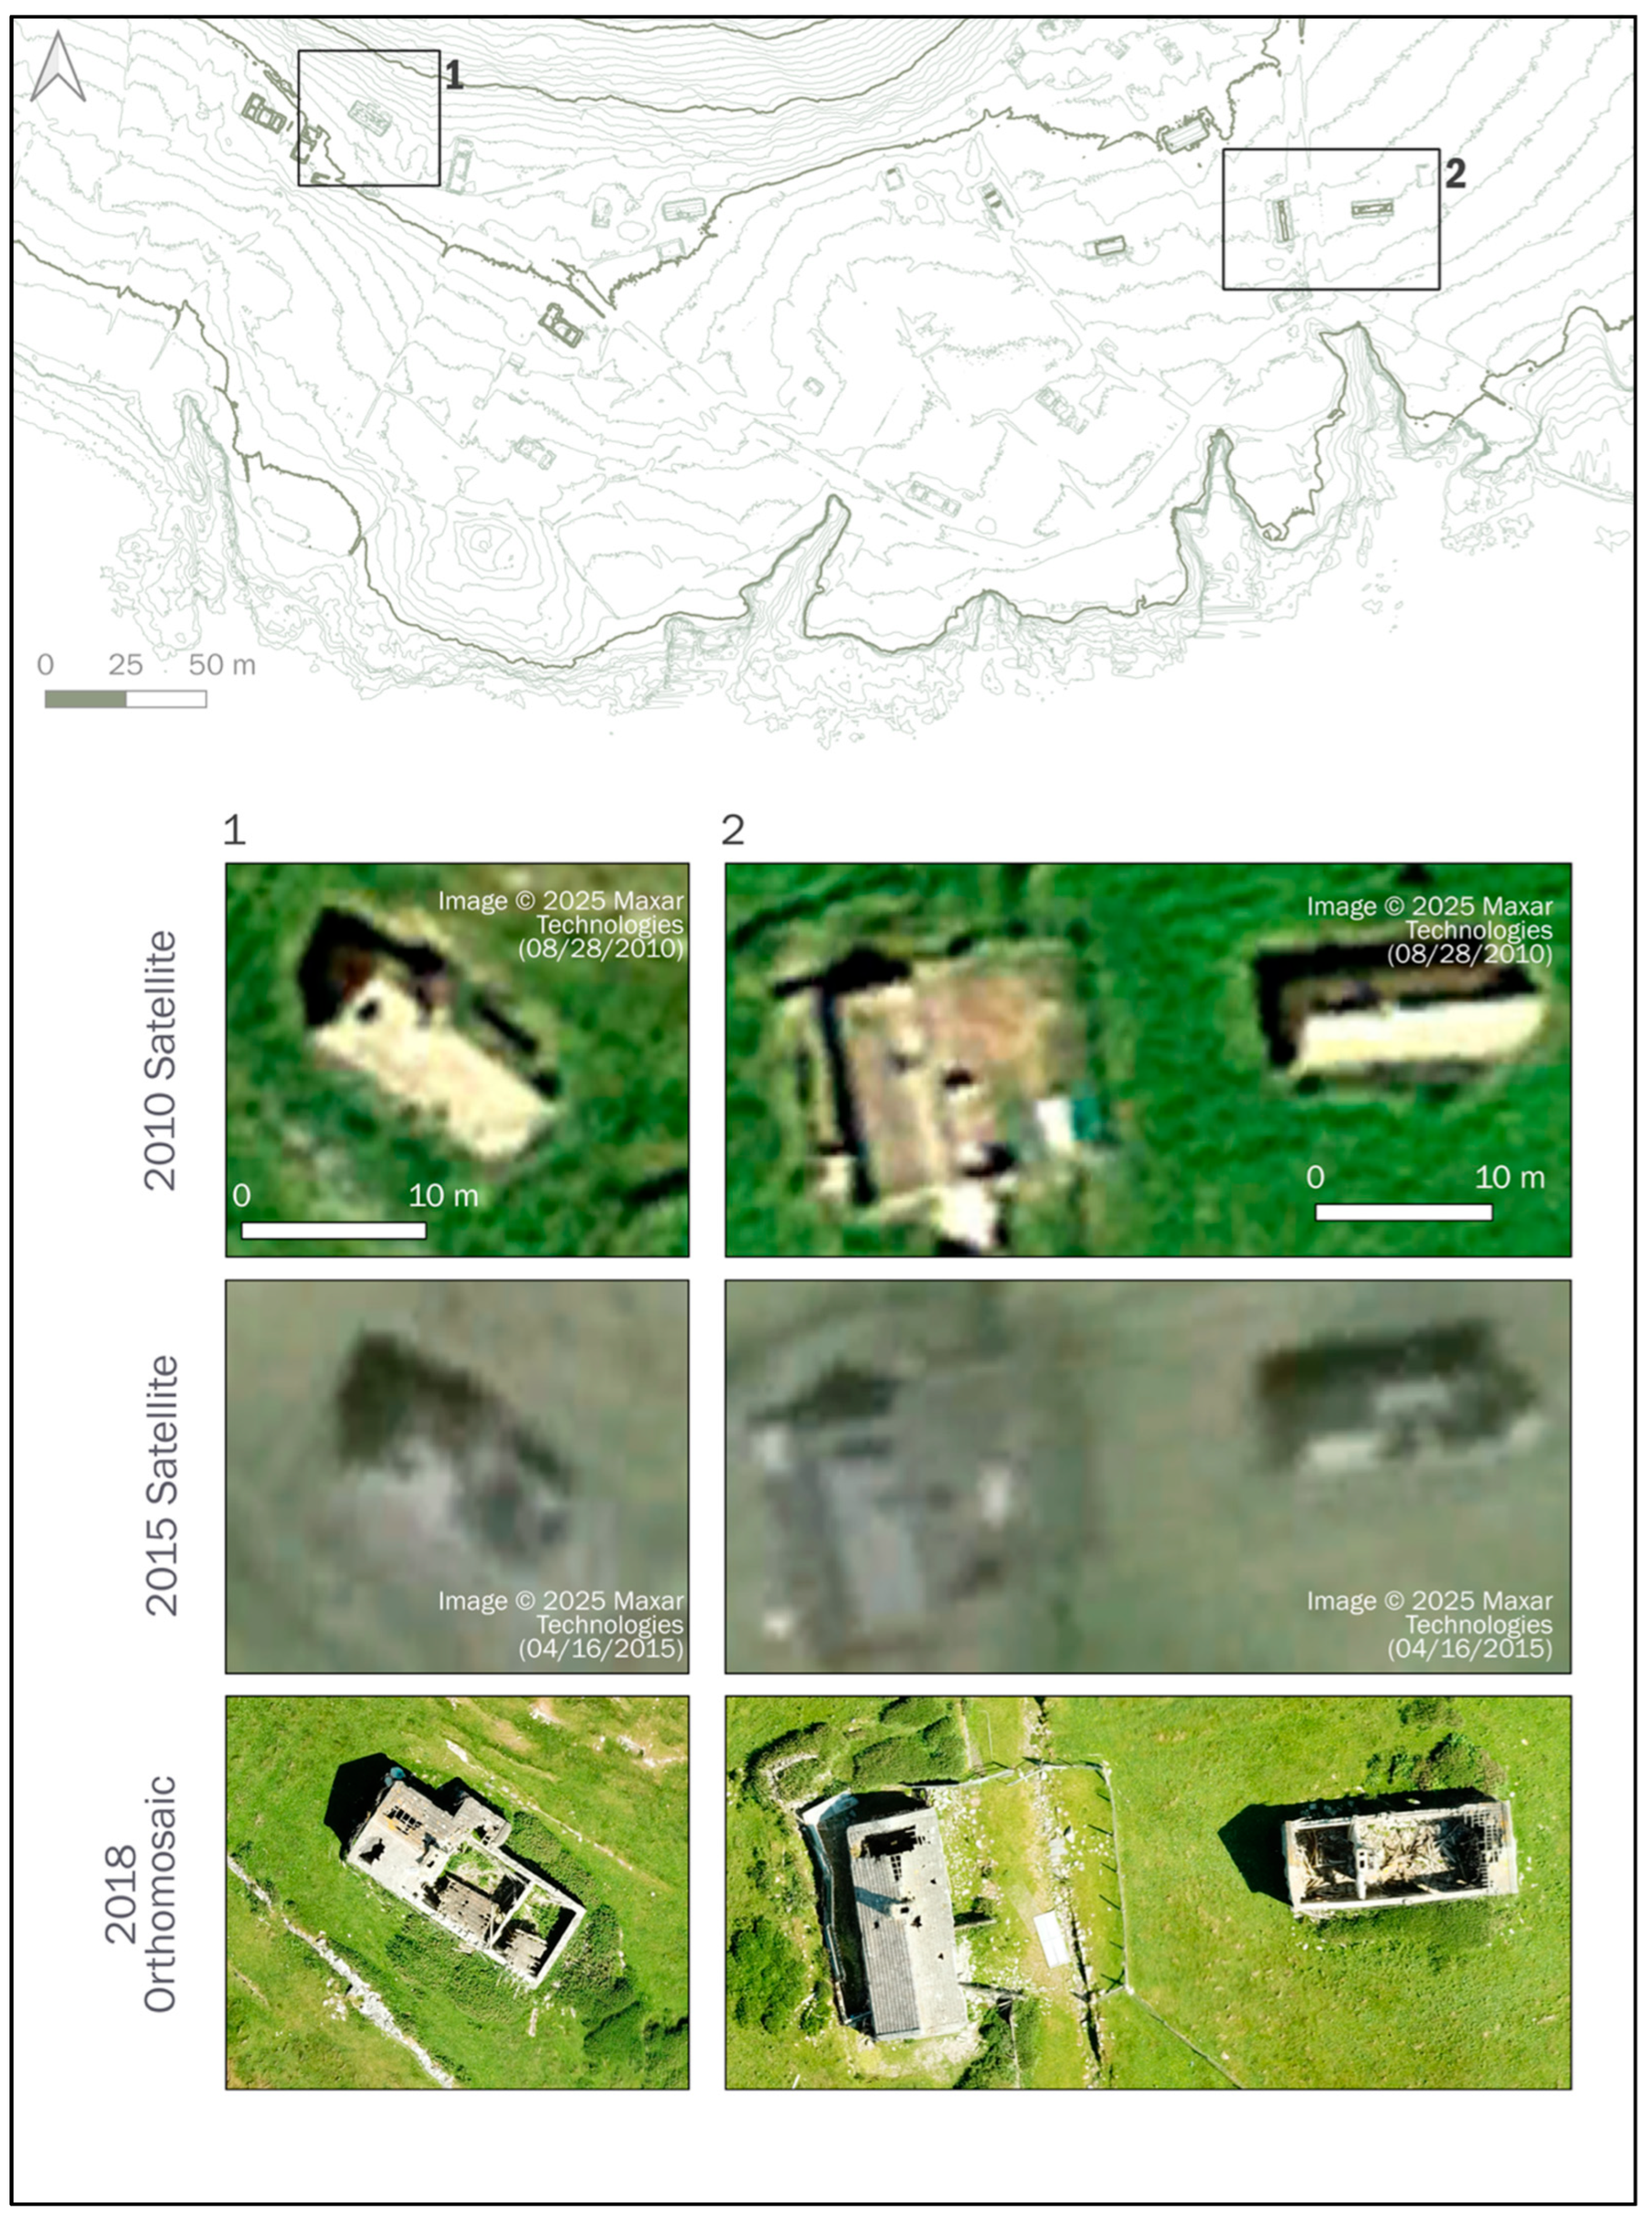
To illustrate ongoing degradation of standing architecture, we focused on two portions of the village, one along the northwestern extent of Inishark village (study area #1, Figure 1) and one along the eastern central portion of the village (study area #2, Figure 1). In both study areas, comparison of 2010 LiDAR, 2015 satellite imagery and 2018 photogrammetry shows post-1910 structures have had considerable portions of their roof collapse relatively rapidly. A four-room structure in study area #1 experienced partial roof collapse in each room, losing ~30 m2 of a ~65 m2 roof area (Figure 2; inset 1). Two buildings on the eastern edge of the village show a greater diversity of collapse: one structure experienced near total roof collapse (~85% collapse of roof area) and the other experienced only minor collapse (~7% collapse of roof area; Figure 2; inset 2). In both areas, 2015 satellite imagery suggests partial-to-full roof collapse can occur in as little as five years. In most of these cases deterioration of roof timbers often occurs along the roofline, adding pressure to long walls of the building, accelerating the rate at which exterior walls pull away from unbonded interior walls.
While wind, rain, and insects have degraded standing architecture in Inishark, it is largely the actions of waves, wind, and seasonal storms that have eroded or buried resources along the shoreline. As outlined by Met.IE, storms along Western Ireland most frequently occur in January or February (Table 2). To learn more about the mechanics and rate of coastal erosion, we employed aerial and satellite imagery, LiDAR, and historic maps for three study areas over at least a 15-year period. Although 15 years represent an admittedly short study period, insights allowed us to estimate the history, rate, and future impact of shoreline erosion. We focused on three portions of the shoreline, two along the southern shore of Inishark village (study area #3; and #4; Figure 1) and one along the eastern shore of the island (study area #5; Figure 1).

3.2. Study Area #3: Owenleough, a 60 m Long Inlet, South Side of Inishark

Owenleough, or alternatively Ooghleough or Fó Leo, means “St Leo’s Cove” [31]. The inlet is just east of an early medieval hermitage shrine that contains a stone hut known as Clochán Leo (“St Leo’s Stone Dwelling”) [32]. The cove is accessible from the eastern cliff edge of the inlet. Until the 20th century, a shelf along this cliff edge contained a spring well and a holy well dedicated to St Leo [33]. Islanders in the 19th and 20th centuries visited this holy well in annual celebrations of St Leo’s Day (11 April), as well as to seek cures or render curses [33]. Folklore and oral historic accounts from the 20th century recall a low stone wall surrounding the holy well, as well as the presence of small objects (hairpins, buttons, and coins) deposited by pilgrims [34]. Likely due to wind and water erosion, as well as a lack of maintenance, there are now no traces of any of these features. Only the general area of the natural spring is apparent.
Depending upon the wind and wave direction with winter storms, coastal erosion becomes magnified in conditions where there is limited bedrock deposits or preexisting inlets along the shoreline. Today, Owenleough is a 60 m long inlet facing southwest (Figure 3). Comparison of the hand-drawn map from 1898, the 2010 LiDAR DSM, and the 2018 photogrammetric DSM illustrates that inlet erosion has totaled 17.2 m between 1898 and 2010 (~0.15 m/year) and another 1.9 m between 2010 and 2018 (~0.23 m/year; Figure 3).
While the historic map is an imperfect measure of the actual shoreline in 1898, these changes suggest that shoreline erosion over the past century has been severe. Likely, the erosion of inlets was episodic and associated with channeling of wave and wind action that expanded the channel during specific high-energy storms [35,36]. In the case of Owenleough, we believe that the erosional expansion of the inlet over 130 years is probably the byproduct of five or six major winter storms with wave and wind oriented to the northeast, rather than from gradual, low-energy erosion taking place each year. Whatever the erosional mechanism or tempo (episodic or gradual), there is no question that future coastal erosion poses a major risk to build cultural heritage on Inishark. However, because we were unable to accurately measure the erosional tempo, it was difficult to project and plan for future impacts, which is critical for heritage management.
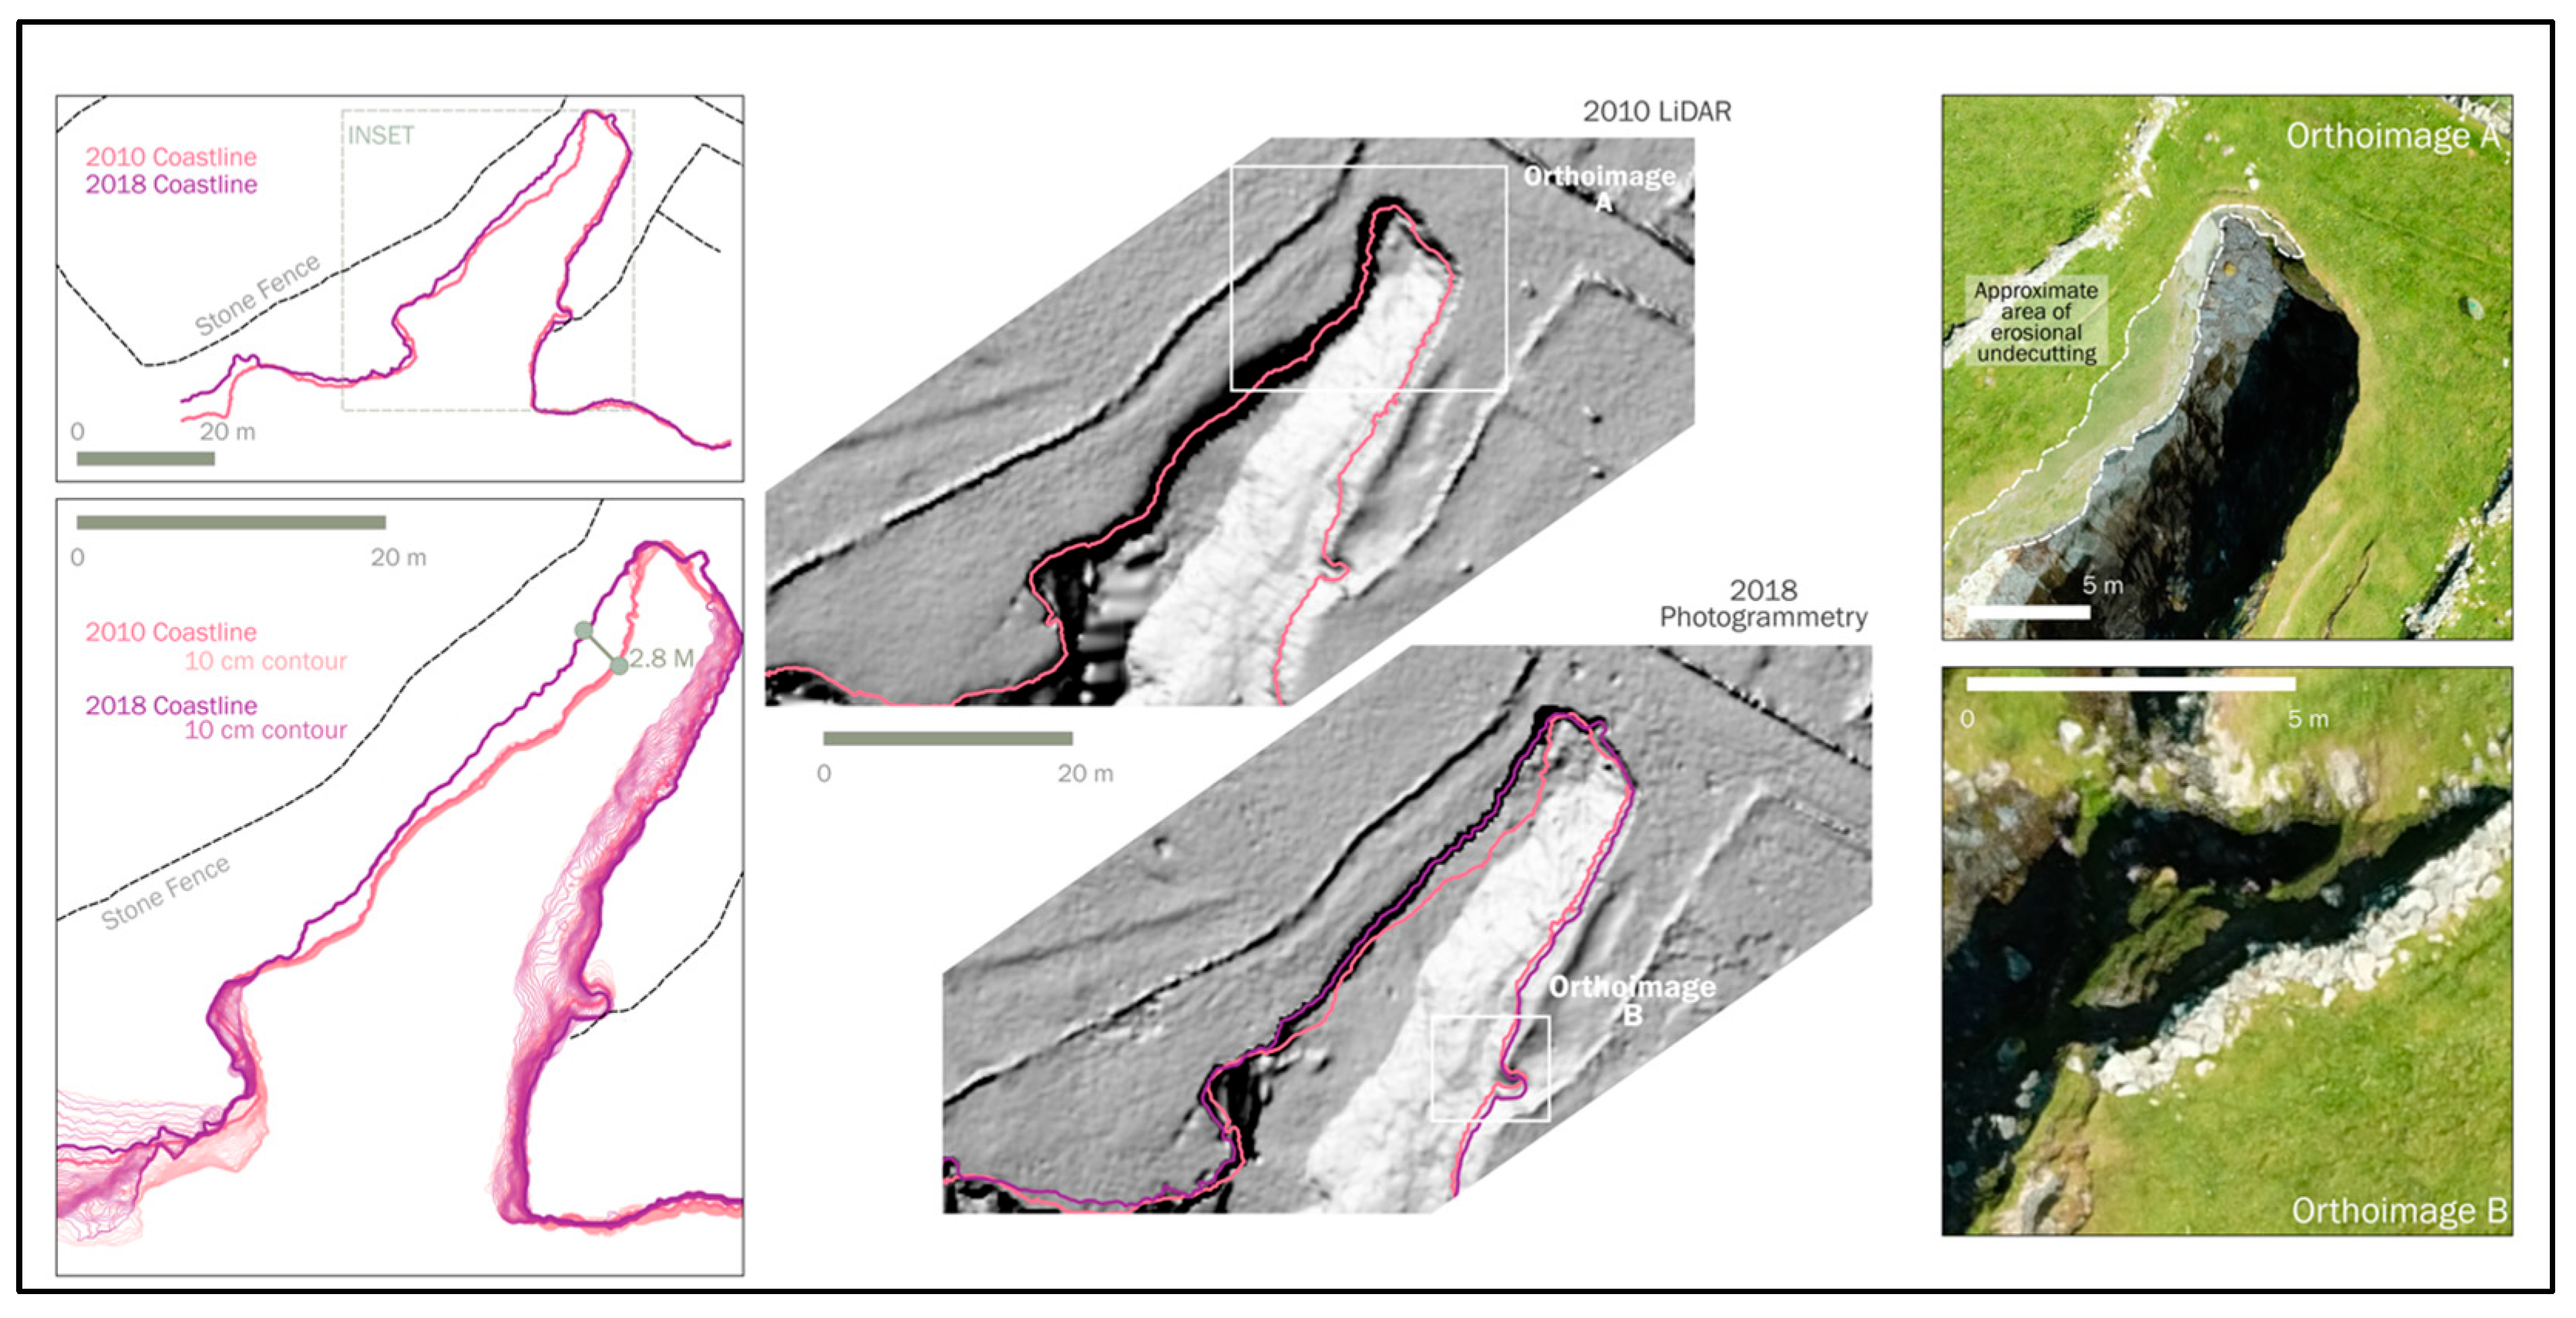
Therefore, we projected future erosion by calculating the erosional rate as the distance between the shoreline at two points in time divided by the number of years between the two points of measure and projected this rate of erosion into the future. Therefore, assuming erosion in the next 35 years remains at a year-to-year rate similar to that of the past century, the NW–SE-oriented wall that lies ~7 m NE of the inlet of Owenleough is likely to be destroyed within the next 35 years. A more detailed comparison of shoreline erosion between the 2010 LiDAR and 2018 photogrammetry show the northwestern shoulder of the inlet deteriorated at the fastest rate, leading to shoreline erosion of ~0.35 m/year (Figure 4). Importantly, an approximately parallel, 80 m stretch of dry-laid stone wall lies only 3–6 m away from the contemporary edge of the inlet. If shoreline erosion continues at a pace of 0.35 m/year, much of this feature will be lost within the next two decades. The 2018 aerial imagery also details ongoing collapse of walls into the inlet (Figure 4).

3.3. Study Area #4: Oughabath Inlet and the Inishark Cemetery

Similar to the physical setting of Owenleough, Oughabath is a large, north–south-oriented inlet that is actively eroding. The placename was alternatively transcribed by John O’Donovan in 1838 as Uaimh an Bháid, “the cave of the boat” [31]. Oral history recalls that this area was an earlier and alternative landing place to the next inlet east, simply called “Port.” Pier infrastructure, including a slipway and breakwater, was constructed in Port initially in the 1870s [19]. The breakwater is now heavily damaged, and the concrete pier almost totally destroyed.
On the cliff that separates Oughabath and Port is a multi-period cemetery (Figure 5), defined by a stone wall on its northern side and elsewhere by the erosion of the cliff edge, which drops 6–7 m to the highwater mark along the rocky coastline. Human skeletal material, from both adults and sub-adults, is actively eroding from the cliff face and have been observed since initial fieldwork in 2008.
Grave settings visible on the surface are comprised of rectangular cairns of stone, typically with unworked head and footstones. Based upon visible grave settings and the interpretation of surface topography, a survey in 2014 estimated 66 grave settings in the cemetery. This is certainly an underestimate of the total number of burials, given that skeletal material and grave fixtures visible in the cliff face cannot always be identified with a corresponding stone setting on the surface. Moreover, islanders are likely to have re-used grave settings multiple times, as is still customary for family graves in the cemetery on nearby Inishbofin.
The historic origins and original extent of the cemetery on Inishark are difficult to estimate. Folklore accounts from the 19th and 20th century suggest that the cemetery was used rarely, particularly for young children or people who died when weather prevented transport to the parish church and burial ground on the nearby island of Inishbofin [34]. MacLoughlin estimated the areal extent of the cemetery in 1942 at one-eighth of an acre.
It is likely that villagers in the 19th and 20th century were re-using a pre-existing burial ground that was founded during the island’s ecclesiastical occupation. Other islands with monastic settlements—including nearby Omey Island—include coastal cemeteries with remains of children, women, and men that were buried across multiple phases in the early medieval and medieval periods [37,38,39]. The cemetery on Inishark might likewise have served as a cemetery for lay people affiliated with Inishark’s monastic community in the early medieval–medieval period. One carved stone cross and one cross-slab used as headstones in the cemetery are consistent with styles of medieval carved stone craft. In 2016, a sample of oak charcoal was taken from a 110 cm long burnt deposit visible in the eroding profile of the cliff edge. This deposit was 110 cm below the ground surface and stratigraphically below all visible burials. The calibrated date of 1023–1160 CE (UBA—36,756; 943 +/− 33 BP) from the sample suggests that in this area at least, people were burying their dead in the cemetery sometime after the mid-11th century.
As the southern boundary of the cemetery is defined today by the erosion of the cliff face, it is possible that its original extent was much greater and that a significant number of burials have been lost with the erosion of the coast from the medieval period onwards. Differences between the 2010 LiDAR DSM and 2018 photogrammetric DSM show a range in horizontal shoreline shift, from a minimum change of ~2 m to a maximum of ~3 m, indicating a maximum erosional rate similar to other areas of Inishark (~0.27 m/year; Figure 5). At this rate, the entire cemetery will likely be lost within three-to-four decades. This estimate, however, seriously underestimates the rate of erosion, and more importantly, the clear risk that much of this cemetery could be destroyed within the next 10 or so years by a single winter storm, such as the one seen in 2014. Given that both the 2010 LiDAR and 2018 photogrammetric surveys were conducted largely through nadir surveys, some of the topographic variability—and the erosional threats of the study area—are poorly captured in available remote sensing. Ground survey and terrestrial photography reveal a far greater rate of erosion. A series of undercut areas, one of which is a large tunnel that goes from the south to the western end of the cemetery, undercuts much of the remaining promontory (Figure 5). This has created a situation where nearly a >100 m2 surface area of the cemetery (~50% of the total feature) with likely more than 100 burials from multiple time periods is now undermined by a large tunnel. It is impossible to quantify when the tunnel was initially formed. Based on annual observations of the cemetery, however, it is clear that at least 2 m have been washed away on the western, southern, and eastern margin between 2010–2023 (~0.15 m/year), and probably that both the western and southern tunnel entrances have expanded by 30–50%, posing an immediate threat to the cemetery.

3.4. Study Area #5: Donnenna Pisha (Promontory Fort)

In contrast to our analysis of Owenleough and Oughabath, research of Donnenna Pisha demonstrates the extent to which winter storms have the potential to destroy cultural heritage along an intact, continuous coastline. On the eastern shores of Inishark is Donnenna Pisha, a promontory fort probably dating to the Iron Age or early medieval period [38]. Irish promontory forts are settlements that use ditches or ramparts of earth or stone to enclose areas along coastlines, particularly atop promontories, cliff edges, bluffs, or peninsulas [40]. Whether used for defense, refuge, or to monitor sea traffic, they often afford prominent views across waterways while being themselves conspicuous landmarks from the water.
Today, Donnenna Pisha is exposed to the sea on its eastern side and on the western side is separated from the coast of Inishark by an inlet that can be traversed only at low tide. Remnants of a ditch and rampart are still visible on the southern end of the site (Figure 6). These enclosing features must once have been much more extensive and indicate the considerable extent of erosion that has taken place since its heyday. The placename of the site recorded in the 19th century hints that the separation between the fort and coastline of the island is of some antiquity. Mac Gabhann interprets the placename recorded in 1838 as Dúinín na Pise, “the little fort of the chasm,” likely a reference to the cleft between the coastline and the fort.
Although it is not possible to document how much Donnenna Pisha has been eroded since it was first constructed the 1838 map, the 2010 LiDAR, and 2023 satellite imagery suggest that the islet shrank from 1100 m2 in 1838 to 570 m2 in 2010 and 495 m2 by 2023. Much of the erosion has occurred along the eastern face of the promontory fort. The minor gap between Donnenna Pisha and the rest of Inishark has also deteriorated (Figure 7). While the historic map may contain minor mapping errors, and satellite images are an imperfect way of measuring the extant shoreline, available data suggest that land loss has occurred at a rate of ~3 m2/year from 1838 to 2010, and a much faster rate of about 5.75 m2/year between 2010 and 2023. The long-term erosional rates is, of course, an averaging of many years when winter storms come from the northwest, and then occasional years when winter storms come from the east, driving high tides into the cliff face to create significant erosion. At the current rates of erosion, Donnenna Pisha will be destroyed within a hundred years, and potentially within the next 20 years.

4. Discussion: The Importance of Integrated Remote Sensing in Proactive Heritage Management

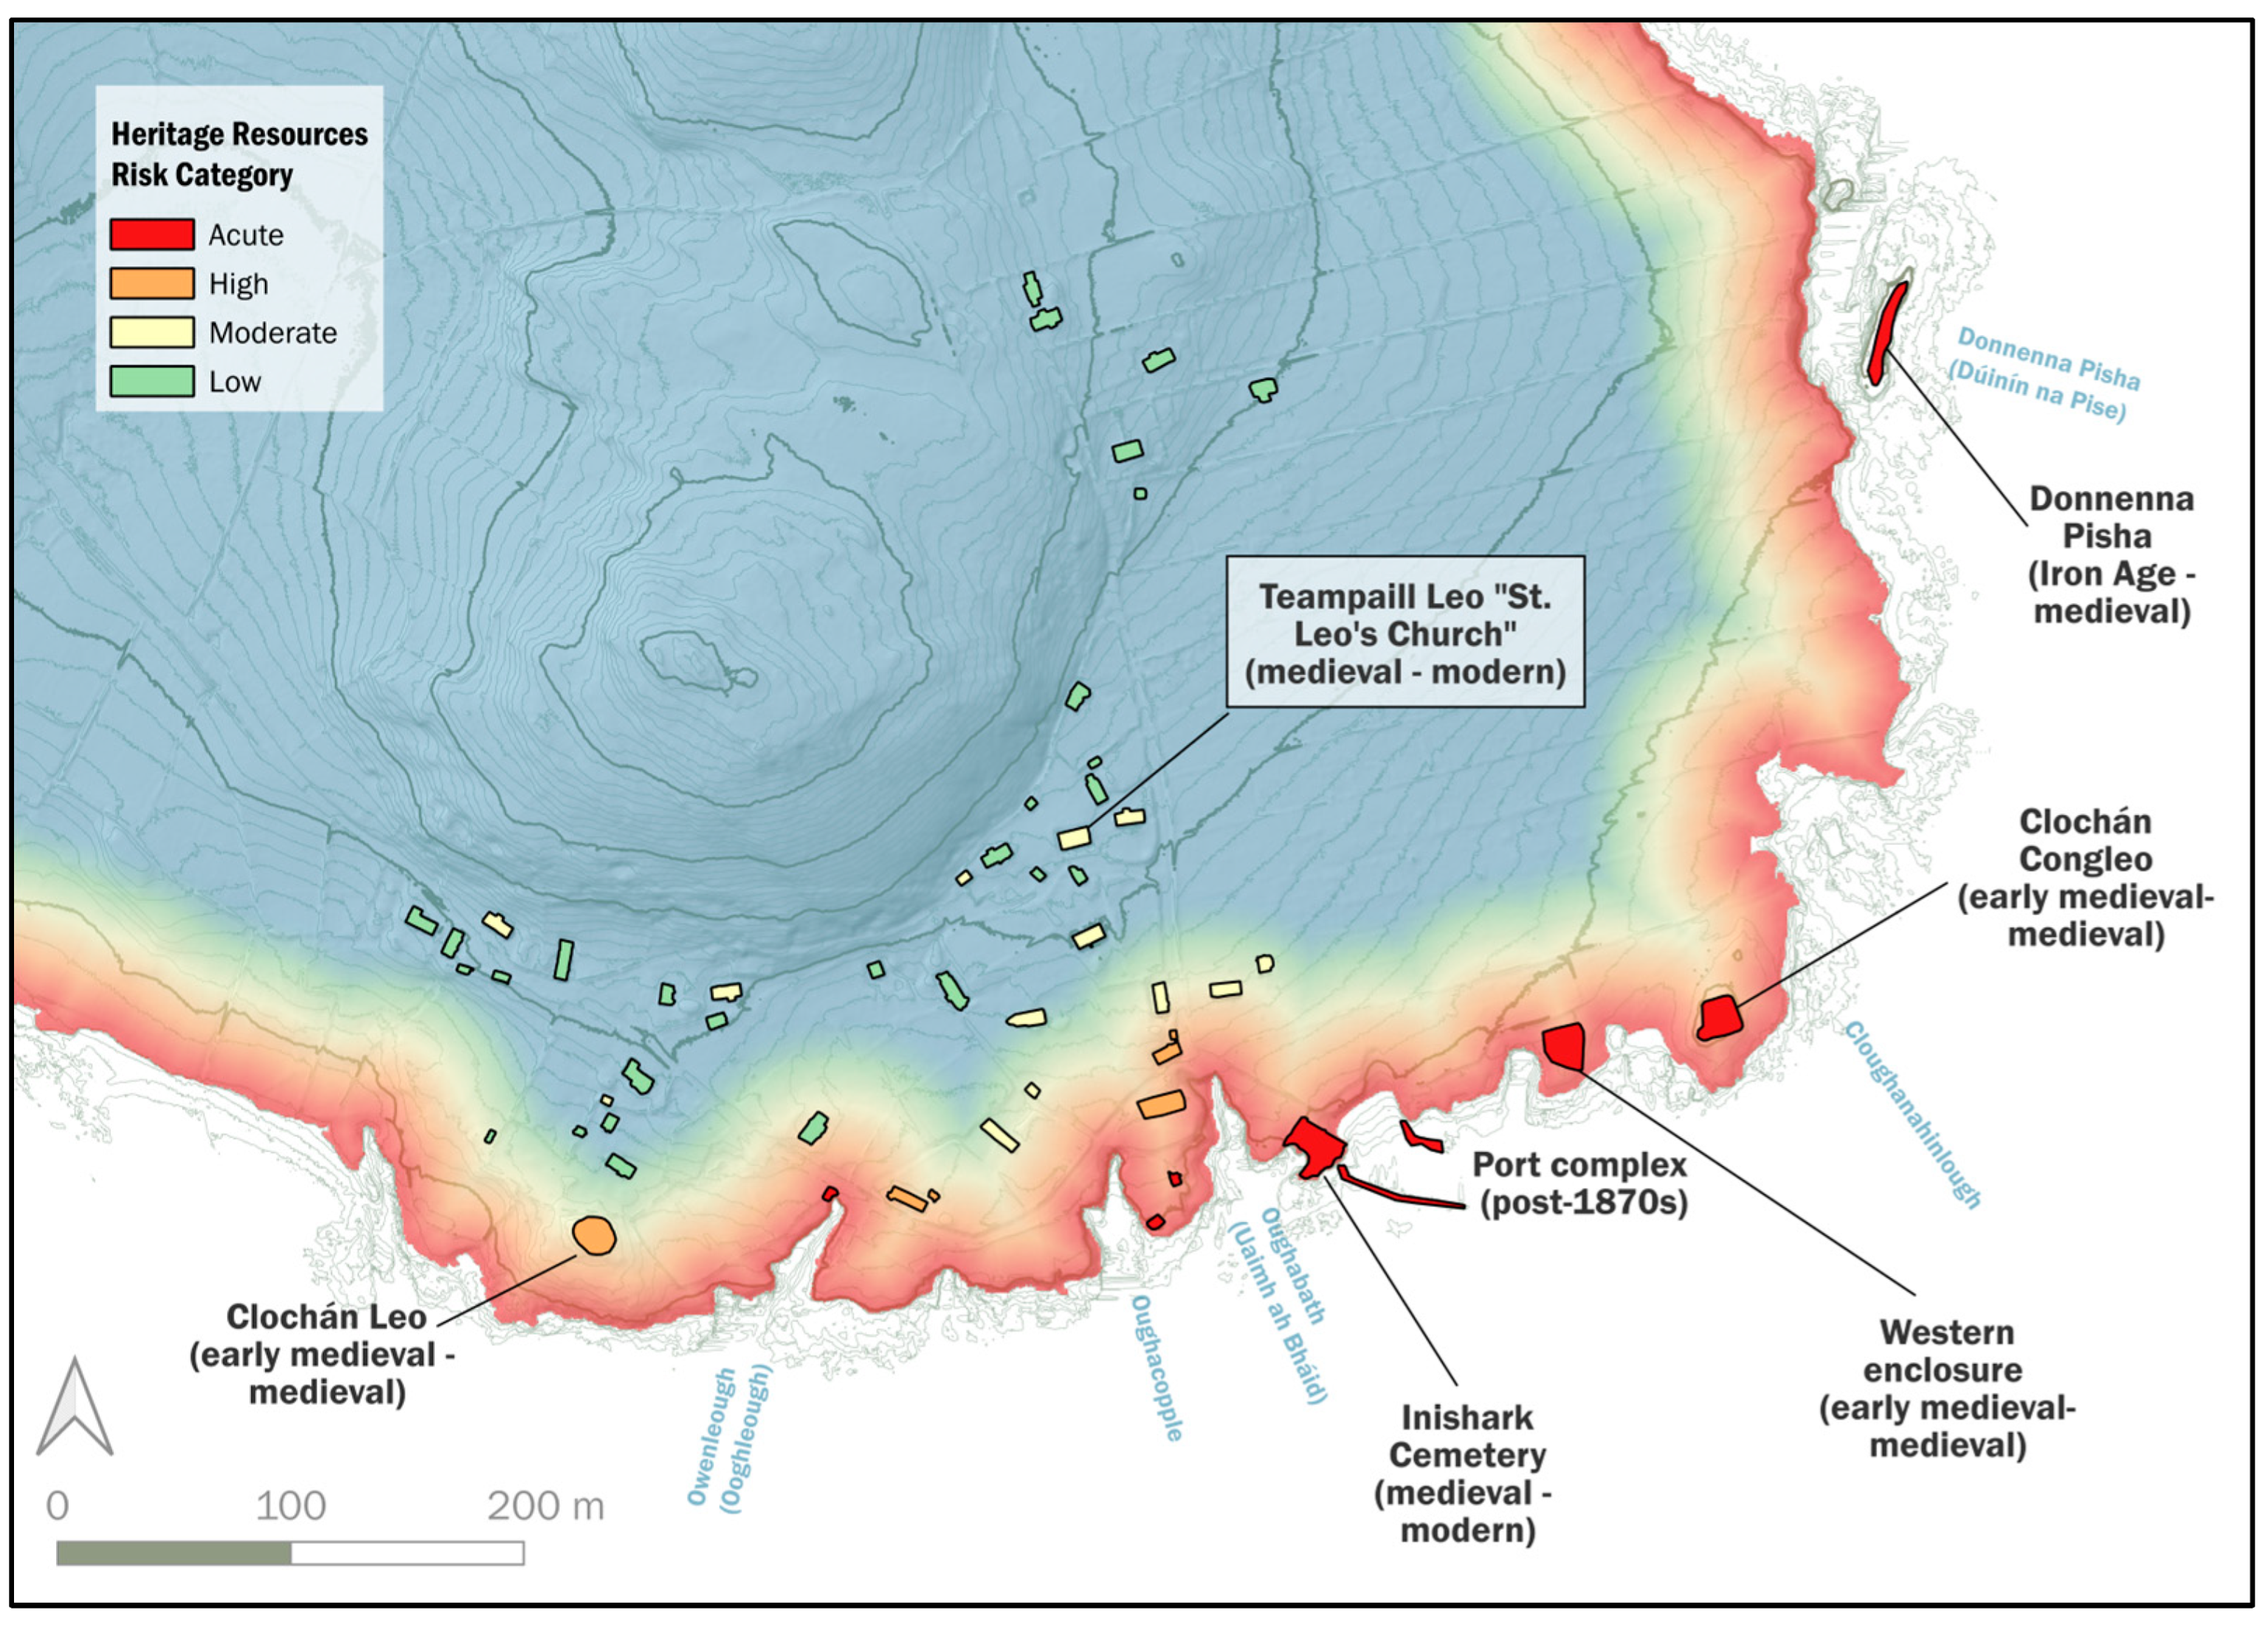
Over the last 20 years it has become increasingly clear that aerial remote sensing now serves as a valuable tool to document the damage and destruction to cultural heritage through coastal erosion [1,2,3,4,5,6,7,8,41,42,43,44,45,46,47,48]. In the context of Inishark, with a mixture of built cultural heritage of dry-laid stone buildings constructed since the 1780s and multiple early medieval and prehistoric archaeology sites, aerial remote sensing has allowed us to better understand two pathways of the destruction of cultural heritage: (1) the gradual, low-energy process where wind and rain deteriorate the wooden support structure of protective roof systems of residential and non-residential buildings, and (2) the episodic high-energy destruction by wave and wind forces under specific tidal conditions that erode areas along the shoreline and buried cultural heritage. These pathways have been summarized in a risk assessment map that classifies ongoing and future risk of deterioration among cultural resources on the island (Figure 8) and a table that quantifies the rate of erosional/degradation threats (Table 3).
The risks associated with built architecture are linked to the gradual deterioration of the wooden roof support system and then the accelerated deterioration when the accumulative impact of high winds, water, and wood rot bring about the collapse of the roof with a single storm. Therefore, buildings placed away from the shoreline and close to the hill for protection from predominant winds coming from the northwest are best preserved and at lowest risk of further damage once the roofs have fallen in (Figure 8).
In contrast, along the coastline of Inishark there are multiple cultural resources that have been destroyed or damaged through high-energy seasonal storms over the last 15 years (Table 2 and Table 3). This includes major sections of the southern coastline, including Donnenna Pisha and the breakwater, landing pier, and cemetery near the Oughabath inlet. The most dramatic erosional losses have occurred at Donnenna Pisha and the cemetery, with at least 2 m of both sites destroyed over the last 15 years. Other buildings and buried sites are not on the cliff edges but still risk damage due to erosion. It is in the setting of established channels, such as with the inlets of Oughabath and Owenleough, where episodic winter storms coming from the southwest, south, or southeast at high tides are most destructive. In these cases, the channeling of water within an enclosed space creates significant high-energy erosion at the end of the channel, eroding both bedrock and unconsolidated sediments.
Our analysis demonstrated that muti-sensor, multi-resolution, and multi-temporal data could be integrated as an effective tool for cultural resource management. We integrated multiple types of data, the core of which was based on remote sensing, to better understand changes in the natural and cultural landscape at Inishark over a nearly 200-year period. Therefore, this research serves not only to demonstrate the utility of remote sensing for resource management but also a generalizable and increasingly common roadmap to illustrate how disparate data can be aggregated to study coastal erosion and the increasing risk to cultural resources. For example, similar approaches using historic imagery, maps, geomorphological, geoarchaeological, or material records have recently proven useful in reconstructing prehistoric shorelines to better understand long-term landscape evolutions [49,50]. Therefore, even though our analysis focused on the case study from Inishark, the patterns and results are representative of other areas of Ireland, Europe, and the world.
Integrating suites of remotely sensed data, however, inherently runs the risk of compounded error. We minimized these effects by building a post hoc co-registration approach that aimed to minimize the spatial errors between data, yet some spatial processing errors undoubtedly impacted our analyses. Even in best-case scenarios, spatial processing errors and landscape practices, such as tillage, can complicate researchers’ ability to measure processes like erosion [51]. Despite these concerns, by comparing above-ground architectural features, assessing clear topographic changes (e.g., shoreline changes), and drawing upon field surveys and traditional archaeological data, we anchored our analyses in evidence that can be easily linked to erosion.

5. Conclusions

Through LiDAR, photogrammetry, satellite imagery, historic data, and traditional archaeological investigation, we documented rates of architectural degradation and coastal erosion on Inishark. Results showed that architectural, burial, and infrastructural components of the cultural landscape on Inishark were threatened. Moreover, results suggested that shoreline resources were likely to suffer irretrievable losses within the next few decades if threats were left unaddressed. This approach demonstrated that, albeit a non-systematic research design, employing multiple remote sensing methods was an effective tool for interpreting diachronic changes to cultural landscapes. Our research on Inishark, however, also draws attention to one of the often-overlooked shortfalls of remote sensing for heritage management: the necessity of field survey and ground truthing. In many research contexts, remote surveys are conducted almost entirely with nadir-orientated sensors, which are poorly suited for documenting severe vertical surfaces, such as cliff edges. In the case of Inishark, some of the most dramatic threats to resources, such as the erosion of a large, multiple-entrance tunnel beneath the cemetery, were identified through field surveys. This highlights that robust remote sensing approaches require horizontal and vertical surface documentation. Despite these shortfalls, our process of aggregating longitudinal remotely sensed data offers a generalizable approach for archaeologists hoping to capitalize on remote sensing for cultural resource management.

Author Contributions

Conceptualization, S.F. and I.K.; methodology, S.F. and I.K.; software, S.F.; validation, S.F. and I.K.; formal analysis, S.F. and I.K.; investigation, S.F., I.K., R.L. and T.B.; resources, I.K. and S.F.; data curation, S.F.; writing—original draft preparation, I.K. and S.F.; writing—review and editing, I.K., S.F., R.L. and T.B.; visualization, S.F. and I.K.; supervision, S.F. and I.K.; project administration, S.F. and I.K.; funding acquisition, I.K. and S.F. All authors have read and agreed to the published version of the manuscript.

Funding

This research program has been generously funded by the John Tynan family, the Institute for Scholarship in the Liberal Arts, University of Notre Dame, the Office of Sponsored Research, University of Notre Dame (Keough-Naughton Insitute for Irish Studies: 2010-1).

Data Availability Statement

The data presented in this study are available on request from the corresponding author.

Acknowledgments

We would like to thank the Department of Anthropology, University of Notre Dame for funding portions of this project and securing software used in photogrammetric analyses. This research program has been made possible by the work of those at Fugro-BKS. Ltd., Coleraine, Northern Ireland, and with data processing by A. Corns, The Discovery Programme, Dublin, Ireland. Documenting Inishark and island life has also been made possible by a long list of friends from Inishark, Inishbofin, Letterfrack, and Clifden. Our warm thanks to all of you. The research was conducted under National Monuments of Ireland license 10E0399.

Conflicts of Interest

The authors declare no conflicts of interest.

References

  1. Daire, M.-Y.; Lopez-Romero, E.; Proust, J.-N.; Regnauld, H.; Pian, S.; Shi, B. Coastal Changes and Cultural Heritage (1): Assessment of the Vulnerability of the Coastal heritage in Western France. J. Isl. Coast. Archaeol. 2012, 7, 168–182. [Google Scholar] [CrossRef]
  2. Erlandson, J.M. As the world warms: Rising seas, coastal archaeology, and the erosion of maritime history. J. Coast. Conserv. 2012, 16, 137–142. [Google Scholar] [CrossRef]
  3. Fitzpatrick, S.M.; Kappers, M.; Kaye, Q. Coastal Erosion and Site Destruction on Carriacou, West Indies. J. Field Archaeol. 2006, 31, 251–262. [Google Scholar] [CrossRef]
  4. Reimann, L.; Vafeidis, A.T.; Brown, S.; Hinkel, J.; Tol, R.S.J. Mediterranean UNESCO World Heritage at risk from coastal flooding and erosion due to sea-level rise. Nat. Commun. 2018, 9, 4161. [Google Scholar] [CrossRef] [PubMed]
  5. Sanchez, F.G.; Sanchez, H.G.; Ribalaygua, C. Cultural heritage and sea level rise threat: Risk assessment of coastal fortifications in the Canary Islands. J. Cult. Herit. 2020, 44, 211–217. [Google Scholar] [CrossRef]
  6. Ackland, K.; Griffiths, H.; Barker, L.; Davies, S.; Driver, T.; Hunt, D. Mapping the impacts of coastal erosion on the heritage assets of Ynys Enlli (Bardsey Island), North Wales, UK. J. Isl. Coast. Archaeol. 2024, 19, 786–813. [Google Scholar] [CrossRef]
  7. Graham, E. Drone Survey to Monitor Erosion Impacts on Coastal Archaeological Sites. J. Field Archaeol. 2025, 50, 22–41. [Google Scholar] [CrossRef]
  8. Westley, K. Refining broad-scale vulnerability assessment of coastal archaeological resources, Lough Foyle, Northern Ireland. J. Isl. Coast. Archaeol. 2019, 14, 226–246. [Google Scholar] [CrossRef]
  9. Lipe, W.D. Archaeological values and resource management. In Archaeology and Cultural Resource Management: Visions for the Future; School for Advanced Research Press: Santa Fe, NM, USA, 2009; pp. 41–63. [Google Scholar]
  10. Surovell, T.A.; Toohey, J.L.; Myers, A.D.; LaBelle, J.M.; Ahern, J.C.; Reisig, B. The end of archaeological discovery. Am. Antiq. 2017, 82, 288–300. [Google Scholar] [CrossRef]
  11. Casana, J. Rethinking the Landscape: Emerging Approaches to Archaeological Remote Sensing. Ann. Rev. Anthropol. 2021, 50, 167–186. [Google Scholar] [CrossRef]
  12. Dimitris, K. Aerial Remote Sensing Archaeology-A Short Review of Application. Land 2024, 13, 997. [Google Scholar]
  13. Smith, R. Disasters and Archaeology: A Remote Sensing Approach for Determination of Archaeology At-Risk to Desertification in Sistan. Remote Sens. 2024, 16, 2382. [Google Scholar] [CrossRef]
  14. Argyrou, A.; Agapiou, A. A review of artificial intelligence and remote sensing for archaeological research. Remote Sens. 2022, 14, 6000. [Google Scholar] [CrossRef]
  15. Laugier, E.J.; Casana, J. Integrating satellite, UAV, and ground-based remote sensing in archaeology: An exploration of pre-modern land use in Northeastern Iraq. Remote Sens. 2021, 13, 5119. [Google Scholar] [CrossRef]
  16. Sakai, M.; Sakurai, A.; Lu, S.; Olano, J.; Albrecht, C.M.; Hamann, H.F.; Freitag, M. AI-accelerated Nazca survey nearly doubles the number of known figurative geoglyphs and sheds light on their purpose. Proc. Natl. Acad. Sci. USA 2024, 121, e2407652121. [Google Scholar] [CrossRef]
  17. Soroush, M.; Mehrtash, A.; Khazraee, E.; Ur, J.A. Deep learning in archaeological remote sensing: Automated qanat detection in the Kurdistan region of Iraq. Remote Sens. 2020, 12, 500. [Google Scholar] [CrossRef]
  18. Stewart, C.; Labrèche, G.; González, D.L. A pilot study on remote sensing and citizen science for archaeological prospection. Remote Sens. 2020, 12, 2795. [Google Scholar] [CrossRef]
  19. Kuijt, I.; Conway, M.; Shakour, K.; McNeill, C.; Brown, C. Vectors of improvement: The material footprint of nineteenth-through twentieth-century Irish National Policy, Inishark, county Galway, Ireland. Int. J. Hist. Archaeol. 2015, 19, 122–158. [Google Scholar] [CrossRef]
  20. Matthews, T.; Murphy, C.; Wilby, R.L.; Harrigan, S. Stormiest winter on record for Ireland and UK. Nat. Clim. Change 2014, 4, 738–740. [Google Scholar] [CrossRef]
  21. Herndon, K.E.; Griffin, R.; Schroder, W.; Murtha, T.; Golden, C.; Contreras, D.A.; Cherrington, E.; Wnag, L.; Bazarsky, A.; Van Kollias, G.; et al. Google Earth Engine for archaeologists: An updated look at the progress and promise of remotely sensed big data. J. Arhcaeol. Sci. Rep. 2023, 50, 104094. [Google Scholar] [CrossRef]
  22. Thuestad, A.E.; Risbol, O.; Kleppe, J.I.; Barlindhaug, S.; Myrvoll, E.R. Archaeological Surveying of Subarctic Landscapes: Comparing the Performance of Airborne Lader Scanning and Remote Sensing Image Data. Sustainability 2021, 13, 1917. [Google Scholar] [CrossRef]
  23. Maxar Intelligence & Maxar Space Systems. Available online: https://www.maxar.com/ (accessed on 1 January 2025).
  24. Gorelick, N.; Hancher, M.; Dixon, M.; Ilyushchenko, S.; Thau, D.; Moore, R. Google Earth Engine: Planetary-scale geospatial analysis for everyone. Remote Sens. Environ. 2017, 202, 18–27. [Google Scholar] [CrossRef]
  25. Rotheram, W.H. Ordnance Survey of Ireland, Galway, Sheet 9D & 9C. Ordnance Six-Inch Ireland, 1829–1969. The National Library of Scotland. 1989. Available online: https://maps.nls.uk/view/247668760 (accessed on 3 February 2025).
  26. Hesse, R. Possibilities and challenges in the application of mutli-temporal airborne lidar data sets for the monitoring of archaeological landscapes. In Proceedings of the 20th International Conference on Cultural Heritage and New Technologies, Vienna, Austria, 2–4 November 2015. [Google Scholar]
  27. Kaiser, T.; Clemen, C.; Maas, H.-G. Automatic co-registration of photogrammetric point clouds with digital building models. Autom. Constr. 2022, 134, 104098. [Google Scholar] [CrossRef]
  28. Shao, J.; Zhang, W.; Mellado, N.; Grussenmeyer, P.; Li, R.; Chen, Y.; Wan, P.; Zhang, X.; Cai, S. Automated markerless registration of point clouds from TLS and structured light scanner for heritage documentation. J. Cult. Herit. 2019, 35, 16–24. [Google Scholar] [CrossRef]
  29. Morelli, L.; Perda, G.; Ioli, F.; Trybala, P.; Sterpin, A.; Rigon, S.; Sutherland, N.; Medici, M.; Remondino, F.; Vitti, A. Co-registering Laser Scanning Point Clouds and Photogrammetric Images with Deep Learning Multi-Modal Matching. Int. Arch. Photogramm. Remote Sens. Spat. Inf. Sci. 2024, 48, 335–342. [Google Scholar] [CrossRef]
  30. QGIS.org. QGIS v3.28. QGIS Geographic Information System. QGIS Association. 2025. Available online: http://www.qgis.org (accessed on 1 January 2025).
  31. Mac Gabhann, F. Logainmneacha Mhaigh Eo 2. Barúntacht Mhuraisce; Coiscéim: Dublin, Ireland, 2014. [Google Scholar]
  32. Lash, R.; Kuijt, I.; Alonzi, E.; Chesson, M.; Burke, T. “Differing in Status, but One in Spirit”: Sacred Space and Social Diversity at Island Monasteries in Connemara, Ireland. Antiquity 2018, 92, 437–455. [Google Scholar] [CrossRef]
  33. Lash, R. Curation and Creativity: Devotional Heritage on Inishark and Inishbofin. In Sacred Realms and Folk Domains of Irish Holy Wells; Ray, C., Ed.; Indiana University Press: Bloomington, Indiana, 2023; pp. 264–275. [Google Scholar]
  34. MacLoughlin, B. Material Concerning the Surviving Antiquities of Inish Airc (Inishark). In Irish Folklore Collection; Irish Folklore Collection at University College Dublin: Dublin, Ireland, 1942; Volume 838–839. [Google Scholar]
  35. Jarmalavicius, D.; Smatas, V.; Stankunavicius, G.; Pupienis, D.; Zilinskas, G. Factors Controlling Coastal Erosion During Storm Events. J. Coast. Res. 2016, 75, 1112–1116. [Google Scholar] [CrossRef]
  36. Larson, W.E.; Lindstrom, M.J.; Schumacher, T.E. The role of severe storms in soil erosion: A problem needing consideration. J. Soil Water Conserv. 1997, 52, 90–95. [Google Scholar] [CrossRef]
  37. O’Keeffe, T. Omey and the Sands of Time. Archaeol. Irel. 1994, 8, 14–17. [Google Scholar]
  38. O’Sullivan, J.; Carragáin, T.Ó. Inishmurray: Monks and Pilgrims in an Atlantic Landscape; Collins: Cork, Ireland, 2008. [Google Scholar]
  39. Scott, R.E. Social Identity in Early Medieval Ireland: A Bioarchaeology of the Early Christian Cemetery on Omey Island, Co. Galway. Ph.D. Dissertation, University of Pennsylvania, Philadelphia, PA, USA, 2006. [Google Scholar]
  40. O’Sullivan, A.; McCormick, F.; Kerr, T.R.; Harney, L. Early Medieval Ireland, AD 400–1100: The Evidence from Archaeological Excavations; Royal Irish Academy: Dublin, Ireland, 2014. [Google Scholar]
  41. Bennett, P.; Wilson, A.; Buzaian, A.; Kattenberg, A. The effects of recent storms on the exposed coastline of Tocra. Libyan Stud. 2004, 35, 113–122. [Google Scholar] [CrossRef]
  42. Eidshaug, J.S.; Bjerck, H.B.; Lohndal, T.; Risbøl, O. Words as Archaeological Objects: A Study of Marine Lifeways, Seascapes, and Coastal Environmental Knowledge in the Yagan-English Dictionary. Int. J. Hist. Archaeol. 2024, 28, 722–766. [Google Scholar] [CrossRef]
  43. Fatorić, S.; Seekamp, E. Are cultural heritage and resources threatened by climate change? A systematic literature review. Clim. Change 2017, 142, 227–254. [Google Scholar] [CrossRef]
  44. Ford, M. Shoreline changes interpreted from multi-temporal aerial photographs and high resolution satellite images: Wotje Atoll, Marshall Islands. Remote Sens. Environ. 2013, 135, 130–140. [Google Scholar] [CrossRef]
  45. Nicu, I.C.; Rubensdotter, L.; Stalsber, K.; Nau, E. Coastal Erosion of Arctic Cultural Heritage in Danger: A Case Study from Svalbard, Norway. Water 2021, 13, 784. [Google Scholar] [CrossRef]
  46. Sesana, E.; Gagnon, A.S.; Ciantelli, C.; Cassar, J.; Hughes, J.J. Climate change impacts on cultural heritage: A literature review. WIREs Clim. Change 2021, 12, e710. [Google Scholar] [CrossRef]
  47. Westley, K.; Nikolaus, J.; Emrage, A.; Flemming, N.; Cooper, A. The impact of coastal erosion on the archaeology of the Cyrenaican coast of Eastern Libya. PLoS ONE 2023, 18, e0283703. [Google Scholar] [CrossRef]
  48. Kabuth, A.K.; Kroon, A.; Pedersen, J.B. Multidecadal shoreline changes in Denmark. J. Coast. Res. 2014, 30, 714–728. [Google Scholar]
  49. Fernandez-Montblanc, T.; Del Rio, L.; Izquierdo, A.; Gracia, F.J.; Bethencourt, M.; Benaventer, J. Shipwrecks and man-made coastal structures as indicators of historical shoreline position. An interdisciplinary study in the Sancti Petri san spit (Bay of Cadiz, SW Spain). Mar. Geol. 2018, 395, 152–167. [Google Scholar]
  50. Martinez-Sanchez, A.; Gracia, F.J.; Alonso, C.; Mata, E.; Caporizzo, C. Reconstructing the historical shoreline evolution of the Northern Bay of Cadiz (SW Spain) from geomorphological and geoarchaeological data. J. Maps 2023, 19, 2206585. [Google Scholar] [CrossRef]
  51. Huisman, H.; Heeres, G.; Os, B.v.; Derickx, W.; Schoorl, J. Erosion and Errors: Testing the Use of Repeated LIDAR Analyses and Erosion Modelling for the Assessment and Prediction of Erosion of Archaeological Sites? Conserv. Manag. Archaeol. Sites 2016, 18, 205–216. [Google Scholar] [CrossRef]
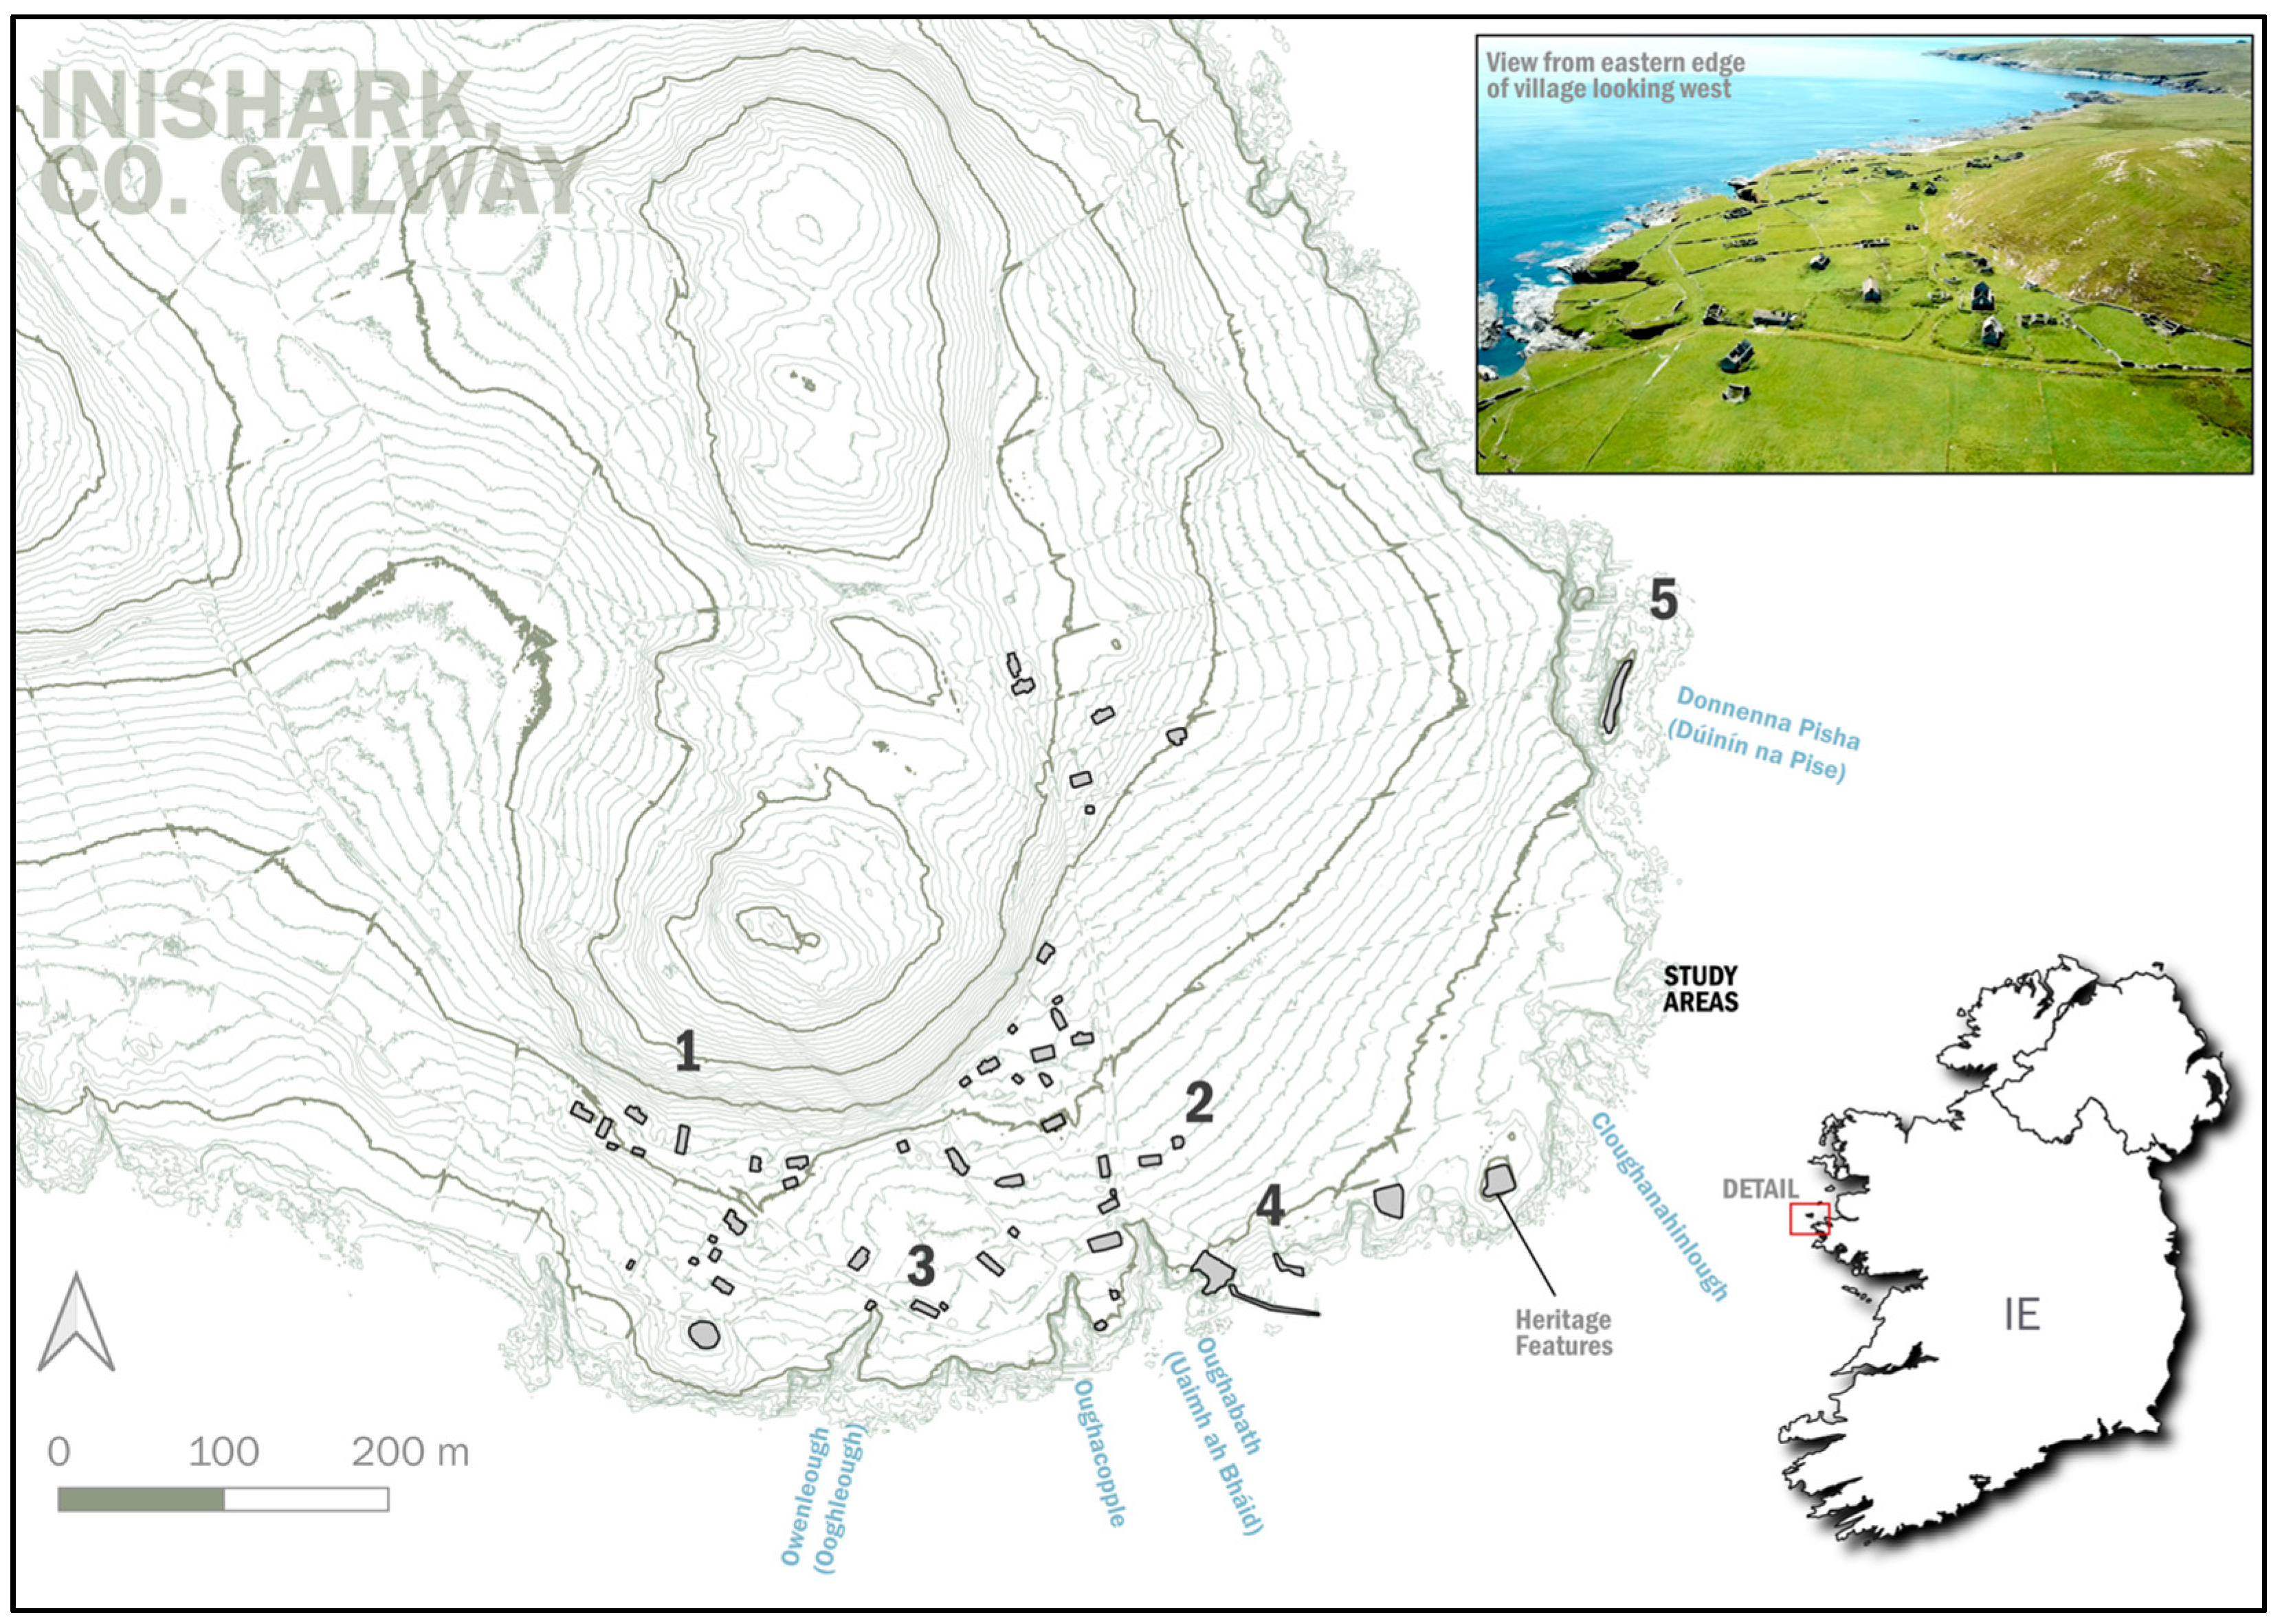
Figure 1. Map of the eastern half of Inishark, Co. Galway, Ireland, showing five study areas used to document cultural resource degradation. The landscape names from the Fair Plan of the 1st Edition Ordnance Survey map (1838) are in blue. Top right inset: Photograph of the village, taken from DJI Mavic facing west/southwest, showing the center of the village with the rising hill on the right-hand side.
Remotesensing 17 02709 g001
Figure 2. Map of study areas #1 and #2 with 2010 satellite imagery, 2015 satellite imagery, and 2018 photogrammetric orthomosaic. It should be noted that the roof of the main building in case study #2, oriented N–S, partially collapsed in 2018 (as seen in the orthomosaic) and fully collapsed in 2021.
Remotesensing 17 02709 g002
Figure 3. Map of the inlet of Owenleough, study area #3, showing the 1898 historic map, 2010 LiDAR derived DSM, and 2018 photogrammetrically derived DSM. Bottom inset shows the expansion of this channel between 1898 and 2018.
Remotesensing 17 02709 g003
Figure 4. Details of Owenleough showing the relationship of historic coastline change in relation to stone walls constructed before 1898, detailed contours derived from the 2010 LiDAR DSM and 2018 photogrammetrically derived DSM, a comparison of both hill-shaded DSMs, and 2018 orthoimages of parts of the inlet in relationship to stone walls.
Remotesensing 17 02709 g004
Figure 5. Details of the Inishark cemetery showing the relationship of historic coastline change in relation to the cemetery, detailed contours derived from the 2010 LiDAR DSM and 2018 photogrammetrically derived DSM, and terrestrial images of the western and southern entrance of the connected tunnel beneath the cemetery.
Remotesensing 17 02709 g005
Figure 6. Map of Donnenna Pisha, eastern side of Inishark, with 1838 historic map, 2010 LiDAR derived DSM, and 2023 satellite imagery. Bottom left inset shows location of shoreline between 1838 and 2018.
Remotesensing 17 02709 g006
Figure 7. Detail of Donnenna Pisha with 2023 satellite imagery. Top right inset shows extent of islet between 2010 and 2023. Photograph 1 illustrates the active erosion along the eastern site of the promontory fort. Photograph 2 shows the open water area between Donnenna Pisha and the shoreline. Looking closely at the photograph reveals the brown water from sediments eroding from the cliff edge, and how this contrasts with the dark blue of the ocean between Inishark and Inishbofin in the distance.
Remotesensing 17 02709 g007
Figure 8. Location and heritage assets’ risk category for cultural heritage along the southeast end of the Island of Inishark, Co. Galway, Ireland.
Remotesensing 17 02709 g008
Table 1. Root-mean-square error (measured in cm) between pairs of remotely sensed data products and the number of shared points used to calculate RMSE for each data pair.
RMSE (cm) Data Source Average RMSE (cm)
1989 Map2010 LiDAR2010 Satellite2015 Satellite2018 Photogrammetry2019 Satellite2023 Satellite
Data Source1989 map-20.5322.2321.0620.9321.42-21.23
2010 LiDAR20.53-9.678.735.977.9912.0110.82
2010 satellite22.239.67-8.406.908.9712.6811.47
2015 satellite21.068.738.40-7.946.59-10.54
2018 photogrammetry20.935.976.907.94-8.40-10.03
2019 satellite21.427.998.976.598.40-11.1710.76
2023 satellite-12.0112.68--11.17-11.95
Average Number of Points Used for RMSE Calculation
No. of Points used for RMSE CalculationData Source1989 map-99888-8.4
2010 LiDAR9-1111208310.3
2010 satellite911-881138.3
2015 satellite8118-88-8.6
2018 photogrammetry82088-8-10.4
2019 satellite881188-37.7
2023 satellite-33--3-3.0
Table 2. Irish major weather events related to winter storms (1839–2024), as listed by Met.IE, the Irish weather service (https://www.met.ie/climate/major-weather-events, accessed on 21 March 2025).
DateEventStorm CharacteristicsReference (Accessed on 21 March 2025)
YearDay-Month Location of RecordWind Speed (Sustained—km/h)Wind Speed (Gusts—km/h)Significant Wave Height (m)Individual Wave Height (m)Wind Direction (Degree)
202421-JanuaryViolent Storm IshaOff Donegal Coast (M4 buoy)8712210.916.7 https://cli.fusio.net/cli/stormcenter/PDF/Isha.pdf
202218-FebruaryViolent Storm EuniceOff Donegal Coast (M4 buoy)58796.611.3 https://cli.fusio.net/cli/stormcenter/PDF/Eunice.pdf
20217-DecemberViolent Storm BarraOff Donegal Coast (M4 buoy)7210410.416.7 https://cli.fusio.net/cli/stormcenter/PDF/Barra.pdf
202019-AugustViolent Storm EllenMace Head station3950 80https://cli.fusio.net/cli/stormcenter/PDF/Ellen.pdf
201716-OctoberViolent Storm OpheliaMace Head station7094 67.5https://www.met.ie/cms/assets/uploads/2023/08/OpheliaReport_v1.pdf
201412-FebruaryHurricane-Force Storm DarwinMace Head station120155 https://www.met.ie/cms/assets/uploads/2017/08/2014StormDarwin-1.pdf
2013/14WinterWinter StormsMace Head station6584 280https://www.met.ie/cms/assets/uploads/2017/08/WinterStorms13_14.pdf
199826-DecemberHurricane Force Winds over North and Northwest https://www.met.ie/cms/assets/uploads/2017/08/Dec1998_Storm.pdf
199724-DecemberWindstorm https://www.met.ie/cms/assets/uploads/2017/08/Dec1997_storm.pdf
19915-JanuaryWindstorm https://www.met.ie/cms/assets/uploads/2017/08/Jan1991_storm.pdf
1990FebruaryStorms and Heavy Rain https://www.met.ie/cms/assets/uploads/2017/08/Feb1990_storms.pdf
19889-FebruaryStorm Force Winds Over Ireland https://www.met.ie/cms/assets/uploads/2017/08/Feb1988_storm.pdf
1986AugustStorm—Hurricane Charley https://www.met.ie/cms/assets/uploads/2017/08/Aug1986_HurCharlie.pdf
19762-JanuaryStorm https://www.met.ie/cms/assets/uploads/2017/08/Jan1976_Storm.pdf
197411 through 12-JanuarySevere storm caused widespread damage https://www.met.ie/cms/assets/uploads/2017/08/Jan1974_Storm.pdf
196116-SeptemberStorm—Hurricane Debbie https://www.met.ie/cms/assets/uploads/2017/08/Sep1961_hurricane-Debbie.pdf
192728-OctoberMajor Storm Off the West Coast https://www.met.ie/cms/assets/uploads/2017/08/Oct1927_storm.pdf
190318 through 27-FebruaryStorm Causing Widespread Damage https://www.met.ie/cms/assets/uploads/2017/08/Feb1903_storm.pdf
18396 through 7-JanuaryThe Night of the Big Wind https://www.met.ie/cms/assets/uploads/2017/08/Jan1839_Storm.pdf
Table 3. Summary of surveyed resources on Inishark, their threats, and the approximate rate of threats to the resources.
ResourceThreatApproximate Rate of Threat
Post-1910 structuresRoof collapse3–5.5 m2/year
OwenleoughInlet erosion, horizontal shoreline shift0.15–0.35 m/year
Oughabath and CemetaryInlet erosion, horizontal shoreline shift and/or undercutting0.15–0.27 m/year
Donnenna PishaIslet erosion, areal loss3–5.75 m2/year
Disclaimer/Publisher’s Note: The statements, opinions and data contained in all publications are solely those of the individual author(s) and contributor(s) and not of MDPI and/or the editor(s). MDPI and/or the editor(s) disclaim responsibility for any injury to people or property resulting from any ideas, methods, instructions or products referred to in the content.