Abstract
Investigating land cover patterns, changes in carbon stocks, and forecasting future conditions are essential for formulating regional sustainable development strategies and enhancing ecological and environmental quality. This study centers on Guiyang, a mountainous urban area in southwestern China, to analyze the dynamic changes in land cover and their effects on carbon stocks from 2000 to 2035. A carbon stocks assessment framework was developed using a cellular automaton-based artificial neural network model (CA-ANN), the InVEST model, and the geographical detector model to predict future land cover changes and identify the primary drivers of variations in carbon stocks. The results indicate that (1) from 2000 to 2020, impervious surfaces expanded significantly, increasing by 199.73 km2. Compared to 2020, impervious surfaces are projected to increase by 1.06 km2, 13.54 km2, and 34.97 km2 in 2025, 2030, and 2035, respectively, leading to further reductions in grassland and forest areas. (2) Over time, carbon stocks in Guiyang exhibited a general decreasing trend; spatially, carbon stocks were higher in the western and northern regions and lower in the central and southern regions. (3) The level of greenness, measured by the normalized vegetation index (NDVI), significantly influenced the spatial variation of carbon stocks in Guiyang. Changes in carbon stocks resulted from the combined effects of multiple factors, with the annual average temperature and NDVI being the most influential. These findings provide a scientific basis for advancing low-carbon development and constructing an ecological civilization in Guiyang.
1. Introduction
Global greenhouse gas emissions are driving increasingly severe global warming, which poses a significant threat to human survival [1,2]. Increasing carbon stocks in terrestrial ecosystems is critical for mitigating temperature rise and maintaining global carbon balance [3,4]. China has committed to achieving carbon peaking by 2030 and carbon neutrality by 2060 [5], necessitating immediate actions to improve regional carbon sink capacity via refined land use planning and ecological restoration. Amidst swift demographic expansion, socioeconomic development, and accelerated urbanization, land use/cover change (LUCC) has followed a trend of shrinking cropland area and expanding impervious surfaces [6,7,8]. The driving mechanisms behind these changes and their relationship with carbon stock dynamics remain unclear [9]. Consequently, examining the relationship between land use/cover change and carbon stocks is crucial for attaining regional sustainable development and low-carbon urban growth.
LUCC is a multifaceted and dynamic geographical phenomenon [10]. Common research methods for simulating and predicting future land use/land cover include the cell-automata-based artificial neural network model (CA-ANN) [11], future land use simulation model (FLUS) [12], patch-generation land use simulation model (PLUS) [13], system dynamics model (SD) [14], IDRISI’s Land Change Modeler (LCM) [15], and spatiotemporal convolutional cellular automaton model (ST-CA) [16]. Among these, the CA-ANN model combines the ability of cellular automata to simulate space with the learning and decision-making skills of neural networks, allowing for the simulation of complex land use/cover patterns with high efficiency, minimal data requirements, and ease of calibration [17]. For instance, Paulos Lukas [12] used a CA-ANN-based model to predict future land use/cover changes in the Upper Omo–Gibe River Basin, Ethiopia. Sayantani Bhattacharyya [18] employed it to assess the impact of land cover changes on the Environmental Composite Index (ECI) in Kolkata, India. Chunqiang Li [19] used an ANN-MLP model to predict carbon stock responses to future land cover changes in Fuzhou over the next 15 years. Maomao Zhang [20] applied the CA-ANN algorithm to predict the relationship between land use changes and the urban thermal environment in Nanjing. Xiaoyang Xiang [21] simulated the future intensity of the urban heat island effect and land use/cover distribution in Guangzhou using the CA-ANN model. This model, when combined with machine learning, shows excellent performance in handling nonlinear, complex systems and simulating the spatiotemporal evolution of intricate features. It effectively trains data to achieve higher simulation accuracy and is gaining increasing attention in regional land cover change simulations [22].
Predicting carbon stocks and analyzing their spatiotemporal dynamics based on land use/cover changes is an effective approach. However, because carbon stock changes are influenced, both directly and indirectly, by multiple driving factors [23], identifying the underlying drivers of these factors is crucial for predicting future carbon stocks’ dynamics [24]. The geographic detector model offers a valuable tool for identifying the driving factors of carbon stocks’ dynamics and their spatial heterogeneity [25]. Therefore, this study develops a multi-model coupling framework that combines the CA-ANN, InVEST, and geographic detector models to predict future land use/cover changes, analyze the dominant drivers of carbon stock changes and their spatial interactions, and estimate carbon stock changes under a natural development scenario.
Guiyang, a typical karst mountainous city in southwestern China, has developed distinctive landscapes due to its unique geological features [26,27]. However, it also faces numerous ecological challenges, including high rock exposure rates, thin soil layers, severe soil erosion, and water shortages induced by engineering activities [28]. As the city expands, a natural spatial pattern of “mountains within the city and the city within the mountains” has emerged, with mountainous areas becoming an integral part of urban space [29]. Compared to cities in plains, mountainous cities not only have complex topography and terrain but also face the fundamental issue of limited land resources. On one hand, the mountainous terrain restricts urban expansion, creating a particularly tense relationship between people and land in these areas. On the other hand, the native and near-natural vegetation preserved in mountainous areas provides critical ecosystem services, such as material cycling, hydrological regulation, and climate regulation, significantly impacting the carbon stocks and sequestration efficiency of cities [27,30,31,32].
In recent years, the rapid urbanization of Guiyang has posed significant challenges to karst ecological conservation and low-carbon urban development. This study proposes a framework for estimating carbon stocks under natural development scenarios, which includes three modules: land cover prediction, carbon stocks estimation, and driver identification. This framework is used to analyze the spatiotemporal characteristics of carbon stocks in Guiyang and elucidate their driving mechanisms. The primary objectives are: (1) evaluating the spatial patterns of land cover alterations from 2000 to 2020, (2) forecasting the spatial distribution of land cover for the years 2025, 2030, and 2035, (3) quantifying the spatiotemporal evolution of carbon stocks from 2000 to 2035, and (4) identifying the driving forces of natural and socioeconomic factors on carbon stocks. The results establish a solid foundation for the optimization and sustainable development of land use in karst mountainous urban regions.
2. Materials and Methods
The flowchart for this study is shown in Figure 1.
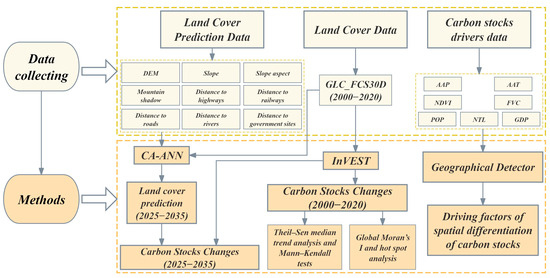
Figure 1.
Flowchart of this study.
2.1. Study Area
Guiyang (26°11′–26°55′N, 106°07′–107°17′E), the capital of Guizhou Province, is located in the central part of the province (Figure 2). It is a major central city in southwest China, covering an area of approximately 8043 km2. The terrain slopes from southwest to northeast, consisting primarily of mountainous and hilly areas. Guiyang has a subtropical humid climate, with an average annual precipitation of 1129.5 mm and an average annual temperature of 15.3 °C. The city experiences distinct seasons, moderate temperatures, and ample precipitation. By the end of 2020, Guiyang had a permanent population of 5.98 million, an urbanization rate of 80.07%, and a GDP of 431.165 billion yuan [33]. In 2020, the primary land cover types in Guiyang were forest (54.77%) and cropland (32.56%).
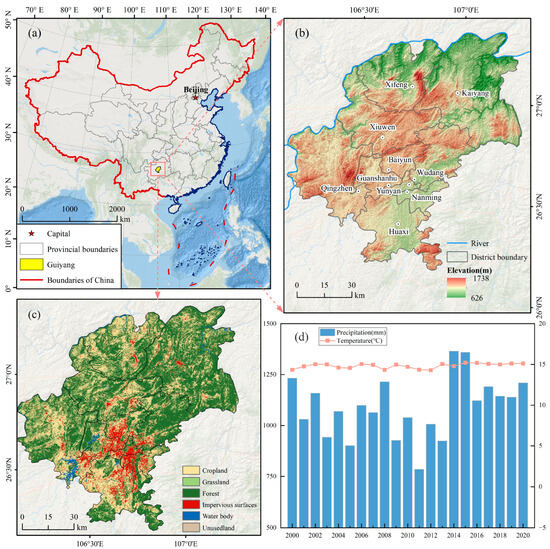
Figure 2.
Summary of the study region: (a) Guiyang’s location in China, (b) DEM of Guiyang, (c) land cover types in Guiyang in 2020, and (d) annual average precipitation and annual average temperature in Guiyang from 2000 to 2020.
2.2. Data Sources and Preprocessing
Land cover drivers encompass natural, socioeconomic, and locational factors. Natural factors include annual average precipitation (AAP), annual average temperature (AAT), digital elevation model (DEM), slope, slope aspect, mountain shadow, normalized vegetation index (NDVI), and fractional vegetation cover (FVC). Socioeconomic factors consist of population (POP), night lighting (NTL), and gross domestic product (GDP). Locational factors were calculated using Euclidean distance and include distances to highways, railways, roads, rivers, and government sites. Data sources are provided in Table 1, where slope, aspect, and mountain shadow are derived from the DEM. Land cover data for the years 2000, 2005, 2010, 2015, and 2020 are derived from the GLC_FCS30D dataset created by Liu Liangyun’s team [34]. This dataset amalgamates all accessible Landsat imagery (1985–2022) utilizing the Google Earth Engine platform and a continuous change detection methodology to observe global land cover dynamics at a 30 m resolution. The dataset’s accuracy, confirmed using the LCCS Level 1 validation system, is 73.24% (±0.30%) for 17 land cover categories, and an overall accuracy of 80.88% (±0.27%) for 10 primary land cover types. Based on the vertical vegetation differentiation and landscape fragmentation characteristics of the karst mountain area in Guiyang, land cover types were reclassified into six major categories: cropland, grassland, forest, impervious surfaces, water body, and unused land. To maintain data integrity, except for the original data with a spatial resolution of 30 m, in ArcGIS 10.8, all data were resampled to 30 m using the bilinear interpolation method, utilizing the spatial reference WGS_1984_UTM_Zone_48N.

Table 1.
Sources of data.
2.3. Study Methods
2.3.1. CA-ANN Model
This study predicted future land cover changes using the CA-ANN model based on the MOLUSCE (Methods of Land Use Change Evaluation) tool in QGIS 3.16.14. MOLUSCE utilizes the multilayer perceptron (MLP) algorithm, a specific type of artificial neural network (ANN) comprising interconnected neurons at different layers, serving as a simplified model of ANN characteristics [35]. Machine learning algorithms were employed to analyze existing land cover data and simulate future natural scenarios based on selected drivers [36]. Using GLC_FCS30D land cover imagery from 2010, 2015, and 2020, along with data on DEM, slope, slope aspect, mountain shadow, and distances to highways, railways, roads, rivers, and government sites (Figure 3), an ANN model was trained to determine the nonlinear function for simulation and predict land cover for 2025, 2030, and 2035.
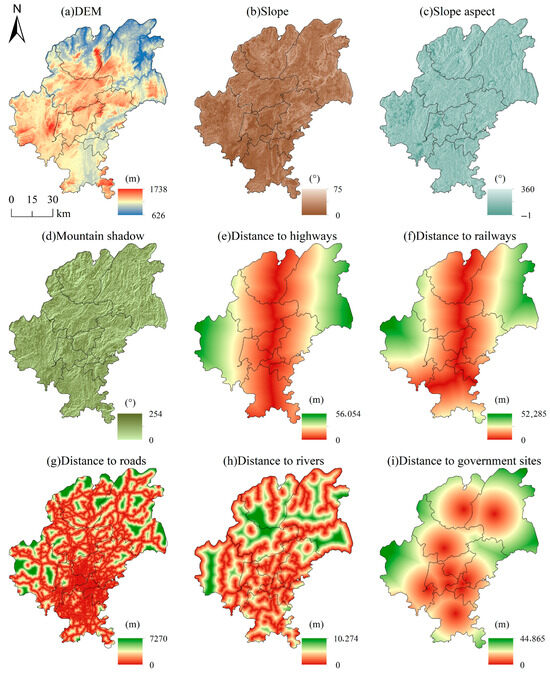
Figure 3.
Predicting the drivers of land cover in Guiyang.
2.3.2. Validation of Predictive Model Accuracy
To empirically evaluate the dependability of models that forecast land cover change, in the MOLUSCE module of QGIS 3.16.14, an ANN-MLP model was employed using a stepwise approach to predict land cover changes. First, the model was trained using actual land cover data from 2000 and 2005, along with the variables shown in Figure 3, to generate simulated land cover data for 2010. The model was then retrained using actual land cover data from 2005 and 2010 to generate simulated data for 2015. Finally, the model was used with actual land cover data from 2010 and 2015 to generate simulated data for 2020. The entire process integrated the driving data from Figure 3 and used Pearson’s correlation coefficient to assess their interrelationships. Based on the simulation results, we generated land cover type area change maps and conversion matrices for any two periods of land cover data to quantitatively analyze the patterns of land cover type conversion. Input the relevant parameters. The model will gradually generate land cover maps for 2010, 2015, and 2020. By comparing the simulated results for each year with the corresponding actual land cover data from the GLC_FCS30D dataset, spatial distribution differences among various land cover types were identified, allowing for an accuracy assessment of the prediction model in terms of land cover type and other factors. The overall accuracy (OA) and Kappa coefficient were used to validate the land cover prediction results. The formulas are as follows:
where denotes the total number of samples, denotes the number of classification categories, denotes the number of correctly classified samples in category , denotes the actual number of samples in category , and denotes the predicted number of samples in category .
2.3.3. The InVEST Model Quantifies Carbon Stocks
The Integrated Valuation of Ecosystem Services and Tradeoffs (InVEST) model simulates changes in ecosystem services across various land cover types, providing a scientific basis for decision-makers to evaluate the benefits and impacts of human activities [37,38]. This study applied the carbon stocks and sequestration module of the InVEST model to quantify carbon stocks in Guiyang. The model incorporates four primary carbon pools: the above-ground carbon pool, below-ground carbon pool, the soil carbon pool, and the dead organic carbon pool [39]. The calculation of ecosystem carbon storage is as follows:
where denotes total carbon stocks, denotes the area of land cover type , denotes above-ground biomass density, denotes below-ground biomass density, denotes soil carbon density, while denotes dead organic matter carbon density.
The selection of carbon density data emphasizes research on carbon stocks within the study area, adjacent regions, and the southern karst area. The findings of previous studies [40,41,42] were referenced. Following the carbon density correction formula proposed by Chen [43] and Alam [44], the carbon density of Guiyang was adjusted based on average annual precipitation and temperature (Table 2). The formulas are as follows:
where denotes annual average precipitation (mm), denotes annual average temperature (°C), and are the temperature and precipitation correction coefficients for biomass carbon density, respectively, and are the biomass carbon density data obtained for Guiyang and China based on annual average precipitation, respectively, and are the biomass carbon density data obtained for Guiyang and China based on annual average temperature, and are the soil carbon density data obtained for Guiyang and China based on annual average temperature, is the biomass carbon density correction coefficient, used to correct and , and is the soil carbon density correction coefficient, used to correct and .

Table 2.
Carbon density of land cover types in Guiyang (kg/m2).
2.3.4. The Theil–Sen Median Trend Analysis and Mann–Kendall Tests
The Theil–Sen slope test was employed to examine the trend in carbon stocks’ variation in Guiyang from 2000 to 2035. The median of the slope series was utilized for trend evaluation, and the Mann–Kendall test was applied to determine statistical significance. By combining these statistical methods, the impact of outliers in carbon stocks was minimized [45,46]. The formulas are as follows:
where denotes the trend of carbon stock changes, while and denote the values of carbon stocks in the time series at years and , respectively. If > 0, it indicates that carbon stocks in the study area are increasing; if < 0, it indicates that carbon stocks in the study area are decreasing. If the standard value > 0, the series shows an upward trend; if < 0, the series shows a downward trend. When |Z| is greater than or equal to 1.65, 1.96, and 2.58, it signifies that the time series has successfully undergone the significance test at the 90%, 95%, and 99% confidence levels, respectively.
2.3.5. Spatial Autocorrelation Analysis
Spatial autocorrelation measures the degree of correlation between a phenomenon in a given area and the same phenomenon in adjacent areas [47]. Global Moran’s I is the most commonly used statistical indicator for testing spatial clustering [48]. Global Moran’s I was used to detect the overall spatial aggregation of average carbon stocks in Guiyang from 2000 to 2035. Additionally, hot spot analysis (Getis-Ord Gi*) was employed to identify local autocorrelation of carbon stocks. The formulas are as follows:
where denotes the number of pixels, the variable represents the standardized spatial weight matrix, signifies the carbon stocks value of pixel , while the variable denotes the carbon stocks value of pixel , and denotes the average carbon stocks value. The value of ranges from [−1, 1]. If > 0, it indicates a positive spatial correlation; if < 0, it indicates a negative spatial correlation. denotes the standard deviation of carbon stocks and denotes the statistical value, where the larger the value, the higher the concentration of carbon stock hot spots, and vice versa for cold spots.
2.3.6. Geographical Detector Model
Geographical detector was used to investigate the spatial distribution of carbon stocks and their driving factors, including single-factor detection and interaction factor detection [49]. A higher q value indicates a stronger explanatory power of the driving factor for the spatial distribution of carbon stores. We employed interaction factor detection to evaluate the cumulative effect of various impacts on carbon stocks. The results of the interaction detection were classified into five types: nonlinear attenuation, single-factor nonlinear attenuation, double-factor enhancement, independent, and nonlinear enhancement. The formulas are as follows:
where denotes the number of samples in layer , denotes the total number of samples, denotes the variance of the dependent variable within layer , denotes the total variance of the dependent variable in the study area, denotes the sum of variances within layer , and denotes the total variance in the study area. The value ranges from 0 to 1 and is a key indicator for assessing the control effect of driving factors on the spatial distribution of carbon stocks. The larger the q value, the stronger the explanatory effect of the driving factors [50].
Based on relevant studies [27,42,51] and the particular characteristics of the study region, the determinants affecting carbon stocks’ variations—namely, AAP, AAT, NDVI, FVC, POP, GDP, and NTL—were selected (Figure 4). In ArcGIS 10.8, a fishnet with a cell size width and cell size length of 3000 was created to divide the Guiyang area. For each driving factor, natural breakpoint classification was used for reclassification, and the values of each category were extracted to the corresponding cells in the fishnet and imported into the geographical detector to complete the analysis of driving factors.
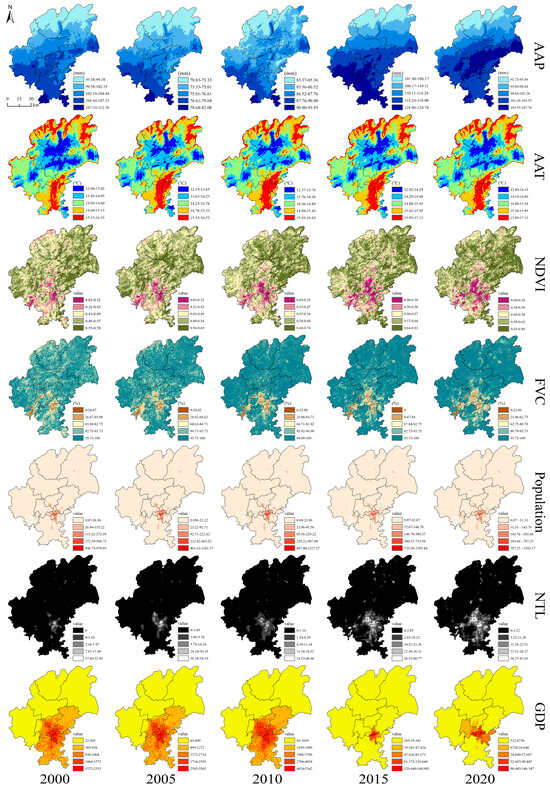
Figure 4.
Carbon stocks’ driving factors map, Guiyang.
3. Results
3.1. Land Cover Change in Guiyang
Figure 5 and Table 3 illustrate the land cover trends and alterations in Guiyang from 2000 to 2020. Forests constitute the predominant land cover type, representing about 54% of the total area over the previous two decades, predominantly located in the karst mountainous, hilly, and valley regions of eastern and northeastern Guiyang. By holding the soil in place with their roots and keeping water through layers of fallen leaves, these forests help prevent rock desertification, highlighting the need for ongoing efforts to protect native plants. Cropland comprises more than 32.5% of the total area, predominantly in the karst erosion basins south of Guiyang, with a characteristic pattern of “small patches, high fragmentation, and mosaic distribution.” This has limited extensive agricultural production and rendered the arable land ecosystem more vulnerable to external perturbations. Impervious surfaces are predominantly concentrated in the central river valley basin, including parts of Nanming, Yunyan, Guanshanhu, Wudang, and Baiyun. Over the past two decades, the area of impervious surfaces has steadily increased, rising from 4.65% to 7.14%, an increase of 199.73 km2, forming a radiating pattern centered on the urban core. The area of cropland decreased from 56.67% to 54.77%, a reduction of 152.29 km2. The areas of water body and unused land remained relatively stable, thereby alleviating to a certain extent the damage caused by human activities to the ecological foundation.
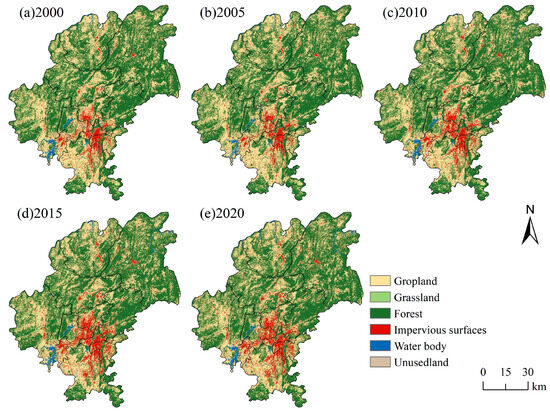
Figure 5.
Land cover map of Guiyang.

Table 3.
Land cover area and percentage in Guiyang (km2).
Trends in land cover change from 2000 to 2020 are illustrated in Figure 6, revealing a bidirectional conversion process between cropland and forest, where land reclamation and ecological restoration coexist together. Throughout the study period, the total area of land cover conversion amounted to 250.02 km2, with 71.90% (179.78 km2) converted to impervious surfaces, 12.57% (31.43 km2) converted to cropland, and 11.97% (29.94 km2) converted to forest. Amid rising urbanization, there has been a shift from “deforestation for land reclamation” to “returning cropland to forest” for ecological restoration. The alteration of land cover throughout the study period displayed various phases: From 2000 to 2010, during the initial stage of urbanization, impervious surfaces increased by 82.72 km2, and the main area of encroachment is located at the edge of cropland, reflecting the fragmented nature of karst cropland. From 2010 to 2015, in the accelerated urbanization phase, changes in impervious surfaces were most pronounced, with 59.94 km2 of cropland converted into impervious surfaces and 19.84 km2 of forest converted into cropland. The conflict between urban growth and the necessity for heightened agricultural output has intensified ecological vulnerability. From 2015 to 2020, the scale of changes slowed but remained at a high intensity. Although the degree of surface fragmentation has slowed, instability within the land system remains.
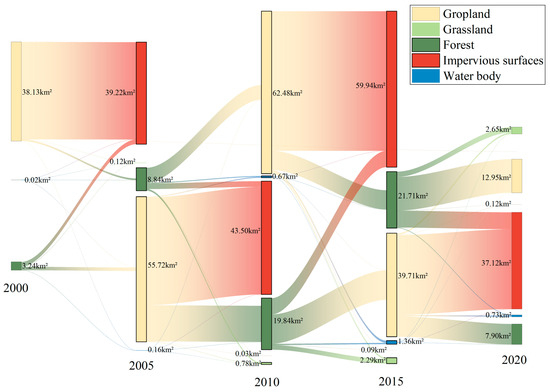
Figure 6.
Land cover change in Guiyang from 2000 to 2020.
3.2. Land Cover Prediction and Validation Based on CA-ANN
In the MLP module, 3000 sample points were randomly generated, with the neighborhood value of the training dataset set to 1 × 1 pixel. The model training parameters were configured as follows: a learning rate of 0.001, a maximum iteration count of 2000, 10 hidden layers, and a momentum parameter of 0.05. The model’s prediction ability was enhanced by increasing the learning depth of the neural network [19,52]. The results presented in Figure 7 show that the difference between the training data (green curve) and the validation data (red curve) is minimal, and the curves are smoothly distributed without noticeable peaks.
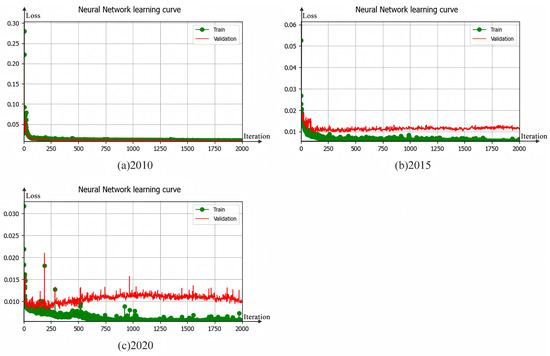
Figure 7.
ANN prediction model learning curve.
As shown in Figure 8, the reliability of the model classification was assessed by comparing the spatial distribution characteristics of the simulated land cover data for three years (2010, 2015, and 2020) with the GLC_FCS30D dataset. The findings demonstrate that the overall accuracy rates of land cover classification for the years 2010, 2015, and 2020 were 95.89%, 95.78%, and 93.99%, respectively, with corresponding Kappa coefficients ranging from 0.89 to 0.93 (Table 4), suggesting that the classification system has a high capacity to distinguish land cover types. The prediction results generated by the cellular-automaton-based artificial neural network model (CA-ANN) closely align with the actual land cover data in terms of patch shape and spatial distribution relationships.
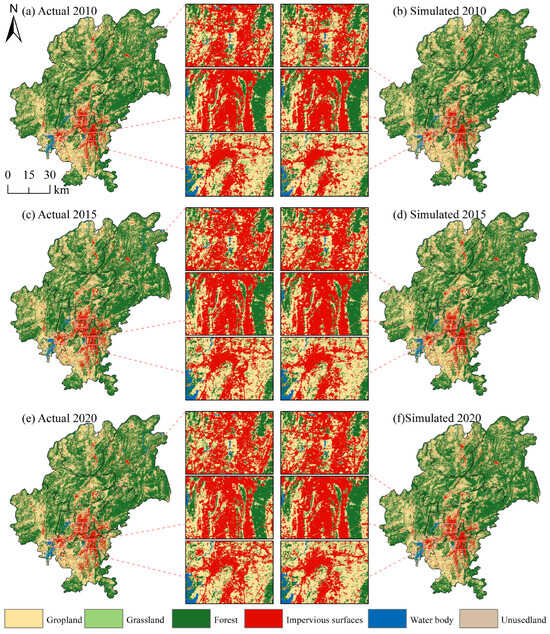
Figure 8.
Comparison of simulated land cover with actual GLC_FCS30D data.

Table 4.
Simulated land cover classification accuracy (km2).
3.3. Prediction of Land Cover Change in Guiyang
Based on the debugging, training, and validation of the CA-ANN model described above, it is evident that the model exhibited strong applicability and accuracy in Guiyang. Consequently, the trained CA-ANN model was used to predict the land cover conditions of the study area for 2025, 2030, and 2035. Figure 9 presents the predicted land cover results for the study area in these years. Under the natural development scenario, cropland area is projected to increase by 6.87 km2 by 2035 (Table 5), accounting for 32.65% of the total land area, up from 32.43% in 2020. This increase is attributed to the systematic implementation of land consolidation projects and innovations in arable land protection policies. The expansion of impervious surfaces is the most significant, with an increase of 34.97 km2, accounting for 7.57% of the total land area. This expansion is concentrated in urban core growth areas, such as the southern parts of Guanshanhu and Huaxi, reflecting the rigid demand for population concentration and industrial development. Meanwhile, forest and grassland areas exhibit a declining trend, decreasing by 10.34 km2 and 30.56 km2, respectively, primarily transforming into impervious surfaces during the rapid urbanization process. This may further intensify the possible risk of rock desertification and impact hydrological systems.
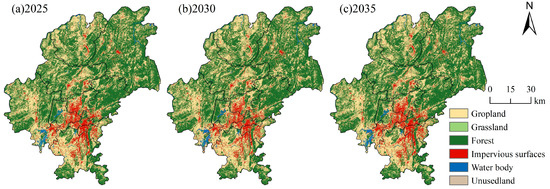
Figure 9.
Predicted land cover map.

Table 5.
Predicted land cover change (km2).
3.4. Characteristics of Carbon Stock Changes
3.4.1. Time Series Characteristics of Carbon Stocks
As shown in Figure 10, carbon stocks in Guiyang and its various regions from 2000 to 2035 exhibited a continuous downward trend. The total carbon stocks in the city fluctuated between 925.16 × 10⁵ and 969.98 × 10⁵ t, with a peak of 969.98 × 10⁵ t in 2005, and this is directly associated with the significant coverage of high forest and grassland vegetation during this period. The most significant decline occurred between 2005 and 2010, with a reduction of 16.04 × 10⁵ t over five years. The initial phase of urbanization has led to the ongoing transformation of arable land into impervious surfaces, thereby intensifying the depletion of carbon stocks. According to land cover prediction results, under the natural development scenario from 2020 to 2035, the average annual decrease is projected to be 0.93 × 10⁵ t, with average carbon stocks of 944.65 × 10⁵ t. It is expected that carbon stocks will reach their lowest level (925.16 × 10⁵ t) by 2030, and the decline will slow significantly by 2035, with a reduction of 1.99 × 10⁵ t. In this scenario, the excessive consumption of karst region carbon resources during the urbanization process has surpassed the self-regulatory capacity of the ecosystem, necessitating ecological protection and policy interventions to mitigate the situation.
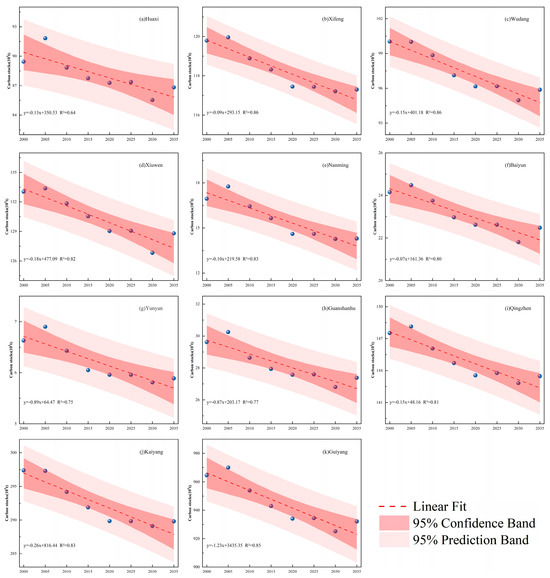
Figure 10.
Trend chart of carbon stock changes in different regions of Guiyang.
Using Theil–Sen median trend analysis and Mann–Kendall tests, we quantitatively assessed the spatiotemporal trend characteristics of carbon stocks in the study area and tested their statistical significance. The results show that, between 2000 and 2035, 97.69% of the carbon stocks in Guiyang exhibited no significant change (Figure 11), while 1.90% of the area experienced a significant decrease, distributed across all regions. More pronounced reductions were observed in areas such as Huaxi, Nanming, Baiyun, and Guanshanhu. Throughout the urbanization process, ecological protection policies have limited large-scale, high-intensity land cover changes, effectively preventing significant fluctuations in carbon stocks and maintaining overall stability in regional carbon stocks. The significant reduction in carbon stocks due to urbanization is primarily concentrated in urban central areas.
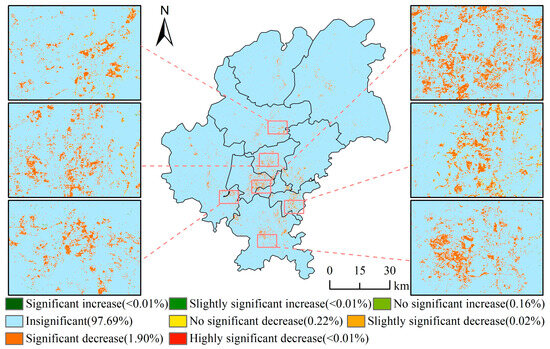
Figure 11.
Carbon stocks trends and significance tests.
3.4.2. Spatial Characteristics of Carbon Stocks
Global Moran’s I was used to detect the overall spatial clustering characteristics of carbon stocks in Guiyang from 2000 to 2035. The findings indicate that Moran’s I was continuously above 0.13, Z-scores surpassed 7.73, and all p-values were 0 (Table 6), indicating a strong spatial autocorrelation in the distribution of carbon stocks in Guiyang. Based on the global Moran’s I results, hot spot analysis was conducted to further investigate the local autocorrelation of carbon stocks in the study area. The hot spot analysis results, presented in Figure 12, show that the spatial clustering of carbon stocks was predominantly insignificant. These minor regions were predominantly in the central–northern section of Kaiyang, the northeastern section of Xifeng, the northeastern section of Xiuwen, and the eastern and western sections of Qingzhen. The land cover in these regions consists mainly of cropland and forest, human activity interference is weak, and development intensity is low, which depend on high-density vegetation cover to maintain elevated carbon stocks levels, resulting in relatively stable spatial clustering patterns. Hot spots with a confidence level ≥90% were concentrated in the eastern part of Guiyang, including the southern part of Kaiyang and the northeastern part of Wudang. The little fragmentation of karst mountains in these regions fosters a good link between carbon sequestration and hotspot stability, underscoring the efficacy of ecological conservation strategies. Conversely, cold spots with a confidence level ≥90% were found in the southern part of the central urban area, including the central and southern parts of Baiyun, the eastern part of Guanshanhu, western Nanming, central–northern Huaxi, and southeastern Qingzhen. The central urban area exhibited significantly lower carbon density due to intensive land development, high population density, and dense commercial activities, resulting in distinct cold spot areas. In summary, the synergistic impact of ecological conservation and urban development has preserved a dynamic equilibrium in the spatial allocation of carbon stocks in Guiyang from 2000 to 2035.

Table 6.
Global Moran’s I for carbon stocks.
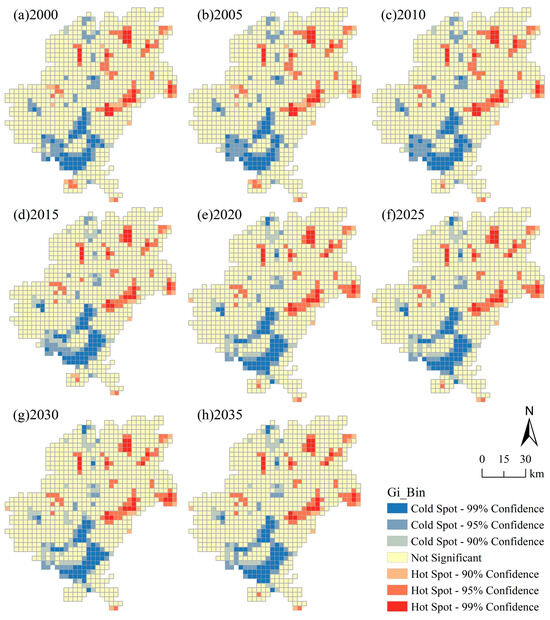
Figure 12.
Carbon stock hot spots and cold spots distribution map.
3.5. Driving Factors of Carbon Stock Changes
We employed a geographic detector to examine the determinants of carbon stocks’ variations in the research area from 2000 to 2020. Table 7 displays the outcomes of single-factor detection throughout various years. Changes in carbon stocks were affected by many natural and societal forces. Aside from AAP, there were significant differences in how key factors affected the way carbon stocks changed over time and space among those that were statistically significant. NDVI demonstrated the highest explanatory capability from 2000 to 2020, recording a q value of 0.3104 in 2005 and an average q value of 0.2664. The research area was primarily forested, with a much greater carbon density than other land cover types, including impermeable surfaces. Even though human activities have reduced the importance of vegetation, the ongoing buildup of carbon in forest carbon pools has kept the level of greenness as the main factor. AAP and AAT had the lowest explanatory power for carbon stocks’ variation, with q values of 0.0277 and 0.0356, respectively. The regulatory effect of vegetation may weaken the impact of temperature and precipitation factors. The impact of different driving factors on carbon stocks fluctuated each year; nevertheless, the primary causes remained predominantly stable, with NDVI consistently identified as the most influential component each year.

Table 7.
Driving factors of carbon stocks.
The results of the interaction analysis (Figure 13) revealed two types of interaction: two-factor enhancement and nonlinear enhancement. Compared to single-factor analysis, any two-factor interaction exerted a stronger influence on carbon stock differentiation. In 2010, the combination of X2 and X3 showed the strongest ability to explain the results (q = 0.3293), which was closely linked to how well the afforestation and grassland restoration project was working at that time. These two factors synergistically enhanced the explanatory power of carbon stocks’ differentiation. Across different years, the interaction between X2 and X5 consistently demonstrated a two-factor enhancement pattern. During rapid urbanization, the accelerated growth of the population and the urban heat island effect in central urban areas jointly exacerbated the spatial differentiation of carbon stocks. In short, the way AAT ∩ NDVI work together is the main factor affecting how carbon stocks are distributed and change in Guiyang’s ecosystems. The regional differences and changes in carbon stocks within Guiyang’s ecosystems result from the combined effects of multiple factors acting synergistically.
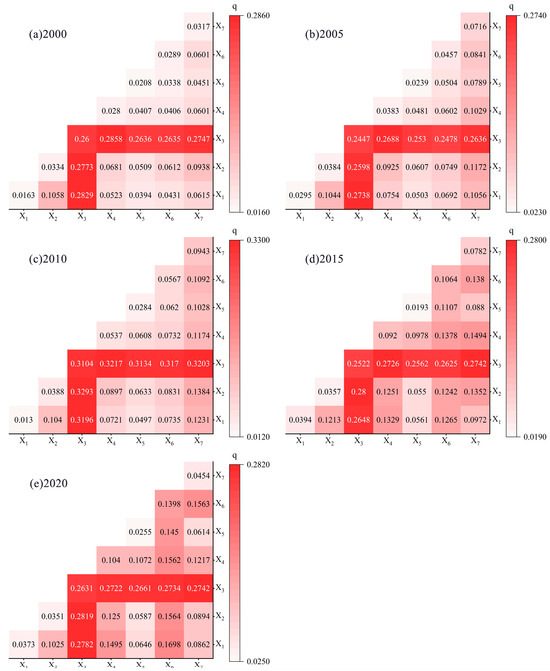
Figure 13.
Interaction detection results for different years: X1 corresponds to AAP, X2 corresponds to AAT, X3 corresponds to NDVI, X4 corresponds to FVC, X5 corresponds to POP, X6 corresponds to NTL, and X7 corresponds to GDP.
4. Discussion
4.1. Dynamic Changes in Land Cover and Their Impact on Carbon Stocks
LUCC happens because of a mix of different factors, including natural conditions, social and economic influences, and human activities [53]. Various factors, such as surface fragmentation, ecological vulnerability, and policy goals, influence land cover alterations in mountainous urban areas. This research analyzed alterations in land cover in Guiyang from 2000 to 2020. During this interval, impervious surfaces expanded from 374.25 km2 to 573.98 km2, signifying a gain of 53.37%. This spatial growth created a radial sprawl pattern centered on the urban core, predominantly at the cost of ecological land, including cropland and forest. The proliferation of impermeable surfaces was primarily influenced by national policies, encompassing population growth, regional economic advancement, and the Western Development Strategy. Additionally, land fragmentation profoundly affected land cover in Guiyang. The expansion of the urban boundaries resulted in an increase in fragmented zones within the central metropolitan area, causing a decline in agriculture and forest areas, as well as a cropland, in regional carbon stocks. This fragmentation adversely impacted agricultural production, modernization, and food security [54].
Rapid urbanization has exacerbated the impact of land cover changes on ecosystem carbon stocks [55]. Land cover changes affect soil composition and vegetation cover, significantly influencing terrestrial carbon stocks [56]. From 2000 to 2020, carbon stocks in the study area exhibited an overall declining trend (Figure 10), with a cumulative decrease of 2.34 × 10⁵ t. High-carbon-density lands, such as cropland and forest, were converted into low-carbon-density impervious surfaces. Since the implementation of the policy to convert cropland to forest and grassland, forest loss has been effectively mitigated, and the grassland area has seen a modest increase. Forest area slightly expanded between 2000 and 2010, leading to regional carbon stocks stabilizing. From 2010 to 2020, Guiyang executed water conservation initiatives, leading to a 67.38% expansion in the water body area, which signifies a net increase of 23.36% relative to the year 2000. This provides important reference for the restoration of aquatic ecosystems in karst regions. During the rapid urbanization process, impervious surfaces continued to expand in the region. In the past twenty years, Guiyang’s permanent resident population rose from 3.37 million to 5.99 million, reflecting an average annual growth rate of 2.91%. Simultaneously, GDP increased from 27.15 billion yuan to 431.17 billion yuan, exhibiting an average annual growth rate of 14.83% [57]. This rapid economic growth accelerated the transformation of land cover types, contributing to a decline in regional carbon stocks. Additionally, model predictions suggested that under a natural development scenario, carbon stocks will continue to decline through 2035. Urban expansion in Guiyang remains a long-term trend, as indicated by the approval of the “Qianzhong Urban Agglomeration” development plan [58,59], the implementation of the “Strengthening the Provincial Capital” strategy [60], and the promotion of “new-type urbanization” [61,62]. To mitigate the ongoing depletion of carbon stocks during urban expansion, it is essential to promote intensive conservation of land resources.
4.2. Determinants of Spatial Variation in Carbon Stocks
The results of single-factor detection are presented in Table 7. The level of greenness was a key factor driving changes in regional carbon stocks. As China’s first national forest city, Guiyang has strictly adhered to the minimum forest coverage rate, achieving a forest coverage rate of 55.3% by the end of 2023 [63]. Ecological initiatives, such as afforestation, grassland restoration, and stone desertification control, have made the level of greenness the dominant factor influencing regional variation and changes in carbon stocks, while carbon emissions from economic activities have been partially offset. Karst mountainous areas, characterized by shallow soil layers [64], result in limited soil organic carbon stocks. Root systems of vegetation are essential in mitigating soil erosion and preserving soil organic carbon [65]. Carbon stocks are less influenced by other factors, such as topography and climate.
In interaction analysis (Figure 13), the strongest interaction factor across different years was AAT ∩ NDVI, which had a greater impact than single vegetation factors, natural elements, such as terrain and climate, and socioeconomic factors. The level of greenness provides the biomass foundation for carbon stocks, while AAT regulates the vegetation growth cycle and photosynthetic efficiency, synergistically enhancing regional differences in carbon stocks. With the advancement of ecological civilization strategies and projects like the “Thousand Parks City” and “Comprehensive Governance of Karst Desertification,” the regional ecological environment has improved. The forest coverage rate in the city has continued to increase, and the karst soil erosion modulus has shown a decreasing trend. The coupled effect of human activity disturbance and natural erosion processes has significantly weakened [66]. Therefore, in karst mountain ecological management, maximizing carbon stocks through the synergistic optimization of vegetation quality and carbon sequestration efficiency is essential, providing a scientific basis for the “dual carbon” pathway of mountain cities.
4.3. Uncertainty Analysis of Land Cover Prediction and Carbon Stocks Estimation
This study provided preliminary results in the assessment of land cover and carbon stocks in mountainous cities; however, significant uncertainties remain. First, although machine learning models performed well using 3000 samples, biases in parameter settings may lead to errors in land cover classification. Additionally, this study was limited to natural scenarios and did not consider land cover simulations under sudden natural disasters, specific scenarios, climate change impacts, or policy-driven conditions. It also overlooked a comprehensive assessment of future land cover and carbon storage. In geographical detector analysis, the explanatory power of factors was relatively low, influenced by the synergistic effects of land surface fragmentation, ecological vulnerability, and high-intensity human intervention. Subsequent studies should incorporate multi-scale analysis methods to improve this aspect. Although the carbon density parameters in the InVEST model were adjusted, data accuracy still needs improvement. Field surveys of vegetation structure and sampling and analysis of carbon density data for different vegetation types were neglected. The heterogeneity of carbon storage within land cover types should be fully considered. The spatial resolution of multi-source remote sensing data cannot yet be unified. The natural breakpoint classification method was used for data import and classification, which is highly subjective, limiting predictions to medium spatial resolution and potentially insufficient to capture changes in land cover and carbon storage at small scales. Therefore, future research will focus on more comprehensively assessing the impacts of land cover changes on ecosystem services, exploring the balance among various ecosystem services under different future scenarios, and seeking higher-resolution land cover data to enhance the accuracy of carbon stock change predictions.
5. Conclusions
Using the ANN–InVEST–geographical detector integrated model framework, this study predicted future land cover changes in Guiyang, quantitatively assessed their impact on carbon stocks, and analyzed the driving mechanisms behind various factors. This research is crucial for formulating regional sustainable development strategies and enhancing ecological quality. The main conclusions were as follows:
- From 2000 to 2020, forest was the dominant land cover type in Guiyang, encompassing a total land cover change area of 250.02 km2 and an increase of 179.78 km2 in impervious surfaces, primarily resulting from the conversion of cropland and forest.
- Machine learning prediction models demonstrated good applicability and high accuracy in Guiyang, with Kappa coefficients exceeding 0.91 and overall accuracy surpassing 93.99%. Impervious surfaces are projected to continue expanding in the study area through 2035.
- From 2000 to 2035, carbon stocks in Guiyang will first increase and then decrease, demonstrating a regional distribution of elevated values in the west and north and diminished values in the central and southern areas. The expansion of impervious surfaces will further reduce carbon stocks, and changes in carbon stocks showed high consistency with land cover changes both temporally and spatially. The spatial distribution of carbon stocks in the study area remains predominantly stable.
- Natural factors dominated the spatial differentiation of carbon stocks. The dynamic changes in carbon stocks were driven by multiple factors acting synergistically, with NDVI being the strongest individual driver. AAT and NDVI were the most important interactive drivers, and the interaction between NDVI and POP continued to strengthen its influence on carbon stocks.
Author Contributions
R.L., writing—original draft, data curation, and visualization; Z.Z., conceptualization, supervision, and funding acquisition; J.K., writing—review and editing; C.W., investigation and writing—review and editing; Y.W., writing—review and editing; R.X., writing—review and editing; C.D., writing—review and editing; X.Z., writing—review and editing. All authors have read and agreed to the published version of the manuscript.
Funding
This research was funded by Guizhou Provincial Key Laboratory Construction Project, “Guizhou Provincial Key Laboratory of Remote Sensing Big Data Intelligent Processing and Application” (Qian Ke He Ping Tai [2025] 014), Guizhou Provincial 2025 Central Government—Guided Local Science and Technology Development Fund Project, “Construction of a Deep—Time Digital Earth Evolution and Cloud—Computing Platform in Karst Mountainous Areas” (Qian Ke He Zhong Yin Di [2025] 031), and Guizhou Provincial 2023 Central Government—Guided Local Science and Technology Development Fund Project, “National Technology Innovation Center for Karst Rocky Desertification Control and Green Development” (Qian Ke He Zhong Yin Di [2023] 005).
Data Availability Statement
All the data used in this study are mentioned in Section 2.
Conflicts of Interest
The authors declare that they have no known competing financial interests or personal relationships that could have influenced the work reported in this paper.
References
- McCarthy, J.J. Climate Change 2001: Impacts, Adaptation, and Vulnerability: Contribution of Working Group II to the Third Assessment Report of the Intergovernmental Panel on Climate Change; Cambridge University Press: Cambridge, UK, 2001; Volume 2. [Google Scholar]
- Wei, W.; Hao, S.; Yao, M.; Chen, W.; Wang, S.; Wang, Z.; Wang, Y.; Zhang, P. Unbalanced economic benefits and the electricity-related carbon emissions embodied in China’s interprovincial trade. J. Environ. Manag. 2020, 263, 110390. [Google Scholar] [CrossRef]
- Wang, Z.; Li, X.; Mao, Y.; Li, L.; Wang, X.; Lin, Q. Dynamic simulation of land use change and assessment of carbon storage based on climate change scenarios at the city level: A case study of Bortala, China. Ecol. Indic. 2022, 134, 108499. [Google Scholar] [CrossRef]
- Liu, Y.; Chen, G.; Meyer-Jacob, C.; Huang, L.; Liu, X.; Huang, G.; Klamt, A.-M.; Smol, J.P. Land-use and climate controls on aquatic carbon cycling and phototrophs in karst lakes of southwest China. Sci. Total Environ. 2021, 751, 141738. [Google Scholar] [CrossRef]
- Dong, H.; Liu, Y.; Zhao, Z.; Tan, X.; Managi, S. Carbon neutrality commitment for China: From vision to action. Sustain. Sci. 2022, 17, 1741–1755. [Google Scholar] [CrossRef]
- Mendoza-Ponce, A.; Corona-Núñez, R.O.; Nava, L.F.; Estrada, F.; Calderón-Bustamante, O.; Martínez-Meyer, E.; Carabias, J.; Larralde-Corona, A.H.; Barrios, M.; Pardo-Villegas, P.D. Impacts of land management and climate change in a developing and socioenvironmental challenging transboundary region. J. Environ. Manag. 2021, 300, 113748. [Google Scholar] [CrossRef]
- Zafar, Z.; Zubair, M.; Zha, Y.; Mehmood, M.S.; Rehman, A.; Fahd, S.; Nadeem, A.A. Predictive modeling of regional carbon storage dynamics in response to land use/land cover changes: An InVEST-based analysis. Ecol. Inform. 2024, 82, 102701. [Google Scholar] [CrossRef]
- Chen, W.; Zeng, J.; Li, N. Change in land-use structure due to urbanisation in China. J. Clean. Prod. 2021, 321, 128986. [Google Scholar] [CrossRef]
- Fu, K.; Chen, L.; Yu, X.; Jia, G. How has carbon storage changed in the Yili-Tianshan region over the past three decades and into the future? What has driven it to change? Sci. Total Environ. 2024, 945, 174005. [Google Scholar] [CrossRef]
- Lambin, E.F.; Geist, H.J.; Lepers, E. Dynamics of land-use and land-cover change in tropical regions. Annu. Rev. Environ. Resour. 2003, 28, 205–241. [Google Scholar] [CrossRef]
- Lukas, P.; Melesse, A.M.; Kenea, T.T. Prediction of future land use/land cover changes using a coupled CA-ANN model in the upper omo–gibe river basin, Ethiopia. Remote Sens. 2023, 15, 1148. [Google Scholar] [CrossRef]
- Liu, X.; Liang, X.; Li, X.; Xu, X.; Ou, J.; Chen, Y.; Li, S.; Wang, S.; Pei, F. A future land use simulation model (FLUS) for simulating multiple land use scenarios by coupling human and natural effects. Landsc. Urban Plan. 2017, 168, 94–116. [Google Scholar] [CrossRef]
- Liang, X.; Guan, Q.; Clarke, K.C.; Liu, S.; Wang, B.; Yao, Y. Understanding the drivers of sustainable land expansion using a patch-generating land use simulation (PLUS) model: A case study in Wuhan, China. Comput. Environ. Urban Syst. 2021, 85, 101569. [Google Scholar] [CrossRef]
- Zhang, X.; Li, A.; Nan, X.; Lei, G.; Wang, C. Multi-scenario simulation of land use change along China-Pakistan Economic Corridor through coupling FLUS model with SD model. J. Geoinf. Sci. 2020, 22, 2393–2409. [Google Scholar]
- Selmy, S.A.; Kucher, D.E.; Mozgeris, G.; Moursy, A.R.; Jimenez-Ballesta, R.; Kucher, O.D.; Fadl, M.E.; Mustafa, A.-r.A. Detecting, analyzing, and predicting land use/land cover (LULC) changes in arid regions using landsat images, CA-Markov hybrid model, and GIS techniques. Remote Sens. 2023, 15, 5522. [Google Scholar] [CrossRef]
- Geng, J.; Shen, S.; Cheng, C.; Dai, K. A hybrid spatiotemporal convolution-based cellular automata model (ST-CA) for land-use/cover change simulation. Int. J. Appl. Earth Obs. Geoinf. 2022, 110, 102789. [Google Scholar] [CrossRef]
- Admas, M.; Melesse, A.M.; Tegegne, G. Predicting the Impacts of Land Use/Cover and Climate Changes on Water and Sediment Flows in the Megech Watershed, Upper Blue Nile Basin. Remote Sens. 2024, 16, 2385. [Google Scholar] [CrossRef]
- Bhattacharyya, S.; Sinha, S.; Kumari, M.; Mishra, V.N.; Hasher, F.F.B.; Szostak, M.; Zhran, M. Spatio-Temporal Influences of Urban Land Cover Changes on Thermal-Based Environmental Criticality and Its Prediction Using CA-ANN Model over Kolkata (India). Remote Sens. 2025, 17, 1082. [Google Scholar] [CrossRef]
- Li, C.; Xu, H.; Du, P.; Tang, F. Predicting land cover changes and carbon stock fluctuations in Fuzhou, China: A deep learning and InVEST approach. Ecol. Indic. 2024, 167, 112658. [Google Scholar] [CrossRef]
- Zhang, M.; Tan, S.; Liang, J.; Zhang, C.; Chen, E. Predicting the impacts of urban development on urban thermal environment using machine learning algorithms in Nanjing, China. J. Environ. Manag. 2024, 356, 120560. [Google Scholar] [CrossRef]
- Xiang, X.; Zhai, Z.; Fan, C.; Ding, Y.; Ye, L.; Li, J. Modelling future land use land cover changes and their impacts on urban heat island intensity in Guangzhou, China. J. Environ. Manag. 2024, 366, 121787. [Google Scholar] [CrossRef]
- Halder, B.; Bandyopadhyay, J.; Banik, P. Monitoring the effect of urban development on urban heat island based on remote sensing and geo-spatial approach in Kolkata and adjacent areas, India. Sustain. Cities Soc. 2021, 74, 103186. [Google Scholar] [CrossRef]
- Ni, C.; Mao, F.; Du, H.; Li, X.; Xu, Y.; Huang, Z. Spatiotemporal Evolution and Influencing Factors of Forest Carbon Storage Based on BIOME-BGC Model and Geographical Detector in Eight Basins of Zhejiang Province in China. Forests 2025, 16, 316. [Google Scholar] [CrossRef]
- Zhou, L.; Dang, X.; Sun, Q.; Wang, S. Multi-scenario simulation of urban land change in Shanghai by random forest and CA-Markov model. Sustain. Cities Soc. 2020, 55, 102045. [Google Scholar] [CrossRef]
- Luo, Z.; Chen, C.; She, J.; Wang, Y.; Tong, W.; Guo, Z. Spatiotemporal Analysis, Predictive Modeling, and Driving Mechanism Investigation of Carbon Storage Dynamics in Changde City Under the Framework of LUCC. Sustainability 2025, 17, 1273. [Google Scholar] [CrossRef]
- Liu, Y.; Huang, X.; Yang, H.; Zhong, T. Environmental effects of land-use/cover change caused by urbanization and policies in Southwest China Karst area–A case study of Guiyang. Habitat Int. 2014, 44, 339–348. [Google Scholar] [CrossRef]
- Wu, A.; Wang, Z. Multi-scenario simulation and carbon storage assessment of land use in a multi-mountainous city. Land Use Policy 2025, 153, 107529. [Google Scholar] [CrossRef]
- Hu, C.; Wu, W.; Zhou, X.; Wang, Z. Spatiotemporal changes in landscape patterns in karst mountainous regions based on the optimal landscape scale: A case study of Guiyang City in Guizhou Province, China. Ecol. Indic. 2023, 150, 110211. [Google Scholar] [CrossRef]
- Wang, X.; Wen, H.; Gui, B.; Liu, Z.; Yang, L. Urban terrain, mountain landscape, and housing price: A heterogeneous investigation of the amenity effects in a mountainous city (Guiyang) from the vertical dimension. Appl. Geogr. 2025, 174, 103479. [Google Scholar] [CrossRef]
- Chen, X.; Wang, Z.; Bao, Y. Cool island effects of urban remnant natural mountains for cooling communities: A case study of Guiyang, China. Sustain. Cities Soc. 2021, 71, 102983. [Google Scholar] [CrossRef]
- Kong, N.; Wang, Z. Response of plant diversity of urban remnant mountains to surrounding urban spatial morphology: A case study in Guiyang of Guizhou Province, China. Urban Ecosyst. 2022, 25, 437–452. [Google Scholar] [CrossRef]
- Luo, Q.; Bao, Y.; Wang, Z.; Chen, X. Potential recreation service efficiency of urban remnant mountain wilderness: A case study of Yunyan District of Guiyang city, China. Ecol. Indic. 2022, 141, 109081. [Google Scholar] [CrossRef]
- Li, Y.; Geng, H. Evolution of land use landscape patterns in karst watersheds of Guizhou Plateau and its ecological security evaluation. Land 2022, 11, 2225. [Google Scholar] [CrossRef]
- Zhang, X.; Zhao, T.; Xu, H.; Liu, W.; Wang, J.; Chen, X.; Liu, L. GLC_FCS30D: The first global 30-m land-cover dynamic monitoring product with a fine classification system from 1985 to 2022 using dense time-series Landsat imagery and continuous change-detection method. Earth Syst. Sci. Data Discuss. 2024, 16, 1353–1381. [Google Scholar] [CrossRef]
- Demessie, S.F.; Dile, Y.T.; Bedadi, B.; Tarkegn, T.G.; Bayabil, H.K.; Sintayehu, D.W. Assessing and projecting land use land cover changes using machine learning models in the Guder watershed, Ethiopia. Environ. Chall. 2025, 18, 101074. [Google Scholar] [CrossRef]
- Senthilkumar, C.; Alabdulkreem, E.; Alruwais, N.; Kavitha, M. Coastal spatial planning using object-based image analysis and image classification techniques. J. S. Am. Earth Sci. 2025, 152, 105322. [Google Scholar]
- Gu, M.; Ye, C.; Hu, M.; Lyu, X.; Li, X.; Hu, H.; Huang, X. Multi-scenario simulation of land use change based on MCR-SD-FLUS model: A case study of Nanchang, China. Trans. GIS 2022, 26, 2932–2953. [Google Scholar] [CrossRef]
- Huang, M.; Mamitimin, Y.; Abulizi, A.; Yimaer, R.; Tiemuerbieke, B.; Chen, H.; Tao, T.; Ma, Y. Integrated assessment of land use and carbon storage changes in the Tulufan-Hami Basin under the background of urbanization and climate change. Int. J. Appl. Earth Obs. Geoinf. 2024, 135, 104261. [Google Scholar] [CrossRef]
- Song, J.; He, X.; Zhang, F.; Ma, X.; Jim, C.Y.; Johnson, B.A.; Chan, N.W. Analyzing and Predicting LUCC and Carbon Storage Changes in Xinjiang’s Arid Ecosystems Under the Carbon Neutrality Goal. Remote Sens. 2024, 16, 4439. [Google Scholar] [CrossRef]
- Ding, F.; Pan, Z.; Wu, P.; Cui, Y.; Zhou, F. Carbon Accumulation and Distribution Characteristics of the Evergreen Broad-Leaved and Deciduous Broadleaved Mixed Forests in East Guizhou. Acta Ecol. Sin. 2015, 35, 1761–1768. [Google Scholar]
- Li, K.; Wang, S.; Cao, M. Carbon storage of vegetation and soil in China. Sci. China (Ser. D) 2003, 33, 72–80. [Google Scholar] [CrossRef]
- Du, S.; Zhou, Z.; Huang, D.; Zhang, F.; Deng, F.; Yang, Y. The response of carbon stocks to land use/cover change and a vulnerability multi-scenario analysis of the karst region in Southern China based on PLUS-InVEST. Forests 2023, 14, 2307. [Google Scholar] [CrossRef]
- Chen, F.; Xie, T.; Yang, Y.; Chen, S.; Chen, F.; Huang, W.; Chen, J. Discussion of the “warming and wetting” trend and its future variation in the drylands of Northwest China under global warming. Sci. China Earth Sci. 2023, 66, 1241–1257. [Google Scholar] [CrossRef]
- Alam, S.A.; Starr, M.; Clark, B.J. Tree biomass and soil organic carbon densities across the Sudanese woodland savannah: A regional carbon sequestration study. J. Arid Environ. 2013, 89, 67–76. [Google Scholar] [CrossRef]
- Fensholt, R.; Proud, S.R. Evaluation of Earth Observation based global long term vegetation trends—Comparing GIMMS and MODIS global NDVI time series. Remote Sens. Environ. 2012, 119, 131–147. [Google Scholar] [CrossRef]
- Zhang, Y.; Zhang, L.; Wang, J.; Dong, G.; Wei, Y. Quantitative analysis of NDVI driving factors based on the geographical detector model in the Chengdu-Chongqing region, China. Ecol. Indic. 2023, 155, 110978. [Google Scholar] [CrossRef]
- Tang, J.; Wang, Q.; Li, Z.; Gu, J.; Xu, J. Coupling coordination degree of industrial solid waste prevention and treatment efficiencies and its driving factors in China. Ecol. Indic. 2024, 158, 111395. [Google Scholar] [CrossRef]
- Moran, P.A. The interpretation of statistical maps. J. R. Stat. Soc. Ser. B (Methodol.) 1948, 10, 243–251. [Google Scholar] [CrossRef]
- Wang, J.-F.; Zhang, T.-L.; Fu, B.-J. A measure of spatial stratified heterogeneity. Ecol. Indic. 2016, 67, 250–256. [Google Scholar] [CrossRef]
- Wei, S.; Liu, X.; McNeill, M.R.; Wang, Y.; Sun, W.; Tu, X.; Wang, G.; Ban, L.; Zhang, Z.; Zhang, R. Identification of spatial distribution and drivers for grasshopper populations based on geographic detectors. Ecol. Indic. 2023, 154, 110500. [Google Scholar] [CrossRef]
- Chen, R.; Fei, X.; Zhu, J.; Chen, W.; Du, H.; Huang, Y.; Shen, Y.; Zhang, Y.; Niu, A.; Xu, P. Assessing carbon storage dynamics in an ecological civilization demonstration zone amid rapid urbanization: A multi-scenario study of Guizhou Province, China. Resour. Environ. Sustain. 2025, 21, 100223. [Google Scholar] [CrossRef]
- Khan, A.; Sudheer, M. Machine learning-based monitoring and modeling for spatio-temporal urban growth of Islamabad. Egypt. J. Remote Sens. Space Sci. 2022, 25, 541–550. [Google Scholar] [CrossRef]
- Wu, J.; Luo, J.; Zhang, H.; Qin, S.; Yu, M. Projections of land use change and habitat quality assessment by coupling climate change and development patterns. Sci. Total Environ. 2022, 847, 157491. [Google Scholar] [CrossRef]
- Gu, T.; Chen, W.; Liang, J.; Pan, S.; Ye, X. Identifying the driving forces of cultivated land fragmentation in China. Environ. Sci. Pollut. Res. 2023, 30, 105275–105292. [Google Scholar] [CrossRef]
- Kooch, Y.; Ghorbanzadeh, N.; Francaviglia, R. Soil carbon stocks can be negatively affected by land use and climate change in natural ecosystems of semi-arid environment of Iran. Geoderma Reg. 2022, 31, e00591. [Google Scholar] [CrossRef]
- Yang, H.; Huang, J.; Liu, D. Linking climate change and socioeconomic development to urban land use simulation: Analysis of their concurrent effects on carbon storage. Appl. Geogr. 2020, 115, 102135. [Google Scholar] [CrossRef]
- Huang, X.; Wang, H.; Shan, L.; Xiao, F. Constructing and optimizing urban ecological network in the context of rapid urbanization for improving landscape connectivity. Ecol. Indic. 2021, 132, 108319. [Google Scholar] [CrossRef]
- Sha, A.; Zhang, J.; Pan, Y.; Zhang, S. How to recognize and measure the impact of phasing urbanization on eco-environment quality: An empirical case study of 19 urban agglomerations in China. Technol. Forecast. Soc. Change 2025, 210, 123845. [Google Scholar] [CrossRef]
- Song, S.; Wang, S.; Xu, D.; Gong, Y. Elemental evolution characteristics and influencing factors of green infrastructure network in karst mountain cities: A case study of Qianzhong urban agglomeration in Southwest China. Ecol. Process. 2024, 13, 54. [Google Scholar] [CrossRef]
- Zhao, J.; Chen, W.; Liu, Z.; Liu, W.; Li, K.; Zhang, B.; Zhang, Y.; Yu, L.; Sakai, T. Urban expansion, economic development, and carbon emissions: Trends, patterns, and decoupling in mainland China’s provincial capitals (1985–2020). Ecol. Indic. 2024, 169, 112777. [Google Scholar] [CrossRef]
- Zhang, W.; Xu, Y.; Streets, D.G.; Wang, C. Can new-type urbanization realize low-carbon development? A spatiotemporal heterogeneous analysis in 288 cities and 18 urban agglomerations in China. J. Clean. Prod. 2023, 420, 138426. [Google Scholar] [CrossRef]
- Chen, M.; Zhou, Y.; Huang, X.; Ye, C. The integration of new-type urbanization and rural revitalization strategies in China: Origin, reality and future trends. Land 2021, 10, 207. [Google Scholar] [CrossRef]
- Wang, C.; Jin, J.; Davies, C.; Chen, W.Y. Urban forests as nature-based solutions: A comprehensive overview of the national forest city action in China. Curr. For. Rep. 2024, 10, 119–132. [Google Scholar] [CrossRef]
- Li, Y.; Li, K.; Zhou, Q.; Zhao, Y.; Cai, L.; Yang, Z. Spatiotemporal dynamics and similarity in soil moisture in shallow soils on karst slopes. J. Hydrol. 2024, 639, 131655. [Google Scholar] [CrossRef]
- Francaviglia, R.; Almagro, M.; Vicente-Vicente, J.L. Conservation agriculture and soil organic carbon: Principles, processes, practices and policy options. Soil Syst. 2023, 7, 17. [Google Scholar] [CrossRef]
- Fan, C.; Wang, Z.; Tang, N.; Deng, G. Construction of ecological network in downtown of Guiyang city based on morphologically spatial pattern and spatially principal component analysis. Acta Ecol. Sin. 2022, 42, 6620–6632. [Google Scholar] [CrossRef]
Disclaimer/Publisher’s Note: The statements, opinions and data contained in all publications are solely those of the individual author(s) and contributor(s) and not of MDPI and/or the editor(s). MDPI and/or the editor(s) disclaim responsibility for any injury to people or property resulting from any ideas, methods, instructions or products referred to in the content. |
© 2025 by the authors. Licensee MDPI, Basel, Switzerland. This article is an open access article distributed under the terms and conditions of the Creative Commons Attribution (CC BY) license (https://creativecommons.org/licenses/by/4.0/).