Article

Estimation of Ultrahigh Resolution PM2.5 in Urban Areas by Using 30 m Landsat-8 and Sentinel-2 AOD Retrievals

1
College of Geographic Science, Xinyang Normal University, Xinyang 464000, China
2
Henan Key Laboratory for Synergistic Prevention of Water and Soil Environmental Pollution, Xinyang Normal University, Xinyang 464000, China
3
School of Remote Sensing and Information Engineering, Wuhan University, Wuhan 430079, China
4
State Key Laboratory of Information Engineering in Surveying, Mapping and Remote Sensing, Wuhan University, Wuhan 430079, China
5
Perception and Effectiveness Assessment for Carbon-Neutrality Efforts, Engineering Research Center of Ministry of Education, Institute for Carbon Neutrality, Wuhan University, Wuhan 430072, China
6
College of Geographic and Environmental Science, Zhejiang Normal University, Jinhua 321004, China
*
Author to whom correspondence should be addressed.
Remote Sens. 2025, 17(15), 2609; https://doi.org/10.3390/rs17152609
Submission received: 16 June 2025 / Revised: 16 July 2025 / Accepted: 24 July 2025 / Published: 27 July 2025

Abstract

Ultrahigh resolution fine particulate matter (PM2.5) mass concentration remote sensing products are crucial for atmospheric environmental monitoring, pollution source verification, health exposure risk assessment, and other fine-scale applications in urban environments. This study developed an ultrahigh resolution retrieval algorithm to estimate 30 m resolution PM2.5 mass concentrations over urban areas from Landsat-8 and Sentinel-2A/B satellite measurements. The algorithm utilized aerosol optical depth (AOD) products retrieved from the Landsat-8 OLI and Sentinel-2 MSI measurements from 2017 to 2020, combined with multi-source auxiliary data to establish a PM2.5-AOD relationship model across China. The results showed an overall high coefficient of determination (R2) of 0.82 and 0.76 for the model training accuracy based on samples and stations, respectively. The model prediction accuracy in Beijing and Wuhan reached R2 values of 0.86 and 0.85. Applications in both cities demonstrated that ultrahigh resolution PM2.5 has significant advantages in resolving fine-scale spatial patterns of urban air pollution and pinpointing pollution hotspots. Furthermore, an analysis of point source pollution at a typical heavy pollution emission enterprise confirmed that ultrahigh spatial resolution PM2.5 can accurately identify the diffusion trend of point source pollution, providing fundamental data support for refined monitoring of urban air pollution and air pollution prevention and control.

1. Introduction

With the acceleration of urbanization, air pollution problems have become increasingly severe, particularly the pollution caused by fine particulate matter, which has emerged as a global environmental issue. Fine particulate matter (PM2.5), defined as particles with aerodynamic diameters less than 2.5 μm, represents a major source of atmospheric pollutants in urban areas, with anthropogenic emissions being the primary contributor. The sparse distribution of ground-based PM2.5 monitoring stations makes it difficult to capture the spatial variations of PM2.5 within urban areas. The acquisition of surface PM2.5 concentrations using remote sensing technology holds significant scientific value and practical importance for the comprehensive and dynamic monitoring of spatiotemporal variations in air pollution.
Most studies have established complex relationships between satellite-retrieved aerosol optical depth (AOD) and ground-based PM2.5 measurements through statistical models, empirical models, and machine learning models, effectively overcoming the coverage limitations of ground-based observations. Using AOD products combined with multi-source data such as land use types, meteorology, Normalized Difference Vegetation Index (NDVI) data, and topography to estimate the spatiotemporal distribution of PM2.5 is currently a research hotspot. In recent years, several different machine learning algorithms [1] have been applied to satellite-based PM2.5 concentration estimation, including Artificial Neural Network (ANN) models [2,3,4], Back Propagation Neural Networks (BPNNs) [5,6,7,8], Radial Basis Function Neural Networks (RBFs) [9,10], geographically intelligent Deep Belief Networks (DBNs) [11,12,13], Support Vector Machine Regression (SVM) [14,15,16], and Random Forest (RF) models [17,18,19,20,21,22,23,24]. Among these, RF is an ensemble learning algorithm that has been widely used in PM2.5 regression analysis due to its ease of parameter tuning, ability to maintain accuracy with missing features, interpretability of variable relationships, and straightforward model training process.
Despite these advancements, a critical barrier persists in spatial resolution limitations. Current PM2.5-AOD models predominantly employ coarse-resolution AOD products (≥1 km, e.g., MODIS/VIIRS AOD), resulting in correspondingly low-resolution PM2.5 estimates [25,26]. These relatively coarse-resolution PM2.5 remote sensing products are advantageous for monitoring aerosol radiative forcing and climate effects at global or regional scales, but they fail to meet the requirements for urban air pollution monitoring, forecasting, meteorological analysis, and climate studies [17,24,27,28,29,30,31] due to the strong spatiotemporal heterogeneity of atmospheric pollution in urban environments. Pioneering work by Sun [32] and Zhang [33] demonstrated the feasibility of 160 m resolution PM2.5 mapping using GF-1 satellite data through linear mixture modeling, albeit with constrained temporal revisit (4-day cycles). Recent breakthroughs by Lin [34] established a novel framework combining Landsat-8 and Sentinel-2 observations to achieve concurrent enhancements in spatial (30 m) and temporal (2–3 day) resolutions, enabling unprecedented detail in urban aerosol pollution analysis. Wei [35] developed a global aerosol retrieval algorithm over land from Landsat imagery integrating Transformer and Google Earth Engine. These high resolution retrieval systems now provide the technical foundation for refined air quality monitoring at neighborhood scales [36,37,38,39,40].
In response to the issue of low spatial resolution in existing PM2.5 remote sensing products, which makes it difficult to meet the needs of atmospheric pollution monitoring at a fine urban scale, we have developed an ultrahigh resolution PM2.5 remote sensing retrieval algorithm for urban areas. Using AOD products retrieved from the Landsat-8 OLI and Sentinel-2A/B MSI observations in Beijing and Wuhan from 2017 to 2020 [34], combined with ground-measured PM2.5 concentration data, meteorological parameters (such as boundary layer height, relative humidity, surface temperature, atmospheric pressure, etc.), and other satellite remote sensing auxiliary data (such as land use types, NDVI, etc.), we constructed a PM2.5-AOD relationship model based on the RF. We then retrieved ultrahigh resolution PM2.5 concentration products for Beijing and Wuhan and analyzed their spatiotemporal variations. The study area and data used in this research are described in Section 2. The method is presented in Section 3. The accuracy evaluation and analysis are discussed in Section 4. Section 5 provides our conclusion.

2. Study Region and Data Description
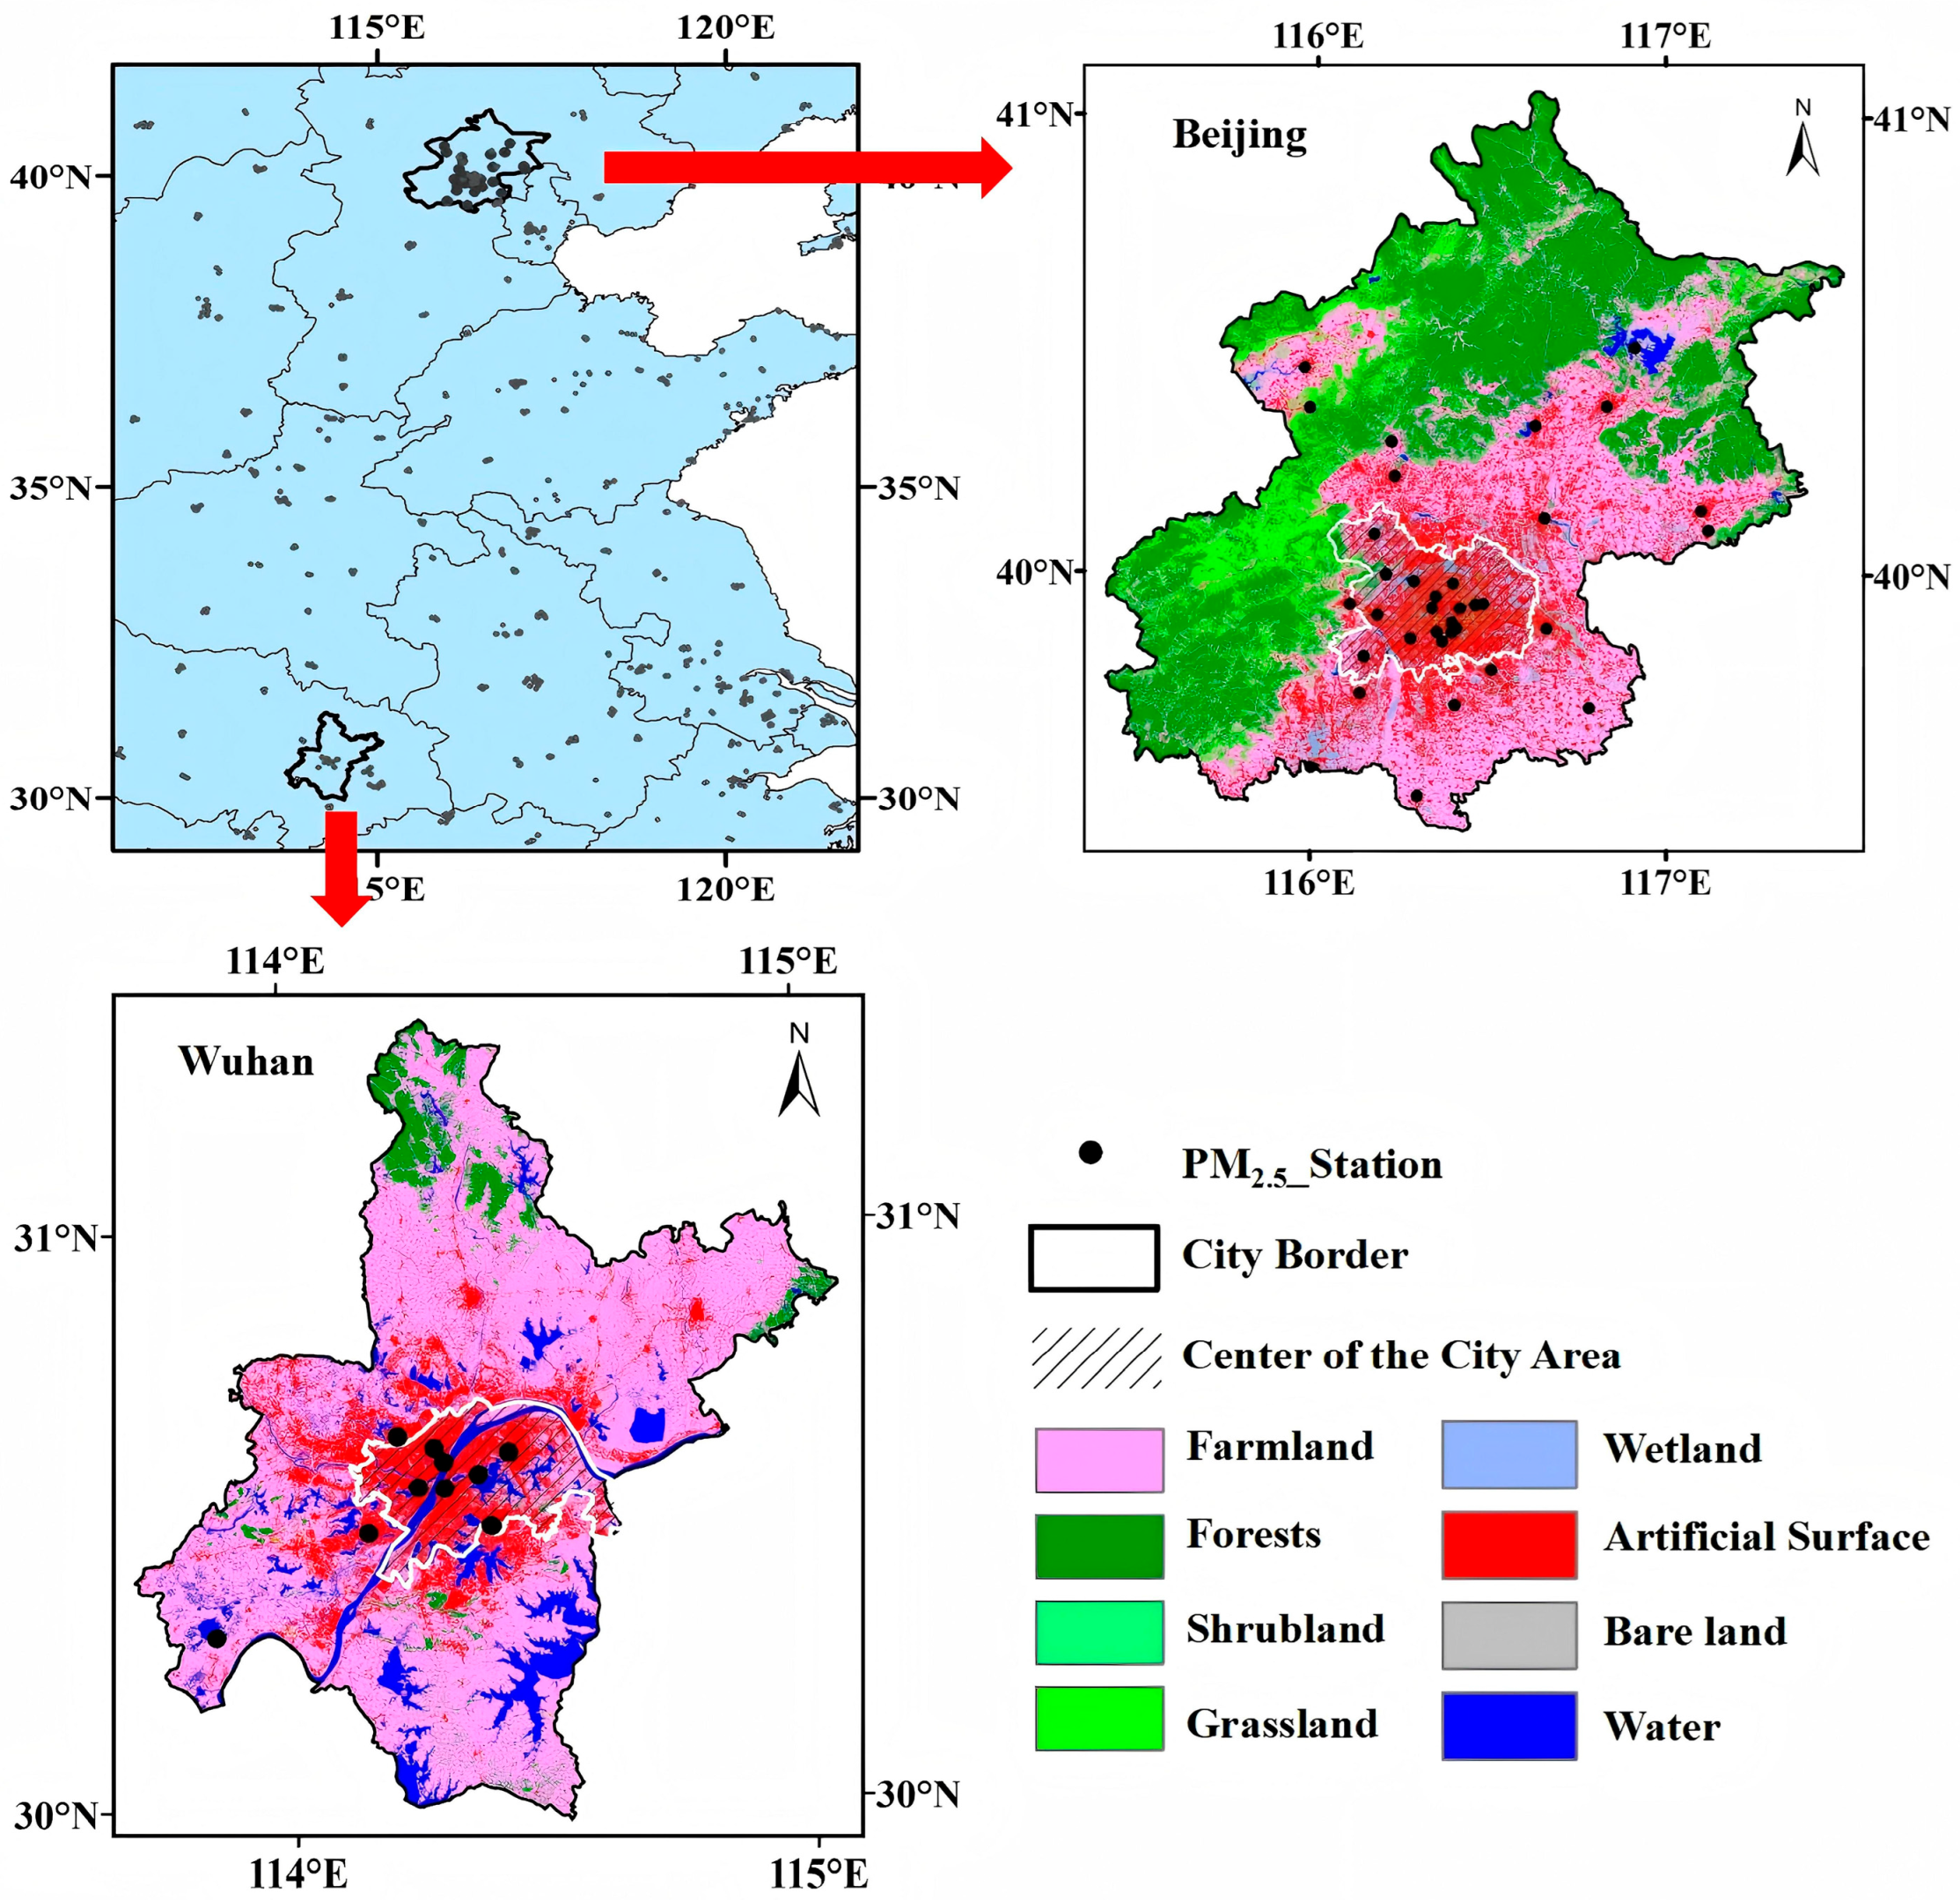
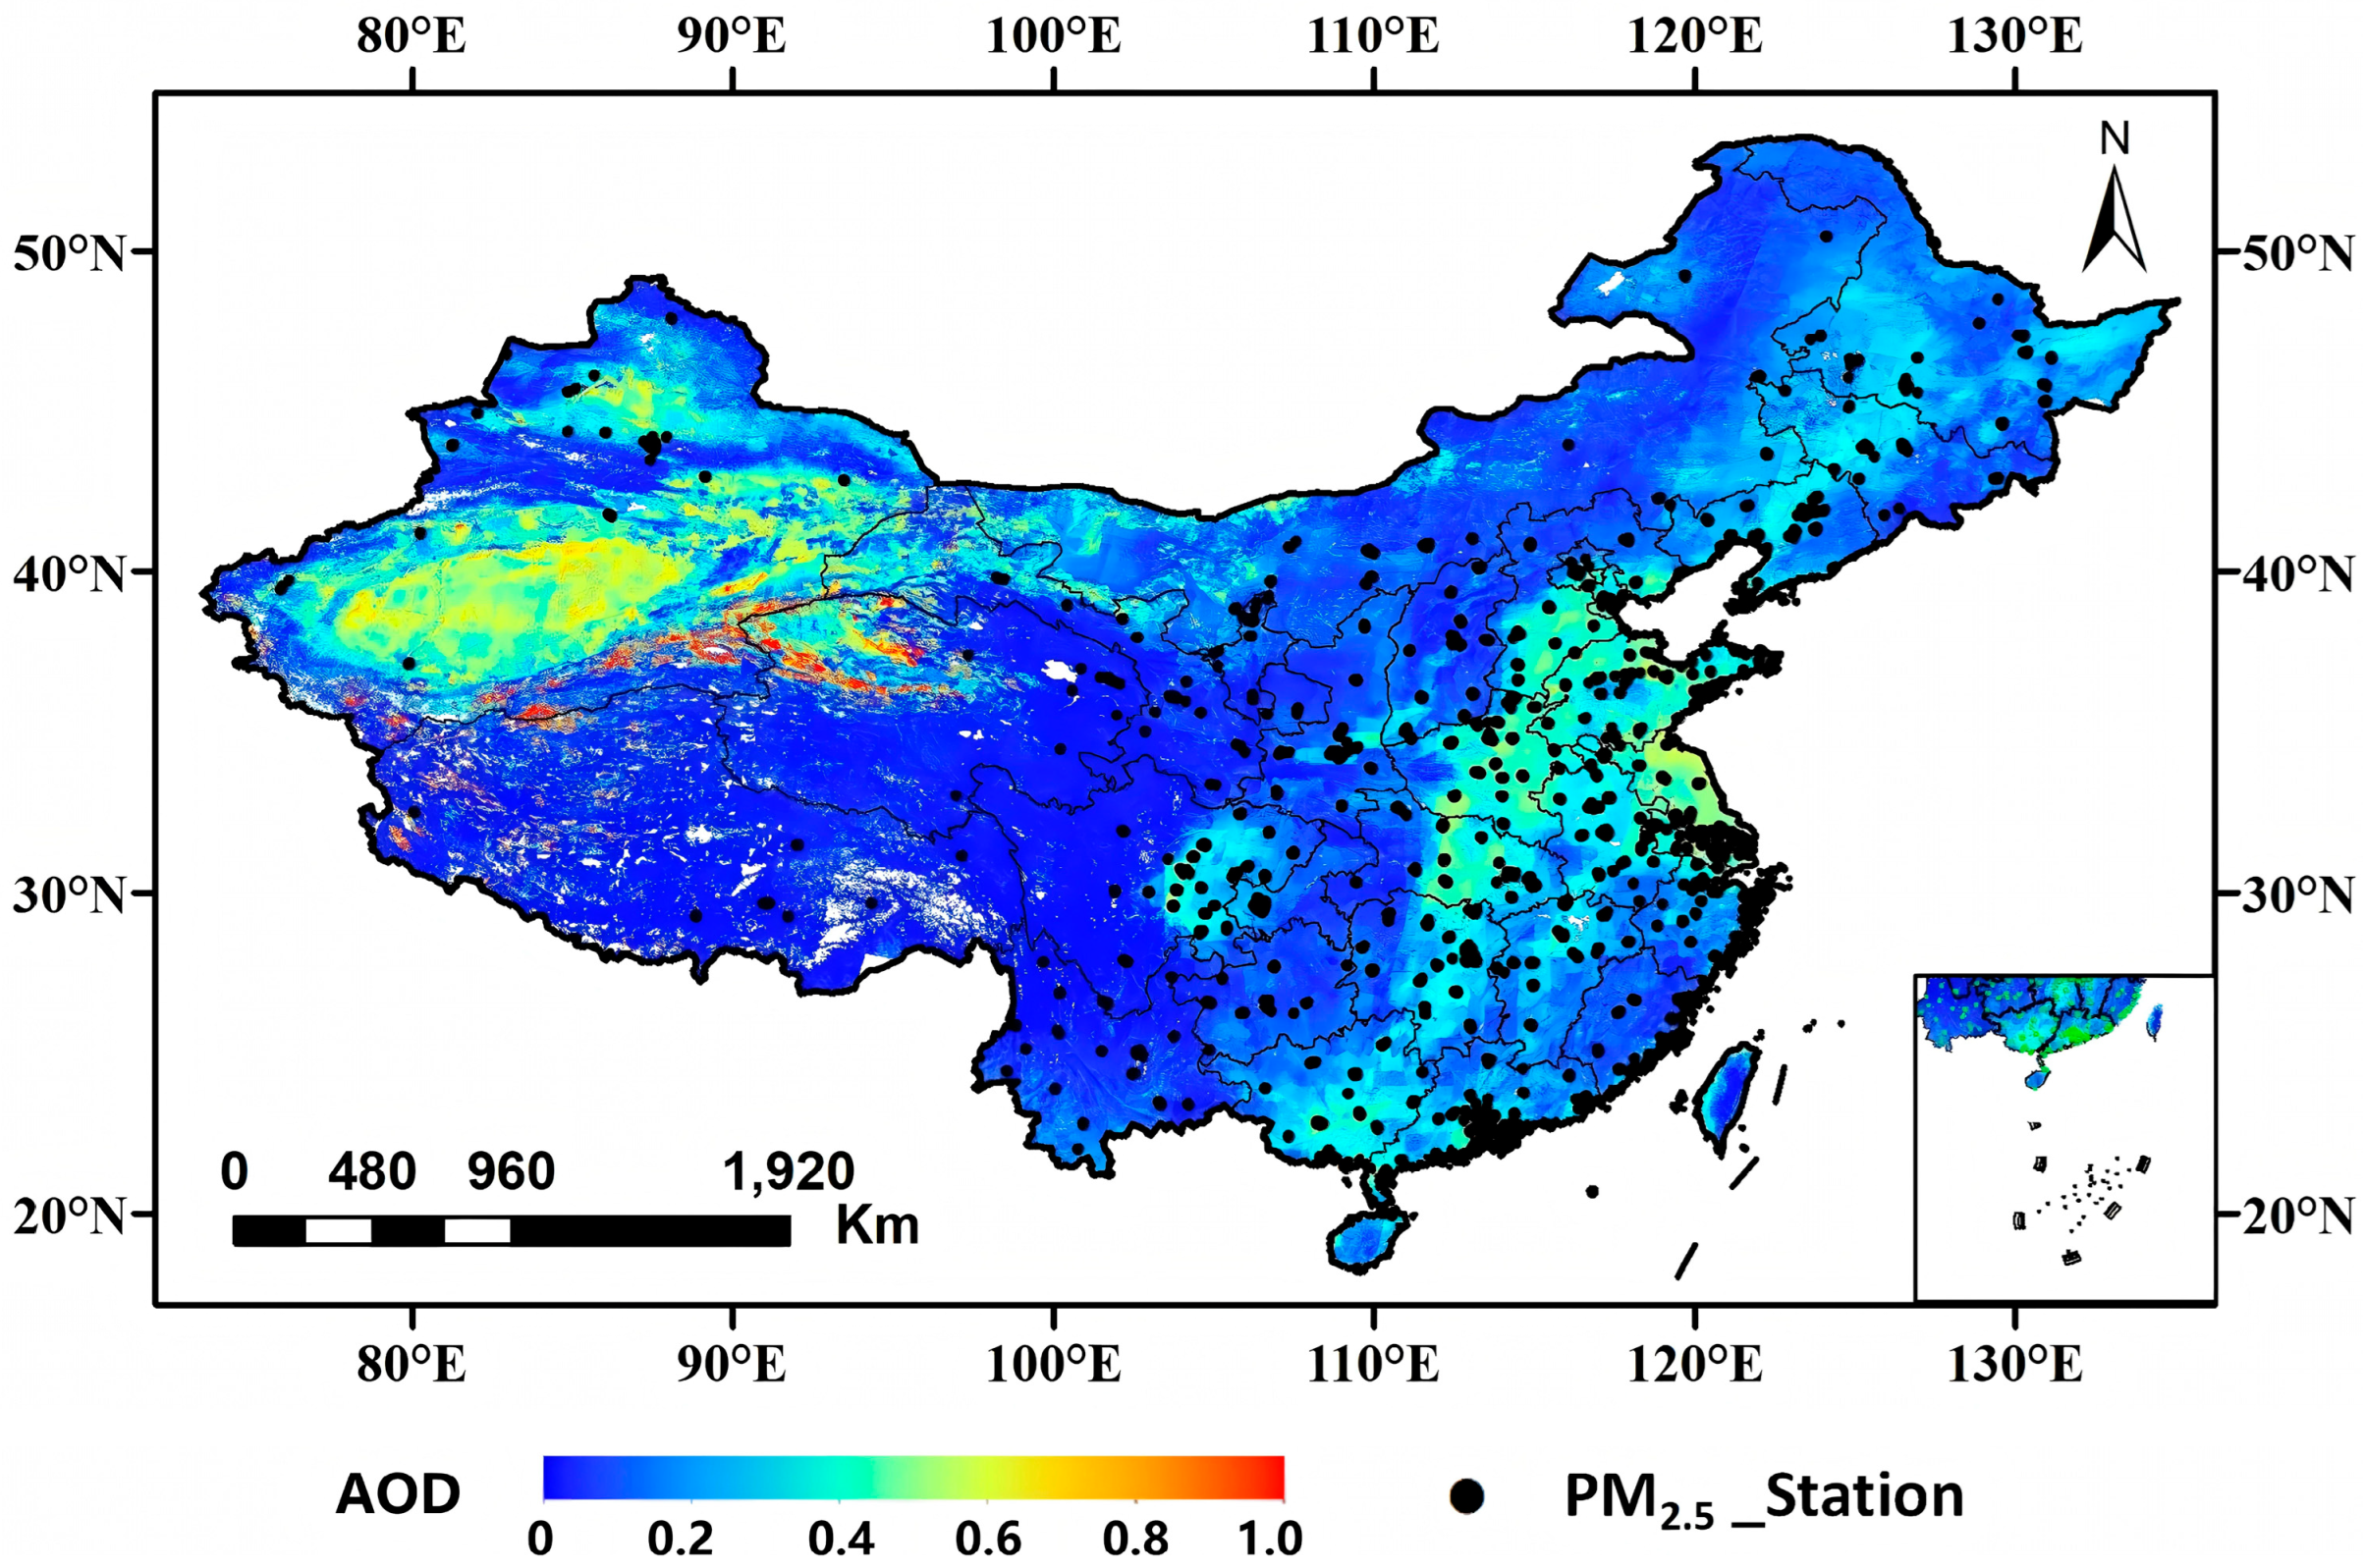
2.1. Study Region

The selection of Beijing and Wuhan as the study areas stems from their representativeness in addressing three critical challenges: chronic atmospheric pollution, multi-source aerosol complexity, and heterogeneous land surface characteristics. Beijing, China’s capital, is situated on the northern North China Plain and spans 16,410.54 km2, with a permanent population exceeding 21 million. Wuhan, the capital of Hubei Province, a central Chinese megacity and national industrial hub, occupies 8569.15 km2 along the Yangtze River’s middle reaches in the Jianghan Plain and has over 12 million residents. Atmospheric pollution in Beijing results from the combined effects of surrounding pollutant transmission, topographical conditions, and climatic conditions, while the sources of atmospheric pollutants in Wuhan are mainly from anthropogenic activities such as urban industrial emissions and traffic exhaust (from cars, ships, etc.) [33,41]. Long-term monitoring by the ground-based aerosol monitoring network indicates that the average AOD over the past decade has reached 0.586 in Beijing and 0.597 in Wuhan. These persistently high pollution levels have created significant socioeconomic and public health challenges, necessitating advanced monitoring solutions. Figure 1 illustrates the spatial configuration of land cover types and PM2.5 monitoring stations across both metropolitan areas.

2.2. Data Sources

2.2.1. Landsat-8 and Sentinel-2 AOD Data

Our prior research [34,42] systematically resolved two critical limitations in urban aerosol monitoring: (1) the lower spatial resolution in existing AOD products and (2) the long revisit cycles and limited spatial coverage due to using a single high resolution satellite sensor. To this end, we proposed a fusing algorithm for satellite aerosol retrieval with high spatial–temporal resolution in urban areas, integrating Landsat-8 OLI and Sentinel-2A/B MSI observations. This algorithm involves the data fusion of observations from different sensors through atmospheric correction, spectral band conversion, image resampling, and multi-temporal image registration. Subsequently, an improved surface reflectivity estimation scheme was utilized to obtain AOD products with a spatial resolution of 30 m for Beijing and Wuhan from 2017 to 2020. A comparison with ground-based stations showed that the correlation coefficients (R2s) between the Landsat-8 OLI AOD and the Sentinel-2 MSI AOD with the AERONET AOD reached 0.935 and 0.899, respectively. Moreover, the AOD retrieved by Landsat-8 OLI and Sentinel-2 MSI sensors at the same time also showed a high degree of consistency (R2 = 0.82). Additionally, the integrated observations achieved 3–4 day temporal resolution, enabling dynamic aerosol monitoring capabilities. As illustrated in Figure 2, this fusing algorithm has been operationally extended to produce China’s nationwide 30 m AOD dataset (2017–2020), forming the cornerstone for our high precision PM2.5-AOD retrieval model.

2.2.2. Ground-Measured PM2.5 Data

Since February 2012, when China incorporated PM2.5 concentration monitoring into its air quality monitoring program and made the data publicly available, more than 2000 national-level atmospheric monitoring stations had been established across 339 prefecture-level and higher cities by the end of 2020 (Figure 2 illustrates the spatial distribution). The types of air quality data provided include the hourly and daily average concentrations for seven monitoring parameters: PM2.5 particulates, PM10 particulates, sulfur dioxide (SO2), nitrogen dioxide (NO2), ozone (O3), carbon monoxide (CO), and the Air Quality Index (AQI), and these data are publicly released by the China National Environmental Monitoring Centre (CNEMC, https://air.cnemc.cn:18007/, accessed on 15 June 2025). Specifically, PM2.5 concentrations are manually measured via gravimetric analysis and automatically via the tapered element oscillating microbalance or beta attenuation methods, ensuring ±1.5 μg/m3 hourly and ±0.5 μg/m3 daily accuracy. In addition, various provincial and municipal environmental monitoring stations have also established numerous atmospheric environmental monitoring stations to monitor air pollution in key urban areas. For instance, the data from 35 and 10 PM2.5 monitoring stations include locations in Beijing and Wuhan, respectively (Figure 1). Hourly PM2.5 concentration monitoring data from 2017 to 2020 over China were collected to enhance the PM2.5-AOD modeling accuracy.

2.2.3. Digital Elevation Model (DEM)

The DEM data were sourced from the Shuttle Radar Topography Mission (SRTM) dataset, featuring an initial spatial resolution of 90 m. Through bilinear interpolation, this resolution is enhanced to 30 m. The DEM accurately captures topographic relief and variations, serving as a crucial factor in influencing the dispersion of PM2.5. Notably, the SRTM data can be accessed free of charge from its official website (http://srtm.csi.cgiar.org/srtmdata/, accessed on 15 June 2025).

2.2.4. Normalized Difference Vegetation Index (NDVI)

The NDVI data is derived from observations by the Landsat-8 OLI and Sentinel-2 MSI sensors, with a spatial resolution of 30 m. These NDVI measurements quantitatively characterize the vegetation’s vigor during satellite overpasses, with values spanning from −1 to 1. The index exhibits critical ecological interpretability: values exceeding 0 indicate detectable vegetation coverage, while progressive increases in NDVI magnitude correspond to enhanced canopy density and improved vegetation health status. Foliar deposition by vegetation directly depletes near-ground PM2.5, and high-NDVI zones correlate with reduced anthropogenic emissions, establishing NDVI as a dual-function indicator for empirical PM2.5 retrieval models.

2.2.5. Land Use and Cover Change (LUCC) Data

The LUCC data utilized in this study adopts the Global Land Cover Change Dataset, released by the Aerospace Information Research Institute, Chinese Academy of Sciences [43]. This dataset is comprehensive, incorporating long-term observation data from Landsat and Sentinel satellites, DEM (Digital Elevation Model) topographic data, global thematic ancillary datasets, and prior knowledge. Leveraging machine learning models, it produces global land surface land use datasets with a high resolution of 30 m, covering the periods of 2015 and 2020. Notably, the dataset encompasses 30 land cover types, including urban impervious surfaces, forests, shrubs, grasslands, wetlands, farmlands, water bodies, and bare land (as depicted in Figure 1), achieving an overall classification accuracy of 84.33%. For this study, we specifically selected LUCC data for the year 2020, as it reflects the current status of land use. Importantly, variations in the pollution sources across different land cover types have a significant impact on PM2.5 concentrations. The land use change dataset, named GLC_FCS30-2020, is freely available for download at https://zenodo.org/record/4280923 (accessed on 15 June 2025).

2.2.6. Meteorological Reanalysis Data

Existing research [31,44,45] has consistently demonstrated the critical role of meteorological conditions in governing the regional transport, dispersion dynamics, and deposition patterns of near-surface PM2.5 concentrations. This study utilizes the ERA-5 reanalysis dataset, the fifth-generation global atmospheric reconstruction product developed by the European Centre for Medium-Range Weather Forecasts (ECMWF). By assimilating historical observational data through advanced numerical models and data assimilation systems, ERA-5 provides comprehensive hourly records since 1979, encompassing 137 vertically stratified atmospheric parameters across terrestrial, oceanic, and atmospheric domains (surface to 80 km altitude), with high resolution global coverage at 0.25° grids. From this dataset, we extracted seven key meteorological variables relevant to PM2.5 behavior: 2 m temperature (TEM), surface pressure (PS), 10 m u/v wind components (10 UW/10 VW), planetary boundary layer height (PBLH), relative humidity (RH), and total ozone concentration (TO3). These parameters, sharing the native 0.25° × 0.25° spatial resolution of ERA-5, were presumed to exhibit minimal intra-grid variability for our analytical purposes. Through spatial registration and resampling processes, the meteorological data were temporally and spatially aligned with ground-based PM2.5 monitoring records and satellite-retrieved AOD measurements, thereby generating essential meteorological covariates for PM2.5-AOD modeling frameworks. The ERA-5 dataset is publicly accessible via the ECMWF data portal (https://www.ecmwf.int/en/forecasts/datasets/reanalysis-datasets/era5, accessed on 15 June 2025).

3. Methodology

While the AOD quantifies the column-integrated light extinction by atmospheric aerosols across the entire vertical profile, ground-level PM2.5 measurements specifically capture near-surface fine particulate concentrations. This fundamental discrepancy in both measurement targets (columnar vs. surface-level aerosols) and observational domains (atmospheric column vs. ground station) dictates a complex, non-linear association between the AOD and PM2.5. The relationship is further modulated through a multi-factor interplay involving aerosol vertical distribution patterns, planetary boundary layer dynamics, hygroscopic growth effects (relative humidity), advection processes (wind vectors), and geographic heterogeneity (terrain elevation, vegetation coverage, and land use characteristics). As established in seminal studies [19,46,47], satellite-based PM2.5 estimation essentially requires establishing a sophisticated non-linear regression framework that accounts for these mediating variables. This section systematically details the multi-source datasets, the pre-processing methodologies employed for the PM2.5-AOD model development, the model architecture specification, and the analytical procedures.

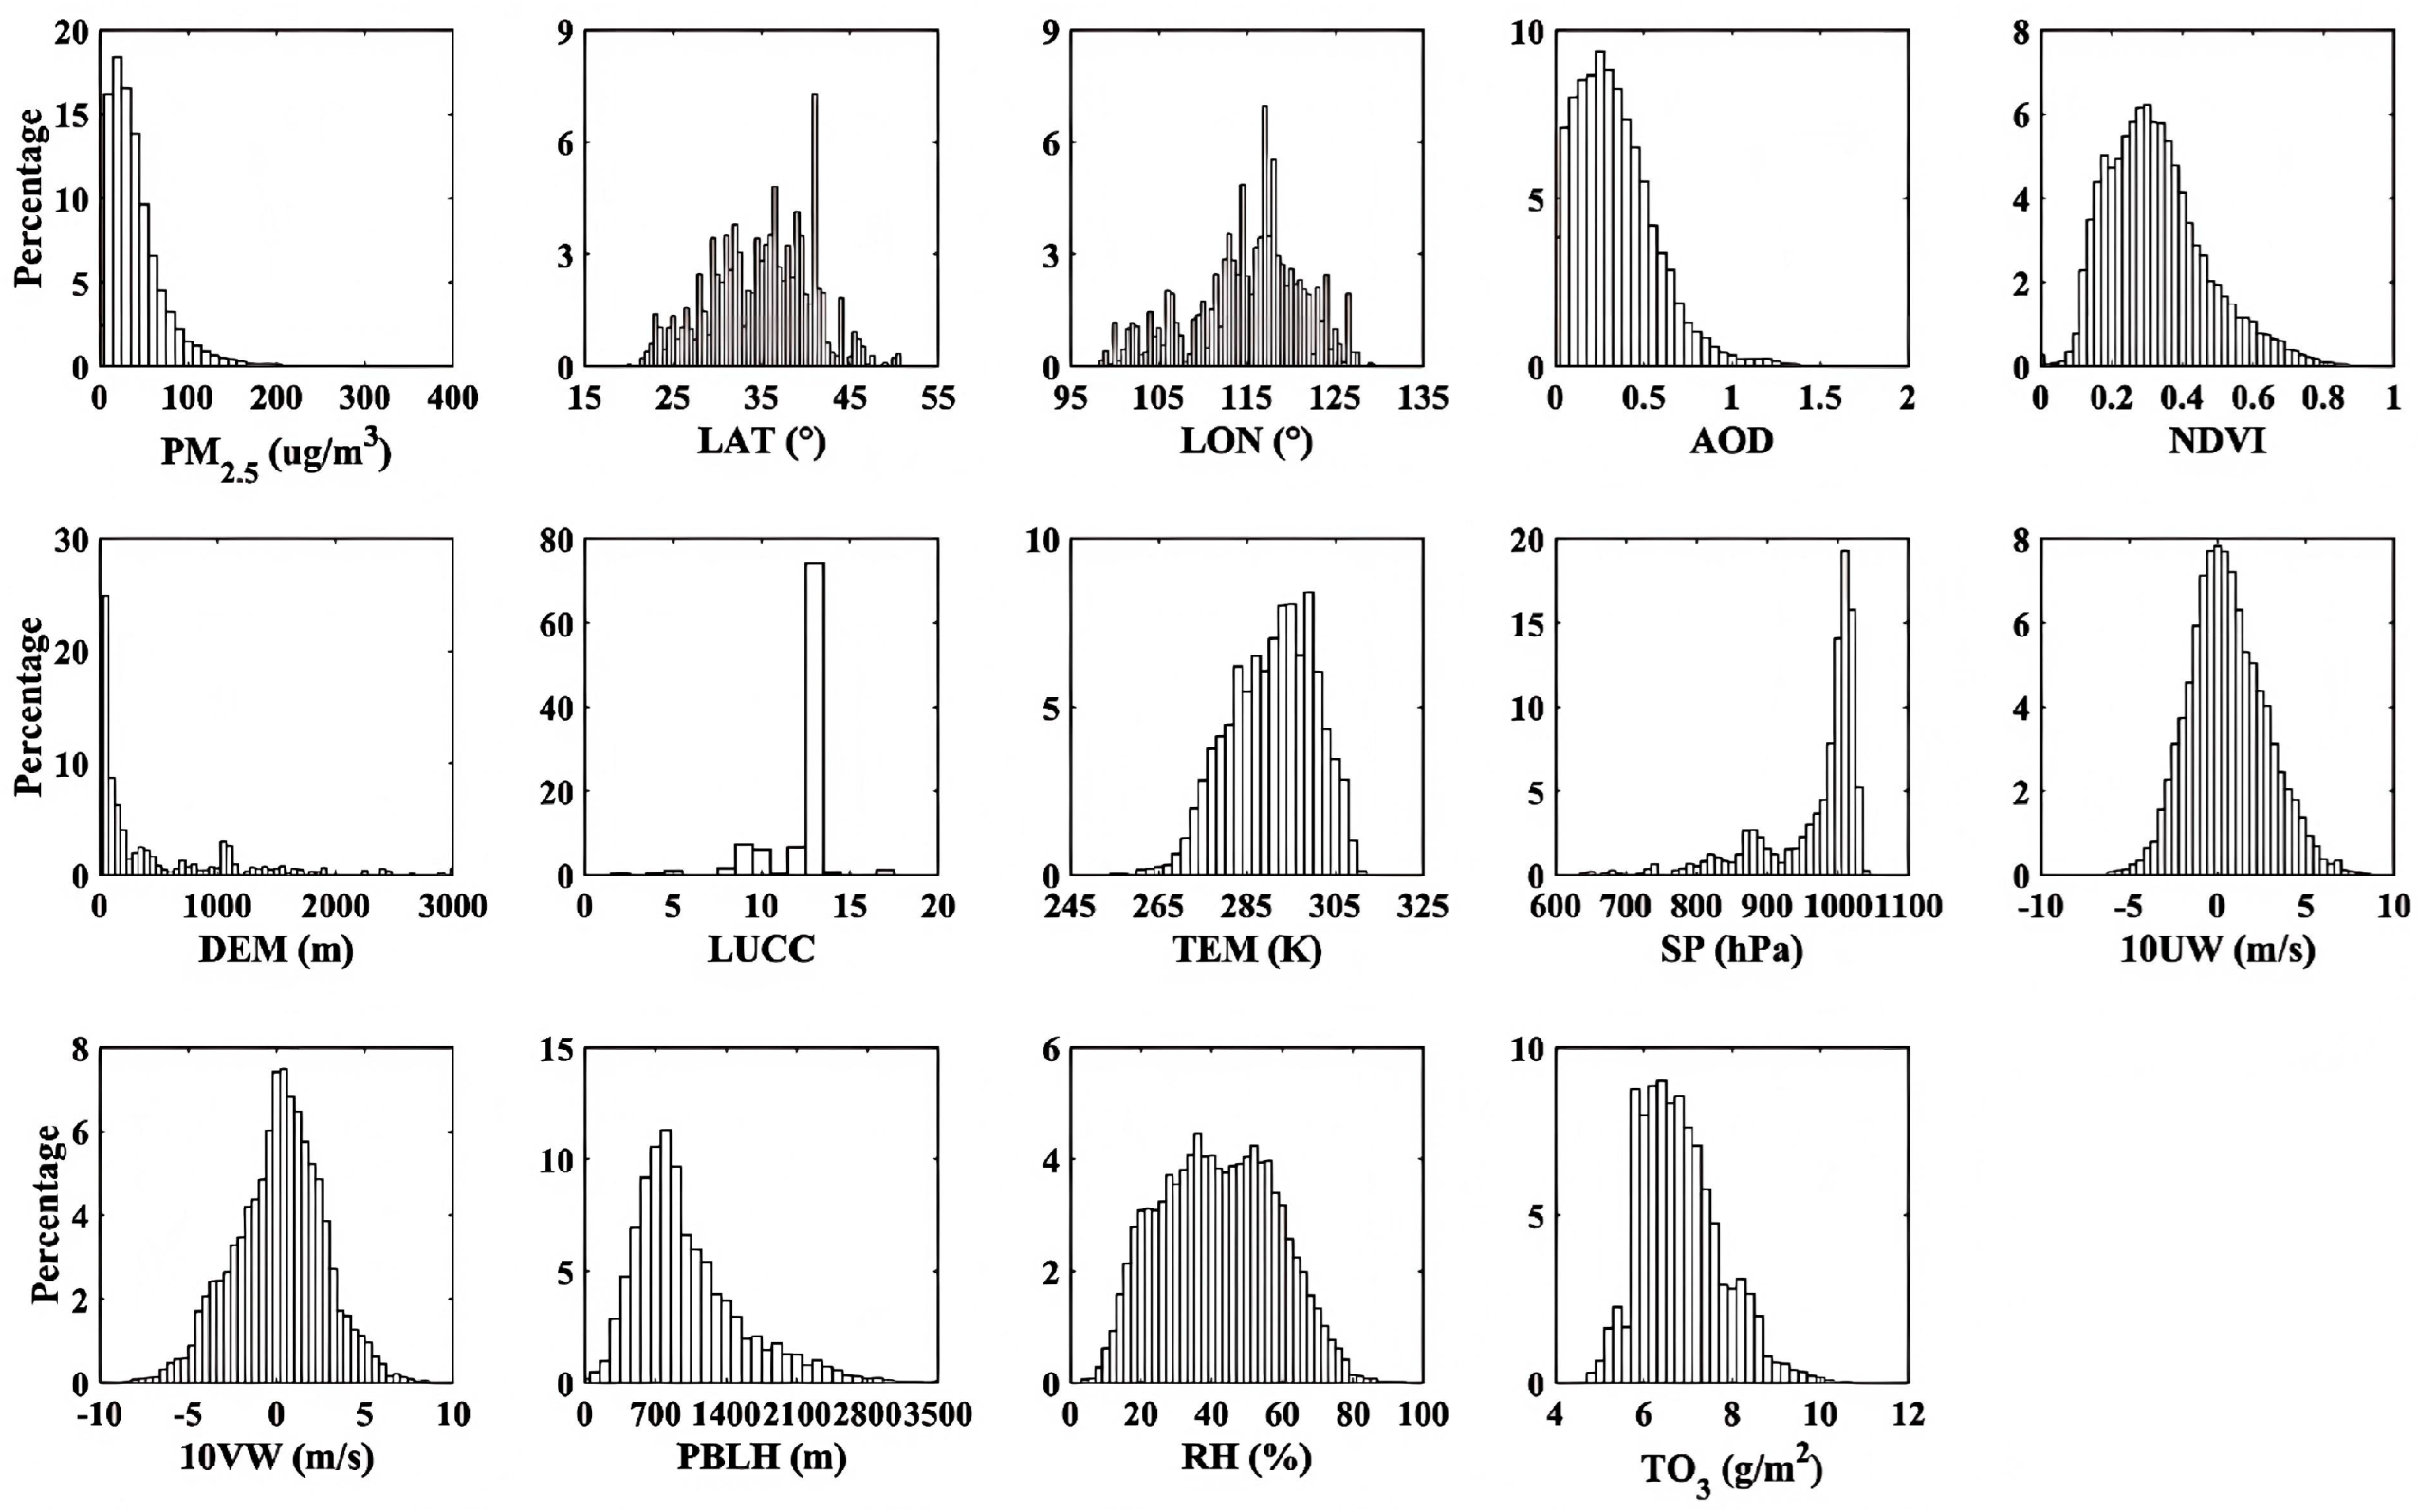
3.1. Selection of Model Parameters

The development of the PM2.5-AOD remote sensing retrieval model relies on a multi-source integration framework comprising three critical components: ground measurement data, satellite observation data, and meteorological parameter data. Table 1 lists detailed information regarding the required data.

3.2. Model Construction

Machine learning algorithms are frequently employed to establish PM2.5-AOD relationship models due to their significant advantages in resolving complex nonlinear fitting problems. This study uses three machine learning algorithms (RF, BPNN, and CatBoost), combining satellite remote sensing observations, ground-based monitoring measurements, and ERA5 reanalysis meteorological parameters to develop PM2.5-AOD retrieval models. The models’ performance will be rigorously evaluated to select the optimal algorithm for subsequent analyses. The RF algorithm [17,18,21] systematically assesses feature importance via permutation-based metrics while generating unbiased estimates, with inherent advantages in overfitting prevention through its bagging architecture and randomized feature selection. The BPNN algorithm [7,8] employs backpropagation to iteratively adjust network weights and biases, minimizing output deviations from expected values. The CatBoost algorithm [48] utilizes symmetric gradient boosting decision trees to effectively handle categorical features, addressing the gradient bias and prediction shift to reduce overfitting while demonstrating exceptional accuracy, computational efficiency, and generalization capability. The basic model architecture is presented in Formula (1). Figure 3 illustrates the PM2.5 retrieval framework utilizing machine learning algorithms, highlighting the synergistic workflow of data fusion, model building, and model prediction for estimating particulate matter concentrations.
P M 2.5 = f ( L A T , L O N , A O D , N D V I , D E M , L U C C , T E M , S P , 10 U W , 10 V W , P B L H , R H , T O 3 )

3.3. Analysis of Model Parameters

In this paper, the Landsat-8 OLI AOD products over China (Figure 2) and the Sentinel-2 MSI AOD products from Beijing and Wuhan, along with the ground measurement PM2.5 and meteorological parameters, were spatially and temporally matched. The matching process yielded 25,680 valid data pairs that met our quality control criteria. The comprehensive characterization of variable distributions during the study period was achieved through descriptive statistics (Table A1) and frequency distribution analysis (Figure 4), providing quantitative insights into the dataset’s statistical properties.
The analytical results revealed distinct pollution characteristics during satellite overpass hours (10:00–12:00 local time). Nationwide PM2.5 concentrations exhibited a mean value of 44.33 μg/m3 (mean ± standard deviation), while the corresponding AOD measurements averaged 0.34. Notably, both parameters demonstrated comparable distribution patterns in their frequency histograms, suggesting a coherent relationship between columnar aerosol loading and surface particulate pollution levels. This distribution similarity provides critical evidence for subsequent PM2.5-AOD correlation modeling.
Table 2 presents the correlation coefficient matrix and probability values among the variables used for the PM2.5 and AOD modeling frameworks; the vast majority of the Pearson correlation coefficients had p-values less than 0.001. The analysis reveals a moderate positive correlation (R = 0.42) between PM2.5 and AOD. The PM2.5 concentrations exhibited weak but significant negative associations with the NDVI, DEM, TEM, and PBLH, while showing a positive dependence on RH. Notably, except for the DEM and SP pair exhibiting a near-perfect anticorrelation (R = −0.98), all other predictor variables exhibited weak correlations, suggesting no collinearity issue among the predictor variables in this study. Since the DEM represents surface elevation, which can be considered constant over long periods, it is a fixed constant for each pixel. Although SP exhibits strong collinearity with the DEM, it can vary slightly at different times due to other meteorological factors. Derived from the ERA-5 meteorological reanalysis data with higher temporal resolution, both the DEM and SP are retained as predictor variables for the PM2.5-AOD model fitting.

3.4. Model Validation and Evaluation

To ensure the statistical robustness and generalizability of our machine learning framework, we implemented a dual-strategy ten-fold cross-validation (10-CV) approach combining sample-based CV (randomized k-fold partitioning) and site-based CV (geospatial cluster validation) [49]. The sample-based cross-validation method randomly selects 90% of the samples for model training while reserving the remaining 10% for validation. This process is repeated 10 times to ensure all samples are tested. The site-based cross-validation adopts the same methodology as the sample-based approach but is specifically designed to evaluate the model’s spatial performance. It completes the 10-CV validation process by randomly excluding 10% of ground-based sites. This methodology systematically addresses overfitting risks while accounting for spatial autocorrelation effects in environmental data. The model performance was rigorously quantified through five complementary metrics: the coefficient of determination (R2), root mean squared error (RMSE), mean absolute error (MAE), mean relative error (MRE), and relative mean bias (RMB), which are used to evaluate the precision of the constructed models. The calculation formulas for the aforementioned evaluation metrics are as follows:
R 2 = i = 1 n ( y i y ¯ i ) i = 1 n ( y i y ¯ i ) 2
R M S E = i = 1 n ( y i y ¯ i ) 2 n
M A E = 1 n i = 1 n y i y ¯ i
M R E = 1 n i = 1 n y i y ¯ i y ¯ i
R M B = 1 n i = 1 n y i y ¯ i
In the formula, y i represents the observed PM2.5 value at the ground level, y ¯ i represents the predicted PM2.5 value simulated by the model, and n represents the number of data points in the modeling dataset.

4. Results

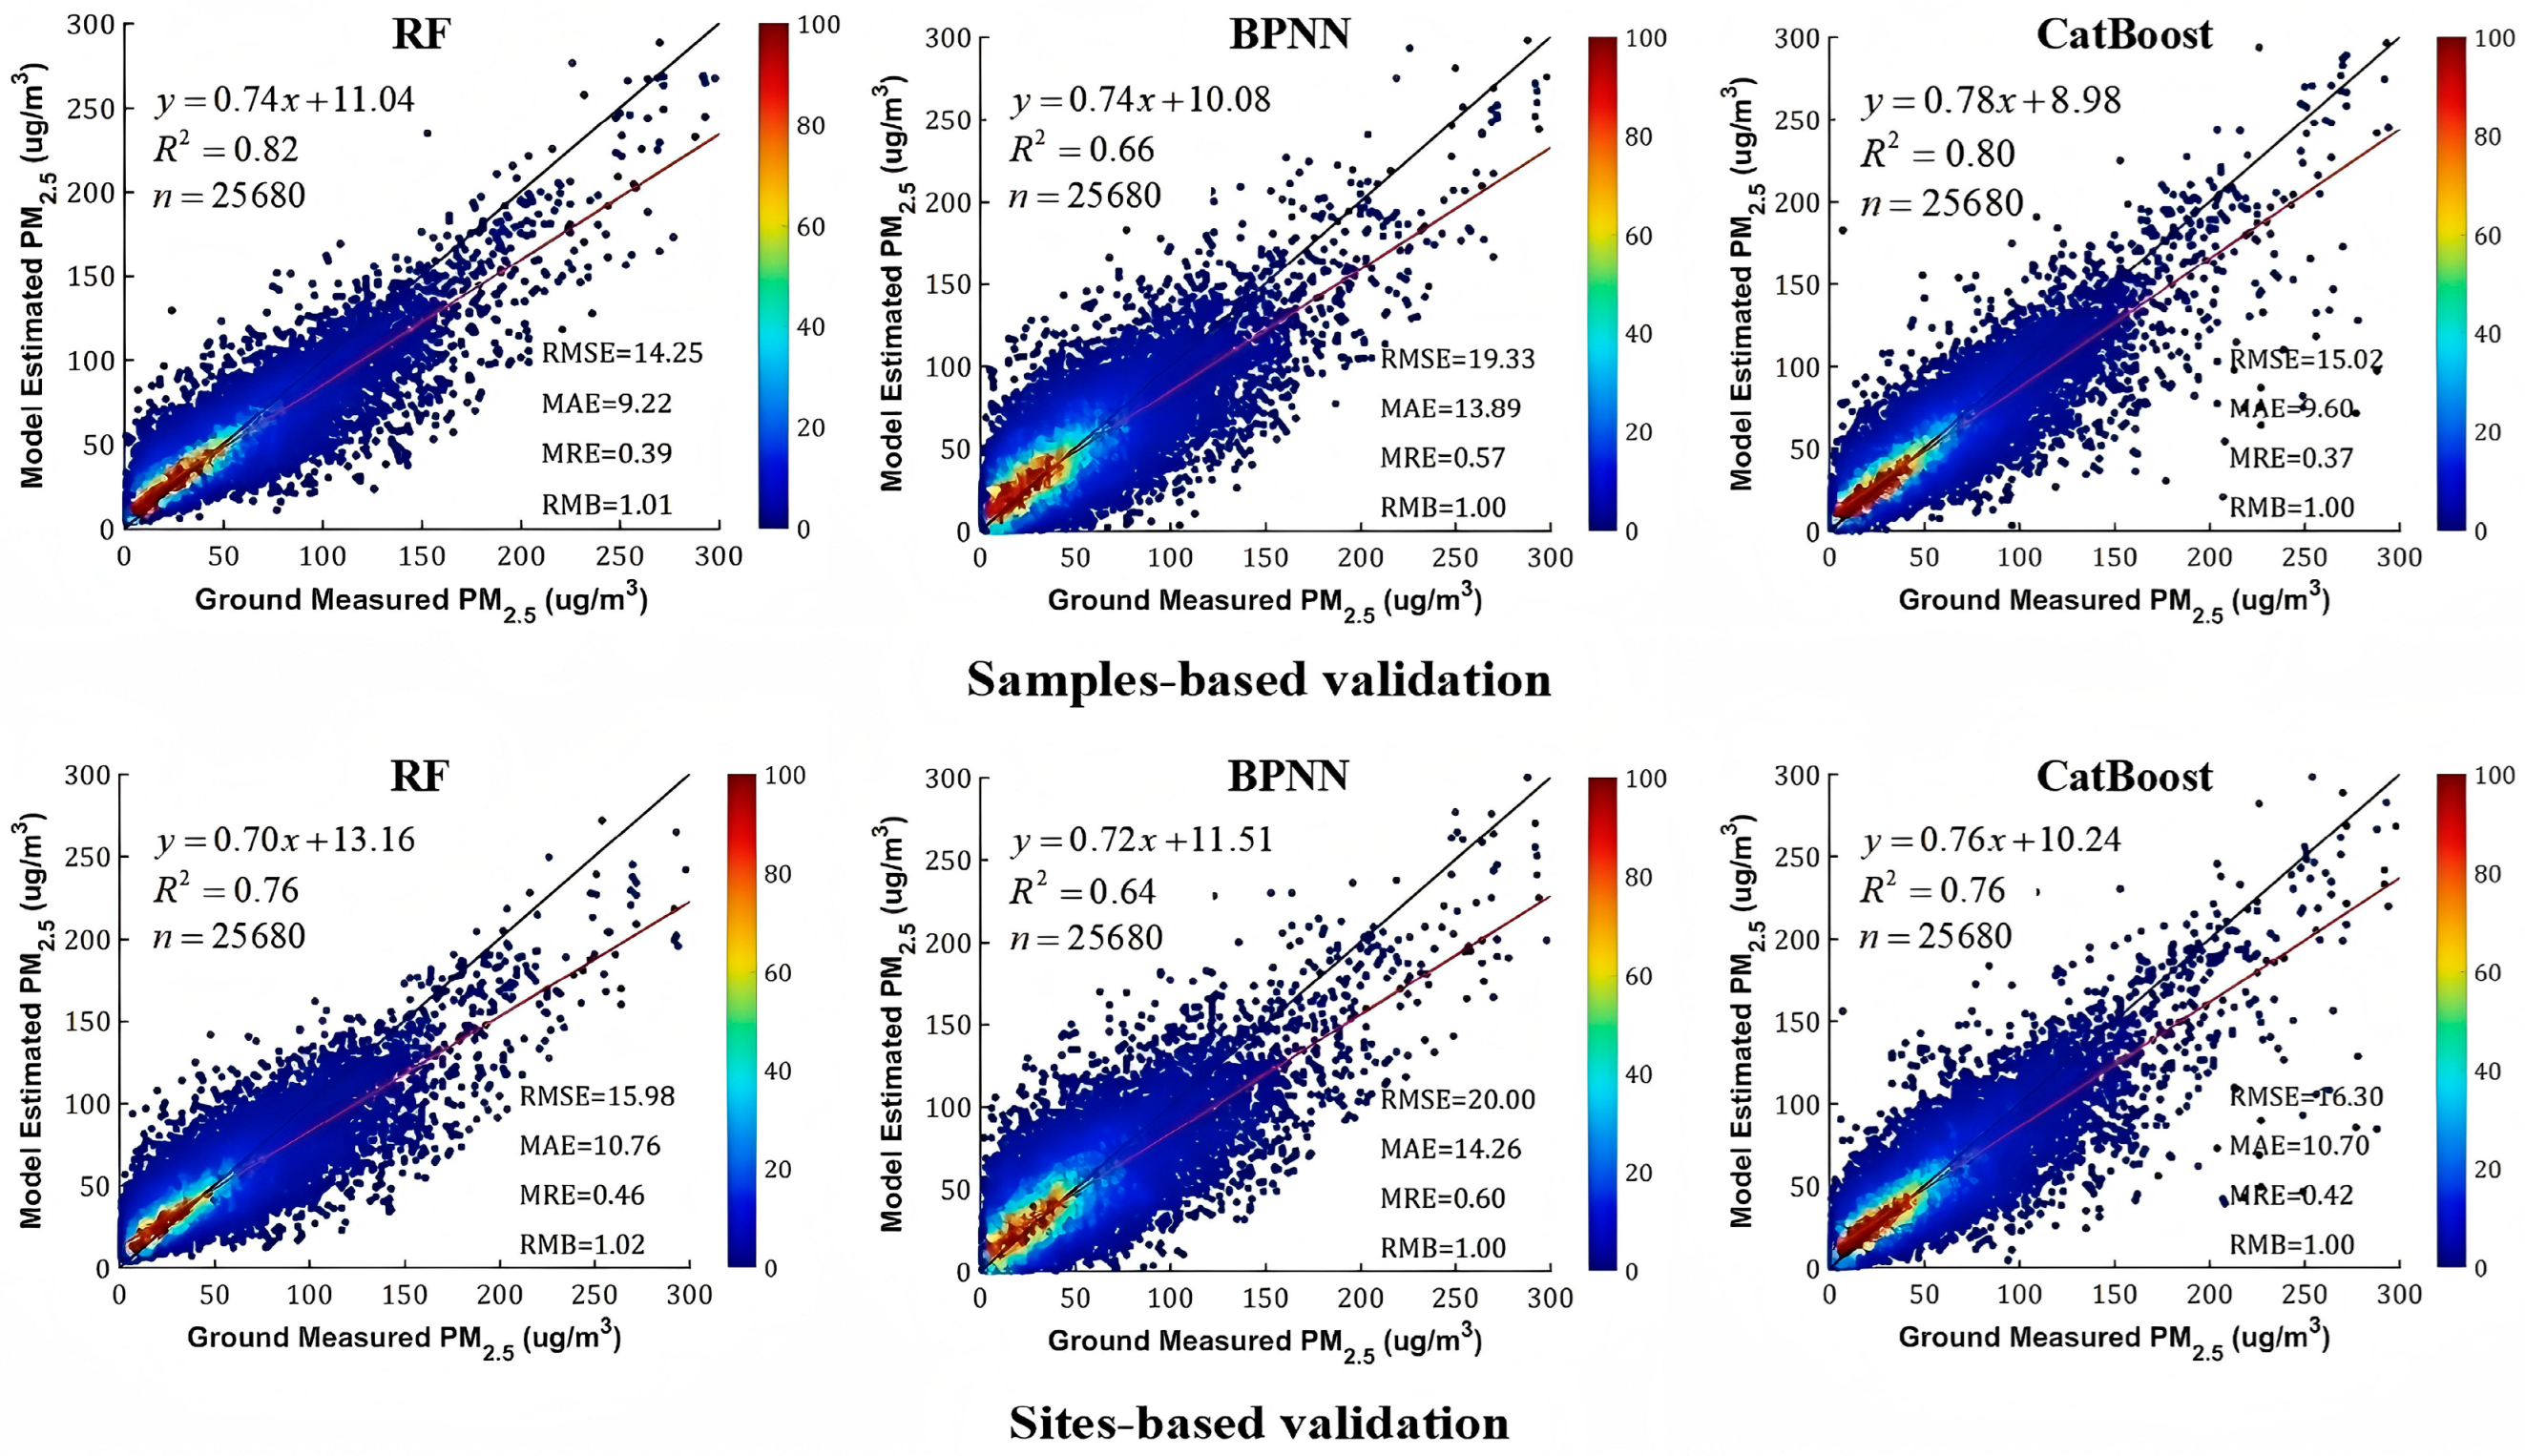
4.1. Overall Accuracy Evaluation

To further demonstrate the performance of the RF model in PM2.5 estimation, comparisons were made with the BPNN model and the CatBoost model. The predictive accuracy of these three models was systematically evaluated through ten-fold cross-validation based on samples and stations. The specific hyperparameter configurations were optimized according to the dataset’s dimensionality: (1) the RF architecture employed 100 decision trees with maximum depth constraints limiting terminal nodes to two per tree, ensuring the model’s simplicity; (2) the BPNN framework adopted a single hidden layer topology containing 300 neurons, trained with early stopping at 500 epochs when the mean squared error reached the ≤0.001 threshold; (3) the CatBoost regression utilized gradient-boosted trees with depth = 10, learning rate η = 0.2, and 500 boosting iterations, optimizing the root mean squared error (RMSE) minimization through symmetric tree construction.
Figure 5 demonstrates distinct performance disparities among the evaluated models. The BPNN exhibited limited predictive accuracy, with sample-based cross-validation metrics (R2 = 0.66, RMSE = 19.33 μg/m3) and site-based validation results (R2 = 0.64, RMSE = 20.00 μg/m3). While CatBoost showed improved performance (sample R2 = 0.80, RMSE = 15.02 μg/m3; station R2 = 0.76, RMSE = 16.30 μg/m3), the RF model outperformed both, achieving superior sample-based validation (R2 = 0.82, RMSE = 14.25 μg/m3, MAE = 9.22 μg/m3, MRE = 0.39, RMB = 1.01) and robust spatial generalization (station R2 = 0.76, RMSE = 15.98 μg/m3). Empirical studies [50,51,52,53,54] consistently show RF’s superior predictive performance over BPNN and CatBoost, particularly in handling the complex feature interactions and spatial autocorrelation patterns inherent in air quality data. For CV on the site scale, the three models have relatively poor accuracies compared with the sample scale because the PM2.5 concentrations are noticeably spatially heterogeneous, suggesting that the spatial generalization capability of machine learning models remains relatively limited in current applications. The residual analysis revealed systematic biases indicating overestimation in low-concentration scenarios (<40 μg/m3) and underestimation in high-pollution scenarios (>40 μg/m3), a pattern consistent with MODIS-based studies employing coarse-resolution AOD products [17,40,45,55]. Figure 3 presents the distribution of the training samples, revealing a significant data imbalance: PM2.5 concentrations below 50 μg/m3 constitute 71.75% of the dataset, while those under 100 μg/m3 account for 94.16%. Samples exceeding 100 μg/m3 represent merely 5.84%. This imbalance likely contributes to the model’s tendency to overestimate low values and underestimate high concentrations. Despite minor spatial validation degradation, the RF model demonstrated exceptional suitability for AOD-PM2.5 retrieval, particularly when integrating Landsat-8 OLI and Sentinel-2 MSI fusion products with harmonized spatial resolutions (30 m) and temporal acquisition windows (±15 min), validating its cross-sensor adaptability for high resolution urban air quality mapping.
The developed RF framework was specifically engineered to generate high resolution (30 m) PM2.5 distribution maps through the synergistic utilization of multi-sensor AOD data, employing fused Landsat-8 OLI and Sentinel-2 MSI products retrieved via our retrieval algorithm. The strategic parameter transfer between sensors was enabled by three critical compatibilities: (1) spatial resolution coherence (Sentinel-2 resampled to 30 m), (2) temporal synchronization, and (3) retrieval consistency (inter-sensor AOD correlation R2 = 0.82). This cross-platform adaptability applies Landsat-8-calibrated RF parameters to Sentinel-2-based PM2.5 estimation, validating the methodology’s robustness for multi-source AOD integration in heterogeneous urban environments.

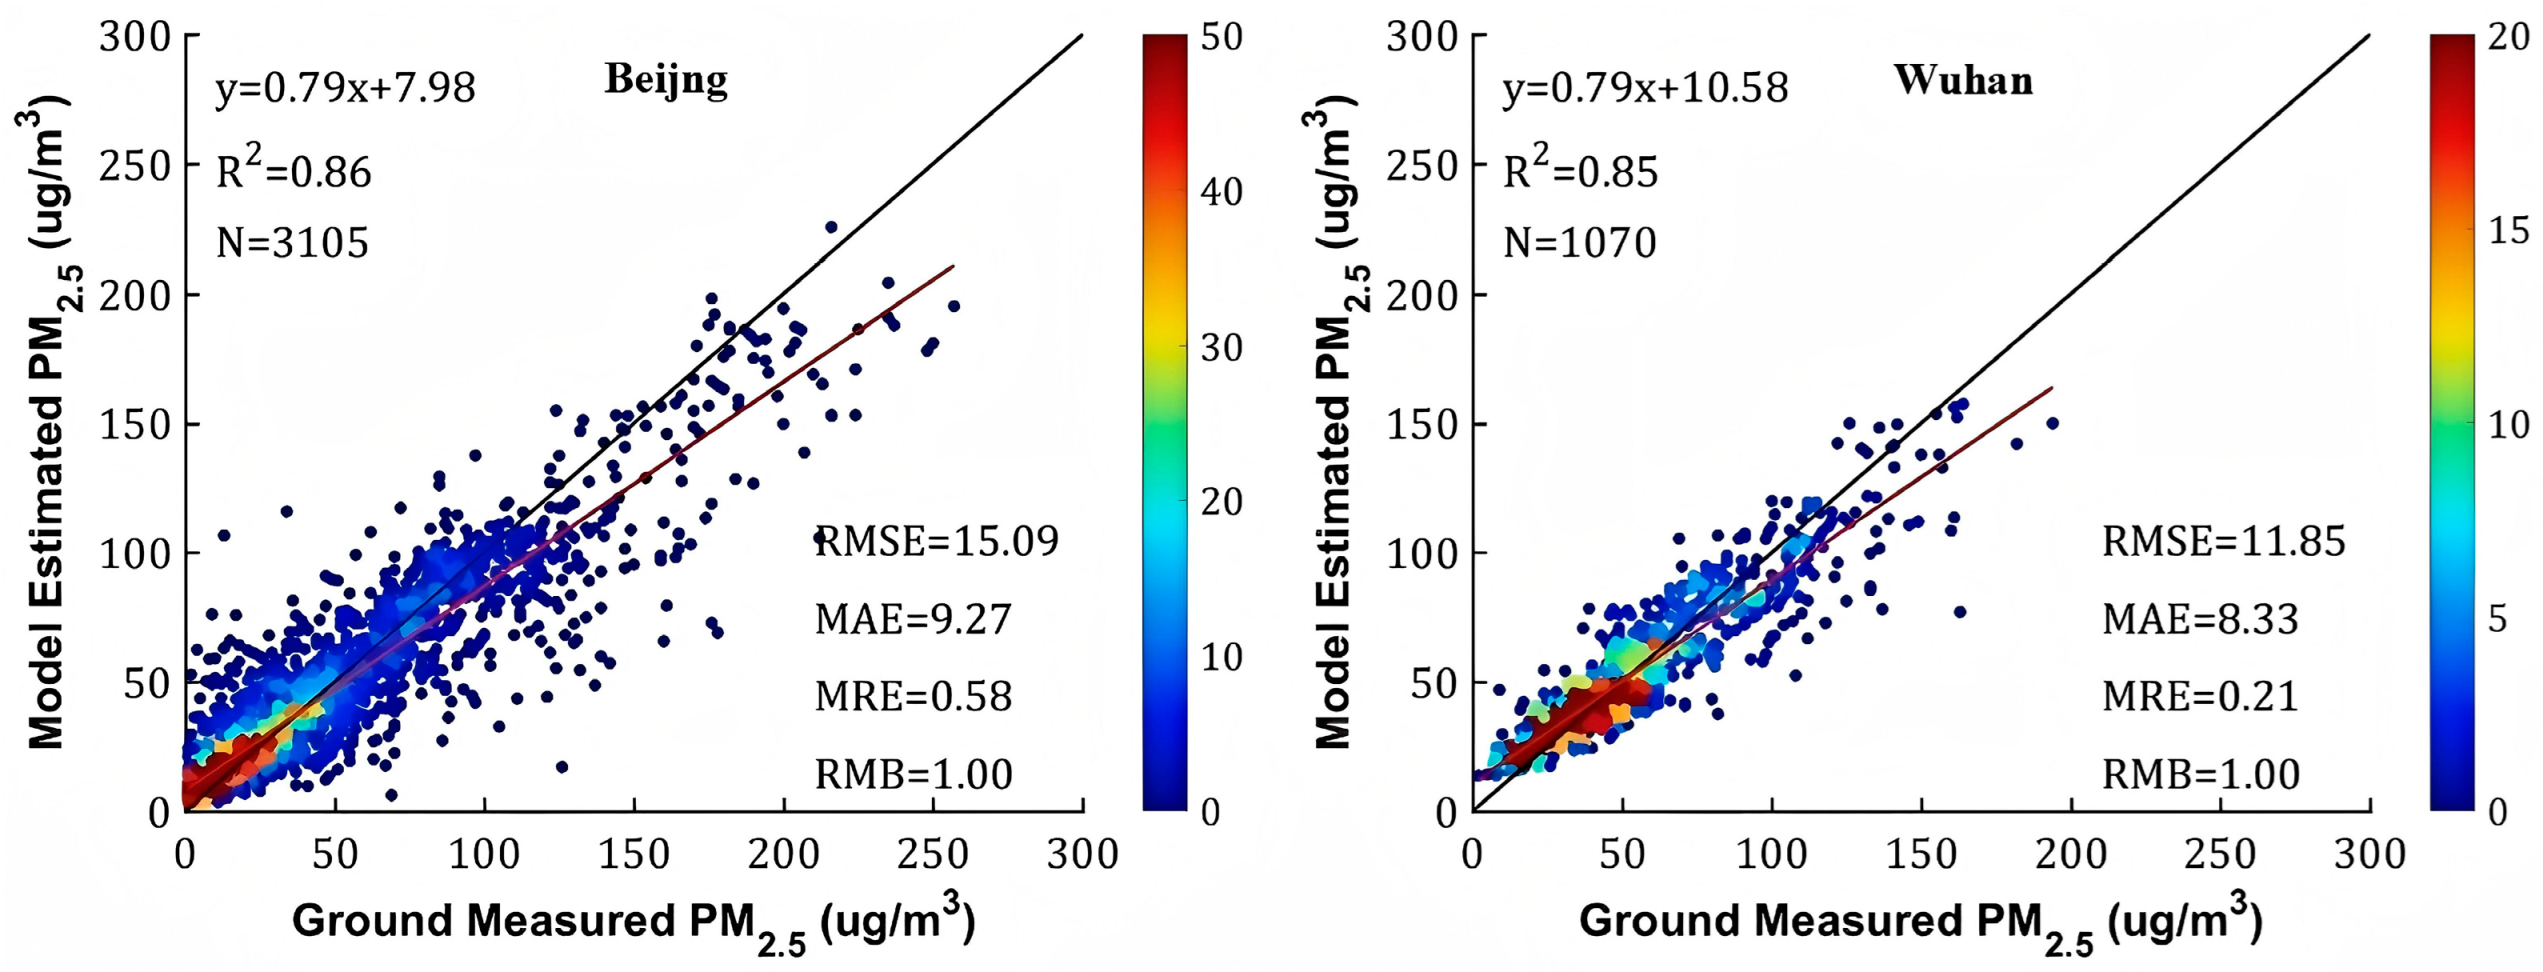
4.2. Accuracy Assessment in Beijing and Wuhan

Within the urban area of Beijing, there are a total of 35 ground-based PM2.5 monitoring stations, while Wuhan has 10 within its urban area (Figure 1). The PM2.5 monitoring stations in Beijing are distributed across both the central city (including Dongcheng, Xicheng, Chaoyang, Haidian, Shijingshan, and Fengtai districts) and suburban areas. In contrast, those in Wuhan are predominantly concentrated in the central city (including Wuchang District, Qingshan District, Jiang’an District, Jianghan District, Qiaokou District, Hanyang District, and Hongshan District), with only one station situated in a suburban region.
Figure 6 demonstrates the validation performance of the RF-based PM2.5 retrieval framework against ground observations. The validation dataset comprises 3105 spatially matched pairs in Beijing versus 1070 in Wuhan. The model exhibits robust predictive accuracy based on the sample, with R2s of 0.86 and 0.85, and RMSEs of 15.09 μg/m3 and 11.85 μg/m3 for Beijing and Wuhan, respectively, outperforming the training dataset benchmarks. This enhanced validation accuracy arises from the spatial clustering of the urban monitoring stations, which improves the regional representativeness compared to the scattered training data. Additionally, the RMSE for the PM2.5 retrieval in Beijing is slightly larger than that in Wuhan. One reason for this is that the PM2.5 concentrations in Beijing are higher on some specific days, while the observation data in this range used for training the RF model are relatively scarce, resulting in inadequate training of the RF model in the high-concentration PM2.5 range. In contrast, the PM2.5 distribution range in Wuhan is more consistent with the training dataset, leading to a lower RMSE for the retrieval results.

5. Discussion

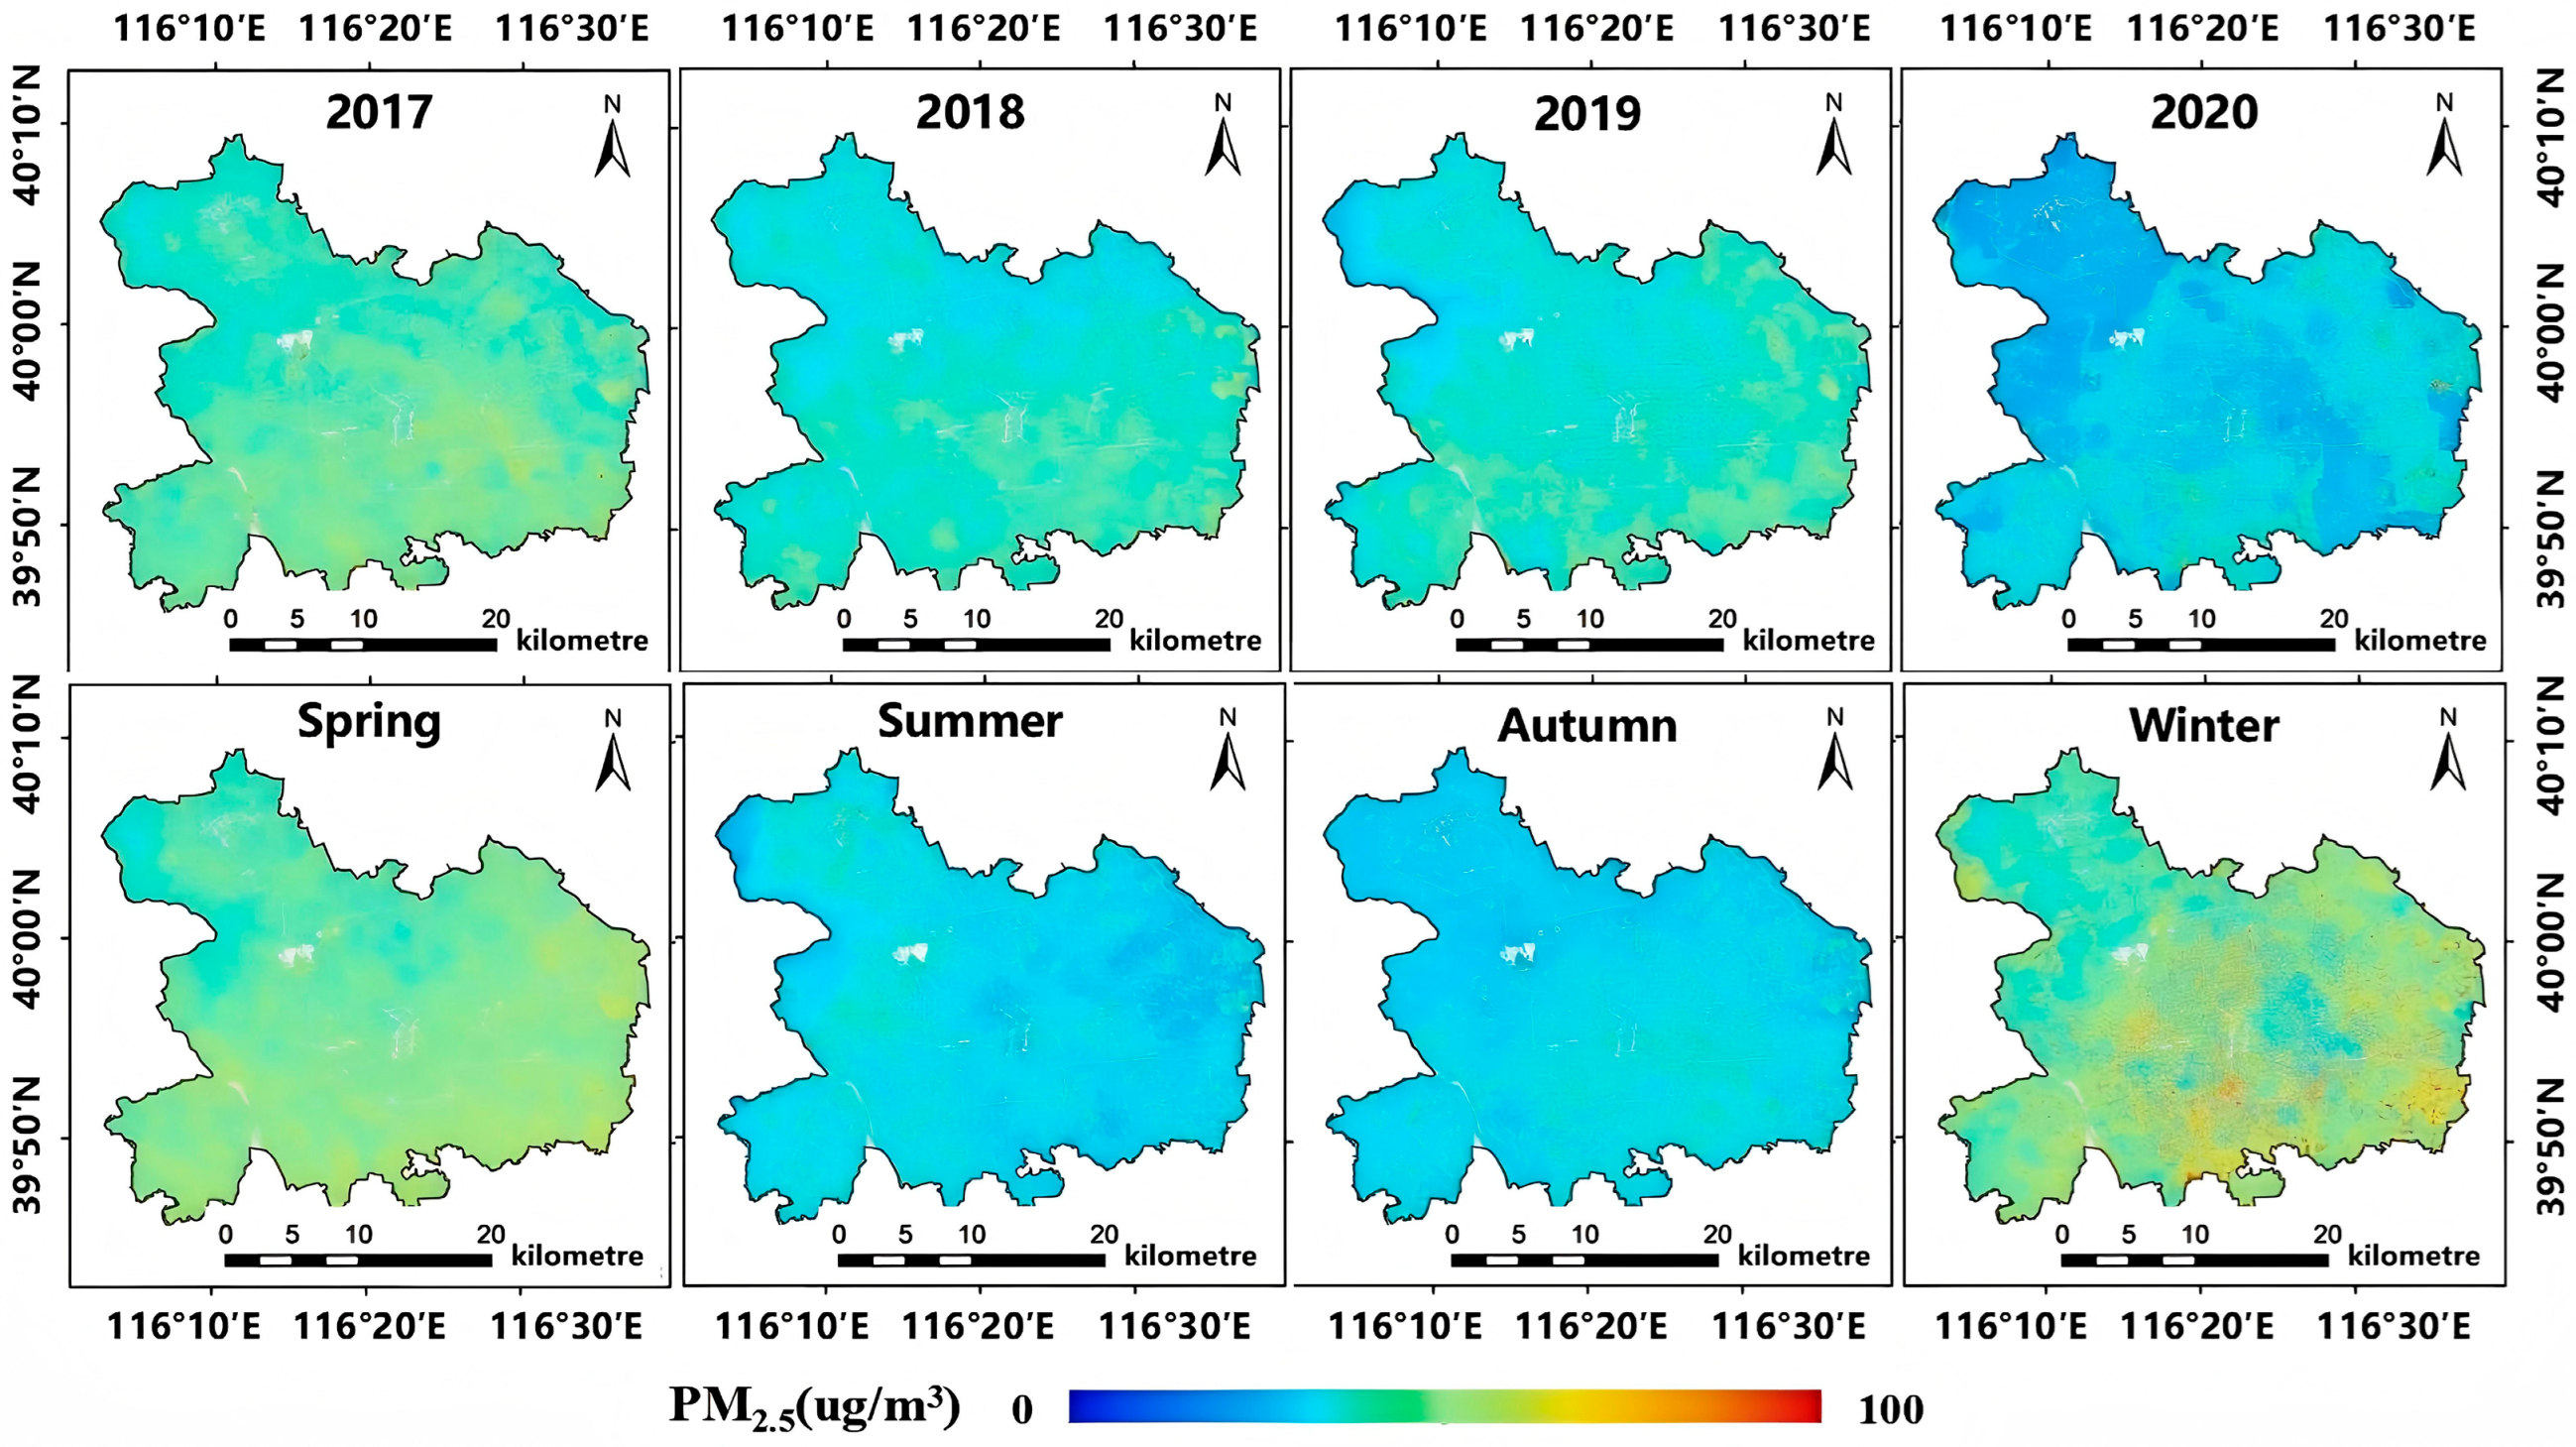
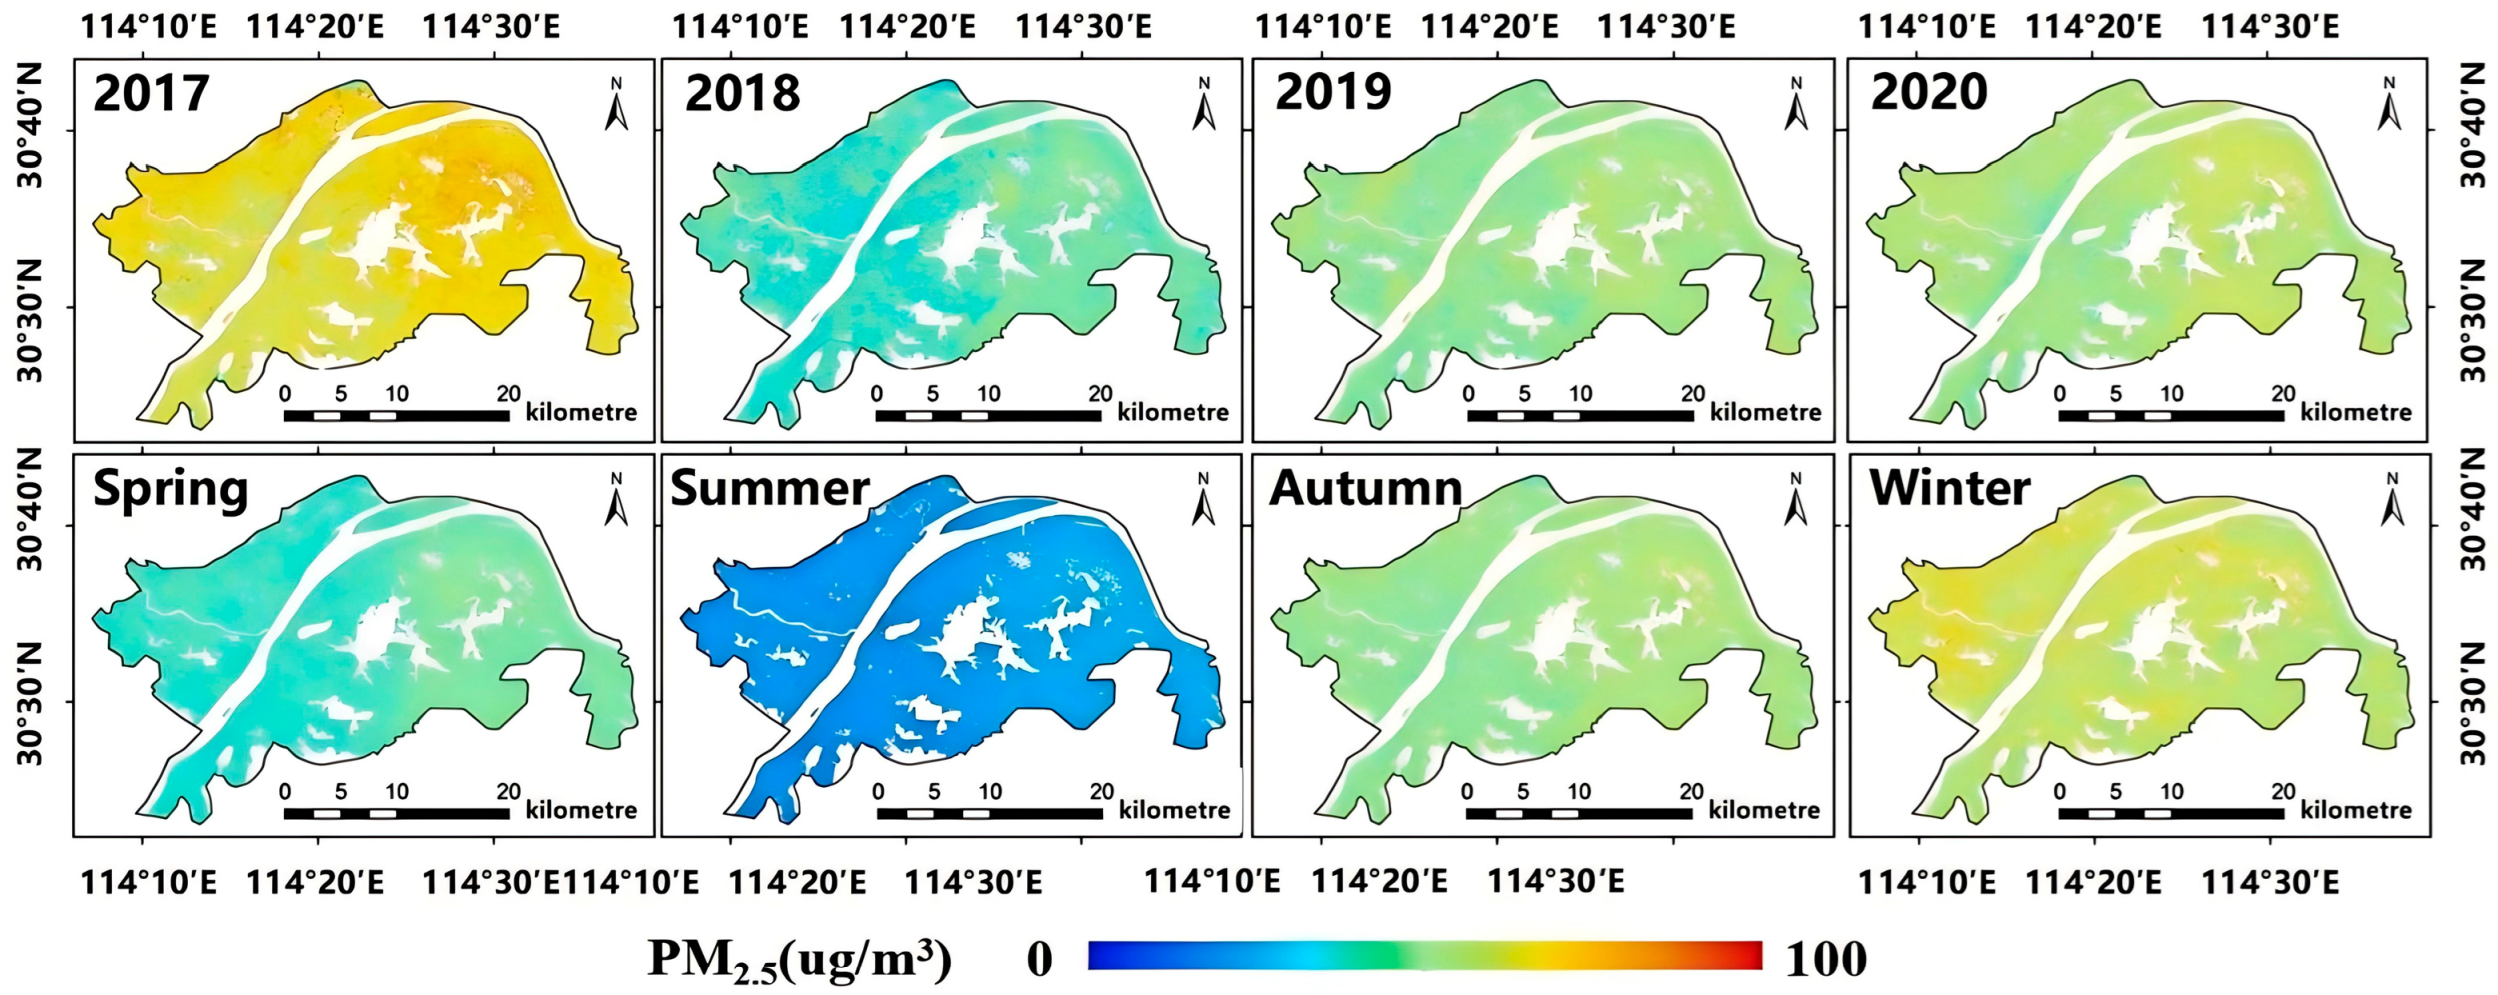
5.1. Temporal and Spatial Distribution Analysis of PM2.5

In this paper, the Landsat-8 OLI and Sentinel-2 MSI PM2.5 products from 2017 to 2020 are used to analyze the spatiotemporal distribution of PM2.5 at a 30 m resolution for certain areas in Beijing and Wuhan.
Figure 7 shows the spatiotemporal variations of PM2.5 pollution in Beijing’s central urban core, complemented by Table A2’s statistical validation showing exceptional model–ground consistency (annual/seasonal mean deviation ≤ 2.22 μg/m3). The 2017–2020 trend demonstrates phased improvements: a 7.33 μg/m3 interannual reduction (2017–2018), stabilized levels during 2018–2019, followed by an 11.58 μg/m3 decline (2019–2020), reflecting effective pollution control policies. A seasonal analysis reveals that PM2.5 concentrations in Beijing are higher in winter (44.66 ug/m3) and spring (45.21 ug/m3) and lower in summer (32.65 ug/m3) and autumn (32.26 ug/m3). The combined effects of coal combustion emissions for heating and meteorological factors (lower boundary layer height, lower wind speed) exacerbate the concentration of PM2.5 in winter. The spring PM2.5 elevation primarily stems from the long-range transport of desert dust (23.5% contribution) originating in the Mongolian Plateau’s arid regions, which interacts with anthropogenic pollutants during atmospheric transport under prevailing northwesterly winds. Overall, the spatial distribution of PM2.5 concentrations in the central city of Beijing shows a trend of higher concentrations in the southeast (Chaoyang, Dongcheng, Xicheng, and Fengtai districts) and slightly lower concentrations in the northwest (Haidian and Shijingshan districts), which is also related to the densely populated northeastern areas and the higher vegetation cover in the southwestern areas.
Figure 8 shows the spatiotemporal variations of PM2.5 pollution in Wuhan’s central urban core, complemented by Table A3’s statistical validation showing exceptional model–ground consistency (annual/seasonal mean deviation ≤ 2.59 μg/m3). PM2.5 levels in central Wuhan showed an overall decreasing trend from 2017 to 2020, with the most significant decline of 19.84 ug/m3 occurring between 2017 and 2018. Compared to 2018, PM2.5 levels rose slightly between 2019 and 2020. In the central urban areas of Wuhan, PM2.5 concentrations were the highest in winter at 84.89 ug/m3, followed by autumn at 50.16 ug/m3 and spring at 43.15 ug/m3, and the lowest in summer at 31.93 ug/m3. Overall, PM2.5 concentrations in the eastern part of the central urban areas of Wuhan (Hongshan District, Qingshan District, and Wuchang District) were higher than those in the western regions.
The PM2.5 concentrations in Wuhan are almost uniformly higher than in Beijing, which is primarily due to Wuhan being a heavy industrial city, where a significant amount of waste gas, dust, traffic emissions (from cars and ships), and other human activities within the central urban areas contribute to persistent local atmospheric pollution emissions. It should be noted that due to the still relatively low temporal resolution of satellite imagery acquisition, and the imaging times of the Landsat-8 OLI and Sentinel-2 MSI sensors being between 10:00 a.m. and 12:00 p.m., the analysis presented above is based solely on the model-retrieved PM2.5 concentration values obtained in this study and represents the spatiotemporal distribution of PM2.5 during the morning hours of 10:00 a.m. to 12:00 p.m. to a certain extent.
Figure 9a–c display the spatial distribution of PM2.5 concentrations in Beijing on a heavily polluted day, as retrieved using Landsat-8 OLI AOD on 4 March 2017. In Figure 9a, the natural true-color image shows that heavy haze covered the central urban areas. Figure 9b presents high resolution AOD products, clearly demonstrating spatially heterogeneous AOD distribution patterns across the study area. Figure 9c depicts the spatial distribution of PM2.5 retrieved using the RF model, which shows a strong spatial consistency and positive correlation with AOD. To further validate the accuracy of the PM2.5 retrieval results, Figure 9c also presents a comparative analysis between model outputs and ground-based monitoring data. The red circles in the figure indicate the geographical locations of PM2.5 monitoring stations, with their sizes proportionally representing the measured concentration values. The spatial patterns and quantitative values derived from our model demonstrate strong agreement with the ground-level observations, confirming the reliability of our retrieval method.
Figure 9d–f present the spatial distribution of AOD and PM2.5 across the center areas of Wuhan during a severe pollution day, derived from the Sentinel-2 MSI AOD on 26 November 2018. As a heavy industrial city, Wuhan has numerous energy-intensive factories scattered throughout the city. Figure 9d shows the Sentinel-2 MSI natural true-color image; the AOD retrieval results in Figure 9e clearly identify multiple concurrent pollution point sources emitting particulates within Wuhan’s metropolitan area. Figure 9f demonstrates the spatial correlation between satellite-derived PM2.5 estimates and ground measurements, showing good consistency between the model outputs and monitoring station data in terms of spatial patterns. During this pollution event, Wuhan recorded hazardous air quality levels, with PM2.5 concentrations averaging 119.25 μg/m3 and reaching a peak of 172 μg/m3. The close correspondence between the modeled PM2.5 values and ground observations further validates the retrieval methodology.

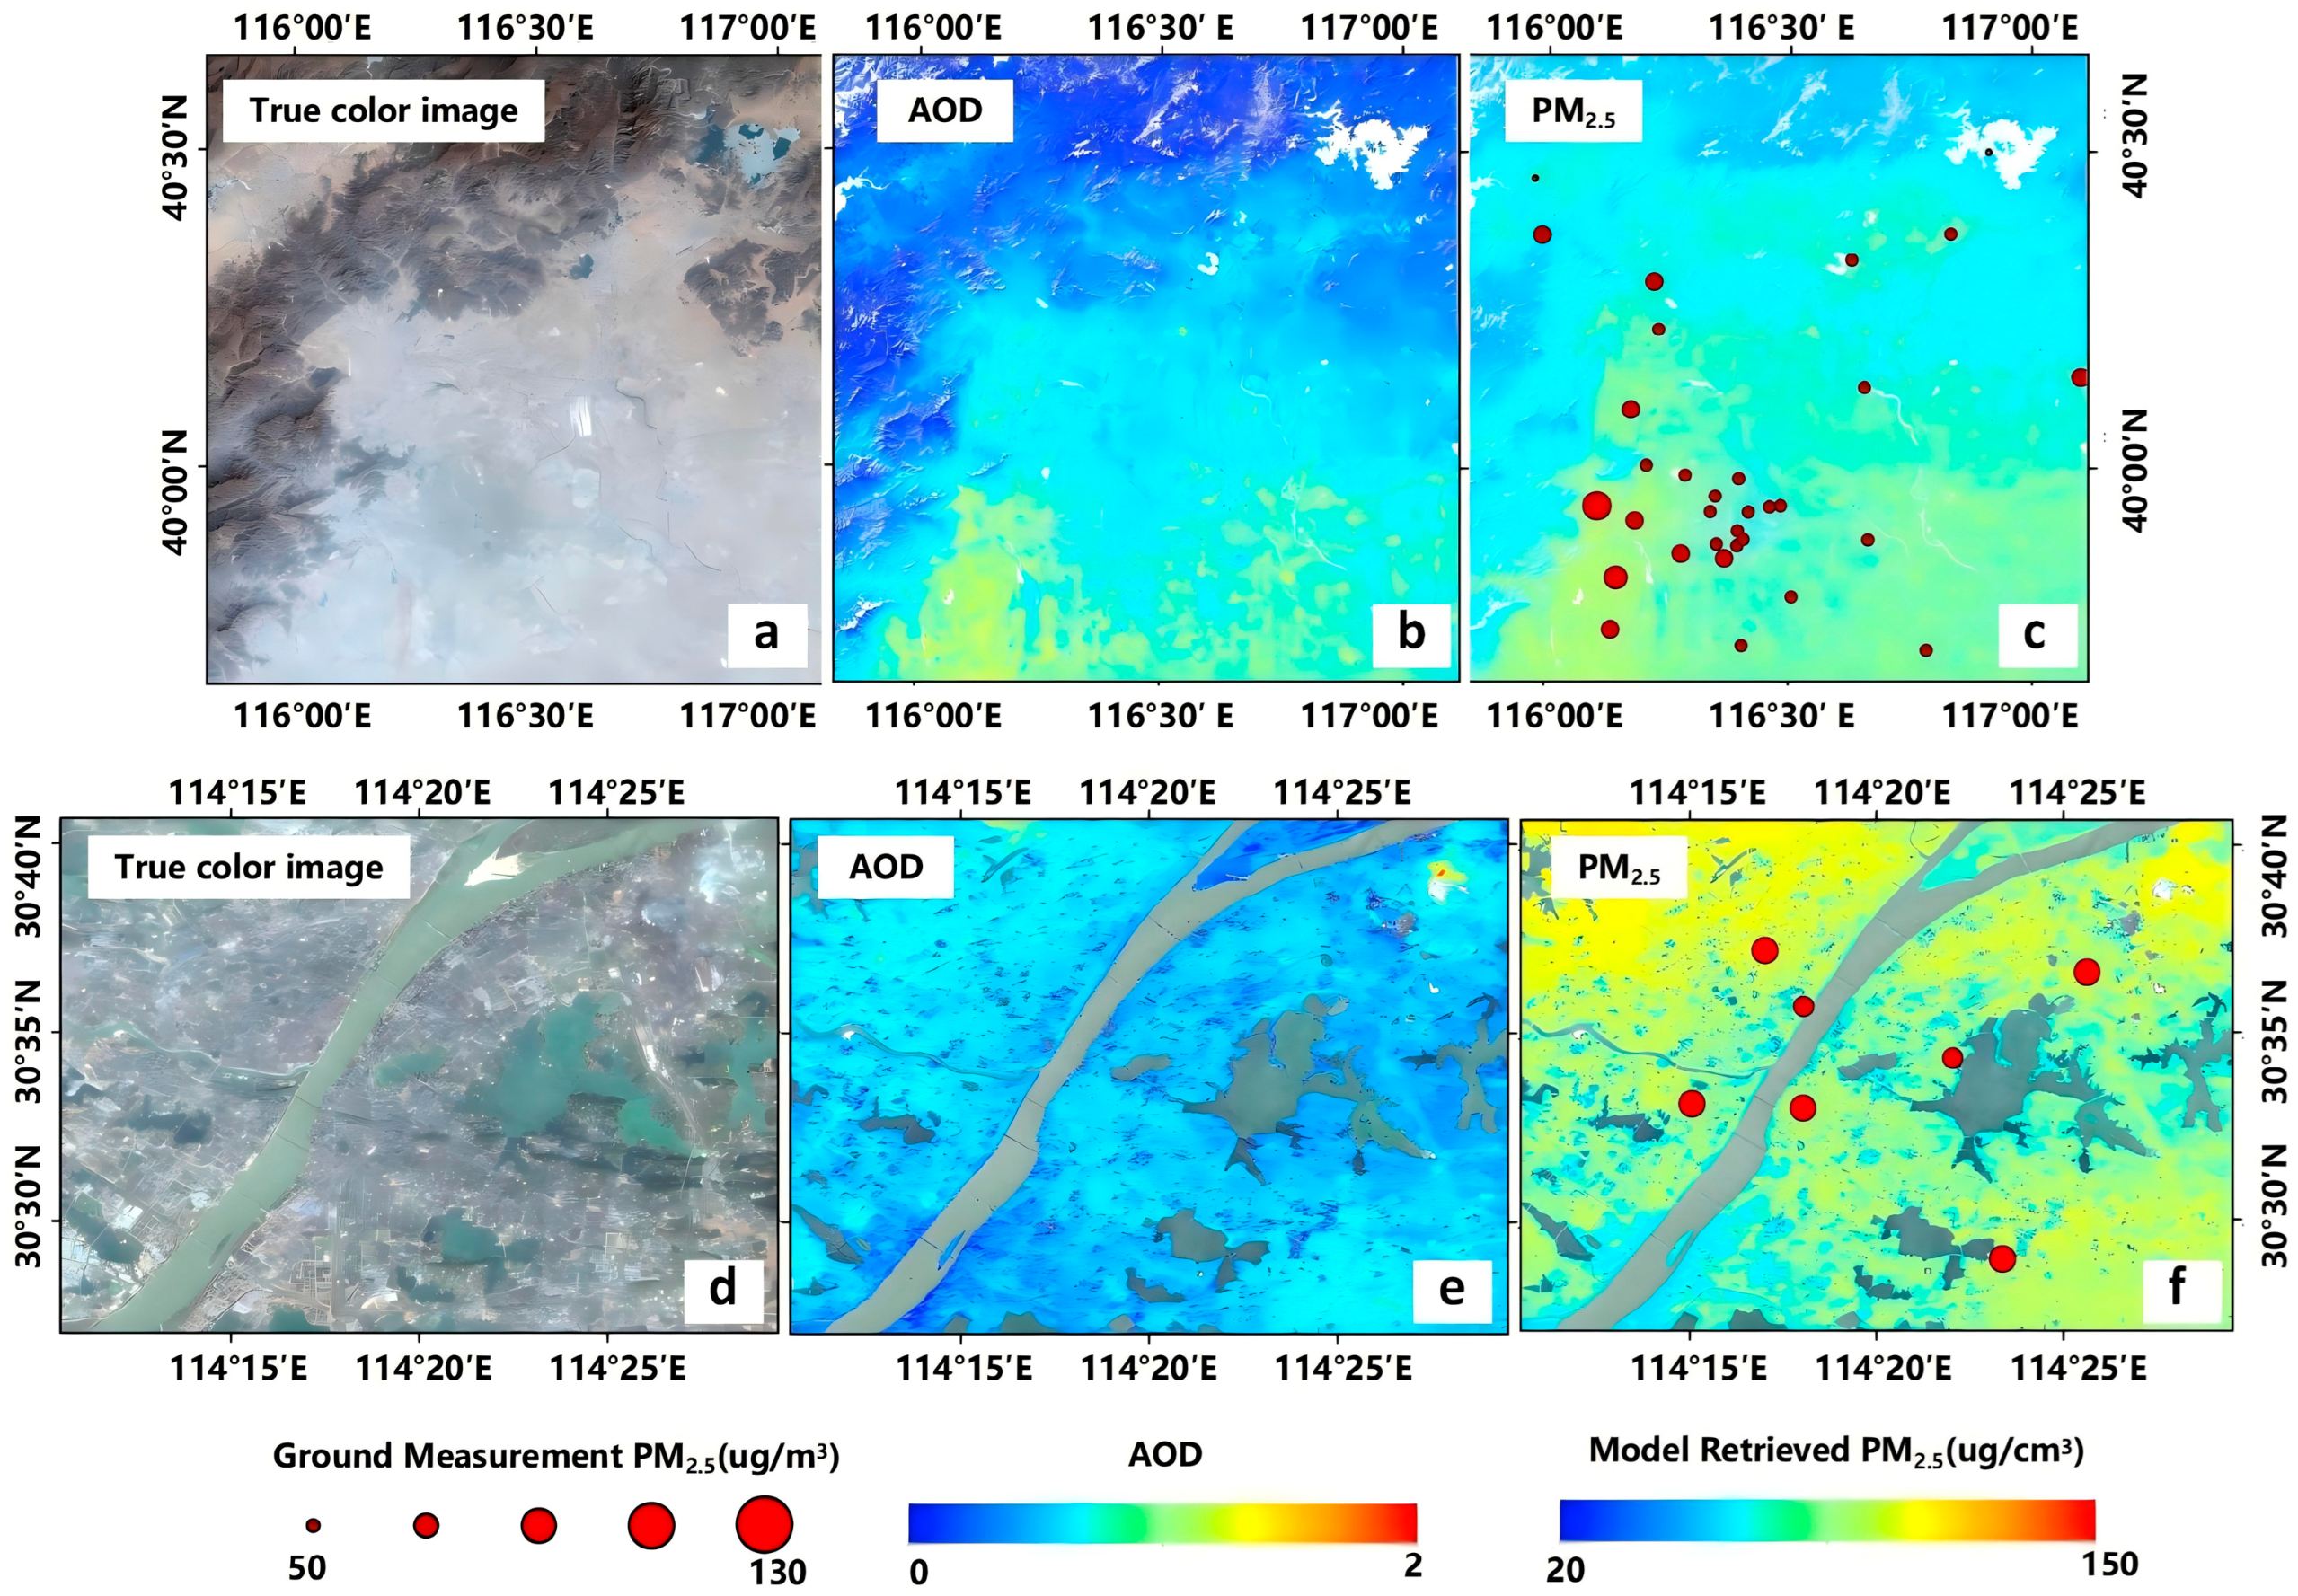
5.2. Monitoring of Point Source Pollution for PM2.5

Ultrahigh resolution PM2.5 satellite remote sensing products play a crucial role in monitoring industrial point source emissions. China Baowu Steel Group Corporation ranks as the fourth-largest steel enterprise globally. Located in Qingshan District, Wuhan, on the southern bank of the Yangtze River, its facility spans 21.17 square kilometers. Within the plant, over 100 chimneys release massive volumes of exhaust gases into the air, causing severe contamination in the surrounding areas. Figure 10 illustrates the spatial distribution of atmospheric pollutants around China Baowu Steel Group captured on selected monitoring dates. To investigate the correlation between the point source pollution dispersion and meteorological conditions, the study employed the Hybrid Single-Particle Lagrangian Integrated Trajectory (HYSPLIT) model to generate forward trajectories. Considering the lag effect of stack emissions on surrounding areas, the model initiation time was set to 1 h prior to the satellite overpass moment. Trajectories simulating 2-h pollutant transport were generated at three altitude levels: 100 m, 300 m, and 500 m above ground level.
Figure 10 demonstrates the spatial distribution of PM2.5 retrieved from Sentinel-2 MSI and Landsat-8 OLI AOD for two pollution episodes (27 October 2017 and 5 November 2019). The satellite imagery (Figure 10a) captures continuous emission plumes from steel plant sintering furnaces, with northeasterly winds driving the southwestward transport of pollutants over considerable distances. This dispersion pattern is corroborated by both AOD retrievals (Figure 10b) and modeled PM2.5 distributions (Figure 10c), showing strong spatial coherence between PM2.5 and AOD. The exhaust emissions from the plant contain a large amount of fine particulate matter, which gradually settles and disappears during the dispersion process. To further demonstrate the rationality of the spatial distribution of PM2.5 retrieved by the model, a comparative analysis was conducted using two ground-based PM2.5 monitoring stations near the plant (Figure 10d). The results indicate that at the QingshanGanghua (QSGH) PM2.5 station, located immediately downwind of the plant, both PM2.5 and PM10 concentrations were the highest among all monitoring stations in Wuhan at that time, with PM2.5 reaching 130 ug/m3 and PM10 reaching 249 ug/m3. In contrast, the concentrations of PM2.5 and PM10 at the Donghu Liyuan (DHLY) station, which is farther from the emission source, were close to the city’s average levels. This suggests that under stagnant atmospheric conditions, pollution emissions from the Baowu Iron & Steel Group tend to accumulate in the vicinity of the facility, leading to persistent pollution accumulation.
Figure 10e also demonstrates that several chimneys from the Baowu Iron and Steel Group are emitting exhaust gas into the atmosphere. The AOD retrieval results (Figure 10f) distinctly illustrate the spatial diffusion trend of the exhaust gas. Under the influence of northeasterly winds (Beaufort scale 3), the stack emissions exhibited rapid southwestward dispersion rather than local accumulation, forming well-defined atmospheric plumes. The AOD-derived PM2.5 spatial distribution (Figure 10g) indicates that while urban background concentrations were relatively homogeneous across Wuhan, the facility’s vicinity maintained elevated PM2.5 levels compared to most ground stations (Figure 10h). Notably, the downwind DHLY station recorded higher PM2.5 concentrations than the proximal QSGH station. The primary cause was the high wind velocity on that day, which carried the chimney’s exhaust gases containing fine particulate matter away from the immediate vicinity. Instead of settling near the emission source, these particles were transported downwind over a considerable distance before gradually descending to ground level.

6. Conclusions

Ultrahigh resolution PM2.5 remote sensing products play a pivotal role in urban-scale air quality monitoring and pollution analysis. This study develops a novel retrieval algorithm for PM2.5 concentrations with ultrahigh spatial resolution in urban environments. Leveraging aerosol optical depth (AOD) products derived from Landsat-8 OLI (China-wide coverage) and Sentinel-2 MSI (Beijing and Wuhan focus) satellite data between 2017 and 2020, we integrated ground-based PM2.5 measurements, meteorological parameters, and supplementary remote sensing data to develop a PM2.5-AOD correlation model by comparing three machine learning approaches (RF, BPNN, and CatBoost). The main conclusions of this article are as follows:
(1) The comparative analysis reveals the RF model’s superior performance, achieving training R2 values of 0.82 (sample-based) and 0.76 (site-based). The model demonstrates robust predictive capability, with validation R2 values reaching 0.86 in Beijing and 0.85 in Wuhan. The spatial–temporal analysis of RF-derived PM2.5 concentrations highlights the method’s exceptional capacity for characterizing urban pollution patterns and identifying pollution hotspots at fine scales.
(2) From 2017 to 2020, PM2.5 concentrations in Beijing and Wuhan generally showed a declining trend, decreasing by 15.32 ug/m3 and 14.40 ug/m3, respectively, demonstrating the effectiveness of China’s air pollution control measures. Higher PM2.5 concentrations in Beijing were observed in winter and spring, with average values of 44.66 ug/m3 and 45.21 ug/m3, respectively, while Wuhan experienced higher PM2.5 concentrations in autumn and winter, with average values of 50.16 ug/m3 and 84.89 ug/m3, respectively.
(3) A case study of industrial point source pollution based on a typical heavy pollution emission enterprise further demonstrates that ultrahigh resolution PM2.5 can accurately identify the diffusion trend of point source pollution, providing fundamental data support for the precise monitoring of urban air pollution, pollutant tracing, resident exposure risk assessment, and air pollution prevention and control.

Author Contributions

Conceptualization, H.L., J.N., and S.L. (Siwei Li); methodology, H.L. and Q.W.; software, J.Y. and W.L.; validation, H.L., Q.W., and S.L. (Shengpeng Liu); data curation, W.L., H.L., and S.L. (Shengpeng Liu); writing—original draft preparation, H.L., S.L. (Siwei Li), Q.W., and J.Y.; writing—review and editing, S.L. (Siwei Li) and H.L. All authors have read and agreed to the published version of the manuscript.

Funding

This work was funded by the National Natural Science Foundation of China [NO: 42375131], Key Laboratory of National Geographic Census and Monitoring, Ministry of Natural Resources [NO: 2025NGCM02], Key Scientific and Technological Research Project of Henan Province (NO: 242102320083), Key Research Projects of Higher Education Institutions in Henan Province (NO: 25B420002), Key Laboratory of Investigation, Monitoring, Protection and Utilization for Cultivated Land Resources, and the Ministry of Natural Resources (No: CLRKL2024GP04).

Data Availability Statement

PM2.5 station observations in the Chinese mainland region are available at http://www.cnemc.cn/, accessed on 10 June 2025. The ERA5 Single Layer dataset is available at https://www.ecmwf.int/en/forecasts/datasets/reanalysis-datasets/era5, accessed on 10 June 2025. The SRTM DEM data are available at http://srtm.csi.cgiar.org/srtmdata/, accessed on 10 June 2025. The Land Use and Cover Change data is available at https://zenodo.org/record/4280923, accessed on 10 June 2025.

Acknowledgments

The authors thank USGS and ESA for their free provision of the Landsat-8 and Sentinel-2 images. We thank the China National Environmental Monitoring Centre for its free ground-based PM2.5 data. We would like to thank the Chinese Academy of Sciences for providing the GLC_FCS30-2020 data. We also would like to thank the anonymous reviewers for their insightful and valuable advice and the assistance of the editorial team of Remote Sensing.

Conflicts of Interest

The authors declare no conflicts of interest.

Appendix A

Table A1. Statistical analysis of feature parameters in PM2.5-AOD modeling.
Characteristic Parameters (units)MinimumMaximumMedianMeanStandard Deviation
PM2.5 (ug/m3)1.00373.0033.0041.3333.36
LAT (°)20.0050.4335.4834.905.74
LON (°)98.58129.49116.13115.066.30
AOD (N/A)0.011.650.300.340.23
NDVI (N/A)0.010.890.310.330.14
DEM (m)−1.003815.0083.00369.63581.74
LUCC (N/A)2.0017.0013.0012.251.90
TEM (K)250.30312.40291.70290.769.64
SP (hPa)60.90104.30100.0096.757.20
10UW (m/s)−10.2410.470.400.562.21
10VW (m/s)−10.299.570.290.152.54
PBLH (m)12.004248.00876.001010.12534.68
RH (%)3.1494.5241.6941.9116.23
TO3 (g/m2)4.7011.806.806.870.94
Table A2. Comparison of ground-measured PM2.5 and model-retrieved PM2.5 in the central city of Beijing.
Year/SeasonGround Measured PM2.5 (ug/m3)Model Retrieved PM2.5 (ug/m3)Error (ug/m3)
Spring46.2745.211.06
Summer32.8932.650.24
Autumn30.3032.26−1.96
Winter43.4344.66−1.23
201745.3643.142.22
201838.0339.00−0.97
201938.3436.941.40
202026.7627.82−1.06
Table A3. Comparison of ground-level PM2.5 measurements and model-retrieved AOD in central urban areas of Wuhan.
Year/SeasonGround Measurements PM2.5 (ug/m3)Model Retrieved PM2.5 (ug/m3)Error (ug/m3)
Spring43.9243.150.77
Summer29.3431.93−2.59
Autumn48.5950.16−1.57
Winter82.9184.89−1.98
201762.8665.05−2.19
201841.6043.17−1.57
201948.7950.34−1.55
202048.1350.65−2.52

References

  1. Tian, Z.; Wei, J.; Li, Z. How Important Is Satellite-Retrieved Aerosol Optical Depth in Deriving Surface PM2.5 Using Machine Learning? Remote Sens. 2023, 15, 3780. [Google Scholar] [CrossRef]
  2. Perez, P.; Trier, A.; Reyes, J. Prediction of PM2.5 concentrations several hours in advance using neural networks in Santiago, Chile. Atmos. Environ. 2000, 34, 1189–1196. [Google Scholar] [CrossRef]
  3. Elangasinghe, M.A.; Singhal, N.; Dirks, K.N.; Salmond, J.A.; Samarasinghe, S. Complex time series analysis of PM10 and PM2.5 for a coastal site using artificial neural network modelling and k-means clustering. Atmos. Environ. 2014, 94, 106–116. [Google Scholar] [CrossRef]
  4. Feng, X.; Li, Q.; Zhu, Y.J.; Hou, J.X.; Jin, L.Y.; Wang, J.J. Artificial neural networks forecasting of PM2.5 pollution using air mass trajectory based geographic model and wavelet transformation. Atmos. Environ. 2015, 107, 118–128. [Google Scholar] [CrossRef]
  5. Gupta, P.; Christopher, S.A. Particulate matter air quality assessment using integrated surface, satellite, and meteorological products: 2. A neural network approach. J. Geophys. Res. Atmos. 2009, 114, D20. [Google Scholar] [CrossRef]
  6. Guo, J.-P.; Wu, Y.-R.; Zhang, X.-Y.; Li, X.-W. Estimation of PM2.5 over eastern China from MODIS aerosol optical depth using the back propagation neural network. Huanjing Kexue Xuebao/Acta Sci. Circumstantiae 2013, 34, 817–825. [Google Scholar]
  7. Wang, W.L.; Zhao, S.L.; Jiao, L.M.; Taylor, M.; Zhang, B.E.; Xu, G.; Hou, H.B. Estimation of PM2.5 Concentrations in China Using a Spatial Back Propagation Neural Network. Sci. Rep. 2019, 9, 13788. [Google Scholar] [CrossRef]
  8. Kow, P.Y.; Wang, Y.S.; Zhou, Y.L.; Kao, I.F.; Issermann, M.; Chang, L.C.; Chang, F.J. Seamless integration of convolutional and back-propagation neural networks for regional multi-step-ahead PM2.5 forecasting. J. Clean. Prod. 2020, 261, 121285. [Google Scholar] [CrossRef]
  9. Zhou, Q.P.; Jiang, H.Y.; Wang, J.Z.; Zhou, J.L. A hybrid model for PM2.5 forecasting based on ensemble empirical mode decomposition and a general regression neural network. Sci. Total Environ. 2014, 496, 264–274. [Google Scholar] [CrossRef]
  10. Zhu, S.; Lian, X.; Wei, L.; Che, J.; Shen, X.; Yang, L.; Qiu, X.; Liu, X.; Gao, W.; Ren, X.; et al. PM2.5 forecasting using SVR with PSOGSA algorithm based on CEEMD, GRNN and GCA considering meteorological factors. Atmos. Environ. 2018, 183, 20–32. [Google Scholar] [CrossRef]
  11. Shen, H.; Li, T.; Yuan, Q.; Zhang, L. Estimating Regional Ground-Level PM2.5 Directly From Satellite Top-Of-Atmosphere Reflectance Using Deep Belief Networks. J. Geophys. Res. Atmos. 2018, 123, 13875–13886. [Google Scholar] [CrossRef]
  12. Xing, Y.; Yue, J.P.; Chen, C.; Xiang, Y.F.; Chen, Y.; Shi, M.X. A Deep Belief Network Combined with Modified Grey Wolf Optimization Algorithm for PM2.5 Concentration Prediction. Appl. Sci. 2019, 9, 3765. [Google Scholar] [CrossRef]
  13. Jia, C.; Sun, L.; Chen, Y.; Liu, Q.; Yu, H.; Zhang, W. Satellite Aerosol Retrieval Using Scene Simulation and Deep Belief Network. IEEE Trans. Geosci. Remote Sens. 2022, 60, 4104516. [Google Scholar] [CrossRef]
  14. Liu, W.; Guo, G.; Chen, F.J.; Chen, Y.H. Meteorological pattern analysis assisted daily PM2.5 grades prediction using SVM optimized by PSO algorithm. Atmos. Pollut. Res. 2019, 10, 1482–1491. [Google Scholar] [CrossRef]
  15. Zhou, Y.; Chang, F.-J.; Chang, L.-C.; Kao, I.-F.; Wang, Y.-S.; Kang, C.-C. Multi-output support vector machine for regional multi-step-ahead PM2. 5 forecasting. Sci. Total Environ. 2019, 651, 230–240. [Google Scholar] [CrossRef]
  16. Mogollón-Sotelo, C.; Casallas, A.; Vidal, S.; Celis, N.; Ferro, C.; Belalcazar, L. A support vector machine model to forecast ground-level PM2. 5 in a highly populated city with a complex terrain. Air Qual. Atmos. Health 2021, 14, 399–409. [Google Scholar] [CrossRef]
  17. Wei, J.; Huang, W.; Li, Z.; Xue, W.; Cribb, M. Estimating 1-km-resolution PM2.5 concentrations across China using the space-time random forest approach. Remote Sens. Environ. 2019, 231, 111221. [Google Scholar] [CrossRef]
  18. Breiman, L. Random forests. Mach. Learn. 2001, 45, 5–32. [Google Scholar] [CrossRef]
  19. Hu, X.; Belle, J.H.; Meng, X.; Wildani, A.; Waller, L.A.; Strickland, M.J.; Liu, Y. Estimating PM2.5 Concentrations in the Conterminous United States Using the Random Forest Approach. Environ. Sci. Technol. 2017, 51, 6936–6944. [Google Scholar] [CrossRef]
  20. Zhao, C.; Wang, Q.; Ban, J.; Liu, Z.; Zhang, Y.; Ma, R.; Li, S.; Li, T. Estimating the daily PM2.5 concentration in the Beijing-Tianjin-Hebei region using a random forest model with a 0.01° × 0.01° spatial resolution. Environ. Int. 2019, 134, 105297. [Google Scholar] [CrossRef]
  21. Brokamp, C.; Jandarov, R.; Hossain, M.; Ryan, P. Predicting Daily Urban Fine Particulate Matter Concentrations Using a Random Forest Model. Environ. Sci. Technol. 2018, 52, 4173–4179. [Google Scholar] [CrossRef] [PubMed]
  22. Huang, K.; Xiao, Q.; Meng, X.; Geng, G.; Wang, Y.; Lyapustin, A.; Gu, D.; Liu, Y. Predicting monthly high-resolution PM2.5 concentrations with random forest model in the North China Plain. Environ. Pollut. 2018, 242, 675–683. [Google Scholar] [CrossRef] [PubMed]
  23. Yu, W.; Ye, T.; Zhang, Y.; Xu, R.; Lei, Y.; Chen, Z.; Yang, Z.; Zhang, Y.; Song, J.; Yue, X.; et al. Global estimates of daily ambient fine particulate matter concentrations and unequal spatiotemporal distribution of population exposure: A machine learning modelling study. Lancet Planet. Health 2023, 7, e209–e218. [Google Scholar] [CrossRef]
  24. Wei, J.; Li, Z.; Lyapustin, A.; Sun, L.; Peng, Y.; Xue, W.; Su, T.; Cribb, M. Reconstructing 1-km-resolution high-quality PM2.5 data records from 2000 to 2018 in China: Spatiotemporal variations and policy implications. Remote Sens. Environ. 2021, 252, 112136. [Google Scholar] [CrossRef]
  25. Southerland, V.A.; Brauer, M.; Mohegh, A.; Hammer, M.S.; van Donkelaar, A.; Martin, R.V.; Apte, J.S.; Anenberg, S.C. Global urban temporal trends in fine particulate matter (PM2·5) and attributable health burdens: Estimates from global datasets. Lancet Planet. Health 2022, 6, e139–e146. [Google Scholar] [CrossRef]
  26. Bai, H.; Wu, H.; Gao, W.; Wang, S.; Cao, Y. Influence of spatial resolution of PM2.5 concentrations and population on health impact assessment from 2010 to 2020 in China. Environ. Pollut. 2023, 326, 121505. [Google Scholar] [CrossRef]
  27. Hu, X.; Waller, L.A.; Lyapustin, A.; Wang, Y.; Liu, Y. 10-year spatial and temporal trends of PM2.5 concentrations in the southeastern US estimated using high-resolution satellite data. Atmos. Chem. Phys. 2014, 14, 6301–6314. [Google Scholar] [CrossRef]
  28. Bai, Y.; Wu, L.; Qin, K.; Zhang, Y.; Shen, Y.; Zhou, Y. A geographically and temporally weighted regression model for ground-level PM2.5 estimation from satellite-derived 500 m resolution AOD. Remote Sens. 2016, 8, 262. [Google Scholar] [CrossRef]
  29. Qiao, T.; Zhao, M.; Xiu, G.; Yu, J. Simultaneous monitoring and compositions analysis of PM1 and PM2.5 in Shanghai: Implications for characterization of haze pollution and source apportionment. Sci. Total Environ. 2016, 557–558, 386–394. [Google Scholar] [CrossRef]
  30. Zhang, Y.; Li, Z.; Bai, K.; Wei, Y.; Xie, Y.; Zhang, Y.; Ou, Y.; Cohen, J.; Zhang, Y.; Peng, Z.; et al. Satellite remote sensing of atmospheric particulate matter mass concentration: Advances, challenges, and perspectives. Fundam. Res. 2021, 1, 240–258. [Google Scholar] [CrossRef]
  31. Wei, J.; Li, Z.; Lyapustin, A.; Wang, J.; Dubovik, O.; Schwartz, J.; Sun, L.; Li, C.; Liu, S.; Zhu, T. First close insight into global daily gapless 1 km PM2.5 pollution, variability, and health impact. Nat. Commun. 2023, 14, 8349. [Google Scholar] [CrossRef]
  32. Sun, K.; Chen, X.; Wang, J.; Zhang, T.; Zhu, Z. Investigation of air quality over the largest city in central China using high resolution satellite derived aerosol optical depth data. Atmos. Pollut. Res. 2018, 9, 584–593. [Google Scholar] [CrossRef]
  33. Zhang, T.H.; Zhu, Z.M.; Gong, W.; Zhu, Z.R.; Sun, K.; Wang, L.C.; Huang, Y.S.; Mao, F.Y.; Shen, H.F.; Li, Z.W.; et al. Estimation of ultrahigh resolution PM2.5 concentrations in urban areas using 160 m Gaofen-1 AOD retrievals. Remote Sens. Environ. 2018, 216, 91–104. [Google Scholar] [CrossRef]
  34. Lin, H.; Li, S.; Xing, J.; Yang, J.; Wang, Q.; Dong, L.; Zeng, X. Fusing Retrievals of High Resolution Aerosol Optical Depth from Landsat-8 and Sentinel-2 Observations over Urban Areas. Remote Sens. 2021, 13, 4140. [Google Scholar] [CrossRef]
  35. Wei, J.; Wang, Z.; Li, Z.; Li, Z.; Pang, S.; Xi, X.; Cribb, M.; Sun, L. Global aerosol retrieval over land from Landsat imagery integrating Transformer and Google Earth Engine. Remote Sens. Environ. 2024, 315, 114404. [Google Scholar] [CrossRef]
  36. Tang, Y.; Deng, R.; Li, J.; Liang, Y.; Xiong, L.; Liu, Y.; Zhang, R.; Hua, Z. Estimation of Ultrahigh Resolution PM2.5 Mass Concentrations Based on Mie Scattering Theory by Using Landsat8 OLI Images over Pearl River Delta. Remote Sens. 2021, 13, 2463. [Google Scholar] [CrossRef]
  37. Wang, Y.; Li, Q.; Luo, Z.; Zhao, J.; Lv, Z.; Deng, Q.; Liu, J.; Ezzati, M.; Baumgartner, J.; Liu, H.; et al. Ultra-high-resolution mapping of ambient fine particulate matter to estimate human exposure in Beijing. Commun. Earth Environ. 2023, 4, 451. [Google Scholar] [CrossRef] [PubMed]
  38. Wu, Y.; Lee, H.F.; Deng, R.R.; Yim, S.H.L. An analysis of roadside particulate matter pollution and population exposure over the Pearl River Delta region of China under clear-sky condition using new ultra-high-resolution PM2.5 satellite-retrieval algorithms. Environ. Res. Lett. 2024, 19, 034042. [Google Scholar] [CrossRef]
  39. Yang, Q.; Yuan, Q.; Li, T. Ultrahigh-resolution PM2.5 estimation from top-of-atmosphere reflectance with machine learning: Theories, methods, and applications. Environ. Pollut. 2022, 306, 119347. [Google Scholar] [CrossRef]
  40. Zhang, Y.; Zhai, S.; Huang, J.; Li, X.; Wang, W.; Zhang, T.; Yin, F.; Ma, Y. Estimating high-resolution PM2.5 concentration in the Sichuan Basin using a random forest model with data-driven spatial autocorrelation terms. J. Clean. Prod. 2022, 380, 134890. [Google Scholar] [CrossRef]
  41. Ma, Y.; Zhang, M.; Jin, S.; Gong, W.; Chen, N.; Chen, Z.; Jin, Y.; Shi, Y. Long-Term Investigation of Aerosol Optical and Radiative Characteristics in a Typical Megacity of Central China During Winter Haze Periods. J. Geophys. Res. Atmos. 2019, 124, 12093–12106. [Google Scholar] [CrossRef]
  42. Lin, H.; Li, S.; Xing, J.; He, T.; Yang, J.; Wang, Q. High resolution aerosol optical depth retrieval over urban areas from Landsat-8 OLI images. Atmos. Environ. 2021, 261, 118591. [Google Scholar] [CrossRef]
  43. Zhang, X.; Liu, L.Y.; Chen, X.D.; Xie, S.; Gao, Y. Fine Land-Cover Mapping in China Using Landsat Datacube and an Operational SPECLib-Based Approach. Remote Sens. 2019, 11, 1056. [Google Scholar] [CrossRef]
  44. Dong, L.; Li, S.; Xing, J.; Lin, H.; Wang, S.; Zeng, X.; Qin, Y. Joint features random forest (JFRF) model for mapping hourly surface PM2.5 over China. Atmos. Environ. 2022, 273, 118969. [Google Scholar] [CrossRef]
  45. Yang, Y.; Wang, Z.; Cao, C.; Xu, M.; Yang, X.; Wang, K.; Guo, H.; Gao, X.; Li, J.; Shi, Z. Estimation of PM2.5 Concentration across China Based on Multi-Source Remote Sensing Data and Machine Learning Methods. Remote Sens. 2024, 16, 467. [Google Scholar] [CrossRef]
  46. Liu, Y.; Park, R.J.; Jacob, D.J.; Li, Q.; Kilaru, V.; Sarnat, J.A. Mapping annual mean ground-level PM2.5 concentrations using Multiangle Imaging Spectroradiometer aerosol optical thickness over the contiguous United States. J. Geophys. Res. Atmos. 2004, 109, 1–10. [Google Scholar] [CrossRef]
  47. Hu, X.; Waller, L.A.; Lyapustin, A.; Wang, Y.; Al-Hamdan, M.Z.; Crosson, W.L.; Estes, M.G.; Estes, S.M.; Quattrochi, D.A.; Puttaswamy, S.J.; et al. Estimating ground-level PM2.5 concentrations in the Southeastern United States using MAIAC AOD retrievals and a two-stage model. Remote Sens. Environ. 2014, 140, 220–232. [Google Scholar] [CrossRef]
  48. Ding, Y.; Chen, Z.; Lu, W.; Wang, X. A CatBoost approach with wavelet decomposition to improve satellite-derived high-resolution PM2.5 estimates in Beijing-Tianjin-Hebei. Atmos. Environ. 2021, 249, 118212. [Google Scholar] [CrossRef]
  49. Rodríguez, J.D.; Pérez, A.; Lozano, J.A. Sensitivity Analysis of k-Fold Cross Validation in Prediction Error Estimation. IEEE Trans. Pattern Anal. Mach. Intell. 2010, 32, 569–575. [Google Scholar] [CrossRef]
  50. Bi, J.; Knowland, K.E.; Keller, C.A.; Liu, Y. Combining Machine Learning and Numerical Simulation for High-Resolution PM2.5 Concentration Forecast. Env. Sci Technol. 2022, 56, 1544–1556. [Google Scholar] [CrossRef] [PubMed]
  51. Vu, B.N.; Bi, J.; Wang, W.; Huff, A.; Kondragunta, S.; Liu, Y. Application of geostationary satellite and high-resolution meteorology data in estimating hourly PM2.5 levels during the Camp Fire episode in California. Remote Sens. Environ. 2022, 271, 112890. [Google Scholar] [CrossRef] [PubMed]
  52. Meng, L.; Xu, X.; Huang, X.; Li, X.; Chang, X.; Xu, D. High-resolution estimation of PM2.5 concentrations across China using multiple machine learning approaches and model fusion. Atmos. Pollut. Res. 2024, 15, 102110. [Google Scholar] [CrossRef]
  53. Dong, L.; Li, S.; Yang, J.; Shi, W.; Zhang, L. Investigating the performance of satellite-based models in estimating the surface PM2.5 over China. Chemosphere 2020, 256, 127051. [Google Scholar] [CrossRef]
  54. Li, P.; Huang, S.; Luo, C.; Li, X.; Zhang, Q.; Wang, J.; Yang, C.; Yang, H.; Liao, J.; Chen, Q.; et al. Temporal heterogeneity in the performance of machine learning models for PM2.5 concentration estimation. Process Saf. Environ. Prot. 2024, 189, 977–984. [Google Scholar] [CrossRef]
  55. Handschuh, J.; Erbertseder, T.; Baier, F. Systematic Evaluation of Four Satellite AOD Datasets for Estimating PM2.5 Using a Random Forest Approach. Remote Sens. 2023, 15, 2064. [Google Scholar] [CrossRef]
Figure 1. The location of the study area and the spatial distribution of land use cover types and ground-based PM2.5 sites.
Remotesensing 17 02609 g001
Figure 2. The average AOD from 2017 to 2020 and the ground-measured PM2.5 station distribution over China (the map of China is based on drawing review No. GS (2016) 1603, supervised by the Ministry of Natural Resources of the People’s Republic of China).
Remotesensing 17 02609 g002
Figure 3. Schematic diagram of PM2.5 retrieval using machine learning algorithms.
Remotesensing 17 02609 g003
Figure 4. Frequency distribution histograms of the parameters in the PM2.5-AOD modeling dataset.
Remotesensing 17 02609 g004
Figure 5. Ten-fold cross-validation accuracy of the RF, BPNN, and CatBoost models. The black solid line in the figure represents the 1:1 reference line, and the red solid line represents the regression line.
Remotesensing 17 02609 g005
Figure 6. Retrieval accuracy of estimated PM2.5 in study area based on sample. The black solid line in the figure represents the 1:1 reference line, and the red solid line represents the regression line.
Remotesensing 17 02609 g006
Figure 7. Temporal and spatial distribution of satellite-retrieved PM2.5 concentrations in the central city of Beijing.
Remotesensing 17 02609 g007
Figure 8. Spatiotemporal distribution of satellite-retrieved PM2.5 concentrations in the central urban areas of Wuhan.
Remotesensing 17 02609 g008
Figure 9. Spatial distribution of AOD and PM2.5 in central urban areas. (a) Landsat-8 natural true-color image on 4 March 2017 for Beijing, (b) Landsat-8 OLI AOD product, (d) Sentinel-2 natural true-color image on 26 November 2018 for Wuhan, (e) Sentinel-2 MSI AOD product, (c,f) model-retrieved and ground measurement PM2.5.
Remotesensing 17 02609 g009
Figure 10. Spatiotemporal distribution of AOD and PM2.5 around China Baowu Steel Group on 27 October 2017 and 5 November 2019. (a) Sentinel-2 natural true-color image. (e) Landsat-8 natural true-color image. (b,f) Sentinel-2 MSI and Landsat-8 OLI AOD products. (c,g) Model-retrieved PM2.5 and forward trajectory. (d,h) Ground measurement PM2.5 and PM10.
Remotesensing 17 02609 g010
Table 1. Detailed information on the variables in the PM2.5-AOD modeling datasets. (“ - “ means unitless).
ClassNameAbbrSourceSpatial ResolutionUnit
Ground MeasurementsFine Particulate matterPM2.5CNEMCPointug/m3
LongitudeLATCNEMCPointdegree
LatitudeLONCNEMCPointdegree
Satellite ObservationsAerosol Optical DepthAODL8-AOD, S2-AOD30 m- N/A
Normalized Vegetation IndexNDVILandsat-8, Sentinel-230 m-
Digital Elevation ModelDEMSRTM90 mm
Land Use CoverLUCCGLC_FCS30-202030 m-
Meteorological Data2 m TemperatureTEMERA-50.25°K
Surface PressureSPERA-50.25°hPa
10 m Eastward Wind Speed10UWERA-50.25°m/s
10 m Northward Wind Speed10VWERA-50.25°m/s
Planetary Boundary Layer HeightPBLHERA-50.25°m
Relative HumidityRHERA-50.25°%
Total Ozone ConcentrationTO3ERA-50.25°g/m2
Table 2. Matrix of Pearson correlation coefficients (R-value, upper triangle) and probability values (p-value, lower triangle) among variables in PM2.5-AOD modeling dataset. “/” represents p-value < 0.001.
PM2.5LATLONAODNDVIDEMLUCCTEMSP10 UW10 VWPBLHRHTO3
PM2.51.00−0.11−0.010.42−0.18−0.120.09−0.150.13−0.090.10−0.280.23−0.06
LAT/1.000.46−0.03−0.30−0.020.12−0.250.020.230.020.14−0.420.60
LON0.06/1.000.16−0.05−0.710.100.030.720.030.01−0.100.040.37
AOD///1.00−0.05−0.280.130.160.29−0.170.12−0.120.34−0.03
NDVI////1.00−0.04−0.420.500.01−0.130.06−0.030.31−0.40
DEM/////1.00−0.20−0.24−0.980.140.030.17−0.17−0.16
LUCC//////1.000.040.190.020.010.02−0.050.12
TEM///////1.000.16−0.140.200.180.20−0.28
SP////0.25///1.00−0.14−0.06−0.200.170.16
10UW/////////1.000.080.28−0.300.29
10VW//0.04///0.20///1.00−0.260.20−0.03
PBLH///////////1.00−0.520.24
RH////////////1.00−0.47
TO3/////////////1.00
Disclaimer/Publisher’s Note: The statements, opinions and data contained in all publications are solely those of the individual author(s) and contributor(s) and not of MDPI and/or the editor(s). MDPI and/or the editor(s) disclaim responsibility for any injury to people or property resulting from any ideas, methods, instructions or products referred to in the content.

