Article

A Novel Framework for Assessing Urban Green Space Equity Integrating Accessibility and Diversity: A Shenzhen Case Study

1
Research Institute for Smart Cities, School of Architecture and Urban Planning, Shenzhen University, Shenzhen 518060, China
2
Guangdong-Hong Kong-Macau Joint Laboratory for Smart Cities, Shenzhen 518060, China
3
State Key Laboratory of Subtropical Building and Urban Science, Shenzhen 518060, China
*
Author to whom correspondence should be addressed.
Remote Sens. 2025, 17(15), 2551; https://doi.org/10.3390/rs17152551
Submission received: 19 June 2025 / Revised: 19 July 2025 / Accepted: 20 July 2025 / Published: 23 July 2025

Abstract

Urban green spaces (UGS) are essential for residents’ well-being, environmental quality, and social cohesion. However, previous studies have typically employed undifferentiated analytical frameworks, overlooking UGS types and failing to adequately measure the structural disparities of different UGS types within residents’ walking distance. To address this, this study integrates Gaussian Two-Step Floating Catchment Area models, Simpson’s index, and the Gini coefficient to construct an accessibility–diversity–equality assessment framework for UGS. This study conducted an analysis of accessibility, diversity, and equity for various types of UGSs under pedestrian conditions, using the high-density city of Shenzhen, China as a case study. Results reveal high inequality in accessibility to most UGS types within 15 min to 30 min walking range, except residential green spaces, which show moderate-high inequality (Gini coefficient: 0.4–0.6). Encouragingly, UGS diversity performs well, with over 80% of residents able to access three or more UGS types within walking distance. These findings highlight the heterogeneous UGS supply and provide actionable insights for optimizing green space allocation to support healthy urban development.

1. Introduction

Urban green spaces (UGS), such as urban parks, forests, street greenery, and residential green areas, function as essential components of urban ecological infrastructure. They offer a range of ecological benefits, including mitigating the urban heat island effect, purifying air, reducing noise pollution, and regulating urban flooding [1,2]. UGS also can encourage outdoor activities, social interactions, and contribute to both physical and mental well-being. Even non-recreational or visual contact, such as viewing greenery from a residence, has been shown to significantly reduce anxiety and stress levels [3,4,5]. In recognition of its multifaceted value, the United Nations’ 2030 Agenda for Sustainable Development has designated the provision of “safe, inclusive, and accessible green public spaces” as a key development goal [6].
Whether the multifaceted ecological, social, and health benefits embedded within UGSs can be effectively accessed and equitably shared by residents necessitates systematic assessment. The spatial accessibility evaluation measures whether residents can reach sufficient UGS within a practical travel threshold [7]. The diversity assessment of accessible UGS types examines whether green spaces meet the varied needs of residents for recreation, social interaction, exercise, and ecological experiences, directly influencing usage frequency and satisfaction [8]. The equity assessment, meanwhile, focuses on whether different demographic groups have relatively equal opportunities to access high-quality green resources [9].
Accurate UGS spatial data is fundamental to these assessments. Early UGS mapping relied heavily on field surveys and aerial photography, but prohibitive costs limited large-scale application [10,11]. The advent of remote sensing revolutionized UGS evaluation. Satellite platforms (e.g., Landsat, Sentinel) utilizing optical, SAR, and LiDAR sensors now provide continuous, rapidly revisiting imagery with broad spectral coverage at resolutions from kilometers to sub-meters. Vegetation exhibits distinct spectral signatures within these imageries, enabling crucial UGS identification in complex urban settings [12]. Critically, NASA and ESA’s open data policies have unlocked over 50 years of Earth observation data [13], enabling large-scale, rapid, and long-term UGS studies. This establishes the essential data foundation for in-depth evaluations of UGS accessibility, diversity, and equity.
UGS accessibility specifically refers to the amount of green space residents can practically use within a defined travel cost [8]. UGS accessibility measurement approaches generally fall into three categories: supply-based, distance-based methods, and supply–demand interaction-based [7,14]. Supply-based methods employ buffers or network service areas to calculate the cumulative UGS area accessible within a specific travel distance or time from residences [15]. They offer intuitive insights into UGS provision and travel distance but often overlook demand heterogeneity. Distance-based methods calculate the minimum distance (Euclidean, cost-weighted, or network distance) from origins to destinations [16]. These methods effectively capture travel impedance but typically underrepresent the match between UGS attractiveness and resident demand. Supply–demand interaction-based methods quantify the relationship between UGS supply and resident demand within a catchment area, often conceptualized as UGS per capita. Classic techniques include gravity models and the two-step floating catchment area (2SFCA) method [14]. The 2SFCA method integrates UGS supply capacity and resident demand, incorporating distance decay functions to reflect the preference of residents for nearby UGS [17]. Consequently, this study adopts the 2SFCA method for accessibility assessment.
UGS access equity, integral to social justice and environmental equity, is receiving increasing attention [18,19,20]. Researchers have developed accessibility–equity evaluation frameworks combining accessibility metrics and equity methodologies to quantify disparities in green space access among different age groups, socioeconomic statuses, and ethnicities [9,18,21]. Substantial empirical evidence consistently reveals significant inequities in UGS distribution among urban populations, hindering the fair distribution of green space benefits [9,22,23]. In response, researchers and policymakers advocate for equitable access standards. For instance, the UK’s Accessible Natural Greenspace Standard (ANGSt) stipulates that no resident should live more than 300 m (Euclidean distance) from accessible UGS [24]. The WHO recommends that urban residents should have access to at least 0.5–1 hectare of UGS within a 300 m straight-line distance (approximately a 5 min walk) from home [25]. These standards provide vital benchmarks for evaluating equity.
However, focusing solely on accessibility equity may be insufficient, as different UGS types offer markedly distinct services and experiences [26,27]. Most current research concentrates on urban parks explicitly designated for recreation [28,29,30]. Yet, other green spaces not primarily designated for leisure—such as street greenery, residential greenspace, and urban agriculture—also significantly benefit residents’ physical and mental well-being [3,31,32] and provide unique recreational opportunities [26,27]. For example: urban forests facilitate hiking, nature exploration, and physical exercise [33]; urban agriculture offers expansive agricultural landscapes and psychological respite from urban stress [34], also serving as a leisure environment for walking and cycling in some areas [35]; community gardens provide daily green activity spaces and enhance social cohesion [36]; street greenery is crucial for promoting walkability [37]. This functional diversity helps meet residents’ varied daily needs for UGSs [8,38,39].
Despite growing recognition of UGS diversity’s importance and calls for type-specific strategies, implementation remains largely confined to urban planning and policy advocacy [39]. Many UGS accessibility and equity assessments still focus on single UGS types or treat all UGS as homogeneous [9,20,22,23], lacking quantitative research on the equity of diverse UGS access. This oversimplification may obscure structural green deprivation. For instance, if disadvantaged groups only have access to limited UGS types (e.g., street trees) while lacking recreational parks or community gardens, their diverse ecological and social needs may remain unmet—even if quantitative accessibility targets are met—leading to a form of “green deprivation.” Therefore, integrating typological diversity into accessibility and equity assessment frameworks is essential to comprehensively understanding and addressing social equity in UGS resource distribution.
This study proposes an accessibility–diversity–equity assessment framework for UGS to measure the equity of diverse UGS provision within walking distance. Specifically, it addresses three key questions: (1) Do significant spatial disparities exist in the accessibility of different UGS types within defined travel thresholds? (2) What are the dominant UGS types within walking distance, and what are their spatial distribution patterns? (3) Do residents have access to diverse UGSs within walking distance, and is this diversity equitably distributed?

2. Study Area and Data
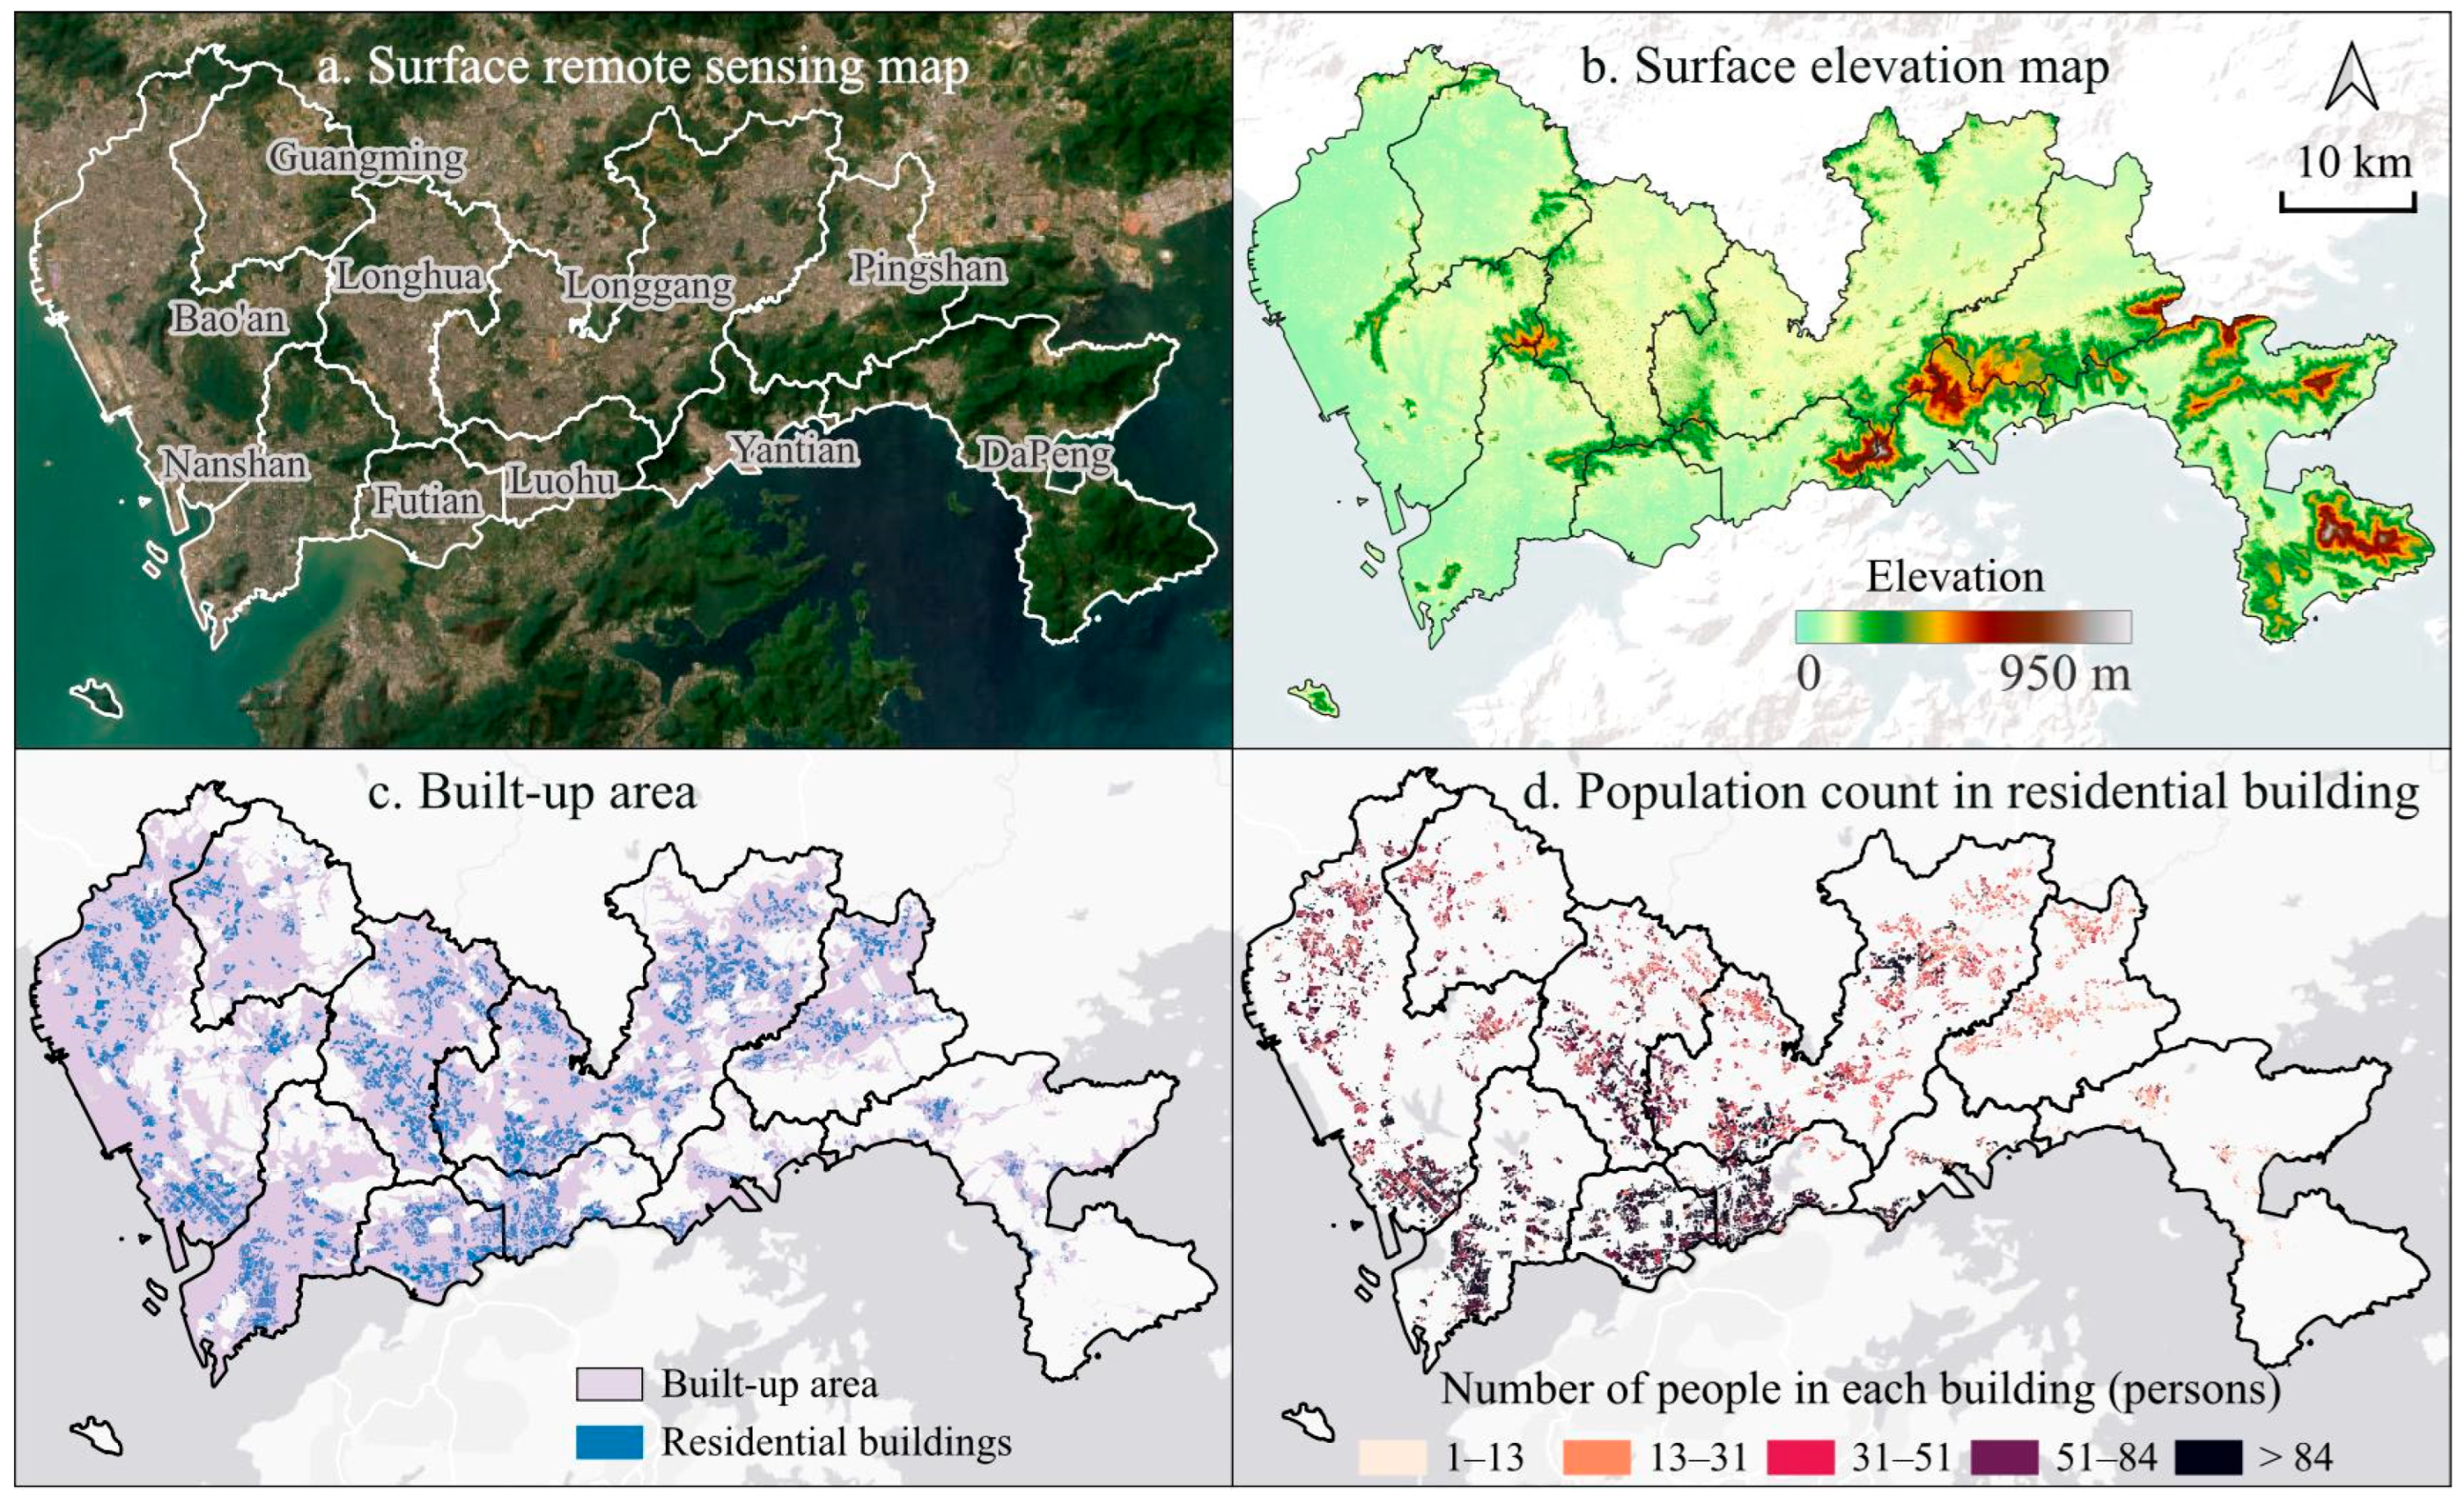
2.1. Study Area

Shenzhen is located on the southeastern coast of China and is one of the first cities designated as a Special Economic Zone. It experiences a humid subtropical climate characterized by warm, humid summers and mild, relatively dry winters. According to data from Shenzhen Meteorological Bureau, Annual averaging precipitation around 1900 mm, with annually averaging temperatures 23.3 °C. As of the end of 2023, the city covers a total area of 1997 square kilometers, with a built-up area exceeding 955 square kilometers. It has a permanent population of approximately 17 million, making it one of the most densely populated cities in China, with an average population density of 18,374 people per km2 in built-up areas. As shown in Figure 1, Shenzhen is administratively divided into 10 district-level units. According to the Master Plan for Building a Park City in Shenzhen and the Three-Year Action Plan (2022–2024), while the green coverage rate in the built-up areas has reached 40.9%, the spatial distribution of green spaces remains uneven. Moreover, the proportion of park green spaces relative to the total green area in built-up zones is relatively low. A substantial share of other types of UGS (e.g., residential, street green spaces) exists, offering alternative green space resources for residents’ use.

2.2. Data Sources

This study utilized Gaofen-1 satellite imagery to extract UGSs, employed urban land-use data to classify UGSs, and leveraged OpenStreetMap (OSM) road network data for accessibility analysis. Additionally, residential building data and population data within these buildings were applied to identify UGS demand locations and quantify demand levels.

2.3. Extraction of Urban Green Spaces

The urban blue-green space data were generated from digital orthophoto maps (DOM) and semantic segmentation models. The DOM used in this study were derived from multispectral data acquired by the Gaofen-1 satellite, available through the Natural Resources Satellite Remote Sensing Cloud Service Platform (Table 1). The satellite provides four multispectral bands—blue, green, red, and near-infrared—with a panchromatic band spatial resolution of 2 m and a multispectral bands resolution of 8 m. The temporal resolution is 3–5 days for the same area.
A total of 10 cloud-free images covering the entire study area were obtained. Of these, three images were acquired on 12 April 2020, four images on 28 April 2020, one image on 9 October 2020, and two on 5 February 2021. These images are ultimately fused with panchromatic and multispectral bands to generate 2-meter resolution data.
Using manually labeled UGS training samples within the study area, UGS vector data were extracted by applying the FarSeg semantic segmentation model—a remote sensing model pretrained and released via the TorchGeo library (https://torchgeo.readthedocs.io, accessed on 19 July 2025).

2.4. Road Network Data

Road network data, including public roads and community roads, were collected from OSM historical records for the year 2019. According to Fan et al. [40], OSM road data achieves over 96% accuracy in major Chinese cities. This data was used for pedestrian accessibility analysis. Prior to the analysis, we retained only roads that allow pedestrian access. Based on OSM road labels, infrastructure such as highways and expressway, which are exclusively for vehicles, was excluded. On this basis, the data underwent topological checks and adjustments to ensure consistency.

2.5. Residential Buildings with Population
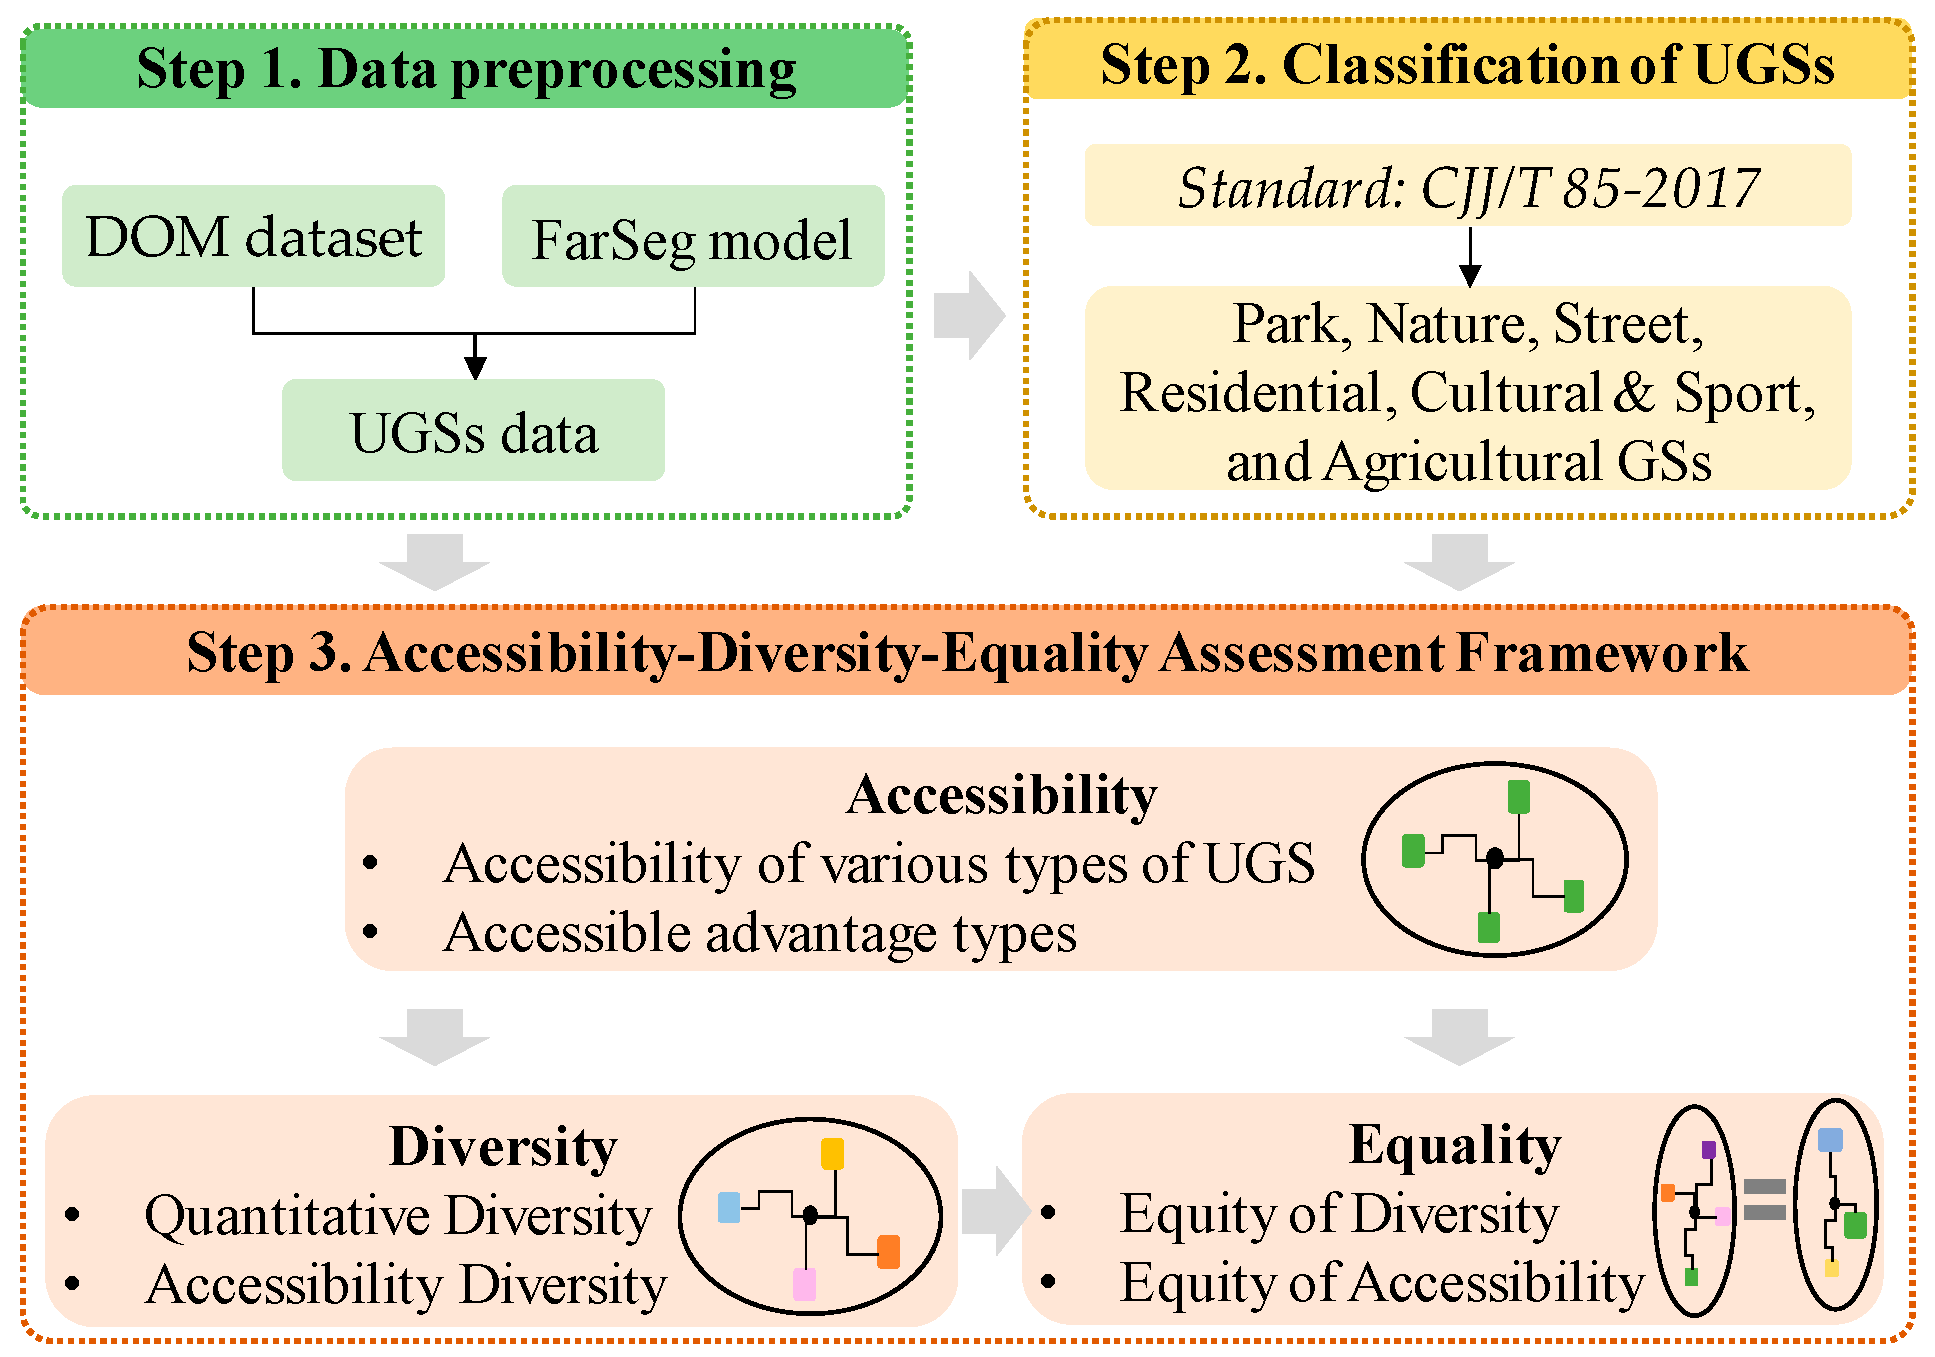
Data on building (representing trip origins for UGS access) footprints, area, and height were sourced from Amap, a leading internet map service provider in China. To address data gaps, supplementary datasets were incorporated, including building rooftop data and the CNBH-10m dataset.
UGS demand was proxied by the resident population per building, estimated using a random forest model developed by Shang et al. [41]. This high-accuracy method integrates mobile signaling data, land-use patterns, detailed building attributes, and point-of-interest (POI) data. When applied to Shenzhen, it yielded 2019 residential population estimates at the building level.

3. Methodology

To assess equity in diverse UGS provision within walking distance, this study developed an accessibility–diversity–equity assessment framework for UGS. The framework comprises three key steps (Figure 2): the first step involves data preprocessing, using a pre-trained semantic segmentation model to extract UGSs information from remote sensing imageries. The second step categorizes UGSs into six functional types—parks, natural areas, streets, residential, cultural and sports facilities, and agricultural green spaces. The third step is the detailed accessibility–diversity–equity assessment framework. Specifically, it calculates the accessibility of various UGS types within residents’ walking range and identifies the dominant UGS type through the 2SFCA method and pedestrian road network analysis. Next, it quantifies UGS diversity using type counts and the Simpson’s diversity index. Finally, it evaluates the equity of accessibility and diversity through Gini coefficient analysis.

3.1. Classification of Urban Green Spaces

UGS social typology refers to the classification of UGSs based on their functional attributes, target user groups, and spatial location, to support systematic planning and management. In China, the Standard for Classification of Urban Green Space (CJJ/T85-2017) [42] provides a unified framework, categorizing green spaces into four major types: park green space, square green space, accessory green space, and district green space.
To better capture the differences among UGS types, we merged and refined these categories, as summarized in Table 2. Firstly, since both parks and squares function as typical public urban spaces—and given the limited presence of squares—we combined them into a single category: park green space. Secondly, regional green spaces include both natural areas and agricultural land, which are typically under public and private ownership, respectively; thus, these were separated into distinct categories. Thirdly, accessory green spaces span a variety of land-uses, including residential, road, cultural, and sports facilities, administrative, medical, industrial, commercial, utility, research, and educational uses. The accessibility of UGSs in these categories varies, some are restricted to specific user groups, while others—like street greenery or cultural/sports facility greenery—are publicly accessible. These publicly accessible UGS were included in our analysis. We exclude UGSs restricted to internal users (e.g., administrative, industrial, educational) or scarce in quantity (e.g., commercial, utility, research, healthcare). Although some residential UGSs are formally restricted to residents, lax access controls often make them de facto public [43]. Furthermore, comparing their equity status with other publicly accessible UGSs helps examine the potential benefits of formally opening them. Therefore, these residentially zoned green spaces were also included within the scope of the analysis. The final classification comprises six UGS types (Table 2).
In the operational process, land-use maps of Shenzhen were employed to classify UGS.

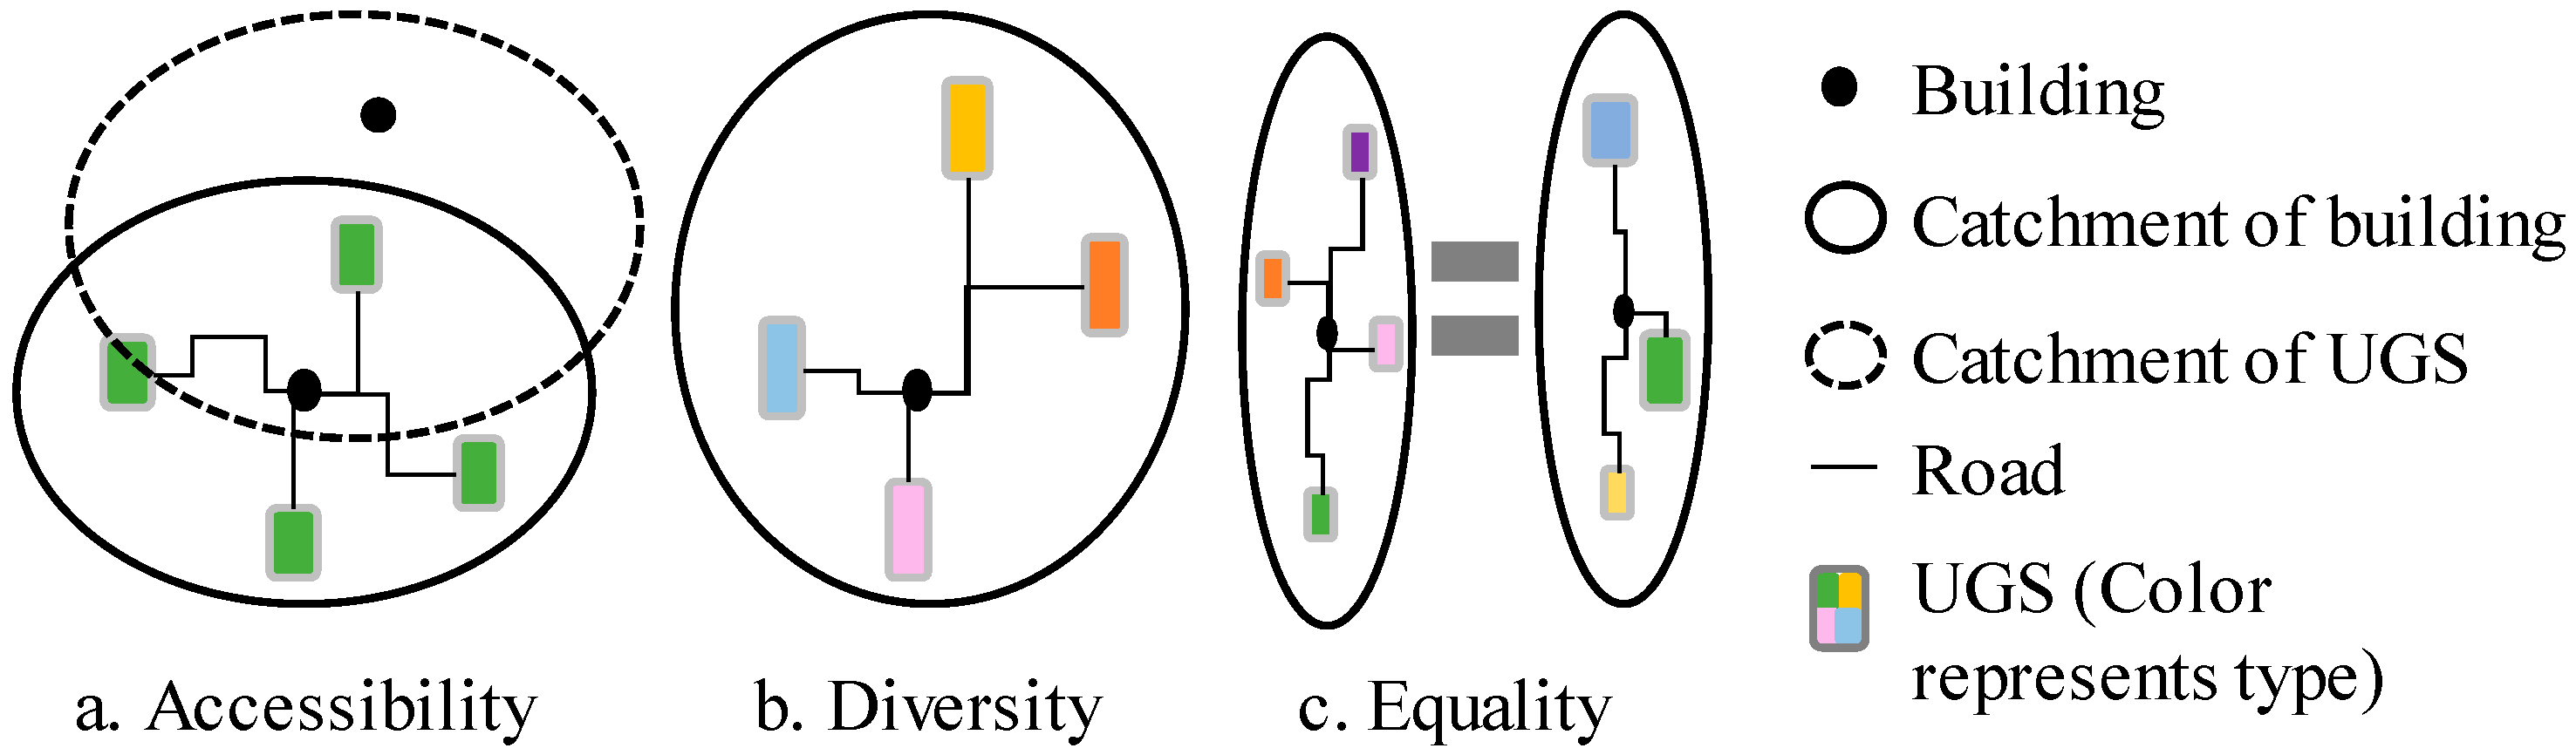
3.2. Accessibility Model

We employed the Gaussian 2SFCA method to measure the walking accessibility of UGSs. This model’s key advantage lies in its use of a Gaussian kernel function to establish a non-linear distance decay mechanism, effectively capturing residents’ preference for nearby green spaces [44].
As shown in Figure 3a, we used network analysis to calculate the accessibility (Ai) for residential building i:
A i = j = 1 m f t i j S j k = 1 n f t k j P k ,
where Ai represents the green space accessibility for building i and higher values indicate greater per capita green space availability. Sj denotes the area of green space j. m is the total number of green spaces within the walking catchment. Pk is the population of building k. n is the total number of buildings within the walking catchment.
f(tij) and f(tkj) are Gaussian distance decay functions calculated as:
f t i j = 0 , t i j > t 0 e 1 2 t i j t 0 2 e 1 2 1 e 1 2 , t i j t 0 ,
where tij represents the travel time from building i to green space j, and t0 denotes the maximum walking radius. Considering the variation in walking time for residents’ daily access to UGS, we selected the most commonly used walking radii of 15, 20, 25, and 30 min [45]. Meanwhile, the average walking speed in the study area was set at 85 m per minute [46].

3.3. Simpson’s Diversity Index

The Simpson’s Diversity Index is a classic metric in ecology used to assess species diversity. Its fundamental principle lies in calculating the probability that two individuals randomly selected from a dataset belong to the same species [47]. This index was chosen for the present study as it effectively captures the diversity (i.e., richness and evenness) of accessible UGS types, which is our primary interest here. In this study, we adopt the Simpson Diversity Index to measure the richness and evenness of UGS types accessible to residents within a defined walking range.
As shown in Figure 3b, the diversity (Di) for residential building i is calculated as:
D i = 1 l = 1 L A i , l 2 ,
where Di represents the Simpson Diversity Index for residential building i, with values ranging from 0 to 1. Higher values indicate greater diversity in accessible UGS types. Ai,l represents the accessibility of type l UGSs in building i, and L refers to the total number of UGS types considered.

3.4. Gini Coefficient

Originally developed to measure income inequality, the Gini coefficient quantifies equity by evaluating the area under the Lorenz curve. In recent years, it has also been applied to assess the equity of UGSs distribution [48]. We employ the Gini coefficient to quantitatively assess the equity of both individual UGS types and UGS diversity.
As shown in Figure 3c, the Gini coefficient (G) for all residential buildings is calculated as:
G = 1 i = 1 n Y i Y i 1 X i + X i 1 ,
where G denotes the Gini coefficient, which ranges from 0 (perfect equality) to 1 (perfect inequality). Yi represents the cumulative percentage of population represented by the first i residential buildings when arranged in ascending order of UGSs accessibility. Xi represents the proportion of cumulative accessible UGSs accessibility/diversity corresponding to these first i buildings.

4. Results

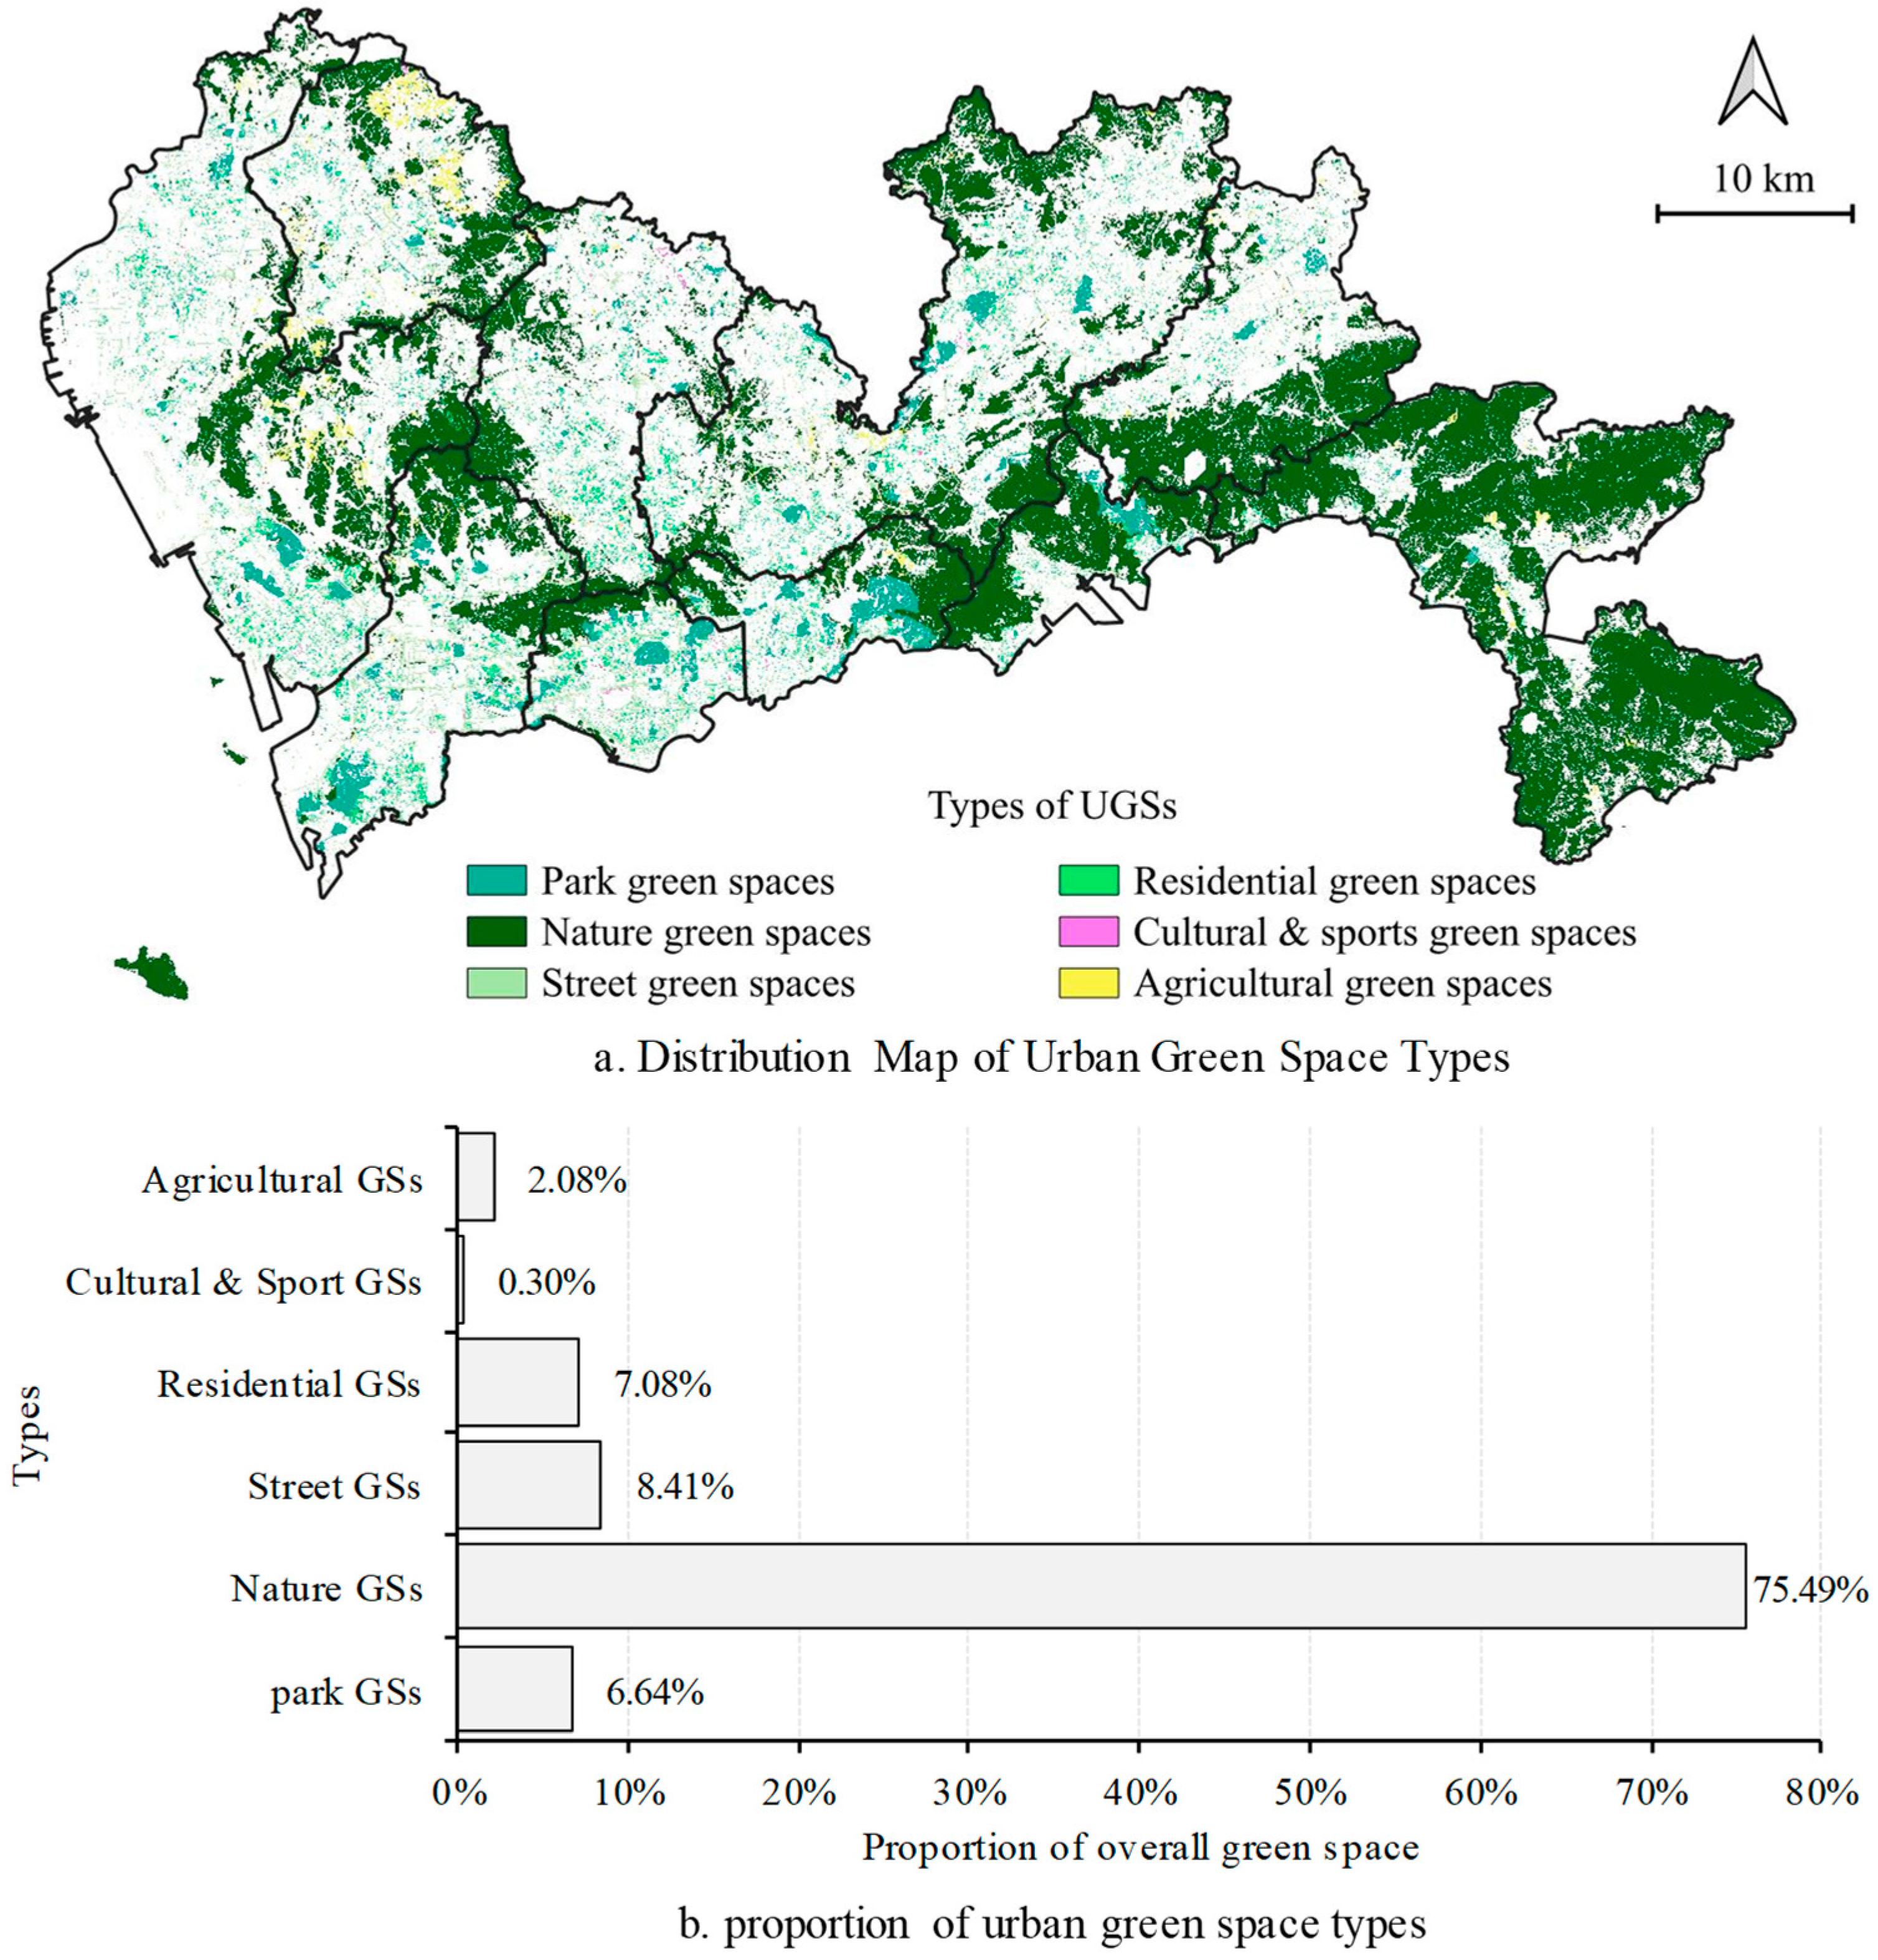
4.1. Composition and Distribution of Urban Green Spaces

The pre-trained FarSeg semantic segmentation model was transferred to our task. After training with a limited sample dataset, it achieved 93.3% accuracy in extracting UGSs in Shenzhen. Subsequently, the extracted UGS were categorized using Shenzhen’s land-use map.
As shown in Figure 4, Shenzhen exhibits a distinctive nature-dominated green space pattern, with natural green spaces accounting for 75.49% of the total, forming the core framework of the urban ecosystem. This characteristic primarily stems from the city’s unique mountainous and coastal topography. Extensive forest coverage across natural landforms such as Wutong Mountain and Qiniang Mountain, as well as within the Dapeng Peninsula Ecological Reserve, provides crucial ecological barriers and carbon sink functions for the city. Notably, despite Shenzhen’s urbanization rate reaching 100%, agricultural green spaces still occupy 2.08% of the urban area. These agricultural green spaces are mainly distributed in peripheral districts such as Guangming and Pingshan. The proportion of functional green spaces directly serving residents’ daily lives remains relatively low. Park green spaces within built-up areas (excluding country parks) account for merely 6.64%, highlighting a shortage of public recreational spaces in high-density urban zones and revealing an uneven spatial distribution. However, specialized functional green spaces demonstrate higher proportions, including street green spaces (8.41%) and residential green spaces (7.08%). These play a positive role in meeting citizens’ diverse demands for green spaces.

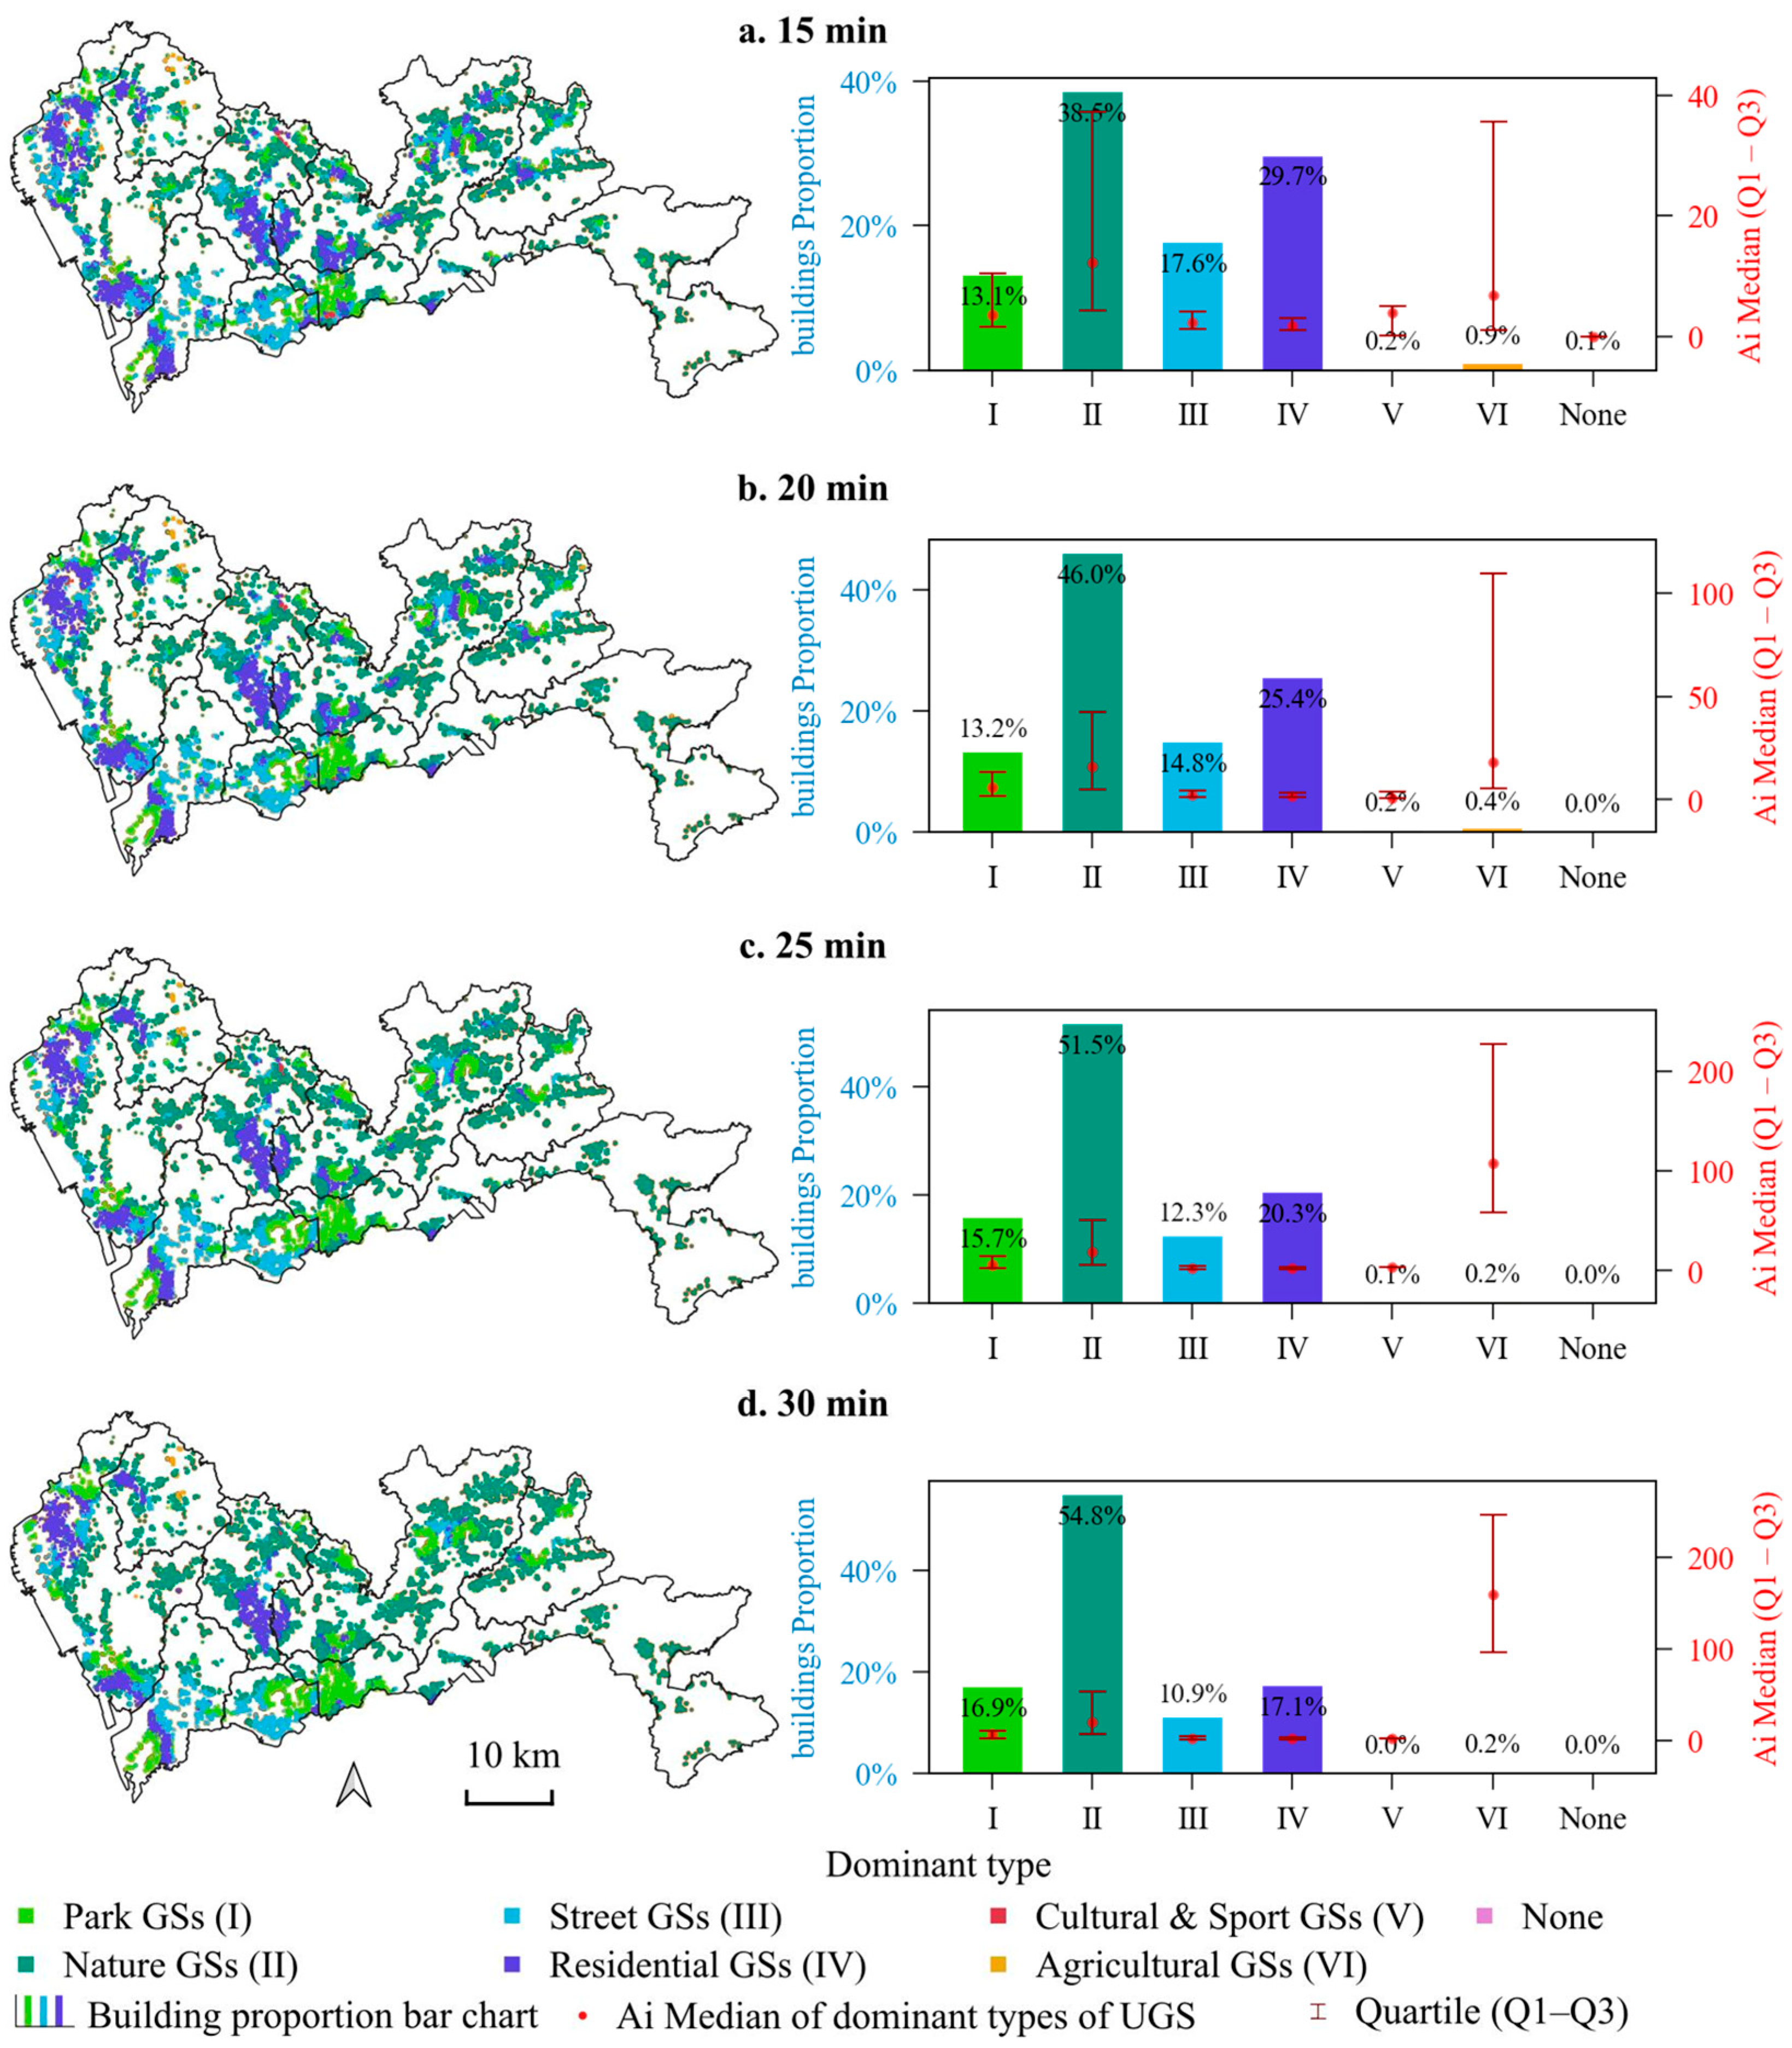
4.2. Accessibility of Different Urban Greeen Spaces

The accessibility analysis results, illustrated in Figure A1, reveal significant spatial disparities in the accessibility of different types of UGS across Shenzhen. Park green spaces exhibit a dual-belt spatial distribution pattern along the west–east axis. High-accessibility areas (with Ai ≥ 1.5) are concentrated in the northern parts of Bao’an–Longhua–Guangming–Pingshan districts and the southern parts of Nanshan–Futian–Luohu districts, while other regions generally exhibit lower Ai values. This spatial pattern is closely related to historical urban development and policy investment. Nanshan, Futian, and Luohu, as the city’s core urban districts, benefited from earlier development and a well-established park system. Meanwhile, the northern areas of Bao’an, Longhua, Guangming, and Pingshan—recently developed districts with lower land costs and guided by the “park city” planning concept—have also seen a relatively advanced development of park infrastructure.
The accessibility of nature green spaces shows a distinct dependency on topography. The northern part of the city, characterized by low hills and mountainous terrain, hosts contiguous high-accessibility natural green spaces. A notable band of high accessibility runs along the edges of major mountain systems such as Wutong Mountain and Tanglang Mountain, forming a central corridor across the city. However, heavily developed zones such as the Nanshan Science Park, Bao’an Industrial Area, and Futian District face limited accessibility to natural green spaces, with values typically below 0.25, due to both topographical barriers and limited transport connectivity.
Street green spaces and residential green spaces exhibit relatively balanced spatial distribution. Although central urban areas show slightly higher accessibility compared to peripheral regions, most areas achieve an accessibility value above 0.5. This can largely be attributed to strict national regulations governing green coverage in residential developments, as well as strong policy support for the construction of tree-lined streets in Chinese cities.
In contrast, the accessibility of cultural and sports green spaces and agricultural green spaces remains generally low, with most areas registering values below 0.25. Higher accessibility is only observed in a few isolated zones. Large cultural and sports facilities (e.g., stadiums and museums) are typically located in new development areas or at designated urban nodes due to land consolidation needs, resulting in spatial misalignment with residential zones. Agricultural green spaces, pressured by urban expansion, have been relegated to remote districts such as Guangming. Their fragmented distribution further limits their integration into the daily activity spaces of urban residents.
We analyzed the dominant types of UGS—defined as the type with the highest accessibility within a given walking range—for residential buildings within 15 min and 30 min walking distances (Figure 5). The results indicate that, regardless of walking distance, natural green spaces consistently emerge as the most common dominant UGS type. Within a 15 min walking range, 38.5% of residential buildings had natural green space as the most accessible type. This proportion increased substantially to 54.8% within a 30 min walking range. These natural green-dominant areas are primarily located on the urban fringe in the northern and central parts of the built-up area. This pattern aligns with Shenzhen’s historical urban expansion, where ecologically sensitive zones—such as the Guanlan area and the Phoenix Mountain–Yangtai Mountain—were preserved due to development restrictions.
Residential green spaces ranked second in dominance but showed a declining trend as the walking range increased. Within a 15 min walking range, 29.7% of residential buildings were most accessible to residential green spaces, reflecting their widespread integration into high-density urban neighborhoods due to China’s stringent planning regulations mandating minimum green space allocations in residential developments. However, this proportion dropped significantly to 17.1% within a 30 min range, indicating that while residential green spaces serve as immediate and local amenities, their relative accessibility advantage diminishes when residents travel longer distances to reach larger or more specialized green space types like parks or natural areas. These residential green-dominant zones are mainly concentrated in the central built-up areas of the city, where compact urban form and high-rise residential complexes create localized clusters of embedded greenery, contrasting with peripheral areas where lower-density housing or natural landscapes alter the green space hierarchy.
Residential buildings with park green space or street green space as the dominant UGS type accounted for similar proportions, ranging from 10% to 18%. However, the trend for these two types diverged with increasing walking distance. The proportion of residential buildings with park green space as the dominant UGS type rose from 13.1% (15 min range) to 16.9% (30 min range), indicating that parks become more accessible relative to other green space types as walking distance increases. Conversely, the proportion of street green spaces decreased from 17.6% to 10.9%, indicating that as the walking range expands, their relative accessibility advantage gradually diminishes, while larger and more functionally comprehensive UGS types increasingly replace them as the dominant category in terms of spatial accessibility. This spatial substitution effect reveals hierarchical differences in service radii among different UGS types. As linear-distributed “capillary” green infrastructure, street green spaces primarily demonstrate accessibility advantages within short-distance ranges.
Although park green space and street green space dominate residential buildings in similar proportions, their spatial distributions show both overlaps and distinctions. Residential buildings with park green space as the dominant UGS type are mainly found in eastern Futian District, western Luohu District, and southern Nanshan District. In contrast, those dominated by street green spaces are primarily located in western Futian, central Nanshan, and southeastern Bao’an District.
The accessibility analysis of dominant types reveals that although natural green spaces and agricultural green spaces differ substantially in coverage area, both exhibit significantly higher median and quartile accessibility values compared to other UGS types. This advantage stems primarily from their large-scale and contiguous spatial distribution. Notably, while street green spaces and residential green spaces demonstrate relatively high coverage rates, their accessibility performance remains comparatively limited—a pattern attributable to their fragmented spatial configurations.

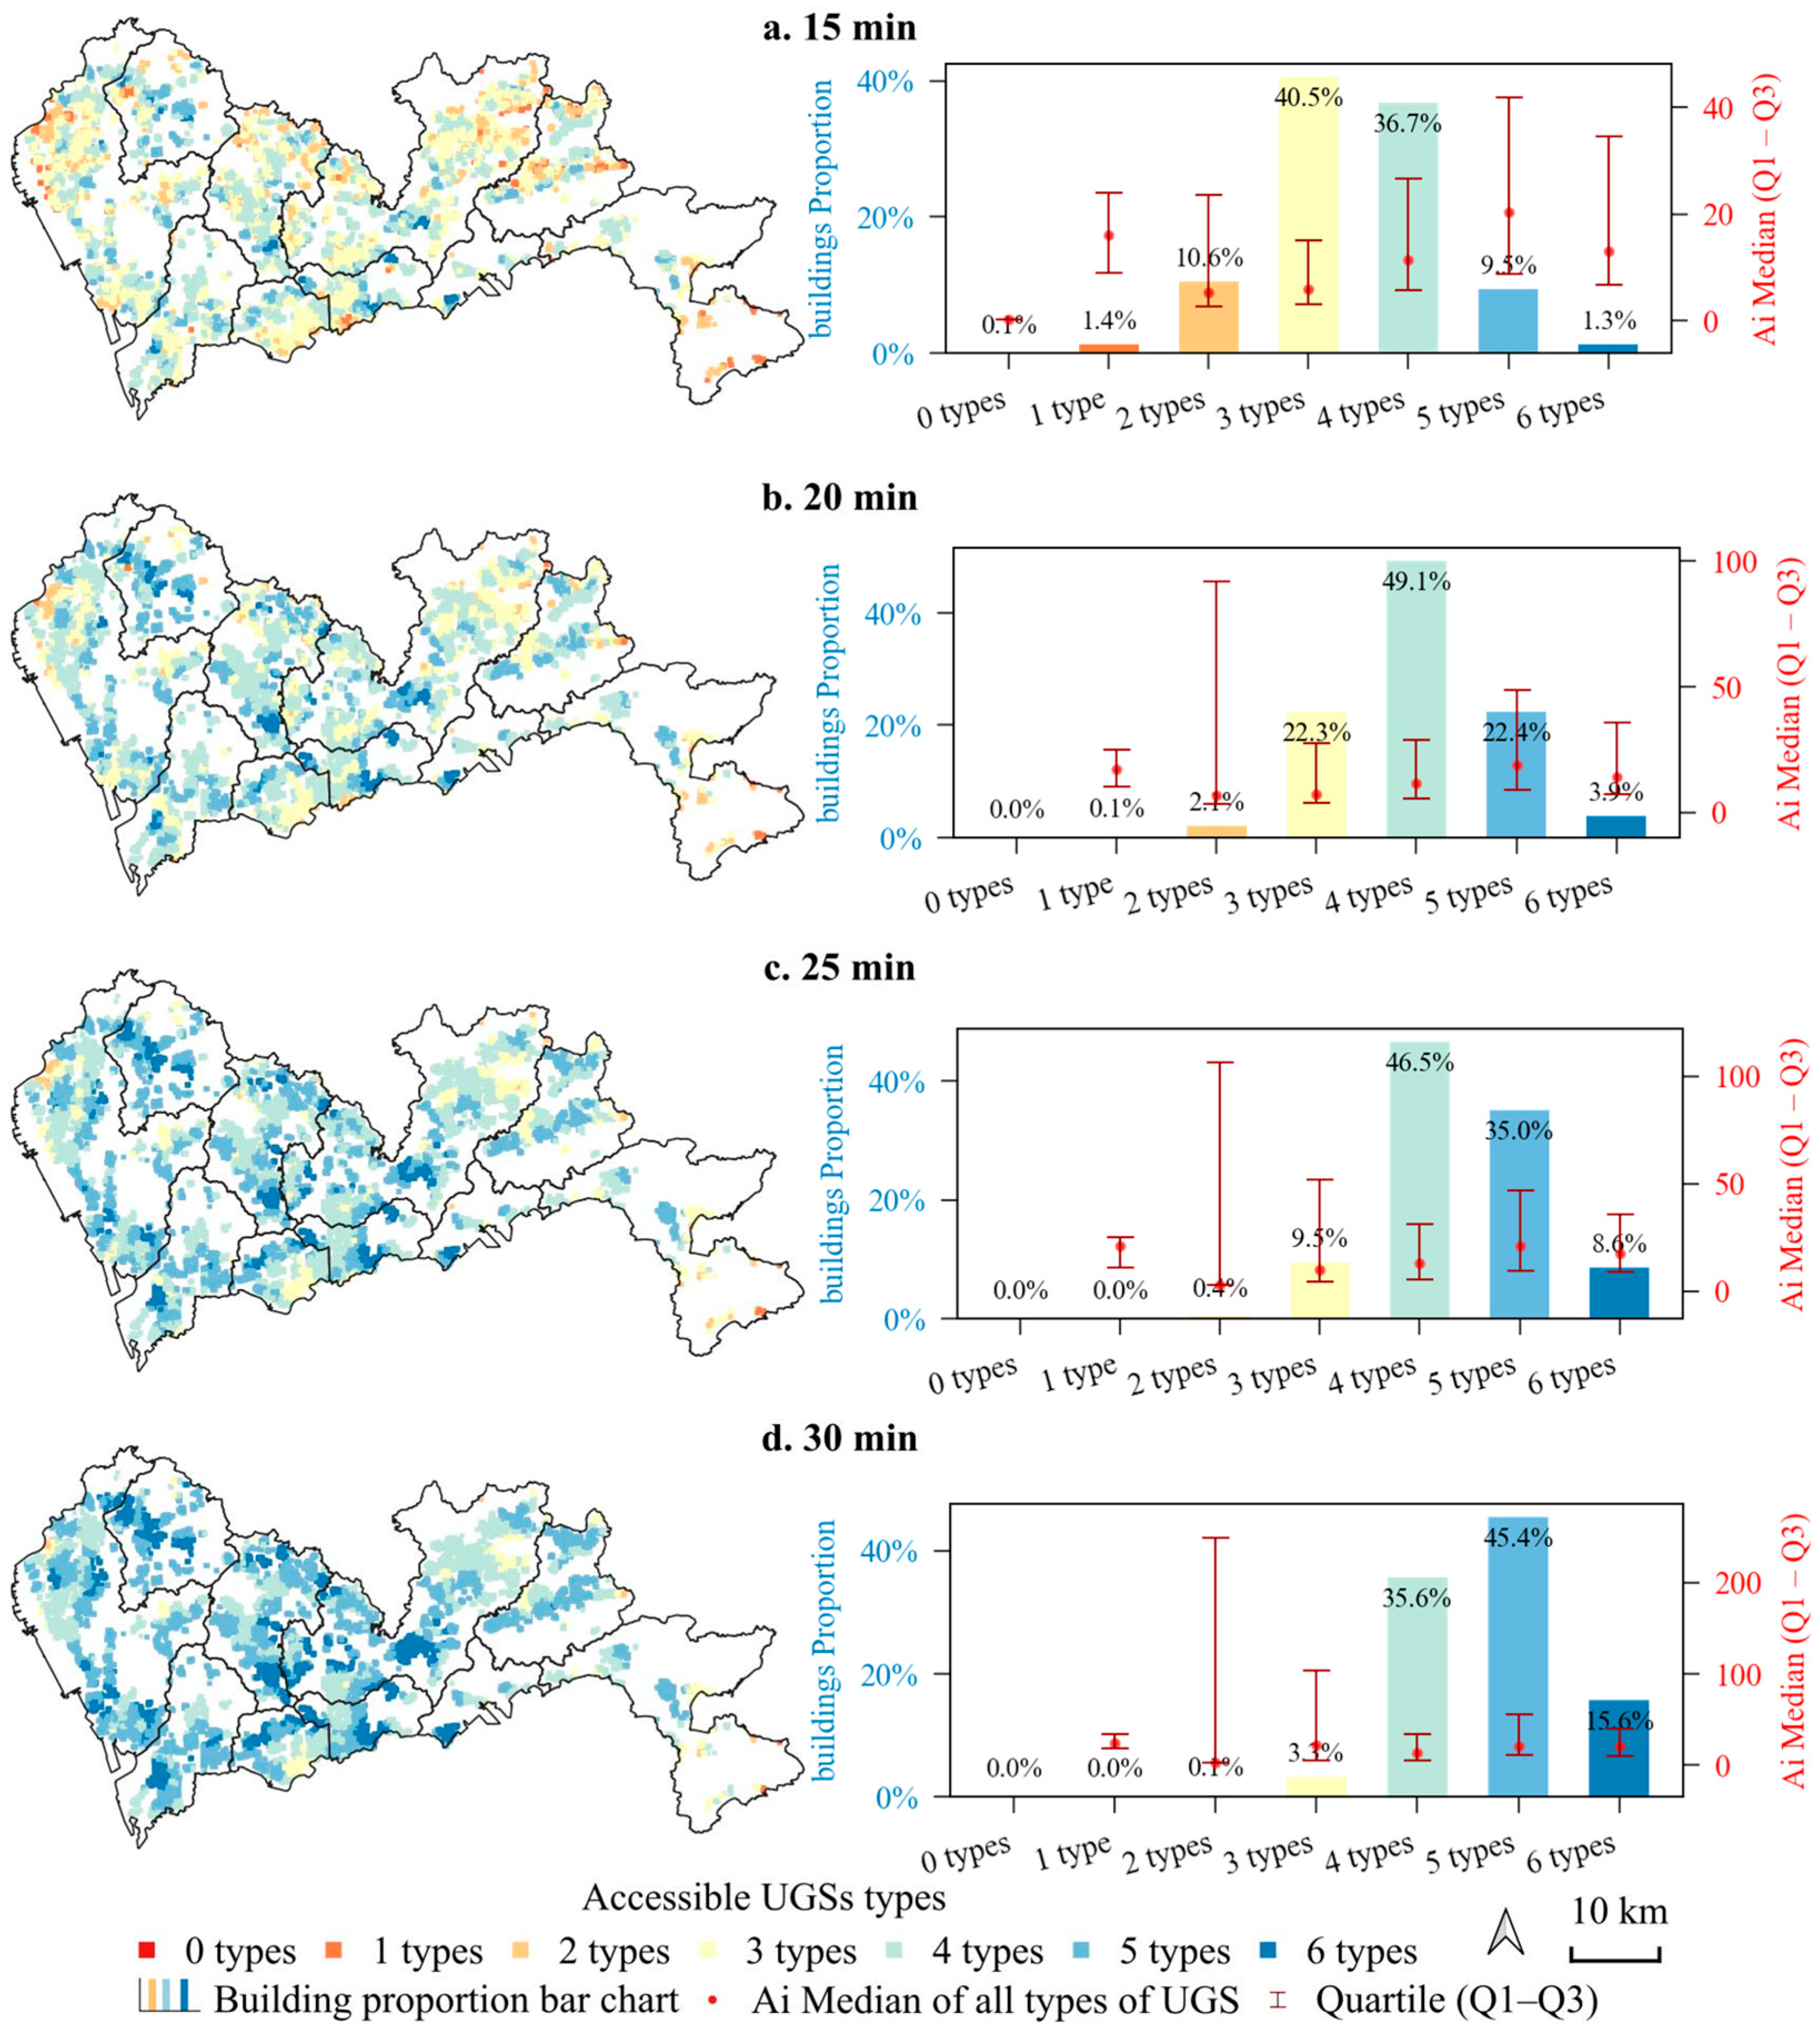
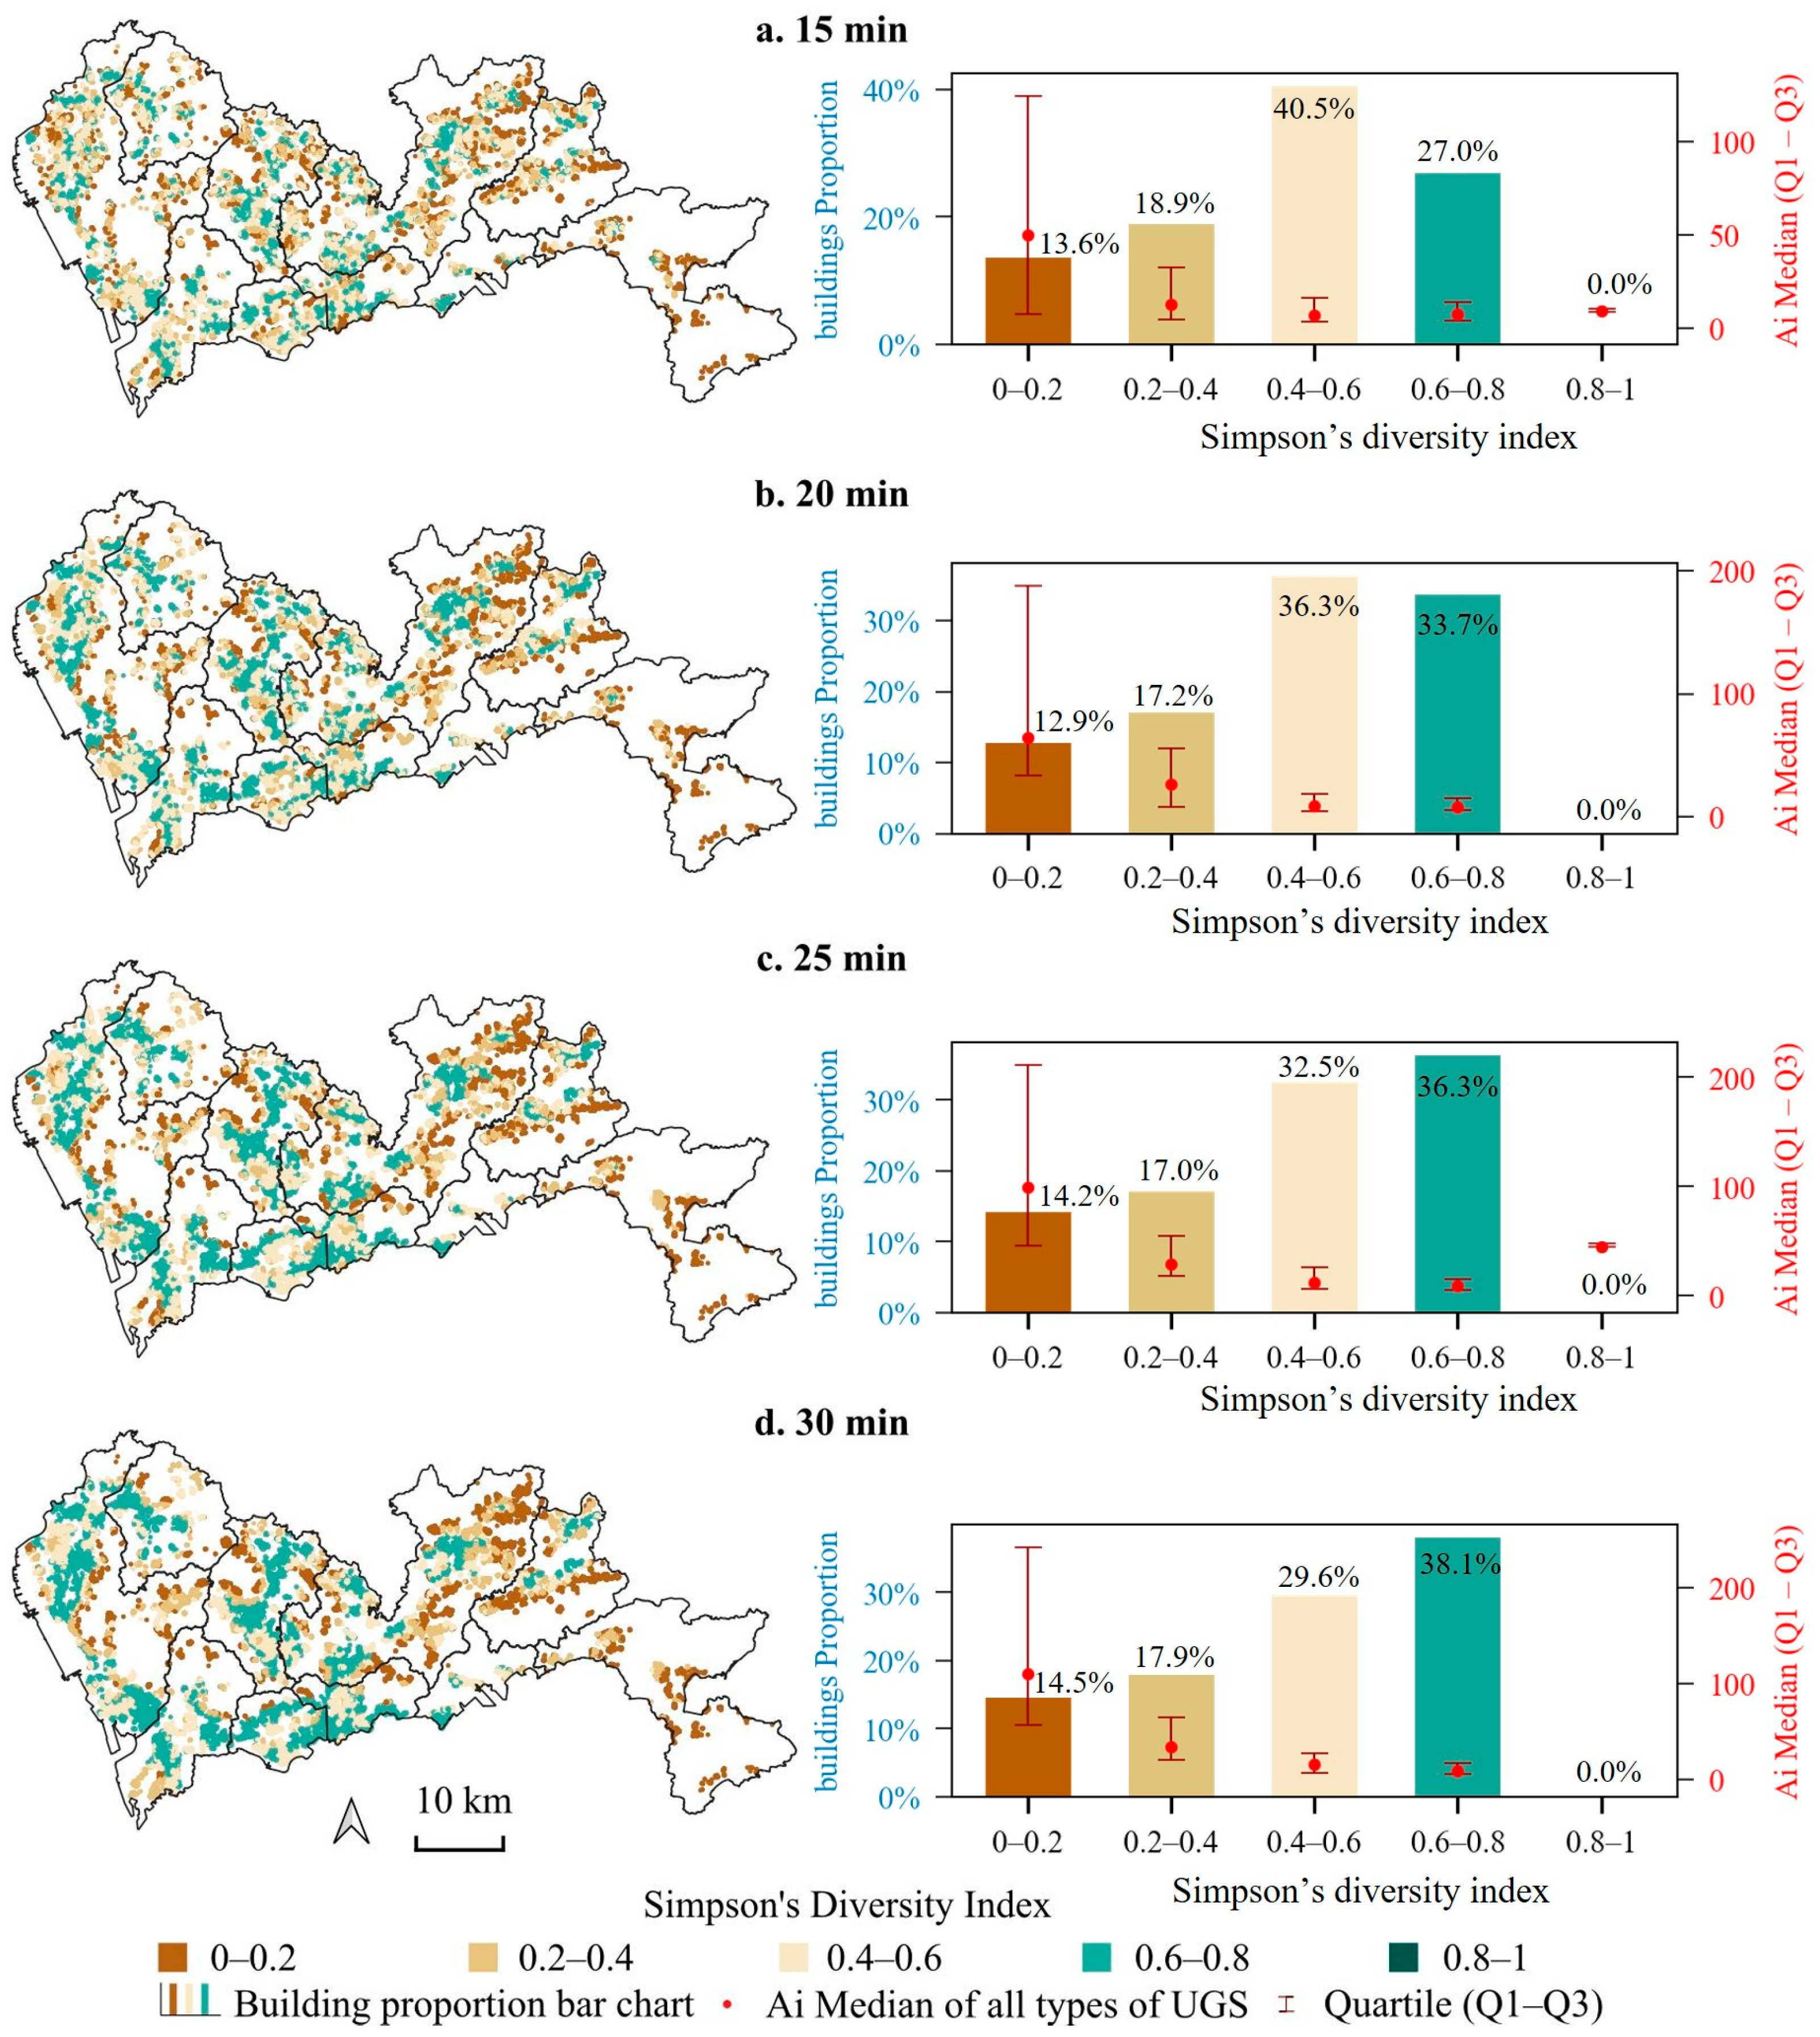
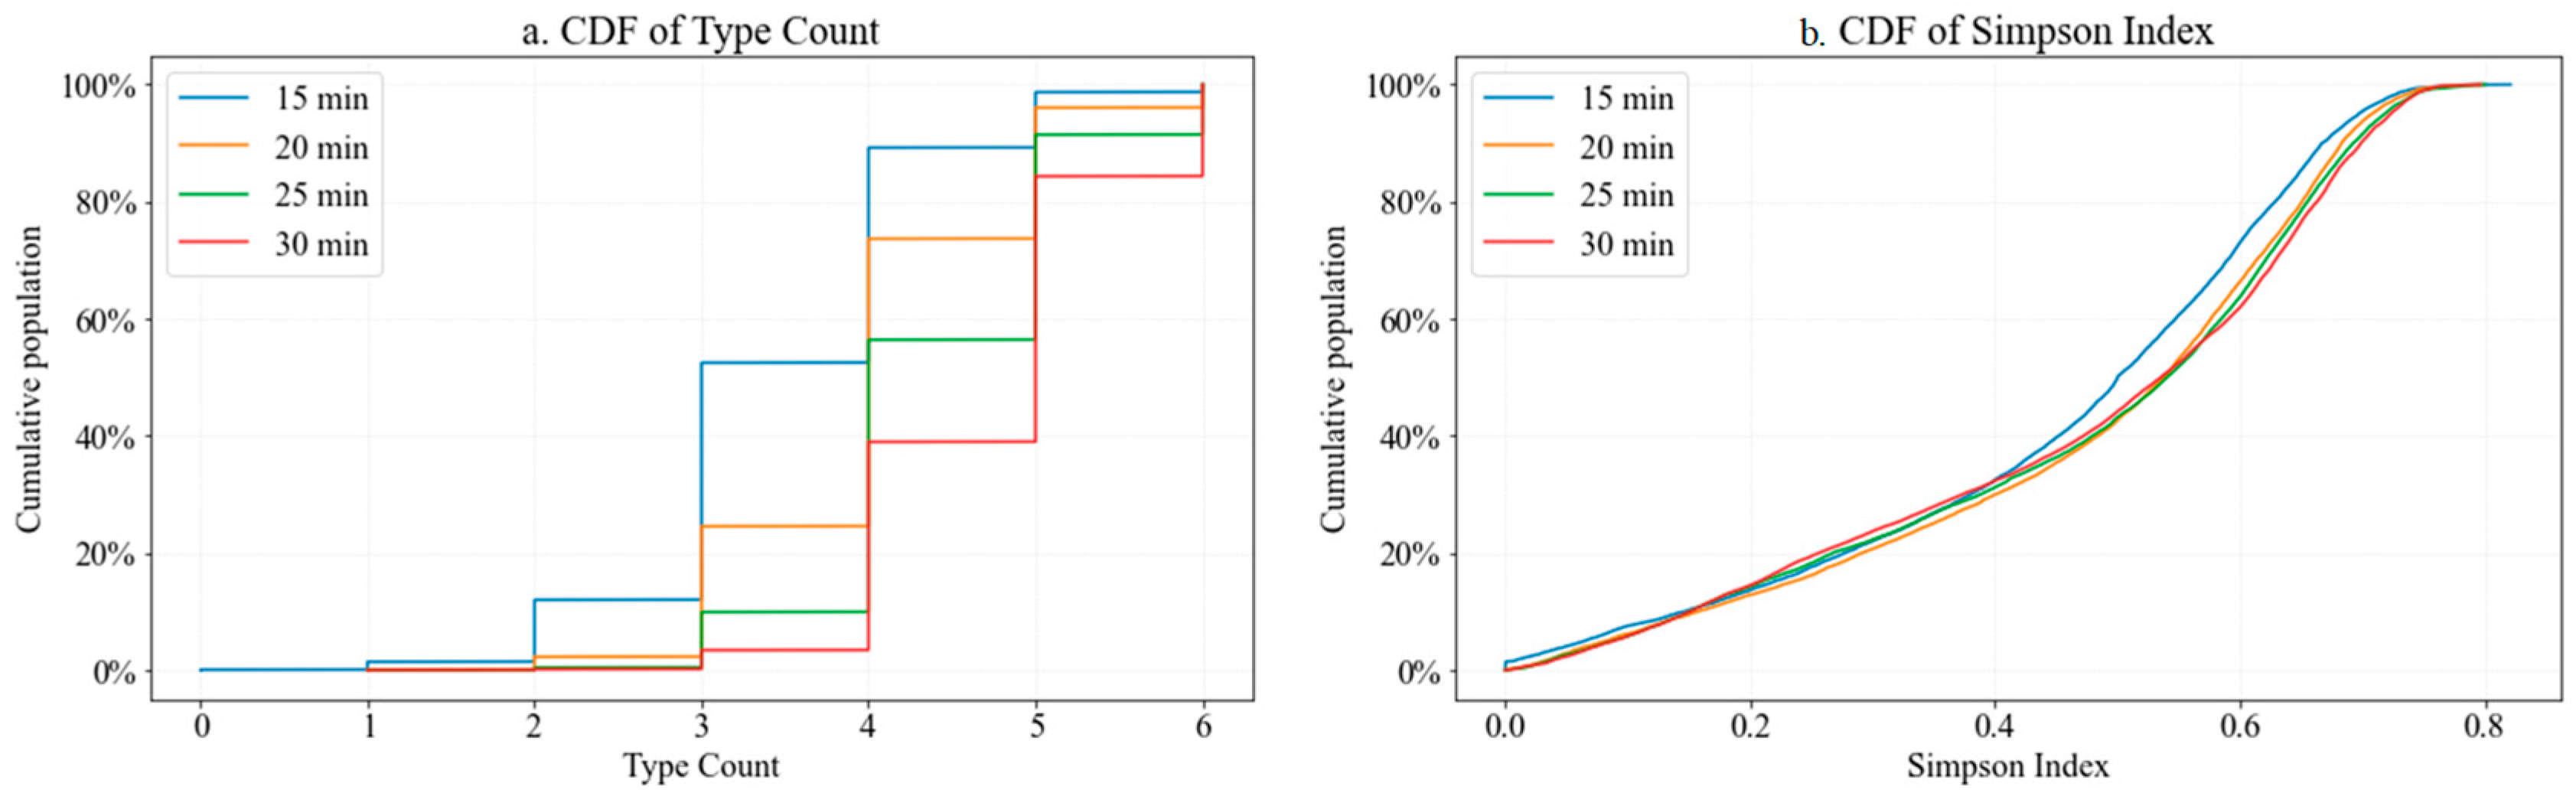
4.3. Diversity of Accessible Urban Green Spaces

As illustrated in Figure 6, we mapped the count of accessible UGS types for residential buildings within various walking ranges. The results indicate that most residential buildings have access to at least three types of UGSs, and the amount of accessible types increases with a longer walking range. Under a 15 min walking range, over 88% of residential buildings have access to three or more types of UGS, while only 1.5% have access to fewer than two types. Under a 30 min walking range, the proportion of residential buildings with access to three or more types of UGS increases to 99.9%, with 15.6% having access to as many as six types. These findings indicate that, without considering supply–demand dynamics, Shenzhen’s UGS diversity is relatively well-distributed. Additionally, while the distribution pattern varies, a consistent spatial trend is evident: areas near the centers of urban internal clusters tend to offer access to more diverse UGS types, whereas peripheral areas and inter-cluster zones offer fewer types. This pattern corresponds with Shenzhen’s natural geography, where peripheral areas and spaces between internal clusters often contain large mountains, lakes, and reservoirs, and where infrastructure development remains limited. In contrast, internal cluster centers—though lacking in natural green spaces—are more comprehensively developed in terms of building UGS such as residential, street, and cultural or sports green spaces.
Accessibility of UGSs (all types) grouped by number of accessible UGS types. As the number of accessible green space types increases, the median accessibility of UGS initially decreases and then rises. This is because areas with the most complete number of green space types are typically located in specific regions. However, whether accessibility improvements in these areas primarily rely on a single dominant large-scale green space type—rather than equitable per capita accessibility across all types—remains unverified. To address this, the following section conducts a diversity assessment based on per capita accessibility.
Although the diversity of quantity reflects the number of accessible UGS, it ignores the diversity of per capita usable UGS area. Figure 7 presents Simpson’s diversity index, which quantifies the diversity of UGSs within walking ranges based on accessibility. For analytical clarity, the index was divided into five categories using 0.2 intervals. The results demonstrate a relatively high level of UGS diversity within walking distances, again with more diverse access observed in the central areas of urban internal clusters and less diversity at the edges. Within a 15 min walking range, more than 67% of residential buildings had a Simpson’s diversity index greater than 0.4. These buildings are mainly concentrated in high-density urban cores, suggesting that even in areas with limited overall green space accessibility, diversity in available types remains relatively rich. As walking distance increases, the proportion of residential buildings with a Simpson Index between 0.4 and 0.6 decreases, while the proportion with an index between 0.6 and 0.8 increases. This indicates that expanding the walking range enables access to a more diverse set of UGS types.
The relationship between UGS diversity and accessibility based on per capita metrics reveals that as the diversity of accessible UGS increases, the median value of accessibility shows a declining trend. This pattern is inconsistent with the trend observed in quantity diversity but aligns with the spatial distribution characteristics of diversity. While quantity diversity reflects the supply capacity of green spaces, per capita diversity reveals service effectiveness. This indicates that the diversity dividend of UGS systems has not been effectively translated into actual service delivery.

4.4. Equity in the Provision of Diverse Urban Green Spaces

Table 3 presents the Gini coefficients for accessibility and diversity of various green space types within a 15 min to 30 min walking range. Overall, the Gini coefficients for accessibility decrease as walking time increases, indicating a reduction in inequality over longer walking distances. However, accessibility inequality remains high for most UGS types. In particular, agricultural green spaces and natural green spaces exhibit Gini coefficients close to 1, reflecting highly unequal spatial distributions. These types of UGS are accessible to only a small portion of the population, consistent with their peripheral and suburban locations.
Cultural and sports green spaces also demonstrate significant spatial inequality, with Gini coefficients ranging from 0.81 to 0.95. This is attributable to their limited presence in the urban landscape. Notably, park green spaces, typically considered the most important for recreation, also show high inequality, with Gini coefficients between 0.88 and 0.73 across different walking ranges. Even at 30 min, a Gini coefficient of 0.73 suggests that most residents still cannot easily reach parks on foot, highlighting a spatial mismatch between park distribution and residential density. This may result from the concentration of parks in select urban centers or waterfront areas, with inadequate coverage in suburban regions.
The Gini coefficients for residential and street green spaces range between 0.45 and 0.67, relatively lower than other types. These green spaces are more closely integrated with residential areas and have broader spatial coverage. While generally small and fragmented, they nonetheless serve as fundamental resources for everyday contact with nature. Despite their limited ecological or recreational capacity compared to parks, their widespread “infill” distribution better aligns with daily life patterns, underscoring the critical role of micro-scale green networks in promoting spatial equity. This suggests that high-density, small-scale, distributed layouts can effectively reduce disparities in access to urban green benefits.
By contrast, the Gini coefficient for access to all types of green spaces combined falls between 0.73 and 0.77, lower than that of parks alone. This indicates that relying solely on large parks cannot resolve spatial inequity in green space access. Instead, a diversified green space strategy—including natural, agricultural, residential, and street green spaces—can help fill service gaps and enhance overall spatial equity.
Encouragingly, the Gini coefficients for UGS diversity, whether measured by type count or Simpson Index, fall within a low range of 0.09 to 0.21—significantly lower than those for accessibility. This suggests that while there are substantial disparities in the area of green spaces accessible to residents, the variety of types is relatively well distributed. The spatial planning of UGS types in Shenzhen appears relatively successful, allowing residents to experience diverse green spaces even when overall accessibility varies. The city’s planning efforts have achieved a systematic integration of different UGS types, helping to avoid imbalances that arise from a concentration of a single type.
Moreover, after a 20 min walking range, the Gini coefficient of diversity tends to stabilize, with little variation observed from further increases in walking time. This indicates a degree of stability and universality in the diversity of UGSs, regardless of the exact walking distance, residents are likely to encounter a relatively consistent range of UGS types within their immediate surroundings.
As shown in the cumulative distribution function (CDF) of Figure 8, in terms of the count of accessible UGS types, more than 80% of residents can access three or more types of green spaces within a 15 min walking distance. This finding highlights the relatively high level of green space type richness that is already present within a basic walking range. As the walking time increases to 20, 25, and 30 min, the proportion of residents with access to more than three types of UGS surpasses 90%. This suggests that the vast majority of residents can encounter a diverse array of green spaces with only a moderate increase in walking distance. The spatial distribution of UGSs effectively supports residents’ fundamental needs for diversity in green space experiences across various walking durations, reflecting a commendable degree of equity and inclusivity.
Further evidence of the equitable provision of diverse green spaces is found in the cumulative distribution curve of the Simpson’s Diversity Index, which reveals a pattern of low disparity and high uniformity. Fewer than 20% of residents live in areas where the Simpson Index is below 0.2, indicating that only a small portion of the population is exposed to relatively homogeneous green space types. Moreover, less than 40% of residents are in areas with a Simpson Index below 0.4, while around 40% reside in areas where the index exceeds 0.6. This distribution implies that most residents live in neighborhoods with high green space diversity, and the variation in the richness of green space types experienced by different residents is relatively small. These results also suggest that the city’s success in ensuring balanced and equitable access to diverse UGS types across the urban landscape.

5. Discussion

5.1. A Framework for Assessing the Accessibility, Diversity, and Equity of Urban Green Spaces

The study developed an accessibility–diversity–equality assessment framework, which evaluates the accessibility of various UGS types within residents’ walking range, the diversity of their types, and their distributive equity. The framework not only provides a methodological tool for precisely identifying gaps in green space resources but also expanding from equity in UGS access to equity in access to diverse UGS types. It serves as a core support for optimizing socio-ecological synergy in land-scarce megacities.
Applying this framework to Shenzhen yielded significant insights regarding the diversity of accessible green spaces. Although equal access to individual green space types remains challenging, our findings indicate that residents generally enjoy access to a diverse combination of green space types. Over 80% of the population can access three or more different types of green spaces—including natural, residential, street, cultural and sports, and agricultural green spaces—within a 15 min walk. This configuration reflects the success of Chinese cities in avoiding spatial imbalances in green space type distribution and promoting a relatively equitable allocation of diverse green resources across residential areas.
The presence of multiple green space types allows for a richer and more inclusive range of green space experiences. For high-density urban environments, these findings provide practical insights into green space planning: it is not only the quantity but also the diversity of green spaces that matters. Promoting diversity in green space types can help ensure that residents with varying needs and preferences have meaningful access to the green amenities.
The innovations of this study include the following: (1) Previous studies have predominantly focused either on a single type of green space or treated all types of UGSs as a homogeneous whole when assessing spatial inequality [9,18,49]. This study integrating accessibility, typological diversity, and distributive equity into a unified framework, overcoming the limitations of traditional studies that focus on a single dimension. This provides a methodological contribution to comprehensively analyzing UGS equity. (2) By combining accessibility, diversity, and equity analyses, the study uncovers the asymmetric characteristics of UGS accessibility and diversity in high-density cities, offering new insights for precision-oriented green space planning. (3) Using Shenzhen as a case study, the framework’s applicability is validated, and its findings can be extended to similar cities worldwide. It serves as a reference paradigm for balancing UGS provision and spatial justice in land-scarce megacities.

5.2. Inequality Among Different Types of Urban Green Space

This study reveals a long-overlooked dimension in green space equity research: the inequality of accessibility varies significantly across UGS types. In some cases, inequality for individual green space types far exceeds that of the overall UGS system.
Natural green spaces are widely recognized for their recreational potential, cultural significance, and ecological value [50,51]. However, little attention has been paid to the equity of their accessibility. This study identifies a “green paradox,” where natural green spaces—despite their extensive spatial coverage (being the dominant type for 38.5% to 54.8% of residential buildings)—exhibit extremely high accessibility inequality (Gini coefficient > 0.9). This is primarily attributed to natural barriers such as geography and terrain that limit physical accessibility, resulting in a disparity between ecological resource abundance and spatial distribution equity. While planners cannot create new natural landscapes, they can improve the situation by optimizing entrance designs and refining conservation strategies. In contrast, artificial green spaces like parks, streets, residential areas, and cultural sites are developed through human intervention. From the perspective of urban managers and planners, judicious interventions in these artificial green spaces constitute the key factor in enhancing resource allocation equity.
Urban parks, often considered the most iconic recreational UGSs, also exhibit significant spatial inequality (Gini coefficient > 0.7), and their accessibility dominance is relatively low. Although parks receive considerable attention from urban planning and management authorities, their development is constrained by high construction costs and limited land availability. Consequently, they tend to be selectively located, often concentrated in city centers or waterfronts [52], which contributes to inequitable access.
In contrast, residential green spaces and street green spaces demonstrate comparatively lower levels of inequality (Gini coefficients < 0.6 and < 0.7, respectively). The relative equity of residential green spaces stems from urban planning regulations in China, which mandate that newly developed residential areas allocate at least 35% of their land to green space. This policy, embedded in detailed regulatory plans, ensures the systematic integration of green spaces within residential developments. Similarly, the linear and flexible characteristics of street green spaces allow them to permeate more evenly across urban environments. Unlike selectively located parks, residential green spaces are embedded directly into daily living environments, making them the most accessible form of nature exposure for residents [18]. These “capillary” green spaces support frequent, informal interactions with nature—such as morning walks or evening strolls—promoting the integration of natural contact into everyday routines [53].
While residential and street green spaces offer more equitable access, studies by Wu et al. [54] and Wen et al. [55] have cautioned that assuming universal public access to all residential green spaces could paradoxically increase inequality. However, the present study presents new evidence that complementarity among diverse UGS types can enhance overall accessibility equity. Given that most existing residential green spaces currently remain within gated communities, this finding highlights the significant potential for opening such communities to improve green space access. When all green spaces are considered collectively, the Gini coefficient for accessibility falls below 0.77—significantly lower than for any single type such as natural, agricultural, or cultural and sports green spaces. This suggests that diversified green space supply strategies are more effective in improving equity. Simply increasing the quantity of a single type of green space may fail to address—and could even exacerbate—existing inequalities.
It is worth noting that while our study did not conduct a quantitative analysis of residents’ relative preferences for different UGS types, existing literature suggests there are significant variations in both perceived importance and actual usage patterns among different UGS types. These differences further complicate the equity landscape. For instance, Zhao et al. found that ancillary green spaces are the most frequently visited and preferred type by residents, with visitation rates significantly outranking parks, plazas, and natural green spaces [39]. It implies that while large natural and agricultural green spaces exhibit high inequality in access, residents’ inherent preference for them is not necessarily high. Urban planning and management should therefore prioritize ensuring equity in the residential, culture and sport and street green spaces that residents encounter daily, better aligning with their high demand.

5.3. Limitations and Future Directions

Our analysis focused primarily on measuring the spatial accessibility and type diversity of green spaces, without incorporating assessments of green space quality due to data limitations. The quality of parks is also a significant factor affecting residents’ access [56], such as their ecological benefits, maintenance levels, and recreational amenities, which needs to be taken into consideration in future research. Second, while our classification system adheres to the official “Urban Green Space Classification Standards”, it does not distinguish between sub-types of green spaces. For instance, parks can include botanical gardens, waterfront parks, or pocket parks, each offering different functions and potentially different patterns of accessibility and equity. Future research should strive to integrate more detailed data on green space quality, potentially through field surveys, high-resolution remote sensing, or crowdsourced imagery. Additionally, refining the green space classification system to account for functional subcategories would enable a more nuanced analysis of diversity and equity in UGS provision.

6. Conclusions

This study proposes an accessibility–diversity–equality assessment framework for UGS under walking-based conditions, using Shenzhen as a case study. We assessed the accessibility, diversity, and spatial equity of six major types of UGS within walking thresholds of 15 to 30 min. The results reveal that natural green spaces in Shenzhen account for over two-thirds of the total UGSs system, whereas park green spaces, residential green spaces, and street green spaces each constitute less than 10%. Significant disparities exist in accessibility across different UGS types: natural, agricultural, and cultural and sports green spaces exhibit high inequality, while residential green spaces—due to their embedded designs—show relatively equitable accessibility. Despite inequalities in access to specific types of UGS, most residents benefit from a diverse supply of green spaces. Over 80% of the population is within walking distance (15 min) of three or more types of UGS. This finding highlights the importance of promoting green space diversity as a strategy for enhancing spatial equity in high-density urban environments. Rather than focusing solely on expanding specific categories, efforts should aim to optimize the spatial configuration of multiple green space types. The study also offers empirical support for integrated green infrastructure planning that considers both the quantity and variety of green spaces.

Author Contributions

Conceptualization, F.C. and Z.H.; methodology, F.C. and Z.H.; software, F.C.; validation, F.C., J.H. and W.L.; formal analysis, F.C., Z.H. and W.L.; investigation, F.C.; resources, Z.H.; data curation, F.C.; writing—original draft preparation, F.C., Z.H., W.L. and J.H.; writing—review and editing, F.C., Z.H. and W.L.; visualization, F.C. and J.H.; supervision, Z.H.; project administration, Z.H.; funding acquisition, Z.H. All authors have read and agreed to the published version of the manuscript.

Funding

This research was funded by National Natural Science Foundation of China, grant number 42471493; Shenzhen Science and Technology Program, grant number 20220809120650001; Guangdong Basic and Applied Basic Research Foundation, grant number 2023A1515110097.

Data Availability Statement

The raw data supporting the conclusions of this article will be made available by the authors on request.

Conflicts of Interest

The authors declare no conflicts of interest.

Abbreviations

The following abbreviations are used in this manuscript:
UGSUrban Green Space
GSGreen Space
2SFCATwo-Step Floating Catchment Area
OSMOpenStreetMap
CDFCumulative Distribution Function
DOMDigital Orthophoto Maps

Appendix A

Figure A1. Accessibility of different UGS’ types.
Remotesensing 17 02551 g0a1

References

  1. Kabisch, N.; Qureshi, S.; Haase, D. Human–environment interactions in urban green spaces—A systematic review of contemporary issues and prospects for future research. Environ. Impact Assess. Rev. 2015, 50, 25–34. [Google Scholar] [CrossRef]
  2. Anguluri, R.; Narayanan, P. Role of green space in urban planning: Outlook towards smart cities. Urban For. Urban Green. 2017, 25, 58–65. [Google Scholar] [CrossRef]
  3. Biernacka, M.; Kronenberg, J.; Łaszkiewicz, E.; Czembrowski, P.; Amini Parsa, V.; Sikorska, D. Beyond urban parks: Mapping informal green spaces in an urban–peri-urban gradient. Land Use Policy 2023, 131, 106746. [Google Scholar] [CrossRef]
  4. McCormick, R. Does Access to Green Space Impact the Mental Well-being of Children: A Systematic Review. J. Pediatr. Nurs. 2017, 37, 3–7. [Google Scholar] [CrossRef] [PubMed]
  5. Elsadek, M.; Liu, B.; Xie, J. Window view and relaxation: Viewing green space from a high-rise estate improves urban dwellers’ wellbeing. Urban For. Urban Green. 2020, 55, 126846. [Google Scholar] [CrossRef]
  6. United Nations. Transforming Our World: The 2030 Agenda for Sustainable Development. 2015. Available online: https://sdgs.un.org/2030agenda (accessed on 26 May 2025).
  7. Zhang, K.; Chen, M. Multi-method analysis of urban green space accessibility: Influences of land use, greenery types, and individual characteristics factors. Urban For. Urban Green. 2024, 96, 128366. [Google Scholar] [CrossRef]
  8. Endalew Terefe, A.; Hou, Y. Determinants influencing the accessibility and use of urban green spaces: A review of empirical evidence. City Environ. Interact. 2024, 24, 100159. [Google Scholar] [CrossRef]
  9. Martin, A.J.F.; Conway, T.M. Using the Gini Index to quantify urban green inequality: A systematic review and recommended reporting standards. Landsc. Urban Plan. 2025, 254, 105231. [Google Scholar] [CrossRef]
  10. Shahtahmassebi, A.R.; Li, C.; Fan, Y.; Wu, Y.; Lin, Y.; Gan, M.; Wang, K.; Malik, A.; Blackburn, G.A. Remote sensing of urban green spaces: A review. Urban For. Urban Green. 2021, 57, 126946. [Google Scholar] [CrossRef]
  11. Nowak, D.J.; Rowntree, R.A.; McPherson, E.G.; Sisinni, S.M.; Kerkmann, E.R.; Stevens, J.C. Measuring and analyzing urban tree cover. Landsc. Urban Plan. 1996, 36, 49–57. [Google Scholar] [CrossRef]
  12. Zeng, Y.; Hao, D.; Huete, A.; Dechant, B.; Berry, J.; Chen, J.M.; Joiner, J.; Frankenberg, C.; Bond-Lamberty, B.; Ryu, Y.; et al. Optical vegetation indices for monitoring terrestrial ecosystems globally. Nat. Rev. Earth Environ. 2022, 3, 477–493. [Google Scholar] [CrossRef]
  13. Wulder, M.A.; Roy, D.P.; Radeloff, V.C.; Loveland, T.R.; Anderson, M.C.; Johnson, D.M.; Healey, S.; Zhu, Z.; Scambos, T.A.; Pahlevan, N.; et al. Fifty years of Landsat science and impacts. Remote Sens. Environ. 2022, 280, 113195. [Google Scholar] [CrossRef]
  14. Mazzulla, G.; Pirrone, C.G. Accessibility Measures: From a Literature Review to a Classification Framework. ISPRS Int. J. Geo Inf. 2024, 13, 450. [Google Scholar] [CrossRef]
  15. Gupta, K.; Roy, A.; Luthra, K.; Maithani, S.; Mahavir. GIS based analysis for assessing the accessibility at hierarchical levels of urban green spaces. Urban For. Urban Green. 2016, 18, 198–211. [Google Scholar] [CrossRef]
  16. Wang, S.; Wang, M.; Liu, Y. Access to urban parks: Comparing spatial accessibility measures using three GIS-based approaches. Comput. Environ. Urban Syst. 2021, 90, 101713. [Google Scholar] [CrossRef]
  17. Chen, X.; Jia, P. A comparative analysis of accessibility measures by the two-step floating catchment area (2SFCA) method. Int. J. Geogr. Inf. Sci. 2019, 33, 1739–1758. [Google Scholar] [CrossRef]
  18. Wu, L.; Kim, S.K. Exploring the equality of accessing urban green spaces: A comparative study of 341 Chinese cities. Ecol. Indic. 2021, 121, 107080. [Google Scholar] [CrossRef]
  19. Liang, H.; Yan, Q.; Yan, Y.; Zhang, Q. Using an improved 3SFCA method to assess inequities associated with multimodal accessibility to green spaces based on mismatches between supply and demand in the metropolitan of Shanghai, China. Sustain. Cities Soc. 2023, 91, 104456. [Google Scholar] [CrossRef]
  20. Rigolon, A. A complex landscape of inequity in access to urban parks: A literature review. Landsc. Urban Plan. 2016, 153, 160–169. [Google Scholar] [CrossRef]
  21. Mandelbaum, R. Size Does Matter: Justice versus Equality in Urban Green Space Policy in Beersheba, Israel. Prof. Geogr. 2021, 73, 434–446. [Google Scholar] [CrossRef]
  22. Lu, W.; Jiang, W.; Qiao, D.; Liu, Q.; Chen, G.; Huang, Q.; Xu, C. Embracing green spaces: Exploring spatiotemporal changes in urban green space accessibility and its equity in Guangzhou, China for sustainable urban greening. Environ. Sustain. Indic. 2023, 19, 100290. [Google Scholar] [CrossRef]
  23. Wüstemann, H.; Kalisch, D.; Kolbe, J. Access to urban green space and environmental inequalities in Germany. Landsc. Urban Plan. 2017, 164, 124–131. [Google Scholar] [CrossRef]
  24. Maksymiuk, G.; Giedych, R.; Winiarska, A. Assessment of differentiation in natural green spaces provision in Warsaw using Accessible Natural Greenspace Standard (ANGSt). Acta Sci. Pol. Archit. Bud. 2019, 18, 45–53. [Google Scholar] [CrossRef]
  25. World Health Organization. Regional Office for Europe. In Urban Green Spaces and Health; World Health Organization: Copenhagen, Denmark, 2019; Available online: https://iris.who.int/handle/10665/345751 (accessed on 19 July 2025).
  26. Massoni, E.S.; Barton, D.N.; Rusch, G.M.; Gundersen, V. Bigger, more diverse and better? Mapping structural diversity and its recreational value in urban green spaces. Ecosyst. Serv. 2018, 31, 502–516. [Google Scholar] [CrossRef]
  27. Ke, X.; Huang, D.; Zhou, T.; Men, H. Contribution of non-park green space to the equity of urban green space accessibility. Ecol. Indic. 2023, 146, 109855. [Google Scholar] [CrossRef]
  28. Liu, W.; Chen, W.; Dong, C. Spatial decay of recreational services of urban parks: Characteristics and influencing factors. Urban For. Urban Green. 2017, 25, 130–138. [Google Scholar] [CrossRef]
  29. Tan, P.Y.; Samsudin, R. Effects of spatial scale on assessment of spatial equity of urban park provision. Landsc. Urban Plan. 2017, 158, 139–154. [Google Scholar] [CrossRef]
  30. Xiao, Y.; Wang, Z.; Li, Z.; Tang, Z. An assessment of urban park access in Shanghai—Implications for the social equity in urban China. Landsc. Urban Plan. 2017, 157, 383–393. [Google Scholar] [CrossRef]
  31. Stanford, H.R.; Hurley, J.; Garrard, G.E.; Kirk, H. Exploring the secret gardens of the city: An assessment of human-nature interactions on informal green space using citizen science data. Urban For. Urban Green. 2024, 98, 128414. [Google Scholar] [CrossRef]
  32. Barron, S.; Rugel, E.J. Tolerant greenspaces: Designing urban nature-based solutions that foster social ties and support mental health among young adults. Environ. Sci. Policy 2023, 139, 1–10. [Google Scholar] [CrossRef]
  33. Hansmann, R.; Hug, S.; Seeland, K. Restoration and stress relief through physical activities in forests and parks. Urban For. Urban Green. 2007, 6, 213–225. [Google Scholar] [CrossRef]
  34. Ekkel, E.D.; de Vries, S. Nearby green space and human health: Evaluating accessibility metrics. Landsc. Urban Plan. 2017, 157, 214–220. [Google Scholar] [CrossRef]
  35. Curry, N.; Ravenscroft, N. Countryside recreation provision in England: Exploring a demand-led approach. Land Use Policy 2001, 18, 281–291. [Google Scholar] [CrossRef]
  36. Zutter, C.; Stoltz, A. Community gardens and urban agriculture: Healthy environment/healthy citizens. Int. J. Ment. Health Nurs. 2023, 32, 1452–1461. [Google Scholar] [CrossRef] [PubMed]
  37. Lu, Y. Using Google Street View to investigate the association between street greenery and physical activity. Landsc. Urban Plan. 2019, 191, 103435. [Google Scholar] [CrossRef]
  38. Qiu, L.; Nielsen, A.B. Are Perceived Sensory Dimensions a Reliable Tool for Urban Green Space Assessment and Planning? Landsc. Res. 2015, 40, 834–854. [Google Scholar] [CrossRef]
  39. Zhao, W.; Zhang, L.; Li, X.; Peng, L.; Wang, P.; Wang, Z.; Jiao, L.; Wang, H. Residents′ preference for urban green space types and their ecological-social services in China. Land 2022, 11, 2239. [Google Scholar] [CrossRef]
  40. Fan, H.; Yang, B.; Zipf, A.; Rousell, A. A polygon-based approach for matching OpenStreetMap road networks with regional transit authority data. Int. J. Geogr. Inf. Sci. 2016, 30, 748–764. [Google Scholar] [CrossRef]
  41. Shang, S.; Du, S.; Du, S.; Zhu, S. Estimating building-scale population using multi-source spatial data. Cities 2021, 111, 103002. [Google Scholar] [CrossRef]
  42. CJJ/T85-2017; Standard for Classification of Urban Green Space. China Architecture & Building Press: Beijing, China, 2017.
  43. Yip, N.M. Walled Without Gates: Gated Communities in Shanghai. Urban Geogr. 2012, 33, 221–236. [Google Scholar] [CrossRef]
  44. Dai, D. Racial/ethnic and socioeconomic disparities in urban green space accessibility: Where to intervene? Landsc. Urban Plan. 2011, 102, 234–244. [Google Scholar] [CrossRef]
  45. Zhang, J.; Yue, W.; Fan, P.; Gao, J. Measuring the accessibility of public green spaces in urban areas using web map services. Appl. Geogr. 2021, 126, 102381. [Google Scholar] [CrossRef]
  46. Willberg, E.; Fink, C.; Toivonen, T. The 15-minute city for all? Measuring individual and temporal variations in walking accessibility. J. Transp. Geogr. 2023, 106, 103521. [Google Scholar] [CrossRef]
  47. Muvengwi, J.; Kwenda, A.; Mbiba, M.; Mpindu, T. The role of urban schools in biodiversity conservation across an urban landscape. Urban For. Urban Green. 2019, 43, 126370. [Google Scholar] [CrossRef]
  48. Zhou, Y.; Zhao, H.; Luo, Y.; Yi, X.; Lun, F. Exploring the inequality in urban parks′ distribution and their cooling effects from the perspective of urbanization. Landsc. Urban Plan. 2025, 260, 105390. [Google Scholar] [CrossRef]
  49. Zhai, C.; Geng, R.; Ren, Z.; Wang, C.; Zhang, P.; Guo, Y.; Hong, S.; Hong, W.; Meng, F.; Fang, N. Spatiotemporal Dynamics of Urban Green Space Coverage and Its Exposed Population under Rapid Urbanization in China. Remote Sens. 2024, 16, 2836. [Google Scholar] [CrossRef]
  50. Luo, Q.; Bao, Y.; Wang, Z.; Chen, X. Potential recreation service efficiency of urban remnant mountain wilderness: A case study of Yunyan District of Guiyang city, China. Ecol. Indic. 2022, 141, 109081. [Google Scholar] [CrossRef]
  51. Liu, S.; Wang, Z.; Kumilamba, G.; Yu, L. Optimizing green space configuration for mitigating land surface temperature: A case study of karst mountainous cities. Sustain. Cities Soc. 2025, 125, 106345. [Google Scholar] [CrossRef]
  52. Tang, X.; Zou, C.; Shu, C.; Zhang, M.; Feng, H. Research on site selection planning of urban parks based on POI and machine learning—Taking Guangzhou City as an example. Land 2024, 13, 1362. [Google Scholar] [CrossRef]
  53. Zhao, Y.; van den Berg, P.E.W.; Ossokina, I.V.; Arentze, T.A. How do urban parks, neighborhood open spaces, and private gardens relate to individuals′ subjective well-being: Results of a structural equation model. Sustain. Cities Soc. 2024, 101, 105094. [Google Scholar] [CrossRef]
  54. Wu, J.; He, Q.; Chen, Y.; Lin, J.; Wang, S. Dismantling the fence for social justice? Evidence based on the inequity of urban green space accessibility in the central urban area of Beijing. Environ. Plan. B Urban Anal. City Sci. 2020, 47, 626–644. [Google Scholar] [CrossRef]
  55. Wen, Z.; Zhang, S.; Yang, Y.; Zheng, X.; Song, Z.; Zhou, Y.; Hao, J. How does enclosed private residential green space impact accessibility equity in urban regions? A case study in Shenzhen, China. Urban For. Urban Green. 2023, 85, 127968. [Google Scholar] [CrossRef]
  56. Wu, Y.; Wei, Y.D.; Liu, M.; Garcia, I. Urban equity of park use in peri-urban areas during the COVID-19 pandemic. Landsc. Urban Plan. 2025, 256, 105269. [Google Scholar] [CrossRef]
Figure 1. Overview of the study area.
Remotesensing 17 02551 g001
Figure 2. Accessibility–diversity–equality assessment framework for UGS.
Remotesensing 17 02551 g002
Figure 3. Schematic diagram for calculating accessibility, diversity, and equality.
Remotesensing 17 02551 g003
Figure 4. Distribution Map of UGS Types in Shenzhen.
Remotesensing 17 02551 g004
Figure 5. Dominant accessible UGS types and their accessibility (Ai).
Remotesensing 17 02551 g005
Figure 6. Accessible UGS types count and their accessibility (Ai).
Remotesensing 17 02551 g006
Figure 7. Accessible UGS Simpson’s Diversity Index and their accessibility (Ai).
Remotesensing 17 02551 g007
Figure 8. Cumulative distribution of diversity index.
Remotesensing 17 02551 g008
Table 1. Data usage and source.
DatasetUsageSource
Gaofen-1 satellite imageryUsed for extracting UGSshttps://www.sasclouds.com/chinese/normal (accessed on 8 July 2025)
Open Street Map road networkEmployed to compute accessibility time to UGSshttp://www.openstreetmap.org (accessed on 7 June 2025)
Residential building dataFunctioned to identify demand locationsAmap: https://amap.com (accessed on 8 July 2025), Building rooftop: https://doi.org/10.11888/Geogra.tpdc.271702 (accessed on 8 July 2025), CNBH-10m: https://zenodo.org/record/782731 (accessed on 8 July 2025)
Urban land-use dataEmployed for UGSs typology classificationOfficial land survey basemap
Point-of-interest dataServed for residential population estimationhttps://lbs.amap.com (accessed on 8 July 2025)
Mobile signaling dataServed for residential population estimationProvided under license by China Unicom’s Smart Footprint platform
Table 2. UGS Classification System.
CategoryDefinitionThe Name Corresponding to the Standard
Park Green SpacesPublic green spaces primarily for recreation.Parks and squares green spaces
Natural Green SpacesUndeveloped or minimally developed non-urbanized green spaces.Regional green spaces
Street Green SpacesGreen spaces along roads, including street trees, green belts, and roadside pocket parks.Ancillary green spaces in urban road land
Residential Green SpacesGreen spaces within residential areas.Ancillary green spaces in residential land
Cultural and Sports Green SpacesGreen spaces in museums, exhibition halls, and sports facilities.Ancillary green spaces in cultural and sports facilities
Agricultural Green SpacesGreen spaces dominated by farming (e.g., croplands, orchards).Green spaces in agricultural land
Note: Standard represents China’s Standard for Classification of Urban Green Space [42].
Table 3. Gini coefficient of UGS accessibility and accessible UGS diversity.
VariableUGS Types15 min20 min25 min30 min
Accessibility of various GSsPark GSs0.880.830.770.73
Nature GSs0.940.920.910.90
Street GSs0.670.620.570.53
Residential GSs0.580.520.480.45
Cultural and Sport GSs0.950.910.860.81
Agricultural GSs0.980.980.960.95
All types of GSs0.770.760.740.73
Diversity of accessible GSsType count0.130.110.100.09
Simpson index0.210.190.190.19
Disclaimer/Publisher’s Note: The statements, opinions and data contained in all publications are solely those of the individual author(s) and contributor(s) and not of MDPI and/or the editor(s). MDPI and/or the editor(s) disclaim responsibility for any injury to people or property resulting from any ideas, methods, instructions or products referred to in the content.

