Abstract
By integrating EarthCARE W-band doppler cloud radar observations with GPM Ku/Ka-band dual-frequency precipitation radar data, this study constructs a novel global “pseudo tripe-frequency” radar coincidence dataset comprising 2886 coincidence events (about one-third of the events detected precipitation), aiming to systematically investigating band-dependent responses to cloud and precipitation structure. Results demonstrate that the W-band is highly sensitive to high-altitude cloud particles and snowfall (reflectivity < 0 dBZ), yet it experiences substantial signal attenuation under heavy precipitation conditions, and with low-altitude reflectivity reductions exceeding 50 dBZ, its probability density distribution is more widespread, with low-altitude peaks increasing first, and then decreasing as precipitation increases. In contrast, the Ku and Ka-band radars maintain relatively stable detection capabilities, with attenuation differences generally within 15 dBZ, but its probability density distribution exhibits multiple peaks. As the precipitation rate increases, the peak value of the dual-frequency ratio (Ka/W) gradually rises from approximately 10 dBZ to 20 dBZ, and can even reach up to 60 dBZ under heavy rainfall conditions. Several cases analyses reveal clear contrasts: In stratiform precipitation regions, W-band radar reflectivity is higher above the melting layer than below, whereas the opposite pattern is observed in the Ku and Ka bands. Doppler velocities exceeding 5 m s−1 and precipitation rates surpassing 30 mm h−1 exhibit strong positive correlations in convection-dominated regimes. Furthermore, the dataset confirms the impact of ice–water cloud phase interactions and terrain-induced precipitation variability, underscoring the complementary strengths of multi-frequency radar observations for capturing diverse precipitation processes.
1. Introduction
To advance global observations of cloud–aerosol–precipitation distributions and collocated radiative fluxes for improving cloud/aerosol parameterizations in climate and weather models [1], the Earth Cloud, Aerosol, and Radiation Explorer (EarthCARE) was successfully launched into its sun-synchronous orbit on 28 May 2024. EarthCARE integrates four synergistic instruments: Atmospheric Lidar (ATLID), Cloud Profiling Radar (CPR), Multi-Spectral Imager (MSI) and Broad-Band Radiometer (BBR) (Figure 1).
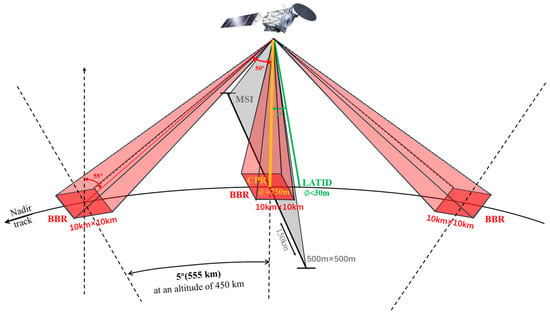
Figure 1.
Illustration of viewing geometry (not proportional).
The CPR is a 94 GHz pulsed Doppler radar designed to measure particle velocities from backscattered signals. As the first spaceborne cloud-profiling radar with Doppler velocity measurement capabilities for both cloud droplets and precipitation particles, it significantly enhances global datasets on cloud-precipitation vertical dynamics and microphysical properties. Equipped with a reflector that has a 2.5 m reflector, the instrument achieves a sensitivity threshold of −35 dBZ and detects virtually all radiatively active ice clouds. With demonstrated Doppler velocity precision exceeding 1.3 m s−1, it improves cloud-type classification accuracy and convective motion characterization. The nadir-pointing CPR features a 700 m ground footprint, generating horizontally averaged data at 500 m resolution along the orbital track [2].
The Dual-frequency Precipitation Radar (DPR) onboard the Global Precipitation Measurement (GPM) satellite, operating at Ku and Ka bands, can retrieve water vapor content profiles for most precipitation types, excluding extreme heavy rainfall and very light rain or snow [3]. With an orbital inclination of 65°, it observes a broader range of weather systems compared to its predecessor—the Ku-band radar aboard the Tropical Rainfall Measuring Mission (TRMM) satellite, which had an inclination of 35° [4]. Owing to the differing orbital inclinations of EarthCARE and GPM, their observational footprints frequently overlap, enabling the construction of “pseudo-triple-frequency” radar profiles for the same weather systems.
To leverage the unique strengths of each frequency band and enable comprehensive observations from clouds to light and heavy precipitation, the combined use of three radar frequencies—W, Ka, and Ku—is essential to investigate the vertical distribution of cloud and precipitation as well as the microphysical processes within weather systems [5]. Berg et al. (2010) utilized the Cloud Profiling Radar (CPR) aboard the CloudSat satellite, together with the Tropical Rainfall Measuring Mission (TRMM) Precipitation Radar (PR), to evaluate rainfall distribution and intensity over tropical and subtropical oceans [6]. Their findings indicated that CPR detected rainfall occurrences at a frequency nearly 2.5 times greater than that of TRMM PR. Tang et al. (2017) performed a global-scale analysis by cross-matching datasets from TRMM PR, GPM Dual-frequency Precipitation Radar (DPR), and CloudSat CPR [7].
Hayden and Liu optimized precipitation retrieval accuracy by combining CloudSat measurements for light rain (<5 mm h−1) with GPM estimates for heavier rates (>10 mm h−1) [8]. Gorgucci et al. examined how single- and multi-frequency radars affect the estimation of cloud water content and concluded that multi-frequency radars improve the accuracy of these estimates [9]. Turk et al. pioneered tripe-frequency analysis using GPM’s dual-frequency precipitation radar (DPR) data, advancing understanding of cold-season precipitation microphysics and surface emissivity interactions [10]. Liang et al. developed a W-Ka band reflectivity fusion algorithm showing 40% improvement in ice/mixed-phase precipitation consistency [11]. Chase et al. identified band-dependent reflectivity maxima patterns: W-band peaks near K-band-defined echo tops (8–12 km) versus Ka-band maxima below 4–5 km [12]. An increasing number of studies suggest that the development of a triple-frequency dataset holds great potential for retrieving cloud precipitation microphysical parameters and observing the complete structure of precipitation clouds. Moreover, this dataset enables the analysis of precipitation clouds using the Dual-Frequency Ratio (DFR). The incorporation of Doppler velocity as an additional constraint further facilitates more advanced microphysical analyses of ice particles.
In this paper, we constructed an overlap dataset between EarthCARE CPR and GPM DPR by matching their precipitation observations in both space and time. Subsequently, we analyzed differences in precipitation measurements between the two radar systems through Statistical analysis and three representative cases to highlight the significance of this overlap dataset.
2. Data and Methods
2.1. GPM Data
The GPM, a joint NASA-JAXA mission, carries the world’s most advanced multi-channel passive microwave imager (GMI) and DPR. The DPR system integrates two radars: a Ku-band (13.6 GHz) precipitation radar (KuPR) optimized for moderate-intensity precipitation detection, and a Ka-band (35.5 GHz) radar (KaPR) specialized in weak precipitation and cloud particle observation. When synergistically operated, these radars provide complementary precipitation measurements with 5 km surface horizontal resolution, covering precipitation intensities from light drizzle to heavy rainfall [4]. To maximize the overlap area, this study utilized data from the KaPR FS mode, which features a 49-pixel-wide scanning swath. The wider swath coverage enables the greatest possible overlap with the EarthCARE orbit [13].
This study utilizes Ka/Ku-band data from the GPM DPR Level 2 Version 07 2A-DPR product. Section 4.1 compares first-level products based on uncorrected radar reflectivity, while Section 4.2 and Section 4.3 compare second-level products using radar reflectivity data corrected for attenuation and non-uniform filling [14,15,16,17].
2.2. EarthCARE Data
EarthCARE data products follow a three-tiered hierarchy: Level 0 (L0) raw instrument data restricted to internal research use; Level 1 (L1) products independently processed by ESA (ATLID, MSI, BBR) and JAXA (CPR); and Level 2 (L2) geophysical retrievals. The L1 products are further categorized into L1b (calibrated physical measurements with error flags and geolocation), and L1d auxiliary products. The X-JSG grid facilitates higher-level product generation by aligning instrument-specific observations [18].
To reconcile the disparate detection ranges and resolutions of EarthCARE’s four instruments, the three-dimensional X-JSG grid serves as the standardized framework for L2b products. This grid combines CPR’s along-track horizontal resolution (500 m), ATLID’s vertical profiling (100 m), and MSI’s cross-track coverage (1 km × 1 km vertical orbital grid), enabling synergistic analysis of coincident atmospheric columns [18].
ESA and JAXA independently develop L2 products categorized as L2a (single-instrument retrievals) and L2b (multi-sensor synergistic inversions), as shown in Figure 2. These include cloud phase classification (ice/mixed/liquid), microphysical property profiles, particle sedimentation velocities, precipitation parameters, and aerosol typing [2].
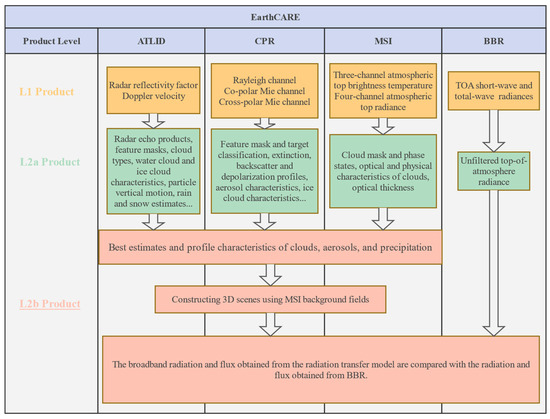
Figure 2.
EarthCARE data Processing Chain Diagram.
This dataset contains all EarthCARE products, but Section 3 mainly shows the comparison and joint observations of EarthCARE CPR and GPM DPR. The data used mainly includes radar reflectivity factors, radial Doppler velocity, target cloud classification, etc. In this study, we utilized various parameters, such as radar reflectivity factor, radial Doppler velocity, and cloud classification. These parameters were obtained from the 1B-CPR-NOM, 2A-CPR-CLD, 2A-CPR-FMR, 2A-CPR-CD, and 2B-AC-TC products. See Table 1 for specific parameters.

Table 1.
The specific parameters from EarthCARE utilized in this study.
2.3. Data Matching and Coincidence Data Processing
In this context, overlapping events are defined as instances in which the footprint trajectories of EarthCARE and GPM intersect within a 15 min time window. Figure 3 illustrates the schematic of the spatiotemporal matching process: green circles indicate DPR data, red circles denote EarthCARE L1D data, and yellow circles represent CPR primary data, which have a horizontal resolution of 500 m. The joint grid of secondary products (X-JSG), with a 1 km horizontal resolution, is also shown. Given that the EarthCARE L1B CPR product possesses the highest horizontal resolution, it serves as the reference grid. Based on the latitude and longitude coordinates of the three-dimensional grid points, EarthCARE Level 2 and GPM products are resampled onto the EarthCARE CPR Level 1 grid using the nearest neighbor method. To minimize spatial and temporal resampling artifacts, the k-nearest neighbor approach is applied [10]. Vertically, linear interpolation is employed to map the GPM data onto the EarthCARE grid, realizing a “pseudo-triple-frequency” radar profile [13]. The blue box in Figure 3 highlights this resampling process. This dataset includes four secondary products from EarthCARE’s instruments, enabling comprehensive investigation of the vertical distribution and radiative properties of aerosols, clouds, and precipitation on a global scale. It also facilitates estimation of cloud-precipitation interactions, characterization of vertical cloud motions, and assessment of atmospheric radiative heating and cooling. However, this paper primarily focuses on the significance of satellite-borne radar pseudo-triple-frequency techniques for cloud and precipitation detection.
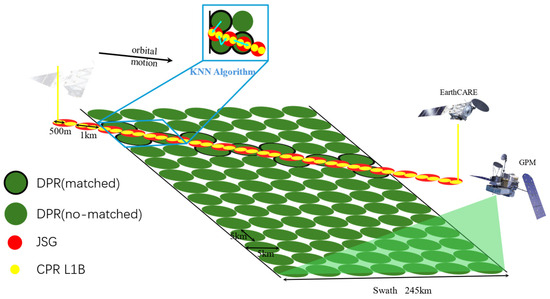
Figure 3.
EarthCARE and GPM spatio-temporal matching diagram.
3. Statistical Analysis
Radars operating at different frequencies exhibit varying sensitivities to precipitation because precipitation particles scatter and absorb electromagnetic waves differently across frequencies, resulting in distinct detection characteristics for the same particles [5]. Based on this principle, exploiting the complementary advantages of multi-frequency radar detection can improve accuracy and sensitivity, enabling more precise identification of precipitation particle types and distributions. This approach is vital for advancing the understanding of precipitation structure and microphysical processes.
By aligning all Level 1 data from EarthCARE’s launch through the period from June 2024 to June 2025 in both space and time, a total of 2886 overlapping events were identified. Among these, 29.4% recorded precipitation detections on both satellites, while 2.9% captured heavy rainfall with precipitation rates exceeding 8 mm h−1. Figure 4 presents the global distribution of overlapping trajectories associated with precipitation events. Based on GPM precipitation rate (P) data within the overlapping events, these events are categorized into three classes: no-precipitation (P < 0.5 mm h−1), light-precipitation (0.5 mm h−1 < P < 8 mm h−1), and heavy-precipitation (P > mm h−1) overlapping events. The density of overlapping trajectories shows minimal variation with longitude, but increases significantly with latitude, peaking between approximately 50° N and 67° N, where 60.51% of all overlapping events occur. This latitudinal concentration is primarily attributed to the unique orbital characteristics of GPM. The spatial distribution of precipitation-overlapping events also shows limited longitudinal variation. However, unlike the general overlapping trajectory distribution, precipitation-overlapping events exhibit an inverse latitudinal pattern, with the most intense and prolonged events predominantly concentrated in low-latitude regions.
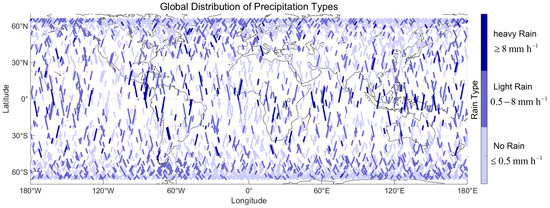
Figure 4.
Global distribution map of overlapping trajectories.
Since ESA began releasing secondary products only after 11 March 2025, the matched secondary products span from that date to 30 June 2025, comprising a total of 933 overlapping data sets. To ensure data accuracy and consistency while minimizing measurement errors, this section utilizes corrected radar reflectivity secondary product overlap data.
Figure 5 illustrates the variation of radar reflectivity with altitude under different precipitation rates. It is evident that the standard deviation of W-band radar reflectivity is significantly larger than that of the Ku and Ka bands across all three subplots. This is mainly due to the W band’s high sensitivity to small particles, which makes it more susceptible to fluctuations caused by such particles, resulting in a wider range of reflectivity values and a “broad” profile in Figure 5—consistent with the extended distribution of the W band shown in Figure 6. In contrast, the longer-wavelength Ku and Ka bands are less sensitive to small particles. Under similar precipitation rates, the particle size variations are minimal, leading to smaller standard deviations and a narrower range of reflectivity variations for Ku and Ka, thus forming a “narrow” profile [19].

Figure 5.
Average cross-sectional diagram of radar reflectivity at different bands for different precipitation rates. (a) No rain, (b) light rain, (c) heavy rain.
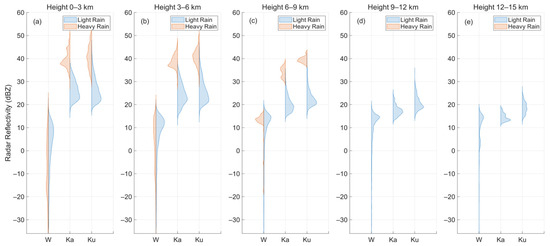
Figure 6.
Probability distribution maps of different bands at different altitudes under different precipitation rates. Orange blocks represent light rain, and blue blocks represent heavy rain. (a) altitude 0–3 km, (b) altitude 3–6 km, (c) altitude 6–9 km, (d) altitude 9–12 km, (e) altitude 12–15 km.
Additionally, as precipitation increases, the average W-band radar reflectivity at low altitudes initially increases and then decreases. From no rain to light rain, particle growth leads to stronger radar reflectivity, dominated by scattering effects. However, as precipitation intensifies from light to heavy rain, increased attenuation of W-band signals by larger precipitation particles aloft reduces reflectivity at lower altitudes. This interpretation is supported by the observation that the average W-band reflectivity at 5 km remains nearly constant from light to heavy rain. A similar pattern is seen in Figure 6: in Figure 6a, the peak of the W-band reflectivity probability density distribution is around 10 dBZ under light rain, but shifts to −15 dBZ under heavy rain. In contrast, Figure 6b shows a notable increase in reflectivity under heavy rain, with the peak approaching 9 dBZ. Furthermore, Figure 5c shows no W-band reflectivity below 0.5 km, indicating significant attenuation of W-band signals by intense precipitation. The inflection point at 14 km in Figure 5a corresponds to high-altitude ice clouds detected by the W-band radar. These clouds often form near the tropopause, where stable stratification and limited vertical motion can cause the accumulation of ice crystals and the appearance of high-frequency radar reflectivity bands [20].
The nearly overlapping radar reflectivity profiles in the Ku and Ka bands suggest a strong correlation between the two. In non-precipitating conditions, the profiles are nearly identical below 5 km. At higher altitudes, Ka-band reflectivity is lower than that of the Ku band, reflecting the Ka band’s slightly greater sensitivity to small ice crystal particles [21]. As precipitation intensity increases, the average reflectivity in both bands continues to rise, reaching up to 40 dBZ under heavy rainfall. The absence of data above 6 km in Figure 5c is attributed to the fact that intense precipitation primarily occurs below the freezing level.
Figure 6 presents the probability density distribution of radar reflectivity at different altitude layers under light and heavy rain conditions. Under light rain, W-band reflectivity increases slightly with altitude; however, a more notable feature is the increasing concentration of reflectivity values, primarily around 15 dBZ. In contrast, Ku- and Ka-band reflectivity decreases with altitude, with the Ka band exhibiting a steeper decline than the Ku band. Between 12 and 15 km, the reflectivity peaks of the W and Ka bands are nearly aligned.
Under heavy rain conditions, Ku and Ka bands often display two or three distinct peak regions. This is mainly because heavy rain is typically associated with convective precipitation, which produces unstable and heterogeneous radar echoes, leading to multiple peaks in the distribution. In contrast, light rain is generally linked to stratiform precipitation, which tends to produce uniform radar echoes, resulting in a more concentrated distribution with a single peak [22].
The dual-frequency ratio (DFR) is a key physical parameter unique to multi-frequency radar systems, offering significant research value in atmospheric detection—particularly for studying cloud microphysical structures, phase identification, and particle size retrieval [21,23]. The “pseudo-triple-frequency” radar profile dataset constructed in this study enables the calculation of three types of DFRs. Here, we focus on DFR (Ka–W), defined as the difference between radar reflectivity in the Ka and W bands.
Figure 7 presents the two-dimensional frequency distribution of DFR (Ka–W), in which (a) represents the full dataset, (b) no-rain conditions, (c) light rain, and (d) heavy rain. As shown in Figure 7a, DFR (Ka–W) is primarily concentrated between 10–25 dBZ and at altitudes of 0.5–3 km. High DFR (Ka–W) values are confined to lower altitudes, while in upper atmospheric layers—particularly above 10 km—DFR (Ka–W) approaches zero. This suggests that in high-altitude regions, such as cirrus cloud layers, Ka- and W-band reflectivities are nearly identical, consistent with the observations in Figure 6e.
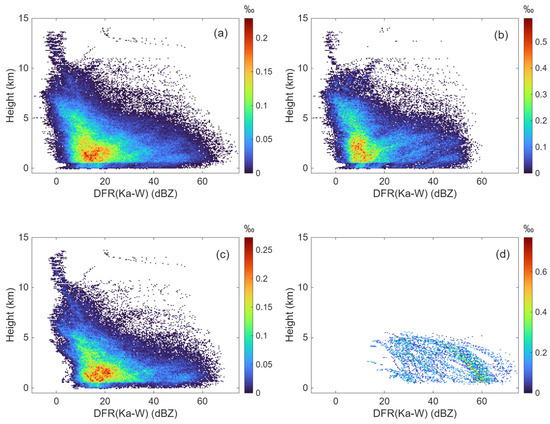
Figure 7.
Two-dimensional frequency density distribution map of the Ka and W band dual-frequency ratio versus height under different precipitation rates. (a) All, (b) No rain, (c) Light rain, (d) Heavy rain.
As precipitation intensity increases, the peak DFR (Ka–W) value rises from approximately 10 dBZ to 20 dBZ, reaching up to 60 dBZ under heavy rain conditions. This indicates that W-band signals are almost entirely attenuated, leading to DFR (Ka–W) ≈ Z (Ka).
4. Coincident Dataset: Case Studies
The merged dataset was subsequently subjected to a rigorous selection process, leading to the identification of representative cases from the primary products that exhibited both stratiform (layered) and convective precipitation. Additionally, secondary products featuring upper-level ice clouds and lower-level water clouds, as well as those associated with snowfall, were identified. These selected cases formed the basis for an in-depth analysis, with particular emphasis placed on the capability of the “pseudo tripe-frequency” radar profiles to detect and differentiate between various cloud and precipitation types. This analytical framework highlights the value of multi-frequency radar observations in enhancing our understanding of cloud–precipitation microphysics and the vertical structure of atmospheric hydrometeors.
4.1. Stratiform and Convective Precipitation
A significant precipitation event occurred over the maritime region near the Strait of Malacca on 24 August 2024. Figure 8 presents a comprehensive depiction of the coincident satellite observations during this event. The differential sensitivity of W-band, Ka-band, and Ku-band radars to various hydrometeor types is clearly illustrated. The W-band radar, owing to its shorter wavelength, is highly sensitive to high-altitude cloud particles, with observed echo tops reaching approximately 15 km. In contrast, the Ka- and Ku-band radars primarily detect precipitation particles and exhibit limited sensitivity to upper-level cloud structures, with echo tops around 8 km.
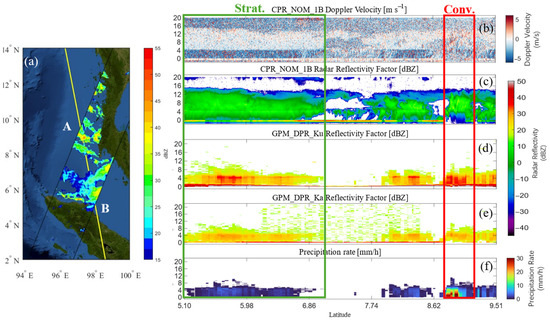
Figure 8.
EarthCARE 01367A track Level 1 product and GPM overlapping track product map for 24 August 2024. (a) The yellow line represents the EarthCARE track, and the black line indicates the GPM vertical maximum Ku-band radar reflectance factor. Points A and B are the intersection points of the EarthCARE and GPM tracks on the outer side. (b–f) are the profiles of the uncorrected Doppler velocity (a), radar reflectance factor (c), DPR Ku-band uncorrected radar reflectance factor (d), DPR Ka-band uncorrected radar reflectance factor (e), and GPM precipitation rate (f) within the AB region in (a). The green box on the left shows the observed layered precipitation event, and the red box on the right shows the observed strong convective event.
Within the region outlined by the green box in Figure 8 (5.1° N–7.0° N), stratiform precipitation is the dominant feature. CPR observations indicate smooth and homogeneous radar reflectivity profiles, accompanied by near-zero Doppler velocities, consistent with the characteristics of stratiform systems. A distinct horizontal bright band is observed near 4 km altitude, attributable to enhanced radar backscattering from melting hydrometeors within the melting layer. At this altitude, W-band reflectivity peaks at approximately 15 dBZ, while Ka-band and Ku-band reflectivities reach 30 dBZ and 40 dBZ, respectively. Below the 4 km level, differential attenuation becomes apparent: the W-band reflectivity declines significantly to about 0 dBZ due to strong signal attenuation from precipitation. The Ku band demonstrated better precipitation detection capabilities, with higher radar reflectivity and contrast in precipitation areas below the melting layer than the Ka band. At the same time, the Ka band and Ku band are almost unaffected by the attenuation effect of layered precipitation with no attenuation, corresponding to a precipitation rate of approximately 3 mm h−1 [11].
In the region enclosed by the red box (8.7° N–9.1° N), intense convective precipitation dominates. The W-band radar detects echo tops reaching up to 12 km, with radial Doppler velocities exceeding 5 m s−1, indicative of vigorous convective updrafts. However, the W-band reflectivity experiences a sharp decrease below 4 km and even shows data voids, which are attributed to severe attenuation by heavy precipitation. In contrast, Ku-band reflectivity in this region exceeds 40 dBZ, corresponding to intense precipitation rates above 30 mm h−1. The vertical distribution of reflectivity reveals a clear pattern of wavelength-dependent attenuation: the W-band, as the shortest wavelength, undergoes the most substantial attenuation, exhibiting a reflectivity difference of up to 50 dBZ between upper and lower levels. The Ka-band shows moderate attenuation, with a reflectivity difference of approximately 15 dBZ, while the Ku-band, having the longest wavelength, remains largely unaffected.
4.2. Two Layers of Clouds in Different Phases
On 17 March 2025, ESA officially released the EarthCARE Level 2 products. To investigate the microphysical interactions between cloud layers, we performed a spatiotemporal matching between the newly released Level 2 products and GPM observations, aiming to identify cases of upper-level ice clouds overlying lower-level water clouds. This analysis was designed to elucidate the influence of ice crystal sedimentation from ice clouds into underlying water clouds on the development of precipitation processes.
On 22 March 2025, a heavy precipitation event was observed over the waters surrounding Indonesia, captured simultaneously by both the GPM and EarthCARE missions. Figure 9 displays the collocated orbital tracks and measurements from the EarthCARE Level 2 and GPM datasets. The red box on the left delineates a region of ice-phase precipitation, while the blue box on the right indicates a region characterized by liquid-phase precipitation.
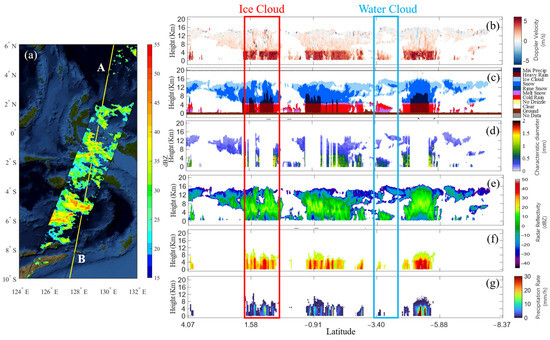
Figure 9.
EarthCARE 04625E track secondary product and GPM overlapping track product map for 22 March 2025. (a) The yellow line is the EarthCARE trajectory, and the black line indicates the GPM vertical maximum Ka-band radar reflectance factor. Points A and B are the intersection points of the EarthCARE and GPM tracks on the outer side. (b–g) are cross-section plots of EarthCARE and GPM products within the AB region in (a). (b) shows EarthCARE corrected Doppler velocity (CPR-CD), (c) is the EarthCARE CPR target classification (AC-TC), (d) is the EarthCARE mean-mass-weighted melted diameter (CPR-CLD), (e) shows EarthCARE W-band corrected radar reflectance factor (CPR-FMR), (f) shows GPM Ka-band corrected radar reflectance factor (2A-DPR), and (g) is the GPM DPR precipitation rate product (2A-DPR) profile. The red box on the left shows the observed ice cloud precipitation event, and the blue box on the right shows the observed water cloud precipitation event.
Within the ice-phase precipitation event, cloud top altitudes reach approximately 16 km. Snowflakes originating from condensational growth in the upper troposphere descend with fall speeds near 2 m s−1. In this region, radar reflectivity and Doppler radial velocity measurements are significantly enhanced compared to those typically observed in pure ice cloud regimes. At around 4 km altitude, the snowflakes undergo melting, transitioning into raindrops and producing a pronounced reflectivity maximum [24]. These raindrops exhibit fall velocities around 5 m s−1 and mean-mass-weighted melted diameter of roughly 1 mm—both significantly greater than those of the snowflakes aloft. Mixed-phase precipitation is observed above the melting layer (highlighted in dark red in Figure 9d), and its occurrence is positively correlated with increased precipitation rates. The Ka-band radar reflectivity in this region exceeding 40 dBZ in Figure 9f also confirms this.
In contrast, the liquid-phase precipitation event, indicated by the blue box, exhibits considerably lower precipitation intensities. This reduced rainfall is primarily attributed to weaker convective activity, as evidenced by cloud tops that rise only to approximately 3 km. The latent heat released during condensation, although present, is insufficient to support the formation of large amounts of cloud water [25]. As shown in Figure 9b, a clear discontinuity exists between the upper-level ice clouds and the lower-level water clouds, suggesting that ice crystals from the upper layers have not descended into the lower cloud layers, thereby failing to trigger the Bergeron process. This is one of the reasons for the low precipitation efficiency of water clouds [26]. Figure 9f further supports this observation: Ka-band radar reflectivity shows strong echoes from ice cloud precipitation, while echoes from water clouds remain weak. In the ice cloud region, reflectivity increases from 10 dBZ at 8 km to 40 dBZ at 4 km altitude, whereas in the water cloud region, it remains below 25 dBZ throughout. Moreover, Figure 9e,f indicates that the W band exhibits stronger sensitivity to water clouds than the Ka band, highlighting its superior detection capability in such environments.
4.3. Snowfall and Rainfall
On 19 March 2025, a precipitation event over the Andes Mountains in Peru was concurrently observed by both the EarthCARE and GPM satellites. Figure 10 presents the collocated orbital products from the two missions. As illustrated in Figure 10a, the observed precipitation spans a range of topographical features, including plateaus, mountainous regions, and lowland plains. The blue box highlights the region of snowfall over the high-altitude plateau, while the black box indicates the area of rainfall across the mountainous and plain regions. The plateau’s average elevation of approximately 4 km aligns closely with the atmospheric melting layer, resulting in a predominance of snowfall within this zone.
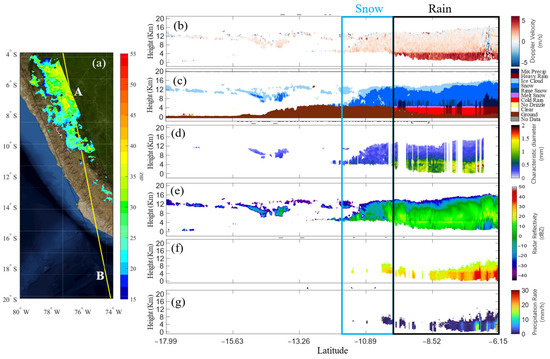
Figure 10.
EarthCARE 04580A track secondary product and GPM overlapping track product map for 19 March 2025. (a) The yellow line is the EarthCARE track, and the black line indicates the GPM vertical maximum Ka-band radar reflectance factor. Points A and B are the intersection points of the EarthCARE and GPM tracks on the outer side. (b–g) are cross-section plots of EarthCARE and GPM products within the AB region in (a). (b) shows EarthCARE corrected Doppler velocity (CPR-CD), (c) is the EarthCARE CPR target classification (AC-TC), (d) is the EarthCARE mean-mass-weighted melted diameter (CPR-CLD), (e) shows EarthCARE W-band corrected radar reflectance factor (CPR-FMR), (f) shows GPM Ka-band corrected radar reflectance factor (2A-DPR), and (g) is the GPM DPR precipitation rate product (2A-DPR) profile. The blue box on the left shows the observed snowfall event, and the black box on the right shows the observed rainfall event.
Within the snowfall region, the observations reveal relatively uniform Doppler velocities (~1 m s−1) and mean-mass-weighted melted diameter (~0.5 mm), as can be seen from Figure 10b,e. Radar reflectivity factors for the W-band radar remain below 0 dBZ, while the Ka-band radar fails to detect significant backscatter from snow particles. This underscores the distinct advantage of the W-band radar in detecting snowfall, effectively compensating for the limitations of the Ku- and Ka-band radars in such conditions [27].
In the lower-altitude regions, snowflakes melt as they descend through the 4 km melting layer, transitioning into raindrops. This phase transition is associated with an increase in mean-mass-weighted melted diameter by approximately 0.5–1 mm, leading to higher fall speeds (~5 m s−1) due to increased mass and changes in hydrometeor morphology. The W-band radar displays a clear bright band signature at 4 km altitude; however, it becomes ineffective for rainfall detection below this level due to severe signal attenuation. In contrast, the Ka-band radar demonstrates stronger performance in detecting rainfall below the melting layer.
This case study reinforces the hypothesis that the synergistic integration of tripe-frequency radar observations (W-, Ka-, and Ku-band) combined with Doppler velocity data enables robust and comprehensive detection of diverse precipitation types, including snowfall, light rain, and heavy rain. The use of integrated observations enhances both the continuity and accuracy of precipitation measurements, offering vital insights into cloud microphysics and advancing the understanding of precipitation formation mechanisms [28].
5. Discussion
With the stable and long-term operation of EarthCARE and GPM, the novel spaceborne “pseudo tripe-frequency” radar coincidence dataset enables the observation of a wider range of typical weather events—such as typhoons and intense convective systems—and allows for the retrieval of their complete cloud and precipitation structures.
On one hand, the inclusion of radial velocity in satellite-based tripe-frequency radar retrieval algorithms facilitates advancements in applications such as cloud water content estimation [9] and hydrometeor classification [29]. On the other hand, the synergy between EarthCARE and GPM observational components offers a high-resolution and reliable framework for advanci1ng research into cloud–aerosol–precipitation interaction mechanisms. Notably, radial velocity is particularly crucial for capturing the dynamics of convective systems, where accurate observation of cloud microphysics is essential for understanding these complex interactions.
In addition to this dataset, there are other data products, such as ATLID and MSI products, which will be further matched and analyzed with GPM products to achieve multi-instrument, multi-angle, and comprehensive observation of precipitation.
6. Conclusions
The CPR aboard the EarthCARE satellite has demonstrated groundbreaking capabilities in the global observation of cloud and precipitation vertical dynamic processes, as evidenced by the validation of its first-year observational data. The integration of Doppler velocity measurement represents a significant advancement in spaceborne cloud radar technology, offering enhanced sensitivity (−35 dBZ), improved horizontal resolution (500 m), and high velocity precision (1.3 m per second). These technical improvements have significantly contributed to more accurate cloud classification, refined retrieval of microphysical parameters, and detailed characterization of vertical precipitation dynamics. Furthermore, the synergistic observation framework—integrating CPR with ATLID, MSI, and BBR—provides high-resolution, multi-source data essential for investigating cloud-aerosol-radiation interactions in climate models. This integration addresses the existing observational gap in the quantitative detection of vertical dynamic processes from spaceborne platforms, thereby establishing a critical data foundation for optimizing global climate models and advancing the understanding of extreme weather mechanisms.
This study further introduces a global “pseudo tripe-frequency” radar profile collocation dataset, constructed through the joint utilization of GPM (Ku/Ka-band) and EarthCARE (W-band) satellite observations. This dataset enables in-depth investigation into the multi-frequency response characteristics of cloud and precipitation vertical structures. A comprehensive analysis of 2886 spatiotemporally matched collocation events demonstrates that while Ku/Ka-band radars are effective in capturing larger raindrops and snow particles in their mature stages, the CPR provides superior sensitivity in detecting high-altitude cloud structures. The complementary nature of these observations enables seamless profiling of cloud-precipitation phase transitions.
A statistical analysis of the dataset was conducted to compare the detection differences among the three radar bands. The results indicate that, as precipitation intensifies, the mean low-altitude W-band reflectivity initially increases and then decreases. Under light rain conditions, the peak of the W-band reflectivity probability density distribution is around 10 dBZ, while under heavy rain it shifts to −15 dBZ. An inflection point observed at 14 km corresponds to high-altitude ice clouds detected by the W-band radar, typically located near the tropopause where stable stratification and weak vertical motion lead to the accumulation of ice crystals and the formation of a high-reflectivity layer.
As precipitation increases, the peak value of DFR (Ka–W) rises from approximately 10 dBZ to 20 dBZ, reaching up to 60 dBZ under heavy rain, indicating near-complete attenuation of W-band signals. In typical layered precipitation, near-surface W-band reflectivity drops to 0 dBZ due to attenuation, while the Ku and Ka bands remain relatively stable. However, the Ku band exhibits a more pronounced bright band and higher reflectivity values than the Ka band.
In strong convective regions, the attenuation difference at low altitudes in the W band can reach 50 dBZ, whereas the Ku band shows strong resistance to attenuation, allowing it to detect the full depth of convective clouds. These findings provide insights into the effects of ice–water cloud interactions on precipitation, the differing capabilities of radar systems for detecting snowfall versus rainfall, and the variations in reflectivity and radial velocity characteristics between rain and snow.
Author Contributions
Z.L.: Date curation, formal analysis, visualization, writing—original draft; S.G.: Supervision, project administration; X.H.: Investigation, methodology, writing—review & editing; W.A.: Funding acquisition; J.T.: Validation; J.Q.: Software; S.H.: Resources; X.Z.: Resources; H.W.: Supervision. All authors have read and agreed to the published version of the manuscript.
Funding
This research received no external funding.
Data Availability Statement
The raw data supporting the conclusions of this article will be made available by the authors on request.
Acknowledgments
The authors thank the anonymous reviewers for their constructive comments and suggestions, which have greatly improved this paper.
Conflicts of Interest
The authors declare no conflict of interest.
References
- Illingworth, A.J.; Barker, H.W.; Beljaars, A.; Ceccaldi, M.; Chepfer, H.; Clerbaux, N.; Cole, J.; Delanoë, J.; Domenech, C.; Donovan, D.P.; et al. The EarthCARE Satellite: The next Step Forward in Global Measurements of Clouds, Aerosols, Precipitation, and Radiation. Bull. Am. Meteorol. Soc. 2015, 96, 1311–1332. [Google Scholar] [CrossRef]
- Wehr, T.; Kubota, T.; Tzeremes, G.; Wallace, K.; Nakatsuka, H.; Ohno, Y.; Koopman, R.; Rusli, S.; Kikuchi, M.; Eisinger, M.; et al. The EarthCARE Mission—Science and System Overview. Atmos. Meas. Tech. 2023, 16, 3581–3608. [Google Scholar] [CrossRef]
- Skofronick-Jackson, G.; Petersen, W.A.; Berg, W.; Kidd, C.; Stocker, E.F.; Kirschbaum, D.B.; Kakar, R.; Braun, S.A.; Huffman, G.J.; Iguchi, T.; et al. The Global Precipitation Measurement (GPM) Mission for Science and Society. Bull. Am. Meteorol. Soc. 2017, 98, 1679–1695. [Google Scholar] [CrossRef] [PubMed]
- Hou, A.Y.; Kakar, R.K.; Neeck, S.; Azarbarzin, A.A.; Kummerow, C.D.; Kojima, M.; Oki, R.; Nakamura, K.; Iguchi, T. The Global Precipitation Measurement Mission. Bull. Amer. Meteor. Soc. 2014, 95, 701–722. [Google Scholar] [CrossRef]
- Battaglia, A.; Kollias, P.; Dhillon, R.; Roy, R.; Tanelli, S.; Lamer, K.; Grecu, M.; Lebsock, M.; Watters, D.; Mroz, K.; et al. Spaceborne Cloud and Precipitation Radars: Status, Challenges, and Ways Forward. Rev. Geophys. 2020, 58, e2019RG000686. [Google Scholar] [CrossRef] [PubMed]
- Berg, W.; L’Ecuyer, T.; Haynes, J.M. The Distribution of Rainfall over Oceans from Spaceborne Radars. J. Appl. Meteorol. Climatol. 2010, 49, 535–543. [Google Scholar] [CrossRef]
- Tang, G.; Wen, Y.; Gao, J.; Long, D.; Ma, Y.; Wan, W.; Hong, Y. Similarities and Differences between Three Coexisting Spaceborne Radars in Global Rainfall and Snowfall Estimation. Water Resour. Res. 2017, 53, 3835–3853. [Google Scholar] [CrossRef]
- Hayden, L.; Liu, C. A Multiyear Analysis of Global Precipitation Combining CloudSat and GPM Precipitation Retrievals. J. Hydrometeorol. 2018, 19, 1935–1952. [Google Scholar] [CrossRef]
- Gorgucci, E.; Baldini, L.; Adirosi, E.; Montopoli, M. Ice Water Content Assessment in the Single-, Dual-, and Triple-Frequency Radar Scenarios. Remote Sens. Environ. 2021, 254, 112242. [Google Scholar] [CrossRef]
- Turk, F.J.; Ringerud, S.E.; Camplani, A.; Casella, D.; Chase, R.J.; Ebtehaj, A.; Gong, J.; Kulie, M.; Liu, G.; Milani, L.; et al. Applications of a CloudSat-TRMM and CloudSat-GPM Satellite Coincidence Dataset. Remote Sens. 2021, 13, 2264. [Google Scholar] [CrossRef]
- Liang, Y.; Kou, L.; Huang, A.; Gao, H.; Lin, Z.; Xie, Y.; Zhang, L. Comparison and Synthesis of Precipitation Data from CloudSat CPR and GPM KaPR. Remote Sens. 2024, 16, 745. [Google Scholar] [CrossRef]
- Chase, R.J.; Dolan, B.; Rasmussen, K.L.; Schulte, R.M.; Stephens, G.; Turk, F.J.; Van Den Heever, S.C. A Multifrequency Spaceborne Radar Perspective of Deep Convection. J. Appl. Meteorol. Climatol. 2025, 64, 133–145. [Google Scholar] [CrossRef]
- Awaka, J.; Le, M.; Brodzik, S.; Kubota, T.; Masaki, T.; Chandrasekar, V.; Iguchi, T. Development of Precipitation Type Classification Algorithms for a Full Scan Mode of GPM Dual-Frequency Precipitation Radar. J. Meteorol. Soc. Jpn. 2021, 99, 1253–1270. [Google Scholar] [CrossRef]
- Hu, X.; Ai, W.; Qiao, J.; Hu, S.; Han, D.; Yan, W. Microphysics of Summer Precipitation over Yangtze-huai River Valley Region in China Revealed by GPM DPR Observation. Earth Space Sci. 2022, 9, e2021EA002021. [Google Scholar] [CrossRef]
- Hu, X.; Ai, W.; Qiao, J.; Yan, W. Insight into Global Climatology of Melting Layer: Latitudinal Dependence and Orographic Relief. Theor. Appl. Clim. 2024, 155, 4863–4873. [Google Scholar] [CrossRef]
- Huang, H.; Zhao, K.; Fu, P.; Chen, H.; Chen, G.; Zhang, Y. Validation of Precipitation Measurements from the Dual-Frequency Precipitation Radar Onboard the GPM Core Observatory Using a Polarimetric Radar in South China. IEEE Trans. Geosci. Remote Sens. 2022, 60, 1–16. [Google Scholar] [CrossRef]
- Wang, Z.; Hu, X.; Ai, W.; Qiao, J.; Zhao, X. Microphysical Characteristics of Monsoon Precipitation over Yangtze-and-Huai River Basin and South China: A Comparative Study from GPM DPR Observation. Remote Sens. 2024, 16, 3433. [Google Scholar] [CrossRef]
- Eisinger, M.; Marnas, F.; Wallace, K.; Kubota, T.; Tomiyama, N.; Ohno, Y.; Tanaka, T.; Tomita, E.; Wehr, T.; Bernaerts, D. The EarthCARE Mission: Science Data Processing Chain Overview. Atmos. Meas. Tech. 2024, 17, 839–862. [Google Scholar] [CrossRef]
- Matrosov, S.Y. A Dual-Wavelength Radar Method to Measure Snowfall Rate. J. Appl. Meteor. 1998, 37, 1510–1521. [Google Scholar] [CrossRef]
- Sassen, K.; Liao, L. Estimation of Cloud Content by W-Band Radar. J. Appl. Meteor. 1996, 35, 932–938. [Google Scholar] [CrossRef][Green Version]
- Matrosov, S.Y.; Heymsfield, A.J.; Wang, Z. Dual-frequency Radar Ratio of Nonspherical Atmospheric Hydrometeors. Geophys. Res. Lett. 2005, 32, L13816. [Google Scholar] [CrossRef]
- Kirsch, B.; Clemens, M.; Ament, F. Stratiform and Convective Radar Reflectivity–Rain Rate Relationships and Their Potential to Improve Radar Rainfall Estimates. J. Appl. Meteorol. Climatol. 2019, 58, 2259–2271. [Google Scholar] [CrossRef]
- Grasmick, C.; Geerts, B.; French, J.R.; Haimov, S.; Rauber, R.M. Estimating Microphysics Properties in Ice-Dominated Clouds from Airborne Ka-W-Band Dual-Wavelength Ratio Reflectivity Factor in Close Proximity to in Situ Probes. J. Atmos. Ocean. Technol. 2022, 39, 1815–1833. [Google Scholar] [CrossRef]
- Allabakash, S.; Lim, S.; Jang, B.-J. Melting Layer Detection and Characterization Based on Range Height Indicator—Quasi Vertical Profiles. Remote Sens. 2019, 11, 2848. [Google Scholar] [CrossRef]
- Viscardi, L.A.M.; Torri, G.; Adams, D.K.; Barbosa, H.D.M.J. Environmental Controls on Isolated Convection during the Amazonian Wet Season. Atmos. Chem. Phys. 2024, 24, 8529–8548. [Google Scholar] [CrossRef]
- Omanovic, N.; Ferrachat, S.; Fuchs, C.; Henneberger, J.; Miller, A.J.; Ohneiser, K.; Ramelli, F.; Seifert, P.; Spirig, R.; Zhang, H.; et al. Evaluating the Wegener-Bergeron-Findeisen Process in ICON in Large-Eddy Mode with in Situ Observations from the CLOUDLAB Project. Atmos. Chem. Phys. 2024, 24, 6825–6844. [Google Scholar] [CrossRef]
- Oue, M.; Kollias, P.; Matrosov, S.Y.; Battaglia, A.; Ryzhkov, A.V. Analysis of the Microphysical Properties of Snowfall Using Scanning Polarimetric and Vertically Pointing Multi-Frequency Doppler Radars. Atmos. Meas. Tech. 2021, 14, 4893–4913. [Google Scholar] [CrossRef]
- Velázquez Blázquez, A.; Domenech, C.; Baudrez, E.; Clerbaux, N.; Salas Molar, C.; Madenach, N. Retrieval of Top-of-Atmosphere Fluxes from Combined EarthCARE Lidar, Imager, and Broadband Radiometer Observations: The BMA-FLX Product. Atmos. Meas. Tech. 2024, 17, 7007–7026. [Google Scholar] [CrossRef]
- Jun-qi, Q.; Wei-hua, A.; Xiong, H.; Shen-sen, H.; Wei, Y. A Recognition Method of Hydrometeor in Tropical Cyclones by Using the GPM Dual-frequency Precipitation Radar. J. Trop. Meteorol. 2020, 26, 161–168. [Google Scholar] [CrossRef]
Disclaimer/Publisher’s Note: The statements, opinions and data contained in all publications are solely those of the individual author(s) and contributor(s) and not of MDPI and/or the editor(s). MDPI and/or the editor(s) disclaim responsibility for any injury to people or property resulting from any ideas, methods, instructions or products referred to in the content. |
© 2025 by the authors. Licensee MDPI, Basel, Switzerland. This article is an open access article distributed under the terms and conditions of the Creative Commons Attribution (CC BY) license (https://creativecommons.org/licenses/by/4.0/).