Article

Constructing an Ecological Spatial Network Optimization Framework from the Pattern–Process–Function Perspective: A Case Study in Wuhan

Department of Urban Planning, School of Urban Design, Wuhan University, Wuhan 430072, China
*
Author to whom correspondence should be addressed.
Remote Sens. 2025, 17(15), 2548; https://doi.org/10.3390/rs17152548
Submission received: 19 May 2025 / Revised: 15 July 2025 / Accepted: 21 July 2025 / Published: 22 July 2025
(This article belongs to the Special Issue Application of Remote Sensing in Landscape Ecology)

Abstract

Under the continuous disturbance of ecosystems driven by urbanization, landscape fragmentation and the disruption of ecological processes and functions are key challenges in optimizing ecological networks (EN). This study aims to examine the spatiotemporal evolution of topological patterns, ecological processes, and ecosystem services (ES) in Wuhan from the “pattern–process–function” perspective. To overcome the lag in research concerning the coupling of ecological processes, functions, and spatial patterns, we explore the long-term dynamic evolution of ecosystem structure, process, and function by integrating multi-source data, including remote sensing, enabling comprehensive spatiotemporal analysis from 2000 to 2020. Addressing limitations in current EN optimization approaches, we integrate morphological spatial pattern analysis (MSPA), use circuit theory to identify EN components, and conduct spatial optimization accurately. We further assess the effectiveness of two scenario types: “pattern–function” and “pattern–process”. The results reveal a distinct “increase-then-decrease” trend in EN structural attributes: from 2000 to 2020, source areas declined from 39 (900 km2) to 37 (725 km2), while corridor numbers fluctuated before stabilizing at 89. Ecological processes and functions exhibited phased fluctuations. Among water-related indicators, water conservation (as a core function), and modified normalized difference water index (MNDWI, as a key process) predominantly drive positive correlations under the “pattern–function” and “pattern–process” scenarios, respectively. The “pattern–function” scenario strengthens core area connectivity (24% and 4% slower degradation under targeted/random attacks, respectively), enhancing resistance to general disturbances, whereas the “pattern–process” scenario increases redundancy in edge transition zones (21% slower degradation under targeted attacks), improving resilience to targeted disruptions. This complementary design results in a gradient EN structure characterized by core stability and peripheral resilience. This study pioneers an EN optimization framework that systematically integrates identification, assessment, optimization, and validation into a closed-loop workflow. Notably, it establishes a quantifiable, multi-objective decision basis for EN optimization, offering transferable guidance for green infrastructure planning and ecological restoration from a pattern–process–function perspective.

1. Introduction

With accelerating urbanization and the increasing frequency of extreme climate events, urban ecosystems face intensified disturbances and heightened uncertainty. These stressors contribute to ecological problems such as biodiversity loss, landscape fragmentation, and urban environmental degradation [1]. Ecological spaces are increasingly compromised [2], and ecological processes and services are progressively deteriorating [2]. In response, the Chinese government has implemented ecological redlines and nature reserves, yet these policies often target isolated ecological patches and lack systemic, landscape-scale considerations [3,4]. Consequently, evaluating ecological network (EN) stability and resilience under compound pressures has become a critical issue in contemporary ecological planning [5].
The “pattern–process–function” framework, a core subject in landscape ecology [6], has gained increasing attention for linking spatial patterns and ecological processes with ecosystem service (ES) to support sustainability [7] and resilience [8]. While pattern and function are explicit ecosystem characteristics, the process reveals internal dynamics by connecting the two [9]. Forman’s “patch–corridor–matrix” model [10] evolved into a more mature ecological security framework incorporating “sources–resistance surfaces–corridors–nodes” [11,12]. EN has emerged to address limitations in traditional restoration methods.
Researchers commonly integrate multi-source remote sensing data tools with geographic information technologies to identify ecological sources and construct resistance surfaces [13]. Among these approaches, open-source remote sensing data [14] and indicator calculations performed using the Google Earth Engine platform [15] serve as prevalent data sources in this field. Ecological sources are key habitat patches with critical functions [16], while corridors facilitate ecological flows and are essential for network connectivity [17]. Sources are typically identified through morphological spatial pattern analysis (MSPA) [18], ES function [19], ES value [1], or ecological sensitivity [20]. Resistance surfaces are constructed by weighting natural and anthropogenic factors [21], enabling corridor extraction using circuit theory [14], minimum cumulative resistance (MCR) models [22], or gravity models [23]. In summary, the integrated identification of sources with high conservation value and connectivity, combined with circuit theory to delineate corridors and ecological nodes, has increasingly become a preferred approach [24]. Research traditionally adopts static temporal slices, which fail to capture dynamic interactions between sources and corridors under compound disturbances [25], nor do they reflect species interactions over time [26]. Thus, to promote the scientific management of ecosystems, dynamic EN analysis is crucial [27].
However, existing EN elements often suffer from poor stability [28], structural deficiencies [29], and mismatches between ecological function and structure [30], leading to the omission of critical nodes and suboptimal overall performance of EN [31]. Therefore, there is an urgent need to explore appropriate methods for EN optimization to achieve a comprehensive balance among multiple objectives [32]. In the early stages of EN optimization research, the primary focus was on biodiversity conservation. This later evolved to emphasize structural optimization and functional enhancement [33]. With theoretical and methodological advancements, complex network theory has been widely applied in ecological studies, giving rise to optimization techniques such as edge deletion, edge addition, edge reconnection, and edge orienting to improve network topology [34]. In EN applications, sources and corridors are typically represented as network nodes and edges, respectively [35]. The resulting network topological characteristics are often associated with ES [36]. Common optimization approaches include adding ecological patches or corridors based on complex network theory to achieve balanced EN configurations [29]. For instance, An et al. enhanced EN structure through steppingstone addition [37].
Current EN optimization frequently relies on simplistic criteria for determining element location and quantity, often based on historical experience or incomplete quantitative assessments. Many decision-making processes consider only isolated correlations between individual ES and landscape patterns, lacking comprehensive characterization of systemic inter-indicator correlations, which may introduce contingency in outcomes [38]. Notably, while EN optimization research acknowledges pattern–function correlation, practical applications often neglect ecological processes due to operational challenges [39], with few attempts to address this gap [40]. To address this limitation, our study introduces static proxies representing ecological processes into EN optimization, balancing operational feasibility with long-term ecological representativeness. This approach compensates for previous oversights and provides a practical perspective for “pattern–process–function” analysis [39,41]. Post-optimization evaluations remain scarce [33], lacking stability evaluations under dynamic disturbances. For urban–ecological coupled systems with high environmental sensitivity, there is a pressing need to enhance EN robustness against external perturbations [3].
Wuhan, a major transportation hub in China, is richly endowed with abundant lakes, wetlands, and forests [20]. Known as the “City of a Thousand Lakes,” it is also the world’s first international wetland city with a population exceeding 10 million. However, like other major urban centers in developing countries, Wuhan has experienced dramatic landscape transformations through urban sprawl and infrastructure expansion [42]. This complex hydro-ecological network exhibits high sensitivity, leading to fragmented corridors and disrupted ecological flows. Existing ecological assets lack integration, compromising regional ecological security and system stability. By targeting such a compound urban–water ecological system, this study addresses a key research gap and offers valuable insights for other cities with similar hybrid landscape features.
This study advances EN optimization through a pattern–process–function lens, addressing gaps in prior research that predominantly focused on subjective experience or incomplete quantitative judgment. Key goals include the following: (1) characterizing spatiotemporal dynamics of Wuhan’s EN, ecological functions, and processes (2000–2020) to resolve the prevalent neglect of temporal coupling in existing studies; (2) proposing multi-indicator-driven optimization schemes that synergistically enhance ecological functions and processes through pattern–function and pattern–process linkages; and (3) introducing robustness testing to quantitatively evaluate strategy-specific stability and resilience—a response to the widespread lack of post-optimization validation. The proposed index system captures long-term system responses to disturbances, strengthening theoretical foundations for EN patch selection. By establishing a closed-loop identification–assessment–optimization–validation pathway, this work elucidates EN topology’s coevolution with multifunctional ecological outcomes, offering actionable insights for ecosystem management.

2. Materials and Methods

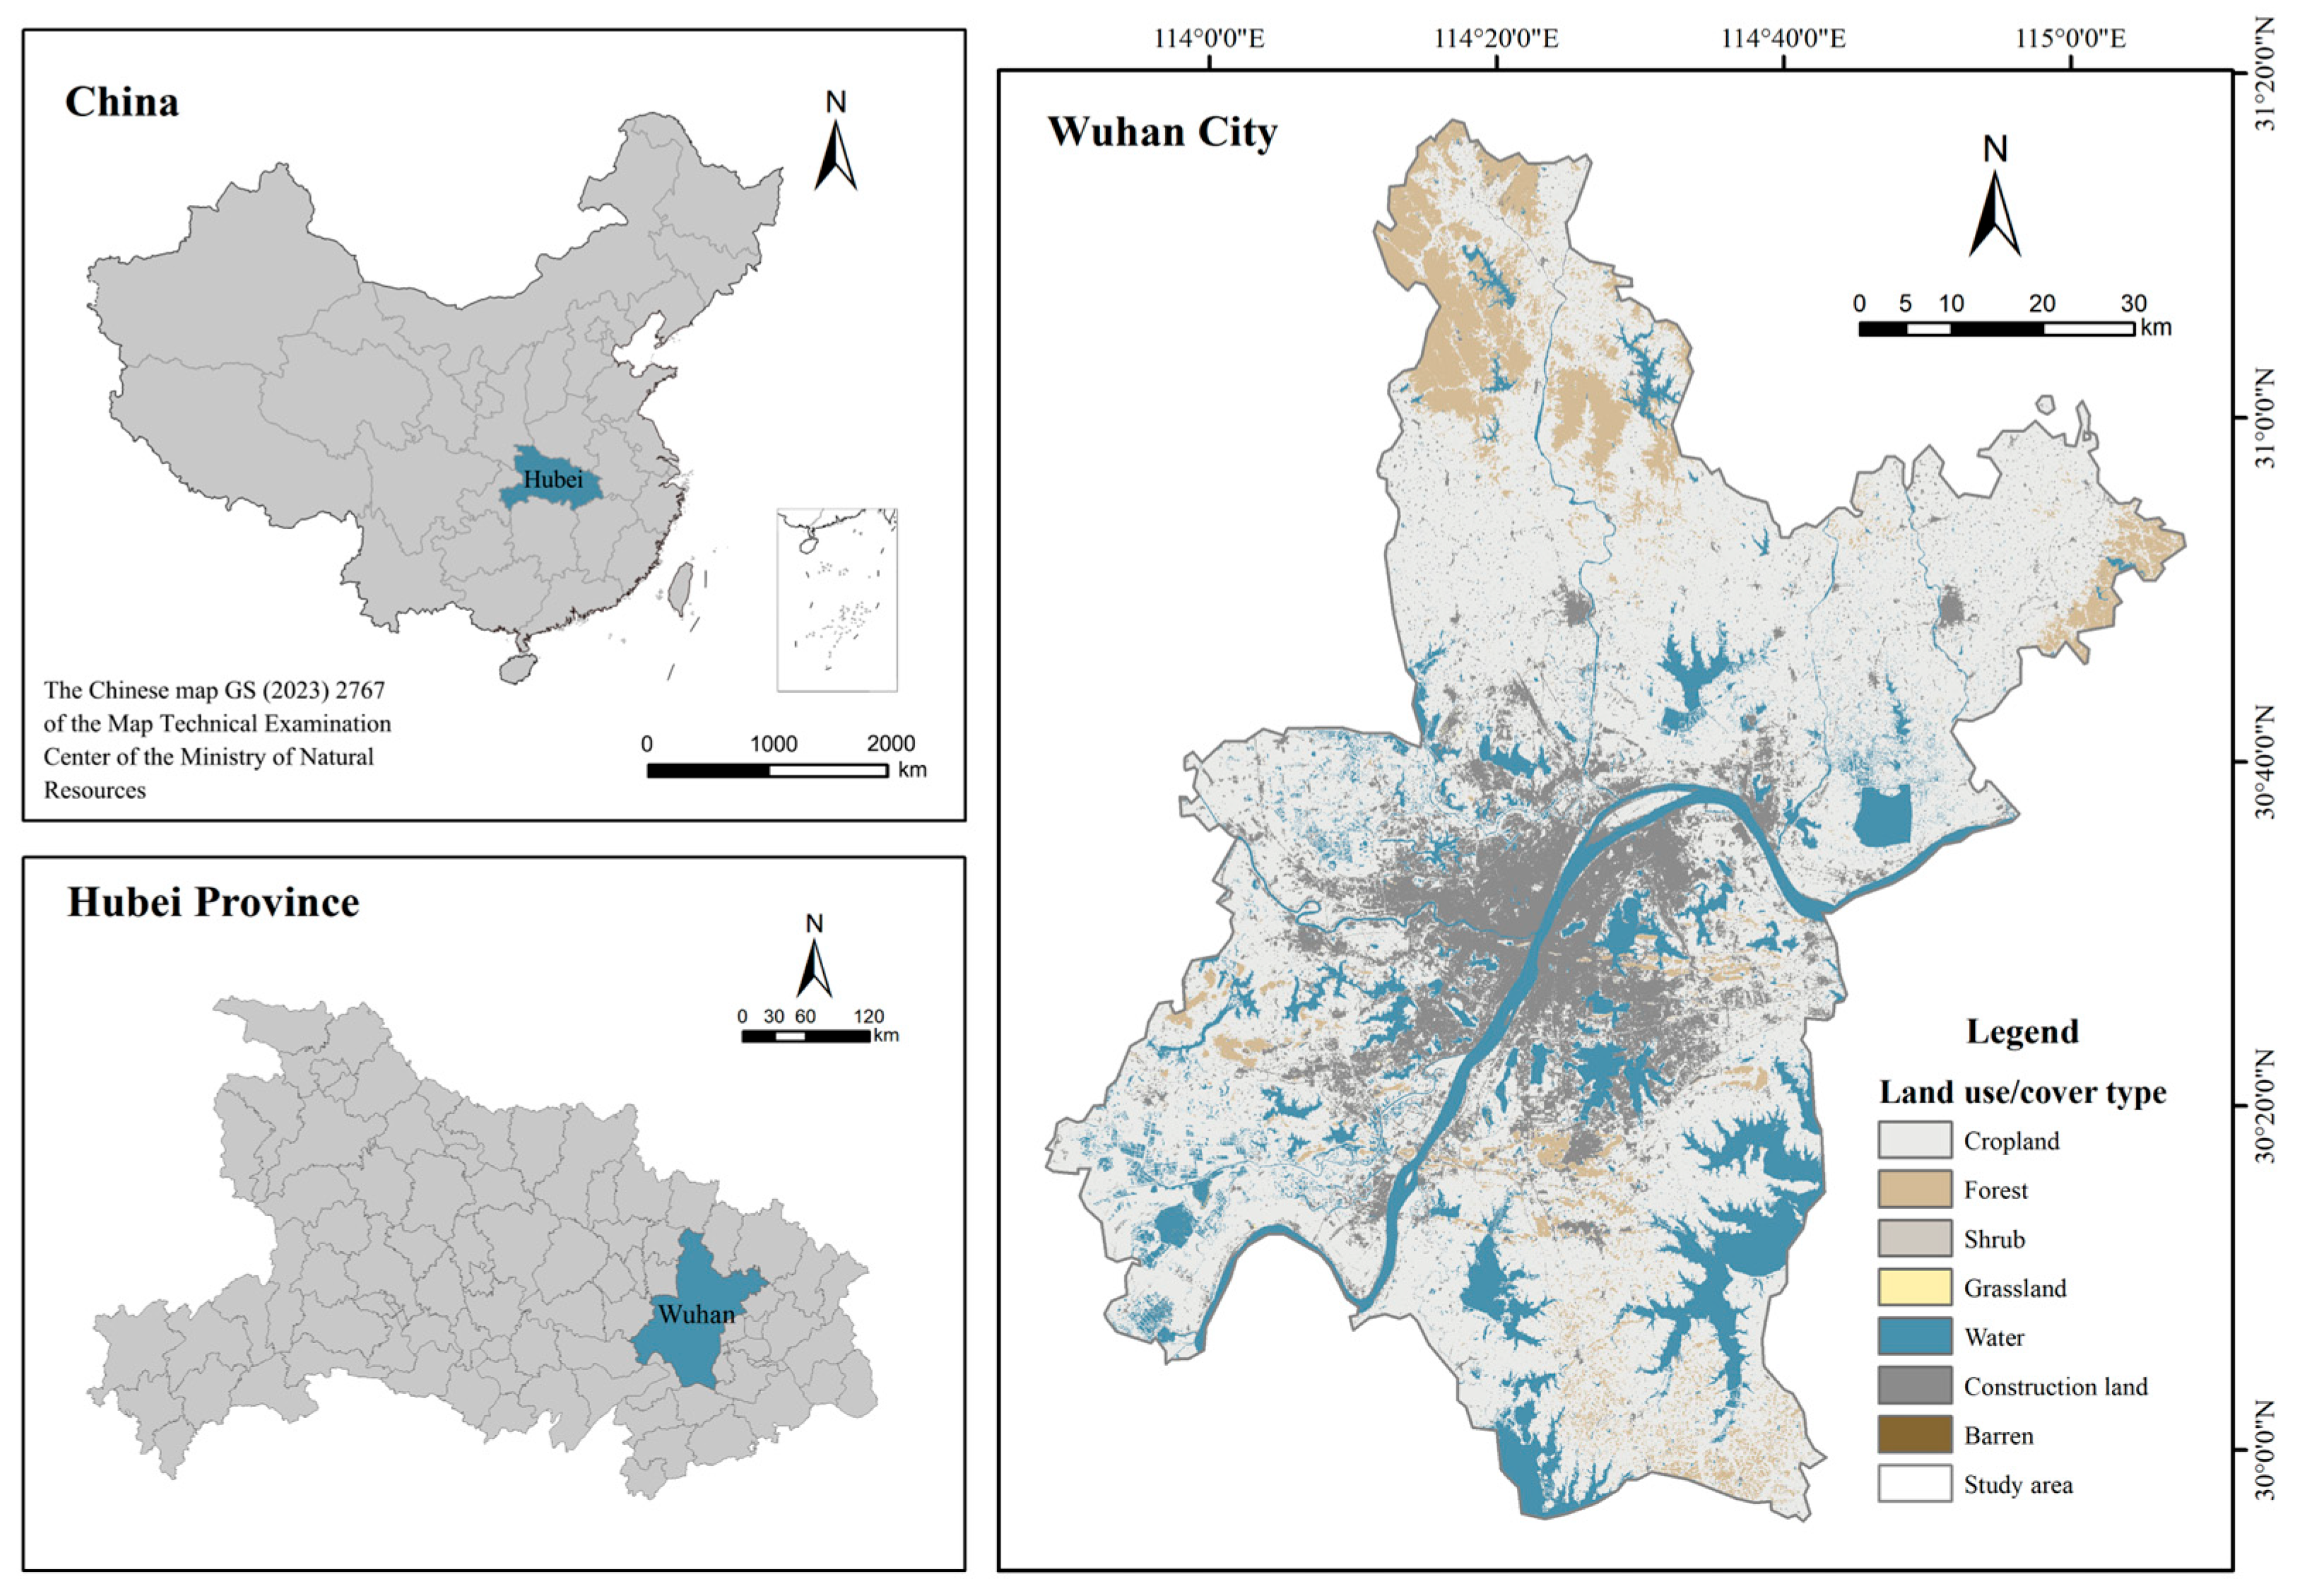
2.1. Study Area and Data Sources

Wuhan, the capital of Hubei Province and a central city in China, is the largest international wetland city in the country, covering approximately 8569.15 km2 (Figure 1). Located in the core region of the Yangtze River Economic Belt, Wuhan serves as a critical corridor linking eastern and western China and bridging the north–south axis. The city’s dense water network and rich ecological foundation endow it with significant ecological advantages. However, rapid urban expansion and climate change have led to intensified landscape fragmentation [43], undermining the ecological infrastructure essential for human well-being [44]. This has resulted in decreased ecological functionality, dramatic reductions in wetland and lake areas, and biodiversity loss [45]. Thus, it is of urgent practical significance to explore pathways for optimizing ecological spatial governance based on cutting-edge theories in landscape ecology.
This study constructs and evaluates an EN using multi-source data (Table 1), including land use, meteorological, soil, vegetation, topographic, and socio-economic information. These data support calculations of ES dynamics and ecological sensitivity. The study spans five temporal snapshots from 2000 to 2020, with all raster data standardized to a 30 m spatial resolution using ArcGIS.

2.2. Methods Framework

This study establishes an EN optimization framework from the perspective of pattern, process, and function, covering the full cycle of identification, assessment, optimization, and validation (Figure 2). The framework is grounded in the integrated theoretical foundation of ecosystem service, landscape ecological health (LEH), and complex network theory.
(1)
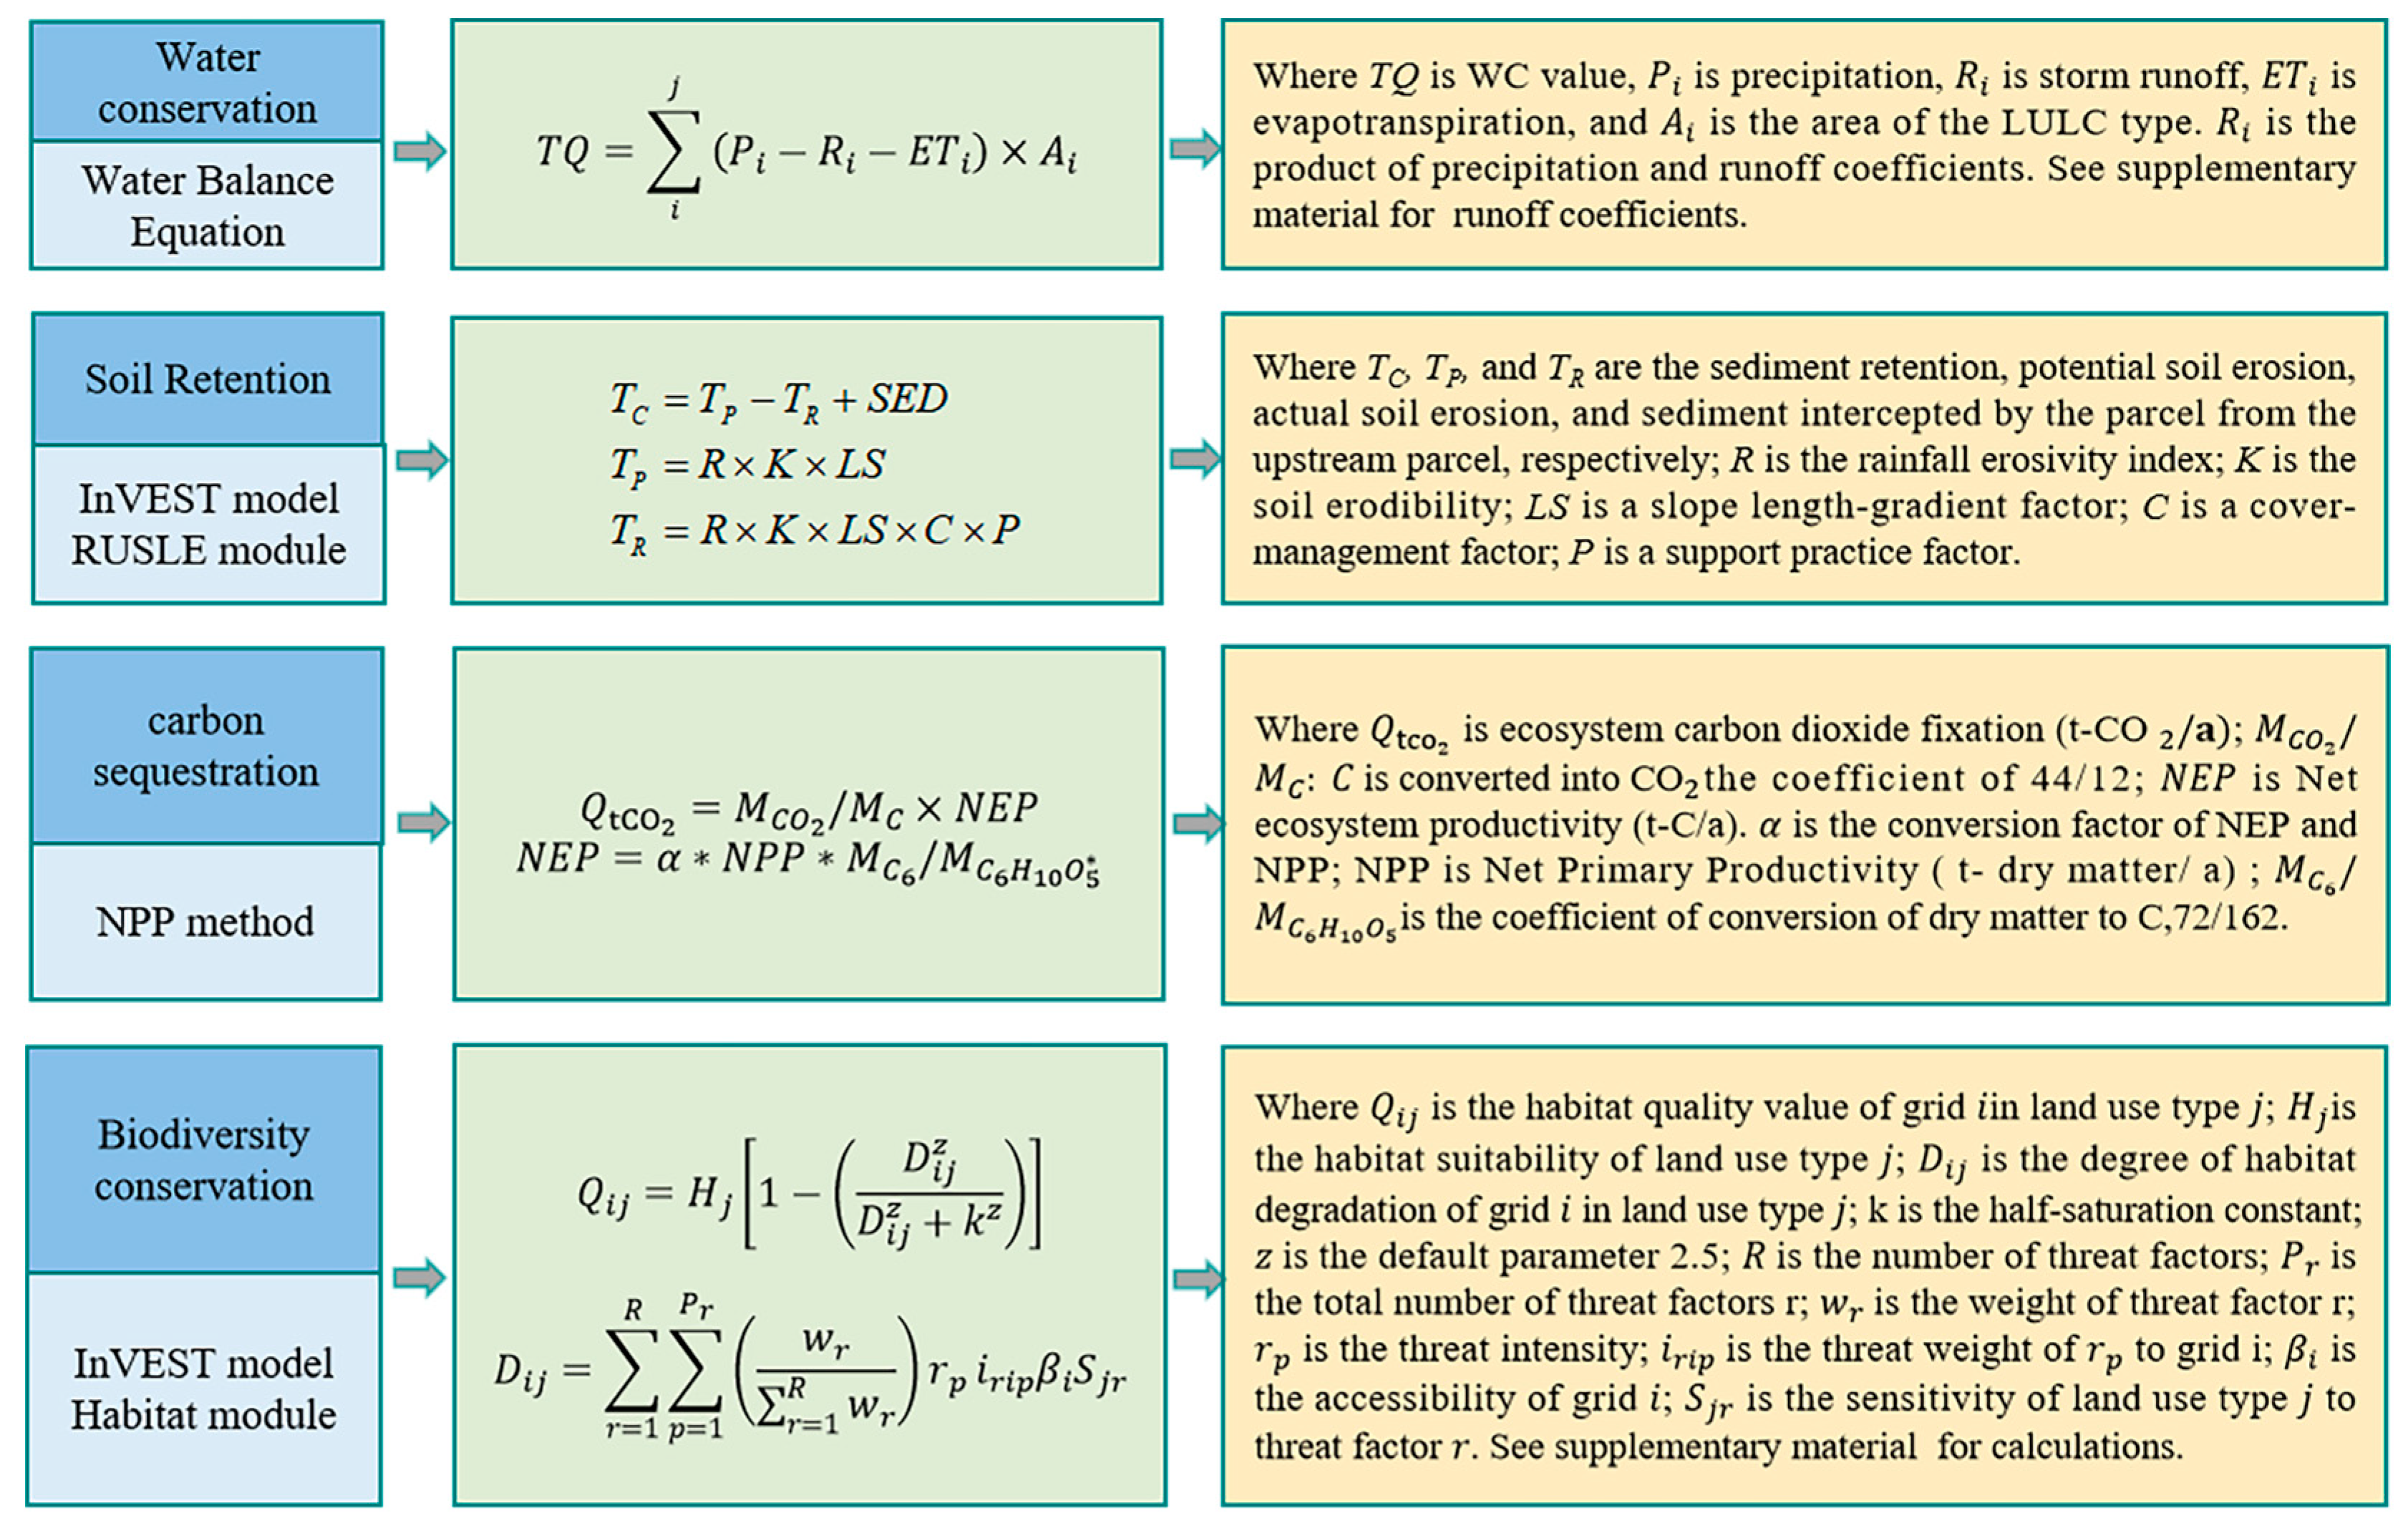
According to ecosystem service theory, ecological functions include regulatory, supporting, and provisioning services [46]. In this study, four typical ecosystem services—habitat quality (HQ), water conservation (WC), soil retention (SR), and carbon sequestration (CS)—are selected to represent functional outcomes, reflecting the service capacity of ecological patches. HQ indicates habitat stability and integrity, WC reflects hydrological regulation capacity, which is especially important in lake-dense urban areas [47], and SR and CS capture soil and carbon regulation capacities in response to environmental pressure [48].
(2)
According to the LEH framework, process evaluation should capture system vigor, resilience, and sensitivity [34]. Accordingly, process indicators include NDVI (plant vigor), modified normalized difference water index (MNDWI, water dynamics), an eco-elasticity index (comprising resistance, adaptation, and recovery), and ecological sensitivity (represented by soil erosion). These indicators capture the spatiotemporal dynamics and adaptive capacity of the urban ecological system under disturbance. MNDWI is chosen to emphasize the urban hydrological dynamics relevant to Wuhan’s landscape, especially for distinguishing surface water changes where NDVI is limited [49]. The resilience and sensitivity indices reflect the system’s response thresholds and recovery capabilities [50].
(3)
From the pattern dimension, based on complex network theory, EN structure is described through four topological indicators: degree centrality, betweenness centrality, closeness centrality, and clustering coefficient. These reflect connectivity, nodal importance, accessibility, and local structural aggregation [33,51], allowing quantitative assessment of network configuration.
From the perspective of pattern (structural topology), process (ecological dynamics), and function (ecosystem services), the framework enables comprehensive EN optimization and patch selection. The combined index system reflects not only the current ecological state but also its long-term capacity for adjustment under disturbances, thereby supporting robust EN patch selection and spatial planning.

2.2.1. Measurement of Ecosystem Services

This study selects four MEA-aligned ES indicators [52]—HQ, WC, SR, and CS—representing core supporting/regulating services. The selection criteria [43,53]: (1) theoretical coverage—spanning structural stability (habitat/water) and process-driven effects (soil/carbon); (2) regional relevance—prioritizing water conservation and habitat quality for Wuhan’s lake-dominated ecosystems. These indicators respond sensitively to eco-space changes. These indicators are calculated using the InVEST model and related approaches (Figure 3, Tables S1–S3).

2.2.2. Assessment of Ecological Process

Three classes of indicators—vigor, elasticity, and sensitivity—are used based on LEH theory [34], three indicators are used to represent ecological processes: the vigor index (NDVI, MNDWI), the eco-elasticity index, and the ecological sensitivity index (soil erosion risk). Calculating details of the indicators are in the Supplementary Materials.
Vigor
NDVI represents vegetation vitality and nutrient cycling under disturbance [39,54]. Given NDVI’s limitations in water detection, MNDWI is added to enhance sensitivity to hydrological dynamics [55]. The combined use of NDVI and MNDWI provides a more comprehensive method for assessing ecological vigor, capturing both vegetation dynamics and water availability [34].
Eco-Elasticity
Eco-elasticity measures an ecosystem’s ability to withstand external disturbances, maintain functionality, and recover. It is evaluated across three dimensions: resistance, adaptability, and restoration capacity, which is also the common 3R resilience assessment framework [56,57]. This index is particularly applicable in urban contexts, where land use changes and landscape dynamics are pronounced.
The eco-elasticity index is calculated as follows:
ER = O × A × R 3 ,
where ER denotes the ecosystem resilience index, and a higher value indicates stronger resilience. The terms O′, A′, and R′ are the normalized values (ranging from 0 to 1) for resistance, adaptability, and recovery, respectively.
Sensitivity
Ecological sensitivity reflects the degree of responsiveness to external environmental changes and is a key measure of landscape stability. Soil erosion risk, highly correlated with ecological sensitivity, captures topographic, climatic, and anthropogenic influences [58], and is widely used in urban landscape health assessments [59].

2.2.3. Construction of Ecological Security Pattern

Ecological Sources
By grading both landscape connectivity and ecological sensitivity into five levels, the upper two levels are overlaid to identify candidate source areas. Referring to previous studies, a minimum patch size of 4 km2 is used [29].
(1)
Landscape Connectivity
Using the MSPA method, forest, shrubland, grassland, wetland, and water are treated as foreground, and other land uses as background. Patches larger than 50 ha in core areas are retained. Connectivity metrics such as Probability of Connectivity (PC) and delta PC (dPC) are calculated using Conefor 2.6 software [60]. A connection threshold of 5000 m and a probability of 0.50 are applied, following existing studies [61].
(2)
Ecological Sensitivity
Given Wuhan’s rapid urbanization, soil erosion and deforestation are key manifestations of ecological vulnerability. Using principles from the national ecological function zoning plan, factors such as land use, elevation, slope, vegetation cover, and erosion risk are evaluated. Weights are determined via the analytic hierarchy process (Table S4), with consistency checks [62]. Results are classified into five sensitivity levels using the Natural Breaks method [63]. The calculation formula is as follows:
E S S i _ = D E M i + S L i + V C i + S E i + L U C C i .
In the formula, ESSi represents the ecological sensitivity of land grid i, while DEMi, SLi, VCi, SEi, and LUCCi represent the elevation, slope, vegetation coverage, soil erosion, and land cover sensitivity of land grid i, respectively.
Ecological Corridors and Key Nodes
Corridors facilitate species migration and gene exchange across habitats, while key nodes at corridor intersections are vital for ecological coordination and ES flow [64].
(1)
Ecological Resistance Surface
Combining Wuhan’s natural features, socio-economic layout, and previous research [44], five factors—land use, elevation, slope, vegetation cover, and distance from primary roads—are selected to construct a resistance surface (Table S5).
(2)
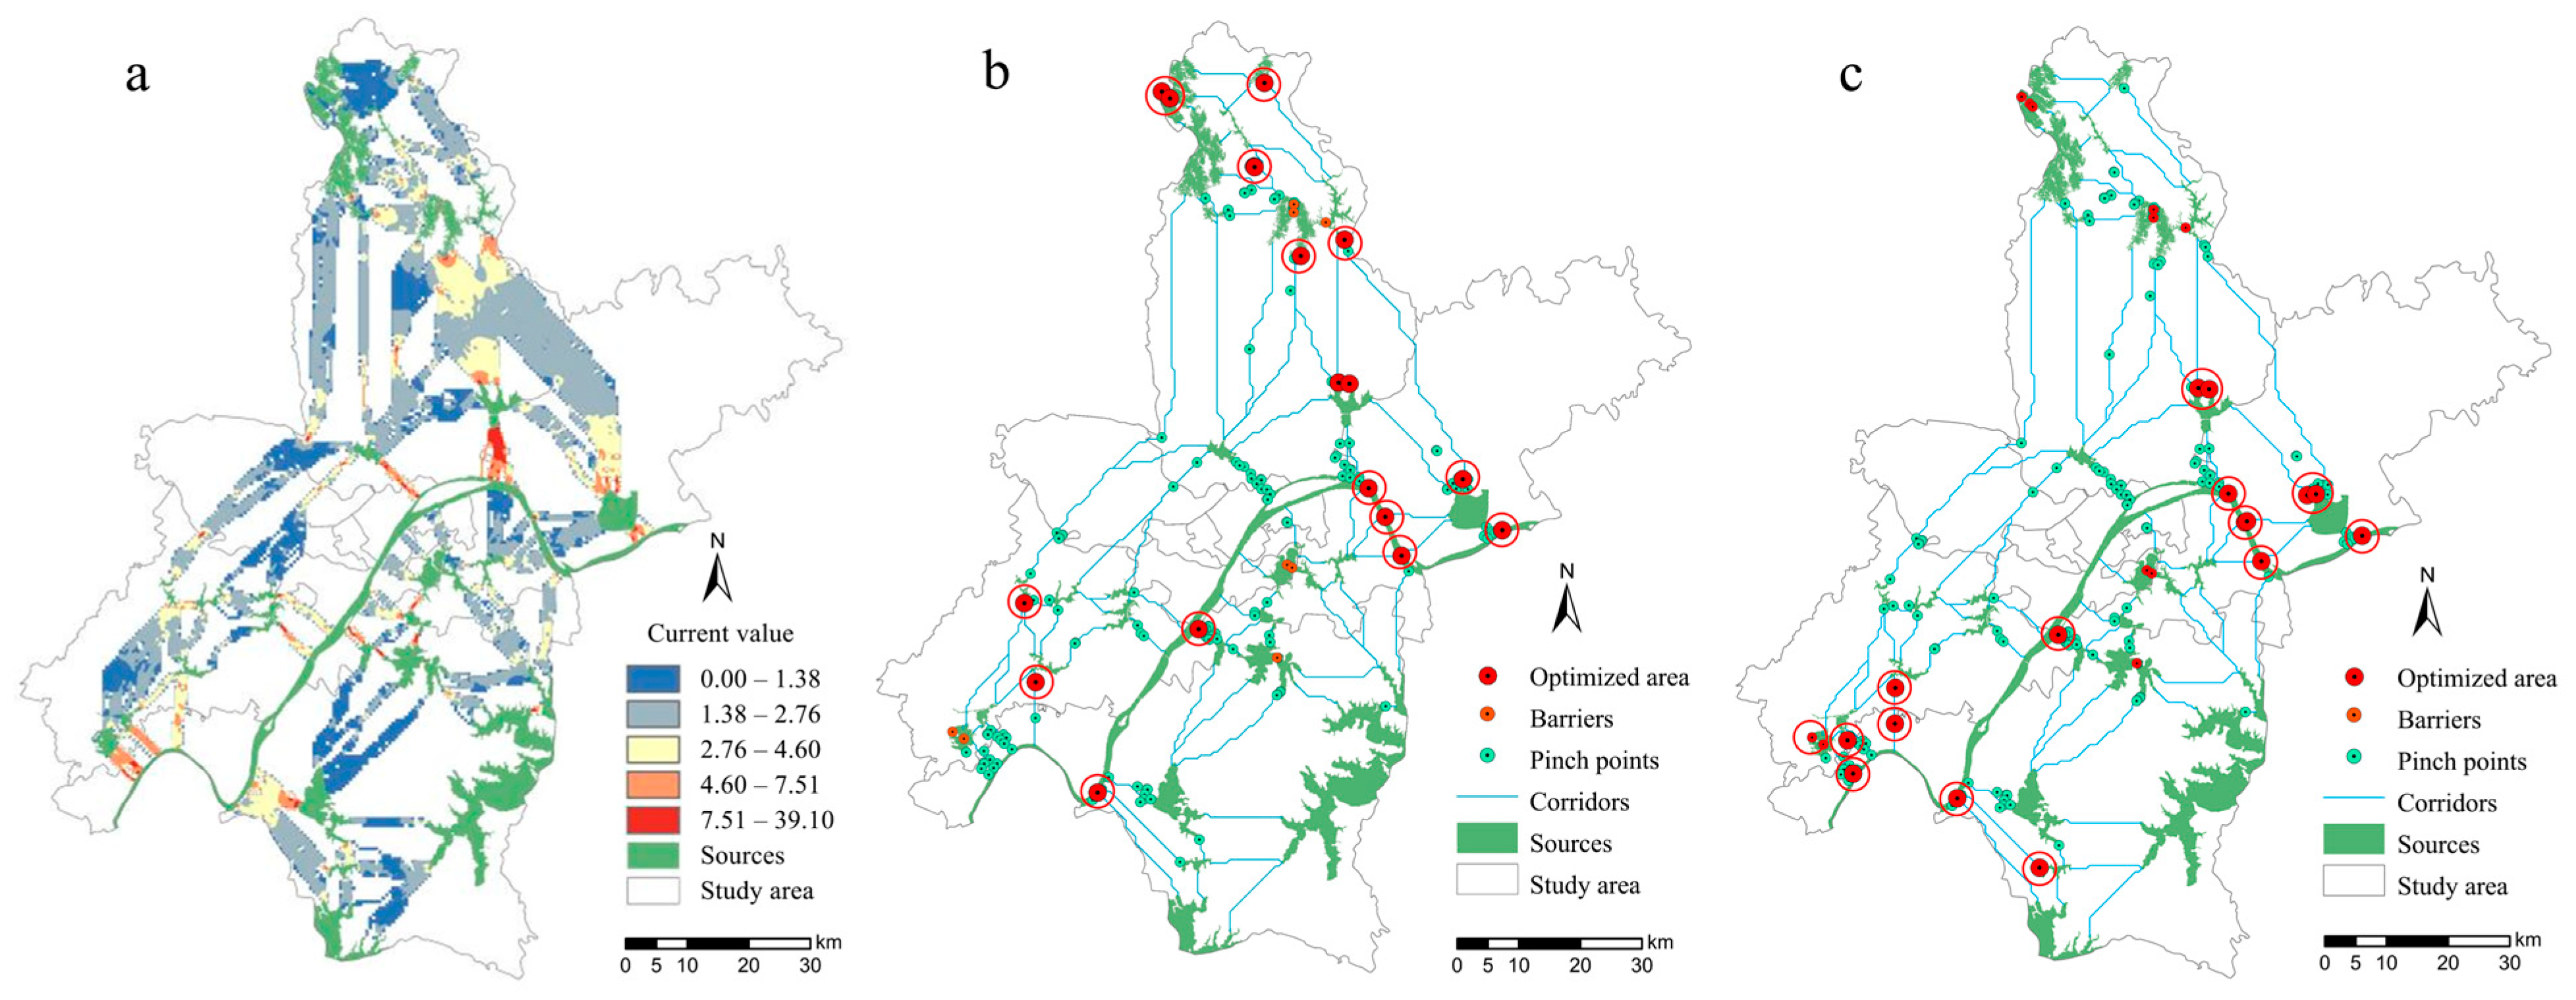
Ecological Corridors, Pinch Points, and Barriers
Circuit theory, which models random walks of electrons, is applied to simulate biological flows in heterogeneous landscapes [65]. High current density zones (pinch points) represent likely species pathways. Linkage Mapper and Pinchpoint Mapper in Circuitscape are used to identify corridors and pinch points. Barrier Mapper is used to extract barriers, or obstructive regions, by measuring the potential connectivity improvement through unit cost-distance adjustments.
Network Topological Pattern
Based on complex network theory, network topological characteristics (NTC) are used to quantitatively describe the EN pattern [33]. Ecological source centroids serve as nodes, while corridors act as edges. Using the Python package NetworkX 3.3, we calculate betweenness centrality, degree centrality, closeness centrality, and clustering coefficient to evaluate nodal importance, reflecting the strength of connections, bridging function, accessibility, and local structural aggregation. Calculation details of the indicators are in the Supplementary Materials.
Degree centrality (DC) measures the extent to which a node is directly connected to other nodes within the ecological network. A node with a higher degree centrality is directly linked to a greater number of other ecological nodes via ecological corridors, implying potentially greater importance in maintaining overall connectivity. Betweenness centrality (BC) quantifies the importance of a node in serving as a “bridge” within the ecological network. A higher value indicates that the node plays a key intermediary role in facilitating the flow of information, materials, or energy across the network. Nodes with high betweenness centrality are often critical for maintaining network-wide connectivity and stability. This metric helps identify ecologically strategic nodes with core regulatory functions. Closeness centrality (CC) reflects the average shortest distance from a node to all other nodes, representing the accessibility of a node within the network. A node with high closeness centrality can quickly establish ecological connections, facilitating efficient flows of information, material, and energy, thereby playing a vital role in ecosystem functioning. This indicator is useful for identifying highly interactive regions and optimizing corridor layouts. Clustering coefficient (AC) describes the tendency of a node’s neighbors to form tightly knit groups, reflecting the compactness of the local network structure. A high clustering coefficient indicates that a node and its neighbors form a relatively independent and stable ecological subsystem.

2.2.4. Optimization and Evaluation of Ecological Network

Network Optimization
EN optimization is not only about spatial restructuring but also enhancing ES and regulating ecological processes [1,66]. Two scenario strategies are proposed: (1) pattern–function optimization (PFO), which focuses on improving structural connectivity and functional coordination; and (2) pattern–process optimization (PPO), which emphasizes the regulation of hydrological and related ecological processes. We first compute average ES and process values within each ecological patch and analyze their Spearman correlations with NTC. Pinch points and barrier areas are selected as optimization targets, and zones with top 10% values in both ES and process needs are prioritized for restoration [67]. Optimization is achieved by edge addition and other enhancement measures.
Evaluation of Optimization Effectiveness
Robustness reflects the ability of an EN to maintain structural integrity and ecological functionality under external disturbances [68]. In this study, we simulate two typical disturbance scenarios—random attacks and targeted attacks—based on two EN optimization strategies. Robustness has been widely used in recent studies as a core metric for assessing the adaptive capacity and risk resistance of ecological networks, particularly under scenarios involving critical node or corridor loss [69,70]. Specifically, connectivity robustness refers to the ability of the EN to preserve its connectivity and ecological flow performance after losing key components [33]. It is commonly evaluated through node-removal experiments simulating network degradation, where random attack deletes nodes arbitrarily and targeted attack removes nodes in descending order of degree. The robustness value (R) is calculated using the equation:
R = C N N r ,
where C represents the number of nodes in the largest connected subgraph after attack, N is the total node count, and Nr is the number of removed nodes. Higher values of R indicate stronger structural persistence and greater disturbance resistance.

3. Results

3.1. Spatiotemporal Patterns of Ecosystem Services

From 2000 to 2020, all services exhibited fluctuations: HQ and WC remained relatively stable overall, with mean values of 0.3969 and 0.5681, respectively, while SR and CS demonstrated moderate growth (Figure 4 and Figure S1). High-value zones for HQ were primarily located in the northern and southwestern parts of Wuhan, with continuous increases over time. In the northern region, complex terrain such as the Mulan Mountain in Huangpi District provides diverse ecological niches, supporting a wide range of species and contributing to the long-term stability of HQ. The southwestern region, characterized by flat terrain and numerous lakes, benefits from a well-coordinated natural EN formed by lakes and farmlands, which promotes continuous improvement in HQ. In contrast, the central urban areas of Wuhan exhibited consistently low HQ due to rapid urbanization, high population density, and extensive land development, which fragmented habitats and weakened ecosystem connectivity; such fragmentation reduces network node redundancy and short-circuits key corridors, thereby lowering overall resilience to disturbances.
SR remained relatively stable with a slight upward trend from 0.0129 to 0.0209. High values clustered along urban fringes and mountainous zones where dense vegetation and stable topography protect the soil. In dense built-up cores, impervious cover weakens SR. CS was relatively low in central Wuhan but higher in peripheral areas, particularly in the north and southeast, where larger natural ecosystems with abundant green vegetation enhanced CS capacity. Temporally, CS exhibited fluctuations, with declines along the urban fringe and noticeable improvements in other regions. These changes were driven by local urban construction activities, ecological protection measures, and climate variations. The urban-fringe decline disrupts gradient continuity, whereas peripheral gains enlarge functional nodes, collectively re-shaping the network’s carbon-processing topology. WC was steady overall yet diverged spatially. Urban edges lost capacity as development sealed surfaces and reduced infiltration, whereas forests and wetlands gained through natural regulation. Central districts, dominated by impervious cover, retained little; the Yangtze corridor displayed unstable patterns, reflecting competing urban expansion and ecological restoration. Instable corridors indicate that the main hydrological axis is still contested, and its final configuration will determine whether the network maintains a longitudinal water-filtration backbone.

3.2. Spatiotemporal Patterns of Landscape Ecological Processes

The study assessed spatiotemporal patterns of ecological processes using vigor (NDVI, MNDWI), eco-elasticity, and ecological sensitivity (soil erosion) index (Figure 5 and Figure S1). The process indicators exhibited phased fluctuation characteristics. Both water and vegetation patterns experienced a significant degradation–recovery trajectory.
2000–2010 saw NDVI and MNDWI decline amid rapid urbanization, farmland expansion, and wetland reclamation, with distinct spatial patterns: central districts lost vegetation due to construction and impervious growth, while peri-urban farmland and drained wetlands shrank water bodies. 2010–2020 brought recovery in both indicators, reflecting ecological restoration policies and better land management; policy-driven efforts reoccupied nodes, rewired links, and restored horizontal connectivity. NDVI showed a stable ring structure with clear gradients—lower in urban cores, higher peripherally—mirroring persistent urban–rural vegetation gradients. By 2020, NDVI had risen sharply from 2000, from 0.0452 to 0.1476, especially in northern and southwestern regions: afforestation and natural regrowth boosted green cover there, while expanded high-NDVI patches enlarged core habitats and strengthened network hierarchy. MNDWI stayed nearly steady with an average value of 0.01735, but spatially imbalanced: central/southern lake/wetland restoration gains offset localized losses from ongoing reclamation and urban water demands. This spatially heterogeneous gain–loss balance signals the network nearing a threshold where positive water connectivity could enhance resilience.
The eco-elasticity index showed a “high-north, low-south” pattern with marked spatial differentiation, with consistently low values in urban cores. This disparity arises because the north’s hilly, forested terrain supports more resilient ecosystems, while the southern plains and urban areas—dominated by built-up land and simplified agriculture—have weaker resilience. From 2000 to 2020, the index declined overall from 0.3966 to 0.3963, reflecting cumulative pressures from urban expansion and intensified land use. However, localized positive changes in northern and southwestern Wuhan indicate ecological restoration mitigated some degradation, forming “resilience hotspots” that can act as nuclei for network-wide recovery. Over time, low-value patches expanded and merged, signaling growing landscape homogenization with reduced resilience which flattens the network’s response diversity, and heightens systemic risk.
Soil erosion remained stable and mostly mild during the study period, with spatially variable risks. Northern hills and low mountains had higher, aggregated risks due to steep slopes, heavy rainfall, and historical deforestation; these clusters can send sediment downstream, threatening network nodes. They expanded from 0.0129 to 0.0215 in 2000–2010 as orchards/roads destabilized slopes but stabilized post-2010 via terracing and vegetation restoration, reducing sediment-driven disconnections and restoring slope-riparian linkages. Flatter, better-vegetated central/southern plains stayed low-risk; built-up zones engineered drainage minimized erosion but spatially disrupted natural hydrology, trading local control for lost hydrological connectivity.

3.3. Spatiotemporal Patterns of Ecological Network and Topology Characteristics

3.3.1. Ecological Network Construction

Ecological sources were delineated by integrating ecological sensitivity evaluation and landscape connectivity. While the overall configuration of sources and corridors remained stable, their quantities exhibited a fluctuating “increase-then-decrease” pattern over time. (Figure 6). Sensitivity showed a “low-center, high-periphery” spatial pattern, with highly sensitive areas concentrated in northern and southern waters and forested zones. Low-sensitivity zones were mainly in the urban core and expanded outward. Between 2005 and 2010, the expansion of low-sensitivity areas was pronounced, followed by a slight rebound in local sensitivity from 2015 to 2020. Mid-sensitivity areas accounted for the largest proportion throughout the study period. The number of final ecological sources increased by 28.2% from 2000 to 2010 and decreased by 27.5% from 2010 to 2020, with the lowest count in 2020. This trend is attributed to the initial increase in conservation efforts followed by urban expansion pressures. Spatially, sources were mostly distributed in Jiangxia and Huangpi districts, extending linearly along the Yangtze River, while the eastern Xinzhou district showed sparse distribution. While the overall spatial structure remained stable, there were local shifts, particularly in Xinzhou and Huangpi.
The resistance surface revealed that high-resistance areas were concentrated in central urban districts (Figure 7). These areas, dominated by construction land and low vegetation cover, formed a radial expansion pattern toward low-resistance zones, mainly located in Huangpi and Xinzhou. From 2000 to 2020, overall resistance values increased significantly, especially in Wuchang South, Hongshan East, and Jiang’an North–Central areas. This increase may mainly be due to urban development and land use changes. The spatiotemporal structure of EN showed a relatively balanced distribution of sources and corridors. While the core EN structure remained stable (Figure 6c4), source area and corridor length initially increased and later decreased. From 2010 to 2020, ecological connectivity weakened, reducing EN integrity and stability. This decline is attributed to increased urbanization and land use changes that disrupted ecological corridors.

3.3.2. Network Topological Characteristics

Four key network topological characteristics were analyzed to reveal the structural evolution of EN. From 2000 to 2020, as the EN underwent structural evolution from expansion to localized degradation, the quantified pattern characteristics (NTC) exhibited moderate fluctuations while maintaining overall stability (Figure 8 and Figure 9). The median degree centrality remained around 0.1 from 2000 to 2020, indicating general structural stability (Figure 8a). However, there were variations in the number of connections per node, reflecting changes in the network’s connectivity over time. For example, in 2010, the degree centrality of some nodes increased significantly due to the establishment of new ecological corridors, which enhanced the network’s connectivity. This increase was primarily observed in the peripheral areas of Wuhan, where conservation efforts led to the creation of new ecological sources and corridors.
Betweenness centrality remained low (<0.1) for most nodes from 2000 to 2020, suggesting that only a few nodes acted as key hubs (Figure 8b). However, there were notable increases in betweenness centrality for some nodes, particularly those located at the intersections of major ecological corridors. For instance, in 2015, a significant increase in betweenness centrality was observed in nodes located along the Yangtze River, reflecting the importance of these areas in maintaining ecological connectivity. This increase was attributed to the implementation of conservation measures that enhanced the functionality of these corridors.
Closeness centrality fluctuated from 2000 to 2020 (median values consistently ranging between 0.3 and 0.4), with a slight increase in recent years (Figure 8c). This improvement in accessibility was primarily due to the optimization of corridor design, which reduced the average shortest path lengths between nodes. For example, in 2020, the closeness centrality of nodes in the central urban areas increased significantly, indicating improved connectivity and accessibility within the network. This change was attributed to the construction of new ecological corridors and the restoration of existing ones, which enhanced the overall efficiency of the ecological network.
The clustering coefficient exhibited minor declines at river junctions from 2000 to 2020 but remained stable overall, with median values ranging between 0.4 and 0.5 (Figure 8d). High local connectivity was observed in nature reserves, wetlands, and ecological islands, where the clustering coefficient remained consistently high. This stability indicates the resilience of these areas to external disturbances and their importance in maintaining local ecological stability. For example, in 2010, the clustering coefficient in some wetland areas decreased slightly due to urban expansion, but it rebounded in 2020 following conservation efforts that restored these areas.
In summary, Wuhan’s ecological network stayed generally stable, with improved connectivity. Peripheral gains in degree and closeness centrality signal successful conservation, while stable clustering in key areas highlights their role. Slight rises in betweenness and closeness centrality indicate better efficiency, but urban pressures persist. Protecting key corridors and sources remains vital for sustainability.

3.4. Correlation Between Ecological Function, Process, and Network Pattern

3.4.1. Pattern–Function Correlation

Significant differences were found between various ES indicators and key NTCs (Figure 10). WC maintained a consistently positive and relatively stable correlation with network structure over the 20-year sequence, representing a critical ES type for structural optimization. The four years showed a strong positive correlation between WC and closeness centrality (r = 0.45–0.51, p < 0.001), and a moderate positive correlation with degree centrality (mean r = 0.25, p < 0.001). In contrast, SR mostly displayed negative correlations with NTCs and is consistently negatively associated with closeness centrality across five years (mean r = −0.36, p < 0.001) and with degree centrality (mean r = −0.21, p < 0.001). CS exhibited negative correlations with betweenness centrality (mean r = −0.23, p < 0.001) and negative correlations with degree centrality in four years (mean r = −0.20, p < 0.001), while showing weak positive correlations with clustering coefficient (mean r = 0.21, p < 0.001). HQ was generally weakly correlated, showing negative correlations with closeness centrality (mean r = −0.28, p < 0.001) and degree centrality (mean r = −0.13, p < 0.001) across five years, but a positive correlation with betweenness centrality in three years (mean r = 0.12, p < 0.001).

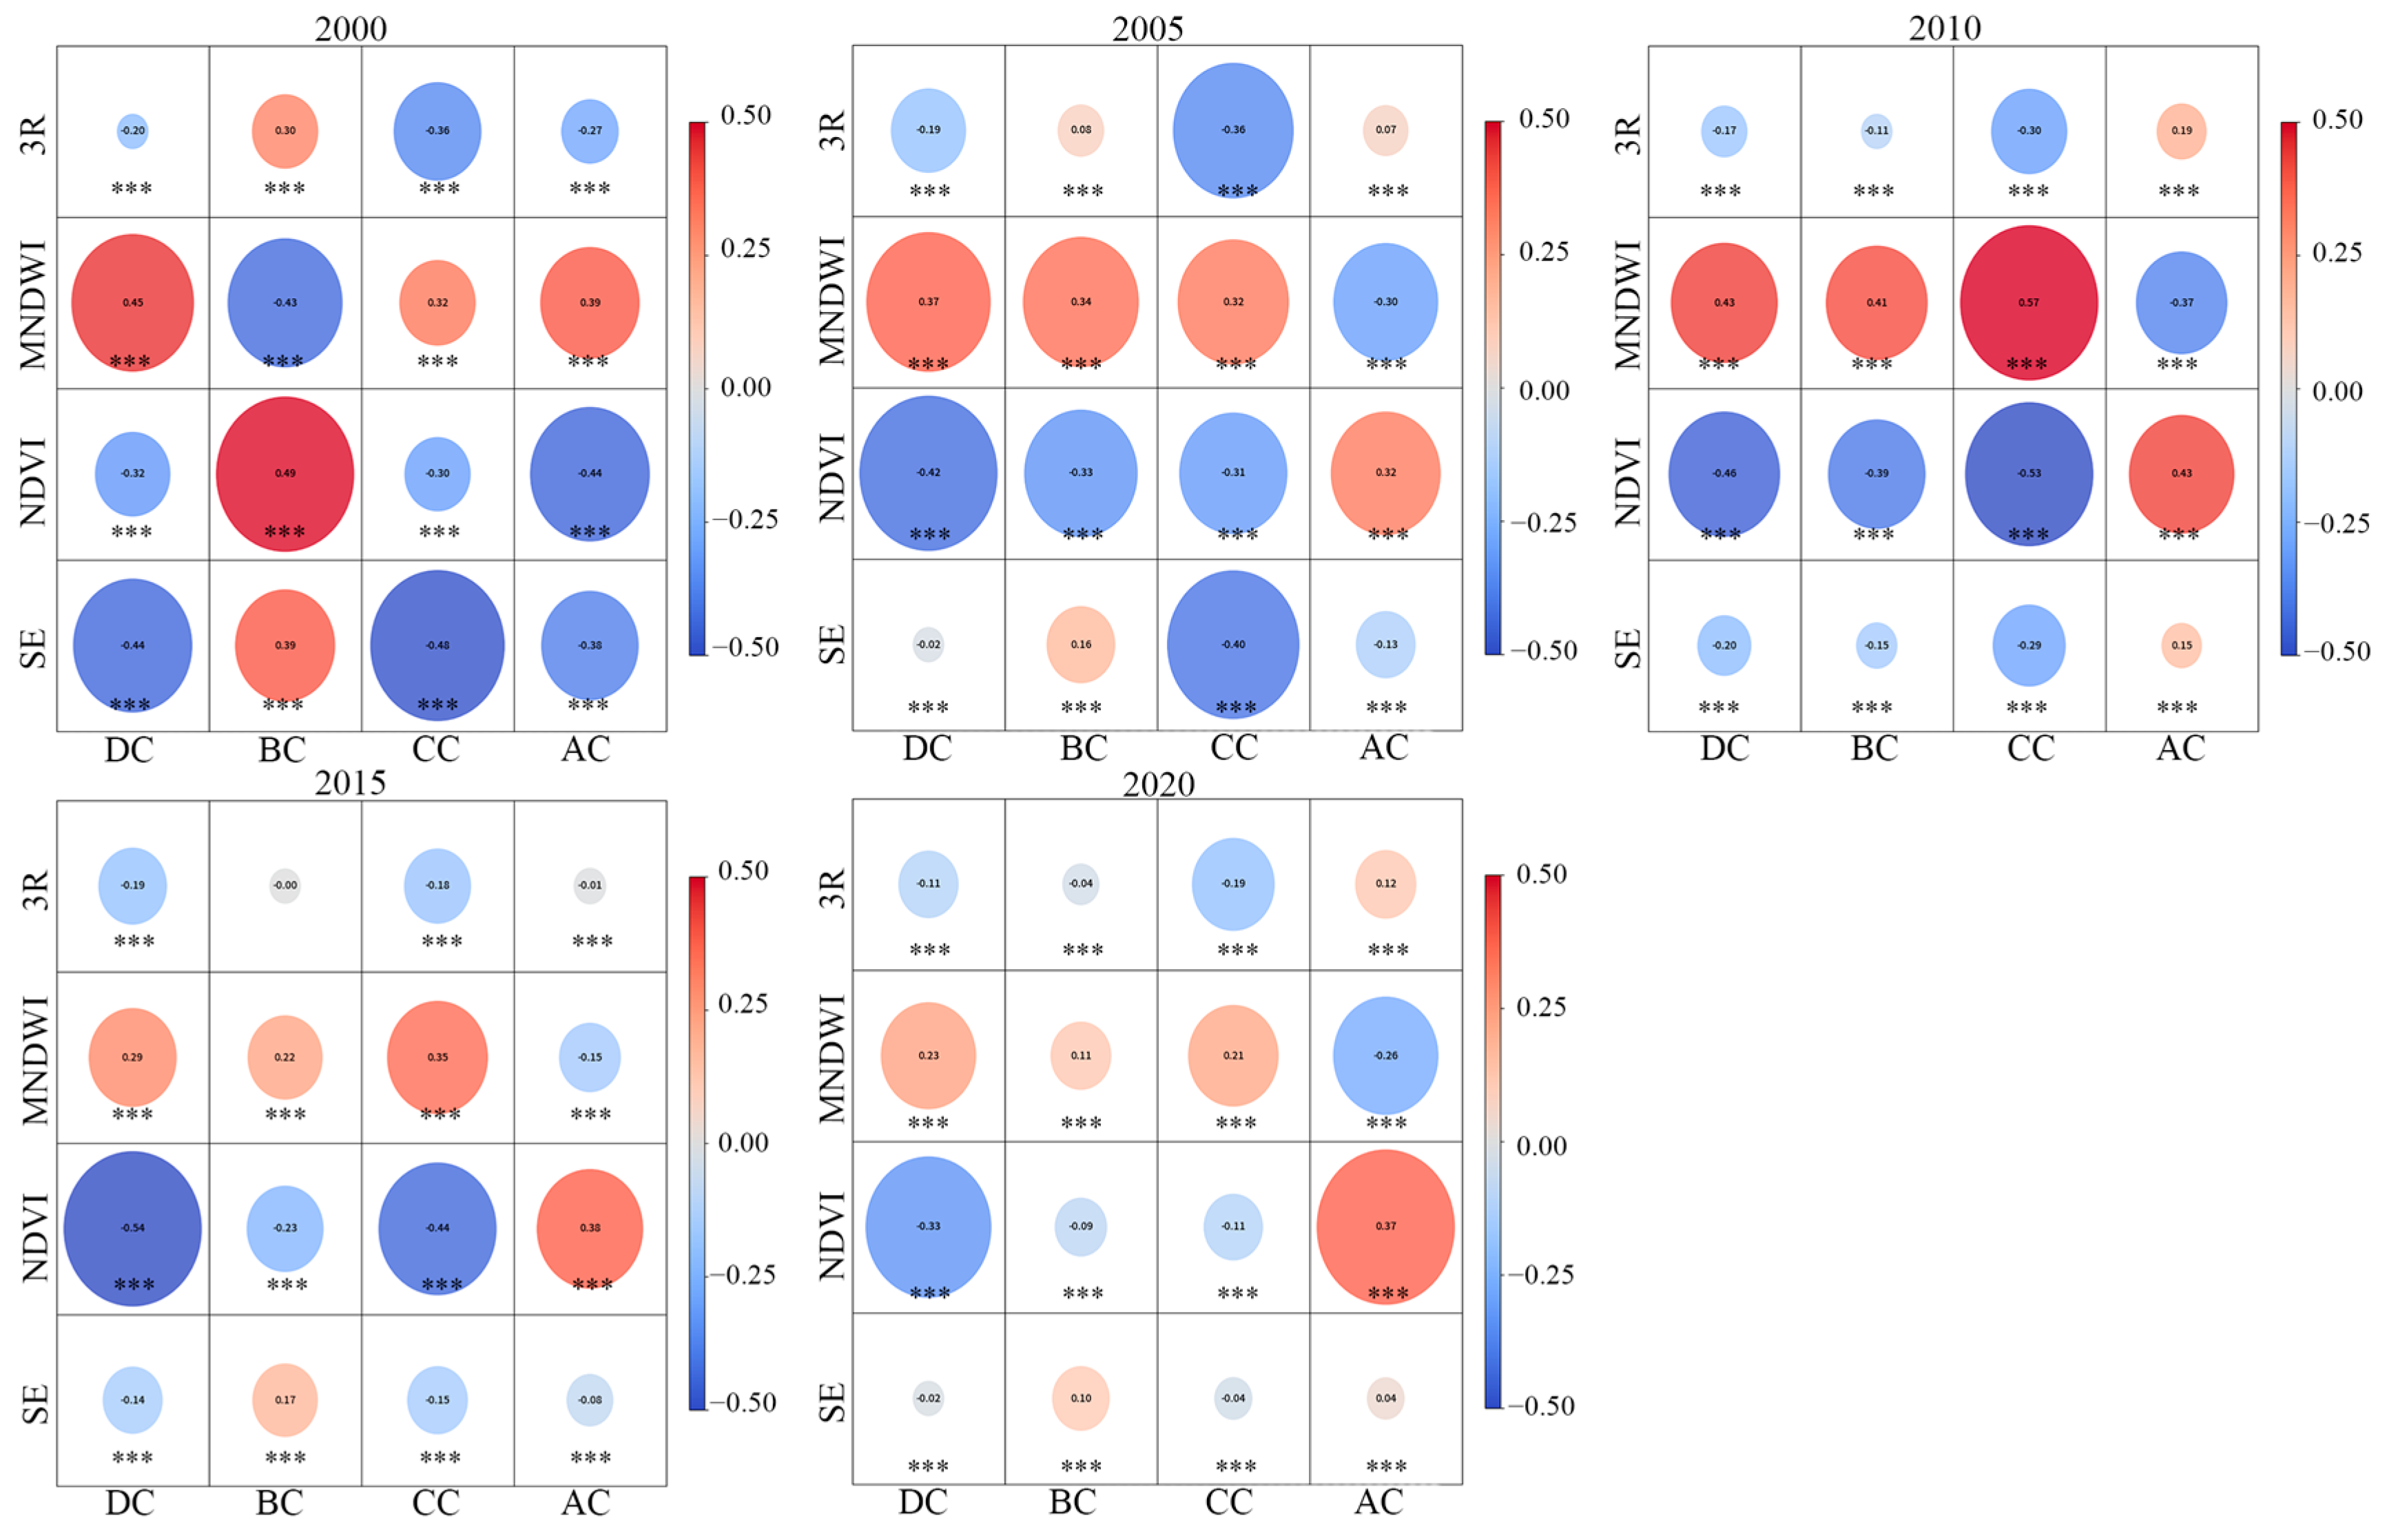
3.4.2. Pattern–Process Correlation

Long-term trends showed that the associations between ecological processes and EN structure were not consistent but revealed clear stage-specific variations (Figure 11). MNDWI (water index) had the most stable and significant positive correlations with NTC, with particularly strong effects in 2010 (CC r = 0.57, DC r = 0.43, BC r = 0.41, p < 0.001). NDVI (vegetation index) generally displayed negative correlations with most NTCs from 2005 to 2020, while showing a moderate positive correlation with clustering coefficient in the same period (r = 0.32–0.43, p < 0.001). Soil erosion demonstrated significant negative correlations with NTCs during the early stages (e.g., in 2000, BC r = −0.44, CC r = −0.48, p < 0.001), but later these associations weakened or became insignificant. Overall, from 2015 to 2020, the correlations between process indicators and network patterns weakened, with some coefficients approaching zero. This suggests that water-related indicators, particularly MNDWI, maintained a strong positive effect on structural connectivity across periods, whereas vegetation and soil processes showed greater dependence on spatial and temporal contexts.

3.5. EN Optimization and Effectiveness Evaluation

3.5.1. Ecological Network Optimization

Pinch points and barriers were first identified as candidates for connectivity restoration (Figure 12a). A total of 155 ecological pinch points were located at ecological patch junctions and urban edges, while 15 major barriers were identified, mostly along waterbody margins and fragmented forest zones. Using correlation analysis, areas in the top 10% of positively related indicators were selected as priority zones. Sixteen pinch points and two barriers were identified for intervention.
Under the PFO strategy, optimization emphasized alignment between EN structure and WC. The optimization primarily focuses on Huangpi District and Xinzhou District, where well-preserved natural ecosystems exhibit strong potential for ecological services, yet their connectivity has been degraded to varying degrees due to anthropogenic disturbances or land use changes. The resulting EN included 55 sources and 122 corridors (Figure 12b). By restoring critical nodes and reconstructing corridors, the optimization effectively eliminates pinch points and barriers within the network, thereby enhancing the stability and resilience of the regional ecological security pattern.
Under the PPO strategy, optimization focused on preserving node stability within hydrological processes. This led to an EN with 55 sources and 130 corridors (Figure 12c). Key intervention areas (Xinzhou, Hannan, and Caidian districts) feature low-lying terrain with dense hydrological networks, providing ideal wetland bases and aquatic connectivity. The optimization strengthens structural linkages among river–wetland–farmland complexes, improving accessibility in previously fragmented, hydrology-dominated zones while sustaining critical hydro-ecological processes (e.g., flood mitigation, water purification). Enhanced corridor redundancy and process continuity further bolster the network’s capacity to withstand extreme disturbances.

3.5.2. Evaluation of Ecological Network Optimization

The original and optimized ENs showed differing responses to disturbance scenarios, with robustness improved in both optimized networks, and PFO showing slightly better global performance (Figure 13). Under random attacks, the original network had a degradation slope of −1.11 (R2 = 0.96), showing moderate redundancy. Under targeted attacks, the slope was −0.90 (R2 = 0.81), indicating weaker structural resilience. As for PFO (Figure 13b, Table S6), it significantly slowed degradation during targeted attacks (slope reduced to −0.68) by enhancing connectivity and decentralization in core areas. Under random attacks, the optimized network showed higher initial robustness (slope: −1.07), indicating improved structural resilience. Under PPO (Figure 13c, Table S7), the regression slope during targeted attacks decreased to −0.71, indicating enhanced resistance. Under random attacks, the slope slightly decreased to −1.09, suggesting sensitivity despite improved initial connectivity. The number of corridors increased from 122 to 130, mainly around transitional zones in Hannan and Xinzhou, improving accessibility in water-dominated regions. The results demonstrate that both optimization strategies significantly mitigate connectivity degradation under targeted disturbances by enhancing connection density and structural dispersion in non-core regions, thereby reducing dependence on core nodes and improving system fault tolerance and recovery potential. Although robustness shows no substantial improvement under random attacks, PPO-optimized networks exhibit higher initial robustness, while PFO networks degrade more gradually—both achieving enhanced structural resilience.

4. Discussion

4.1. Value and Necessity of Optimizing Ecological Networks from a Long-Term Pattern–Process–Function Perspective

Optimizing the EN can significantly enhance ecosystem connectivity, system stability, continuity of ecological processes, and long-term sustainability [71]. Traditional ecological conservation and restoration efforts often rely on qualitative approaches, focusing on network structure or ES from a homogenous perspective. This may lead to inherent limitations—such as emphasizing localized improvements while neglecting system-wide benefits [71,72], or disregarding the role of ecological processes [73]. The pattern–process–function framework integrates ecological system complexity—including dynamics, processes, and structure—allowing comprehensive evaluation of ecosystem states to guide spatial optimization [39]. This study employs this perspective to provide a quantitative basis for identifying and prioritizing key restoration zones, avoiding subjective judgments based solely on historical experience or patch characteristics [74]. EN pinch points and barriers with high restoration potential are identified as optimization candidates. Correlations among multiple NTCs, ES, and process indicators are analyzed, and priority zones are ranked based on positively correlated indicators [75]. Different optimization scenarios are assessed via simulation, and strategy-specific benefits provide planning guidance. Compared to previous EN studies [25,28], this research achieves a more comprehensive balance between structure, process, and function. It avoids mismatches that may constrain effectiveness and enhances restoration efficiency. We randomly selected the same number of alternative optimization areas as in Section 3.5.1 to compare the enhancement effects of PFO and PPO with the conventional method [33] (Figure 14). Under targeted attacks, PFO (−0.68) and PPO (−0.71) exhibited flatter curve trends compared to stochastic optimization (−0.76), indicating superior network stability. To mitigate the influence of stochastic fluctuations from random attacks, the PFO and PPO curves under unified R2 conditions still maintained gentler degradation slopes. Both approaches demonstrated greater stability under both targeted and random attacks.
Compared to previous approaches to EN optimization [70], this study incorporates indicators with stable long-term correlations, enabling the consideration of interannual fluctuations and avoiding optimization decisions based solely on short-term conditions. This approach enhances the robustness and reliability of the proposed strategies. For example, water conservation services and network topological characteristics exhibited consistent positive correlations from 2000 to 2015, with deviations only in 2020. For example, the positive correlation between WC and DC from 2000 to 2015 (mean r = 0.25) changed to a negative correlation (r = −0.01) in 2020. This may be due to data or serendipitous factors [30]. Relying on single-year correlation patterns may lead to misjudgments in decision-making. Moreover, it is broadly applicable across ecosystems and regions. Researchers can flexibly select appropriate ecological processes and ES based on regional characteristics—for example, soil retention and desertification in grasslands or water-related indicators in water-rich areas like Wuhan [39].

4.2. Correlation Between Ecosystem Services, Ecological Processes, and Network Topological Characteristics

In conventional EN research, the structural heterogeneity and change characteristics of the source are often difficult to describe intuitively [76], and the characteristics and relationships of network structure and function are rarely analyzed [31]. This study applies complex network theory to reveal correlations among four ES indicators, four ecological process indicators, and key NTCs, trying to provide a new perspective for the above research.
The observed correlations reveal unique and interpretable mechanisms. Water conservation consistently shows strong positive correlations with network centrality indicators. Areas with high water retention capacity tend to exhibit better connectivity, highlighting the indirect use value of hydrological services in maintaining the structural integrity of ecological space, in line with previous findings [30]. This relationship may stem from the marked spatial heterogeneity of water-related ecosystem services, which makes them particularly susceptible to network structure influences [77]. Improved hydrological connectivity further supports nutrient cycling, pollutant degradation, and biodiversity maintenance, thereby enhancing overall ES supply capacity. Beyond the well-established supporting role of water-related ES for other services [77], this indirect mechanism also supports the prioritization of water-related ES in urban EN planning.
In contrast, soil retention and carbon sequestration show weak or negative correlations with network centrality. Their service delivery, often localized in nature, may not align with large-scale structural connectivity. The negative correlation between carbon sequestration and betweenness centrality, and its positive correlation with the clustering coefficient, echoes prior findings [38]. This may be because nodes with high betweenness centrality are more exposed to global disturbances, reducing CS, whereas nodes with high clustering coefficients may enhance local carbon cycles through stronger neighborhood interactions. However, Wang et al. reported significant positive correlations between soil conservation and network structure in southeastern Tibet [38]. This divergence may reflect Wuhan’s unique ecological context—extensive wetlands (13.9% water area), sparse and fragmented forest patches—leading to different spatial foundations. It also underscores the need for EN optimization strategies to go beyond simply selecting high-performing ES areas [33], and instead to identify patches based on the integrated pattern–function relationships, thus better reflecting local ecological realities.
Although few studies have examined correlations between process indicators and NTC, our results reveal stage-specific associations that support earlier findings. MNDWI maintained stable and positive correlations over time, indicating the critical role of moisture distribution in sustaining network cohesion. In contrast, NDVI and soil erosion displayed greater variability, likely influenced by land use dynamics or seasonal fluctuations. Notably, the negative correlations between NDVI and centrality indicators (degree, betweenness, closeness) may be attributed to “bridge nodes” where ecological degradation is likely [78,79], suggesting a possible trade-off between vegetation cover and connectivity in highly urbanized wetland cities. The weakening correlations from 2015 to 2020 suggest that the network structure may have reached a relatively stable configuration, reducing its sensitivity to external process drivers. Overall, these patterns indicate that water-related indicators serve as a robust baseline for EN optimization in compound urban–water ecological systems, while vegetation and soil-based indicators require more context-specific assessments. This emphasizes the need to optimize urban land use—e.g., reducing impervious surfaces to improve water environments [80]. Managing these effects requires restricting development in ecologically sensitive zones [81].

4.3. Comparative Analysis of Two Optimization Scenarios and Their Synergistic Implications

A comparison of PFO and PPO reveals distinct characteristics and collaborative potential (Table 2, Tables S6 and S7). Structurally, PFO enhances topological connectivity among core sources, forming a centralized, node-driven network. In contrast, PPO builds a more distributed structure with increased redundancy and system resilience. In terms of robustness, PFO performs better under both random and targeted disturbances, with the slope improving from −1.11 to −1.07 (random) and reaching −0.68 (targeted), the lowest observed—similar to findings in previous research [33]. PPO also shows good performance under targeted attacks, with a slope of −0.71. Spatially, new corridors in PFO cluster in ecologically valuable areas, while PPO strengthens transitions between rivers, wetlands, and farmland in edge zones. Functionally, PFO prioritizes ES connectivity reinforcement by stabilizing high-value patch linkages, which may sustain critical functions like water conservation. In contrast, PPO emphasizes process optimization through flow continuity, which may enhance systemic self-regulation and adaptive buffering. Their complementary traits suggest that a unified, multi-scale planning framework—particularly for complex urban-aquatic systems like Wuhan—may maximize ecological security by synergizing both paradigms. Future EN planning should adopt a multi-scale synergy framework that balances urban–rural ecological layouts, ensuring spatial equity and resilience. Overlapping optimization zones from both scenarios should be prioritized for protection (Figure 12).

4.4. Deficiencies and Prospects of the Study

Similarly to previous studies [33], this paper simulates the characteristic variations in EN over extended temporal sequences based on multiple time slices. However, it is noteworthy that the environments confronting EN may undergo instantaneous changes. Future research should incorporate data with finer temporal resolution for refinement, while employing landscape-driven land use simulation approaches to analyze the future dynamics of EN. Our analysis is based on undirected networks, which may overlook directionality and intensity changes under pressures of urbanization. Future work should incorporate directed ENs to improve realism [26,82]. In order to better understand the relationship between human activities and EN structure, future work should integrate socio-ecological indicators to quantify anthropogenic effects—overcoming the current natural-indicator limitations in our study—while adopting cascading failure modeling and multi-metric resilience assessments to validate optimization outcomes. Additionally, due to the complexity of ecological processes, this study used static proxies rather than dynamic models. Like other studies, we primarily rely on externally observable indicators, which may not capture real-time internal dynamics. Future work should integrate interdisciplinary methods such as the Source–Pathway–Sink Model (SPSM) to analyze co-influences of patterns and processes [83], or employ isotopic or biochemical indicators to trace spatiotemporal ecological processes [84]. Moreover, this paper is an exploratory framework from the pattern–process–function perspective to try to optimize EN structure. Further exploration of landscape ecological mechanisms is inevitable in the future [7]. Integrated approaches could be adopted to further explore how structural optimization affects the spatial transfer and redistribution of ecological functions and processes across urban networks.

5. Conclusions

This study proposes a long-term EN assessment framework from the pattern–process–function perspective, systematically analyzing the spatiotemporal evolution and optimization paths of urban EN, and verifying the feasibility of EN optimization strategies.
Under urbanization pressures, the EN exhibited a “growth-then-decline” spatiotemporal evolution pattern. During 2000–2010, structural improvements occurred with 28.2% and 38.2% increases in source areas and corridors, respectively, forming a more centralized network. Subsequently (2010–2020), both source quantity and corridor length decreased by 27.5% and 27.6%, weakening connectivity. Resistance surfaces revealed growing resistance in built-up areas and major transport corridors, expanding radially outward.
ES and ecological process indicators showed distinct spatiotemporal heterogeneity. Water-related indicators, especially WC and MNDWI, were positively and significantly correlated with network topological characteristics across multiple years (r > 0.4, p < 0.001). This finding underscores the critical role of water distribution and water conservation capacity in maintaining the structure and functionality of EN. HQ steadily improved, SR remained stable, and CS was closely tied to green space coverage. Among processes, MNDWI showed the strongest positive correlation with NTCs.
The PFO and PPO scenarios were complementary in objectives, spatial strategies, and risk response, exhibiting superior robustness compared to both unoptimized ENs (24% and 21% slower degradation under targeted attacks) and conventional optimization methods (11% and 7% improvement). PFO excelled in enhancing key services and network stability, suited for core areas and backbone structures. PPO was more applicable to edge zones, improving system adaptability and buffering. Priority should be given to overlapping optimized areas in both scenarios. This study overcomes subjective and incomplete quantitative limitations in EN optimization through a multi-objective synergy framework, enhancing its stability. The findings advance ecological spatial planning and provide transferable insights for spatiotemporal regulation of urban ecological spaces in similar hybrid landscapes.

Supplementary Materials

The following supporting information can be downloaded at: https://www.mdpi.com/article/10.3390/rs17152548/s1, Figure S1: Trends in ecological indicators in Wuhan; Table S1: The mean runoff coefficient value of LULC [46,85,86]; Table S2: The sensitivity of habitat types to each threat factor [43,46]; Table S3: Habitat suitability and sensitivity of habitat types to each threat factor [46,87]; Table S4: Classification criterion of influence factors and sensibility in Wuhan [20,88,89]; Table S5: Resistance factor; Table S6: Comparative analysis of network optimization under the PFO scenario; Table S7: Comparative analysis of network optimization under the PPO scenario.

Author Contributions

Conceptualization, A.T., Y.Z. and T.C.; methodology, A.T.; software, A.T., T.C. and Z.Q.; writing—original draft preparation, A.T. and T.C.; writing—review and editing, A.T., Y.Z. and Z.Q.; visualization, A.T. and T.C.; supervision, Y.Z. All authors have read and agreed to the published version of the manuscript.

Funding

This research is supported by National Key Research and Development Program of China (No. 2023YFB3906703) and National Natural Science Foundation of China (Nos. 72474164, 72174158).

Data Availability Statement

Publicly available datasets were analyzed in this study. The data sources and access links are indicated in the text.

Conflicts of Interest

The authors declare no conflicts of interest.

Abbreviations

The following abbreviations are used in this manuscript:
ENEcological Network
ESEcosystem Service
HQHabitat Quality
WCWater Conservation
SRSoil Retention
CSCarbon Sequestration
MSPAMorphological Spatial Pattern Analysis
NTCNetwork Topological Characteristics
DCDegree Centrality
BCBetweenness Centrality
CCCloseness Centrality
ACClustering Coefficient
PFOPattern–Function Optimization
PPOPattern–Process Optimization

References

  1. Jiang, J.; Cai, J.; Peng, R.; Li, P.; Chen, W.; Xia, Y.; Deng, J.; Zhang, Q.; Yu, Z. Establishment and optimization of urban ecological network based on ecological regulation services aiming at stability and connectivity. Ecol. Indic. 2024, 165, 112217. [Google Scholar] [CrossRef]
  2. Chen, G.; Li, X.; Liu, X.; Chen, Y.; Liang, X.; Leng, J.; Xu, X.; Liao, W.; Qiu, Y.A.; Wu, Q.; et al. Global projections of future urban land expansion under shared socioeconomic pathways. Nat. Commun. 2020, 11, 537. [Google Scholar] [CrossRef] [PubMed]
  3. Li, J.; Nie, W.; Zhang, M.; Wang, L.; Dong, H.; Xu, B. Assessment and optimization of urban ecological network resilience based on disturbance scenario simulations: A case study of Nanjing city. J. Clean. Prod. 2024, 438, 140812. [Google Scholar] [CrossRef]
  4. Nie, W.; Bin Xu, B.; Yang, F.; Shi, Y.; Liu, B.; Wu, R.; Lin, W.; Pei, H.; Bao, Z. Simulating future land use by coupling ecological security patterns and multiple scenarios. Sci. Total Environ. 2023, 859, 160262. [Google Scholar] [CrossRef] [PubMed]
  5. Zhang, M.; Li, J.; Wang, L.; Xu, B.; Nie, W. The impact of connectivity in natural protected areas on the resilience of urban ecological networks: A research framework based on hierarchical disturbance scenario simulation. Ecol. Indic. 2024, 164, 112144. [Google Scholar] [CrossRef]
  6. Schröder, B. Pattern, process, and function in landscape ecology and catchment hydrology—How can quantitative landscape ecology support predictions in ungauged basins? Hydrol. Earth Syst. Sci. 2006, 10, 967–979. [Google Scholar] [CrossRef]
  7. Yin, C.; Zhao, W.; Pereira, P. Ecosystem restoration along the “pattern-process-service-sustainability” path for achieving land degradation neutrality. Landsc. Urban Plan. 2025, 253, 105227. [Google Scholar] [CrossRef]
  8. Xia, M.; Jia, K.; Wang, X.; Bai, X.; Li, C.; Zhao, W.; Hu, X.; Cherubini, F. A framework for regional ecosystem authenticity evaluation-a case study on the Qinghai-Tibet Plateau of China. Glob. Ecol. Conserv. 2021, 31, e01849. [Google Scholar] [CrossRef]
  9. Zhu, Q.; Cai, Y. Impact of ecological risk and ecosystem health on ecosystem services. Acta Geogr. Sin. 2024, 79, 1303–1317. [Google Scholar]
  10. Forman, R.T.T. Some general principles of landscape and regional ecology. Landsc. Ecol. 1995, 10, 133–142. [Google Scholar] [CrossRef]
  11. Peng, J.; Yang, Y.; Liu, Y.; Hu, Y.; Du, Y.; Meersmans, J.; Qiu, S. Linking ecosystem services and circuit theory to identify ecological security patterns. Sci. Total Environ. 2018, 644, 781–790. [Google Scholar] [CrossRef] [PubMed]
  12. Dong, X.; Wang, F.; Fu, M. Research progress and prospects for constructing ecological security pattern based on ecological network. Ecol. Indic. 2024, 168, 112800. [Google Scholar] [CrossRef]
  13. Wang, S.; Zhao, Y.; Ren, H.; Zhu, S. Stepwise Construction and Integration of Ecological Network in Resource-Based Regions: A Case Study on Liaoning Province, China. Remote Sens. 2024, 16, 3228. [Google Scholar] [CrossRef]
  14. Zhang, L.; Liu, Q.; Wang, J.; Wu, T.; Li, M. Constructing ecological security patterns using remote sensing ecological index and circuit theory: A case study of the Changchun-Jilin-Tumen region. J. Environ. Manag. 2025, 373, 123693. [Google Scholar] [CrossRef] [PubMed]
  15. Aizizi, Y.; Kasimu, A.; Liang, H.; Zhang, X.; Zhao, Y.; Wei, B. Evaluation of ecological space and ecological quality changes in urban agglomeration on the northern slope of the Tianshan Mountains. Ecol. Indic. 2023, 146, 109896. [Google Scholar] [CrossRef]
  16. Liu, X.; Wei, M.; Li, Z.; Zeng, J. Multi-scenario simulation of urban growth boundaries with an ESP-FLUS model: A case study of the Min Delta region, China. Ecol. Indic. 2022, 135, 108538. [Google Scholar] [CrossRef]
  17. Li, Y.; Liu, W.; Feng, Q.; Zhu, M.; Yang, L.; Zhang, J.; Yin, X. The role of land use change in affecting ecosystem services and the ecological security pattern of the Hexi Regions, Northwest China. Sci. Total Environ. 2023, 855, 158940. [Google Scholar] [CrossRef] [PubMed]
  18. Wang, Y.; Qu, Z.; Zhong, Q.; Zhang, Q.; Zhang, L.; Zhang, R.; Yi, Y.; Zhang, G.; Li, X.; Liu, J. Delimitation of ecological corridors in a highly urbanizing region based on circuit theory and MSPA. Ecol. Indic. 2022, 142, 109258. [Google Scholar] [CrossRef]
  19. Zhang, Y.; Zhao, Z.; Fu, B.; Ma, R.; Yang, Y.; Lü, Y.; Wu, X. Identifying ecological security patterns based on the supply, demand and sensitivity of ecosystem service: A case study in the Yellow River Basin, China. J. Environ. Manag. 2022, 315, 115158. [Google Scholar] [CrossRef] [PubMed]
  20. Cui, X.; Deng, W.; Yang, J.; Huang, W.; de Vries, W.T. Construction and optimization of ecological security patterns based on social equity perspective: A case study in Wuhan, China. Ecol. Indic. 2022, 136, 108714. [Google Scholar] [CrossRef]
  21. Sun, D.; Wu, X.; Wen, H.; Ma, X.; Zhang, F.; Ji, Q.; Zhang, J. Ecological Security Pattern based on XGBoost-MCR model: A case study of the Three Gorges Reservoir Region. J. Clean. Prod. 2024, 470, 143252. [Google Scholar] [CrossRef]
  22. Zhang, J.; Zhu, H.; Zhang, P.; Song, Y.; Zhang, Y.; Li, Y.; Rong, T.; Liu, Z.; Yang, D.; Lou, Y. Construction of GI Network Based on MSPA and PLUS Model in the Main Urban Area of Zhengzhou: A Case Study. Front. Environ. Sci. 2022, 10, 878656. [Google Scholar] [CrossRef]
  23. Li, S.; Zhao, Y.; Xiao, W.; Yue, W.; Wu, T. Optimizing ecological security pattern in the coal resource-based city: A case study in Shuozhou City, China. Ecol. Indic. 2021, 130, 108026. [Google Scholar] [CrossRef]
  24. Liu, H.; Wang, Z.; Zhang, L.; Tang, F.; Wang, G.; Li, M. Construction of an ecological security network in the Fenhe River Basin and its temporal and spatial evolution characteristics. J. Clean. Prod. 2023, 417, 137961. [Google Scholar] [CrossRef]
  25. Wang, S.Q.; Zhao, Y.L.; Wang, Q.Y.; Ren, H.; Zhu, S.C.; Cao, J.R. Ecological network construction and optimization of typical resource-based regions, and strategies for the enhancement of multiple ecosystem services: Balancing function and structure. Ecol. Indic. 2025, 170, 112951. [Google Scholar] [CrossRef]
  26. Gao, C.; Pan, H.; Wang, M.; Zhang, T.; He, Y.; Cheng, J.; Yao, C. Identifying priority areas for ecological conservation and restoration based on circuit theory and dynamic weighted complex network: A case study of the Sichuan Basin. Ecol. Indic. 2023, 155, 111064. [Google Scholar] [CrossRef]
  27. Cao, W.; Jia, G.; Yang, Q.; Sun, H.; Wang, L.; Svenning, J.; Wen, L. Construction of ecological network and its temporal and spatial evolution characteristics: A case study of Ulanqab. Ecol. Indic. 2024, 166, 112344. [Google Scholar] [CrossRef]
  28. Wang, T.; Huang, Y.; Cheng, J.; Xiong, H.; Ying, Y.; Feng, Y.; Wang, J. Construction and optimization of watershed-scale ecological network based on complex network method: A case study of Erhai Lake Basin in China. Ecol. Indic. 2024, 160, 111794. [Google Scholar] [CrossRef]
  29. Lu, Y.; Huang, D.; Liu, Y.; Zhang, Y.; Jing, Y.; Chen, H.; Zhang, Z.; Liu, Y. Exploring the optimization and management methods of ecological networks based on the cluster mode: A case study of Wuhan Metropolis, China. Land Use Policy 2024, 137, 107021. [Google Scholar] [CrossRef]
  30. Guo, H.; Song, X.N.; Leng, P.; Zhu, X.M.; Hu, R.H.; Guo, D.; Gao, L.; Wang, Y.F.; Xue, K. Higher water ecological service values have better network connectivity in the middle Yellow River basin. Ecol. Indic. 2024, 160, 111797. [Google Scholar] [CrossRef]
  31. Huang, X.; Xiu, L.; Lu, Z.; Wang, J. Ecological networks construction and optimization in the Longdong Loess Plateau: The advantages of self-organizing map and complex networks. Ecol. Indic. 2025, 170, 113138. [Google Scholar] [CrossRef]
  32. Wang, S.; Wu, M.; Hu, M.; Xia, B. Integrating ecosystem services and landscape connectivity into the optimization of ecological security pattern: A case study of the Pearl River Delta, China. Environ. Sci. Pollut. Res. 2022, 29, 76051–76065. [Google Scholar] [CrossRef] [PubMed]
  33. Men, D.; Pan, J. Incorporating network topology and ecosystem services into the optimization of ecological network: A case study of the Yellow River Basin. Sci. Total Environ. 2024, 912, 169004. [Google Scholar] [CrossRef] [PubMed]
  34. Song, S.; Gong, Y.; Yu, Y.F. Integrating pattern, process, and function in urban landscape ecological network planning: A case study of Harbin central city. Ecol. Indic. 2024, 159, 111671. [Google Scholar] [CrossRef]
  35. Gao, X.; Liang, X.; Guo, Z.; Yuan, Z.; Li, G.; Likulunga, L.E. The analysis of ecological network characteristics of Baiyangdian Basin in China using the complex network theory. Ecol. Indic. 2024, 167, 112650. [Google Scholar] [CrossRef]
  36. Zhu, N.Y.; Ai, J.W.; Zeng, Z.; Zhou, C.H. Exploring the Spatial Relationship between the Ecological Topological Network and Carbon Sequestration Capacity of Coastal Urban Ecosystems: A Case Study of Yancheng City, China. Remote Sens. 2023, 15, 4007. [Google Scholar] [CrossRef]
  37. An, Y.; Liu, S.; Sun, Y.; Shi, F.; Beazley, R. Construction and optimization of an ecological network based on morphological spatial pattern analysis and circuit theory. Landsc. Ecol. 2021, 36, 2059–2076. [Google Scholar] [CrossRef]
  38. Wang, F.; Yu, Q.; Qiu, S.; Xu, C.L.; Ma, J.J.; Liu, H.J. Study on the relationship between topological characteristics of ecological spatial network and soil conservation function in southeastern Tibet, China. Ecol. Indic. 2023, 146, 109791. [Google Scholar] [CrossRef]
  39. Zhao, Z.; Fu, B.; Lü, Y.; Li, T.; Deng, L.; Wang, Y.; Lü, D.; Wang, Y.; Wu, X. Variable climatic conditions dominate decreased wetland vulnerability on the Qinghai–Tibet Plateau: Insights from the ecosystem pattern-process-function framework. J. Clean. Prod. 2024, 458, 142496. [Google Scholar] [CrossRef]
  40. Pan, Z.; Gao, G.; Fu, B. Spatiotemporal changes and driving forces of ecosystem vulnerability in the Yangtze River Basin, China: Quantification using habitat-structure-function framework. Sci. Total Environ. 2022, 835, 155494. [Google Scholar] [CrossRef] [PubMed]
  41. Sun, R.; Sun, L.; Su, X.; Chen, L. A review on the coupling research of landscape patterns and ecological processes: Consistency and innovation. Shengtai Xuebao 2021, 41, 415–421. [Google Scholar]
  42. Tan, C.; Ma, J.; Yan, Y.; Hong, G.; Wu, X. Identifying priority wetlands for the conservation of waterbirds in Wuhan, China. Ecol. Indic. 2023, 157, 111240. [Google Scholar] [CrossRef]
  43. Fan, F.; Wen, X.; Feng, Z.; Gao, Y.; Li, W. Optimizing urban ecological space based on the scenario of ecological security patterns: The case of central Wuhan, China. Appl. Geogr. 2022, 138, 102619. [Google Scholar] [CrossRef]
  44. Wang, T.; Li, H.B.; Huang, Y. The complex ecological network’s resilience of the Wuhan metropolitan area. Ecol. Indic. 2021, 130, 108101. [Google Scholar] [CrossRef]
  45. Hong, G.; Liu, S.; Liu, W.; Wu, X. Nonlinear trade-off relationship and critical threshold between ecosystem services and climate resilience for sustainable urban development. Sustain. Cities Soc. 2024, 103, 105253. [Google Scholar] [CrossRef]
  46. Xia, H.; Yuan, S.; Prishchepov, A.V. Spatial-temporal heterogeneity of ecosystem service interactions and their social-ecological drivers: Implications for spatial planning and management. Resour. Conserv. Recycl. 2023, 189, 106767. [Google Scholar] [CrossRef]
  47. Xu, J.; Wang, F.; Ren, C.; Bian, J.; Li, T.; Ping, Z. Spatial and temporal characteristics of water conservation services and rapid response framework for water yield in key ecological zones of the Yiluo River basin. J. Hydrol. Reg. Stud. 2025, 60, 102542. [Google Scholar] [CrossRef]
  48. Pang, L.; Tian, C.; Yuan, Q.; Deng, W. Effects of different restoration years on soil carbon sequestration and water retention capacity in bamboo forest: A case study in Southwest China Karst. Ecol. Eng. 2025, 210, 107434. [Google Scholar] [CrossRef]
  49. Deng, Y.; Shao, Z.; Dang, C.; Huang, X.; Wu, W.; Zhuang, Q.; Ding, Q. Assessing urban wetlands dynamics in Wuhan and Nanchang, China. Sci. Total Environ. 2023, 901, 165777. [Google Scholar] [CrossRef] [PubMed]
  50. Grafton, R.Q.; Doyen, L.; Béné, C.; Borgomeo, E.; Brooks, K.; Chu, L.; Cumming, G.S.; Dixon, J.; Dovers, S.; Garrick, D.; et al. Realizing resilience for decision-making. Nat. Sustain. 2019, 2, 907–913. [Google Scholar] [CrossRef]
  51. Li, C.; Su, K.; Liang, X.F.; Jiang, X.B.; Wang, J.P.; You, Y.F.; Wang, L.Y.; Chang, S.H.; Wei, C.W.; Zhang, Y.M.; et al. Identification of priority areas to provide insights for ecological protection planning: A case study in Hechi, China. Ecol. Indic. 2023, 154, 110738. [Google Scholar] [CrossRef]
  52. MEA. Ecosystems and Human Well-Being: Synthesis; Island Press: Washington, DC, USA, 2005; pp. 1–137. [Google Scholar]
  53. Ran, P.; Hu, S.; Frazier, A.E.; Yang, S.; Song, X.; Qu, S. The dynamic relationships between landscape structure and ecosystem services: An empirical analysis from the Wuhan metropolitan area, China. J. Environ. Manag. 2023, 325, 116575. [Google Scholar] [CrossRef] [PubMed]
  54. Li, Q.; Shi, X.; Wu, Q. Effects of protection and restoration on reducing ecological vulnerability. Sci. Total Environ. 2021, 761, 143180. [Google Scholar] [CrossRef] [PubMed]
  55. Bao, Z.; Zhang, J.; Wang, G.; Guan, T.; Jin, J.; Liu, Y.; Li, M.; Ma, T. The sensitivity of vegetation cover to climate change in multiple climatic zones using machine learning algorithms. Ecol. Indic. 2021, 124, 107443. [Google Scholar] [CrossRef]
  56. Chen, M.; Xu, X.; Tan, Y.; Lin, Y. Assessing ecological vulnerability and resilience-sensitivity under rapid urbanization in China’s Jiangsu province. Ecol. Indic. 2024, 167, 112607. [Google Scholar] [CrossRef]
  57. Wang, S.; Li, Z.; Long, Y.; Yang, L.; Ding, X.; Sun, X.; Chen, T. Impacts of urbanization on the spatiotemporal evolution of ecological resilience in the Plateau Lake Area in Central Yunnan, China. Ecol. Indic. 2024, 160, 111836. [Google Scholar] [CrossRef]
  58. Feng, X.; Zeng, F.; Loo, B.P.Y.; Zhong, Y. The evolution of urban ecological resilience: An evaluation framework based on vulnerability, sensitivity and self-organization. Sustain. Cities Soc. 2024, 116, 105933. [Google Scholar] [CrossRef]
  59. Peng, L.; Wu, H.; Li, Z. Spatial-Temporal Evolutions of Ecological Environment Quality and Ecological Resilience Pattern in the Middle and Lower Reaches of the Yangtze River Economic Belt. Remote Sens. 2023, 15, 430. [Google Scholar] [CrossRef]
  60. Wang, N.; Zhao, Y. Construction of an ecological security pattern in Jiangnan water network area based on an integrated Approach: A case study of Gaochun, Nanjing. Ecol. Indic. 2024, 158, 111314. [Google Scholar] [CrossRef]
  61. Zhang, Y.; Hu, W.; Min, M.; Zhao, K.; Zhang, S.; Liu, T. Optimization of ecological connectivity and construction of supply-demand network in Wuhan Metropolitan Area, China. Ecol. Indic. 2023, 146, 109799. [Google Scholar] [CrossRef]
  62. Li, Z.; Song, K.; Peng, L. Flood Risk Assessment under Land Use and Climate Change in Wuhan City of the Yangtze River Basin, China. Land 2021, 10, 878. [Google Scholar] [CrossRef]
  63. Gong, D.; Huang, M.; Lin, H. Construction of an ecological security pattern in rapidly urbanizing areas based on ecosystem sustainability, stability, and integrity. Remote Sens. 2023, 15, 5728. [Google Scholar] [CrossRef]
  64. De Montis, A.; Caschili, S.; Mulas, M.; Modica, G.; Ganciu, A.; Bardi, A.; Ledda, A.; Dessena, L.; Laudari, L.; Fichera, C.R. Urban-rural ecological networks for landscape planning. Land Use Policy 2016, 50, 312–327. [Google Scholar] [CrossRef]
  65. Huang, K.; Peng, L.; Wang, X.; Deng, W.; Liu, Y. Incorporating circuit theory, complex networks, and carbon offsets into the multi-objective optimization of ecological networks: A case study on karst regions in China. J. Clean. Prod. 2023, 383, 135512. [Google Scholar] [CrossRef]
  66. Lu, Z.; Geng, Y.; Li, W.; Yue, R. Integrating spatial carbon factors into ecological network construction in an energy-intensive megaregion toward multi-objective synergy in northern China. Environ. Impact Assess. Rev. 2024, 106, 107480. [Google Scholar] [CrossRef]
  67. Qiu, S.; Yu, Q.; Niu, T.; Fang, M.Z.; Guo, H.Q.; Liu, H.J.; Li, S.; Zhang, J.Y. Restoration and renewal of ecological spatial network in mining cities for the purpose of enhancing carbon Sinks: The case of Xuzhou, China. Ecol. Indic. 2022, 143, 109313. [Google Scholar] [CrossRef]
  68. Dang, H.; Bai, J.; Lü, Y.; Li, J. The cascade failure model under ecological network is effective for quantifying the resilience of urban regions. Sustain. Cities Soc. 2024, 114, 105749. [Google Scholar] [CrossRef]
  69. Liu, H.J.; Niu, T.; Yu, Q.; Yang, L.Z.; Ma, J.; Qiu, S. Evaluation of the Spatiotemporal Evolution of China’s Ecological Spatial Network Function-Structure and Its Pattern Optimization. Remote Sens. 2022, 14, 4593. [Google Scholar] [CrossRef]
  70. Long, Q.; Gao, X.; Hu, Y.; Hu, Y.; Wang, Z.; Mao, W.; Lu, X. Optimization of ecological network to improve water conservation services in the Nianchu River Basin. J. Environ. Manag. 2024, 372, 123368. [Google Scholar] [CrossRef] [PubMed]
  71. Shi, J.; Zhang, D.W.; Yin, J.F.; Wang, Z.Y.; Feng, H.Y.; Liu, Y.; Shi, P.J. Regional ecosystem health improvement pathway design based on ecological network optimization. Ecol. Indic. 2025, 173, 113377. [Google Scholar] [CrossRef]
  72. Chen, X.; Kang, B.; Li, M.; Du, Z.; Zhang, L.; Li, H. Identification of priority areas for territorial ecological conservation and restoration based on ecological networks: A case study of Tianjin City, China. Ecol. Indic. 2023, 146, 109809. [Google Scholar] [CrossRef]
  73. Zhai, Y.; Zhai, G.; Chen, Y.; Liu, J. Research on regional terrestrial carbon storage based on the pattern-process-function. Ecol. Inform. 2024, 80, 102523. [Google Scholar] [CrossRef]
  74. Lü, P.; Liu, Y.; Chen, Y.; Zhang, Z.; Wu, D.; Sun, Q.; Peng, S. Research on synergistic optimization of ecological network under the dual-objective orientation of “blind zone reduction” and “functional structure coordination”: A case study of Wuhan. Shengtai Xuebao 2025, 45, 420–433. [Google Scholar] [CrossRef]
  75. Huang, L.; Wang, J.; Fang, Y.; Zhai, T.; Cheng, H. An integrated approach towards spatial identification of restored and conserved priority areas of ecological network for implementation planning in metropolitan region. Sustain. Cities Soc. 2021, 69, 102865. [Google Scholar] [CrossRef]
  76. Zeng, Y.F.; Chen, X.; Yang, Z.Y.; Yu, Q. Study on the relationship between ecological spatial network structure and regional carbon use Efficiency: A case study of the Wuding river basin. Ecol. Indic. 2023, 155, 110909. [Google Scholar] [CrossRef]
  77. Tian, N.; Zhang, Y.; Li, J.; Du, W.; Liu, X.; Jiang, H.; Bian, H. Evaluation and Optimization of Hydrological Connectivity Based on Graph Theory: A Case Study in Dongliao River Basin, China. Water 2022, 14, 3958. [Google Scholar] [CrossRef]
  78. Morino, Y.; Miwa, H. Network Design Method Resistant to Cascade Failure Considering Betweenness Centrality; Barolli, L., Nishino, H., Miwa, H., Eds.; Springer International Publishing AG: Cham, Switzerland, 2020; Volume 1035, pp. 360–369. [Google Scholar]
  79. Valdez, L.D.; Shekhtman, L.; La Rocca, C.E.; Zhang, X.; Buldyrev, S.V.; Trunfio, P.A.; Braunstein, L.A.; Havlin, S. Cascading failures in complex networks. J. Complex Netw. 2020, 8, cnaa013. [Google Scholar] [CrossRef]
  80. Lim, S.; Suh, S.; Kim, J.; Park, H.S. Urban water infrastructure optimization to reduce environmental impacts and costs. J. Environ. Manag. 2010, 91, 630–637. [Google Scholar] [CrossRef] [PubMed]
  81. Taiwo, B.E.; Al Kafy, A.; Samuel, A.A.; Rahaman, Z.A.; Ayowole, O.E.; Shahrier, M.; Duti, B.M.; Rahman, M.T.; Peter, O.T.; Abosede, O.O. Monitoring and predicting the influences of land use/land cover change on cropland characteristics and drought severity using remote sensing techniques. Environ. Sustain. Indic. 2023, 18, 100248. [Google Scholar] [CrossRef]
  82. Men, D.; Pan, J. Integrating key species distribution and ecosystem service flows to build directed ecological network: Evidence from the Shiyang River Basin, China. J. Environ. Manag. 2025, 381, 125183. [Google Scholar] [CrossRef] [PubMed]
  83. Chen, L.; Sun, R.; Lu, Y. A conceptual model for a process-oriented landscape pattern analysis. Sci. China Earth Sci. 2019, 62, 2050–2057. [Google Scholar] [CrossRef]
  84. Sun, L.; Yen, H.; Chen, L.; Zhao, F.; Yan, L. Distribution of agricultural land regulates stream water isotopes over multiple spatial scale in a subtropical forested watershed. J. Hydrol. 2019, 579, 124206. [Google Scholar] [CrossRef]
  85. Ouyang, Z.; Zheng, H.; Xiao, Y.; Polasky, S.; Liu, J.; Xu, W.; Wang, Q.; Zhang, L.; Xiao, Y.; Rao, E.; et al. Improvements in ecosystem services from investments in natural capital. Science 2016, 352, 1455–1459. [Google Scholar] [CrossRef] [PubMed]
  86. Zhou, L.; Cui, W.; Yang, F. Spatiotemporal variations and driving forces analysis of ecosystem water conservation in coastal areas of China. Ecol. Indic. 2024, 162, 112019. [Google Scholar] [CrossRef]
  87. Chen, H.; Yan, W.; Li, Z.; Wende, W.; Xiao, S. A framework for integrating ecosystem service provision and connectivity in ecological spatial networks: A case study of the Shanghai metropolitan area. Sust. Cities Soc. 2024, 100, 105018. [Google Scholar] [CrossRef]
  88. Gao, M.; Hu, Y.; Bai, Y. Construction of ecological security pattern in national land space from the perspective of the community of life in mountain, water, forest, field, lake and grass: A case study in Guangxi Hechi, China. Ecol. Indic. 2022, 139, 108867. [Google Scholar] [CrossRef]
  89. Xiang, H.; Zhang, J.; Mao, D.; Wang, M.; Yu, F.; Wang, Z.; Li, H. Optimizing ecological security patterns considering zonal vegetation distribution for regional sustainability. Ecol. Eng. 2023, 194, 107055. [Google Scholar] [CrossRef]
Figure 1. Study area.
Remotesensing 17 02548 g001
Figure 2. Research framework.
Remotesensing 17 02548 g002
Figure 3. Method for calculating ecosystem services.
Remotesensing 17 02548 g003
Figure 4. Spatial distribution of ecosystem services in Wuhan. (ae): time slices from 2000 to 2020; (14): habitat quality, soil retention, carbon sequestration, and water conservation.
Remotesensing 17 02548 g004
Figure 5. Spatial distribution of ecological process indicators in Wuhan. (ae): time slices from 2000 to 2020; (14): NDVI, MNDWI, eco-elasticity, and soil erosion.
Remotesensing 17 02548 g005
Figure 6. Ecological network construction in Wuhan. (ae): time slices from 2000 to 2020; (13): landscape connectivity, ecological sensitivity, final sources; (4): final ecological networks.
Remotesensing 17 02548 g006
Figure 7. Resistance surface construction in Wuhan. (ae): time slices from 2000 to 2020; (15): single-factor surfaces for land use, DEM, slope, NDVI, distance to roads; (6): final resistance surface.
Remotesensing 17 02548 g007
Figure 8. EN topological characteristics in Wuhan (2000–2020). (ae): time slices; (14): degree centrality, betweenness centrality, closeness centrality, clustering coefficient.
Remotesensing 17 02548 g008
Figure 9. Boxplots of topological indicators. (ad), respectively, illustrate the temporal variation from 2000 to 2020 in degree centrality, betweenness centrality, closeness centrality, and clustering coefficient. In the boxplot, the box represents the interquartile range (IQR, from the 25th to 75th percentiles), the horizontal line inside the box is the median, the whiskers extend to the most extreme data points within 1.5 times the IQR from the box edges, and any points outside this range are plotted as outliers.
Remotesensing 17 02548 g009
Figure 10. Correlation between ecosystem services and network topological indicators (*** p < 0.001).
Remotesensing 17 02548 g010
Figure 11. Correlation between ecological processes and network topological indicators (*** p < 0.001).
Remotesensing 17 02548 g011
Figure 12. Ecological network optimization in Wuhan, 2020. (a): identified pinch and barrier points; (b,c): ecological network under pattern–function optimization (PFO) and pattern–process optimization (PPO), with priority zones.
Remotesensing 17 02548 g012
Figure 13. Robustness analysis of EN before and after optimization. (ac): original network, PFO, and PPO scenarios.
Remotesensing 17 02548 g013
Figure 14. Robustness analysis of stochastic optimization (SO) versus two optimization scenarios (PFO and PPO) of EN. Robustness comparison under (a): targeted attack; (b): random attack.
Remotesensing 17 02548 g014
Table 1. Data sources.
DataData FormatSpatial ResolutionData Sources/Processing
Normalized difference vegetation index (NDVI)Raster250 mCalculated in Google Earth Engine based on Landsat 8 TM (USGS)
PrecipitationRaster1 kmResource and Environment Science and Data Center (http://www.resdc.cn (accessed on 28 June 2024))
EvapotranspirationRaster1 kmNational Tibetan Plateau/Third Pole Environment Data Center
(https://doi.org/10.11866/db.loess.2021.001 (accessed on 20 November 2024))
Soil dataRaster1 kmHarmonized World Soil Database (HWSD) version 2, International Institute for Applied Systems Analysis (IIASA) (https://iiasa.ac.at/ (accessed on 22 July 2024))
Net Primary Production (NPP)Raster500 mNASA MODIS_MOD17A3
(https://search.earthdata.nasa.gov/search (accessed on 1 July 2024))
Land use dataRaster30 mChina’s Land-Use/Cover Datasets (CLUD)
(https://zenodo.org/records/5210928#.Y-99ymlBxPb (accessed on 21 July 2024))
Digital elevation model (DEM)Raster30 mGeospatial Data Cloud (http://www.gscloud.cn (accessed on 20 November 2024))
RoadVector-Open Street Map
(http://www.openstreetmap.org (accessed on 21 July 2024))
Population densityRaster1 kmCenter for International Earth Science Information Network
(http://sedac.ciesin.columbia.edu/data/collection/gpw-v4/documentation (accessed on 22 July 2024))
Nighttime lightingRaster1 kmChina Long Time Series Artificial Nighttime Lighting Dataset (PANDA-China) (https://data.casearth.cn/sdo/detail/66693dd3819aec0d5564a3f9 (accessed on 20 November 2024))
Table 2. Compatibility of different optimization objectives.
Optimization ObjectivePFOPPODescription
Synergy core ES and connectivityStrongModerateFunctionality: Attention to ecosystem services
Synergy peripheral ecological processes and connectivityModerateStrongFunctionality: Attention to ecological processes
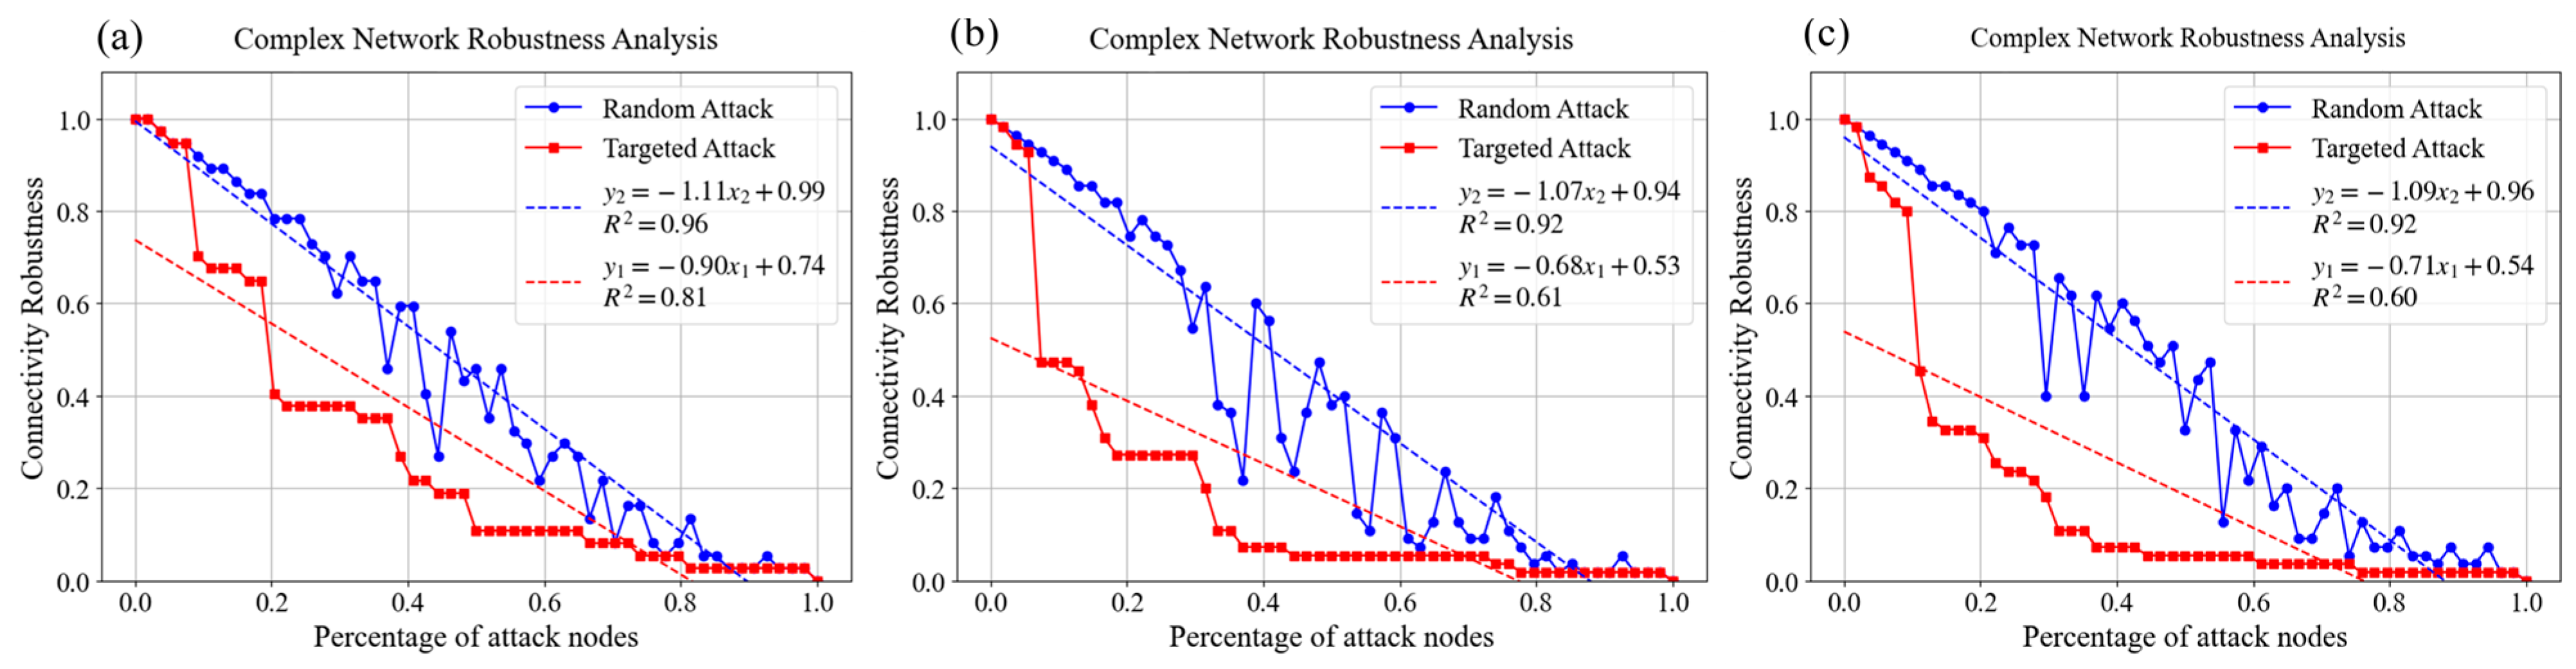
Resistance to targeted attacksStronger (24%)Strong (21%)Robustness: Slope performance under targeted attacks (Figures in brackets indicate slope improvement, the same below)
Resistance to random attacksModerate (4%)Moderate (2%)Robustness: Slope performance under random attacks
Spatial balance and edge redundancyCentralizedEnhancedSpatial distribution: Equilibrium and dispersion of new corridors
Disclaimer/Publisher’s Note: The statements, opinions and data contained in all publications are solely those of the individual author(s) and contributor(s) and not of MDPI and/or the editor(s). MDPI and/or the editor(s) disclaim responsibility for any injury to people or property resulting from any ideas, methods, instructions or products referred to in the content.

