
MoHiPr-TB: A Monthly Gridded Multi-Source Merged Precipitation Dataset for the Tarim Basin Based on Machine Learning


Abstract
1. Introduction
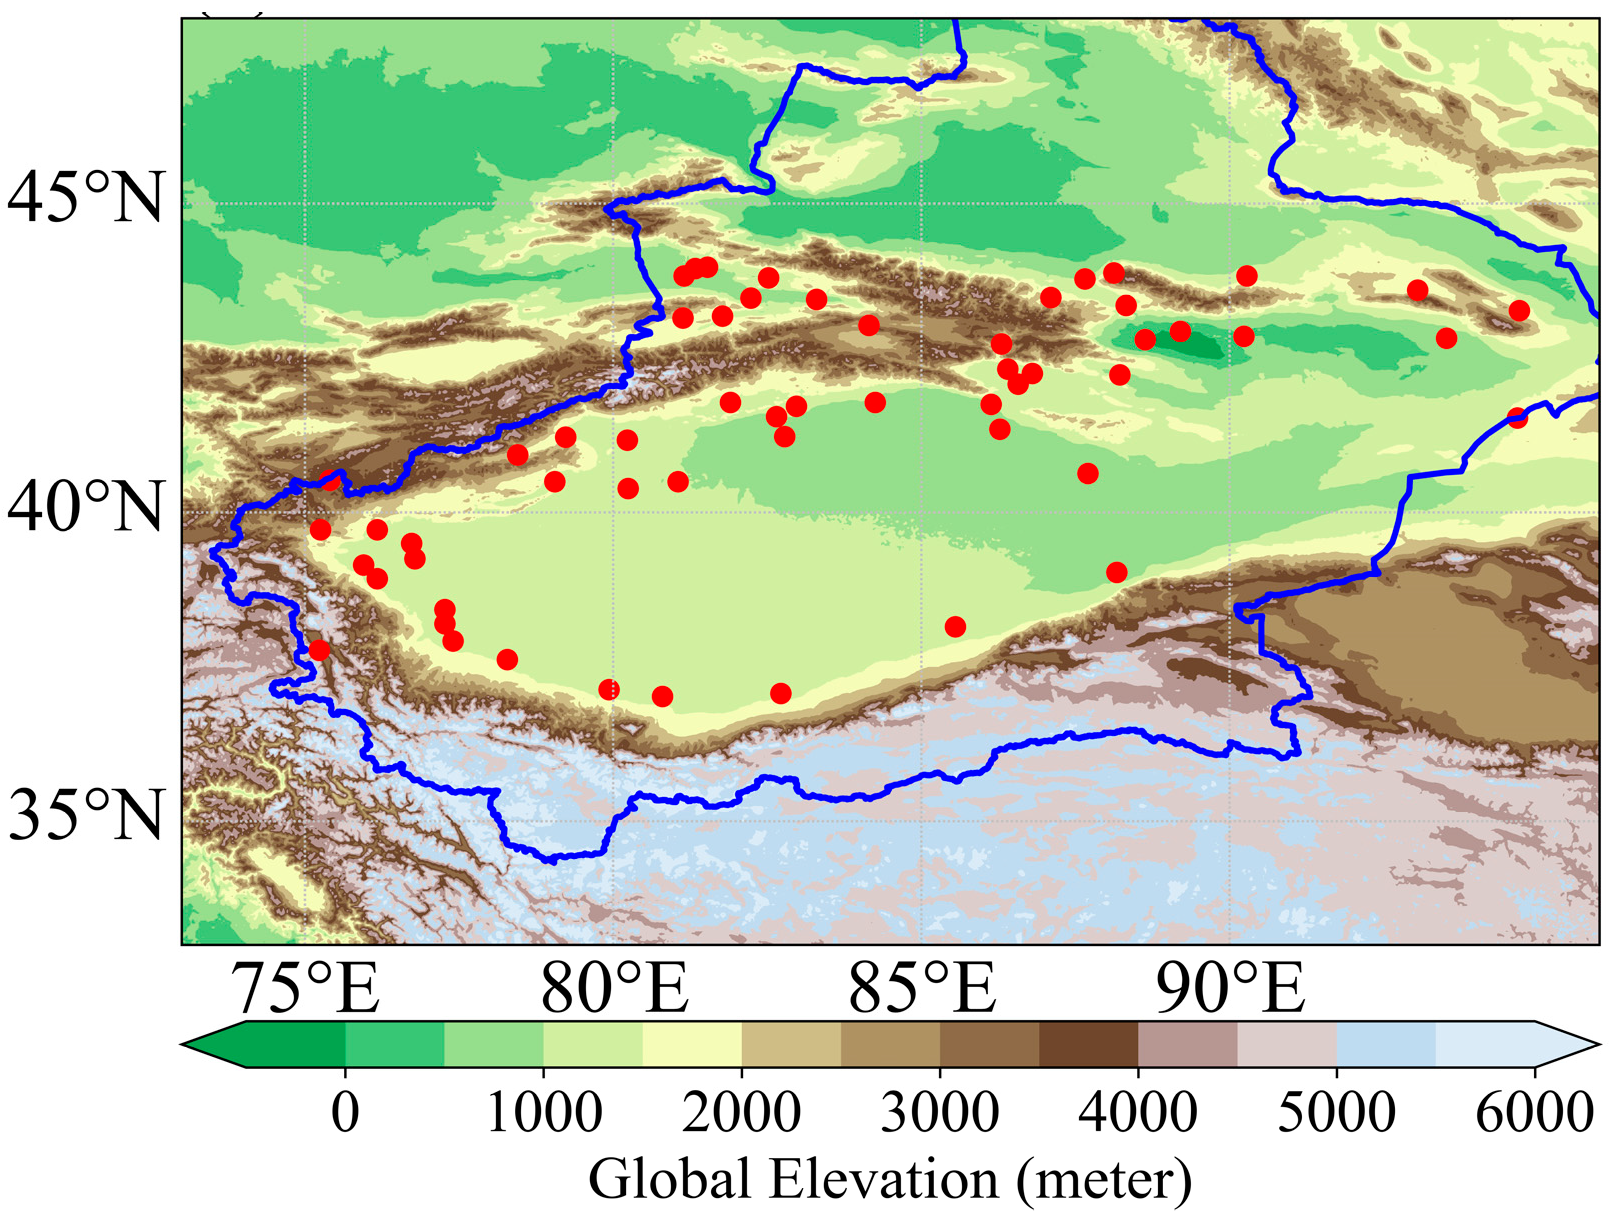
2. Materials and Methods
2.1. Precipitation Datasets
2.2. Method
3. Results
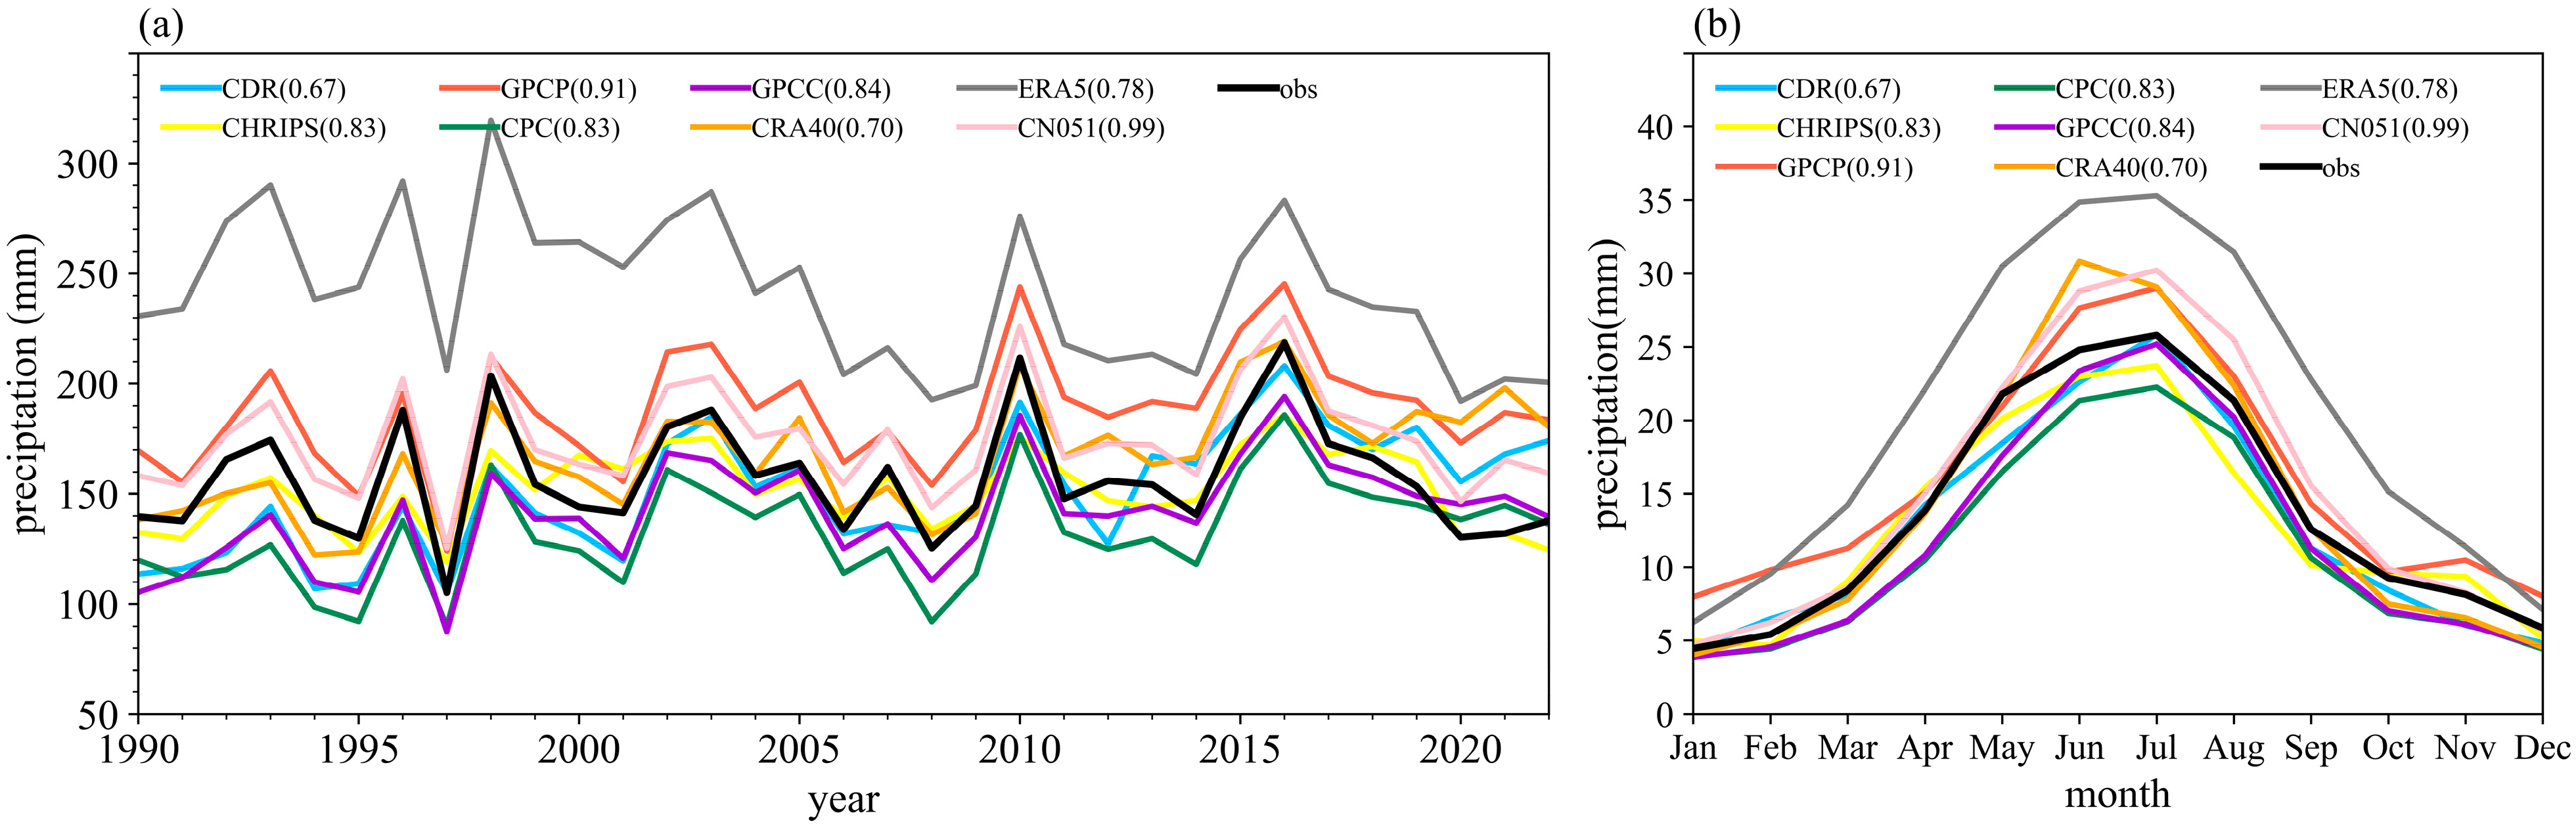
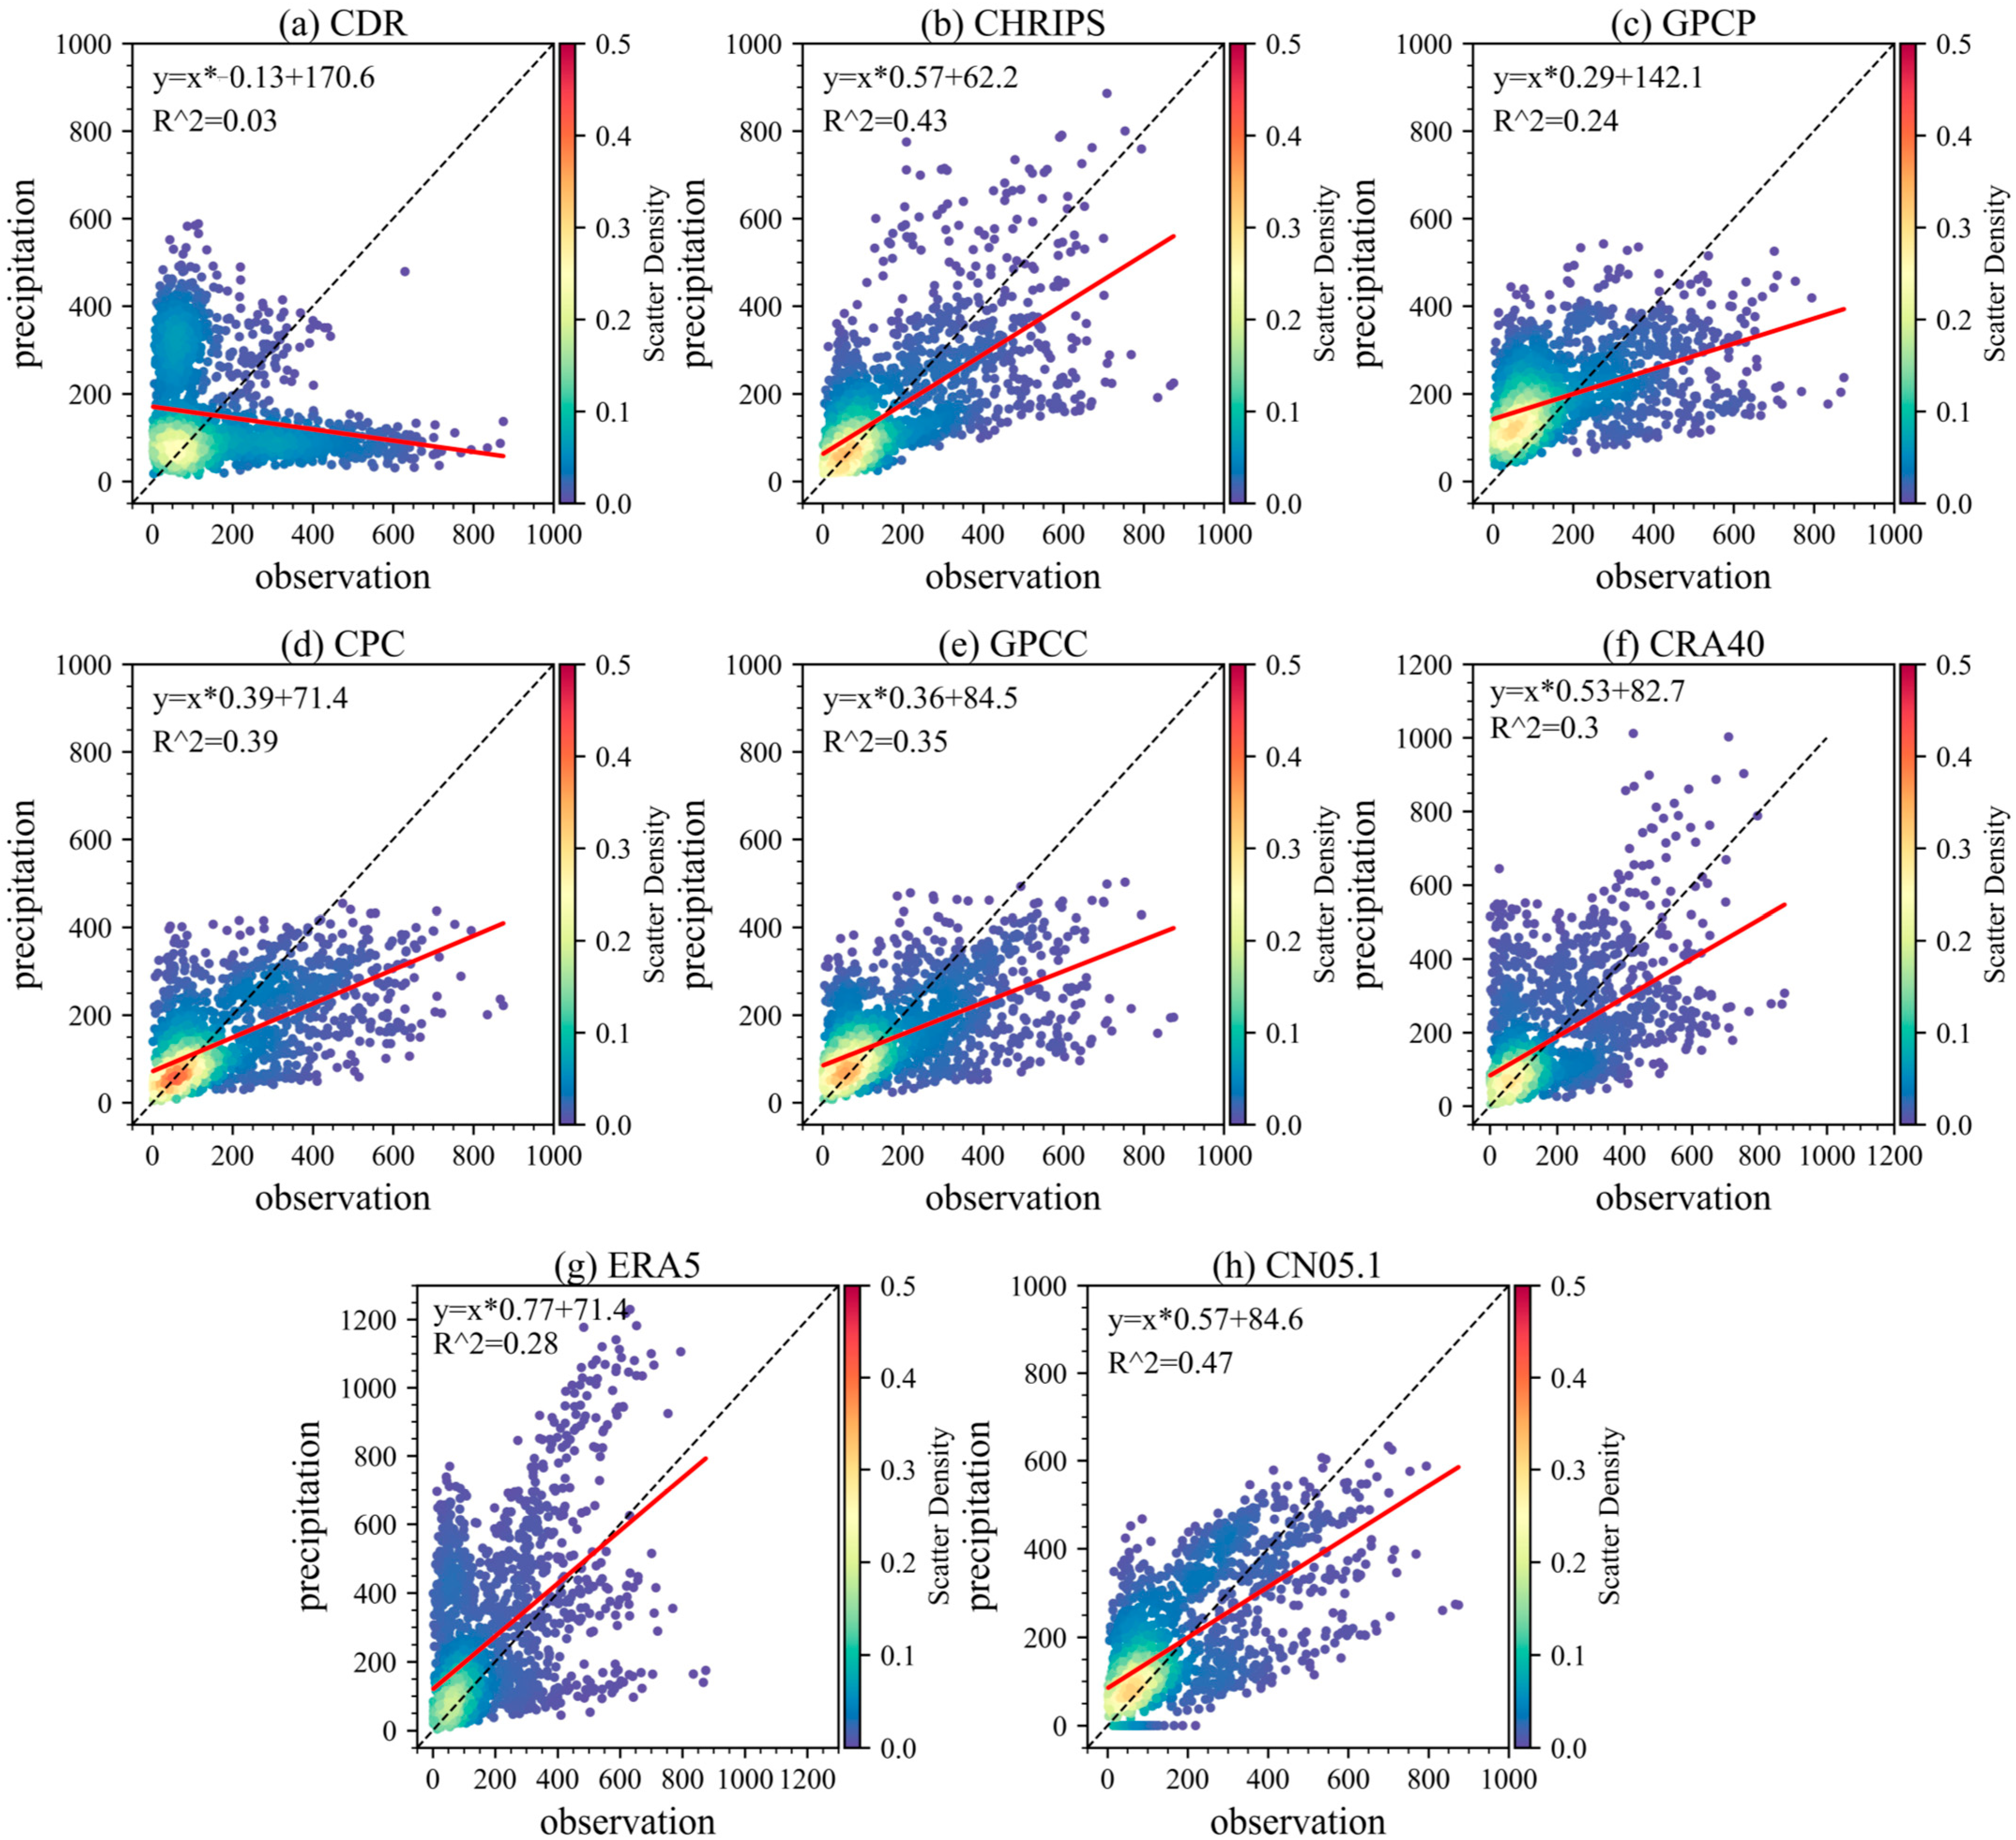
3.1. Evaluation of Eight Gridded Precipitation Datasets
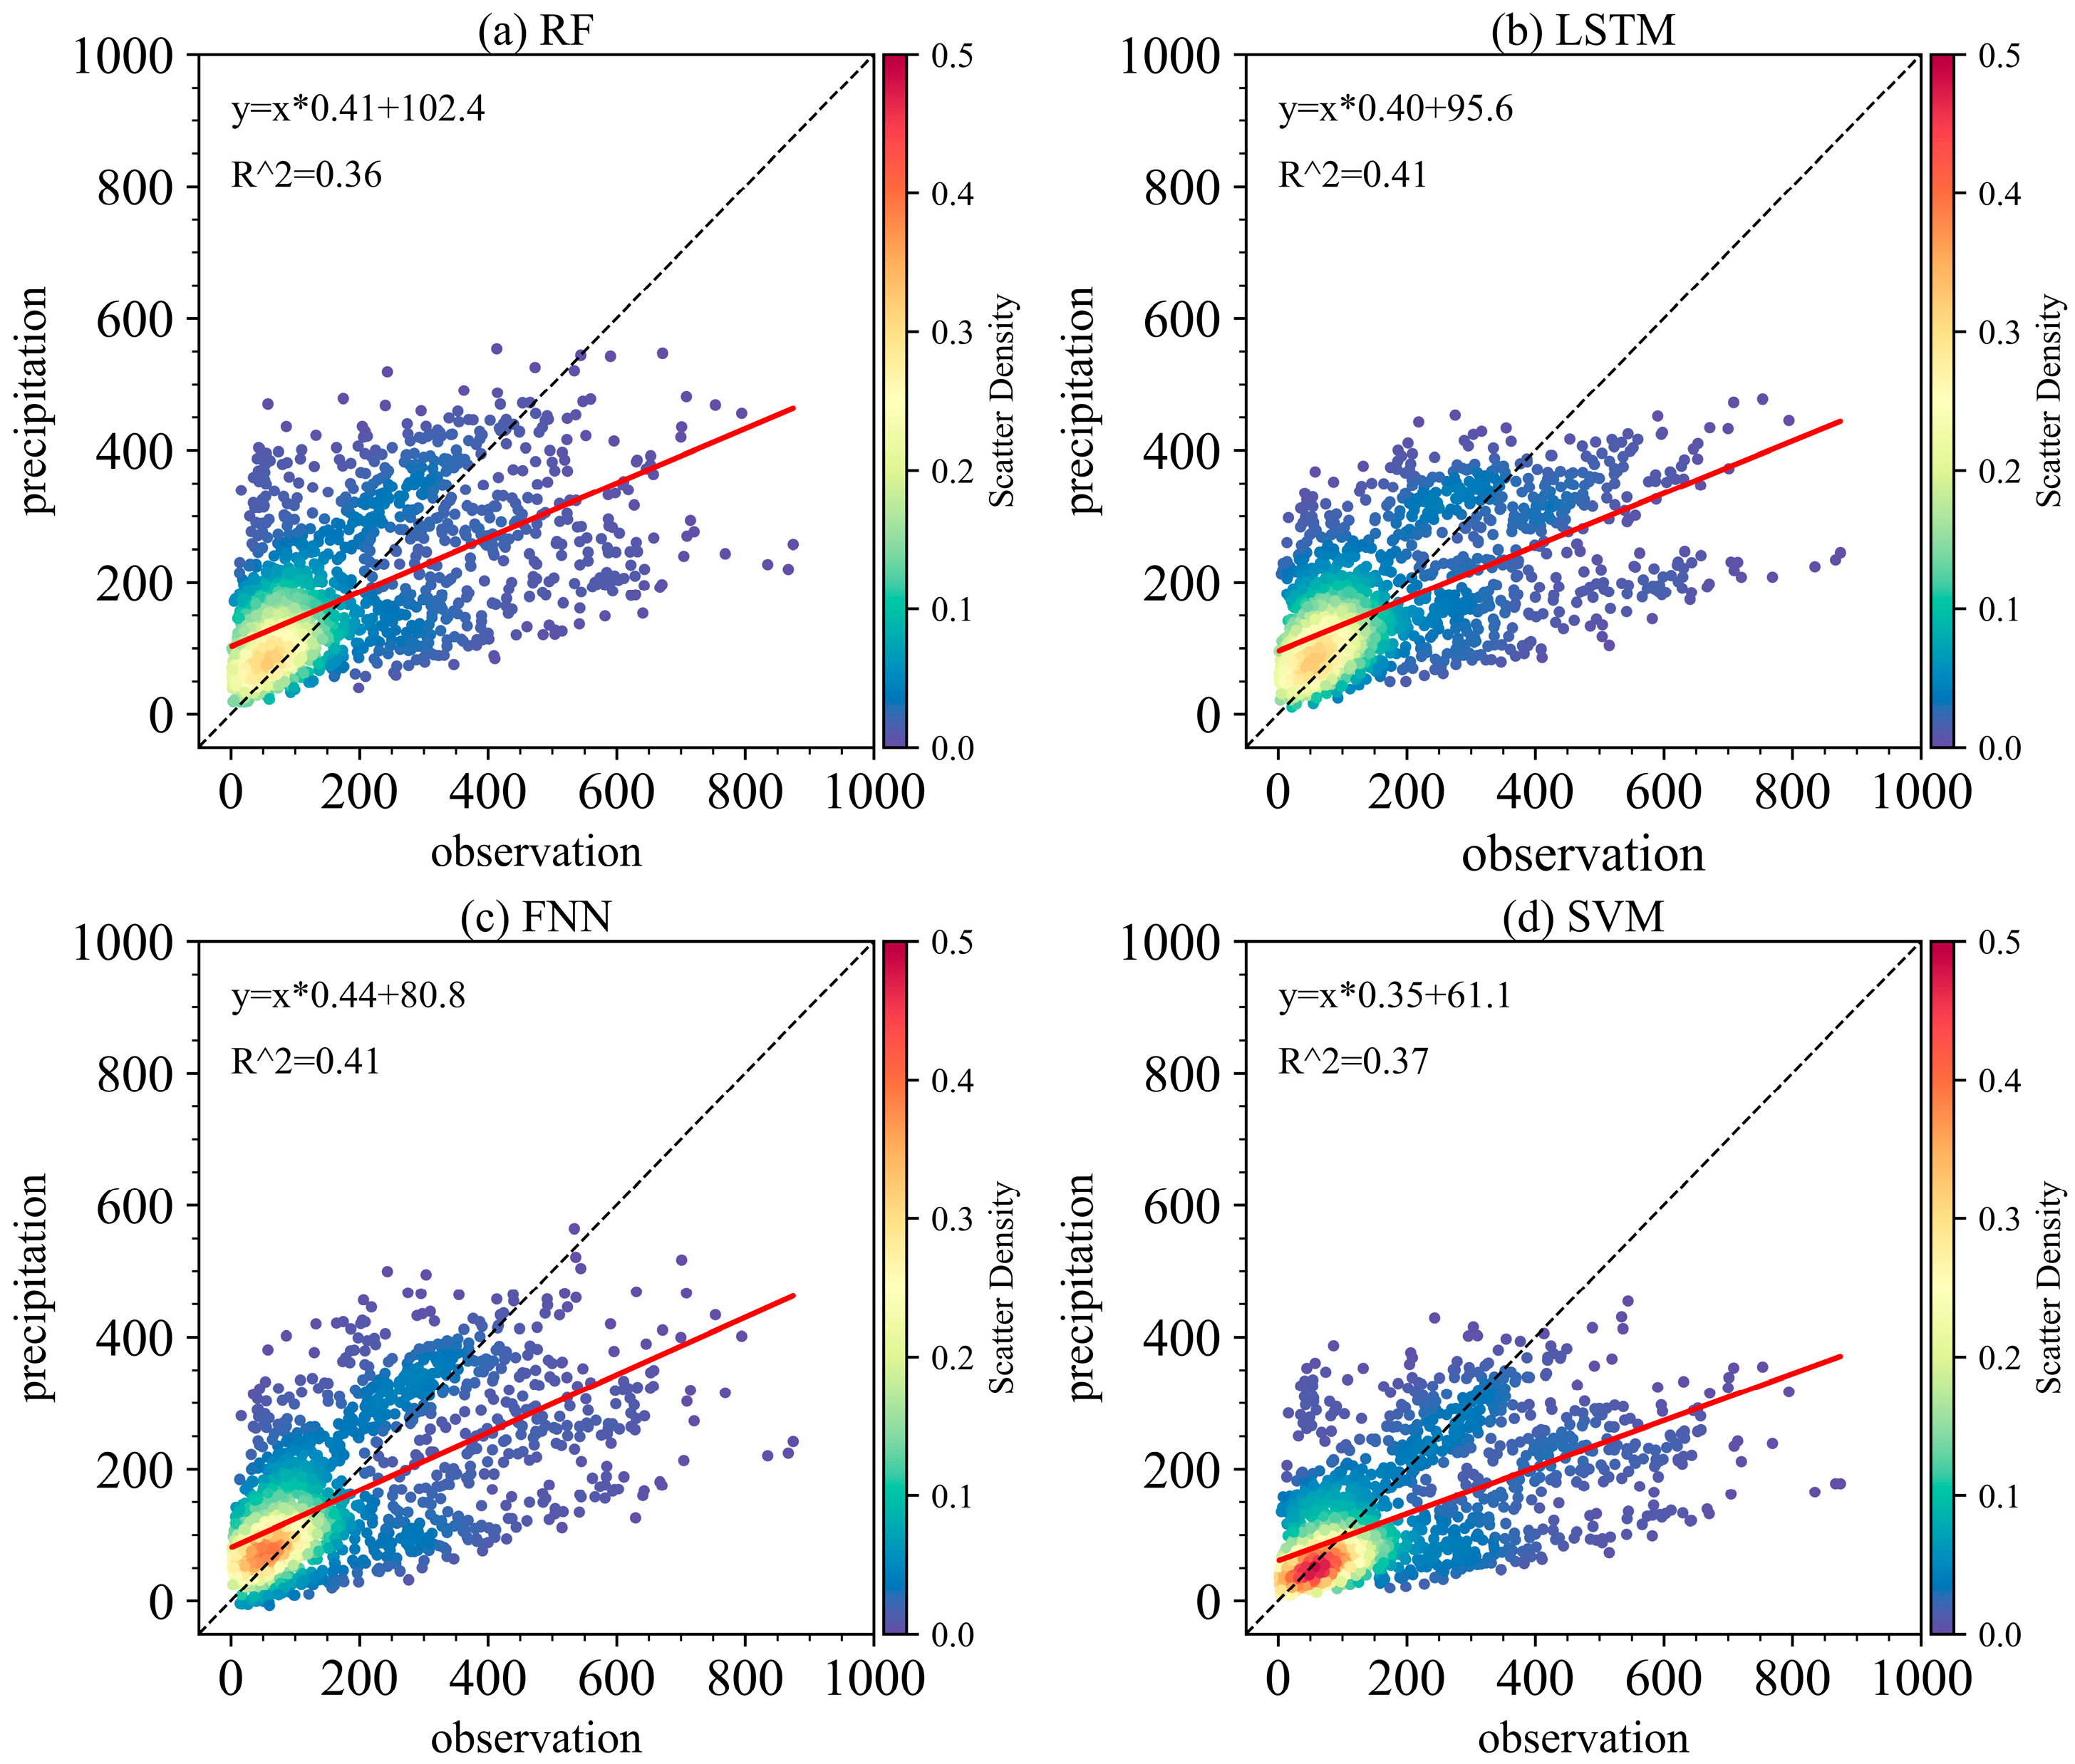
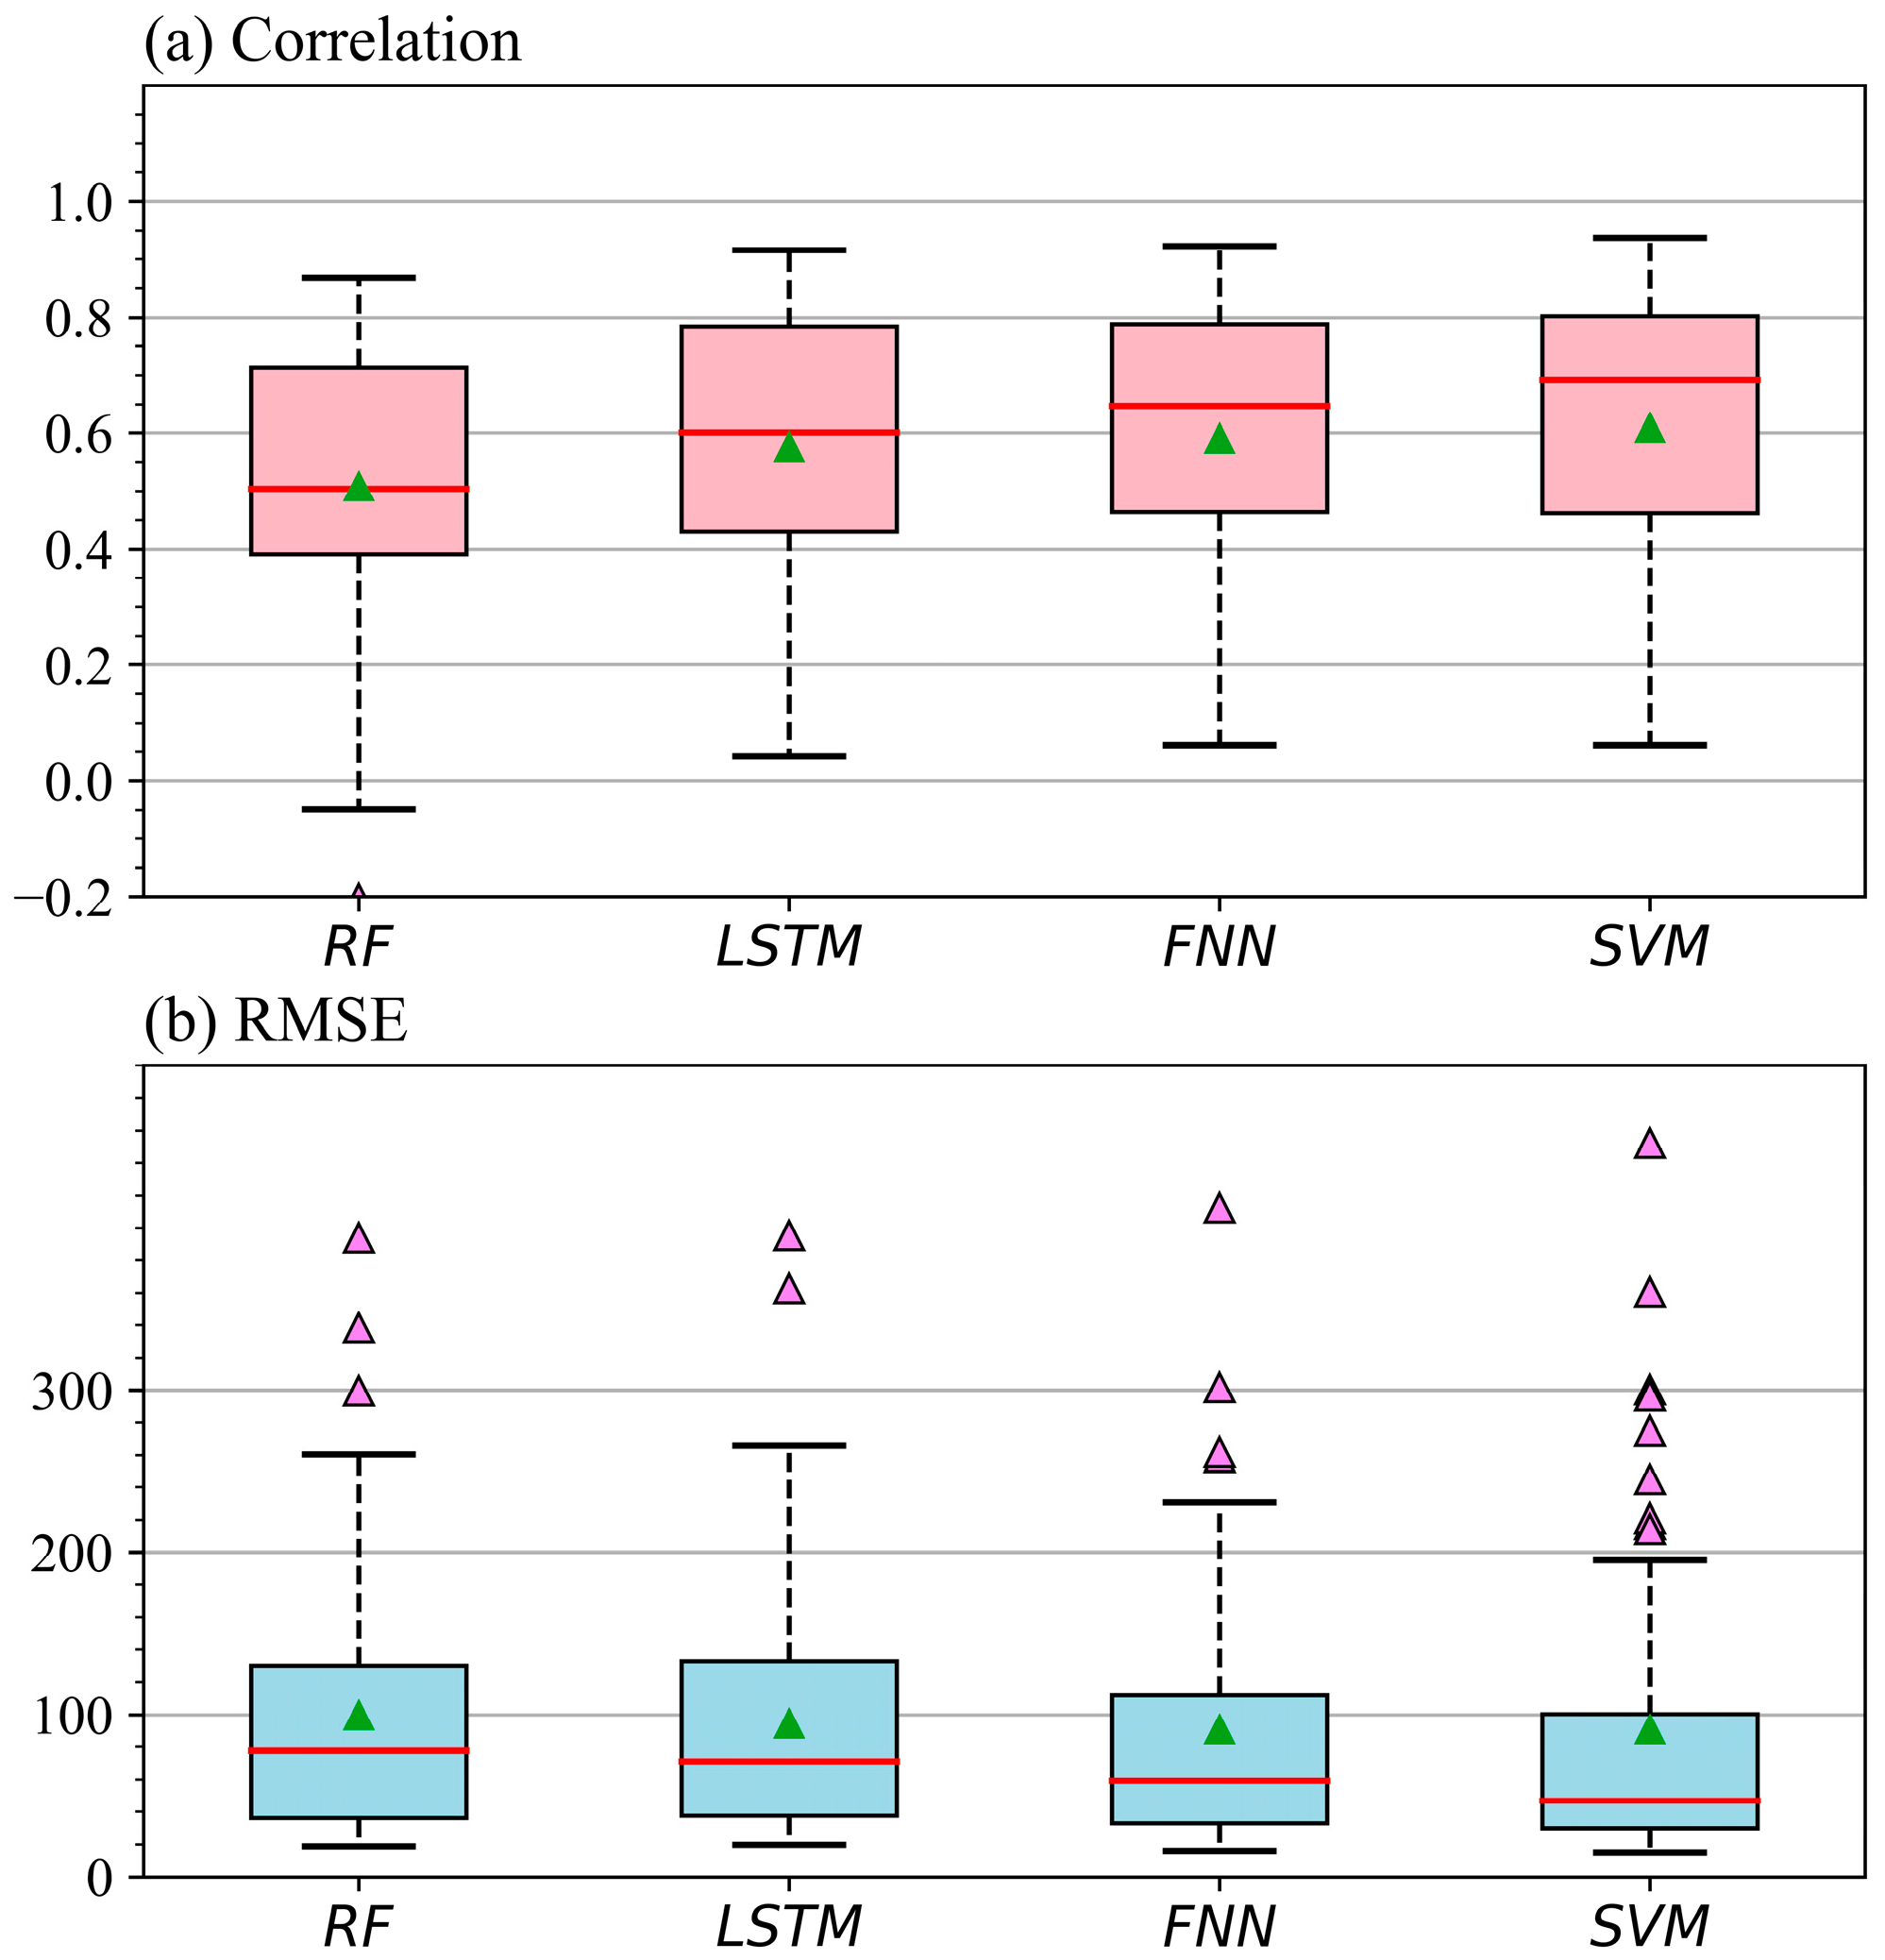
3.2. Evaluation of the Four Merged Station Precipitation Datasets
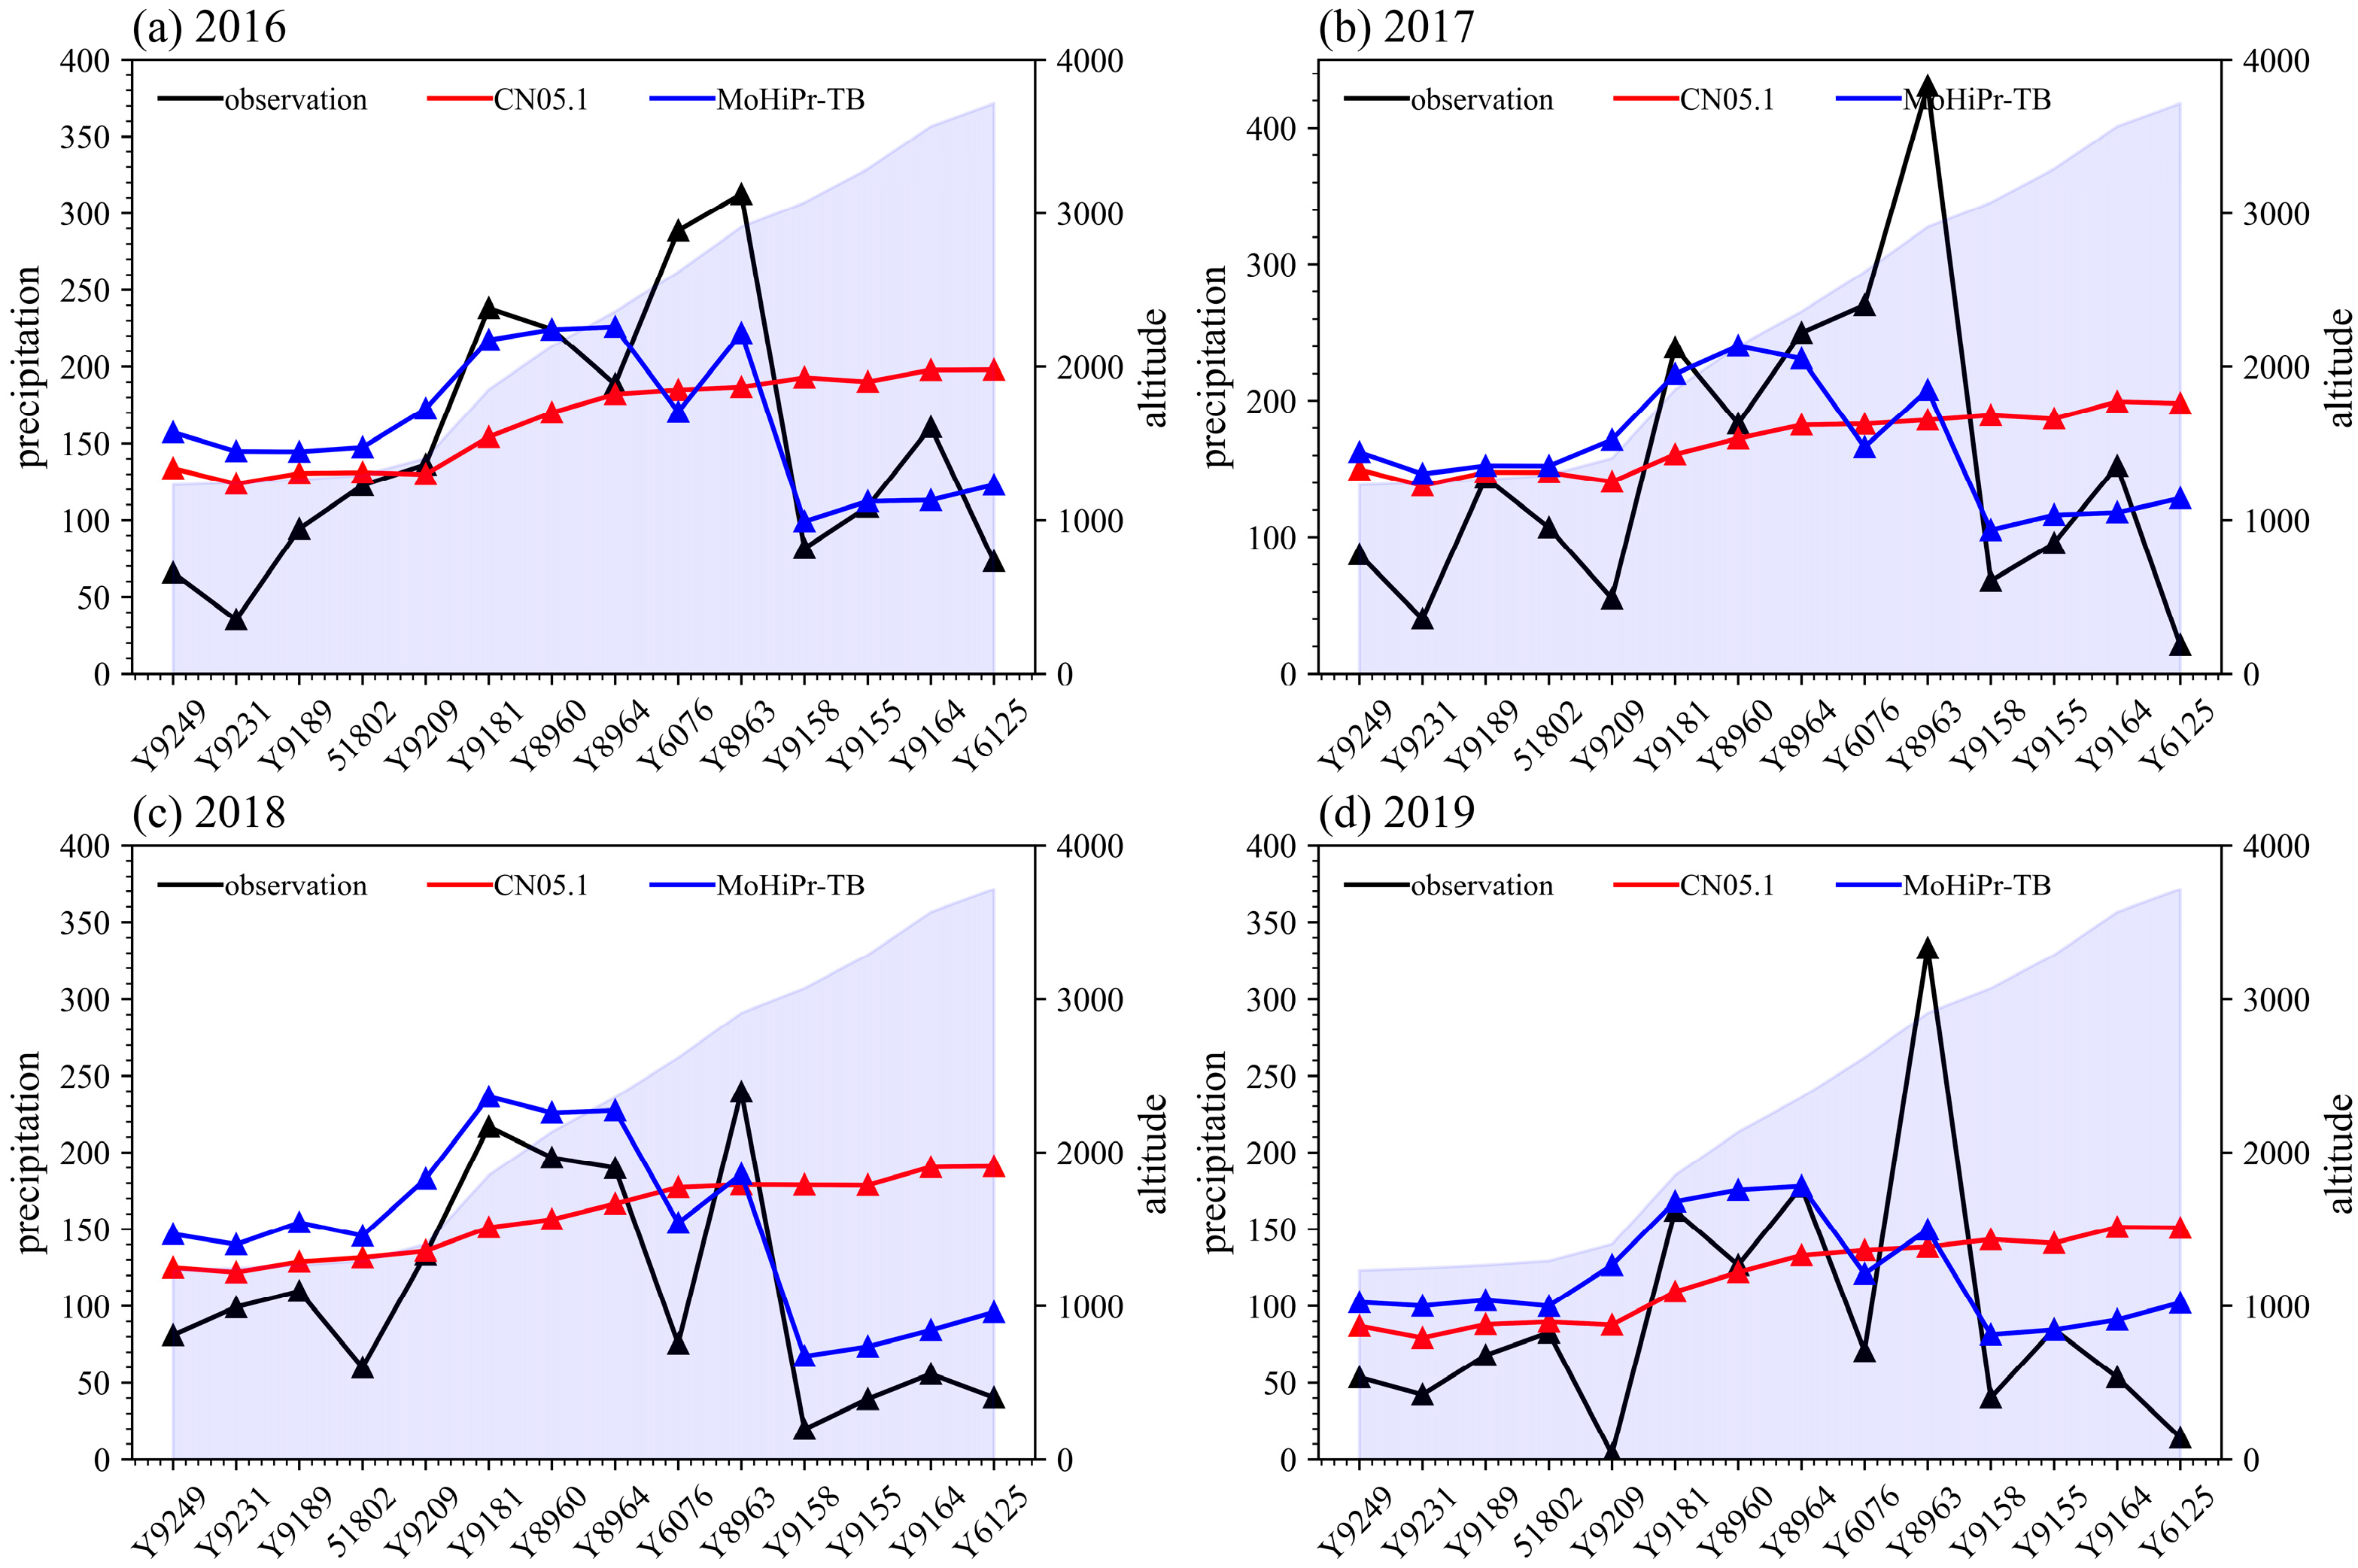
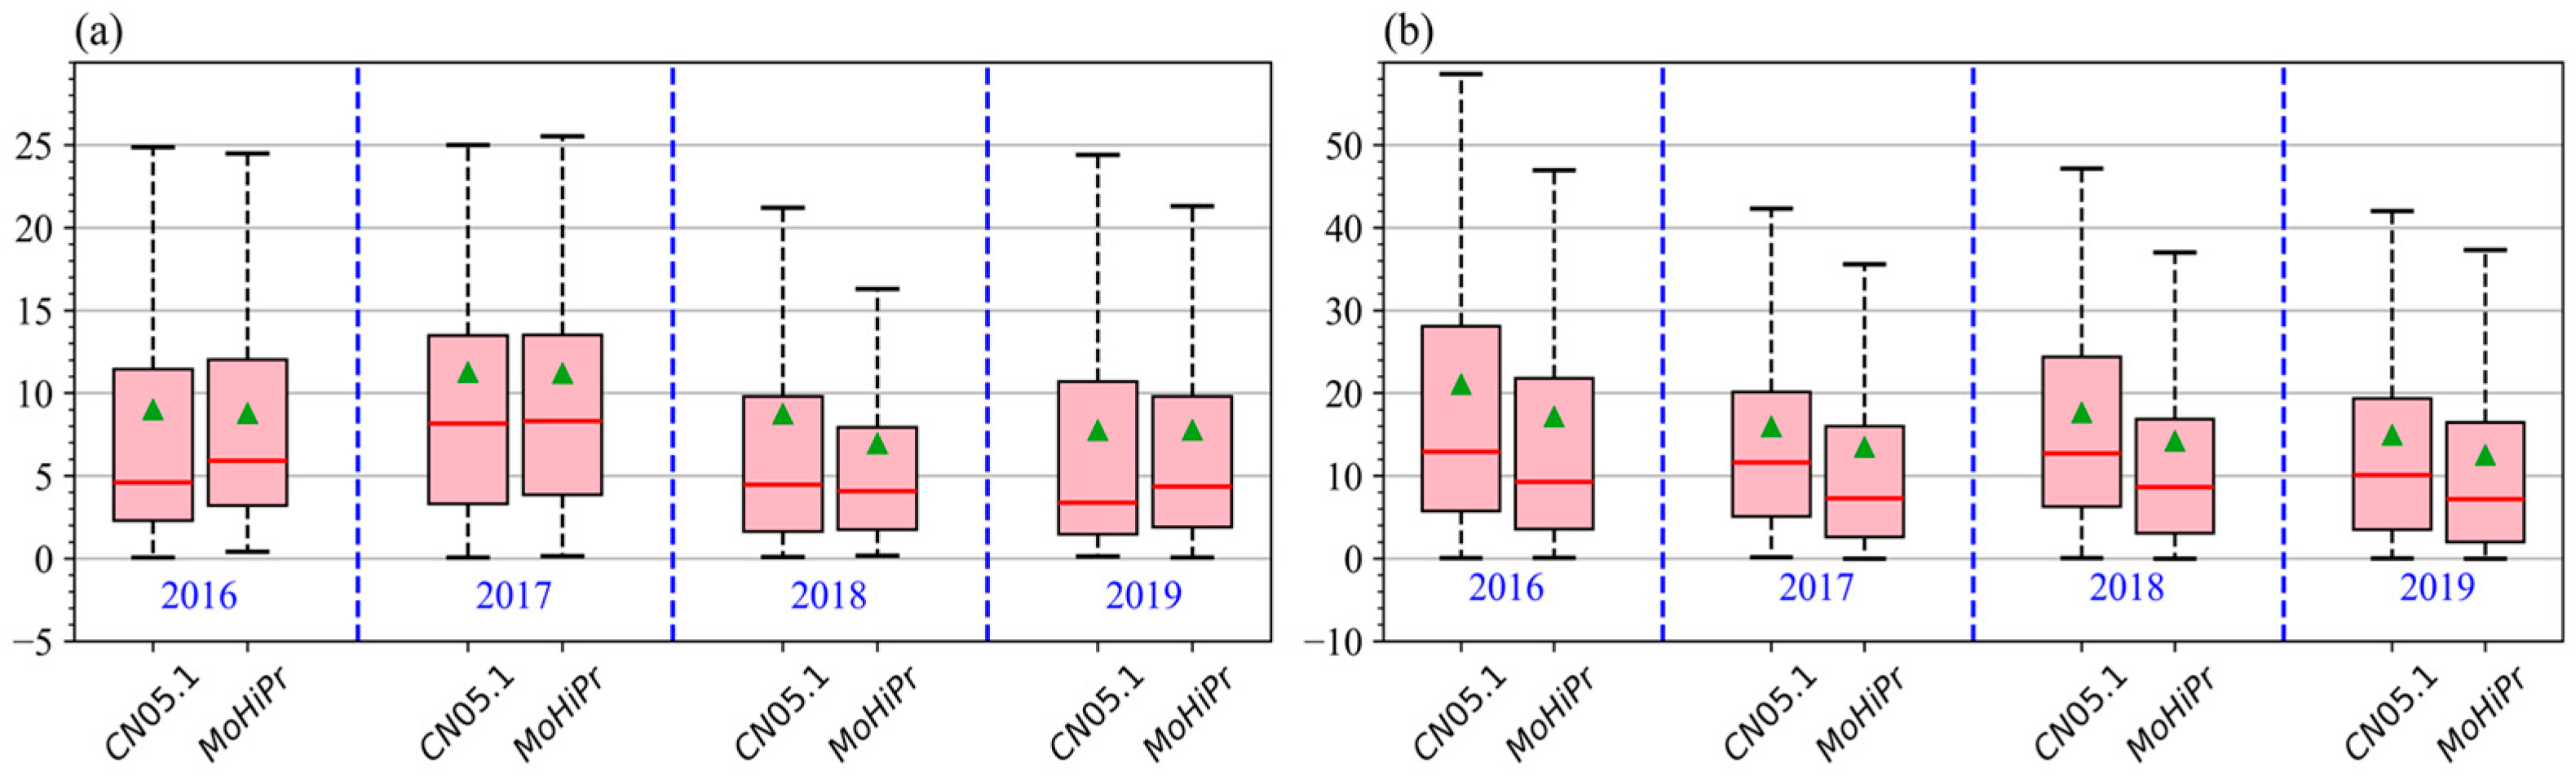
3.3. Evaluation and Bias Correction of the Merged Gridded Precipitation Datasets
4. Discussions
5. Conclusions
Author Contributions
Funding
Data Availability Statement
Acknowledgments
Conflicts of Interest
References
- Huang, W.; Feng, S.; Chen, J.; Chen, F. Physical Mechanisms of Summer Precipitation Variations in the Tarim Basin in Northwestern China. J. Clim. 2015, 28, 3579–3591. [Google Scholar] [CrossRef]
- Peng, S.; Ding, Y.; Liu, W.; Li, Z. 1 Km Monthly Temperature and Precipitation Dataset for China from 1901 to 2017. Earth Syst. Sci. Data 2019, 11, 1931–1946. [Google Scholar] [CrossRef]
- Hou, C.; Huang, D.; Xu, H.; Xu, Z. Evaluation of ERA5 Reanalysis over the Deserts in Northern China. Theor. Appl. Climatol. 2023, 151, 801–816. [Google Scholar] [CrossRef]
- Wang, X.; Xu, M.; Kang, S.; Li, X.; Han, H.; Li, X. Comprehensive Applicability Evaluation of Four Precipitation Products at Multiple Spatiotemporal Scales in Northwest China. J. Arid Land 2024, 16, 1232–1254. [Google Scholar] [CrossRef]
- Su, J.; Wang, J.; Li, H.; Shang, K.; Kang, Y.; Jia, X.; Wu, Z. Preliminary analysis of precipitation characteristics in the Badain Jaran and Tengger Desert. J. Arid Meteorol. 2016, 34, 261–268. [Google Scholar]
- Ning, G.; Luo, M.; Zhang, Q.; Wang, S.; Liu, Z.; Yang, Y.; Wu, S.; Zeng, Z. Understanding the Mechanisms of Summer Extreme Precipitation Events in Xinjiang of Arid Northwest China. J. Geophys. Res. Atmos. 2021, 126, e2020JD034111. [Google Scholar] [CrossRef]
- Ning, S.; Wang, J.; Jin, J.; Xu, X.; Zhang, Y.; Song, F.; Zhang, L. Comprehensive Evaluation of Satellite-Derived Precipitation Products Considering Spatial Distribution Difference of Daily Precipitation over Eastern China. J. Hydrol. Reg. Stud. 2022, 44, 101242. [Google Scholar] [CrossRef]
- Yu, C.; Shao, H.; Yang, X.; Liu, G.; Xin, Q.; Gu, J. Optimization and Simulation of Flat Area Sites Based on Probability Matching and Transfer Intensity Using Remote Sensing Precipitation. Water Resour. Res. 2025, 61, e2024WR038622. [Google Scholar] [CrossRef]
- Huffman, G.J.; Bolvin, D.T.; Braithwaite, D.; Hsu, K.; Kidd, R.J.C.; Nelkin, E.J.; Sorooshian, S.; Tan, J.; Xie, P. NASA Global Precipitation Measurement (GPM) Integrated Multi-satellitE Retrievals for GPM (IMERG). In Algorithm Theoretical Basis Document (ATBD) Version 06; NASA/GSFC: Greenbelt, MD, USA, 2019; 38p. [Google Scholar]
- Chen, C.; Li, Z.; Song, Y.; Duan, Z.; Mo, K.; Wang, Z.; Chen, Q. Performance of Multiple Satellite Precipitation Estimates over a Typical Arid Mountainous Area of China: Spatiotemporal Patterns and Extremes. J. Hydrometeorol. 2020, 21, 533–550. [Google Scholar] [CrossRef]
- Ashouri, H.; Hsu, K.-L.; Sorooshian, S.; Braithwaite, D.K.; Knapp, K.R.; Cecil, L.D.; Nelson, B.R.; Prat, O.P. PERSIANN-CDR: Daily Precipitation Climate Data Record from Multisatellite Observations for Hydrological and Climate Studies. Bull. Am. Meteorol. Soc. 2015, 96, 69–83. [Google Scholar] [CrossRef]
- Funk, C.; Peterson, P.; Landsfeld, M.; Pedreros, D.; Verdin, J.; Shukla, S.; Husak, G.; Rowland, J.; Harrison, L.; Hoell, A.; et al. The Climate Hazards Infrared Precipitation with Stations—A New Environmental Record for Monitoring Extremes. Sci. Data 2015, 2, 150066. [Google Scholar] [CrossRef]
- Joyce, R.J.; Janowiak, J.E.; Arkin, P.A.; Xie, P. CMORPH: A Method That Produces Global Precipitation Estimates from Passive Microwave and Infrared Data at High Spatial and Temporal Resolution. J. Hydrometeorol. 2004, 5, 487–503. [Google Scholar] [CrossRef]
- Jiang, J.; Zhou, T.; Zhang, W. Evaluation of Satellite and Reanalysis Precipitable Water Vapor Data Sets Against Radiosonde Observations in Central Asia. Earth Space Sci. 2019, 6, 1129–1148. [Google Scholar] [CrossRef]
- Adler, R.; Sapiano, M.; Huffman, G.; Wang, J.-J.; Gu, G.; Bolvin, D.; Chiu, L.; Schneider, U.; Becker, A.; Nelkin, E.; et al. The Global Precipitation Climatology Project (GPCP) Monthly Analysis (New Version 2.3) and a Review of 2017 Global Precipitation. Atmosphere 2018, 9, 138. [Google Scholar] [CrossRef] [PubMed]
- Hersbach, H.; Bell, B.; Berrisford, P.; Hirahara, S.; Horányi, A.; Muñoz-Sabater, J.; Nicolas, J.; Peubey, C.; Radu, R.; Schepers, D.; et al. The ERA5 Global Reanalysis. Q. J. R. Meteorol. Soc. 2020, 146, 1999–2049. [Google Scholar] [CrossRef]
- Xie, P.; Chen, M.; Yang, S.; Yatagai, A.; Hayasaka, T.; Fukushima, Y.; Liu, C. A Gauge-Based Analysis of Daily Precipitation over East Asia. J. Hydrometeorol. 2007, 8, 607–626. [Google Scholar] [CrossRef]
- Chen, M.; Shi, W.; Xie, P.; Silva, V.B.S.; Kousky, V.E.; Wayne Higgins, R.; Janowiak, J.E. Assessing Objective Techniques for Gauge-based Analyses of Global Daily Precipitation. J. Geophys. Res. 2008, 113, 2007JD009132. [Google Scholar] [CrossRef]
- Dilinuer, T.; Yao, J.; Chen, J.; Zhao, Y.; Mao, W.; Li, J.; Yang, L. Systematical Evaluation of Three Gridded Daily Precipitation Products Against Rain Gauge Observations Over Central Asia. Front. Earth Sci. 2021, 9, 699628. [Google Scholar] [CrossRef]
- He, Q.; Jin, L. Summary of meteorological field experiments in the Taklimakan Desert, China. J. Xinjiang Univ. (Nat. Sci. Ed. Chin. Eng.) 2021, 38, 334–354. [Google Scholar]
- Liu, Z.; Liu, Y.; Wang, S.; Yang, X.; Wang, L.; Baig, M.H.A.; Chi, W.; Wang, Z. Evaluation of Spatial and Temporal Performances of ERA-Interim Precipitation and Temperature in Mainland China. J. Clim. 2018, 31, 4347–4365. [Google Scholar] [CrossRef]
- Wang, Y.; Zhao, N. Evaluation of Eight High-Resolution Gridded Precipitation Products in the Heihe River Basin. Remote Sens. 2022, 14, 1458. [Google Scholar] [CrossRef]
- Hong, Z.; Han, Z.; Li, X.; Long, D.; Tang, G.; Wang, J. Generation of an Improved Precipitation Data Set from Multisource Information over the Tibetan Plateau. J. Hydrometeorol. 2021, 22, 1275–1295. [Google Scholar] [CrossRef]
- Ma, Z.; Xu, J.; Ma, Y.; Zhu, S.; He, K.; Zhang, S.; Ma, W.; Xu, X. AERA5-Asia: A Long-Term Asian Precipitation Dataset (0.1°, 1-Hourly, 1951–2015, Asia) Anchoring the ERA5-Land under the Total Volume Control by APHRODITE. Bull. Am. Meteorol. Soc. 2022, 103, E1146–E1171. [Google Scholar] [CrossRef]
- Jiang, Y.; Yang, K.; Qi, Y.; Zhou, X.; He, J.; Lu, H.; Li, X.; Chen, Y.; Li, X.; Zhou, B.; et al. TPHiPr: A Long-Term (1979–2020) High-Accuracy Precipitation Dataset (1∕30°, Daily) for the Third Pole Region Based on High-Resolution Atmospheric Modeling and Dense Observations. Earth Syst. Sci. Data 2023, 15, 621–638. [Google Scholar] [CrossRef]
- Han, J.; Miao, C.; Gou, J.; Zheng, H.; Zhang, Q.; Guo, X. A New Daily Gridded Precipitation Dataset for the Chinese Mainland Based on Gauge Observations. Earth Syst. Sci. Data 2023, 15, 3147–3161. [Google Scholar] [CrossRef]
- Zhang, L.; Li, X.; Zheng, D.; Zhang, K.; Ma, Q.; Zhao, Y.; Ge, Y. Merging Multiple Satellite-Based Precipitation Products and Gauge Observations Using a Novel Double Machine Learning Approach. J. Hydrol. 2021, 594, 125969. [Google Scholar] [CrossRef]
- Baez-Villanueva, O.M.; Zambrano-Bigiarini, M.; Beck, H.E.; McNamara, I.; Ribbe, L.; Nauditt, A.; Birkel, C.; Verbist, K.; Giraldo-Osorio, J.D.; Xuan Thinh, N. RF-MEP: A Novel Random Forest Method for Merging Gridded Precipitation Products and Ground-Based Measurements. Remote Sens. Environ. 2020, 239, 111606. [Google Scholar] [CrossRef]
- Fan, Z.; Li, W.; Jiang, Q.; Sun, W.; Wen, J.; Gao, J. A Comparative Study of Four Merging Approaches for Regional Precipitation Estimation. IEEE Access 2021, 9, 33625–33637. [Google Scholar] [CrossRef]
- Wu, J.; Gao, X.J. A gridded daily observation dataset over China region and comparison with the other datasets. Chin. J. Geophys. 2013, 56, 1102–1111. [Google Scholar] [CrossRef]
- Schneider, U.; Hänsel, S.; Finger, P.; Rustemeier, E.; Ziese, M. GPCC Full Data Monthly Version 2022 at 1.0°: Monthly Land-Surface Precipitation from Rain-Gauges Built on GTS-Based and Historic Data: Globally Gridded Monthly Totals 2022, min. 20 MB-max. 300 MB Per Gzip Archive (10 Years Per Archive); Global Precipitation Climatology Centre (GPCC): Offenbach/Main, Germany, 2022. [Google Scholar]
- Yang, F.; Lu, H.; Yang, K.; He, J.; Wang, W.; Wright, J.S.; Li, C.; Han, M.; Li, Y. Evaluation of Multiple Forcing Data Sets for Precipitation and Shortwave Radiation over Major Land Areas of China. Hydrol. Earth Syst. Sci. 2017, 21, 5805–5821. [Google Scholar] [CrossRef]
- Yu, X.; Qian, L.; Wang, W.; Huo, X.; Hu, X.; Wang, Y. Assessing and Comparing Reference Evapotranspiration across Different Climatic Regions of China Using Reanalysis Products. Water 2023, 15, 2027. [Google Scholar] [CrossRef]
- Breiman, L. Random Forests. Mach. Learn. 2001, 45, 5–32. [Google Scholar] [CrossRef]
- Li, Q.; Shi, G.; Shangguan, W.; Nourani, V.; Li, J.; Li, L.; Huang, F.; Zhang, Y.; Wang, C.; Wang, D.; et al. A 1 Km Daily Soil Moisture Dataset over China Using in Situ Measurement and Machine Learning. Earth Syst. Sci. Data 2022, 14, 5267–5286. [Google Scholar] [CrossRef]
- Akbari Asanjan, A.; Yang, T.; Hsu, K.; Sorooshian, S.; Lin, J.; Peng, Q. Short-Term Precipitation Forecast Based on the PERSIANN System and LSTM Recurrent Neural Networks. J. Geophys. Res. Atmos. 2018, 123, 12543–12563. [Google Scholar] [CrossRef]
- Huang, Y.; Yang, L.; Fu, Z. Reconstructing Coupled Time Series in Climate Systems Using Three Kinds of Machine-Learning Methods. Earth Syst. Dynam. 2020, 11, 835–853. [Google Scholar] [CrossRef]
- Song, X.; Liu, Y.; Xue, L.; Wang, J.; Zhang, J.; Wang, J.; Jiang, L.; Cheng, Z. Time-Series Well Performance Prediction Based on Long Short-Term Memory (LSTM) Neural Network Model. J. Pet. Sci. Eng. 2020, 186, 106682. [Google Scholar] [CrossRef]
- Tran Anh, D.; Van, S.P.; Dang, T.D.; Hoang, L.P. Downscaling rainfall using deep learning long short-term memory and feedforward neural network. Int. J. Climatol. 2019, 39, 4170–4188. [Google Scholar] [CrossRef]
- Qin, R.; Zhao, Z.; Xu, J.; Ye, J.-S.; Li, F.-M.; Zhang, F. HRLT: A High-Resolution (1 d, 1 Km) and Long-Term (1961–2019) Gridded Dataset for Surface Temperature and Precipitation across China. Earth Syst. Sci. Data 2022, 14, 4793–4810. [Google Scholar] [CrossRef]
- Mellit, A.; Pavan, A.M.; Benghanem, M. Least Squares Support Vector Machine for Short-Term Prediction of Meteorological Time Series. Theor. Appl. Climatol. 2013, 111, 297–307. [Google Scholar] [CrossRef]
- Bochenek, B.; Ustrnul, Z. Machine Learning in Weather Prediction and Climate Analyses—Applications and Perspectives. Atmosphere 2022, 13, 180. [Google Scholar] [CrossRef]
- Tong, K.; Su, F.; Yang, D.; Hao, Z. Evaluation of Satellite Precipitation Retrievals and Their Potential Utilities in Hydrologic Modeling over the Tibetan Plateau. J. Hydrol. 2014, 519, 423–437. [Google Scholar] [CrossRef]
- Li, J.; Bai, J.; Wang, Y. Time series area of the Ayakkum Lake and its response to climate change. Arid Zone Res. 2018, 35, 85–95. [Google Scholar]


| Short Name | Details | Spatial Resolution | Time Resolution | Data Sources | Temporal Coverage | |
|---|---|---|---|---|---|---|
| 1 | PERSLANN-CDR | Precipitation Estimation from Remotely Sensed Information Using Artificial Neural Networks–Climate Data Record | 0.25 | daily | S+G | 1983–2022 |
| 2 | CHIRPS | Climate Hazards Group Infrared Precipitation with Stations (CHIRPS) V2.0 | 0.25 | daily | S+G+R | 1981–2022 |
| 3 | GPCP | Global Precipitation Climatology Project monthly precipitation dataset version 2.3 | 2.5 | monthly | S+G | 1979–2022 |
| 4 | CRA40-LAND | China’s First Generation of Global Land Surface Reanalysis | 0.25 | monthly | R | 1979–2022 |
| 5 | ERA5 | European Centre for Medium-Range Weather Forecasts (ECMWF) Reanalysis 5 | 0.1 | monthly | R | 1979–2022 |
| 6 | CPC | Climate Prediction Center (CPC) Unified Gauge-Based Analysis of Global Daily Precipitation | 0.5 | daily | G | 1979–2022 |
| 7 | GPCC | Global Precipitation Climatology Centre (GPCC) Full Data Monthly Product Version 2022 | 1.0 | monthly | G | 1982–2022 |
| 8 | CN05.1 | A gridded daily observation dataset over China region | 0.25 | daily | G | 1961–2022 |
| 9 | Observations | China Meteorological Station Observations | monthly | 1990–2022 | ||
| 10 | CLDAS2.0 | China Meteorological Administration (CMA) Land Data Assimilation System | daily | 1998–2022 |
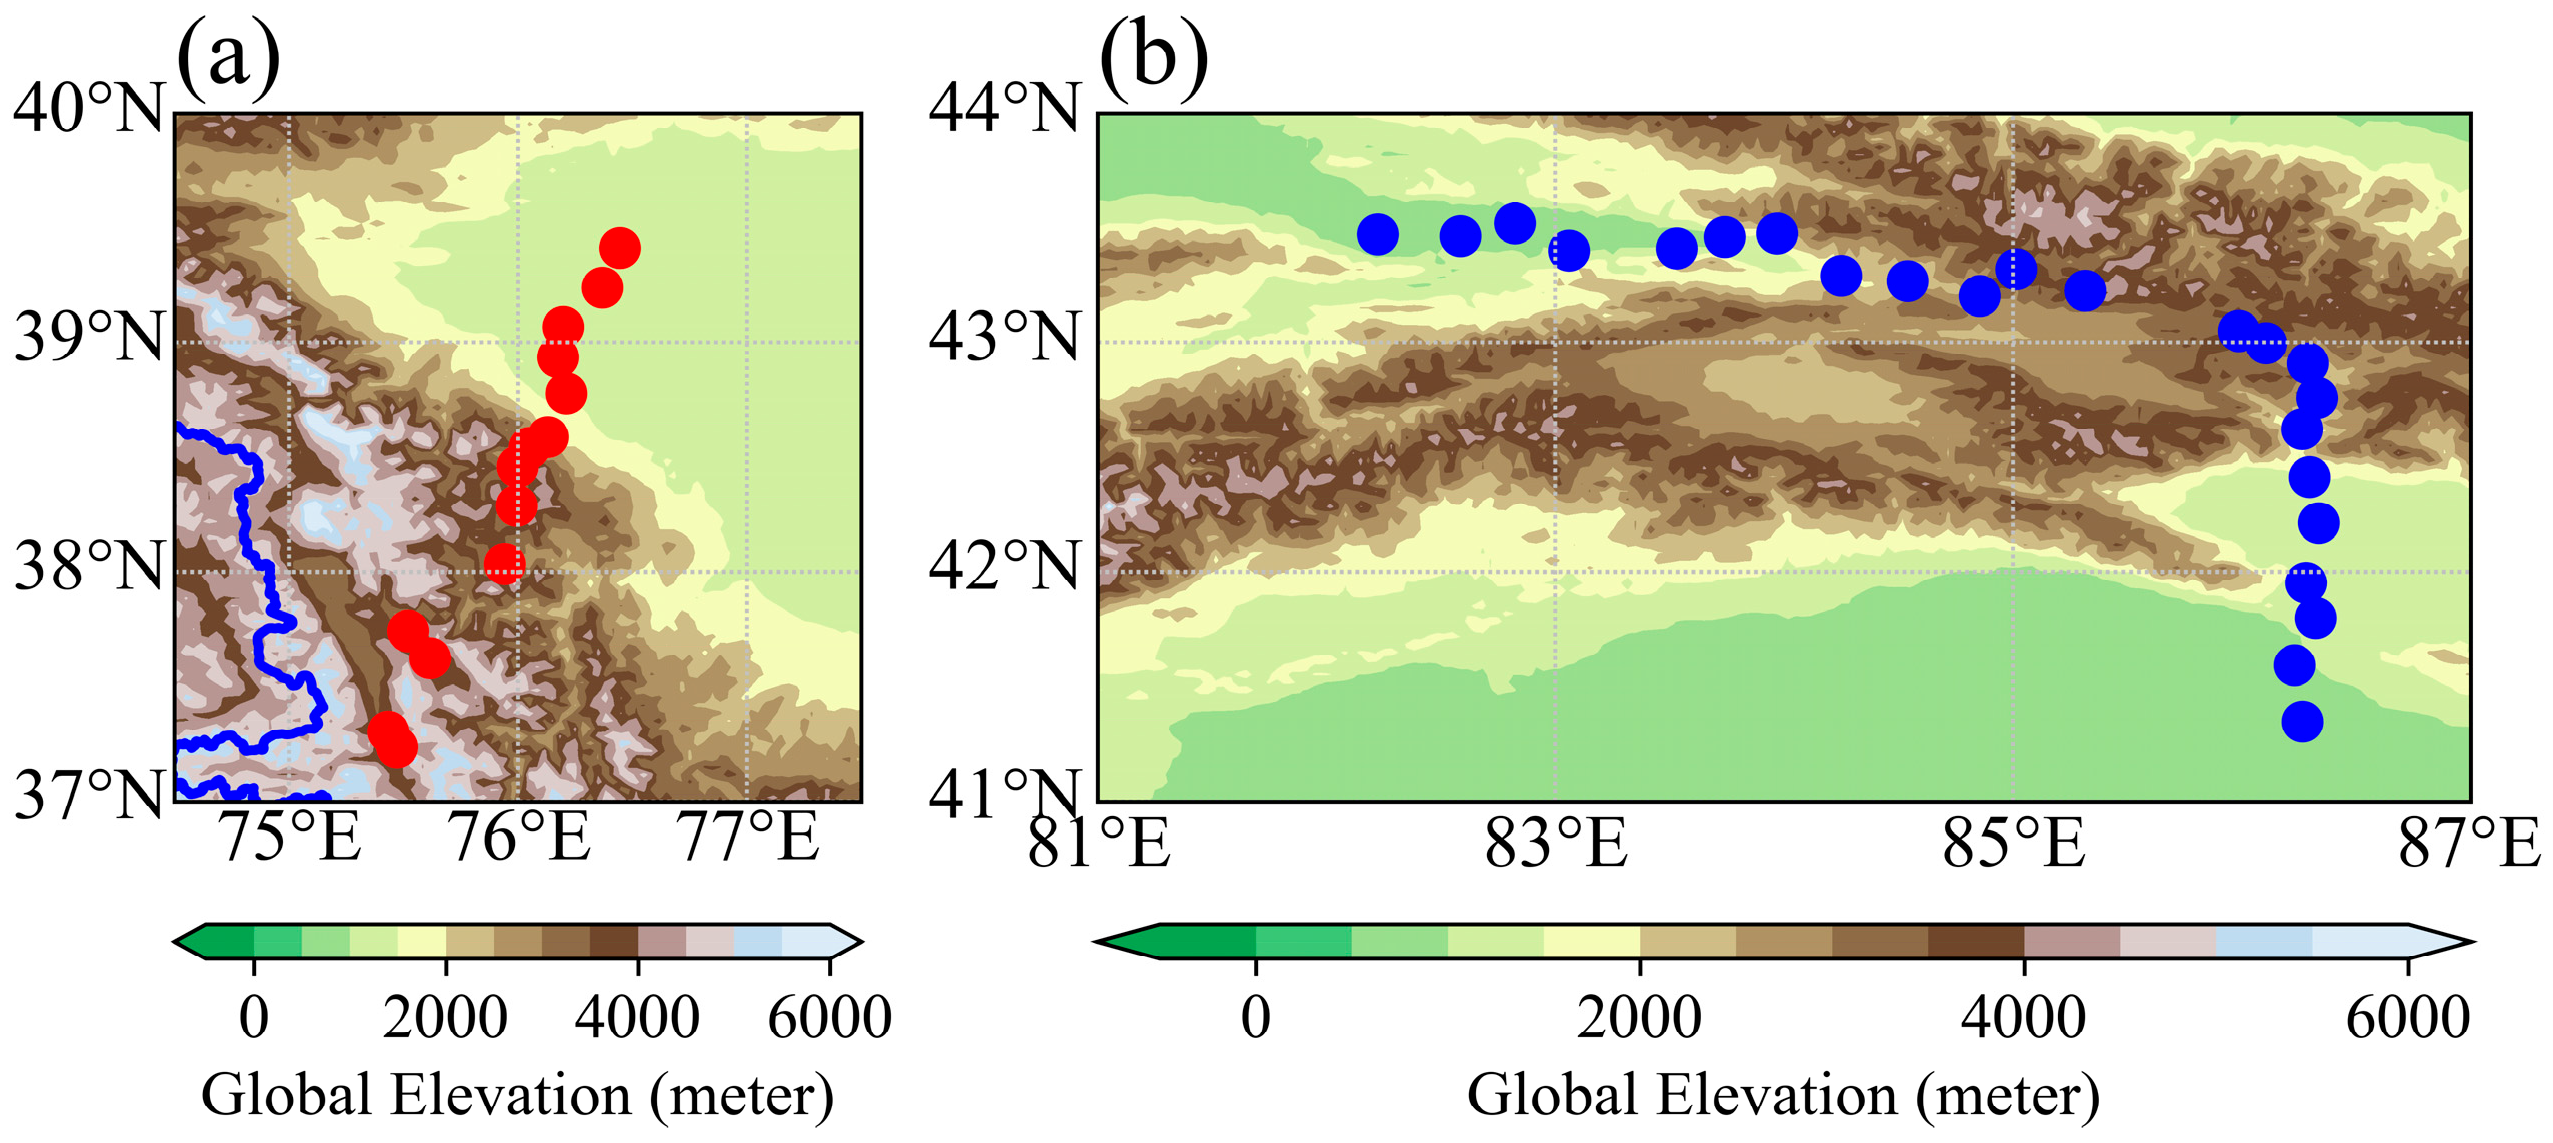
| Station Number | Y9249 | Y9231 | Y9189 | 51802 | Y9209 | Y9181 | Y8960 | Y8964 | Y6076 | Y8963 | Y9158 | Y9155 | Y9164 |
|---|---|---|---|---|---|---|---|---|---|---|---|---|---|
| Latitude | 39.4 | 39.2 | 39.1 | 38.9 | 38.8 | 38.6 | 38.5 | 38.5 | 38.0 | 38.3 | 37.7 | 37.6 | 37.3 |
| Longitude | 76.4 | 76.4 | 76.2 | 76.2 | 76.2 | 76.1 | 76.1 | 76.0 | 75.9 | 76.0 | 75.5 | 75.6 | 75.4 |
| Elevation | 1232 | 1246.5 | 1266.7 | 1294.3 | 1403.6 | 1852 | 2135 | 2360 | 2619 | 2911 | 3070.6 | 3288.6 | 3566.4 |
| Y6125 | 51435 | 5226 | Y6464 | Y6402 | Y6409 | 5214 | 5248 | 5249 | Y5815 | Y5829 | Y5831 | ||
| Latitude | 37.2 | 43.5 | 43.5 | 43.5 | 43.4 | 43.4 | 43.5 | 43.5 | 43.3 | 43.3 | 43.2 | 43.3 | |
| Longitude | 75.5 | 82.2 | 82.6 | 82.8 | 83.1 | 83.5 | 83.7 | 84.0 | 84.3 | 84.5 | 84.9 | 85.0 | |
| Elevation | 3716 | 774.4 | 820 | 806 | 961 | 1025 | 1052 | 1533 | 1609 | 1967 | 3048 | 3574 | |
| Y5854 | Y8317 | Y8233 | Y8232 | 51467 | Y5866 | Y8229 | Y5889 | Y8224 | Y8310 | Y5870 | 51655 | ||
| Latitude | 43.2 | 43.1 | 43.0 | 42.9 | 42.8 | 42.6 | 42.2 | 42.0 | 41.8 | 41.6 | 42.4 | 41.4 | |
| Longitude | 85.3 | 86.0 | 86.1 | 86.3 | 86.3 | 86.3 | 86.3 | 86.3 | 86.3 | 86.2 | 86.3 | 86.3 | |
| Elevation | 3252 | 3289 | 3001 | 2191 | 1778 | 1562 | 1062 | 1079 | 1095 | 909 | 1218 | 885.4 |
Disclaimer/Publisher’s Note: The statements, opinions and data contained in all publications are solely those of the individual author(s) and contributor(s) and not of MDPI and/or the editor(s). MDPI and/or the editor(s) disclaim responsibility for any injury to people or property resulting from any ideas, methods, instructions or products referred to in the content. |
© 2025 by the authors. Licensee MDPI, Basel, Switzerland. This article is an open access article distributed under the terms and conditions of the Creative Commons Attribution (CC BY) license (https://creativecommons.org/licenses/by/4.0/).
Share and Cite
Chen, P.; Yao, J.; Chen, J.; Yao, M.; Ma, L.; Mao, W.; Sun, B. MoHiPr-TB: A Monthly Gridded Multi-Source Merged Precipitation Dataset for the Tarim Basin Based on Machine Learning. Remote Sens. 2025, 17, 2483. https://doi.org/10.3390/rs17142483
Chen P, Yao J, Chen J, Yao M, Ma L, Mao W, Sun B. MoHiPr-TB: A Monthly Gridded Multi-Source Merged Precipitation Dataset for the Tarim Basin Based on Machine Learning. Remote Sensing. 2025; 17(14):2483. https://doi.org/10.3390/rs17142483
Chicago/Turabian StyleChen, Ping, Junqiang Yao, Jing Chen, Mengying Yao, Liyun Ma, Weiyi Mao, and Bo Sun. 2025. "MoHiPr-TB: A Monthly Gridded Multi-Source Merged Precipitation Dataset for the Tarim Basin Based on Machine Learning" Remote Sensing 17, no. 14: 2483. https://doi.org/10.3390/rs17142483
APA StyleChen, P., Yao, J., Chen, J., Yao, M., Ma, L., Mao, W., & Sun, B. (2025). MoHiPr-TB: A Monthly Gridded Multi-Source Merged Precipitation Dataset for the Tarim Basin Based on Machine Learning. Remote Sensing, 17(14), 2483. https://doi.org/10.3390/rs17142483