Article

Driving Forces and Future Scenario Simulation of Urban Agglomeration Expansion in China: A Case Study of the Pearl River Delta Urban Agglomeration

School of Geography and Planning, Sun Yat-Sen University, Guangzhou 510006, China
*
Author to whom correspondence should be addressed.
These authors are co-first author.
Remote Sens. 2025, 17(14), 2455; https://doi.org/10.3390/rs17142455
Submission received: 15 April 2025 / Revised: 20 June 2025 / Accepted: 9 July 2025 / Published: 15 July 2025

Abstract

The remote sensing monitoring of land use changes and future scenario simulation hold crucial significance for accurately characterizing urban expansion patterns, optimizing urban land use configurations, and thereby promoting coordinated regional development. Through the integration of multi-source data, this study systematically analyzes the spatiotemporal trajectories and driving forces of land use changes in the Pearl River Delta urban agglomeration (PRD) from 1990 to 2020 and further simulates the spatial patterns of urban land use under diverse development scenarios from 2025 to 2035. The results indicate the following: (1) During 1990–2020, urban expansion in the Pearl River Delta urban agglomeration exhibited a “stepwise growth” pattern, with an annual expansion rate of 3.7%. Regional land use remained dominated by forest (accounting for over 50%), while construction land surged from 6.5% to 21.8% of total land cover. The gravity center trajectory shifted southeastward. Concurrently, cropland fragmentation has intensified, accompanied by deteriorating connectivity of ecological lands. (2) Urban expansion in the PRD arises from synergistic interactions between natural and socioeconomic drivers. The Geographically and Temporally Weighted Regression (GTWR) model revealed that natural constraints—elevation (regression coefficients ranging −0.35 to −0.05) and river network density (−0.47 to −0.15)—exhibited significant spatial heterogeneity. Socioeconomic drivers dominated by year-end paved road area (0.26–0.28) and foreign direct investment (0.03–0.11) emerged as core expansion catalysts. Geographic detector analysis demonstrated pronounced interaction effects: all factor pairs exhibited either two-factor enhancement or nonlinear enhancement effects, with interaction explanatory power surpassing individual factors. (3) Validation of the Patch-generating Land Use Simulation (PLUS) model showed high reliability (Kappa coefficient = 0.9205, overall accuracy = 95.9%). Under the Natural Development Scenario, construction land would exceed the ecological security baseline, causing 408.60 km2 of ecological space loss; Under the Ecological Protection Scenario, mandatory control boundaries could reduce cropland and forest loss by 3.04%, albeit with unused land development intensity rising to 24.09%; Under the Economic Development Scenario, cross-city contiguous development zones along the Pearl River Estuary would emerge, with land development intensity peaking in Guangzhou–Foshan and Shenzhen–Dongguan border areas. This study deciphers the spatiotemporal dynamics, driving mechanisms, and scenario outcomes of urban agglomeration expansion, providing critical insights for formulating regionally differentiated policies.

1. Introduction

Globally, urbanization rates have surpassed 50%, with projections indicating that over 70% of the world’s population will reside in urban areas by 2050 [1,2]. Urbanization-driven land use and land cover changes critically influence global climate change and greenhouse effects, as extensive natural/semi-natural ecosystems are converted to impervious urban surfaces, profoundly altering regional landscape patterns, biogeochemical cycles, hydrological regimes, and biodiversity [3,4,5,6]. The Pearl River Delta, China’s pioneering reform hub and a global manufacturing powerhouse, has undergone rapid urbanization and industrialization since the 1980s [7]. By 2023, the region’s permanent population exceeded 70 million, with a GDP surpassing USD 1.7 trillion (approximately 10% of China’s total), forming a contiguous urban corridor anchored by Guangzhou, Shenzhen, and Hong Kong. However, accelerated urbanization has triggered dramatic landscape transformations, intensifying the fragmentation of natural habitats, persistent cropland depletion, and disordered construction land expansion [8,9,10]. The 2019 Outline Development Plan for the Guangdong–Hong Kong–Macao Greater Bay Area explicitly prioritizes establishing an “eco-friendly, economically vibrant, and livable world-class bay area,” demanding the enhanced sustainability of regional landscape ecosystems [11]. Within this context, systematically investigating the spatiotemporal evolution of land use patterns in the PRD urban agglomeration and projecting future scenarios has emerged as a pivotal scientific challenge for reconciling regional development with ecological conservation.
Urban and regional land change simulation constitutes a focal area in contemporary urban geographical research [12] and serves as a critical tool for implementing the “Three Control Lines” (ecological conservation redlines, permanent prime cropland boundaries, and urban development boundaries) in territorial spatial planning and resolving spatial conflicts [13]. Domestic and international studies on urban land use changes have primarily concentrated on spatiotemporal patterns [14,15], driving mechanisms [16,17], scenario simulations [18,19], and the ecological impact assessments of urbanization [20,21]. Remote sensing satellite imagery has become an essential methodology for acquiring urban land use/cover data, serving as a critical foundation for investigating the spatiotemporal patterns of urban expansion [22,23]. As one of China’s most dynamic urban agglomerations, the Pearl River Delta Urban Agglomeration has garnered significant scholarly attention due to its rapid urbanization process. In recent years, systematic research has been conducted across four key dimensions: temporal-spatial evolution, driving mechanisms, simulation forecasting, and ecological impacts, collectively providing robust scientific foundations for regional sustainable development. Studies have revealed distinct phased characteristics in the PRD’s urban expansion: construction land area grew at an annual rate of 4.5% during 1980–2015, with expansion patterns transitioning from “mononuclear agglomeration” to “polycentric networking”, particularly evident in coalescing core areas like Guangzhou–Foshan and Shenzhen–Dongguan–Huizhou [24]. A strong spatial coupling was observed between construction land expansion and economic (GDP)/demographic growth (R2 > 0.85), with Shenzhen and Dongguan exhibiting higher expansion intensity than neighboring regions [25]. From 2010 to 2020, the Land Consumption Rate per capita surpassed the Population Growth Rate by 2.3 times, highlighting inefficient resource utilization and the urgent need for land use optimization [26]. Research has revealed synergistic interactions among multi-scale drivers: Research has revealed synergistic interactions among multi-scale drivers: Economic globalization (foreign investment constituting >60% of fixed-asset investment) and municipal land finance systems emerged as dominant socioeconomic catalysts [27]. Geomorphic constraints (e.g., Pearl River Estuary alluvial plains) induced distinct east–west axial disparities in expansion patterns. Urban expansion increased spring surface temperatures by 1.2 °C, reduced wind speeds by 0.5 m/s, and exacerbated ozone pollution through disrupted atmospheric ventilation corridors [28]. Wetland loss demonstrated a strong negative correlation with construction land growth (r = −0.78), confirming direct ecological displacement effects [24]. Scenario modeling has emerged as a critical research focus. Empirical studies demonstrate that by 2035, urban land use in the Pearl River Delta urban agglomeration is projected to increase by 23%, with ecological redline constraints potentially reducing habitat conflicts by 15% [29]. For flood risk mitigation, simulations indicate that adopting a “low-density clustered expansion model” could decrease inundation losses compared to conventional sprawl patterns [30]. By 2050, 30% of cropland in the PRD’s primary agricultural zones may be lost, necessitating urban growth boundary policies to reconcile development and food security demands [31]. However, urban expansion continues to exacerbate ecological degradation: the PRD’s ecological deficit surged by 320% (2000–2015), with urban energy consumption accounting for 65% of regional totals [32]. Land use changes may reduce biodiversity indices by 18% by 2050, with Dongguan and Zhongshan facing the highest risks of habitat fragmentation [33].
In summary, research on urban expansion in the Pearl River Delta (PRD) urban agglomeration has made significant strides in understanding spatiotemporal patterns, driving mechanisms, and predictive modeling. Nevertheless, three critical scientific bottlenecks require urgent resolution: (1) Inadequate Fusion of Multisource Heterogeneous Data: Current studies predominantly rely on single-source data, lacking systematic integration of multisource information, which constrains the comprehensive characterization of urban expansion complexity [34]. (2) Weak Dynamic Analysis of Policy–Institution Interactions: The mechanistic roles of land use policies and spatial planning remain poorly quantified, often limited to qualitative descriptions [35,36]. (3) Low Precision in Coupled Complex Systems Modeling: Urban expansion—as a social-ecological-coupled system—suffers from an insufficient representation of cross-scale feedback mechanisms (e.g., policy-natural factor interactions), undermining scientific support for resilience-optimized decision-making [37]. Addressing these gaps is imperative to advance evidence-based urban resilience strategies. Against this backdrop, this study leverages multi-temporal land use data (1990–2020) and socioeconomic datasets to analyze the spatiotemporal trajectories and driving factors of urban land use changes in the PRD. Furthermore, we conduct predictive simulations of future urban land demand and spatial configurations under divergent development scenarios (2020–2035). These efforts aim to provide actionable scientific insights for territorial spatial governance, orderly development strategies in the PRD, and the sustainable construction of the Guangdong–Hong Kong–Macao Greater Bay Area. The technical framework of this study is illustrated in Figure 1.
This study focuses on China’s Pearl River Delta urban agglomeration with three primary objectives: (1) To unravel the spatiotemporal evolution of urban expansion using standard deviation ellipse (SDE) and landscape pattern indices; (2) To investigate driving factors by integrating the Geographically and Temporally Weighted Regression model with geographical detector analysis; (3) To simulate future land use patterns under three scenarios—natural development, ecological conservation, and economic prioritization—using the PLUS (Patch-generating Land Use Simulation) model.
The study’s highlights include three principal advances: (1) Synthesizing the Geographically and Temporally Weighted Regression model with geographical detector analysis to decode urban expansion drivers through spatiotemporal non-stationarity resolution and interaction factor identification; (2) Pioneering policy spatialization by converting planning documents and regulatory texts into geocoded metrics, thereby quantifying policy gradient effects on urban sprawl dynamics; and (3) Developing a multi-scenario simulation framework that integrates ecological constraints (e.g., habitat connectivity thresholds) with planning priorities (e.g., infrastructure corridors) to project development thresholds and sustainability pathways for urban agglomerations. These highlights provide spatially explicit decision-support tools for balancing growth demands with ecological resilience in territorial governance.

2. Research Area Overview and Methodology

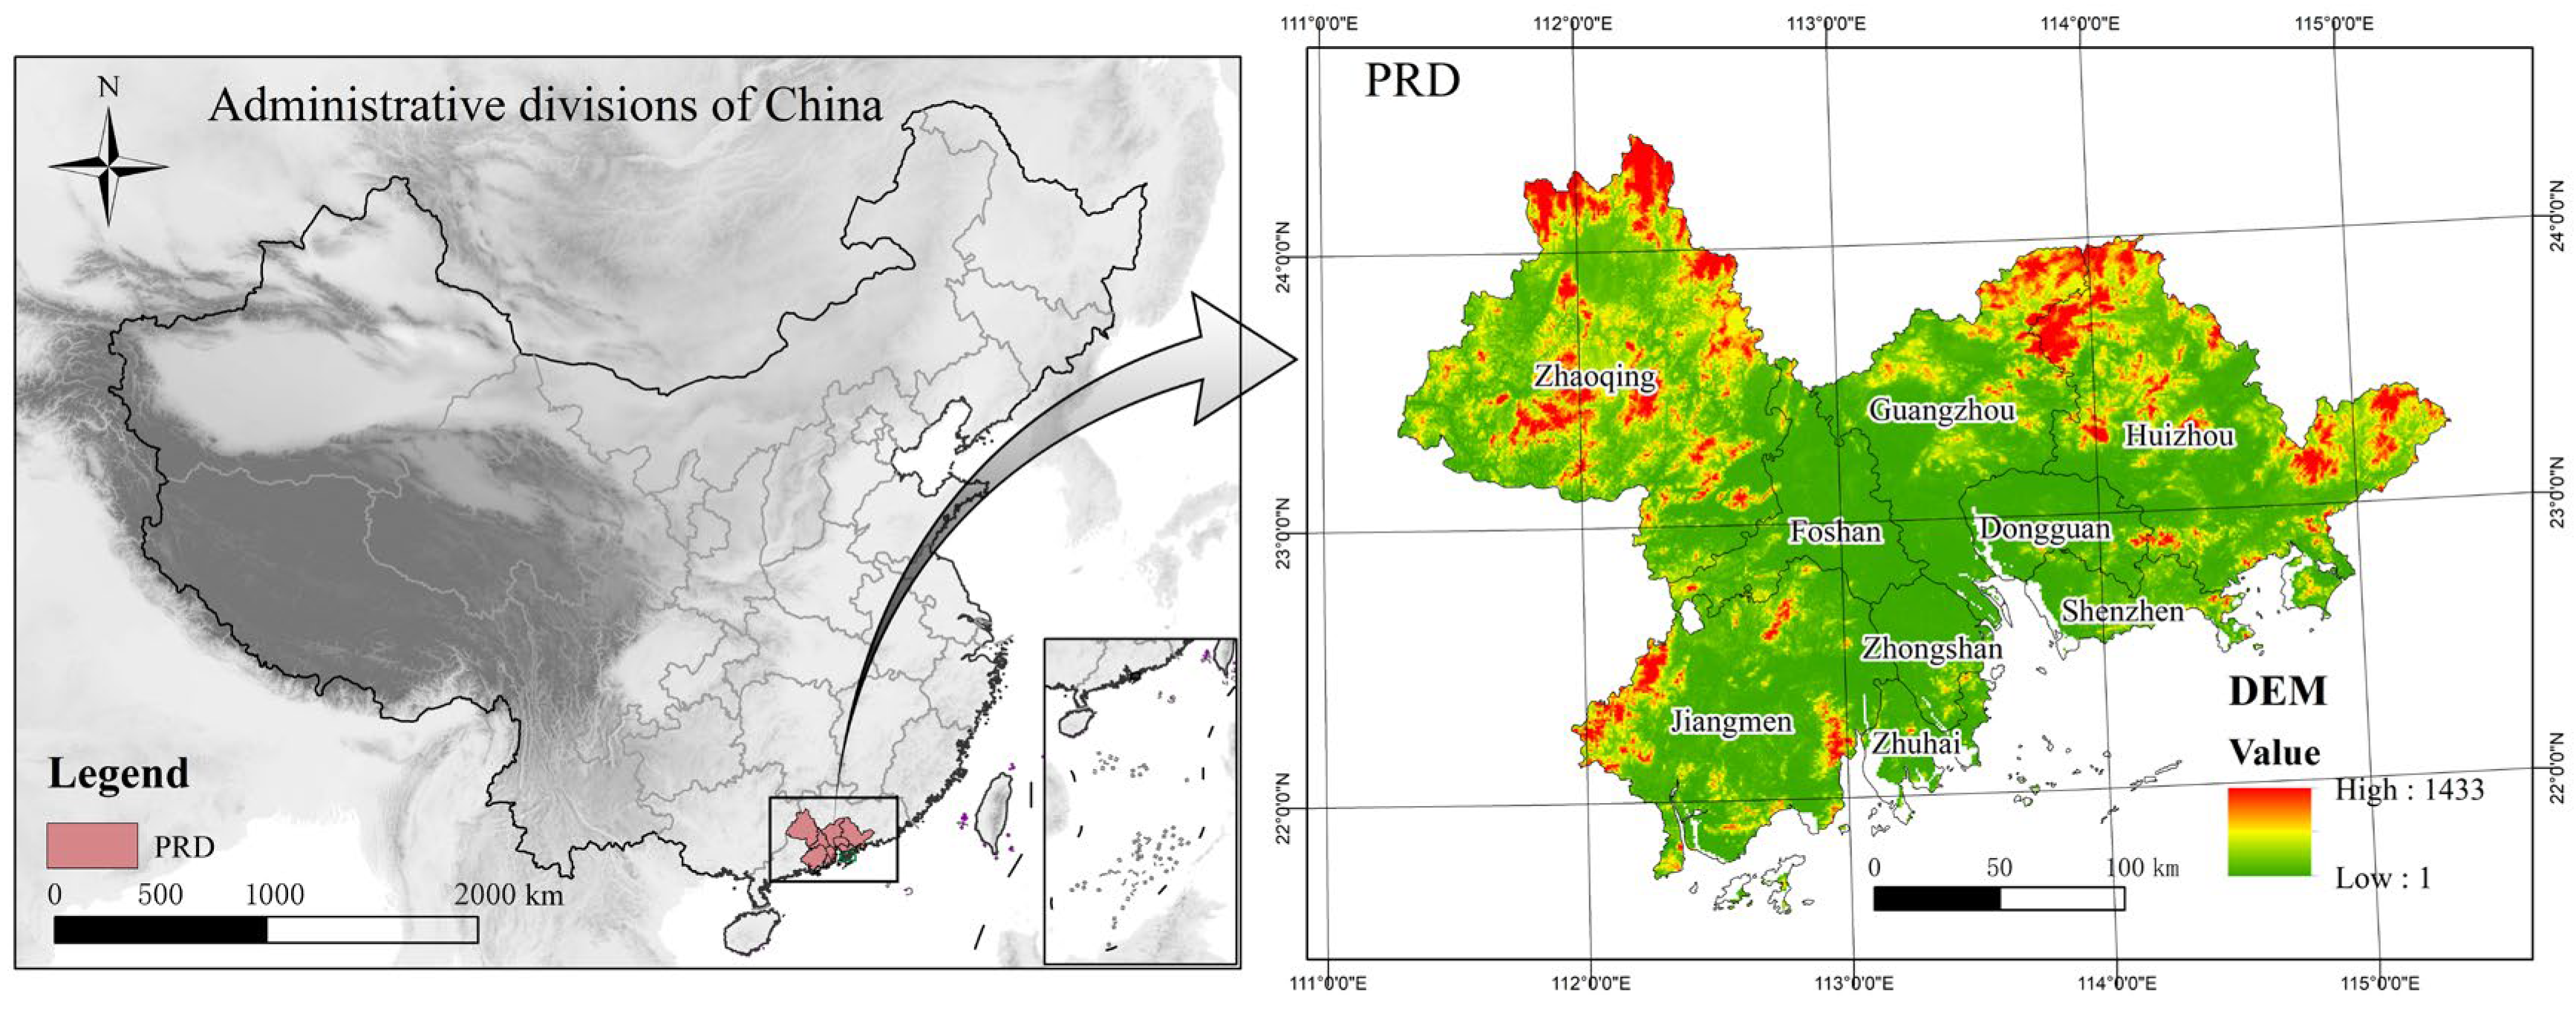
2.1. Research Area Overview

The Pearl River Delta urban agglomeration (PRD), spanning 111°22′–115°25′E and 21°28′–24°26′N, encompasses nine cities: Guangzhou, Shenzhen, Zhuhai, Foshan, Jiangmen, Zhaoqing, Huizhou, Dongguan, and Zhongshan (Figure 2). Characterized by flat terrain, a humid subtropical monsoon climate, and abundant rainfall, the region boasts diverse vegetation types and robust ecological foundations. Recent decades have witnessed rapid economic growth fueled by policy support, marked by rapid rural industrialization and accelerated urban–rural integration [25,26,27]. As one of Asia-Pacific’s most dynamic economic hubs, the PRD ranks among China’s top three regions in population density, innovation capacity, and comprehensive competitiveness [7]. These attributes render it an exemplary case for investigating landscape pattern evolution in mega-urban agglomerations.

2.2. Data Sources

The study integrates multi-source datasets encompassing land use, geospatial, DEM, and socioeconomic data for the Pearl River Delta Urban Agglomeration (Table 1). I. Sourced from the “China Multi-period Land Use and Land Cover Remote Sensing Monitoring Dataset” (30 m × 30 m resolution) by the Resource and Environmental Science Data Center, Chinese Academy of Sciences (RESDC; http://www.resdc.cn, accessed on 20 August 2024). Derived from Landsat TM/ETM+ and Landsat-8 OLI imagery, the data were reclassified into six categories—cropland, forest, grassland, water body, construction land, and unused land—following China’s Land Use Classification standard (GB/T 21010-2017) [38]. Seven temporal snapshots (1990, 1995, 2000, 2005, 2010, 2015, 2020) were processed with an overall accuracy > 90% (Kappa > 0.85), meeting analytical requirements (Figure 3); II. DEM data are derived from NASA-SRTM DEM data; III. The basic geographic information data originate from the National Basic Geographic Information Center and the OSM (Open Street Map, OSM) database, including cities, administrative boundaries of cities, traffic line data, and river data; IV. Population density, GDP, and industrial statistics (2000–2020) from the Guangdong Provincial Bureau of Statistics; V. NPP-VIIRS nighttime light data from 2000 to 2020 are derived from the National Science and Technology Infrastructure Platform-National Earth System Science Data Center.

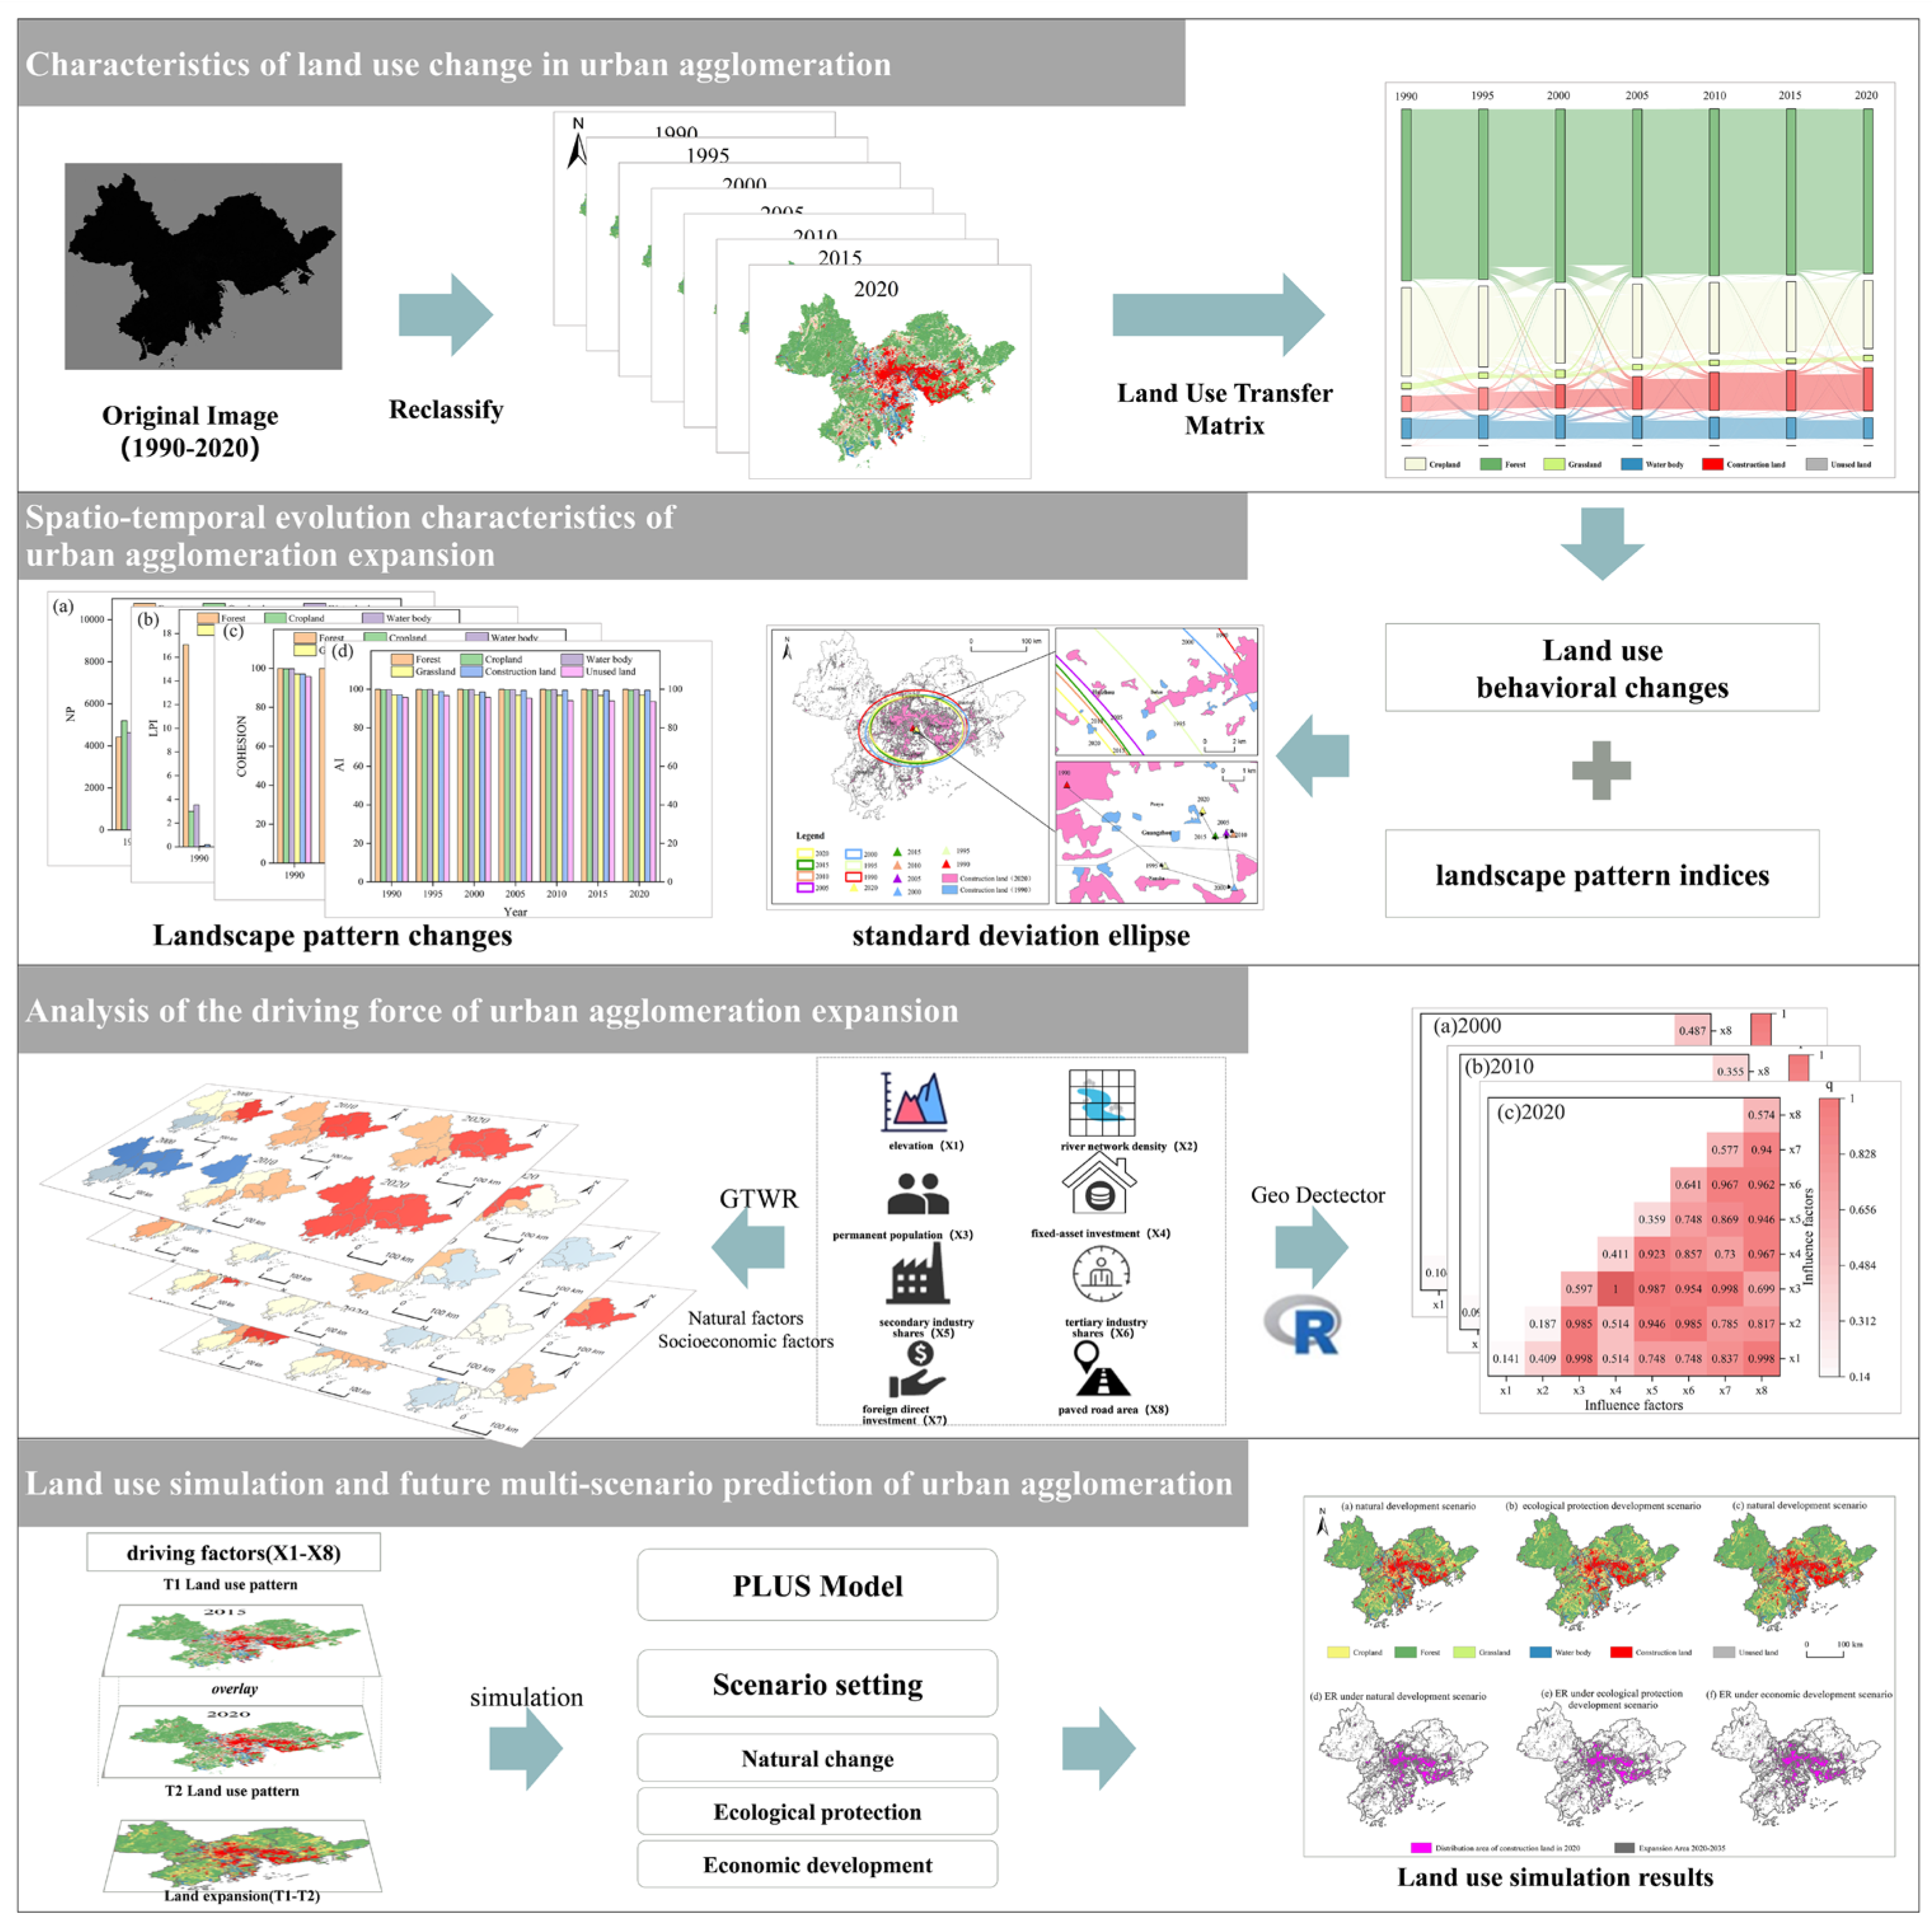
2.3. Research Methodology

2.3.1. Standard Deviation Ellipse (SDE) Analysis

The Standard Deviational Ellipse is an effective method to accurately reveal the overall characteristics of the spatial distribution of geographical elements in spatial statistical methods. On a certain time scale, the overall characteristics of spatial distribution, such as centrality, distribution, direction, and spatial form, provide multiple perspectives for understanding and describing the spatial and temporal changes of the expansion of the Pearl River Delta urban agglomeration. In this paper, the geometric center point of the standard deviation ellipse can be used as the spatial distribution center of the standard deviation ellipse of the urban expansion of the Pearl River Delta, and the spatial characteristics of the urban expansion of the Pearl River Delta can be reflected by the direction and position of its transfer. The formula is as follows [39]:
( A - , B - ) = i = 1 n a i X i i = 1 n X i , i = 1 n b i X i i = 1 n X i
where a i and b i are the geographical coordinates of the geometric center of the i -th city unit, respectively; X i is the attribute value of the research object, that is, the urban expansion intensity of the i -th city unit; ( A - , B - ) is the center point coordinates of the standard deviation ellipse of urban expansion in the Pearl River Delta.
The standard deviation ellipse azimuth represents the development direction of urban expansion in the Pearl River Delta. The formula is as follows:
tan θ = i = 1 n X i 2 Δ A i 2 i = 1 n X i 2 Δ B i 2 + i = 1 n X i 2 Δ A i 2 i = 1 n x i 2 Δ B i 2 2 + 4 i = 1 n X i 2 Δ A i 2 Δ B i 2 2 2 i = 1 n X i 2 Δ A i 2 Δ B i 2
where Δ A i and Δ B i represent the coordinates of the administrative center point of the i -th city unit, respectively, a i , b i and the deviation of the geographical coordinates of the standard deviation ellipse center point coordinates ( A - , B - ) of the Pearl River Delta urban expansion; θ is the azimuth of the standard deviation ellipse.

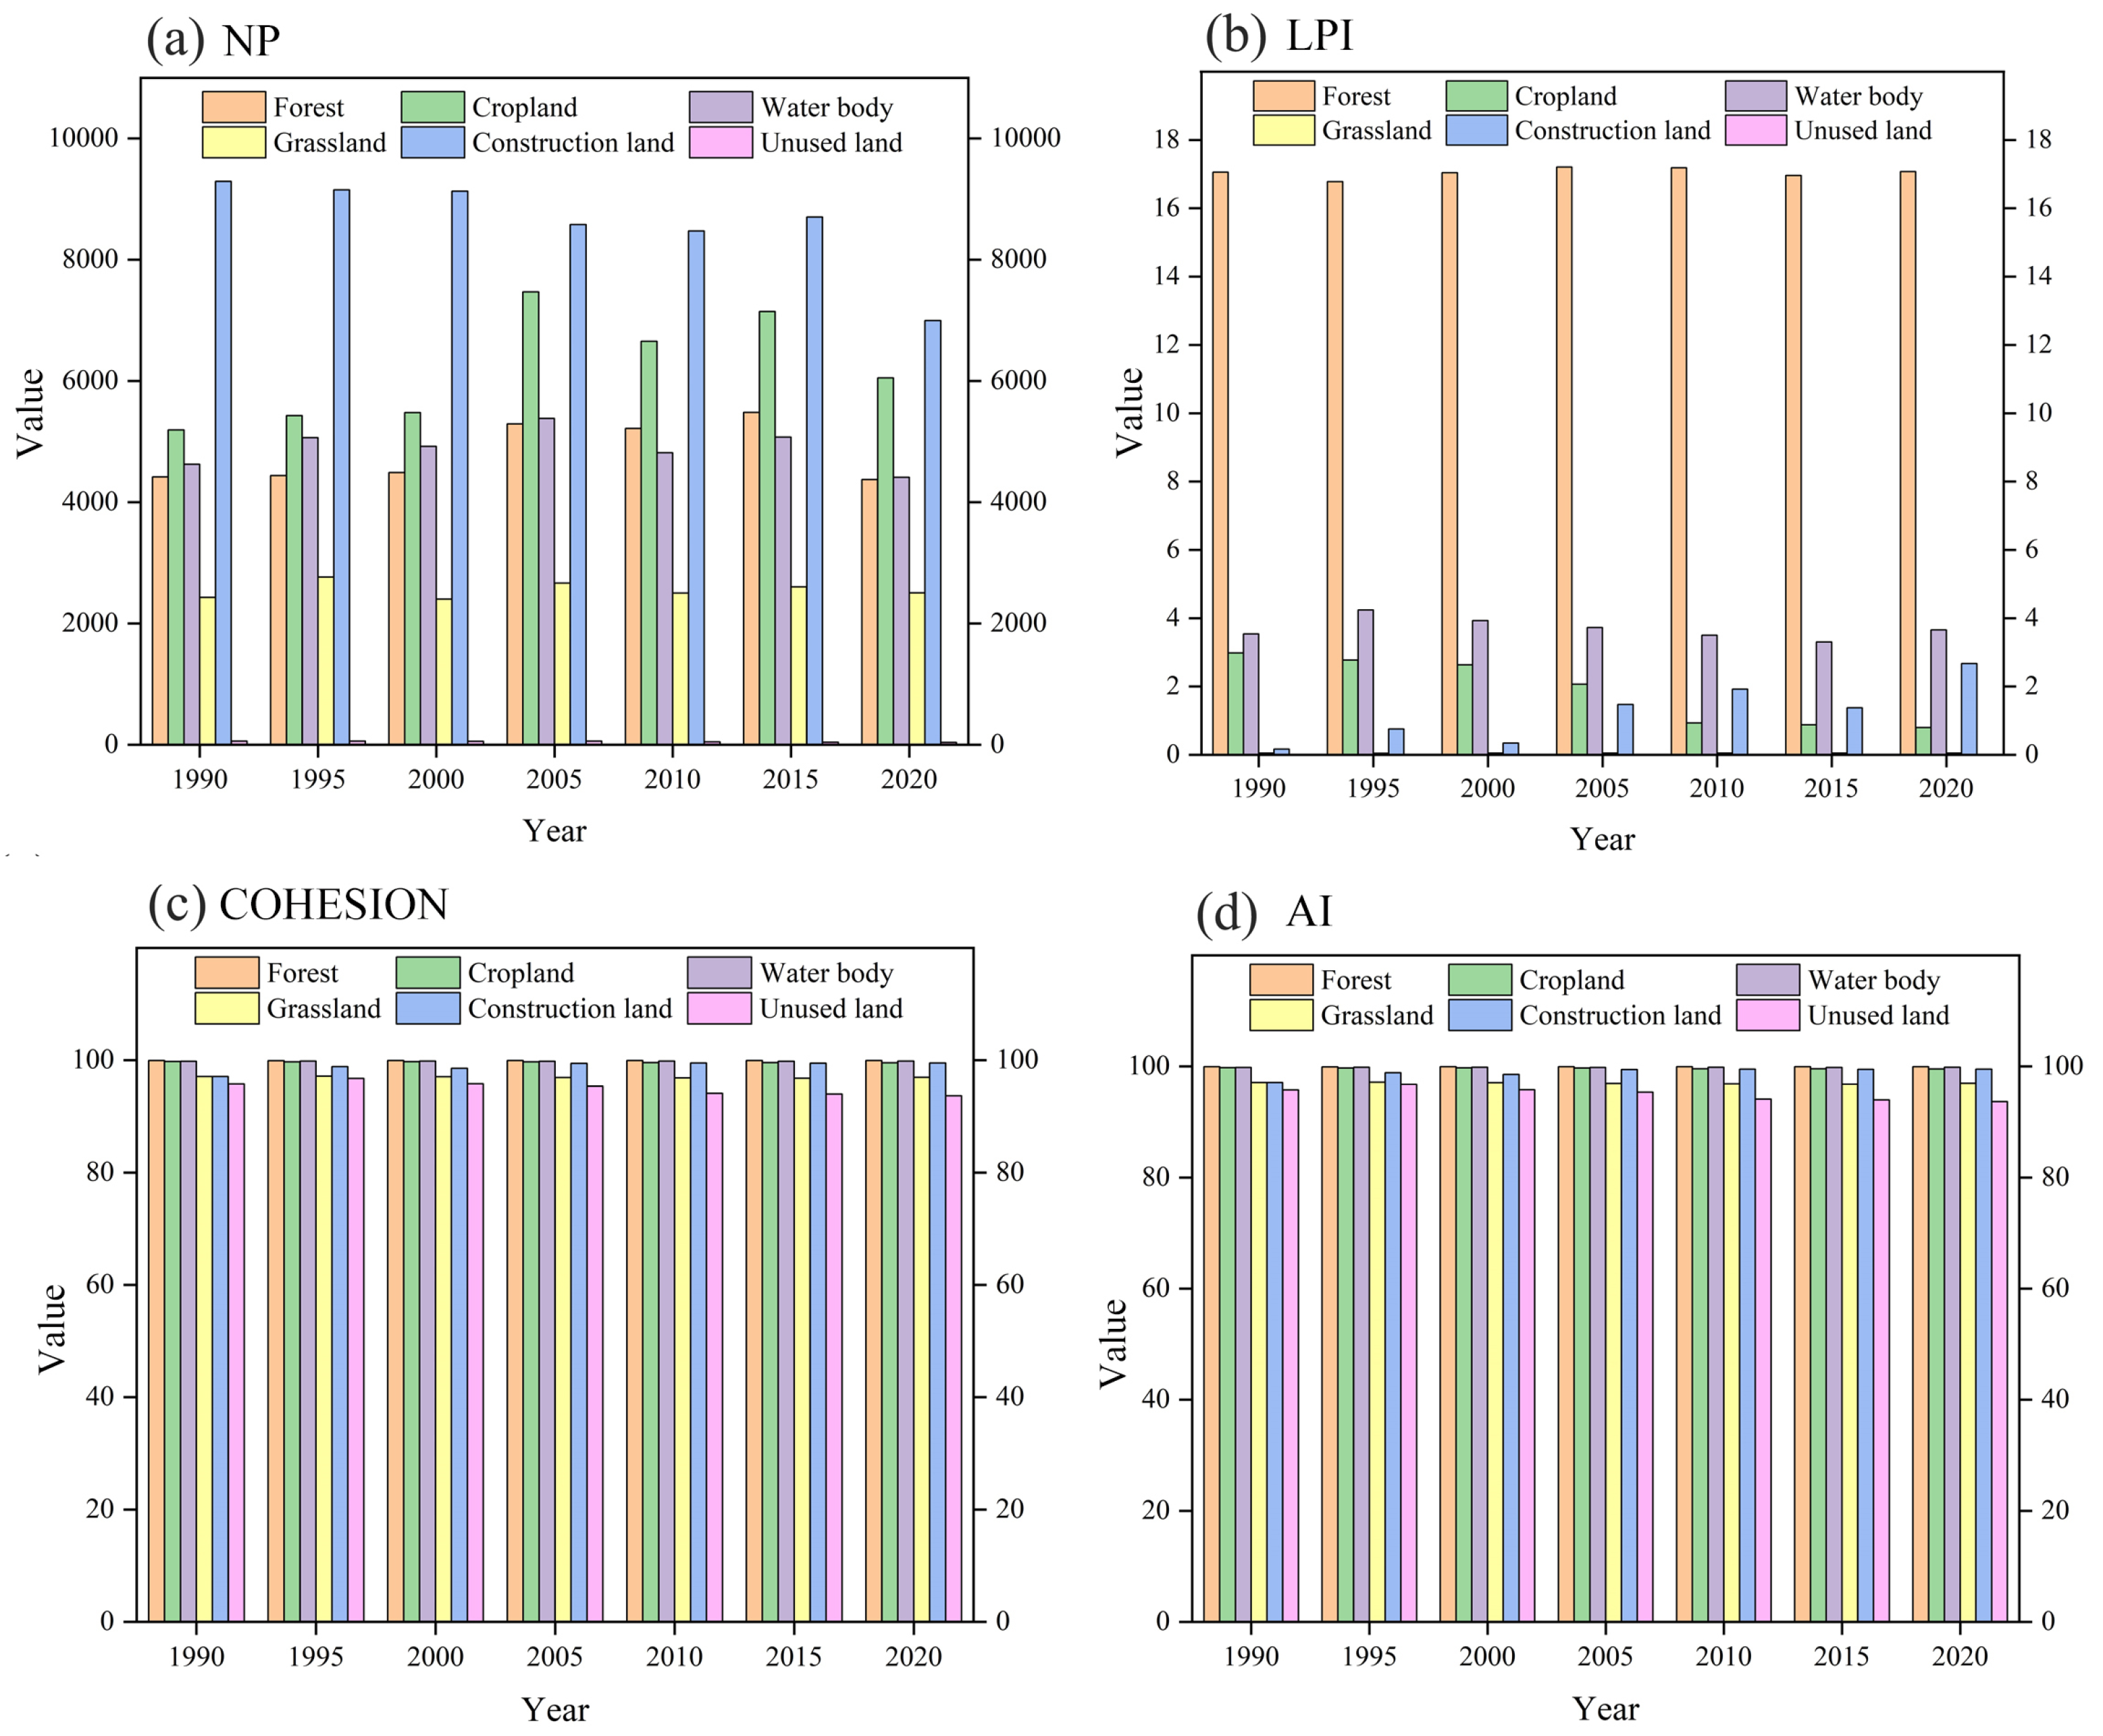
2.3.2. Landscape Pattern Indices

Urban expansion, as a key driver of landscape pattern evolution, necessitates spatially explicit assessment and analysis of its induced land use changes through scientific landscape pattern evaluation [40]. Landscape pattern analysis typically operates across three hierarchical levels: patch, patch type, and landscape. This study focuses on the Pearl River Delta urban agglomeration and selects two levels of patch type and landscape with significant ecological significance to carry out research. Based on the existing research results [13,41], the number of patches (NP) and the largest patch index (LPI) were selected from the patch type level, and the core indicators such as patch aggregation index (AI) and landscape connectivity index (COHESION) were selected from the landscape level. By analyzing the dimensions of landscape fragmentation, aggregation, and diversity, a quantitative evaluation framework was constructed to reveal the spatial evolution characteristics of land use in the Pearl River Delta urban agglomeration. This study selected four core indicators: NP, LPI, AI, and COHESION, and the rationale is as follows: On one hand, these indicators correspond to four independent dimensions—fragmentation, dominance, aggregation, and connectivity—thus avoiding redundant analysis of highly correlated indices [42]. On the other hand, this study focuses on the core contradiction of the Pearl River Delta urban agglomeration: fragmentation caused by cultivated land loss and declining connectivity of ecological land, which aligns with the assessment needs for regional sustainable development. The calculation formula of the main landscape index and its ecological interpretation are shown in Table 2.

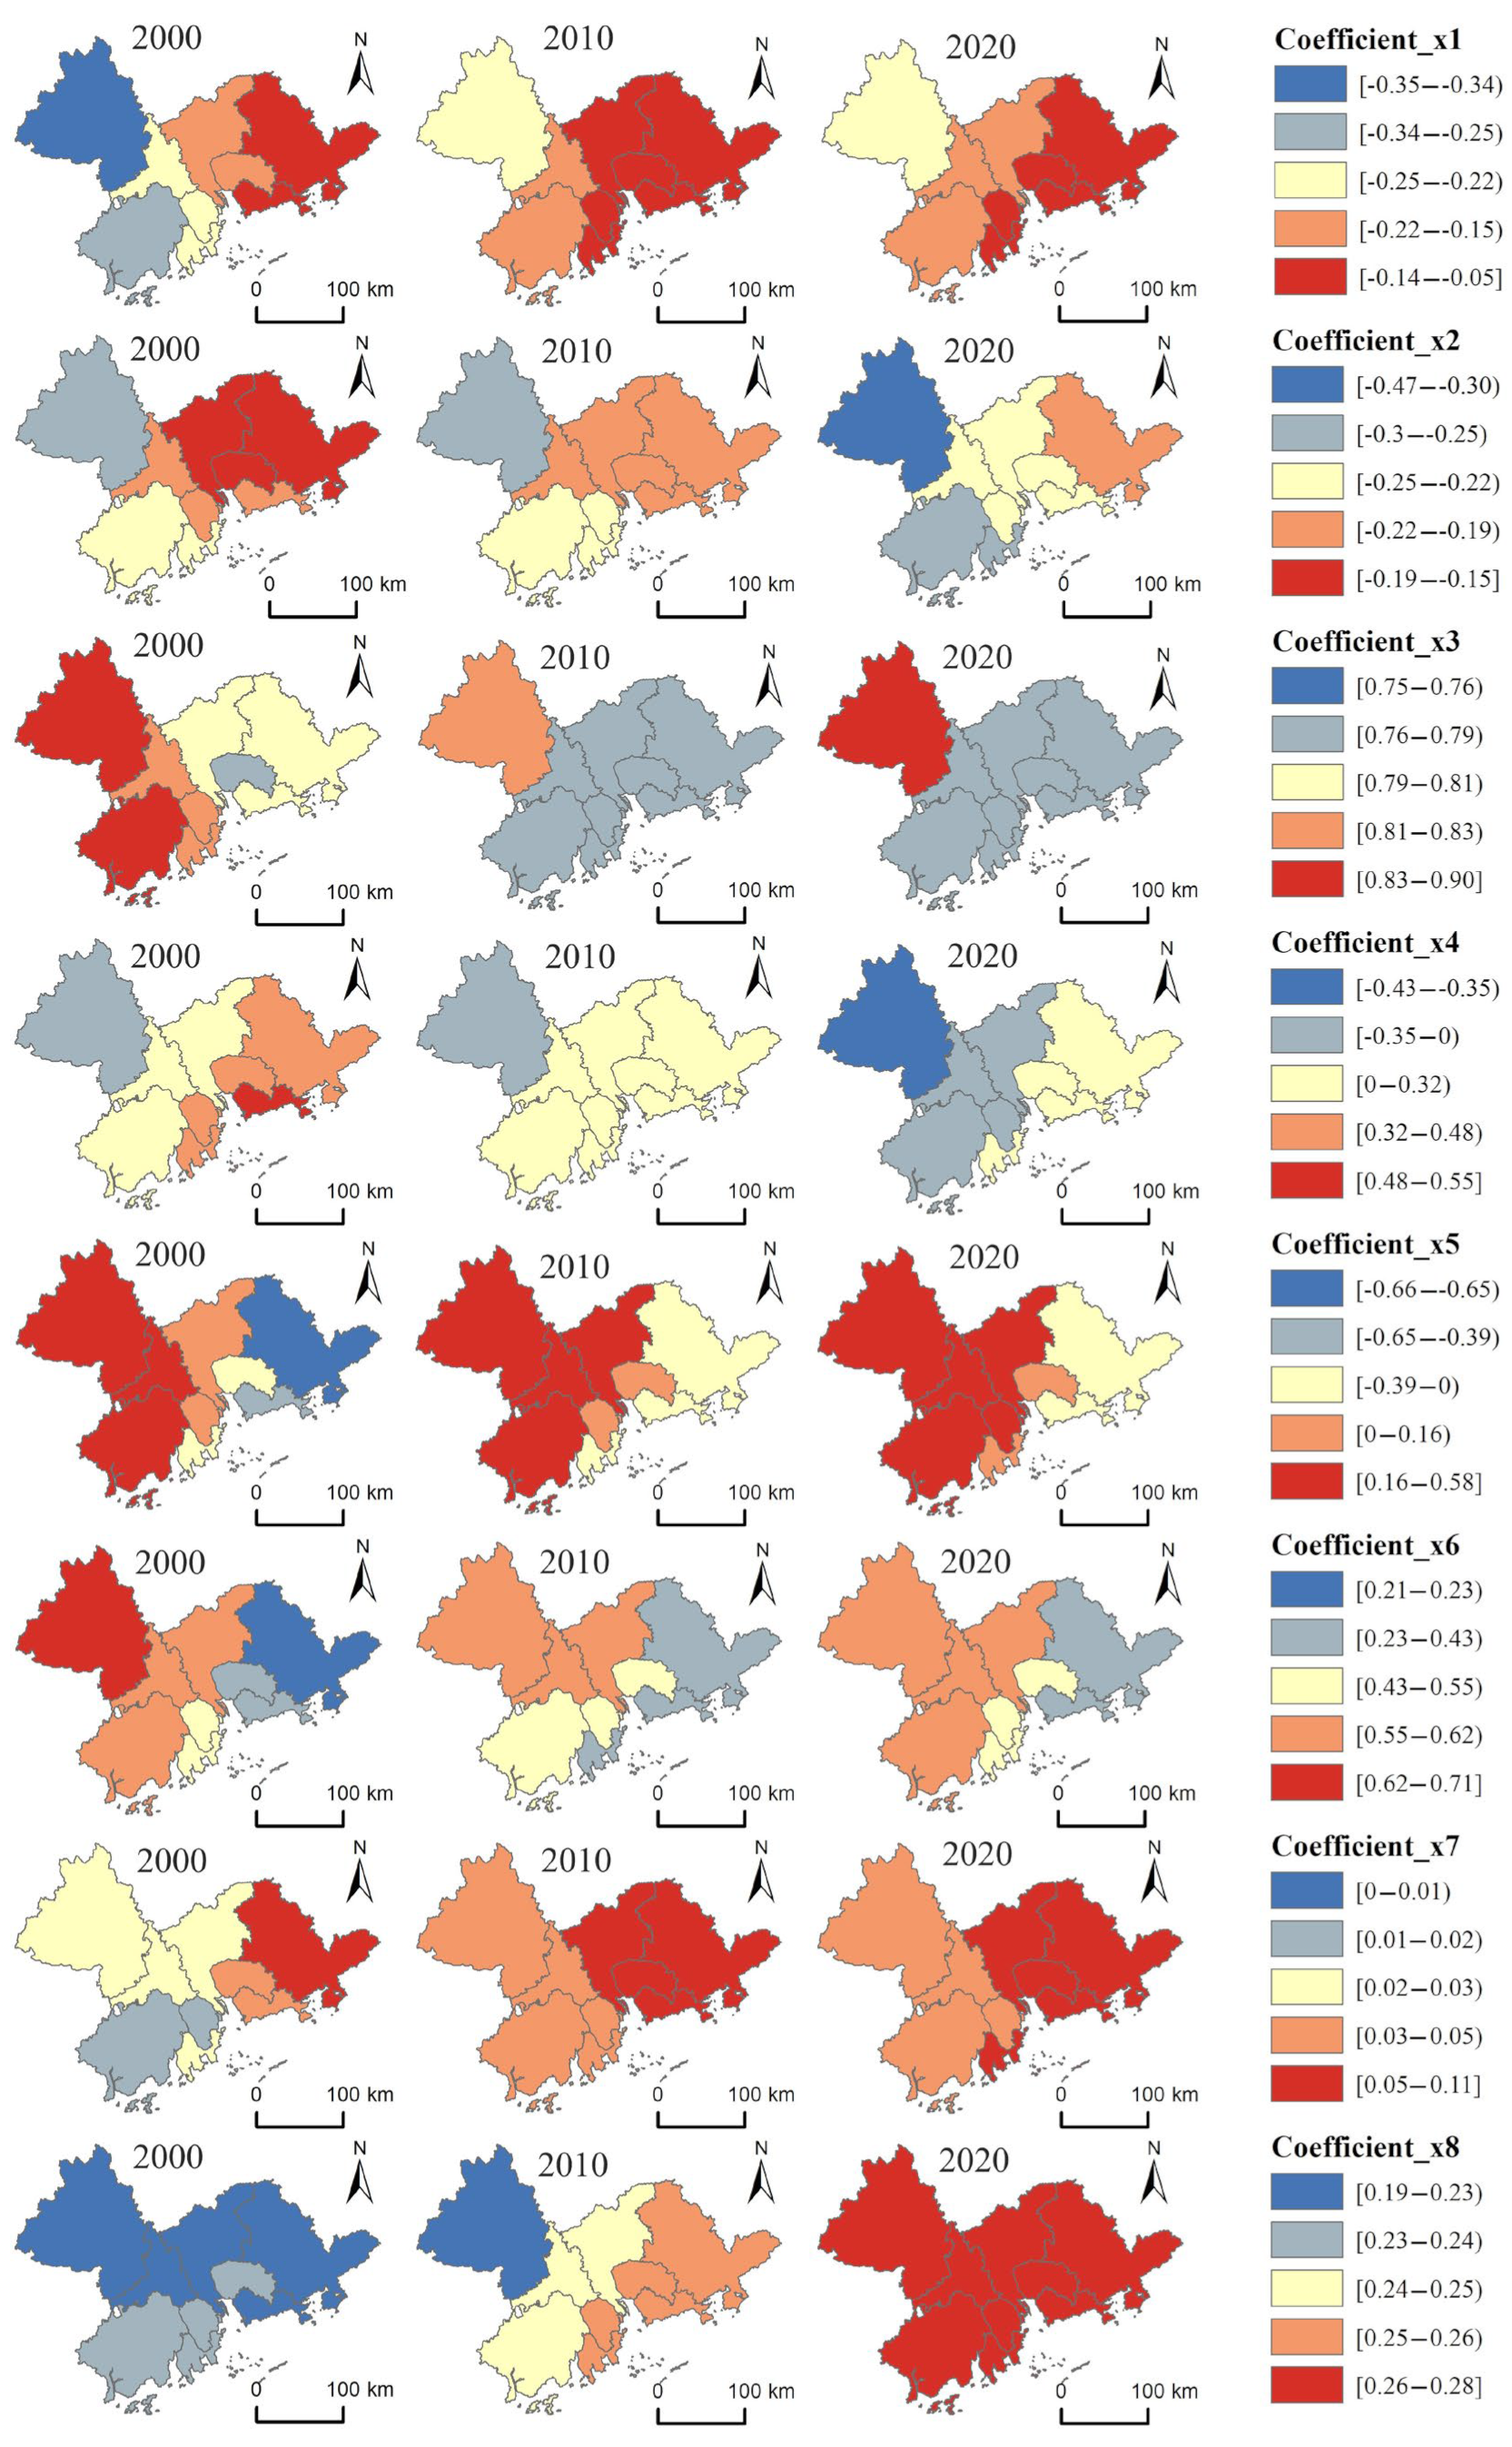
2.3.3. Geographically and Temporally Weighted Regression (GTWR)

The Geographically and Temporally Weighted Regression model integrates spatial correlation and linear regression, improving upon traditional methods like Ordinary Least Squares (OLS) [43]. Its key advantage lies in enabling localized parameter estimation where relationships between independent and dependent variables vary across space and time, thereby capturing overlooked spatial-temporal heterogeneity. The GTWR framework incorporates temporal attributes into the spatial properties of Geographic Weighted Regression (GWR) to explore spatiotemporal effects on explanatory variables. The formula is expressed as follows [44]:
y i = β 0 u i , v i , t i + k = 1 p β k u i , v i , t i X i k + ε i
where i is the number of observation units; y i is the explanatory value of the dependent variable of city i ; u i , v i , t i is the geographical center coordinates of the observation of the i -th sample; the parameter β is a function of u i , v i and t i , that is, the estimated parameter β of any specific spatial location is obtained through local estimation, which varies with time and geographical location. X i k (k = 1, 2, …, 5) is the independent variable and the explanatory value of city i ; β k u i , v i , t i is the regression parameter of the k th variable of position i ; β 0 u i , v i , t i and ε i are the intercept term and the random error term of position i , respectively.
Urban expansion is driven by both natural and socioeconomic factors (Table 3). Natural drivers include topographic relief [45,46,47,48], slope, river network density, and elevation. Socioeconomic drivers encompass permanent population, nighttime light index, GDP, total fixed-asset investment, industrial output, secondary industry share, tertiary industry share, foreign direct investment, and paved road area [49,50,51,52,53,54].
This study proposes the following testable hypotheses to clarify the expected impact mechanisms of driving factors on urban expansion:
(1)
Natural Constraint Hypothesis: Elevation and river network density will exhibit globally negative effects on expansion.
(2)
Infrastructure-Driven Hypothesis: Paved road area and FDI will demonstrate joint positive effects, with their regression coefficients’ spatial distribution highly coupled with the transport corridors of the urban agglomeration.
(3)
Industrial Transformation Hypothesis: The facilitating effect of the tertiary sector share will strengthen over time.
(4)
Policy Intervention Hypothesis: The sign (positive/negative) of fixed investment’s effect may indicate policy orientation.

2.3.4. Geographical Detector

The geographical detector, initially proposed by Professor Wang Jinfeng’s research team [55], is a statistical method designed to analyze spatial heterogeneity in geographic element distributions and identify underlying driving factors. It operates on the hypothesis that if an independent variable significantly influences a dependent variable, their spatial distributions will exhibit congruence. This framework enables the detection of spatial differentiation patterns and causal drivers. In this study, the interaction detector module was employed to quantitatively assess the influence of interacting drivers on urban expansion in the Pearl River Delta. After data discretization, interaction effects were measured using the q-value (ranging between 0 and 1), where values closer to 1 indicate a stronger explanatory power of the interacting factors. The calculation method follows [56]:
q = 1 h = 1 L N h δ h 2 N h δ 2
where h = 1, 2…… L is the classification or partition of variable Y or factor X ; N h and N are the number of layers h and the number of units in the whole region, respectively. The δ h 2 and δ 2 are the variances of the Y values of the layer h and the whole region, respectively.

2.3.5. PLUS Model

The PLUS Model (Patch-generating Land Use Simulation model) developed by the HPSCIL@CUG Lab at the China University of Geosciences is a raster-based land use change simulation model designed to predict future land use patterns [57]. It comprises two core modules: the Land Expansion Analysis Strategy (LEAS) and the Cellular Automata with Random Patch Seeds (CARSs). The workflow involves three steps: (1) extracting expansion areas of each land use type from two-period land use data; (2) analyzing relationships between land use expansion and driving factors (e.g., climate, population, policy) using the LEAS module’s random forest algorithm to derive development probabilities; (3) simulating future spatial land use patterns in the PRD by integrating the CARS model, random seed generation, and threshold decay mechanisms. For scenario-specific projections, the model combines Markov Chain predictions, land cost assessments, historical data, and drivers (temperature, precipitation, soil, terrain, transportation, etc.) to calculate development suitability probabilities and cellular conversion probabilities, ultimately simulating land use changes through a roulette wheel selection mechanism. Policy constraints, such as ecological conservation mandates from the Guangdong–Hong Kong–Macao Greater Bay Area Development Plan (e.g., protection of the Pearl River Estuary mangroves, Xijiang–Beijiang ecological corridors, and Baiyun Mountain–Nanling Range) and the Guangdong Provincial Territorial Spatial Plan (2021–2035) (enforcing the “Three Zones and Three Lines” framework with ecological redlines for water conservation and biodiversity zones), are embedded as rigid constraints in the PLUS model.

3. Results Analysis

3.1. Characteristics of Land Use Change in Urban Agglomeration

The proportional area distribution of land use types within the Pearl River Delta urban agglomeration from 1990 to 2020 reflects the structural characteristics of regional land resources (Figure 4, Table 4). Throughout this period, forest remained the dominant land cover, accounting for over 50% of the total area, followed by cropland (averaging 25.85%) and construction land (averaging 9.71%). Water bodies occupied 6.89% on average, while grassland and unused land constituted only 1.97% and 0.03%, respectively. Rapid urbanization drove a dramatic expansion of construction land, increasing from 2789.74 km2 in 1990 to 7721.43 km2 in 2020. Conversely, cropland decreased by 3641.68 km2 (equivalent to three-quarters of construction land expansion), and forest declined by 1245.07 km2 (one-quarter of construction land growth)—tenfold the increase in water bodies and thirteenfold the reduction in grassland. Spatiotemporal analysis revealed opposing trends: construction land exhibited a phased growth trajectory (“rapid expansion (1990–2000: 5.22% annual rate) → accelerated growth (2000–2010: 6.04%) → stabilized expansion”), while cropland transitioned from “rapid decline to gradual reduction,” with its conversion rate to construction land decreasing overall and slowing markedly during 2010–2015. The land transition matrix indicates construction land rose from 5.16% (1990) to 14.27% (2020), with a total expansion rate of 5.90% over 30 years, underscoring irreversible cropland loss and landscape fragmentation.(Table A1, Table A2, Table A3, Table A4, Table A5 and Table A6)

3.2. Spatial and Temporal Evolution Characteristics of Urban Agglomeration Expansion

Utilizing the standard deviation ellipse tool in ArcGIS 10.8 alongside landscape pattern and expansion area analyses, this study deciphers the spatiotemporal evolution of urban development in the Pearl River Delta urban agglomeration. From 1990 to 2010, the PRD experienced significant urban expansion, with construction land growing by 144.10%, primarily concentrated in coastal cities along the Pearl River Estuary—Guangzhou, Shenzhen, Foshan, Zhongshan, Dongguan, and Huizhou. The SDE analysis and gravity center migration trajectory (Figure 5) revealed a southeastward shift toward Panyu and Nansha Districts between 1990 and 2020. Rapid gravity center movement occurred during 1990–1995, 1995–2000, and 2000–2005, followed by slower migration within Panyu District post-2005. This pattern aligns with policy interventions: the 2000 Guangzhou Urban Development Strategic Concept Plan prioritized southward expansion into Panyu District, while the 2005 Pearl River Delta Urban Cluster Coordinated Development Plan (2004–2020) institutionalized regional synergy. These policies stabilized gravity center shifts after 2005. The SDE’s direction angle remained within 0–90°. The centroid of the ellipse shifted southward from Panyu District, Guangzhou, to Nansha District, before subsequently moving northward back towards Panyu District. This indicates that while the ellipse’s primary (major-axis) orientation persisted along the northeast–southwest direction, its positional shift exhibited rotational movement in the north–south axis. These spatial dynamics demonstrate that the PRD urban agglomeration developed with Guangzhou and Shenzhen, the two national central cities, serving as its core, driven by the synergistic growth momentum emanating from Zhongshan, Foshan, and Dongguan, the three major growth poles. Concurrently, Shenzhen leveraged its radiation effect to advance Shenzhen–Dongguan integration, forging a globally influential innovative metropolitan cluster. Under this framework, construction land distribution increasingly exhibits north–south axial characteristics, balancing rapid urbanization with ecological priorities.
Scientific analysis of urban landscape patterns forms the foundation for spatially explicit evaluation of land use changes (Figure 6). The NP for six land use types—cropland, forest, grassland, water bodies, construction land, and unused land—reached its lowest value in 2000, exhibited fluctuating increases during 2005–2015, and declined by 2020. Between 2015 and 2020, construction land and water bodies showed the most pronounced NP decreases, while unused land, grassland, water bodies, forest, and cropland experienced sequentially smaller reductions, indicating diminishing encroachment of construction land on other land types. The LPI was highest for forest, followed by water bodies, construction land, and cropland, confirming these as dominant land use categories in the PRD. From 1990 to 2020, cropland LPI declined sharply (−42%), contrasting with construction land’s marked increase (+28%), while grassland, water bodies, unused land, and forest exhibited minimal fluctuations (<±5%). This underscores construction land’s disproportionate encroachment on cropland. The COHESION for construction land increased annually, indicating its continuous expansion gradually formed contiguous, interconnected patches. Conversely, the COHESION for other ecological land uses and unused land showed a slight downward trend, indicating their distribution became more fragmented and patchy. Prior to 2010, the AI for non-construction lands declined collectively, revealing the erosion of ecological patches by urban sprawl. Post-2005, construction land’s AI rose steadily, reflecting sprawling expansion, while other land types showed stabilized or rebounding AI trends—most notably grassland (+9%), forest (+5%), and water bodies (+4%)—demonstrating effective ecological conservation through policy interventions like the Pearl River Delta Ecological Protection Plan (2010–2020).

3.3. Analysis of the Driving Force of Urban Agglomeration Expansion

3.3.1. GTWR Results Analysis

To empirically investigate the spatial heterogeneity of urban agglomeration expansion under diverse natural and socioeconomic conditions, this study employs the Geographically and Temporally Weighted Regression model to analyze driving factors of construction land expansion across the Pearl River Delta urban agglomeration. The influencing factors encompass natural factors (elevation, river network density) and socioeconomic factors (permanent population, fixed-asset investment, secondary/tertiary industry shares, foreign direct investment, paved road area). To mitigate estimation bias caused by indicator correlations, collinearity diagnostics were conducted using IBM SPSS Statistics 26, with results confirming the absence of multicollinearity among selected variables (Table 5). All Variance Inflation Factor (VIF) values were <10, and Condition Indices were <30, satisfying thresholds for robust regression analysis.
To empirically investigate the driving mechanisms of urban expansion in the Pearl River Delta urban agglomeration, this study employs a GTWR model to analyze the spatiotemporal heterogeneous effects of natural and socioeconomic factors, based on 27 observational samples (9 cities × 3 years: 2000, 2010, 2020). The model’s performance was evaluated via fivefold cross-validation to address limitations in training/testing set partitioning under a small sample size. The results are presented in Table 6.
The GTWR model achieves the lowest AICc value (significantly lower than OLS and GWR by 63% and 80%, respectively), indicating optimal balance between goodness-of-fit and model complexity. Cross-validated RMSE further confirms its superiority: GTWR’s prediction error (0.040) is significantly lower than OLS (0.055, p = 0.010) and GWR (0.059, p = 0.003). Although differences in adjusted R2 across models are minor, GTWR’s R2 improvement is statistically more significant (smallest p-value = 0.01). Crucially, its capability to parse spatiotemporal non-stationarity better matches the complex driving mechanisms of urban expansion.
Based on the GTWR regression results (Figure 7), the influence of driving factors on urban expansion in the Pearl River Delta urban agglomeration exhibits significant spatial heterogeneity, with regression coefficients demonstrating robust statistical significance.
(1)
Natural Factors
Throughout the study period, both elevation and river network density exhibited negative correlation effects on urban expansion in the Pearl River Delta urban agglomeration. Spatial analysis of regression coefficients revealed pronounced heterogeneity in their inhibitory impacts: Elevation: Negative high-value clusters (strongest constraints) were concentrated in Zhaoqing (western PRD), while negative low-value zones (weaker constraints) occurred in Shenzhen and Huizhou (eastern PRD). River network density: Similarly, negative high-value clusters dominated Zhaoqing, with minimal constraints observed in Shenzhen–Huizhou. Notably, the spatial distribution of elevation’s negative regression coefficients gradually stabilized over time, while their inhibitory effects became increasingly pronounced. These findings confirm persistent spatial constraints from both natural factors. Elevation emerges as a progressively stronger limiting force, with its intensification mechanism being as follows: As elevation increases, development suitability for construction land diminishes. Consequently, higher-altitude zones have become critically emerging land sources for construction land development.
(2)
Socioeconomic Factors
The influence of year-end total population on urban expansion in the Pearl River Delta urban agglomeration showed a slight decline while remaining predominantly positive, with a west-high–east-low spatial pattern in impact coefficients. During 2000–2010, moderate-to-high positive effect clusters were primarily concentrated in Zhaoqing (western PRD), with minimal overall variation. From 2010 to 2020, low-value zones expanded to eastern and southern regions, while high-value clusters persisted in Zhaoqing. Overall, the population’s impact on urban expansion remained relatively stable, exhibiting a slight downward trend over time.
The impact of total fixed-asset investment on urban expansion in the Pearl River Delta urban agglomeration exhibited volatile dynamics with distinct phase-specific patterns: 2000–2010: Strong positive effects dominated, with high and moderate-value clusters concentrated in the southeastern PRD (Guangzhou–Shenzhen corridor). 2010–2020: Negative regression coefficients emerged, and negative high-value clusters shifted to Zhaoqing in the northeastern PRD. Overall, fixed-asset investment demonstrated phase-dependent influence, transitioning from a growth accelerator in early-stage industrialization to a constraint under ecological redline policies post-2010.
The influence of secondary industry share on urban expansion in the Pearl River Delta urban agglomeration exhibited fluctuating dynamics, characterized by alternating positive and negative regression coefficients. During 2000–2010, secondary industry exerted a stronger impact, with sub-high positive clusters concentrated in western PRD (e.g., Foshan–Zhongshan industrial corridors). Post-2011, these positive clusters gradually migrated eastward, stabilizing in central-western regions (e.g., Guangzhou–Huizhou). Conversely, negative regression coefficient zones shifted from the southwestern PRD to eastern cities (Shenzhen and Huizhou). Overall, the secondary industry’s influence demonstrated pronounced phase-dependent spatial heterogeneity, reflecting evolving industrial policies and regional economic restructuring.
The tertiary industry share predominantly exerted positive effects on urban expansion in the Pearl River Delta urban agglomeration, with its influence growing significantly over time. Regression coefficient high-value clusters were initially concentrated in the western PRD, gradually migrating northeastward from 2000 to 2020. Cities such as Guangzhou and Foshan remained within moderate–high-value clusters throughout this period, with spillover effects radiating to surrounding areas post-2011. Notably, the regression coefficients for tertiary industry share continuously increased, surpassing other drivers to become the dominant factor shaping urban expansion patterns by 2020. This upward trajectory aligns with the PRD’s strategic shift toward a service-oriented economy under national policies like the Modern Service Industry Development Plan (2010–2025).
Foreign investment exhibited a moderate increase in influence on urban expansion in the Pearl River Delta urban agglomeration, with predominantly positive effects and an east-high–west-low spatial pattern in impact coefficients. During 2000–2010, moderate-high positive clusters were concentrated around Huizhou (eastern PRD), showing substantial spatial variability. By 2010–2020, low-value zones expanded to the western PRD, while high-value clusters intensified in the eastern regions (e.g., Shenzhen–Dongguan). Overall, foreign investment’s impact remained relatively stable with a slight upward trend, reflecting its growing role in shaping the PRD’s export-oriented and innovation-driven urbanization.
The influence of urban transportation infrastructure on urban expansion in the Pearl River Delta urban agglomeration has gradually intensified, exhibiting predominantly positive effects with pronounced spatial agglomeration characteristics. During 2000—2010, low-to-moderate positive impact zones were distributed diffusely across the entire region, with relatively moderate overall variation. By 2010–2020, high-value clusters expanded ubiquitously, accompanied by substantial spatial variability in impact magnitude.

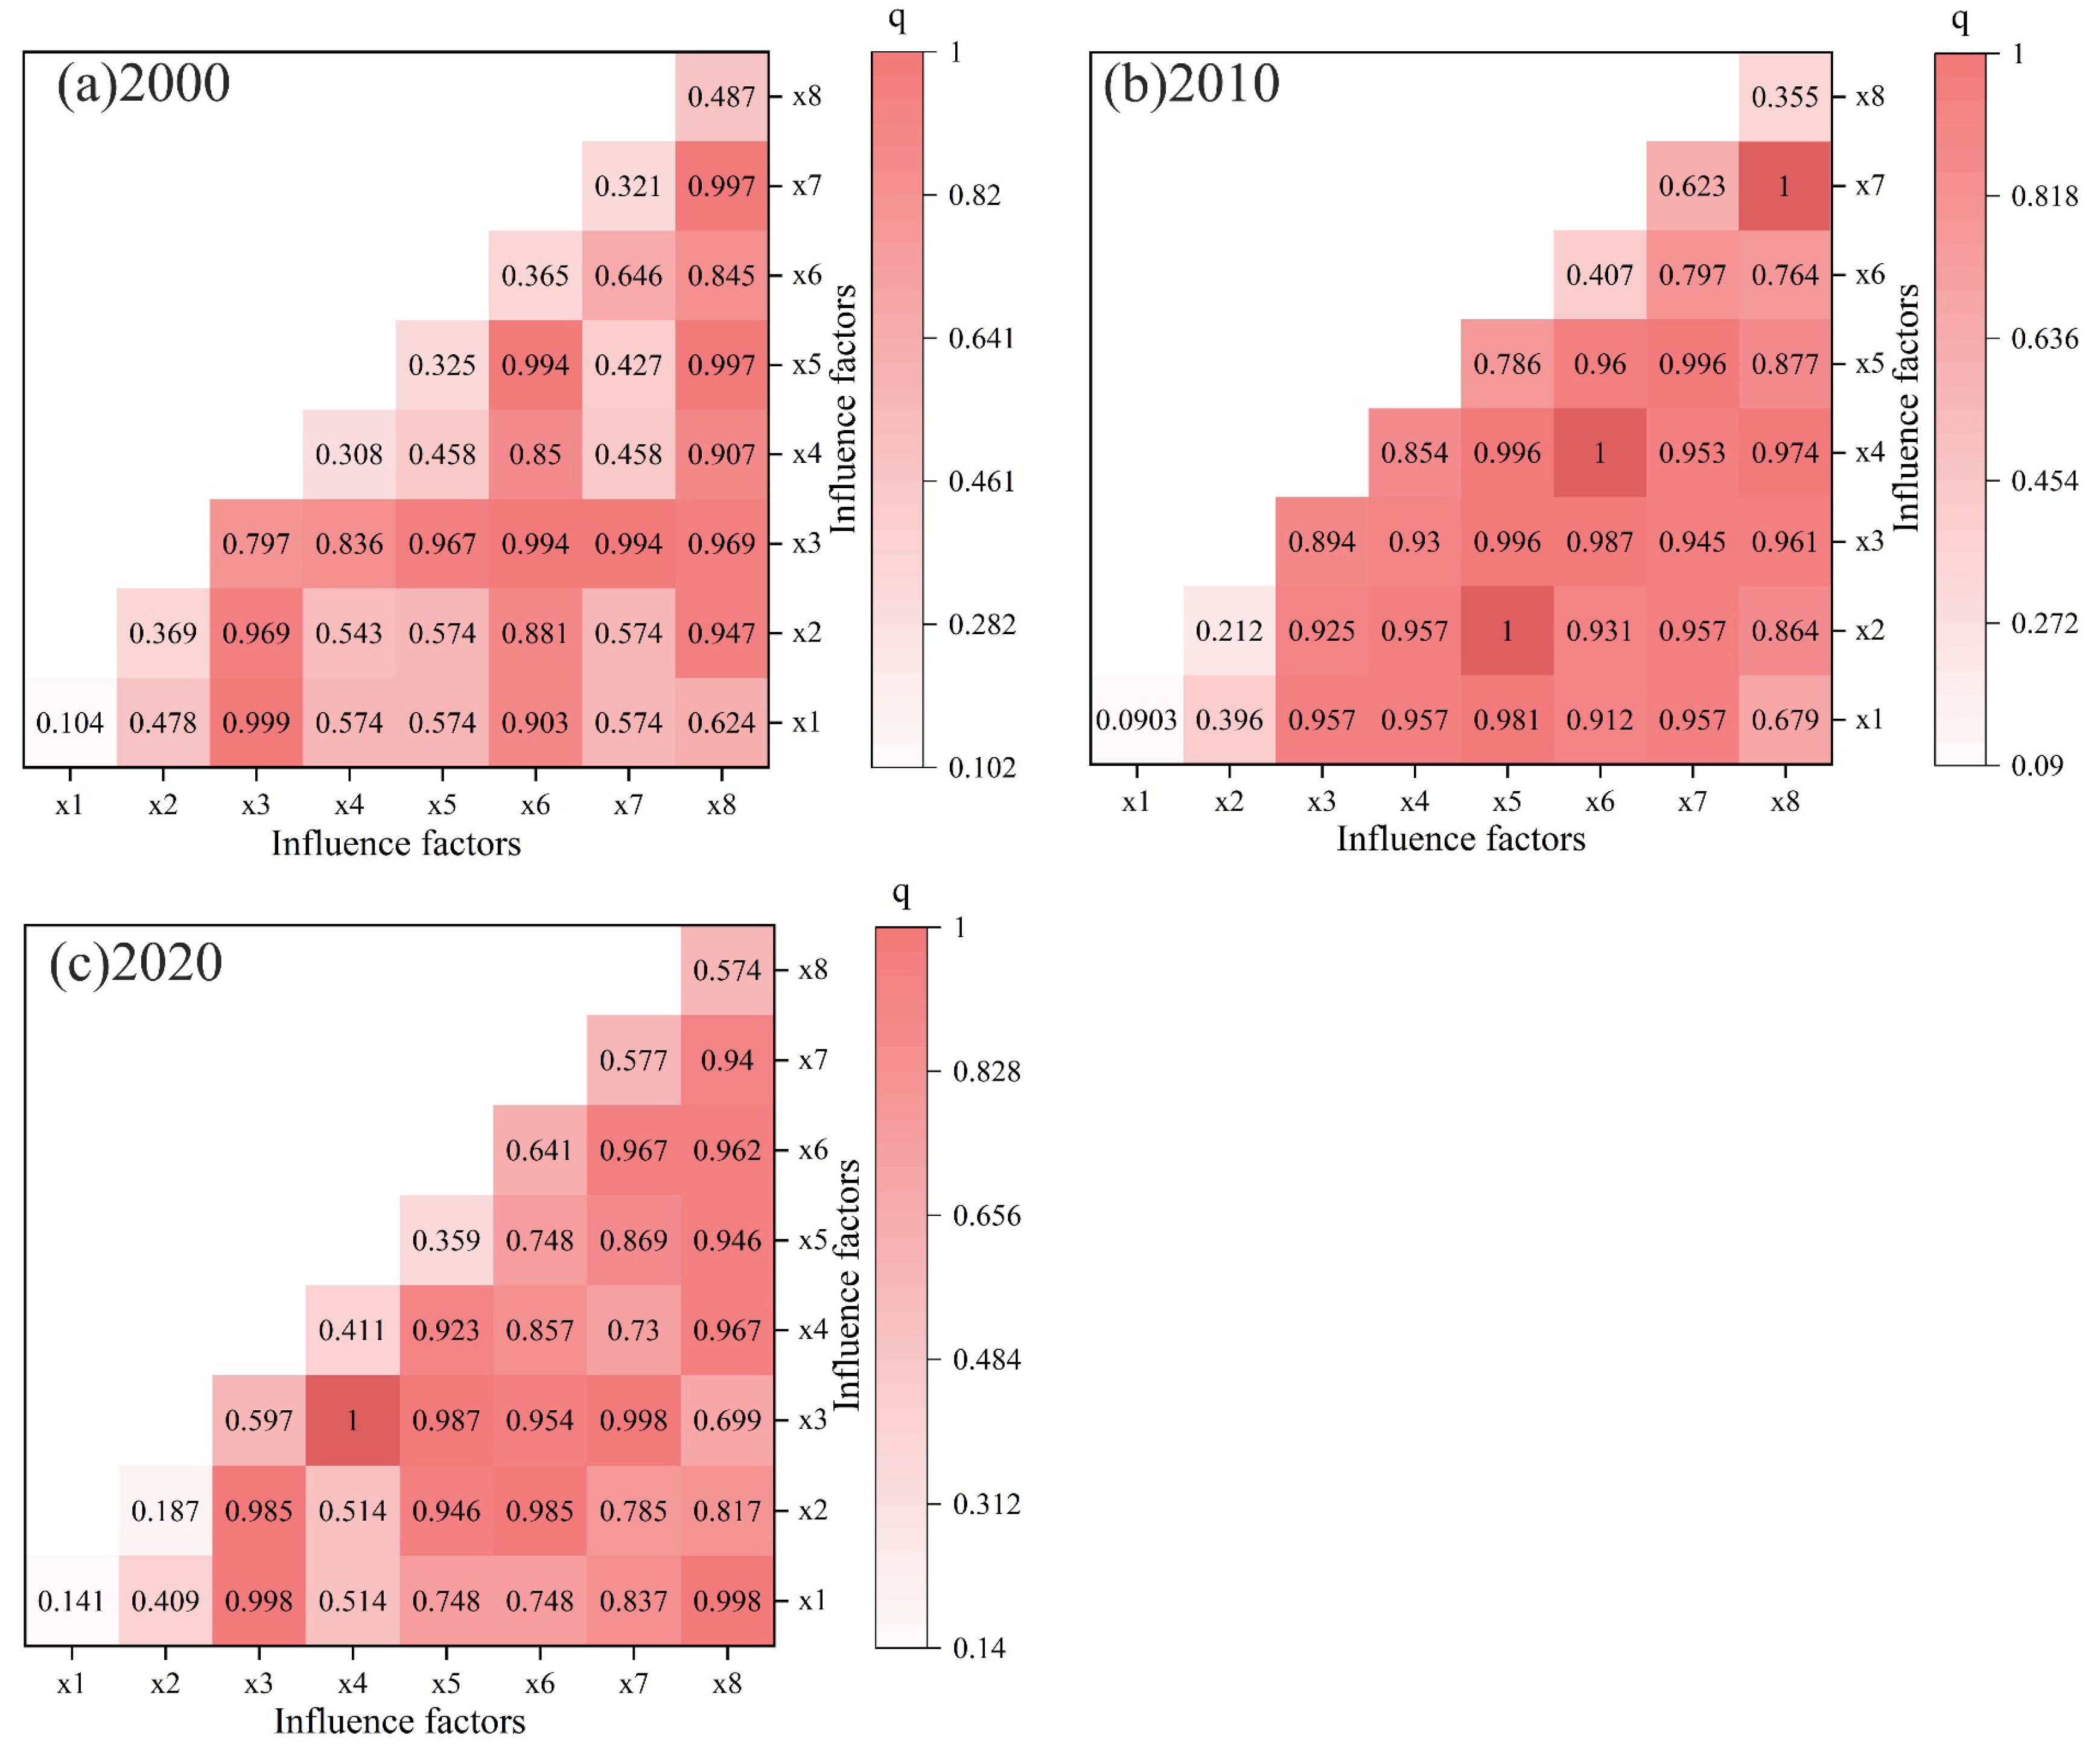
3.3.2. Analysis of Interactive Detection of Geographic Detector

The interaction detector can be used to explore the magnitude and types of interactions among driving factors in the Pearl River Delta urban agglomeration. This study employs the geographical detector’s interaction analysis to assess the influence of different drivers on urban pattern evolution, revealing that all factor interactions exhibit two-factor enhancement or nonlinear enhancement effects. The explanatory power of dual-factor interactions on land use changes exceeds that of single factors. The top three drivers with significant spatial heterogeneity in 2020 were selected to investigate the spatial characteristics of urban expansion (Figure 8). As shown in Figure 8, the top three interaction pairs in 2000 were X1∩X3 (0.999), X5∩X8 (0.997), and X7∩X8 (0.997); in 2010, they were X2∩X5 (1.000), X4∩X6 (1.000), and X7∩X8 (1.000); in 2020, the top pairs were X3∩X4 (1.000), X1∩X3 (0.998), X1∩X8 (0.998), and X3∩X7 (0.998). The interactions involving X3 and X8 consistently demonstrated greater explanatory power than other factor pairs, aligning with X3’s dominant influence in the GTWR model. Both 2010 and 2020 included the two-factor enhancement pairs X1∩X8 and X2∩X6. While X3 had the strongest individual impact on urban expansion in the GTWR model, the combinations of X1∩X8 and X2∩X6 exhibited the highest explanatory power in dual-factor interactions. When X8 interacted with other factors, the explanatory power for urban expansion patterns significantly increased. Spatial heterogeneity in urban expansion was markedly enhanced when two factors exhibited distinct spatial differentiation. This underscores X8’s critical role, as transportation infrastructure upgrades not only improve spatial accessibility but also reshape expansion direction, speed, and morphology by guiding population mobility, industrial agglomeration, and land use transitions.

3.4. Land Use Simulation and Future Multi-Scenario Prediction of Urban Agglomeration

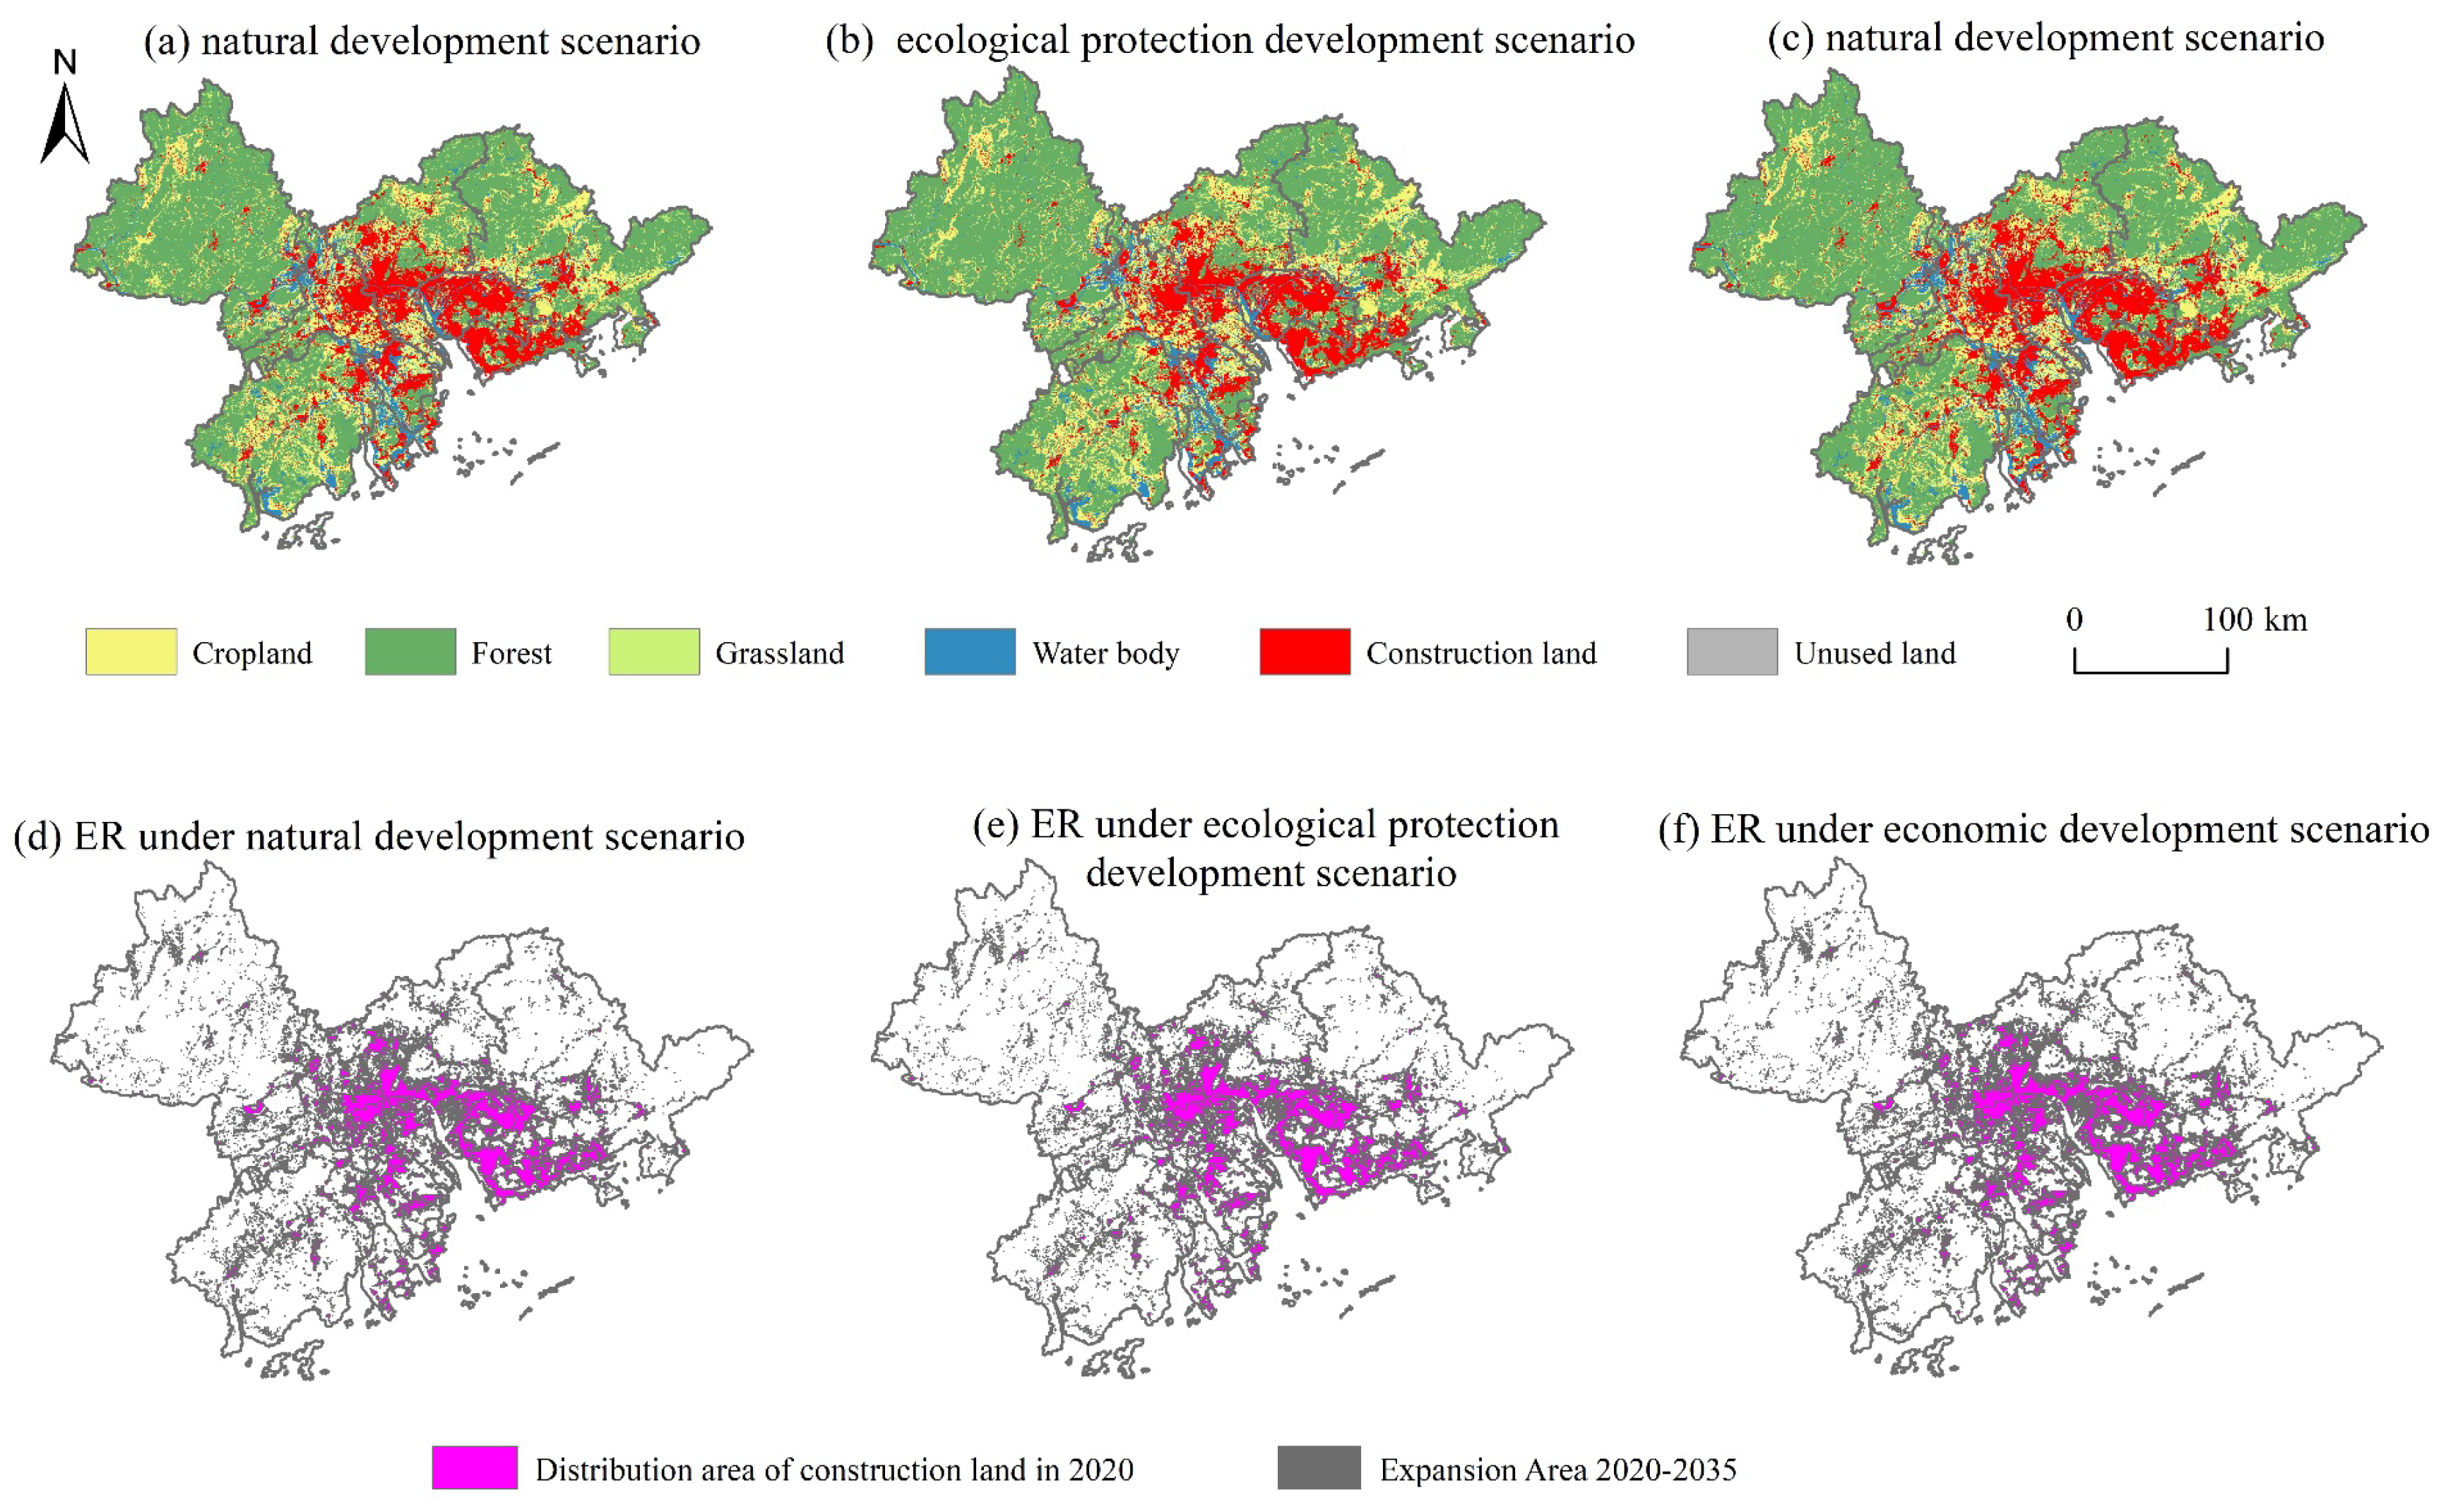
3.4.1. Scenario Settings

To study the impacts of future land use demand and policy controls on urban expansion patterns under different scenarios, this research establishes three scenarios—natural development, ecological conservation, and economic development—to simulate land use changes in the Pearl River Delta urban agglomeration [58,59]. ① Natural Development Scenario: Land use changes occur without human planning or policy intervention, evolving solely based on historical land use transition patterns. Assuming that historical growth trends persist, the 2035 land use demand is projected using Markov chain analysis without imposing constraints. ② Ecological Conservation Scenario: Prioritizes ecological protection by adjusting land use transition probabilities: Cropland: +30% to forest, +60% to grassland, −50% to construction land. Forest: −80% to cropland, −80% to grassland, −90% to construction land. Grassland: +20% to cropland, −80% to construction land. Unused land: +20% to cropland, +20% to forest, +50% to grassland. Conversion probabilities between other land types remain unchanged. ③ Economic Development Scenario: Aligns with the UN Sustainable Development Goals (SDGs) for economic growth, lifting restrictions on urban expansion. Based on the 2015–2020 land use transition matrix: Cropland: +60% to construction land. Grassland: +50% to construction land. Unused land: +30% to construction land. Conversion probabilities between other land types remain unchanged.

3.4.2. Simulation Result Analysis

The accuracy and reliability of the simulated 2035 land use outcomes for the Pearl River Delta Urban Agglomeration meet requirements. Using the PLUS model to simulate and predict urban expansion-driven land use changes, the Kappa coefficient reached 0.9205, with an overall accuracy of 95.90%, indicating strong explanatory power of selected drivers for modeling future land use probability distributions. Future simulations must incorporate constraint conditions to control regional development trajectories. Based on PLUS-predicted land areas and local planning documents as constraints, this study simulates 2035 land use changes and 2020–2035 construction land expansion patterns under three scenarios—Natural Ecological Conservation, Economic Development, and Ecological Protection (Table 7, Figure 9).
Under the Natural Development Scenario, construction land is projected to increase to 8840.04 km2 by 2035, primarily through conversions from forest (to construction land and grassland) and cropland (to construction land and forest). From 2020 to 2035, cumulative land conversion reaches 2256.12 km2, with construction land predominantly encroaching on forests and cropland. Grassland area rises to 1042.05 km2 by 2035, mainly sourced from forest loss. Urban expansion concentrates in central and southern regions, particularly along the Pearl River Estuary in cities like Guangzhou, Dongguan, Foshan, and Huizhou, exhibiting clustered outward growth.
Under the Ecological Conservation Scenario, construction land expansion is constrained, increasing to 7930.39 km2 (14.65% of total area), with minimal unused land. Designating cropland as ecological land limits urban encroachment, enhancing the stability of cropland, forest, and grassland. Forest conversion decreases, while grassland expands by 318 km2 (equivalent to the 2010 forest area), forming contiguous ecological patches.
Under the Economic Development Scenario, construction land surges by 1831 km2 (17.65% of total area). Development prioritizes waterbody stability, avoiding hydrological encroachment, while cropland declines sharply (−1432 km2). Unused land decreases by 33.33%, grassland by 2.90%, and forest by 0.08% (due to its large baseline area).

4. Discussion

4.1. Comparison with Related Research Results

Existing studies reveal that the Pearl River Delta urban agglomeration exhibited distinct phased expansion of construction land over the past 30+ years. During 1980–2015, its annual growth rate reached 4.5%, transitioning from a “single-core agglomeration” to a “polycentric networked” pattern [24]. This study identifies 2000–2010 as PRD’s fastest expansion phase (6.04% annual growth), aligning with prior scholarship [28]. This acceleration likely stems from the synergistic effects of post-WTO accession export-oriented economic growth, land finance policies, and “Shenzhen–Dongguan–Huizhou” integration initiatives. In contrast, the Mid-Yangtze River urban agglomeration recorded 3.8% average annual construction land growth during 2000–2020, displaying an “increasing-then-declining” intensity trend. Post-2010, its growth decelerated to 2.5% due to strengthened ecological protection policies. Spatially, it exhibited a “polycentric diffusion” pattern—distinct from PRD’s networked structure—attributable to administrative fragmentation across three provinces and absence of strong core-city radiation [60,61].
Cropland constituted the primary land type converted for urban expansion. During 1990–2020, cropland loss accounted for 75.3% of new construction land in PRD, compared to 68.1% in the Mid-Yangtze region. Crucially, ecological land loss (forest/wetlands) was more severe in the latter (21.5% of its construction land increment vs. 12.8% in PRD). This regional disparity may reflect weaker enforcement of the “cropland requisition-compensation balance” policy in the Mid-Yangtze region. Notably, PRD demonstrated significant spatial heterogeneity in ecological land encroachment: post-2010 ecological policies reduced forest-to-construction land conversion by 90%, while the Mid-Yangtze region achieved only a 45% reduction during the same period, indicating relatively limited efficacy of its ecological constraints [62,63].
PRD’s urban center of gravity shifted persistently southeastward, whereas the Mid-Yangtze region demonstrated “axial expansion along development corridors” (e.g., Yangtze River, Wuhan–Changsha–Nanchang axis), characterized by a “dual-core (Wuhan–Changsha–Zhuzhou–Xiangtan) polycentric” structure. These differences derive from both the Pearl River Estuary’s alluvial plain constraints and the Mid-Yangtze’s lack of cross-regional coordination mechanisms comparable to the Greater Bay Area. Scenario simulations project that under ecological protection constraints, PRD’s 2035 construction land scale would decrease by 10.3% relative to natural development trends, contrasting with merely a 5.8% reduction in the Mid-Yangtze region, highlighting the latter’s insufficient policy rigidity [62,63].
The interaction between fixed-asset investment and road network density (average q-value > 0.90) dominated PRD’s expansion. Conversely, the Mid-Yangtze region’s primary driver was the interaction between GDP density and distance to transportation lines (q-value = 0.82), with stronger individual factor effects indicating greater reliance on traditional economic elements than infrastructure interconnectivity [64]. This finding transcends the traditional economic globalization-centric framework [27], revealing how divergent development stages shape expansion dynamics: PRD has entered a “networked coordination” phase, while the Mid-Yangtze region remains in a “multi-core competition” phase.
Beyond comparisons with existing studies, hypothesis testing based on GTWR reveals new findings: The Natural Constraint Hypothesis is validated: Elevation regression coefficients decreased from −0.35 to −0.34 to −0.25 to −0.22 during the study period, indicating that terrain constrains urban expansion more strongly in the western region than in the eastern region. Infrastructure–Industry Synergy: The interaction q-value between road area (X8) and FDI (X7) reached 0.998, demonstrating that the Guangzhou–Shenzhen–Hong Kong–Macau corridor has formed synergistic corridors of notable scale. Tertiary Sector-Led Transformation: The regression coefficient of X6 (tertiary sector share) showed dynamic fluctuations during 2000–2010 and 2010–2020, verifying that service sector-driven expansion exhibits stage-specific characteristics in industrialization. Policy-Sensitive Effects: Fixed investment (X4) revealed post-2010 negative-value clusters (e.g., Zhaoqing: −0.21), a result that aligns spatiotemporally with ecological redline policy implementation.

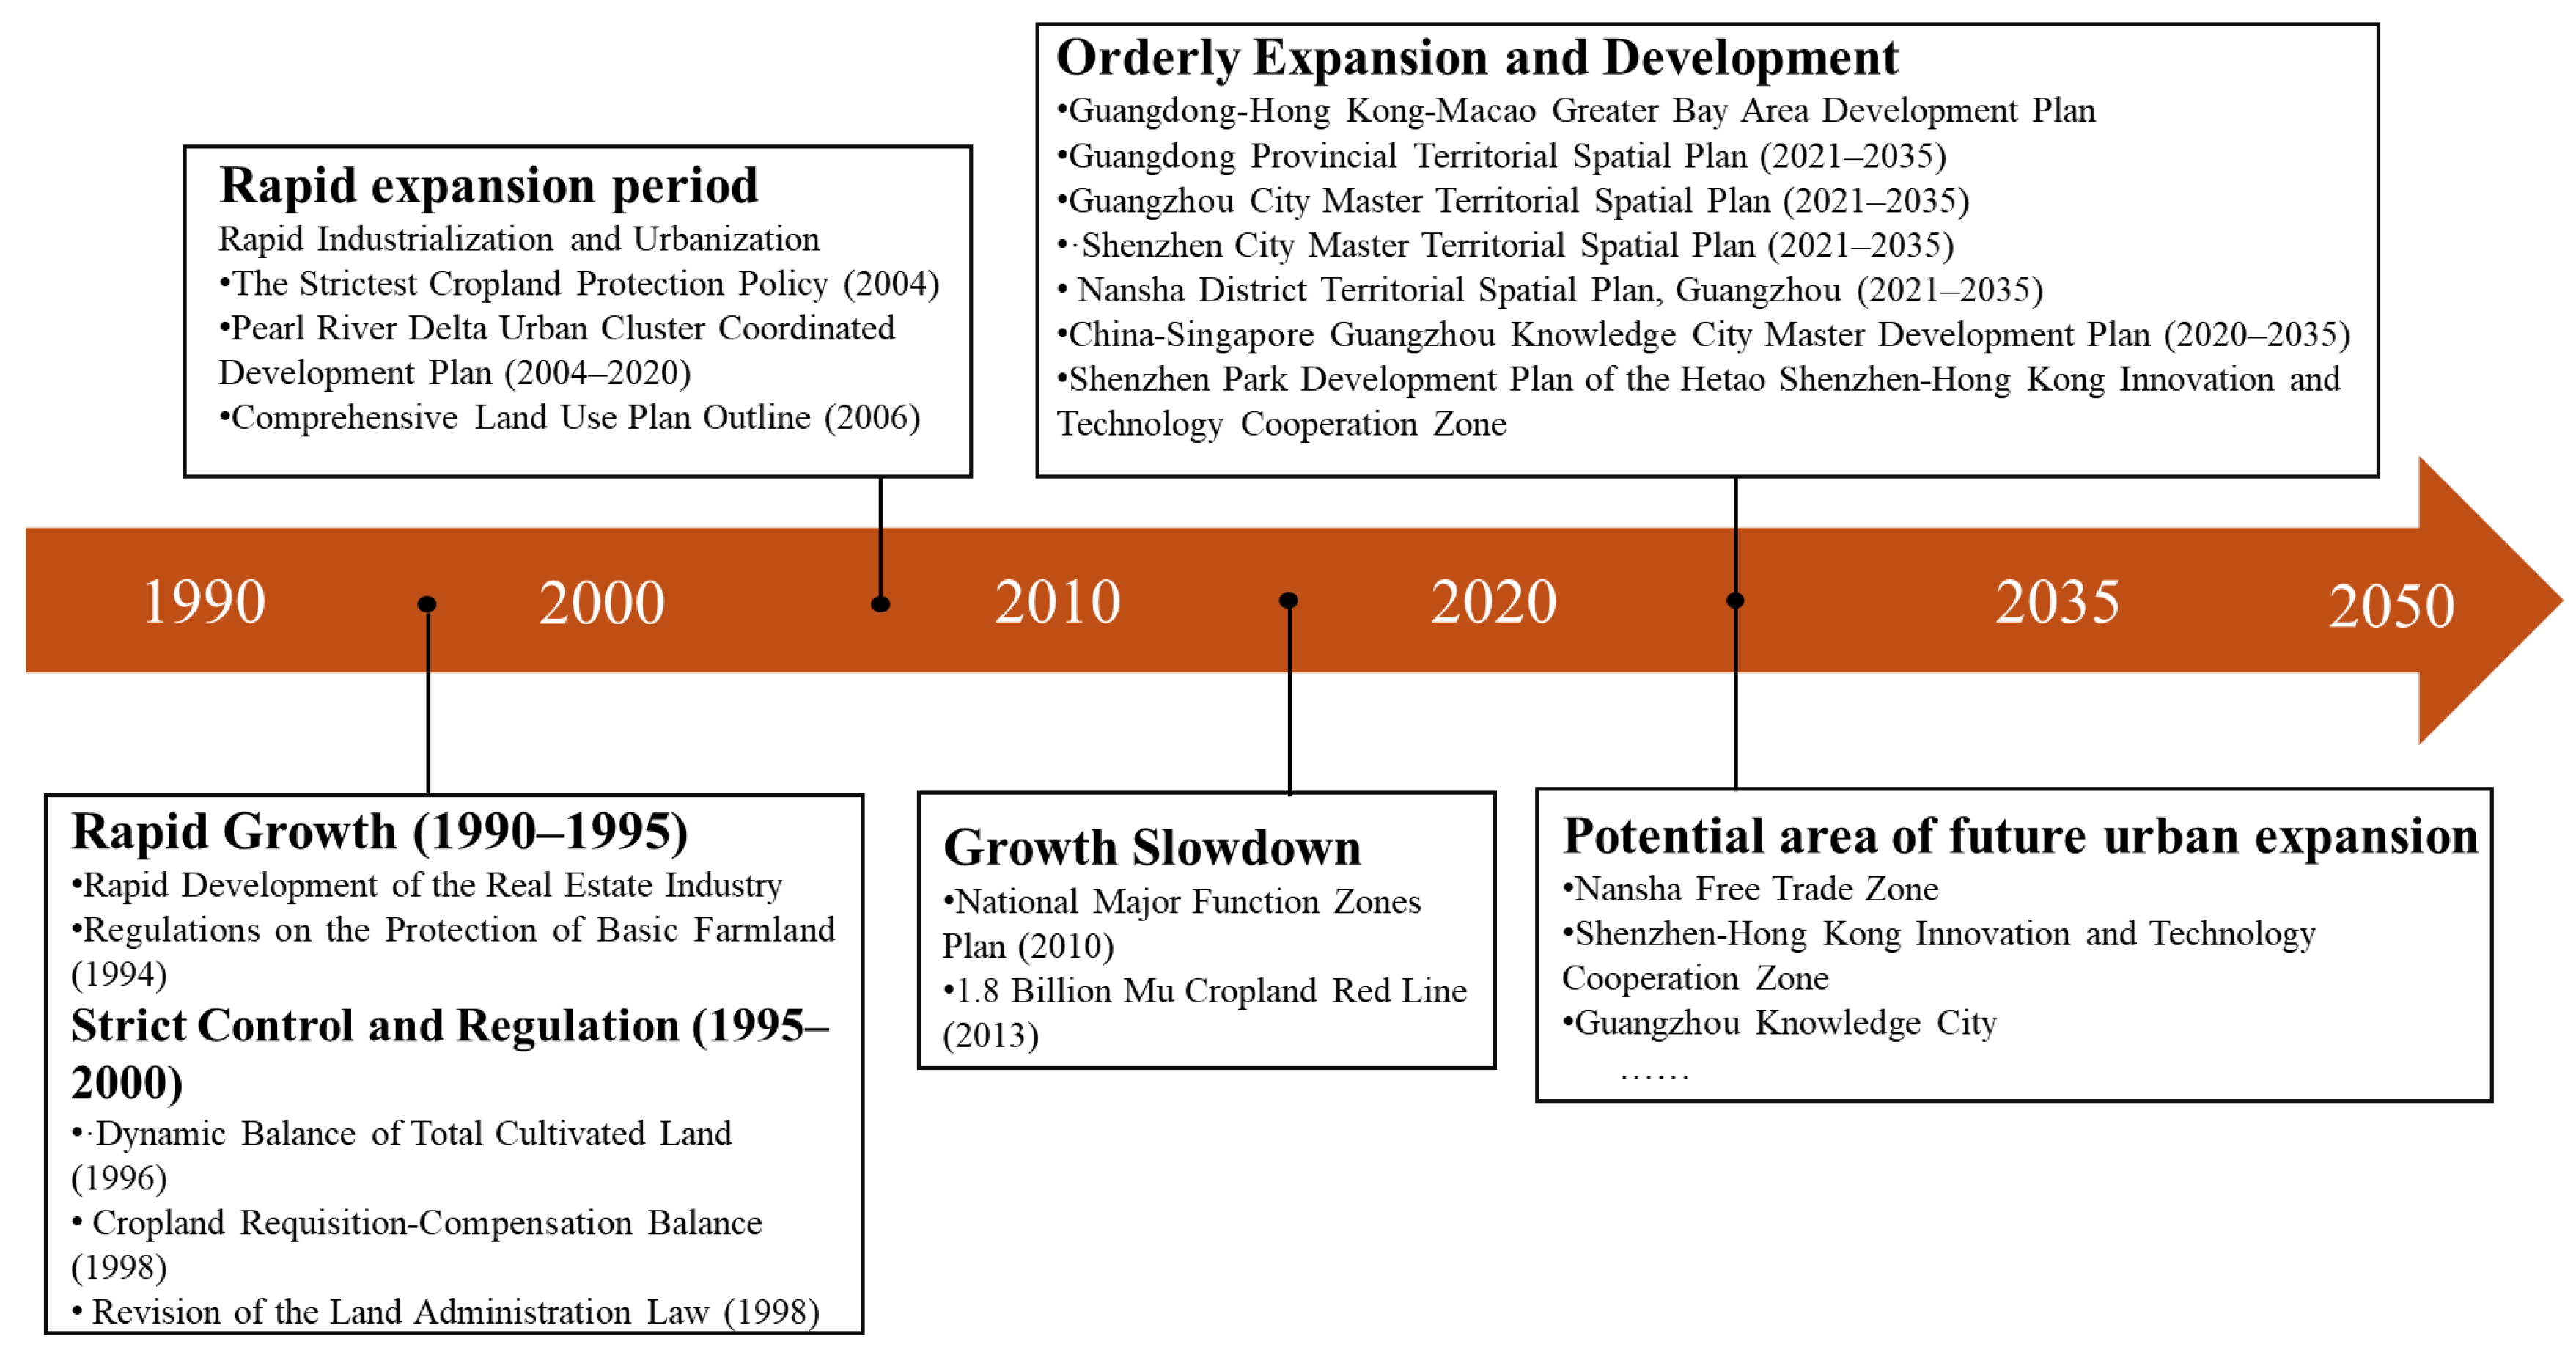
4.2. Policy Attribution of Urban Expansion Pattern Change

Policy factors have significantly driven the spatiotemporal evolution of land use patterns in the Pearl River Delta urban agglomeration (Figure 10). From 1990 to 1995, the advancement of real estate marketization reforms triggered a surge in construction land expansion (234.84 km2/a), characterized by disordered sprawl. The implementation of the Regulations on the Protection of Basic Farmland (1994) and the Cropland Requisition-Compensation Balance Policy (1998) established a regulatory framework, leading to a notable decline in expansion intensity. Post-2000, WTO accession-fueled industrialization and urbanization sustained growth rates above 321.26 km2/a, while the Strictest Cropland Protection System (2004) and Comprehensive Land Use Plans (2006) curbed excessive sprawl through quota controls. The National Major Function Zones Plan (2010) classified territorial space into priority development, protected development, restricted development, and prohibited development zones. Post-implementation, spatial differentiation between prioritized development and ecological conservation reduced expansion intensity by 22.35% (2010–2020 vs. 2000–2010), steering urban growth toward orderly patterns.
Since 2020, urban expansion in the Guangdong–Hong Kong–Macao Greater Bay Area (GBA) has exhibited three significant new features:
(1)
Regional Synergy-Oriented Expansion Model
Following the implementation of the GBA Plan, cross-administrative coordination in construction land expansion increased by 42%. Joint development projects in border areas (e.g., Shenzhen-Hong Kong and Zhuhai-Macao) significantly enhanced the contiguity of cross-boundary construction land [65]. Regional cooperation mechanisms weakened the “boundary effect” in urban expansion, raising the growth correlation of construction land between adjacent cities from 0.35 to 0.61 [66].
(2)
Innovation Corridor-Guided Spatial Restructuring
Along the Guangzhou–Shenzhen–Hong Kong–Macao Science and Technology Innovation Corridor (cities: Shenzhen, Dongguan, Guangzhou), the proportion of land for scientific research in newly added construction land rose from 12% in 2015 to 28% in 2023, forming distinct “knowledge-space” agglomerations [65]. Concurrently, the expansion of traditional industrial land decelerated by 56%, reflecting structural shifts in land demand driven by industrial upgrading [67].
(3)
Quality and Efficiency Improvement Under Ecological Constraints
Post-2020, the GBA’s construction land expansion rate decreased to 156.72 km2/year, while annual GDP output per unit of construction land increased by 9.7% [66]. Unauthorized land use within ecological conservation redlines dropped by 78%, and the average floor–area ratio of construction land outside redlines increased by 0.8, demonstrating a development transition characterized by “total quantity control and efficiency enhancement” [65].
Driven by the national GBA strategy, strategic platforms including the Nansha Free Trade Zone, Shenzhen-Hong Kong Innovation and Technology Cooperation Zone, and Guangzhou Knowledge City have emerged as new growth poles. These platforms absorbed 39% of newly added construction land during 2020–2023 while boosting land values in adjacent areas by 28% [65], marking the Pearl River Delta’s entry into a high-quality spatial restructuring phase. Notably, the spatial coupling between urban expansion and extreme precipitation decreased by 31% [67], indicating that rational, planning-guided expansion contributes to mitigating urban climate risks.

4.3. Countermeasures and Suggestions

Urban expansion in China’s Pearl River Delta urban agglomeration results from the interplay of natural and socioeconomic factors. Natural geographic elements, such as river network density and elevation, impose foundational constraints on spatial development, with significant spatial heterogeneity in dominant drivers across regions, complicating standardized assessments [24]. This study combines qualitative and quantitative analyses to demonstrate that while natural factors significantly influence urban expansion, their relative stability over short timescales limits large-scale human-driven adjustments [41]. In contrast, socioeconomic factors offer greater regulatory flexibility [59]. Urban planners can implement targeted interventions—such as land supply management and industrial layout optimization—tailored to local conditions [57]. This dynamic regulatory mechanism accommodates the PRD’s diverse development needs while guiding orderly spatial expansion [27]. Based on these findings, this study prioritizes optimizing socioeconomic drivers to reshape land use patterns, providing theoretical foundations for scientific spatial governance strategies.
Proposed spatial optimization strategies include the following: (1) redistributing population to emerging growth poles like eastern Guangzhou and Foshan’s Sanlongwan via rail transit networks, enhancing core area efficiency through smart city systems; (2) directing fixed-asset investments to strategic platforms such as the Guangzhou–Shenzhen–Hong Kong–Macao Technology Innovation Corridor and the Pearl River Estuary’s “Golden Inner Bay,” prioritizing land allocation for 5G infrastructure and EV charging stations; (3) advancing industrial synergy by upgrading manufacturing clusters (e.g., Dongguan’s Songshan Lake, Huizhou’s Daya Bay) toward smart manufacturing, maintaining secondary industry share at 30–35% while boosting output intensity via vertical industrial parks; (4) anchoring tertiary industries in international business hubs across Guangzhou–Foshan and Shenzhen-Hong Kong, leveraging Nansha Free Trade Zone for digital economy innovation; (5) innovating foreign investment platforms in Qianhai and Hengqin to attract green industries and restrict high-energy processing trade; (6) enhancing multimodal transport networks like the Shenzhen–Zhongshan Link and Guangzhou–Foshan Circular Line to strengthen the “1-h Bay Area Circle,” promoting TOD development in intercity zones with intensified land use within 800 m of transit hubs.

4.4. Limitations and Future Development

This study conducts multi-scenario simulations of the Pearl River Delta urban agglomeration using the PLUS model, which integrates dual mechanisms of natural environmental changes and human activities to significantly enhance simulation accuracy and effectively reconstruct the dynamic evolution of regional land use patterns. The findings reveal that the spatial expansion of the PRD is constrained by multiple interacting factors: terrain and geomorphology form natural foundational limits, ecological elements impose rigid constraints, while socioeconomic drivers and policy interventions dominate the speed and modes of urban expansion. Despite incorporating key drivers such as topography, transportation networks, GDP, and population, current research remains limited by data availability and quality, with insufficient inclusion of other natural factors like soil types and geological conditions, leaving room for improvement in the driver system. Existing studies on urban agglomeration expansion primarily focus on two-dimensional horizontal analysis. However, as smart growth principles deepen their integration into urban planning, urban development now exhibits multi-dimensional trends of intensification, verticalization, and ecologicalization. This transformation is reflected not only in horizontal land cover expansion but also in qualitative shifts in three-dimensional spatial features such as building height and development intensity. Thus, there is an urgent need to transcend traditional two-dimensional frameworks by incorporating land use behavioral changes (e.g., transitions between high-rise and low-density development) and establishing a multi-dimensional quality assessment system that integrates three-dimensional morphology and ecological indicators. As a critical component of southern China’s ecological security barrier, achieving dynamic equilibrium between urbanization and ecological conservation through spatial optimization has become a core challenge for the Guangdong–Hong Kong–Macao Greater Bay Area’s high-quality development. Future research will design systematic development scenarios aligned with the UN Sustainable Development Goals (SDGs), focusing on optimizing model transition rules: (1) enhancing the analysis of synergistic mechanisms in the “socioeconomic-ecological” composite system through multi-objective constraint algorithms to refine expansion patterns [68]; (2) developing a comprehensive evaluation model integrating “spatial morphology-ecological services-carbon sequestration functions” to provide decision-making support for sustainable high-density urban agglomerations from dual perspectives of vertical spatial development and ecological efficiency enhancement [69,70].

5. Conclusions

This study systematically reveals the spatiotemporal dynamics and sustainability challenges of urban expansion in China’s Pearl River Delta urban agglomeration through multi-method integration. Key findings include the following:
(1)
Spatiotemporal evolution of Urban Expansion: The PRD exhibited marked spatiotemporal heterogeneity in urban expansion from 1990 to 2020. Construction land underwent “phased expansion” with an annual growth rate of 3.7%, increasing its share from 6.5% to 21.8% of the total land area. Cropland accounted for 75.3% of construction land expansion, while forest areas faced persistent encroachment. Spatially, expansion transitioned from “single-core agglomeration” to a “multi-center networked” pattern, with the urban gravity center shifting southeastward (concentrated in Guangzhou’s Panyu and Nansha Districts), driven by Guangzhou’s “Southern Expansion” strategy and Shenzhen–Dongguan integration, forming a continuous urban belt along the northeast–southwest axis. Landscape metrics showed a 30% rise in construction land aggregation (AI) and a 42% decline in cropland integrity (LPI), reflecting intensified fragmentation. Post-2010 policies reduced cropland-to-construction 58.4%, yet ecological pressures persisted in sensitive zones like the Pearl River Estuary, highlighting the tension between urbanization and conservation.
(2)
Drivers of Urban Expansion: Natural and socioeconomic factors jointly shaped expansion dynamics. The GTWR model identified elevation and river density as spatially heterogeneous natural constraints, strongest in western Zhaoqing. Socioeconomic drivers dominated, with paved road area and foreign direct investment as key contributors. Geographical detector analysis revealed synergistic interactions, where dual-factor combinations (e.g., transportation-population, q=0.998; investment-tertiary industry, q=1.000) outperformed single factors, underscoring infrastructure–industry multiplier effects. Policy interventions post-2010 reduced expansion intensity by 1.51%, validating spatial governance efficacy.
(3)
The PLUS model verification results show that model validation achieved a Kappa coefficient of 0.9205 and 95.90% overall accuracy. Expansion hotspots clustered along the Pearl River Estuary, dominated by peripheral sprawl (67%) supplemented by infilling (33%), primarily converting forests and cropland. Multi-scenario simulations projected that under natural development, construction land would breach ecological safety thresholds by 2035, erasing 408.60 km2 of ecological space. Ecological conservation scenarios reduced cropland/forest loss by 3.04% but intensified unused land development (24.09%). Economic prioritization scenarios spurred cross-city development zones in the estuary, with unused land and cropland conversion rates soaring to 64.17% and 13.34%, respectively. The study concludes that a “dual-track governance” balancing ecology and economy is critical for sustainable high-density urbanization in the PRD.

Author Contributions

Conceptualization, Z.Z. and C.Z.; methodology, Z.Z.; software, X.Z.; validation, Z.Z., X.Z. and C.Z.; formal analysis, Z.Z. and X.Z.; investigation, S.L.; resources, C.Z.; data curation, S.L.; writing—original draft preparation, Z.Z. and X.Z.; writing—review and editing, Z.Z.; visualization, S.L.; supervision, C.Z.; project administration, X.Z.; funding acquisition, C.Z. All authors have read and agreed to the published version of the manuscript.

Funding

This study was supported by The General Program of National Natural Science Foundation of China, grant number 42371208.

Data Availability Statement

The original contributions presented in the study are included in the article; further inquiries can be directed to the corresponding author.

Conflicts of Interest

The authors declare no conflicts of interest.

Appendix A

Table A1. Land use transition matrix of the PRD from 1990 to 1995 (km2).
1990–1995
Land Use TypeCroplandForestGrasslandWater BodyConstruction LandUnused Land
Cropland 209.2926.72105.34139.451.23
Forest131.77 43.7024.4947.780.10
Grassland11.2726.54 2.225.180.01
Water body41.0423.542.74 21.310.26
Construction land38.5415.351.4712.98 0.02
Unused land0.180.060.030.040.31
Table A2. Land use transition matrix of the PRD from 1995 to 2000 (km2).
1995–2000
Land Use TypeCroplandForestGrasslandWater BodyConstruction LandUnused Land
Cropland 130.45 10.61 54.32 52.49 0.18
Forest205.09 25.98 25.06 22.03 0.05
Grassland26.63 43.23 2.78 1.99 0.01
Water body57.18 24.41 2.08 20.99 0.04
Construction land79.86 26.66 2.37 16.92 0.31
Unused land0.94 0.06 0.01 0.23 0.38
Table A3. Land use transition matrix of the PRD from 2000 to 2005 (km2).
2000–2005
Land Use TypeCroplandForestGrasslandWater BodyConstruction LandUnused Land
Cropland 11.43 0.45 20.09 111.17 0.01
Forest7.29 1.31 2.46 46.83 0.03
Grassland0.49 4.94 0.27 4.17 0.00
Water body3.10 2.02 0.19 31.84 0.00
Construction land2.76 1.94 0.09 0.84 0.00
Unused land0.01 0.02 0.00 0.19 0.30
Table A4. Land use transition matrix of the PRD from 2005 to 2010 (km2).
2005–2010
Land Use TypeCroplandForestGrasslandWater BodyConstruction LandUnused Land
Cropland 13.19 0.63 43.18 77.65 0.01
Forest13.25 1.98 5.36 37.34 0.01
Grassland0.98 3.54 1.00 3.06 0.00
Water body51.08 3.06 0.25 23.68 0.00
Construction land22.44 16.57 0.92 8.55 0.01
Unused land0.21 0.07 0.00 0.14 0.36
Table A5. Land use transition matrix of the PRD from 2010 to 2015 (km2).
2010–2015
Land Use TypeCroplandForestGrasslandWater BodyConstruction LandUnused Land
Cropland 5.80 0.38 2.35 20.33 0.00
Forest6.08 2.51 1.24 15.91 0.00
Grassland0.36 1.33 0.15 1.17 0.00
Water body2.60 1.30 0.10 6.57 0.00
Construction land2.45 1.49 0.12 0.88 0.00
Unused land0.03 0.01 0.00 0.00 0.15
Table A6. Land use transition matrix of the PRD from 2015 to 2020 (km2).
2015–2020
Land Use TypeCroplandForestGrasslandWater BodyConstruction LandUnused Land
Cropland 26.80 1.98 20.16 70.76 0.04
Forest28.71 8.03 11.05 38.39 0.01
Grassland1.79 5.41 0.75 3.01 0.00
Water body12.76 7.48 1.33 25.30 0.02
Construction land43.51 23.35 6.80 12.22 0.00
Unused land0.05 0.02 0.01 0.06 0.07

References

  1. Villeneuve, P.J.; Lin, Y.; Tjepkema, M.; Pinault, L.; Crouse, D.L.; Osornio-Vargas, A.R.; Hystad, P.; Jerrett, M.; Lavigne, E.; Stieb, D.M. Residential proximity to greenness and adverse birth outcomes in urban areas: Findings from a national Canadian population-based study. Environ. Res. 2021, 204, 112344. [Google Scholar] [CrossRef]
  2. Bauwelinck, M.; Casas, L.; Nawrot, T.S.; Nemery, B.; Trabelsi, S.; Thomas, I.; Aerts, R.; Lefebvre, W.; Vanpoucke, C.; Van Nieuwenhuyse, A.; et al. Residing in urban areas with higher green space is associated with lower mortality risk: A census-based cohort study with ten years of follow-up. Environ. Int. 2021, 148, 106365. [Google Scholar] [CrossRef]
  3. Nguyen, T.P.; Virdis, S.G.; Vu, T.B. “Matter of climate change” or “Matter of rapid urbanization”? Young people’s concerns for the present and future urban water resources in Ho Chi Minh City metropolitan area, Vietnam. Appl. Geogr. 2023, 153, 102906. [Google Scholar] [CrossRef]
  4. Ali, M.T.; Bari, Q.H.; Islam, A.R.M.T. Exploring environmental and meteorological factors influencing greenhouse gas emissions on major urbanized cities in Bangladesh. Urban Clim. 2025, 60, 102369. [Google Scholar] [CrossRef]
  5. Zhu, Z.; Liu, B.; Wang, H.; Hu, M. Analysis of the Spatiotemporal Changes in Watershed Landscape Pattern and Its Influencing Factors in Rapidly Urbanizing Areas Using Satellite Data. Remote Sens. 2021, 13, 1168. [Google Scholar] [CrossRef]
  6. Shen, X.; Bai, X.; Zhao, C.; Tan, Q.; Luo, G.; Li, C.; Ran, C.; Zhang, S.; Xiong, L.; Liao, J.; et al. Global response of soil biodiversity to climate and land use changes. J. Clean. Prod. 2024, 471, 1143381. [Google Scholar] [CrossRef]
  7. Zou, Z.; Yuan, X.; Zhang, Z.; Li, X.; Zhou, C. Spatiotemporal Evolution and Influencing Factors of Coupling and Coordination between the Ecosystem Service Value and Economy in the Pearl River Delta Urban Agglomeration of China. Land 2024, 13, 1670. [Google Scholar] [CrossRef]
  8. Zhang, D.; Xie, X.; Zhou, C. Spatial influence of exposure to green spaces on the climate comfort of urban habitats in China. Urban Clim. 2023, 51, 101657. [Google Scholar] [CrossRef]
  9. Hu, P.; Li, F.; Sun, X.; Liu, Y.; Chen, X.; Hu, D. Assessment of Land-Use/Cover Changes and Its Ecological Effect in Rapidly Urbanized Areas—Taking Pearl River Delta Urban Agglomeration as a Case. Sustainability 2021, 13, 5075. [Google Scholar] [CrossRef]
  10. Liu, W.; Zhan, J.; Zhao, F.; Yan, H.; Zhang, F.; Wei, X. Impacts of urbanization-induced land-use changes on ecosystem services: A case study of the Pearl River Delta Metropolitan Region, China. Ecol. Indic. 2019, 98, 228–238. [Google Scholar] [CrossRef]
  11. Li, C.; Kam, M.; Tang, Y.; Fung, T. From a “World Factory” to China’s Bay Area: A Review of the Outline of the Development Plan for the Guangdong-Hong Kong-Macao Greater Bay Area. Plan. Theory Pract. 2022, 23, 310–314. [Google Scholar] [CrossRef]
  12. Jiang, S.; Ren, H.; Zhang, Z. Monitoring and assessing the growth law of urban land using multi-source data: A case study of five East African countries. Land Use Policy 2025, 153, 107530. [Google Scholar] [CrossRef]
  13. Wei, L.; Zhou, L.; Sun, D.; Tang, X. The evolution of spatio-temporal pattern and scenario simulation of urban agglomeration expansion in the Yellow River Basin: A case study in the Hohhot-Baotou-Ordos-Yulin Urban Agglomeration. Geogr. Res. 2022, 41, 1610–1622. [Google Scholar]
  14. Taka, M.; Sillanpää, N.; Niemi, T.; Warsta, L.; Kokkonen, T.; Setälä, H. Heavy metals from heavy land use? Spatio-temporal patterns of urban runoff metal loads. Sci. Total Environ. 2022, 817, 152855. [Google Scholar] [CrossRef]
  15. Zhai, H.; Lv, C.; Liu, W.; Yang, C.; Fan, D.; Wang, Z.; Guan, Q. Understanding Spatio-Temporal Patterns of Land Use/Land Cover Change Under Urbanization in Wuhan, China, 2000–2019. Remote Sens. 2021, 13, 3331. [Google Scholar] [CrossRef]
  16. Wang, S.; He, S.; Wang, J.; Li, J.; Zhong, X.; Cole, J.; Kurbanov, E.; Sha, J. Analysis of Land Use/Cover Changes and Driving Forces in a Typical Subtropical Region of South Africa. Remote Sens. 2023, 15, 4823. [Google Scholar] [CrossRef]
  17. Chen, Q.; Wu, M.; Xie, H. Tillage conditions or social economy? An analysis of the dominant driving force of farmland marginalization from the farmers’ perspective. Land Use Policy 2023, 133, 106870. [Google Scholar] [CrossRef]
  18. Zhao, D.; Xiao, M.; Huang, C.; Liang, Y.; Yang, Z. Land Use Scenario Simulation and Ecosystem Service Management for Different Regional Development Models of the Beibu Gulf Area, China. Remote Sens. 2021, 13, 3161. [Google Scholar] [CrossRef]
  19. Simwanda, M.; Murayama, Y.; Phiri, D.; Nyirenda, V.R.; Ranagalage, M. Simulating Scenarios of Future Intra-Urban Land-Use Expansion Based on the Neural Network–Markov Model: A Case Study of Lusaka, Zambia. Remote Sens. 2021, 13, 942. [Google Scholar] [CrossRef]
  20. Li, B.; Shi, X.; Chen, Y.; Jiang, Y. Quantitative assessment of the ecological effects of land use/cover change in the arid region of Northwest China. Environ. Monit. Assess. 2019, 191, 704. [Google Scholar] [CrossRef]
  21. Krishnan, G.; Shanthi Priya, R.; Senthil, R. Ecological effects of land use and land cover changes on lakes in urban environments. Sustain. Dev. 2024, 32, 6801–6818. [Google Scholar] [CrossRef]
  22. Hashim, F.; Dibs, H.; Jaber, H.S. Adopting Gram-Schmidt and Brovey Methods for Estimating Land Use and Land Cover Using Remote Sensing and Satellite Images. Nat. Environ. Pollut. Technol. 2022, 21, 867–881. [Google Scholar] [CrossRef]
  23. Li, K.; Wang, L.; Yin, D. Deriving corn and soybeans fractions with Land Remote-Sensing Satellite (System, Landsat) imagery by accounting for endmember variability on Google Earth Engine. Int. J. Remote Sens. 2021, 42, 4493–4513. [Google Scholar] [CrossRef]
  24. Hu, P.; Li, F.; Hu, D.; Sun, X.; Liu, Y.; Chen, X. Spatial and temporal characteristics of urban expansion in Pearl River Delta urban agglomeration from 1980 to 2015. Acta Ecol. Sin. 2021, 41, 7063–7072. [Google Scholar]
  25. Liu, Z.; Huang, H.; Saskia, E.W.; Yan, D. Construction area expansion in relation to economic-demographic development and land resource in the Pearl River Delta of China. J. Geogr. Sci. 2016, 26, 188–202. [Google Scholar] [CrossRef]
  26. Wang, Y.; Huang, C.; Feng, Y.; Gu, J. Evaluation of the Coordinated Relationship between Land Consumption Rate and Population Growth Rate in the Pearl River Delta based on the 2030 Sustainable Development Goals. Remote Sens. Technol. Appl. 2021, 36, 1168–1177. [Google Scholar]
  27. Xu, Q.; Huang, Y. Analysis of urban expansion measurement and driving mechanism in typical region of Pearl River Delta. Sci. Surv. Mapp. 2018, 43, 49–52. [Google Scholar]
  28. Chen, Q.; Wang, X.; Wu, Z.; Wang, Z. Impacts of Urban Expansion on Meteorological Conditions and Ozone Concentration in Spring over the Pearl River Delta, China. J. Trop. Meteorol. 2012, 28, 357. [Google Scholar]
  29. Zhao, L.; Liu, X.; Liu, P.; Chen, G.; He, J. Urban Expansion Simulation and Early Warning based on Geospatial Partition and FLUS Model. J. Geo-Inf. Sci. 2020, 22, 517–530. [Google Scholar]
  30. Guo, R.; Liu, X.; Xu, X. Future Urban Expansion Simulation and Flood Mitigation Assessment in the Pearl River Delta under Flood Risk Avoidance. Trop. Geogr. 2023, 43, 1083–1097. [Google Scholar]
  31. Lu, Y.; Lin, J. Predicting the impact of urban agglomeration development on grain production regions: A case study of Pearl River Delta. J. Nat. Resour. 2023, 38, 1532–1549. [Google Scholar] [CrossRef]
  32. Zhang, X.; Zeng, H. Dynamic of three dimensional ecological footprint in the Pearl River Delta and its driving factors. Acta Sci. Circumstantiae 2017, 37, 771–778. [Google Scholar]
  33. Wang, M.; Qiu, S.; Shi, W. Impacts of future land use change on biodiversity in the Pearl River Delta. Acta Ecol. Sin. 2024, 44, 7183–7197. [Google Scholar]
  34. Wu, M.; Niu, Z.; Wang, C. Assessing the Accuracy of Spatial and Temporal Image Fusion Model of Complex area in South China. J. Geo-Inf. Sci. 2014, 16, 776–783. [Google Scholar]
  35. Hu, Y.; Connor, D.S.; Stuhlmacher, M.; Peng, J.; Turner, B.L., II. More urbanization, more polarization: Evidence from two decades of urban expansion in China. npj Urban Sustain. 2024, 4, 33. [Google Scholar] [CrossRef]
  36. Xiao, R.; Yu, X.; Xiang, T.; Zhang, Z.; Wang, X.; Wu, J. Exploring the coordination between physical space expansion and social space growth of China’s urban agglomerations based on hierarchical analysis. Land Use Policy 2021, 109, 105700. [Google Scholar] [CrossRef]
  37. Li, Z.; Li, M.; Xia, B. Spatio-temporal dynamics of ecological security pattern of the Pearl River Delta urban agglomeration based on LUCC simulation. Ecol. Indic. 2020, 114, 106319. [Google Scholar] [CrossRef]
  38. GB/T 21010-2017; Current Land Use Classification. General Administration of Quality Supervision, Inspection and Quarantine of the People’s Republic of China (AQSIQ) and Standardization Administration of the People’s Republic of China (SAC): Beijing, China, 2017.
  39. Wei, Q.; Xue, L.; Zhang, H.; Chen, P.; Yang, J.; Niu, B. Spatiotemporal analysis of carbon emission efficiency across economic development stages and synergistic emission reduction in the Beijing-Tianjin-Hebei region. J. Environ. Manag. 2025, 377, 124609. [Google Scholar] [CrossRef]
  40. He, Y.; Liang, Y.; Li, L.; Zhang, C.; Huang, J. Loss of green landscapes due to urban expansion in China. Resour. Conserv. Recycl. 2023, 199, 107228. [Google Scholar] [CrossRef]
  41. You, M.; Zou, Z.; Zhao, W.; Zhang, W.; Fu, C. Study on land use and landscape pattern change in the Huaihe River Ecological and economic zone from 2000 to 2020. Heliyon 2023, 9, e13430. [Google Scholar] [CrossRef]
  42. Li, Z.; Han, H.; You, H.; Cheng, X.; Wang, T. Effects of local characteristics and landscape patterns on plant richness: A multi-scale investigation of multiple dispersal traits. Ecol. Indic. 2020, 117, 106584. [Google Scholar] [CrossRef]
  43. Zou, Z.; Zhao, X.; Liu, S.; Yuan, X.; Zhou, C. Quantitative attribution of spatio-temporal pattern of pm2.5 concentration based on geodetector and GWR model: Evidence from China’s three major urban agglomerations. PLoS ONE 2025, 20, e0326241. [Google Scholar]
  44. He, X.; Zhou, Y.; Yuan, Y. Exploring the relationship between urban polycentricity and consumer amenity development: An empirical study using Dianping Data in China. Cities 2025, 166, 106197. [Google Scholar] [CrossRef]
  45. Bao, W.; Yang, Y.; Zou, L. How to reconcile land use conflicts in mega urban agglomeration? A scenario-based study in the Beijing-Tianjin-Hebei region, China. J. Environ. Manag. 2021, 296, 113168. [Google Scholar] [CrossRef] [PubMed]
  46. Wang, R.; Bai, Y.; Alatalo, J.; Guo, G.; Yang, Z.; Yang, Z.; Yang, W. Impacts of urbanization at city cluster scale on ecosystem services along an urban-rural gradient: A case study of Central Yunnan City Cluster, China. Environ. Sci. Pollut. Res. Int. 2022, 29, 88852–88865. [Google Scholar] [CrossRef] [PubMed]
  47. Guo, S.; Zhang, S.; Lv, X.; Tang, Y.; Zhang, T.; Hua, Z. Occurrence, risk assessment and source apportionment of perfluoroalkyl acids in the river of a hill-plain intersection region: The impacts of land use and river network structure. Sci. Total Environ. 2024, 954, 176260. [Google Scholar] [CrossRef] [PubMed]
  48. Wang, P.; Zeng, C.; Zhang, W.; Lv, T.; Miao, X.; Xiang, H. Investigation of the spatial effects on PM2.5 in relation to land use and ecological restoration in urban agglomerations. Sci. Total Environ. 2023, 913, 169665. [Google Scholar] [CrossRef]
  49. Xu, Y.; Liu, X. Path analysis and mediating effects of influencing factors of land use carbon emissions in Chang-Zhu-Tan urban agglomeration. Technol. Forecast. Soc. Change 2023, 188, 122268. [Google Scholar]
  50. Liu, C.; Hu, S.; Wu, S.; Song, J.; Li, H. County-level land use carbon emissions in China: Spatiotemporal patterns and impact factors. Sustain. Cities Soc. 2024, 105, 105304. [Google Scholar] [CrossRef]
  51. Li, H.; Chen, K.; Yan, L.; Zhu, Y.; Liao, L.; Chen, Y. Urban Land Use Transitions and the Economic Spatial Spillovers of Central Cities in China’s Urban Agglomerations. Land 2021, 10, 644. [Google Scholar] [CrossRef]
  52. Qiao, W.; Hu, B.; Guo, Z.; Huang, X. Evaluating the sustainability of land use integrating SDGs and its driving factors: A case study of the Yangtze River Delta urban agglomeration, China. Cities 2023, 143, 104569. [Google Scholar] [CrossRef]
  53. Wang, X.; Yan, F.; Zeng, Y.; Chen, M.; Su, F.; Cui, Y. Changes in Ecosystems and Ecosystem Services in the Guangdong-Hong Kong-Macao Greater Bay Area since the Reform and Opening Up in China. Remote Sens. 2021, 13, 1611. [Google Scholar] [CrossRef]
  54. Liu, Y.; Cao, X.; Xu, J.; Li, T. Influence of traffic accessibility on land use based on Landsat imagery and internet map: A case study of the Pearl River Delta urban agglomeration. PLoS ONE 2019, 14, e0224136. [Google Scholar] [CrossRef] [PubMed]
  55. Wang, J.; Xu, C. Geodetector: Principle and prospective. Acta Geogr. Sin. 2017, 72, 116–134. [Google Scholar]
  56. Zou, Z.; You, M.; Zhao, W.; Fu, C.; Zhang, W.; He, Z. Changes in the “Production-Living-Ecological Space” Pattern in the Interlocking Mountain and River Zones of the Yellow River Basin—Taking Xinxiang City as an Example. J. Resour. Ecol. 2023, 14, 479–492. [Google Scholar]
  57. Li, C.; Wu, Y.; Gao, B.; Zheng, K.; Wu, Y.; Li, C. Multi-scenario simulation of ecosystem service value for optimization of land use in the Sichuan-Yunnan ecological barrier, China. Ecol. Indic. 2021, 132, 108328. [Google Scholar] [CrossRef]
  58. Cai, J.; Chi, H.; Lu, N.; Bian, J.; Chen, H.; Yu, J.; Yang, S. Analysis of Spatiotemporal Predictions and Drivers of Carbon Storage in the Pearl River Delta Urban Agglomeration via the PLUS-InVEST-GeoDetector Model. Energies 2024, 17, 5093. [Google Scholar] [CrossRef]
  59. Gong, J.; Du, H.; Sun, Y.; Zhan, Y. Simulation and prediction of land use in urban agglomerations based on the PLUS model: A case study of the Pearl River Delta, China. Front. Environ. Sci. 2023, 11, 1306187. [Google Scholar] [CrossRef]
  60. Cui, F.; Wang, Y.; Liu, G. Exploring the spatial-temporal evolution and driving mechanisms for coupling coordination between green transformation of urban construction land and industrial transformation and upgrading: A case study of the urban agglomeration in the middle reaches of the Yangtze River. Environ. Sci. Pollut. Res. Int. 2023, 30, 119385–119405. [Google Scholar]
  61. Zhu, Z.; Zhu, X.; Li, S. Evolution process and characteristics of spatial structure of urban agglomeration in the middle reaches of the Yangtze River. Acta Geogr. Sin. 2021, 76, 799–817. [Google Scholar]
  62. Zhu, Z.; He, Q. Spatio-temporal evaluation of the urban agglomeration expansion in the middle reaches of the Yangtze River and its impact on ecological lands. Sci. Total Environ. 2021, 790, 148150. [Google Scholar]
  63. Wang, Y.; Zhou, X.; Wang, P.; Li, B.; Han, W.; Hou, J. Spatio-temporal Analysis of Land Use/Land Cover Pattern Changes in Triangle of Central China in the Past 30 Years. Remote Sens. Technol. Appl. 2025, 40, 132. [Google Scholar]
  64. He, D.; Chen, Z.; Zhou, J.; Yang, T.; Lu, L. The Heterogeneous Impact of High-Speed Railway on Urban Expansion in China. Remote Sens. 2021, 13, 4914. [Google Scholar] [CrossRef]
  65. Zhang, X.; Zou, Y.; Xia, C.; Lu, Y. Unraveling the mystery of urban expansion in the Guangdong-Hong Kong-Macao Greater Bay Area: Exploring the crucial role of regional cooperation. Environ. Plan. B Urban Anal. City Sci. 2025, 52, 707–724. [Google Scholar] [CrossRef]
  66. Zhang, X.; Chen, Y.; Xu, Y.; Yue, W.; Tang, C. Does regional cooperation constrain urban sprawl? Evidence from the Guangdong-Hong Kong-Macao Greater Bay Area. Landsc. Urban Plan. 2023, 235, 104742. [Google Scholar] [CrossRef]
  67. Yang, F.; Pang, B.; Song, L.; Cheng, H.; Zhou, S.; Zheng, Z.; Peng, D.; Zuo, D. Response of extreme precipitation to urban expansion over the Guangdong-Hong Kong-Macao Greater Bay Area. Urban Clim. 2024, 56, 102062. [Google Scholar] [CrossRef]
  68. Hong, W.; Ren, Z.; Guo, Y.; Wang, C.; Cao, F.; Zhang, P.; Hong, S.; Ma, Z. Spatiotemporal changes in urban forest carbon sequestration capacity and its potential drivers in an urban agglomeration: Implications for urban CO2 emission mitigation under China’s rapid urbanization. Ecol. Indic. 2024, 159, 111601. [Google Scholar] [CrossRef]
  69. Wang, C.; Ren, Z.; Du, Y.; Guo, Y.; Zhang, P.; Wang, G.; Hong, S.; Ma, Z.; Hong, W.; Li, T. Urban vegetation cooling capacity was enhanced under rapid urbanization in China. J. Clean. Prod. 2023, 425, 138906. [Google Scholar] [CrossRef]
  70. Guo, Y.; Ren, Z.; Wang, C.; Zhang, P.; Ma, Z.; Hong, S.; Hong, W.; He, X. Spatiotemporal patterns of urban forest carbon sequestration capacity: Implications for urban CO2 emission mitigation during China’s rapid urbanization. Sci. Total Environ. 2023, 912, 168781. [Google Scholar] [CrossRef]
Figure 1. Technology path.
Remotesensing 17 02455 g001
Figure 2. Location of the study area. Note: This map was created based on the standard map (Approval Number: GS (2020)4630) issued by the Ministry of Natural Resources of the People’s Republic of China. The base map remains unaltered.
Remotesensing 17 02455 g002
Figure 3. Land use change from 1990 to 2020. Note: This map was created based on the standard map (Approval Number: GS (2020)4630) issued by the Ministry of Natural Resources of the People’s Republic of China. The base map remains unaltered.
Remotesensing 17 02455 g003
Figure 4. Change of land use transfer area from 1990 to 2020.
Remotesensing 17 02455 g004
Figure 5. Spatiotemporal variation trend of standard deviation ellipse of construction land and center of gravity of urban agglomeration in the Pearl River Delta urban agglomeration from 1990 to 2020. Note: This map was created based on the standard map (Approval Number: GS (2020)4630) issued by the Ministry of Natural Resources of the People’s Republic of China. The base map remains unaltered.
Remotesensing 17 02455 g005
Figure 6. Landscape pattern changes of land use from 1990 to 2020.
Remotesensing 17 02455 g006
Figure 7. Spatial distribution of regression coefficients of driving factors in the GTWR model. Note: This map was created based on the standard map (Approval Number: GS (2020)4630) issued by the Ministry of Natural Resources of the People’s Republic of China. The base map remains unaltered.
Remotesensing 17 02455 g007
Figure 8. Heat map of the results of the interaction of the driving factors of the geodetector.
Remotesensing 17 02455 g008
Figure 9. Land use simulation results in 2035 under different scenarios and the regional distribution of construction land expansion in 2020–2035. Note: This map was created based on the standard map (Approval Number: GS (2020)4630) issued by the Ministry of Natural Resources of the People’s Republic of China. The base map remains unaltered.
Remotesensing 17 02455 g009
Figure 10. The impact of policies and urban plans on urban expansion.
Remotesensing 17 02455 g010
Table 1. Data list.
Table 1. Data list.
Data Name n Data DescriptionData TypeTimeData Source
Land UseLand Use DataRaster Data1990, 1995, 2000, 2005, 2010, 2015, 2020 Resource and Environmental Science Data Center, Chinese Academy of Sciences (http://www.resdc.cn/, accessed on 26 March 2024)
DEM Elevation, slope, aspect, et al.Raster Data2020NASA-SRTM (https://www.earthdata.nasa.gov/, accessed on 2 July 2023)
Geospatial Data Administrative boundaries, road networks, rivers, et al.Vector Data2020National Geomatics Center of China (http://www.ngcc.cn/)
Socioeconomic DataPopulation, economic indicators for driving factor analysisStatistical Data2000, 2010, 2020Guangdong Provincial Bureau of Statistics (https://stats.gd.gov.cn/)
NPP-VIIRS Nighttime LightsEconomic proxy for driving factor analysisRaster Data2000, 2010, 2020National Earth System Science Data Center, National Science & Technology Infrastructure of China (http://www.geodata.cn)
Constraint FactorsNature reservesVector Data2025OSM (https://www.openstreetmap.org/, accessed on 18 March 2025)
Note: Due to data availability constraints, this study utilizes socioeconomic datasets from 2000, 2010, and 2020 for the analysis of urban expansion drivers; additionally, all satellite data were converted to the Albers equal-area conic projection and resampled to 1 km resolution.
Table 2. Landscape indices and ecological significance.
IndexEcological Significance Calculation FormulaParameter Description
NPTotal number of patches of a specific land type N P = n i n i is the number of patches of type i
LPIProportion of the largest patch relative to the total landscape area L P I = m a x j n a i j A × 100 % a i j is the area of the j patch in the i landscape and A is the total landscape area
AIPatch connectivity; higher values indicate greater aggregation A I = g i j m a x g i j × 100 % g i j is the number of similar adjacent patches of corresponding landscape types
COHESIONPhysical connectivity between patches within a landscape type C O H E S I O N = 1 j = 1 n P i j j = 1 n a i j 1 1 A × 100 % p i j is the perimeter of the j th patch in the i th landscape, a i j is the area of the j patch in the i landscape, and A is the total area of the landscape
Table 3. Driving factors of urban expansion in the PRD.
CategoryIDFactorMetricUnit
Natural factors1Terrain reliefRelief amplitudem
2SlopeMean slope%
3River network densityRiver length ÷ built-up areakm/km2
4ElevationMean elevationm
Socioeconomic factors5PopulationPermanent population10,000 people
6Economic vitalityNighttime light index-
7Economic scaleGDP10,000 CNY
8Investment intensityFixed-asset investment10,000 CNY
9Industrial outputGross industrial output10,000 CNY
10Secondary industrySecondary industry GDP share%
11Tertiary industryTertiary industry GDP share%
12Foreign investmentForeign direct investment (FDI)10,000 CNY
13TransportationPaved road aream2
Table 4. Area and proportions of land use types, 1990–2020.
Land Use Type199020102020
Area (km2)Proportion of Area (%)Area (km2)Proportion of Area (%)Area (km2)Proportion of Area (%)
Cropland15,803.6929.2312,666.0223.4012,162.0222.47
Forest30,666.2556.7229,812.8755.0829,421.1854.37
Grassland1112.472.06944.951.751018.891.88
Water body3668.026.783881.347.173786.537.00
Construction land2789.745.166809.6712.587721.4314.27
Unused land21.420.048.910.026.040.01
Table 5. Collinearity in the section of the influential factors.
Influencing FactorsExplanatory VariablesVariance Inflation Factor (VIF)Tolerance (T)
Natural factors elevation (X1)6.8530.146
river network density (X2)5.3820.186
Socioeconomic factorspermanent population (X3)2.5410.394
fixed-asset investment (X4)2.9420.342
secondary industry shares (X5)7.7150.130
tertiary industry shares (X6)4.3280.231
foreign direct investment (X7)2.7280.367
paved road area (X8)2.3110.433
Table 6. Comparison of GTWR, GWR, and OLS fitting effects (n = 27).
ModelsAICc (Akaike Information Criterion Corrected) Adjusted   R 2 RMSE (Cross-Validation)
OLS16.29600.95320.055 ± 0.007
GWR30.06160.94840.059 ± 0.008
GTWR6.07690.96770.040 ± 0.005
Table 7. The change statistics of different land use types under different simulation scenarios in 2035.
Types of LandNatural Development ScenarioEcological Protection ScenarioEconomic Development Scenario
AreaProportionAreaProportionAreaProportion
Cropland11,455.3421.17%11,817.1221.84%10,730.3619.83%
Forest28,874.9753.35%29,738.9954.94%28,851.1553.30%
Grassland1042.041.93%790.881.46%1011.811.87%
Water body3900.987.21%3833.927.08%3968.287.33%
Construction land8840.0416.34%7930.3914.65%9552.3017.65%
Unused land2.690.01%4.750.01%2.160.01%
Disclaimer/Publisher’s Note: The statements, opinions and data contained in all publications are solely those of the individual author(s) and contributor(s) and not of MDPI and/or the editor(s). MDPI and/or the editor(s) disclaim responsibility for any injury to people or property resulting from any ideas, methods, instructions or products referred to in the content.

