Article

Performance Degradation in Monopulse Angle Measurement of Planar Phased-Array Due to Cross-Polarization Component

1
College of Electronic Science and Technology, National University of Defense Technology, Changsha 410073, China
2
National Key Laboratory of Science and Technology on Blind Signal Processing, Chengdu 611731, China
*
Author to whom correspondence should be addressed.
Remote Sens. 2025, 17(14), 2454; https://doi.org/10.3390/rs17142454
Submission received: 20 May 2025 / Revised: 11 July 2025 / Accepted: 14 July 2025 / Published: 15 July 2025
(This article belongs to the Special Issue Recent Advances in SAR: Signal Processing and Target Recognition)

Abstract

Due to the high-precision angle measurement performance, the monopulse technique plays a key role in fields such as remote sensing and space surveillance. The accuracy of monopulse angle measurement depends on the received amplitude and phase information, which is sensitive to the polarization component. Previous research has demonstrated that the performance of monopulse radar equipped with a parabolic antenna suffers from the cross-polarization component. However, it is not clear whether phased arrays (PAs) with higher degrees of freedom will also be affected by the cross-polarization component, and the parameter tolerance for performance degradation remains uncertain. In this paper, we establish a mathematical model of monopulse angle measurement in PA radar, which provides a comprehensive consideration of the cross-polarization component. Then, the received amplitude and phase patterns of PA radar are analyzed, and the theoretical angle errors caused by the cross-polarization jamming are derived. The experiments are conducted based on the measured amplitude-phase patterns of both co-polarization and cross-polarization. Experimental results are consistent with the theoretical analysis: the angle errors caused by cross-polarization jamming can reach half of the beamwidth in both azimuth and elevation dimensions, provided that the power of the cross-polarization and co-polarization components at the receiver is equal.

1. Introduction

The monopulse technique plays a vital role in applications such as remote sensing and space surveillance [1]. Monopulse angle measurement delivers high-precision angular information and ensures stable beam pointing toward targets in ISAR imaging [2,3]. It can also determine the elevation angle in SAR imaging [4] while realizing ground moving target detection [5,6].
The principle of monopulse angle measurement is straightforward: angular information of the target can be derived by comparing amplitude or phase differences between channels. However, this sensitivity to amplitude and phase variations makes the system’s performance vulnerable to environmental interference [7] or deliberate jamming [8]. Thus, modeling and analyzing monopulse angle measurement under non-ideal conditions hold significant research value. Existing models primarily focus on spatial-domain imperfections modeling under the condition of multi-source interference, mainlobe interference, or sidelobe interference. However, these interference sources can be mitigated by phased array (PA) systems with enhanced spatial degrees of freedom (DoF) [9,10,11,12,13], thereby eliminating performance degradation by spatial filtering [14]. In [15,16], Wang modeled and analyzed polarization diversity for dual-base and three-dimensional beamforming based on tensor and co-array representations. The accurate channel parameter estimation can significantly improve signal quality, reduce interference, and optimize performance.
Nevertheless, the polarization characteristics of electromagnetic waves also critically influence the amplitude and phase of received signals. This polarization-dependent property, independent of spatial information, constitutes another key factor affecting monopulse performance. In radar systems, there are four polarization transmit–receive modes: HH, VV, HV, and VH. The co-polarization constitutes the primary modes, such as HH or VV, while the cross-polarization [17,18] refers to the secondary modes, such as HV and VH. As an inherent defect arising from antenna polarization isolation, the cross-polarization component in the echo is undesired, and it is usually ignored in the idealized mathematical model of monopulse technique due to its relatively low power compared to co-polarization. Notably, cross-polarization jamming can utilize the non-ideal polarimetric characteristic to degrade the performance of the monopulse technique, and the deceptive angle information can be covertly introduced by the cross-polarization component.
Regarding the amplitude comparison monopulse [19], ref. [20] found that the angle error may be half of the beamwidth when the cross-polarization component exists, even if the output power ratio of cross-polarization and co-polarization is −5 dB. In [21], Kırdar et al. clarify the relationships among polarization purity, jamming-to-signal ratio (JSR), and the angle error, demonstrating that the requirement of minimum JSR for effective angular jamming is determined by the receiving antenna’s polarization rate. Both the co-polarization and cross-polarization beam patterns have been analyzed in [22]. The authors found that cross-polarization jamming causes significant distortion of the monopulse ratios, but jamming with a low JSR may not induce obvious angle error. This also suggests that combining another jamming technique [23] with cross-polarization jamming will be highly effective even if the power of cross-polarization jamming alone is low in [22]. Regarding phase comparison monopulse, it has been found that the non-ideal phase characteristics of two channels can be used for cross-polarization jamming to distort the consistency of the phase patterns, and ref. [24] reduced the angular performance by 40 % .
However, the objects of study are limited to parabolic reflector antennas or wire-grid antennas in previous research. Current models for monopulse angle measurement that account for cross-polarization effects are incomplete for PA systems, and the corresponding model and comprehensive study require further exploration. In this paper, we investigate the impact of cross-polarization on monopulse angle measurement based on a PA. Its theoretical influence on the monopulse PA radar with amplitude comparison and phase comparison monopulse methods is derived, and the requirements for amplitude-phase control generated by cross-polarization jamming are discussed.
The rest of this paper comprises four sections. In Section 2, the mathematical model of amplitude comparison and phase comparison monopulse technique is established. Furthermore, after taking cross-polarization into consideration, the evaluation criteria of the influence of the cross-polarization component are derived in Section 3. Section 4 exhibits the measured amplitude and phase patterns of both cross-polarization and co-polarization, along with performance curves that demonstrate how angle measurement error varies with phase and JSR. The results validate the effectiveness of the theory. Conclusions are drawn in Section 6.
The main symbols and definitions of the paper are shown in Table 1.

2. Mathematical Model of PA Radar Monopulse 2D-Angle Measurement

Assuming the PA can obtain the sum-difference beam through the digital beamforming (DBF) technique at the subarray level [25]. The two specific angle measurement methods—the amplitude comparison monopulse and the phase comparison monopulse—will be introduced in this section.

2.1. Monopulse Amplitude Comparison

To achieve monopulse 2D angle measurements, the planar array can be divided into four subarrays simultaneously. The structure and detection geometry of the planar PA are depicted in Figure 1.
The number of array elements is 2 M x × 2 N y , where 2 M x and 2 N y are the number of rows and columns, respectively. In Figure 1, azimuth angle φ is defined as the angle between the projection of the direction vector (from the origin to the target) onto the XOY plane and the positive X-axis. Elevation angle θ is defined as the angle between the direction vector and the positive Z-axis. Assuming the coordinate origin is the reference point, the distance between adjacent elements along the X-axis is d x , and along the Y-axis is d y . Then, the position vector of the ( m , n ) element is represented as
r m n = ( 2 m + 1 ) d x 2 x ^ + ( 2 n + 1 ) d y 2 y ^ ,
where m M x , M x 1 and n N y , N y 1 . represents the vector, and ^ denotes the unit vector.
The unit vector r ^ along the direction of the target can be defined as
r ^ = sin θ cos φ x ^ + sin θ sin φ y ^ + cos θ z ^ .
The vector r 0 in the direction θ 0 , φ 0 of the beam can be described as
r 0 = sin θ 0 cos φ 0 x ^ + sin θ 0 sin φ 0 y ^ + cos θ 0 z ^ .
Let u = sin θ cos φ and v = sin θ sin φ , u 0 = sin θ 0 cos φ 0 and v 0 = sin θ 0 sin φ 0 . The beam patterns of subarrays are denoted as F 1 ( u , v ) , F 2 ( u , v ) , F 3 ( u , v ) and F 4 ( u , v ) , respectively. In the case of beam scanning, when the beam direction is r ^ 0 , the directional function of ( m , n ) is
F m n r ^ , r 0 = exp j k r m n · r ^ r 0 · r ^ ,
where k = 2 π / λ .
By substituting Formulas (1)–(3) into (4), we can obtain
F 1 ( u , v ) = m = 1 M x n = 1 N y exp j k ( m 1 ) d x ( u u 0 ) + ( n 1 ) d y ( v v 0 ) F 2 ( u , v ) = F 1 ( u , v ) exp j k M x u u 0 F 3 ( u , v ) = F 1 ( u , v ) exp j k M x u u 0 + N y v v 0 F 4 ( u , v ) = F 1 ( u , v ) exp j k N y v v 0 .
Thus, four sub-beams are formed, each with the same pointing direction as the array. Summing them results in the sum beam, the azimuth difference beam, and the elevation difference beam, which are denoted as F Σ ( u , v ) , F u ( u , v ) , and F v ( u , v ) respectively. The “sum-difference(u)-difference(v)” pattern function can be expressed as
F Σ ( u , v ) = F 1 ( u , v ) + F 2 ( u , v ) + F 3 ( u , v ) + F 4 ( u , v ) F u ( u , v ) = F 1 ( u , v ) + F 2 ( u , v ) F 3 ( u , v ) F 4 ( u , v ) F v ( u , v ) = F 1 ( u , v ) F 2 ( u , v ) + F 3 ( u , v ) F 4 ( u , v ) .
The azimuth and elevation angles can be obtained by the sum-difference monopulse ratio; the monopulse ratio is
MRC = F u u , v k m F Σ u , v = F 1 u , v + F 2 u , v F 3 u , v F 4 u , v k m F 1 u , v + F 2 u , v + F 3 u , v + F 4 u , v = 1 + e j k M x u u 0 e j k M x u u 0 + N y v v 0 e j k N y v v 0 k m 1 + e j k M x u u 0 + e j k M x u u 0 + N y v v 0 + e j k N y v v 0 ,
where k m symbolizes the slope of the angle identification curve. MRC denotes monopulse ratio. The monopulse ratio is derived by taking the ratio of the sum and difference beam weights. The least squares method (LSM) regression is applied to fit the monopulse ratio data, calculating the discrimination curve slope parameter k m [26].

2.2. Monopulse Phase Comparison

Angle measurement method using the half-array technique utilizes the collective symmetry of the array to construct the sum and difference beam weight vectors. The beam weight can be expressed as the product of the steering vector for beam pointing ( θ 0 , φ 0 ) . Then, the subarray weight vectors can be written as [26,27]
w 1 Σ = [ 1 , 1 , , 1 ] 1 × M x a ( θ 0 , φ 0 ) [ 1 , 1 , , 1 ] 1 × N y T b ( θ 0 , φ 0 ) w 2 Σ = w 1 Σ exp j k M x sin θ 0 cos φ 0 w 3 Σ = w 1 Σ exp j k M x sin θ 0 cos φ 0 + N y sin θ 0 sin φ 0 w 4 Σ = w 1 Σ exp j k N y sin θ 0 sin φ 0
where
a ( θ 0 , φ 0 ) = 1 , e j k d x u 0 , · · · , e j k ( M x 1 ) d x u 0 b ( θ 0 , φ 0 ) = 1 , e j k d y v 0 , · · · , e j k ( N y 1 ) d y v 0 T ,
where ⊙ is the Hadamard product, and ⊗ denotes the Kronecker product.
Based on the symmetry of the uniform planar array, the weight vectors of difference beams [26,27] can be expressed as
w 1 Δ = [ 1 , 1 , , 1 ] 1 × M x a ( θ 0 , φ 0 ) [ 1 , 1 , , 1 ] 1 × N y T b ( θ 0 , φ 0 ) w 2 Δ = [ 1 , 1 , , 1 ] 1 × M x a ( θ 0 , φ 0 ) [ 1 , 1 , , 1 ] 1 × N y T b ( θ 0 , φ 0 ) · exp j k M x sin θ 0 cos φ 0 w 3 Δ = w 1 Δ exp j k M x sin θ 0 cos φ 0 + N y sin θ 0 sin φ 0 w 4 Δ = [ 1 , 1 , , 1 ] 1 × M x a ( θ 0 , φ 0 ) [ 1 , 1 , , 1 ] 1 × N y T b ( θ 0 , φ 0 ) · exp j k N y sin θ 0 sin φ 0 .
Assuming the desired direction of the target signal is θ , then the output of the sum beam and the difference beam are as follows:
Σ u , v 1 = m = 1 M x n = 1 N y e j k ( m 1 ) d x ( u u 0 ) + ( n 1 ) d y ( v v 0 ) Σ u , v 2 = m = M x 2 M x n = 1 N y e j k ( m 1 ) d x ( u u 0 ) + ( n 1 ) d y ( v v 0 ) Σ u , v 3 = m = M x 2 M x n = N y 2 N y e j k ( m 1 ) d x ( u u 0 ) + ( n 1 ) d y ( v v 0 ) Σ u , v 4 = m = 1 M x n = N y 2 N y e j k ( m 1 ) d x ( u u 0 ) + ( n 1 ) d y ( v v 0 )
Δ u , v 1 = m = 1 M x n = 1 N y e j k ( m 1 ) d x ( u u 0 ) + ( n 1 ) d y ( v v 0 ) Δ u , v 2 = m = M x 2 M x n = 1 N y e j k ( m 1 ) d x ( u u 0 ) e j k ( n 1 ) d y ( v v 0 ) Δ u , v 3 = m = M x 2 M x n = N y 2 N y e e j k ( m 1 ) d x ( u u 0 ) + ( n 1 ) d y ( v v 0 ) Δ u , v 4 = m = 1 M x n = N y 2 N y e j k ( m 1 ) d x ( u u 0 ) + e j k ( n 1 ) d y ( v v 0 ) .
Thus,
Σ ( u , v ) = Σ ( u , v ) 1 + Σ ( u , v ) 2 + Σ ( u , v ) 3 + Σ ( u , v ) 4 Δ ( u , v ) = Δ ( u , v ) 1 + Δ ( u , v ) 2 + Δ ( u , v ) 3 + Δ ( u , v ) 4 .
Using Euler’s formula, the sum-difference beam ratio for the azimuth and elevation angles can be obtained as follows:
Δ ( u ) Σ ( u ) = Δ θ , φ s Σ θ , φ s = exp j k M x d x u / 2 exp j k M x d x u / 2 exp j k M x d x u / 2 + exp j k M x d x u / 2 = j sin ( π M x d x u / λ ) cos ( π M x d x u / λ ) = j tan k M x d x u 2 Δ ( v ) Σ ( v ) = Δ θ s , φ Σ θ s , φ = exp j k N y d y v / 2 exp j k N y d y v / 2 exp j k N y d y v / 2 + exp j k N y d y v / 2 = j sin ( π N y d y v / λ ) cos ( π N y d y v / λ ) = j tan k N y d y v 2 ,
where the notation θ s indicates that the azimuth angle is held at a fixed value when solving for the elevation angle; similarly, φ s represents a fixed value for the elevation angle when solving for the azimuth angle.
The weighted method refers to the process of designing a sum-difference beam that meets a given sidelobe suppression ratio by performing windowing on the steering vectors a ( θ 0 , φ 0 ) and b ( θ 0 , φ 0 ) at the beam pointing direction. Similar to the half-array method, this will not be elaborated upon here.
In fact, for the aforementioned phase comparison angle measurement method, it is not only about considering the phase difference as in the traditional interferometric angle measurement method, but also allows for the simultaneous use of amplitude and phase information for monopulse angle measurement through subarray-level beamforming. However, the conventional model does not account for the presence of cross-polarization. Therefore, the next section will analyze the PA monopulse angle measurement model considering cross-polarization.

3. Monopulse Angle Measurement with Cross-Polarization

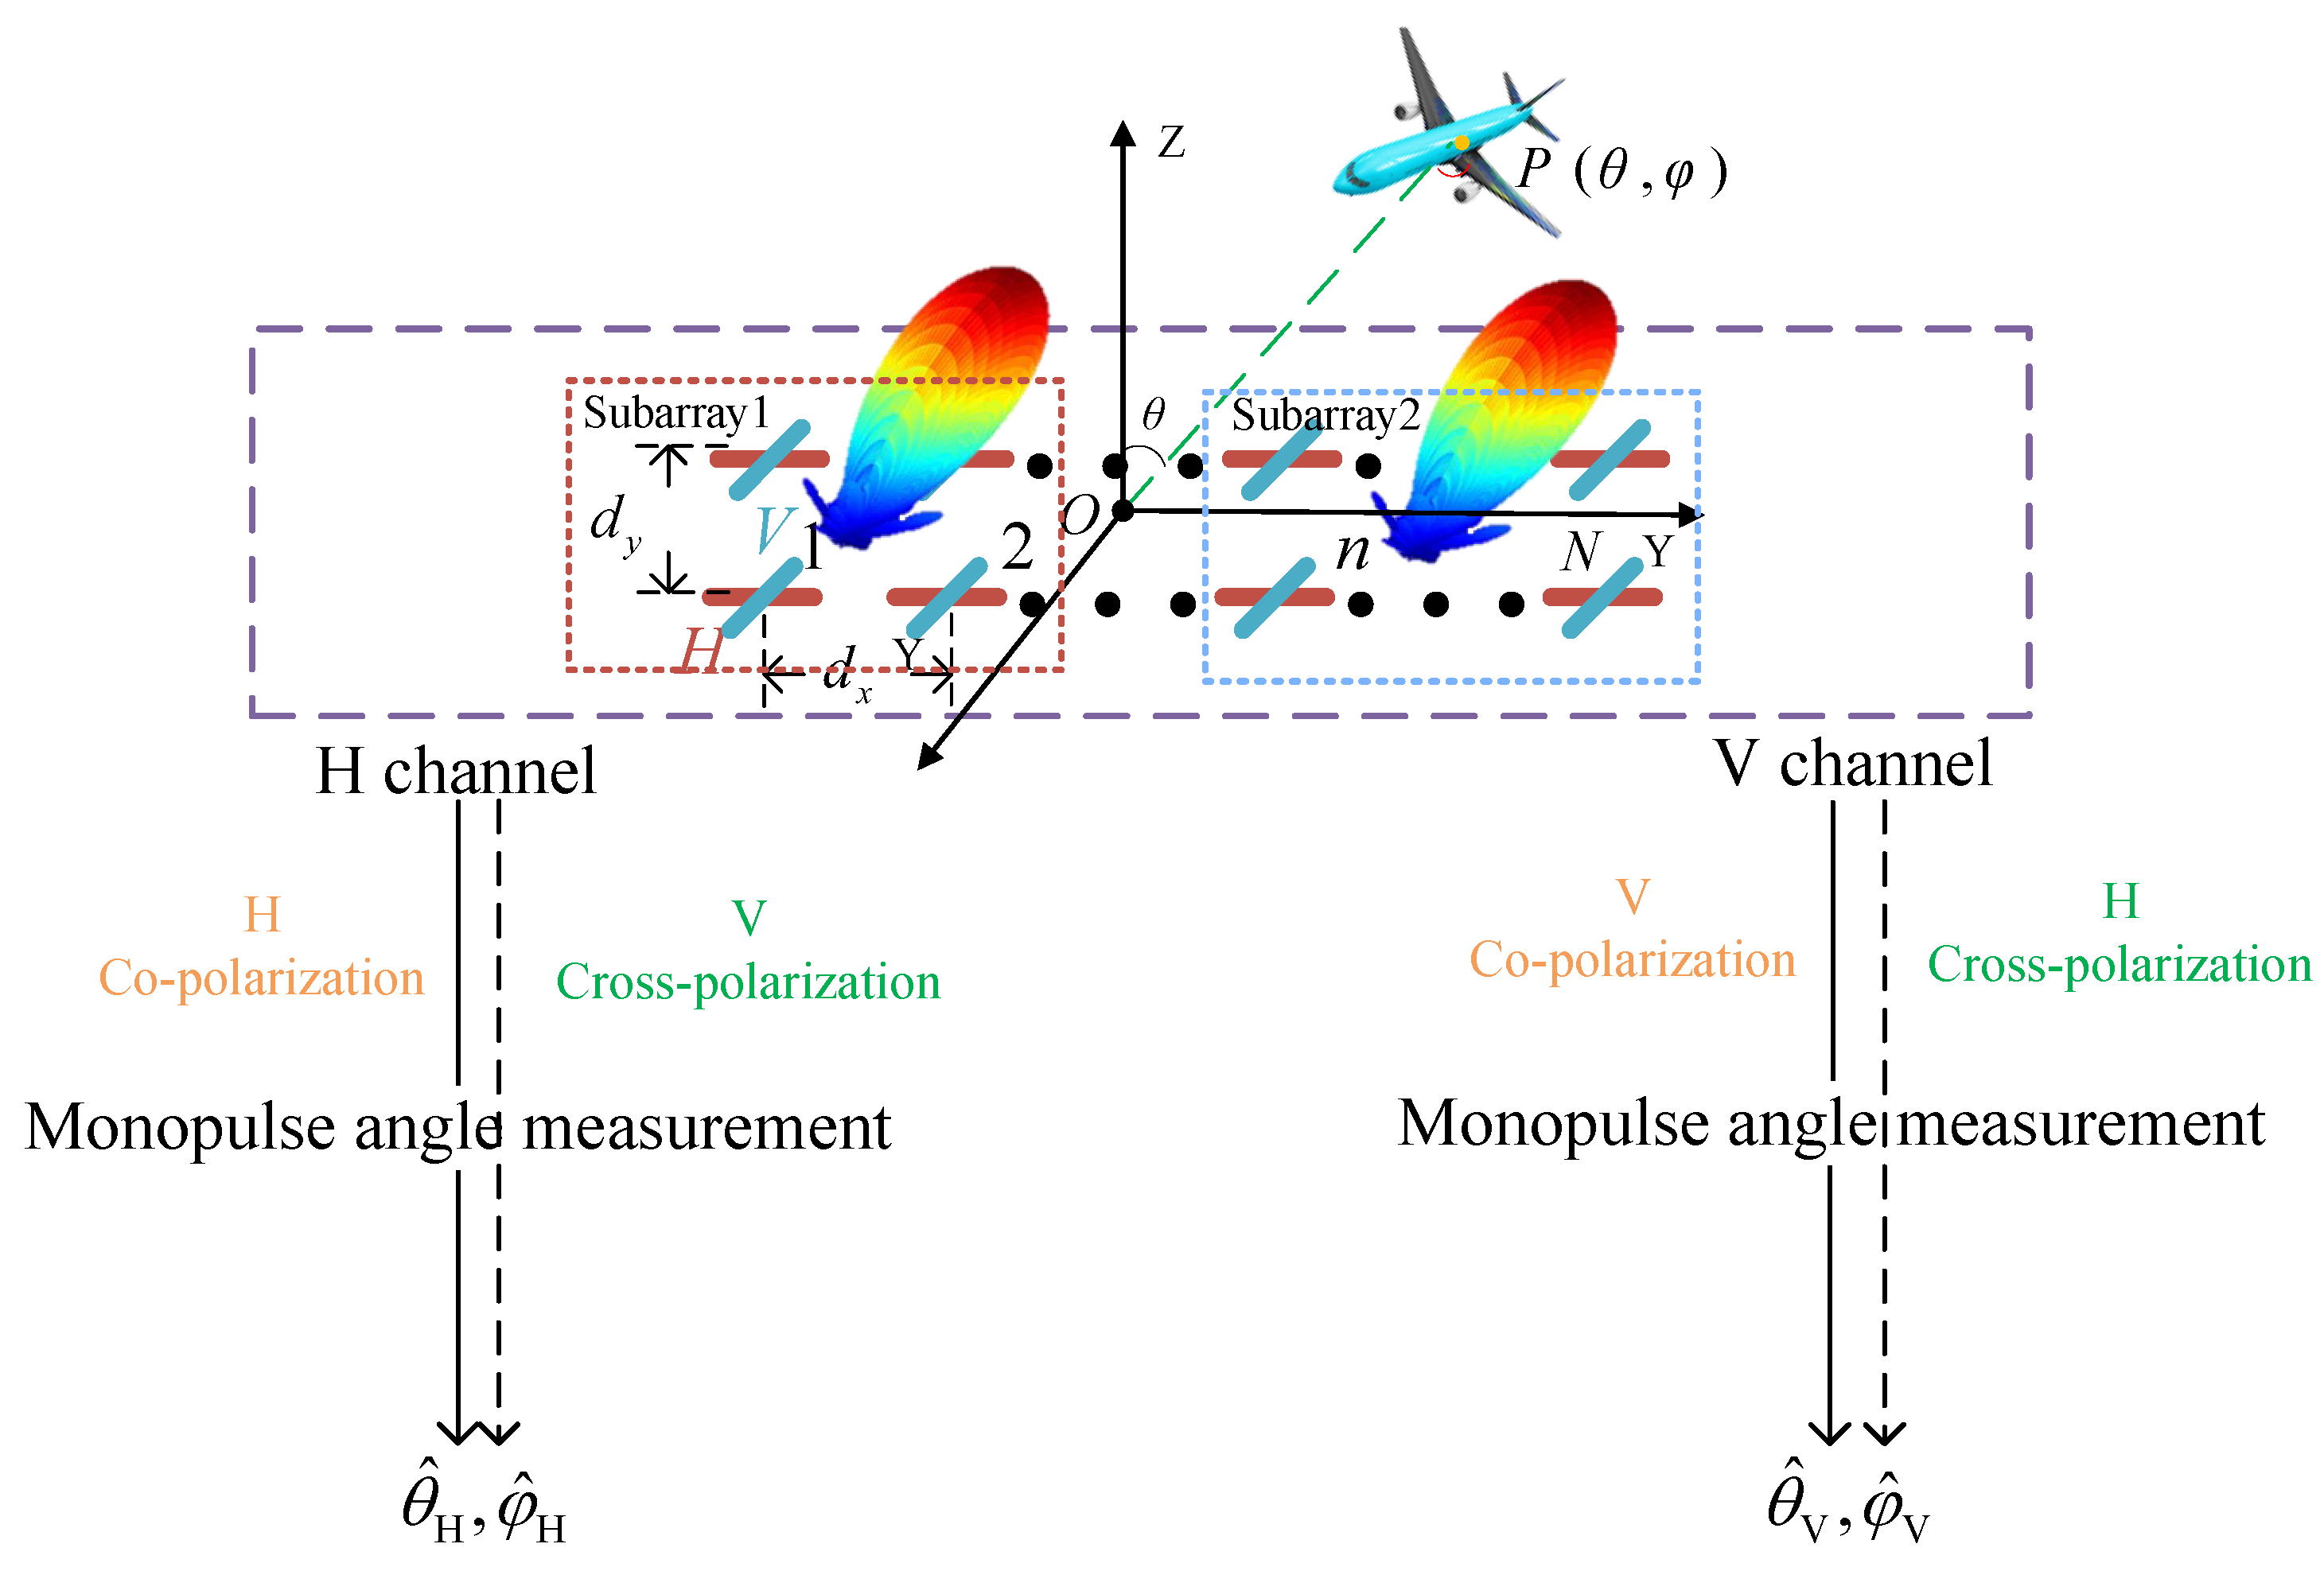
Divide the PA into several subarrays, the subbeams formed by the subarrays pointing in the same direction. The process of solving for azimuth and elevation angles is similar. In this section, with fixed azimuth φ = 90 , the monopulse measurement model for elevation angle θ is provided under the existence of the cross-polarization component. Referring to Figure 2, for the elevation measurement, subscript 1 represents the sum beam of A and B, and subscript 2 represents the sum beam of C and D in this paper.
The reception efficiency of the antenna varies with polarization. For general reception scenarios, we employ the polarization match factor to characterize this effect, defined as the ratio of actual received power to the maximum possible received power. The open-circuit voltage equation is given by
V = h T E = h H E H + h V E V ,
where h = h H h V = G H θ P H θ G V θ P V θ represents the two orthogonal polarization components of the receiving antenna, E = E H E V is the incident wave field vector. The maximum received power W max can thus be expressed as
W max = E H h H + E V h V 2 = E H 2 h H 2 + E V 2 h V 2 + 2 E V h H E H h V .
When the ratio of the antenna’s orthogonal components equals the corresponding ratio of the incident wave components, i.e., h H h V = E H E V , the received power is maximized achieving optimal reception efficiency. Substituting h H h V = E H E V into (16)
W max = E H 2 h H 2 + E V 2 h V 2 + 2 E V h H E H h V = E H 2 + E V 2 h H 2 + h V 2 = h 2 E 2 .
The polarization match factor is
ρ = V V * h 2 E 2 = h T E 2 h 2 E 2 .
This study specifically considers the case when ρ = 1 , corresponding to the optimal reception condition. Under this scenario, both the co-polarization component in the horizontal-polarization (H-polarization) signal and the cross-polarization component in the vertical-polarization (V-polarization) signal can be received by the horizontal received channel.
The polarization distortion of the echo comes from the cross-polarization of the receiving antenna and the cross-polarization scattering of the target. For simplicity, our analysis focuses on the receiving antenna; thus, the received signals of the two subarrays can be expressed as
s 1 = G mH 1 ( θ ) P mH 1 ( θ ) G cH 1 ( θ ) P cH 1 ( θ ) G cV 1 ( θ ) P cV 1 ( θ ) G mV 1 ( θ ) P mV 1 ( θ ) E + n 1 s 2 = G mH 2 ( θ ) P mH 2 ( θ ) G cH 2 ( θ ) P cH 2 ( θ ) G cV 2 ( θ ) P cV 2 ( θ ) G mV 2 ( θ ) P mV 2 ( θ ) E e j Δ ϕ + n 2 ,
where E = [ E H , E V ] T , Δ ϕ = 2 π D s u b sin θ λ represents the phase shift of the received signal of Subarray 2 relative to Subarray 1, where D s u b is the interval between the two subarrays. n 1 = [ n H 1 , n V 1 ] T , n 2 = [ n H 2 , n V 2 ] T , and n H 1 , n V 1 , n H 1 , n V 2 indicates the noise of channel H and channel V receiving beams 1 and 2, respectively.
Assuming that the co-polarization gain pattern and the phase pattern of each subarray [28] are consistent,
G mH 1 ( θ ) = G mH 2 ( θ ) = G mV 1 ( θ ) = G mV 2 ( θ ) = G m ( θ ) P mH 1 ( θ ) = P mH 2 ( θ ) = P mV 1 ( θ ) = P mV 2 ( θ ) = P m ( θ ) .
Let F ( · ) = G ( · ) P ( · ) ; the received signal can also be expressed as
s H 1 = F m ( θ ) E H 0 + E Hj + G cH 1 ( θ ) P cH 1 ( θ ) E V 0 + E Vj + n H 1 s V 1 = F m ( θ ) E V 0 + E Vj + G cV 1 ( θ ) P cV 1 ( θ ) E H 0 + E Hj + n V 1 s H 2 = F m ( θ ) E H 0 + E Hj e j Δ ϕ + G cH 2 ( θ ) P cH 2 ( θ ) E V 0 + E Vj e j Δ ϕ + n H 2 s V 2 = F m ( θ ) E V 0 + E Vj e j Δ ϕ + G cV 2 ( θ ) P cV 2 ( θ ) E H 0 + E Hj e j Δ ϕ + n V 2 .

3.1. Case 1: Identical Cross-Polarization Patterns

The cross-polarization gain pattern and phase pattern for both the H channel and V channel of each subarray satisfy
G cH 1 ( θ ) = G cH 2 ( θ ) = G cV 1 ( θ ) = G cV 2 ( θ ) = G c ( θ ) P cH 1 ( θ ) = P cH 2 ( θ ) = P cV 1 ( θ ) = P cV 2 ( θ ) = P c ( θ ) .
Therefore, (21) can be simplified as
s H 1 = F m ( θ ) E H 0 + E Hj + F c ( θ ) E V 0 + E Vj + n H 1 s V 1 = F m ( θ ) E V 0 + E Vj + F c ( θ ) E H 0 + E Hj + n V 1 s H 2 = F m ( θ ) E H 0 + E Hj e j Δ ϕ + F c ( θ ) E V 0 + E Vj e j Δ ϕ + n H 2 s V 2 = F m ( θ ) E V 0 + E Vj e j Δ ϕ + F c ( θ ) E H 0 + E Hj e j Δ ϕ + n V 2 .
The output signal of the sum and difference channels is depicted as
Σ H = s H 1 + s H 2 = F m θ E H 0 + E Hj ( 1 + e j Δ ϕ ) + F c θ E V 0 + E Vj ( 1 + e j Δ ϕ ) + n H 1 + n H 2 Σ V = s V 1 + s V 2 = F m θ E V 0 + E Vj ( 1 + e j Δ ϕ ) + F c θ E H 0 + E Hj ( 1 + e j Δ ϕ ) + n V 1 + n V 2 Δ H = s H 1 s H 2 = F m θ E H 0 + E Hj ( 1 e j Δ ϕ ) + F c θ E V 0 + E Vj ( 1 e j Δ ϕ ) + n H 1 n H 2 Δ V = s V 1 s V 2 = F m θ E V 0 + E Vj ( 1 e j Δ ϕ ) + F c θ E H 0 + E Hj ( 1 e j Δ ϕ ) + n V 1 n V 2 .
Thus, the output monopulse ratios can be expressed as
Δ H Σ H = E H 0 + E Hj + F ( θ ) E V 0 + E Vj ( 1 e j Δ ϕ ) + n H 1 E H 0 + E Hj + F ( θ ) E V 0 + E Vj ( 1 + e j Δ ϕ ) + n H 2 Δ V Σ V = E V 0 + E Vj + F ( θ ) E H 0 + E Hj ( 1 e j Δ ϕ ) + n V 1 E V 0 + E Vj + F ( θ ) E H 0 + E Hj ( 1 + e j Δ ϕ ) + n V 2 ,
where F ( θ ) = G c ( θ ) P c ( θ ) G m ( θ ) P m ( θ ) = F c ( θ ) F m ( θ ) , and
n H 1 = n H 1 n H 2 F m ( θ ) n H 2 = n H 1 + n H 2 F m ( θ ) n V 1 = n V 1 n V 2 F m ( θ ) n V 2 = n V 1 + n V 2 F m ( θ ) .
From (25), it can be observed that when the phase of the jamming component is consistent with the signal component, it will not only not impact the angle measurement but also enhance the signal-to-noise ratio (SNR) through coherent accumulation. In other words, if the cross-polarization pattern and the co-polarization patterns of the subarrays exhibit good amplitude and phase consistency, the cross-polarization jamming becomes ineffective.
Fortunately, the phase information of the signal and jamming can be utilized to enhance the influence of jamming on the measurement accuracy, which is similar to the principle of cross-eye jamming [29,30]. Assuming the H channel receives the co-polarization component, and the cross-polarization channel is the V channel. A new variable Δ ϕ VH = Angle [ E Vj / E H 0 ] is introduced, where Angle [ · ] symbolizes the phase-taking operation. Utilizing coherent inverse phase accumulation, it is possible to achieve either E H 0 + E Hj + F ( θ ) E V 0 + E Vj = 0 or E V 0 + E Vj + F ( θ ) E H 0 + E Hj = 0 , which results in a reduction of the SNR of the receiving channels. Nevertheless, this method is limited to affecting only one channel at a time. For polarization fusion angle measurement techniques, the jamming effect is consequently suboptimal. To effectively reduce the SNR in both channels simultaneously, it is necessary to obtain the phases of E H 0 and E V 0 such that E H 0 + E Hj = 0 or E V 0 + E Vj = 0 .
In summary, the impact of cross-polarization on PA monopulse angle measurement primarily hinges on the consistency of the cross-polarization gain and phase patterns of the two subarrays. When there is ideal amplitude and phase consistency between subarrays, cross-polarization only impairs the measurement performance by diminishing the SNR through opposite-phase stacking, and the jamming efficacy is constrained.

3.2. Case 2: Different Cross-Polarization Patterns

Consider a more common scenario in which the patterns of each subarray are inconsistent. The output signal of the sum and difference channels can be expressed as
Σ H = s H 1 + s H 2 = F m θ E H 0 + E Hj ( 1 + e j Δ ϕ ) + F cH 1 θ E V 0 + E Vj + F cH 2 θ E V 0 + E Vj e j Δ ϕ + n H 1 + n H 2 Σ V = s V 1 + s V 2 = F m θ E V 0 + E Vj ( 1 + e j Δ ϕ ) + F cV 1 θ E H 0 + E Hj + F cV 2 θ E H 0 + E Hj e j Δ ϕ + n V 1 + n V 2 Δ H = s H 1 s H 2 = F m θ E H 0 + E Hj ( 1 e j Δ ϕ ) + F cH 1 θ E V 0 + E Vj F cH 2 θ E V 0 + E Vj e j Δ ϕ + n H 1 n H 2 Δ V = s V 1 s V 2 = F m θ E V 0 + E Vj ( 1 e j Δ ϕ ) + F cV 1 θ E H 0 + E Hj F cV 2 θ E H 0 + E Hj e j Δ ϕ + n V 1 n V 2 .
Thus, the monopulse ratio can be rewritten as
Δ H Σ H = ( 1 e j Δ ϕ ) + α H ( 1 β H e j Δ ϕ ) + n H 1 n H 2 ( 1 + e j Δ ϕ ) + α H ( 1 + β H e j Δ ϕ ) + n H 1 + n H 2 Δ V Σ V = ( 1 e j Δ ϕ ) + α V ( 1 β V e j Δ ϕ ) + n V 1 n V 2 ( 1 + e j Δ ϕ ) + α V ( 1 + β V e j Δ ϕ ) + n V 1 + n V 2 ,
where
α H = G cH 1 ( θ ) P cH 1 ( θ ) E V 0 + E Vj G m ( θ ) P m ( θ ) E H 0 + E Hj α V = G cV 1 ( θ ) P cV 1 ( θ ) E H 0 + E Hj G m ( θ ) P m ( θ ) E V 0 + E Vj β H = G cH 2 ( θ ) P cH 2 ( θ ) G cH 1 ( θ ) P cH 1 ( θ ) β V = G cV 2 ( θ ) P cV 2 ( θ ) G cV 1 ( θ ) P cV 1 ( θ ) .
Consider an extreme case α H , α V 1 , such that the cross-polarization patterns of the two subarrays differ only in phase. The phase differences of the horizontal and vertical channels are denoted by η H and η V , respectively, which can be expressed as β H = G cH 2 ( θ ) P cH 2 ( θ ) G cH 1 ( θ ) P cH 1 ( θ ) = e j η H and β V = G cV 2 ( θ ) P cV 2 ( θ ) G cV 1 ( θ ) P cV 1 ( θ ) = e j η V . Thus, the monopulse ratio can be expressed as
Δ H Σ H = α H ( 1 β H e j Δ ϕ ) + n H 1 n H 2 α H ( 1 + β H e j Δ ϕ ) + n H 1 + n H 2 = e j Δ ϕ + η H 2 ( e j Δ ϕ + η H 2 e j Δ ϕ + η H 2 ) e j Δ ϕ + η H 2 ( e j Δ ϕ + η H 2 + e j Δ ϕ + η H 2 ) = j tan Δ ϕ + η H 2 Δ V Σ V = α V ( 1 β V e j Δ ϕ ) + n V 1 n V 2 α V ( 1 + β V e j Δ ϕ ) + n V 1 + n V 2 = e j Δ ϕ + η V 2 ( e j Δ ϕ + η V 2 e j Δ ϕ + η V 2 ) e j Δ ϕ + η V 2 ( e j Δ ϕ + η V 2 + e j Δ ϕ + η V 2 ) = j tan Δ ϕ + η V 2 .
The estimated phase Δ ϕ ^ H 2 Im Δ H Σ H Δ ϕ H + η H . So, the estimated angle value is
sin θ ^ H = λ 2 π D s u b Δ ϕ ^ H = λ 2 π D s u b Δ ϕ H + λ 2 π D s u b η H = sin θ H + λ 2 π D s u b η H sin θ ^ V = λ 2 π D s u b Δ ϕ ^ V = λ 2 π D s u b Δ ϕ V + λ 2 π D s u b η V = sin θ V + λ 2 π D s u b η V .
Similarly, the estimated values for the elevation angle φ ^ H and φ ^ V can be obtained.

4. Experiments and Simulations

To assess the accuracy and precision of the monopulse angle measurement comprehensively, the root mean square error (RMSE) of the angle estimation is used as a measure, denoted as
RMSE = 1 L l = 1 L E θ θ ^ l 2 ,
where L means Monte Carlo iterations.

4.1. The Amplitude and Phase Patterns of Measurement

The phase and amplitude radiation patterns are derived from the actual measurements of an antenna array in a microwave anechoic chamber. The array is with 20 λ subarray interval in the lateral (azimuth) direction and 15 λ subarray interval in the longitudinal (elevation) direction. The center frequency of the transmitted signal is 10 GHz with a bandwidth of 80 MHz. Both azimuth and elevation angles were scanned with 0 . 02 step. The measured phase and amplitude patterns are shown in Figure 3 and Figure 4. In subsequent experiments, the H channel denotes the co-polarization channel, so the secondary polarization (VH) is defined as cross-polarization. The gain of the cross-polarization pattern is about 18 dB lower than that of the co-polarization pattern, and the phase difference is around 30 between the two channels in the mainlobe region.

4.2. Performance of Angle Estimations Under Case 1

In this section and subsequent experiments, the mainlobe of the beam pattern points to ( 0 , 0 ) , and the target is located at ( 0 . 5 , 0 . 5 ) . To satisfy the condition of Case 1, assuming the cross-polarization (VH) beams of two subarrays are both the VH-beam1 in Figure 3a for azimuth, and VH-beam1 in Figure 4a for elevation.
To verify the theoretical results in Section 3.1, 1000 Monte Carlo trials [31] have been conducted to illustrate the impact of cross-polarization on the angle measurement results for each experiment. The JSR of the signal is altered by 5, 10 and 15 dB. The curves show how the RMSEs of the azimuth angle measurement vary with SNR under different Δ ϕ VH ; the corresponding results of azimuth measurement are depicted in Figure 5.
Then, the phase difference between the cross-polarization channel and the co-polarization channel is changed, and curves are plotted to show how the RMSEs of azimuth angle measurement vary with JSR under different SNR conditions in Figure 6. To better illustrate the details, the portion of the figure above is magnified and shown in Figure 7. Similar to the experiments of azimuth, Figure 8, Figure 9 and Figure 10 are presented to exhibit the measurement results of elevation angle.
As can be observed in Figure 6, Figure 7, Figure 8, Figure 9 and Figure 10, when the phase difference Δ ϕ VH between the jamming and the signal is 150 , the cross-polarization effect is best around JSR = 18 dB. This is because the gain of cross-polarization beam is about 18 dB lower than that of the co-polarization, and the phase difference between co-polarization and cross-polarization phase pattern is 30 as shown in Figure 3 and Figure 4, which results in E H 0 + F θ E Vj 0 . The relationship between the elevation angle measurement performance and the phase pattern and phase difference of the jamming signal is consistent with the experimental conclusions obtained from the azimuth angle measurement. Under the same conditions, the elevation angle RMSE is slightly higher than the azimuth angle RMSE because the sub-beam width in the elevation dimension ( 2 . 3 ) is higher than that in the azimuth dimension ( 1 . 9 ) .
This phenomenon has been revealed by (25) in Section 3.1. With the ideal polarization consistency of the receiver, the efficacy of the cross-polarization is influenced concurrently by SNR, JSR, and the phase difference of the cross-polarization component. It can be found in higher SNR scenarios, the cross-polarization effect on the angle measurement is suboptimal. Notably, a higher JSR is not invariably advantageous; the optimal JSR is one that equalizes the co-polarization and cross-polarization signals at the receiver, thereby achieving the worst angular measurement performance.
This paper presents the simulation results and analysis of the angle measurement under the condition of H-polarization as co-polarization. In fact, consistent conclusions can be drawn under an arbitrary polarization state.

4.3. Performance of Angle Estimations Under Case 2

Under Case 2 in Section 3.2, the experiments are conducted based on the measurement patterns in Figure 3 and Figure 4. For simplicity, H-polarization is set as the co-polarization.
This part repeats the experimental content of Section 4.2. Using the azimuth angle measurement as an example, the process is as follows: First, RMSE curves are plotted for different JSR values, illustrating how the RMSE of the azimuth angle measurement varies with SNR under different phase differences. Second, the phase difference between the cross-polarization and co-polarization channels is altered, and curves are plotted to show how the RMSE of the azimuth angle measurement varies with JSR under different SNR conditions, as shown in Figure 11 and Figure 12. Similarly, Figure 13 and Figure 14 are provided for the measurement of the elevation angle.
However, the results differ significantly from those in Section 4.2. It can be observed that neither the SNR nor the phase difference Δ ϕ VH has a substantial impact on the RMSE values. The most significant factor affecting the angle measurement performance is the JSR. In fact, due to the similar amplitude patterns of the two sub-beams of co-polarization, the worst RMSE value aligns with the theoretical value of the jamming angle from (31), at which point the cross-polarization component acts as a robust deception.
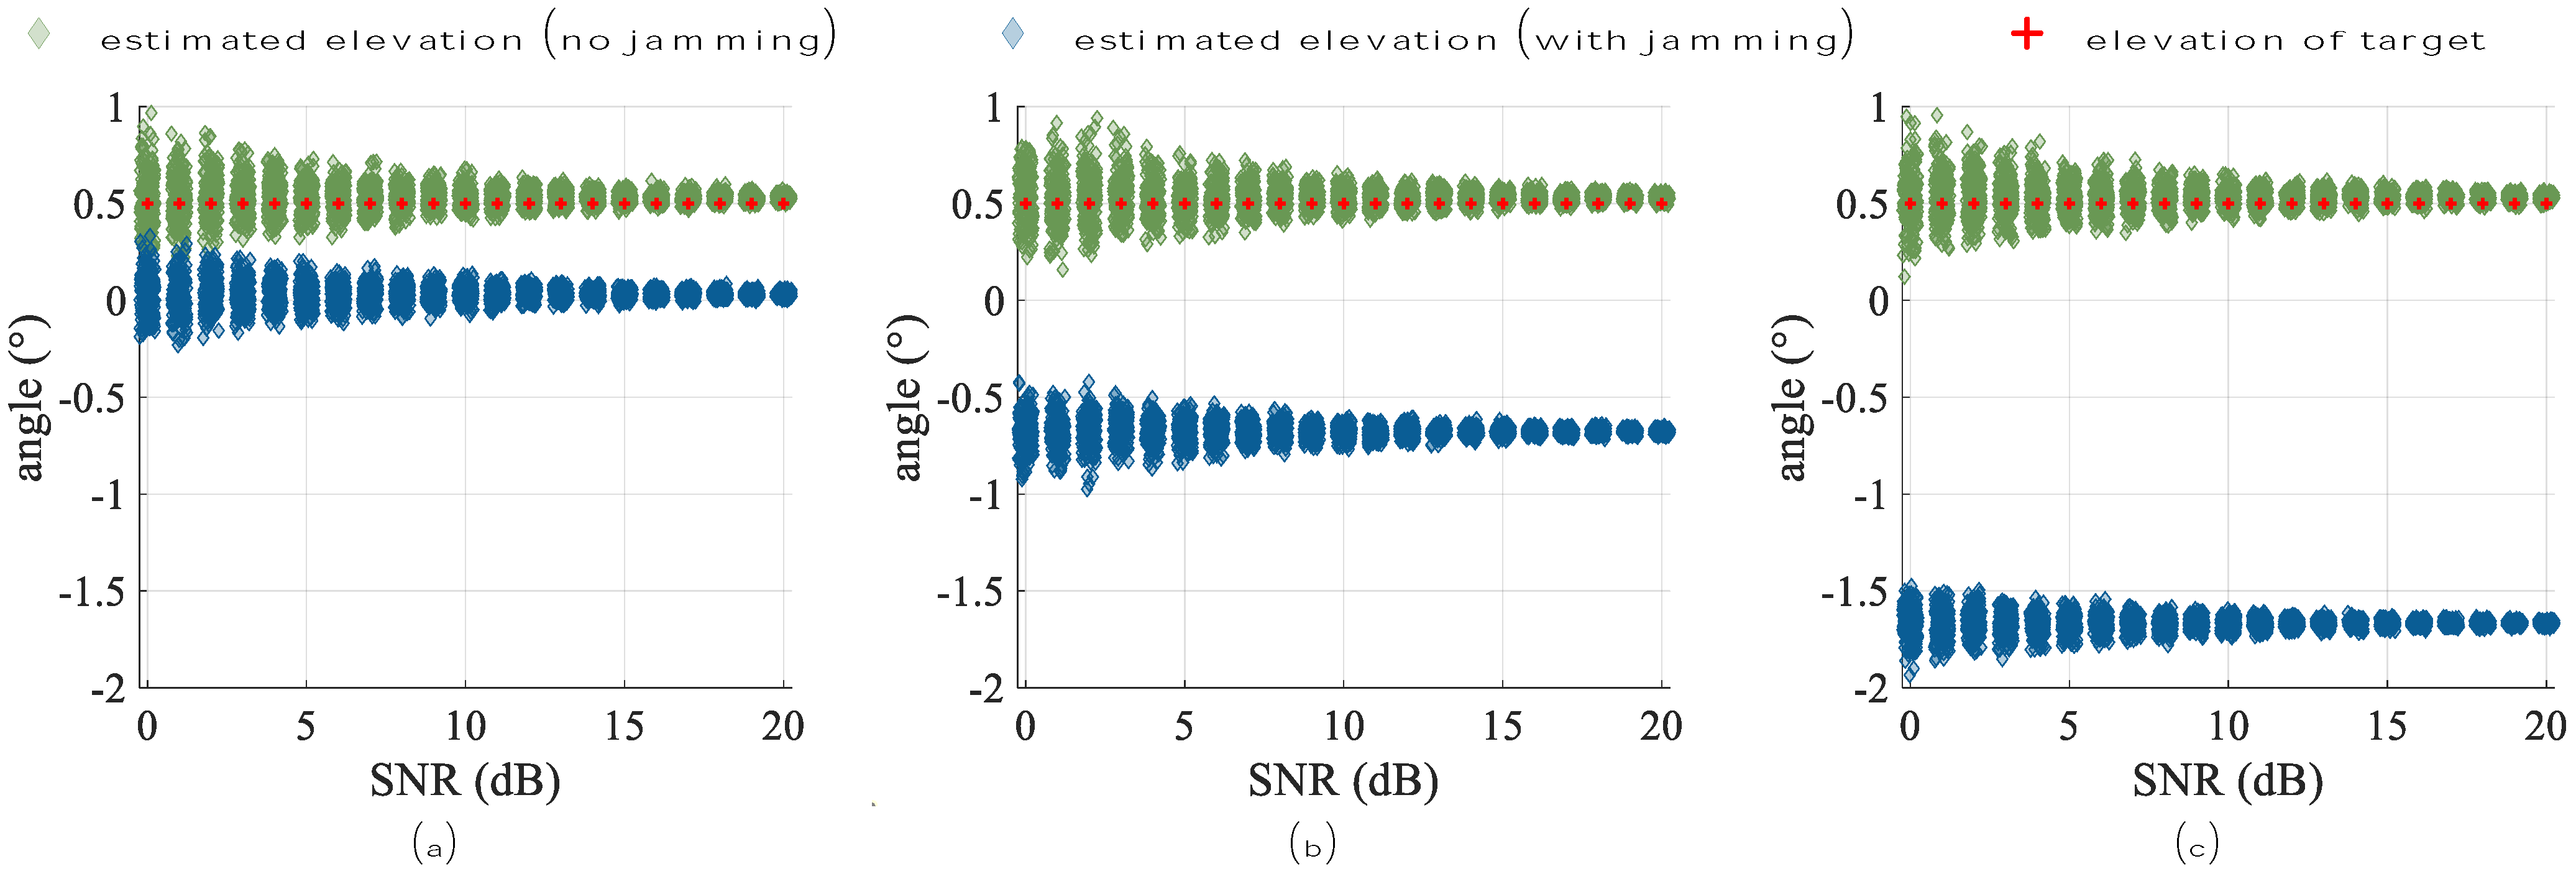
The distribution of both azimuth and elevation angle measurement results is exhibited in Figure 15 and Figure 16, respectively. Elevated SNR levels induce asymptotic convergence in the angle estimation distribution, while the estimates statistically approach the true angle in jamming-free scenarios, the presence of cross-polarization jamming forces convergence toward another angle (deceptive angle). At a JSR of 20 dB, where the cross-polarization component power equals the co-polarization component in the received signal, the azimuth and elevation deceptive angles exhibit offsets of 0 . 8 and 1 . 3 , respectively, as shown in Figure 15b and Figure 16b. These offsets exceed half the beam width in their respective dimensions, indicating the vulnerability in monopulse PA radar systems under the high-power cross-polarization component.
In practical applications, the PA antennas are similar to the non-ideal condition in Case 2, which means the cross-polarization component will induce a relative fixed offset on monopulse angle measurement under higher JSR, and the decoy effect depends on the phase pattern difference between the two subarrays.

5. Discussion

In this paper, we demonstrate through theoretical analysis and experimental validation that the cross-polarization component leads to the degradation of the performance of the planar PA monopulse angle measurement. These findings provide critical theoretical references for remote sensing and space surveillance applications. From the engineering implementation point of view, the development of countermeasures and mitigation strategies regarding polarization interference in monopulse goniometry for remote sensing tracking applications is a crucial step that will effectively enhance the practical application value of our work. A polarization-fusion monopulse method is under active research, but further validation is required for robust deployment.

6. Conclusions

In this paper, a monopulse angle measurement model for planar PA radar is established by incorporating cross-polarization components, which addresses the limitations of conventional models that neglect cross-polarization effects on PA. The proposed framework analytically quantifies the performance degradation in angle estimation accuracy induced by cross-polarization jamming under imperfect antenna polarization isolation. Under the assumption of the identical cross-polarization pattern and different cross-polarization patterns, the quantitative analyses of the decoying effect due to cross-polarization jamming have been derived, respectively. The experiments demonstrate that the influence caused by cross-polarization jamming is the most significant under the condition of anti-phase relationship (i.e., 180 out-of-phase) between cross-polarization and co-polarization components at the receiver, which validates the proposed model. This study provides a reference that benefits the development of a compensation method for angle measurement errors induced by the cross-polarization component in PA radar systems.

Author Contributions

Conceptualization, Y.Z. and D.D.; Methodology, Y.Z., B.P. and Z.T.; Formal analysis, Y.Z.; Investigation, B.C.; Writing—original draft, Y.Z. and Z.T.; Writing—review & editing, B.P. All authors have read and agreed to the published version of the manuscript.

Funding

This research received no external funding.

Data Availability Statement

The original contributions presented in this study are included in the article. Further inquiries can be directed to the corresponding author.

Conflicts of Interest

The authors declare no conflicts of interest.

References

  1. Sherman, S.M.; Barton, D.K. Monopulse Principles and Techniques; Artech House: London, UK, 2011. [Google Scholar]
  2. Liu, Y.; Yu, W.; Li, S.; Zhao, H.; Lin, Q. An Effective Approach for Space-Borne ISAR Receiving Echoes with Variable Sampling Start Based on IMM Method. IEEE Geosci. Remote Sens. Lett. 2025, 22, 1000705. [Google Scholar] [CrossRef]
  3. Xie, J.; Zhou, W.; Zhou, G.; Yuan, Y.; Li, S. Tracking of Range and Azimuth for Continuous Imaging of Marine Target in Monopulse ISAR with Wideband Echoes. Int. J. Antennas Propag. 2016, 2016, 1865915. [Google Scholar] [CrossRef]
  4. Freeman, A.; Zink, M. An application of the monopulse principle to determining elevation angles in SAR images. IEEE Trans. Geosci. Remote Sens. 1994, 32, 616–625. [Google Scholar] [CrossRef]
  5. Soumekh, M. Moving target detection in foliage using along track monopulse synthetic aperture radar imaging. IEEE Trans. Image Process. 1997, 6, 1148–1163. [Google Scholar] [CrossRef]
  6. Sui, R.; Wang, J.; Sun, G.; Xu, Z.; Feng, D. A Dual-Polarimetric High Range Resolution Profile Modulation Method Based on Time-Modulated APCM. IEEE Trans. Antennas Propag. 2025, 73, 1007–1017. [Google Scholar] [CrossRef]
  7. Ma, J.; Shi, L.; Li, Y.; Xiao, S.; Wang, X. Angle estimation of extended targets in main-lobe interference with polarization filtering. IEEE Trans. Aerosp. Electron. Syst. 2017, 53, 169–189. [Google Scholar] [CrossRef]
  8. Du Plessis, W.P. A Comprehensive Investigation of Retrodirective Cross-Eye Jamming; University of Pretoria (South Africa): Pretoria, South Africa, 2010. [Google Scholar]
  9. Nickel, U. Overview of generalized monopulse estimation. IEEE Aerosp. Electron. Syst. Mag. 2006, 21, 27–56. [Google Scholar] [CrossRef]
  10. Zhang, X.; Li, Y.; Yang, X.; Zheng, L.; Long, T.; Baker, C.J. A novel monopulse technique for adaptive phased array radar. Sensors 2017, 17, 116. [Google Scholar] [CrossRef] [PubMed]
  11. Nickel, U. Monopulse estimation with adaptive arrays. In IEE Proceedings F (Radar and Signal Processing); IET: Lucknow, India, 1993; Volume 140, pp. 303–308. [Google Scholar]
  12. Li, H.L.; Li, M.D.; Cui, X.C.; Chen, S.W. Man-Made Target Structure Recognition with Polarimetric Correlation Pattern and Roll-Invariant Feature Coding. IEEE Geosci. Remote Sens. Lett. 2022, 19, 8024105. [Google Scholar] [CrossRef]
  13. Li, H.L.; Liu, S.W.; Chen, S.W. PolSAR Ship Characterization and Robust Detection at Different Grazing Angles with Polarimetric Roll-Invariant Features. IEEE Trans. Geosci. Remote Sens. 2024, 62, 5225818. [Google Scholar] [CrossRef]
  14. Seifer, A.D. Monopulse-radar angle tracking in noise or noise jamming. IEEE Trans. Aerosp. Electron. Syst. 1992, 28, 622–638. [Google Scholar] [CrossRef]
  15. Wang, H.; Xu, L.; Yan, Z.; Gulliver, T.A. Low-Complexity MIMO-FBMC Sparse Channel Parameter Estimation for Industrial Big Data Communications. IEEE Trans. Ind. Inform. 2021, 17, 3422–3430. [Google Scholar] [CrossRef]
  16. Wang, H.; Xiao, P.; Li, X. Channel Parameter Estimation of mmWave MIMO System in Urban Traffic Scene: A Training Channel-Based Method. IEEE Trans. Intell. Transp. Syst. 2022, 25, 754–762. [Google Scholar] [CrossRef]
  17. Ludwig, A. The definition of cross polarization. IEEE Trans. Antennas Propag. 1973, 21, 116–119. [Google Scholar] [CrossRef]
  18. Huang, J.; Yin, J.; An, M.; Li, Y. Azimuth Pointing Calibration for Rotating Phased Array Radar Based on Ground Clutter Correlation. IEEE Trans. Geosci. Remote Sens. 2025, 63, 1000315. [Google Scholar] [CrossRef]
  19. Abd El-Alim, O.; Agrama, E.; Ezz-El-Arab, M. Second-order discriminant function for amplitude comparison monopulse antenna systems (EW antenna array). IEEE Trans. Instrum. Meas. 1991, 40, 596–600. [Google Scholar] [CrossRef]
  20. Kırdar, B.; Ayazgök, S. Cross Polarization Jamming and Jammer Antenna Polarization Purity Level Analysis. In Proceedings of the 2022 30th Signal Processing and Communications Applications Conference (SIU), Safranbolu, Turkey, 15–18 May 2022; pp. 1–4. [Google Scholar]
  21. Kırdar, B.; Uslu, A. Polarization Purity, Jamming Power and Time-Sharing Analysis for Cross Polarization Jamming. In Proceedings of the 2024 32nd Signal Processing and Communications Applications Conference (SIU), Mersin, Turkey, 15–18 May 2024; pp. 1–4. [Google Scholar]
  22. Du Plessis, W.P.; Mosoma, K. Initial Results for Cross-Polarisation Jamming of Monopulse Radar. In Proceedings of the 2022 International Conference on Electromagnetics in Advanced Applications (ICEAA), Cape Town, South Africa, 5–9 September 2022; pp. 258–263. [Google Scholar]
  23. Neri, F. Anti-monopulse jamming techniques. In Proceedings of the 2001 SBMO/IEEE MTT-S International Microwave and Optoelectronics Conference (Cat. No. 01TH8568), Campina Grande, Brazil, 9–12 November 2001; Volume 2, pp. 45–50. [Google Scholar]
  24. Han, H.; Xu, X.; Wang, H.; Dai, H. Analysis of cross-polarization jamming for phase comparison monopulse radars. In Proceedings of the 2019 IEEE 2nd International Conference on Electronic Information and Communication Technology (ICEICT), Harbin, China, 20–22 January 2019; pp. 404–407. [Google Scholar]
  25. Zhong, T.; Tao, H.; Lan, L. Multi-Dimensional Parameter Estimation in Polarimetric ULA with Cross-Distribution Dipole Pairs. Remote Sens. 2022, 14, 3614. [Google Scholar] [CrossRef]
  26. Deng, Y. The Research on Monopulse Angle Measurement for Digital Phased Array. Ph.D. Thesis, University of Electronic Science and Technology of China, Chengdu, China, 2021. (In Chinese). [Google Scholar]
  27. Wei, F. Study of Algorithm for Phased Array Monopulse Angle Measurement. Ph.D. Thesis, Beijing Institute of Technology, Beijing, China, 2016. (In Chinese). [Google Scholar]
  28. Forteza, X.J.; Bhagwat, S.; Kumar, S.; Pani, P. Novel Ringdown Amplitude-Phase Consistency Test. Phys. Rev. Lett. 2023, 130, 021001. [Google Scholar] [CrossRef]
  29. Kim, J.A.; Lee, J.H. Performance Degradation in Cross-Eye Jamming Due to Amplitude/Phase Instability between Jammer Antennas. Sensors 2021, 21, 5027. [Google Scholar] [CrossRef]
  30. Liu, T.; Wei, X.; Liu, Z.; Guan, Z. Continuous and Stable Cross-Eye Jamming via a Circular Retrodirective Array. Electronics 2019, 8, 806. [Google Scholar] [CrossRef]
  31. Zou, R.; Cheng, Y.; Wu, H.; Yang, Z.; Liu, K.; Hua, X. A Two-Step Space-Time Adaptive Matrix Information Geometry Detector for Multi-Channel Radar. IEEE Trans. Aerosp. Electron. Syst. 2025. early access. [Google Scholar] [CrossRef]
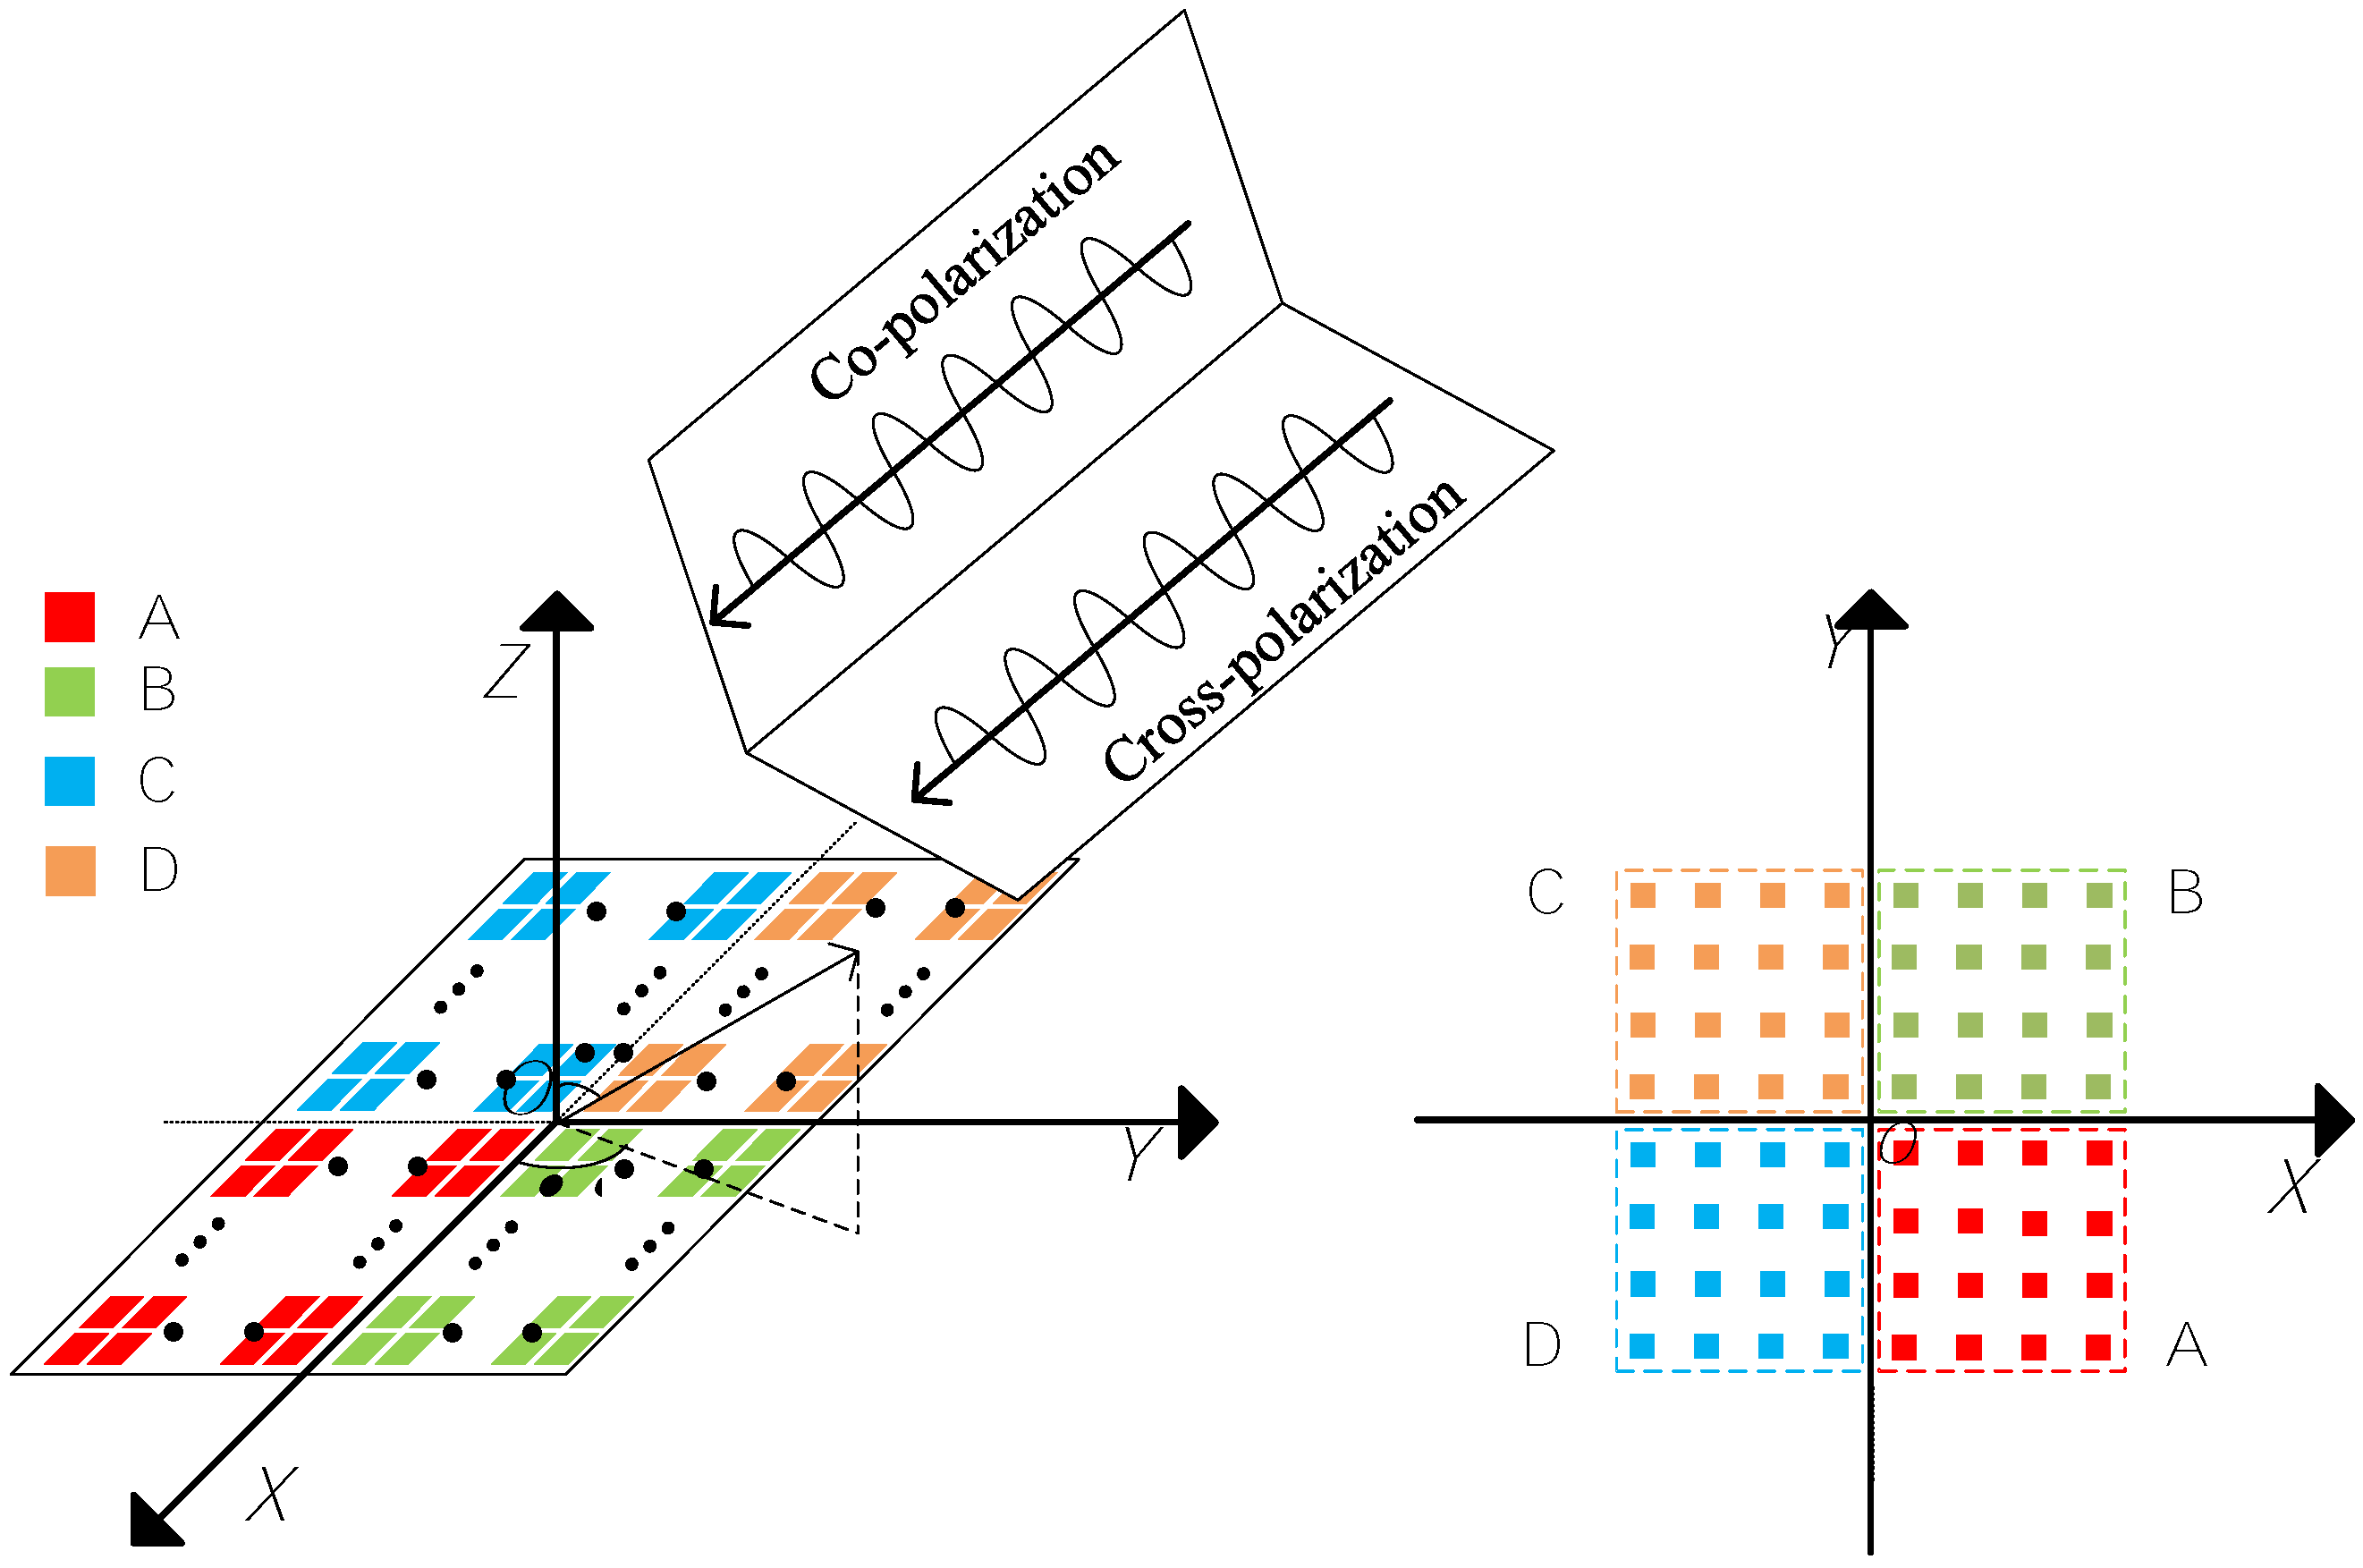
Figure 1. Configuration of the monopulse angle measurement array with four subarrays.
Remotesensing 17 02454 g001
Figure 2. The polarization PA monopulse angle measurement with cross-polarization.
Remotesensing 17 02454 g002
Figure 3. Pattern of sub-beams (azimuth). (a) Amplitude pattern (H channel); (b) phase pattern (H channel); (c) amplitude pattern (V channel); (d) phase pattern (V channel).
Remotesensing 17 02454 g003
Figure 4. Pattern of sub-beams (elevation). (a) Amplitude pattern (H channel); (b) phase pattern (H channel); (c) amplitude pattern (V channel); (d) phase pattern (V channel).
Remotesensing 17 02454 g004
Figure 5. Variation of azimuth angle measurement RMSE with SNR under different JSR conditions (Case 1). (a) Δ ϕ VH = 0 ; (b) Δ ϕ VH = 60 ; (c) Δ ϕ VH = 120 ; (d) Δ ϕ VH = 150 .
Remotesensing 17 02454 g005
Figure 6. Variation of azimuth angle measurement RMSE with JSR under different phase differences (Case 1). (a) SNR = 5 dB; (b) SNR = 10 dB; (c) SNR = 15 dB; (d) SNR = 20 dB.
Remotesensing 17 02454 g006
Figure 7. Detailed figure of variations of the azimuth angle measurement RMSE with JSR under different phase differences (Case 1). (a) SNR = 5 dB; (b) SNR = 10 dB; (c) SNR = 15 dB; (d) SNR = 20 dB.
Remotesensing 17 02454 g007
Figure 8. Variation of elevation angle measurement RMSE with SNR under different JSR conditions (Case 1). (a) Δ ϕ VH = 0 ; (b) Δ ϕ VH = 60 ; (c) Δ ϕ VH = 120 ; (d) Δ ϕ VH = 150 .
Remotesensing 17 02454 g008
Figure 9. Variations of elevation angle measurement RMSE with JSR under different phase differences (Case 1). (a) SNR = 5 dB; (b) SNR = 10 dB; (c) SNR = 15 dB; (d) SNR = 20 dB.
Remotesensing 17 02454 g009
Figure 10. Detailed figure of variations of elevation angle measurement RMSE with JSR under different phase differences (Case 1). (a) SNR = 5 dB; (b) SNR = 10 dB; (c) SNR = 15 dB; (d) SNR = 20 dB.
Remotesensing 17 02454 g010
Figure 11. Variations of azimuth angle measurement RMSE with SNR under different JSR conditions (Case 2). (a) Δ ϕ VH = 0 ; (b) Δ ϕ VH = 60 ; (c) Δ ϕ VH = 120 ; (d) Δ ϕ VH = 150 .
Remotesensing 17 02454 g011
Figure 12. Variations of azimuth angle measurement RMSE with JSR under different phase differences (Case 2). (a) SNR = 5 dB; (b) SNR = 10 dB; (c) SNR = 15 dB; (d) SNR = 20 dB.
Remotesensing 17 02454 g012
Figure 13. Variations of elevation angle measurement RMSE with SNR under different JSR conditions (Case 2). (a) Δ ϕ VH = 0 ; (b) Δ ϕ VH = 60 ; (c) Δ ϕ VH = 120 ; (d) Δ ϕ VH = 150 .
Remotesensing 17 02454 g013
Figure 14. Variations of elevation angle measurement RMSE with JSR under different phase differences (Case 2). (a) SNR = 5 dB; (b) SNR = 10 dB; (c) SNR = 15 dB; (d) SNR = 20 dB.
Remotesensing 17 02454 g014
Figure 15. Distributions of azimuth angle measurement with Δ ϕ VH = 60 (Case 2). (a) JSR = 10 dB; (b) JSR = 20 dB; (c) JSR = 30 dB.
Remotesensing 17 02454 g015
Figure 16. Distributions of elevation angle measurement with Δ ϕ VH = 60 (Case 2). (a) JSR = 10 dB; (b) JSR = 20 dB; (c) JSR = 30 dB.
Remotesensing 17 02454 g016
Table 1. The main symbols and definitions.
SymbolDefinitionSymbolDefinition
2 M x number of elements along X-axishorthogonal polarization component
2 N y number of elements along Y-axisEincident wave field vector
φ azimuth angle W m a x maximum received power
θ elevation angle ρ polarization match factor
d x elements spacing along X-axis G · amplitude pattern
d y elements spacing along Y-axis P · phase pattern
r m n position vector of element (m,n) n noise
r 0 vector in direction of beam Δ ϕ phase difference between two subarrays
F · beam pattern D s u b interval between two subarrays
k m slope of angle identification curve · m co-polarization component
Vopen-circuit voltage equation · c cross-polarization component
F Σ ( · ) sum beam pattern · H horizontal polarization component
F u ( · ) elevation difference beam pattern · V vertical polarization component
F v ( · ) azimuth difference beam patternLMonte Carlo iterations
sreceived signal η phase difference
Disclaimer/Publisher’s Note: The statements, opinions and data contained in all publications are solely those of the individual author(s) and contributor(s) and not of MDPI and/or the editor(s). MDPI and/or the editor(s) disclaim responsibility for any injury to people or property resulting from any ideas, methods, instructions or products referred to in the content.