Driving Forces and Future Scenario Simulation of Urban Agglomeration Expansion in China: A Case Study of the Pearl River Delta Urban Agglomeration
Abstract
1. Introduction
2. Research Area Overview and Methodology
2.1. Research Area Overview
2.2. Data Sources
2.3. Research Methodology
2.3.1. Standard Deviation Ellipse (SDE) Analysis
2.3.2. Landscape Pattern Indices
2.3.3. Geographically and Temporally Weighted Regression (GTWR)
- (1)
- Natural Constraint Hypothesis: Elevation and river network density will exhibit globally negative effects on expansion.
- (2)
- Infrastructure-Driven Hypothesis: Paved road area and FDI will demonstrate joint positive effects, with their regression coefficients’ spatial distribution highly coupled with the transport corridors of the urban agglomeration.
- (3)
- Industrial Transformation Hypothesis: The facilitating effect of the tertiary sector share will strengthen over time.
- (4)
- Policy Intervention Hypothesis: The sign (positive/negative) of fixed investment’s effect may indicate policy orientation.
2.3.4. Geographical Detector
2.3.5. PLUS Model
3. Results Analysis
3.1. Characteristics of Land Use Change in Urban Agglomeration
3.2. Spatial and Temporal Evolution Characteristics of Urban Agglomeration Expansion
3.3. Analysis of the Driving Force of Urban Agglomeration Expansion
3.3.1. GTWR Results Analysis
- (1)
- Natural Factors
- (2)
- Socioeconomic Factors
3.3.2. Analysis of Interactive Detection of Geographic Detector
3.4. Land Use Simulation and Future Multi-Scenario Prediction of Urban Agglomeration
3.4.1. Scenario Settings
3.4.2. Simulation Result Analysis
4. Discussion
4.1. Comparison with Related Research Results
4.2. Policy Attribution of Urban Expansion Pattern Change
- (1)
- Regional Synergy-Oriented Expansion Model
- (2)
- Innovation Corridor-Guided Spatial Restructuring
- (3)
- Quality and Efficiency Improvement Under Ecological Constraints
4.3. Countermeasures and Suggestions
4.4. Limitations and Future Development
5. Conclusions
- (1)
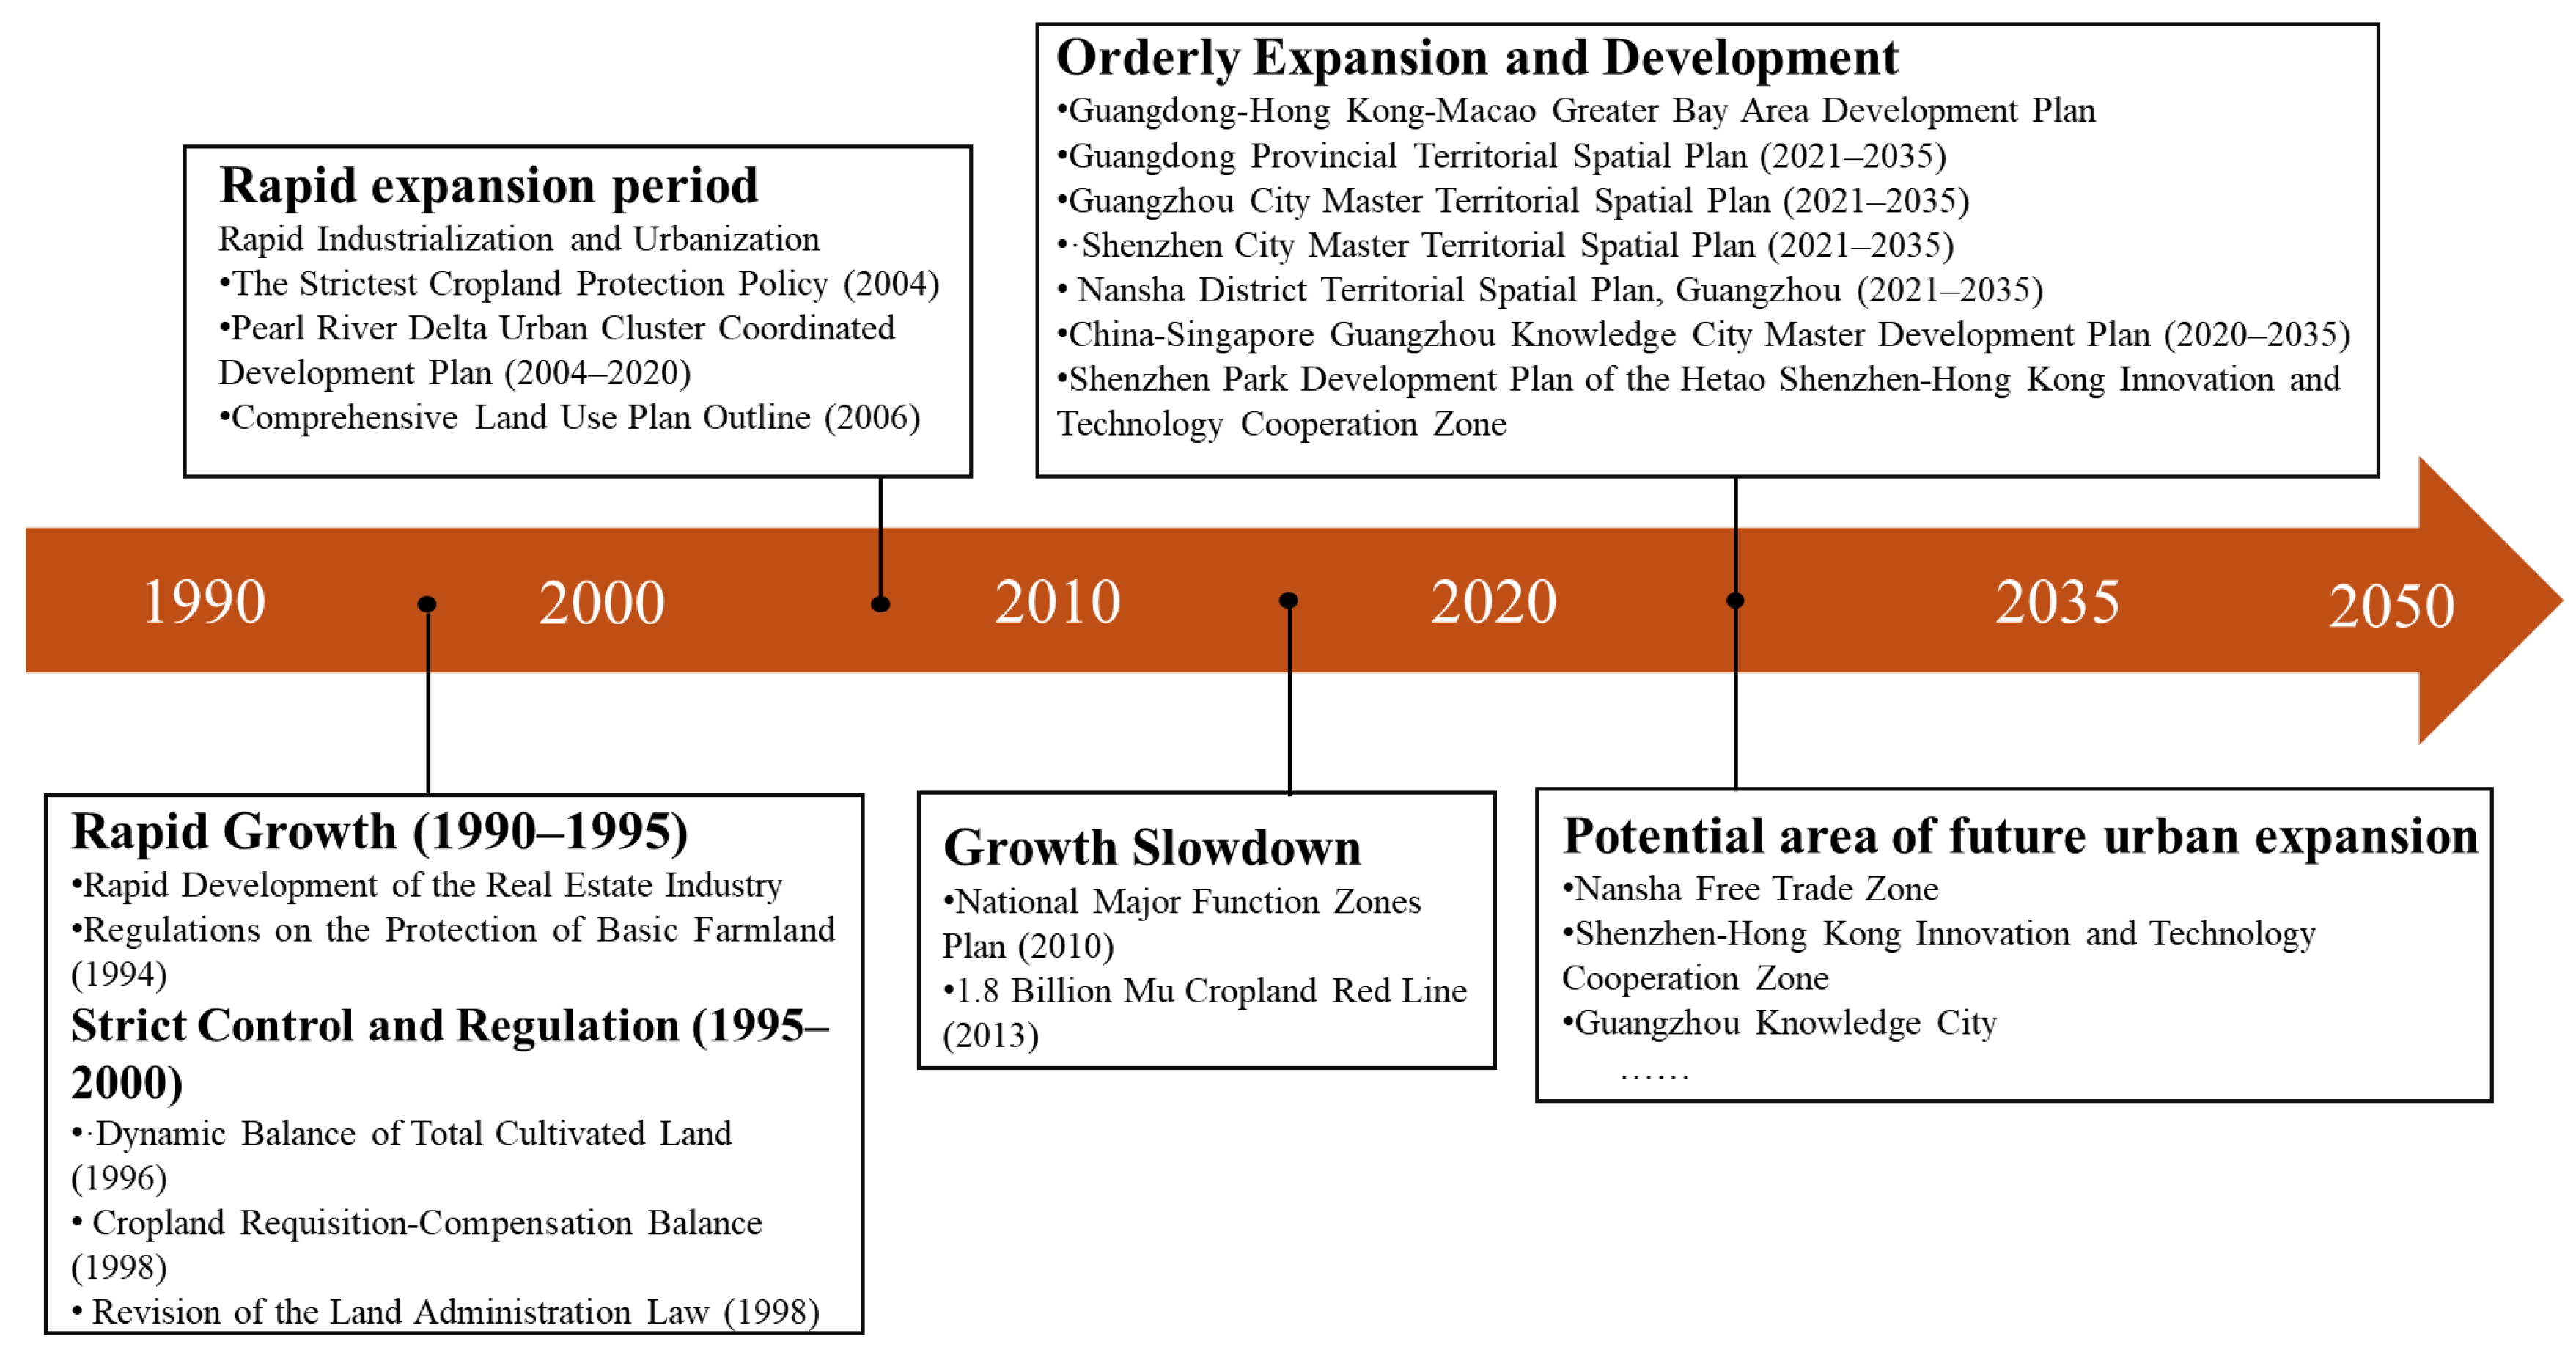
- Spatiotemporal evolution of Urban Expansion: The PRD exhibited marked spatiotemporal heterogeneity in urban expansion from 1990 to 2020. Construction land underwent “phased expansion” with an annual growth rate of 3.7%, increasing its share from 6.5% to 21.8% of the total land area. Cropland accounted for 75.3% of construction land expansion, while forest areas faced persistent encroachment. Spatially, expansion transitioned from “single-core agglomeration” to a “multi-center networked” pattern, with the urban gravity center shifting southeastward (concentrated in Guangzhou’s Panyu and Nansha Districts), driven by Guangzhou’s “Southern Expansion” strategy and Shenzhen–Dongguan integration, forming a continuous urban belt along the northeast–southwest axis. Landscape metrics showed a 30% rise in construction land aggregation (AI) and a 42% decline in cropland integrity (LPI), reflecting intensified fragmentation. Post-2010 policies reduced cropland-to-construction 58.4%, yet ecological pressures persisted in sensitive zones like the Pearl River Estuary, highlighting the tension between urbanization and conservation.
- (2)
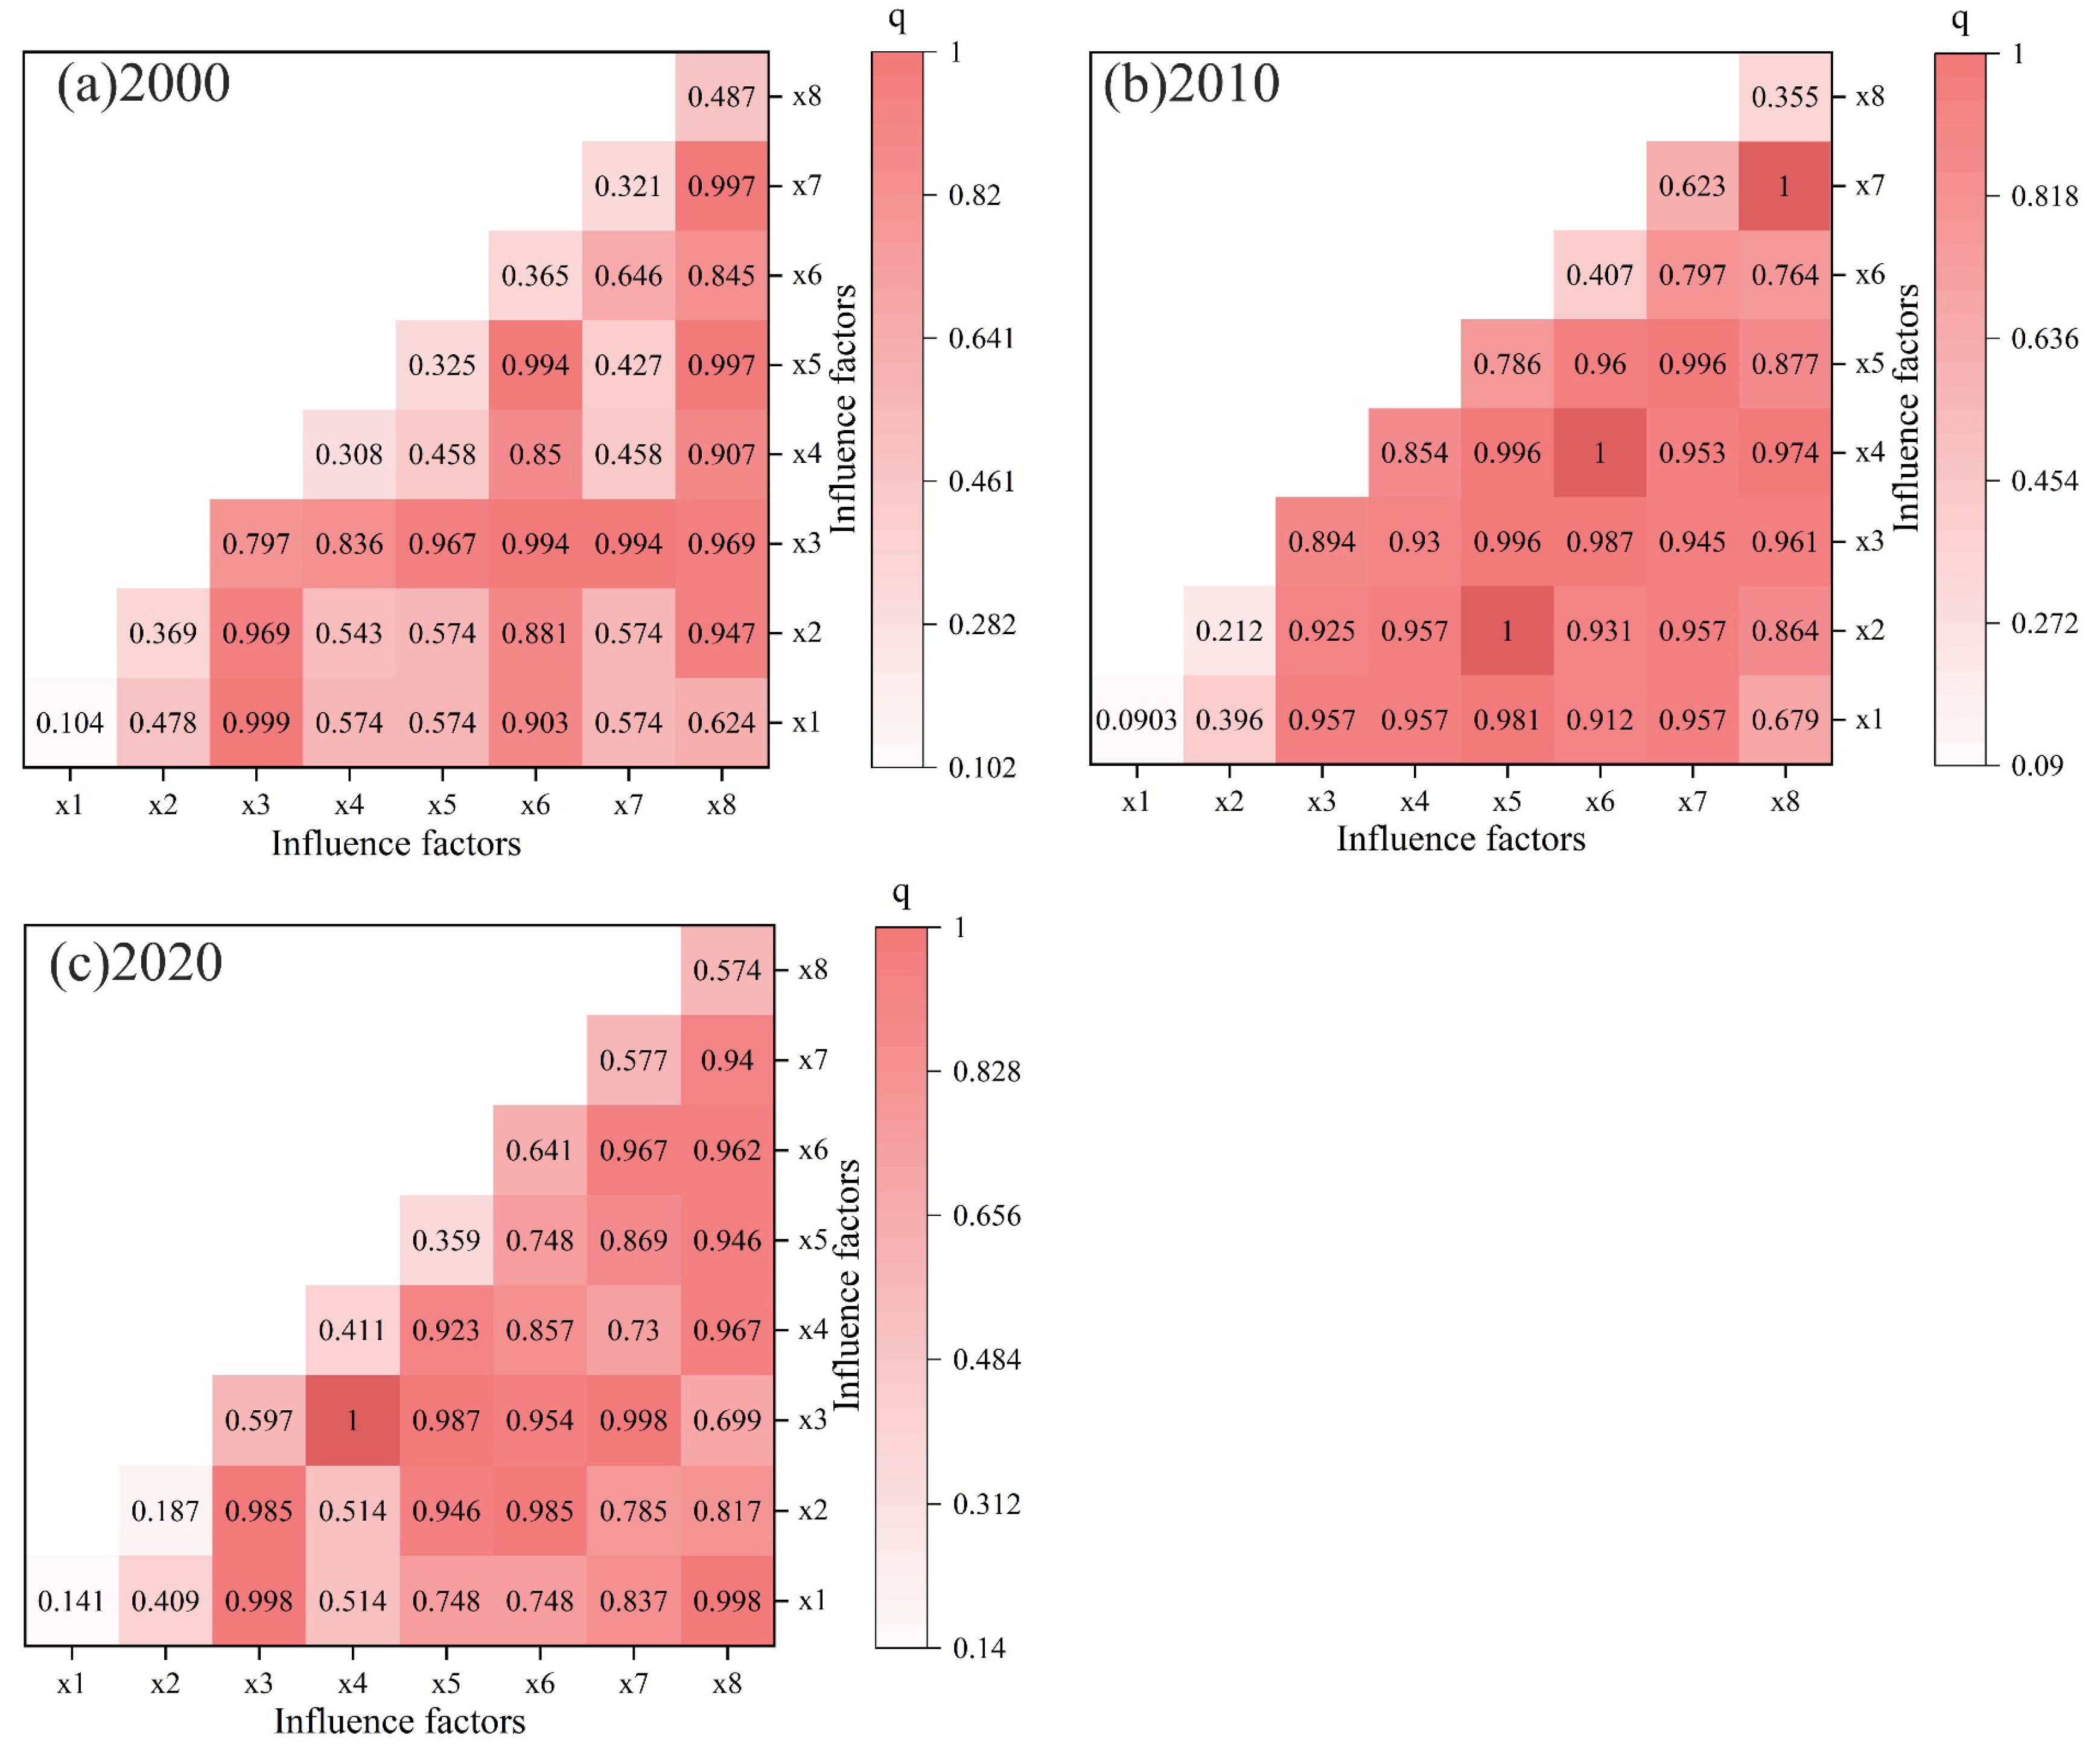
- Drivers of Urban Expansion: Natural and socioeconomic factors jointly shaped expansion dynamics. The GTWR model identified elevation and river density as spatially heterogeneous natural constraints, strongest in western Zhaoqing. Socioeconomic drivers dominated, with paved road area and foreign direct investment as key contributors. Geographical detector analysis revealed synergistic interactions, where dual-factor combinations (e.g., transportation-population, q=0.998; investment-tertiary industry, q=1.000) outperformed single factors, underscoring infrastructure–industry multiplier effects. Policy interventions post-2010 reduced expansion intensity by 1.51%, validating spatial governance efficacy.
- (3)
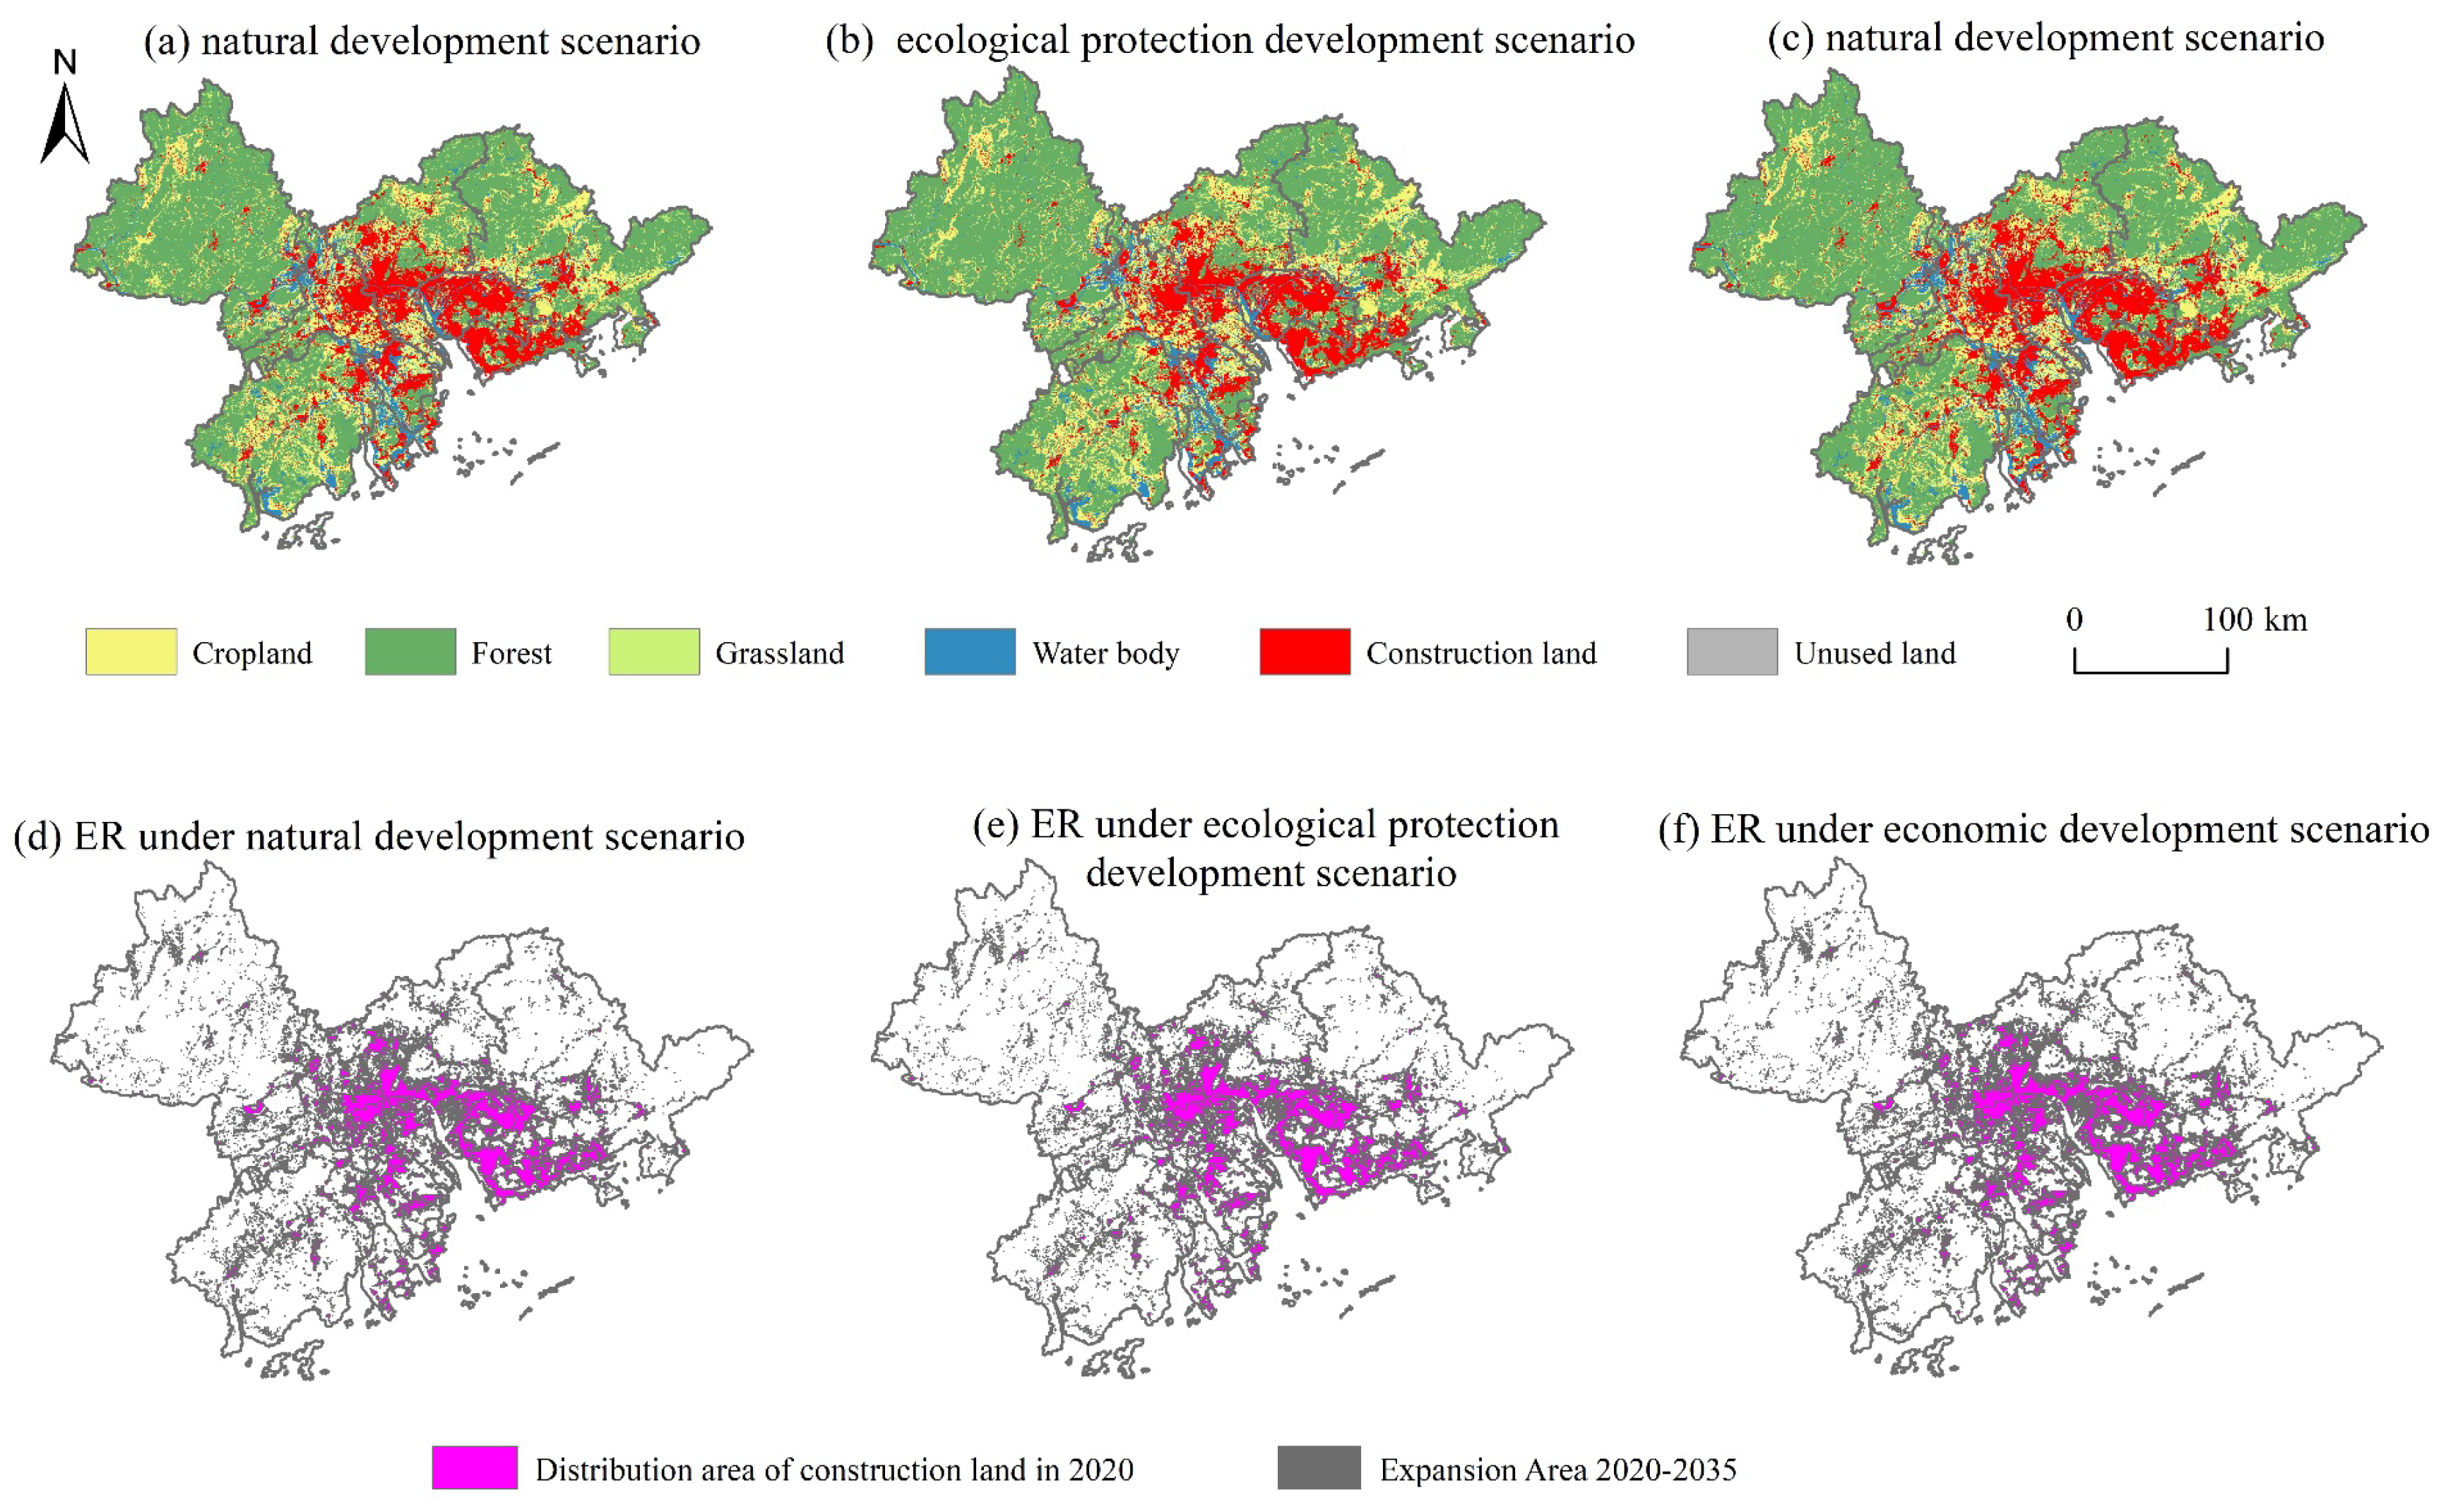
- The PLUS model verification results show that model validation achieved a Kappa coefficient of 0.9205 and 95.90% overall accuracy. Expansion hotspots clustered along the Pearl River Estuary, dominated by peripheral sprawl (67%) supplemented by infilling (33%), primarily converting forests and cropland. Multi-scenario simulations projected that under natural development, construction land would breach ecological safety thresholds by 2035, erasing 408.60 km2 of ecological space. Ecological conservation scenarios reduced cropland/forest loss by 3.04% but intensified unused land development (24.09%). Economic prioritization scenarios spurred cross-city development zones in the estuary, with unused land and cropland conversion rates soaring to 64.17% and 13.34%, respectively. The study concludes that a “dual-track governance” balancing ecology and economy is critical for sustainable high-density urbanization in the PRD.
Author Contributions
Funding
Data Availability Statement
Conflicts of Interest
Appendix A
| 1990–1995 | ||||||
|---|---|---|---|---|---|---|
| Land Use Type | Cropland | Forest | Grassland | Water Body | Construction Land | Unused Land |
| Cropland | 209.29 | 26.72 | 105.34 | 139.45 | 1.23 | |
| Forest | 131.77 | 43.70 | 24.49 | 47.78 | 0.10 | |
| Grassland | 11.27 | 26.54 | 2.22 | 5.18 | 0.01 | |
| Water body | 41.04 | 23.54 | 2.74 | 21.31 | 0.26 | |
| Construction land | 38.54 | 15.35 | 1.47 | 12.98 | 0.02 | |
| Unused land | 0.18 | 0.06 | 0.03 | 0.04 | 0.31 | |
| 1995–2000 | ||||||
|---|---|---|---|---|---|---|
| Land Use Type | Cropland | Forest | Grassland | Water Body | Construction Land | Unused Land |
| Cropland | 130.45 | 10.61 | 54.32 | 52.49 | 0.18 | |
| Forest | 205.09 | 25.98 | 25.06 | 22.03 | 0.05 | |
| Grassland | 26.63 | 43.23 | 2.78 | 1.99 | 0.01 | |
| Water body | 57.18 | 24.41 | 2.08 | 20.99 | 0.04 | |
| Construction land | 79.86 | 26.66 | 2.37 | 16.92 | 0.31 | |
| Unused land | 0.94 | 0.06 | 0.01 | 0.23 | 0.38 | |
| 2000–2005 | ||||||
|---|---|---|---|---|---|---|
| Land Use Type | Cropland | Forest | Grassland | Water Body | Construction Land | Unused Land |
| Cropland | 11.43 | 0.45 | 20.09 | 111.17 | 0.01 | |
| Forest | 7.29 | 1.31 | 2.46 | 46.83 | 0.03 | |
| Grassland | 0.49 | 4.94 | 0.27 | 4.17 | 0.00 | |
| Water body | 3.10 | 2.02 | 0.19 | 31.84 | 0.00 | |
| Construction land | 2.76 | 1.94 | 0.09 | 0.84 | 0.00 | |
| Unused land | 0.01 | 0.02 | 0.00 | 0.19 | 0.30 | |
| 2005–2010 | ||||||
|---|---|---|---|---|---|---|
| Land Use Type | Cropland | Forest | Grassland | Water Body | Construction Land | Unused Land |
| Cropland | 13.19 | 0.63 | 43.18 | 77.65 | 0.01 | |
| Forest | 13.25 | 1.98 | 5.36 | 37.34 | 0.01 | |
| Grassland | 0.98 | 3.54 | 1.00 | 3.06 | 0.00 | |
| Water body | 51.08 | 3.06 | 0.25 | 23.68 | 0.00 | |
| Construction land | 22.44 | 16.57 | 0.92 | 8.55 | 0.01 | |
| Unused land | 0.21 | 0.07 | 0.00 | 0.14 | 0.36 | |
| 2010–2015 | ||||||
|---|---|---|---|---|---|---|
| Land Use Type | Cropland | Forest | Grassland | Water Body | Construction Land | Unused Land |
| Cropland | 5.80 | 0.38 | 2.35 | 20.33 | 0.00 | |
| Forest | 6.08 | 2.51 | 1.24 | 15.91 | 0.00 | |
| Grassland | 0.36 | 1.33 | 0.15 | 1.17 | 0.00 | |
| Water body | 2.60 | 1.30 | 0.10 | 6.57 | 0.00 | |
| Construction land | 2.45 | 1.49 | 0.12 | 0.88 | 0.00 | |
| Unused land | 0.03 | 0.01 | 0.00 | 0.00 | 0.15 | |
| 2015–2020 | ||||||
|---|---|---|---|---|---|---|
| Land Use Type | Cropland | Forest | Grassland | Water Body | Construction Land | Unused Land |
| Cropland | 26.80 | 1.98 | 20.16 | 70.76 | 0.04 | |
| Forest | 28.71 | 8.03 | 11.05 | 38.39 | 0.01 | |
| Grassland | 1.79 | 5.41 | 0.75 | 3.01 | 0.00 | |
| Water body | 12.76 | 7.48 | 1.33 | 25.30 | 0.02 | |
| Construction land | 43.51 | 23.35 | 6.80 | 12.22 | 0.00 | |
| Unused land | 0.05 | 0.02 | 0.01 | 0.06 | 0.07 | |
References
- Villeneuve, P.J.; Lin, Y.; Tjepkema, M.; Pinault, L.; Crouse, D.L.; Osornio-Vargas, A.R.; Hystad, P.; Jerrett, M.; Lavigne, E.; Stieb, D.M. Residential proximity to greenness and adverse birth outcomes in urban areas: Findings from a national Canadian population-based study. Environ. Res. 2021, 204, 112344. [Google Scholar] [CrossRef]
- Bauwelinck, M.; Casas, L.; Nawrot, T.S.; Nemery, B.; Trabelsi, S.; Thomas, I.; Aerts, R.; Lefebvre, W.; Vanpoucke, C.; Van Nieuwenhuyse, A.; et al. Residing in urban areas with higher green space is associated with lower mortality risk: A census-based cohort study with ten years of follow-up. Environ. Int. 2021, 148, 106365. [Google Scholar] [CrossRef]
- Nguyen, T.P.; Virdis, S.G.; Vu, T.B. “Matter of climate change” or “Matter of rapid urbanization”? Young people’s concerns for the present and future urban water resources in Ho Chi Minh City metropolitan area, Vietnam. Appl. Geogr. 2023, 153, 102906. [Google Scholar] [CrossRef]
- Ali, M.T.; Bari, Q.H.; Islam, A.R.M.T. Exploring environmental and meteorological factors influencing greenhouse gas emissions on major urbanized cities in Bangladesh. Urban Clim. 2025, 60, 102369. [Google Scholar] [CrossRef]
- Zhu, Z.; Liu, B.; Wang, H.; Hu, M. Analysis of the Spatiotemporal Changes in Watershed Landscape Pattern and Its Influencing Factors in Rapidly Urbanizing Areas Using Satellite Data. Remote Sens. 2021, 13, 1168. [Google Scholar] [CrossRef]
- Shen, X.; Bai, X.; Zhao, C.; Tan, Q.; Luo, G.; Li, C.; Ran, C.; Zhang, S.; Xiong, L.; Liao, J.; et al. Global response of soil biodiversity to climate and land use changes. J. Clean. Prod. 2024, 471, 1143381. [Google Scholar] [CrossRef]
- Zou, Z.; Yuan, X.; Zhang, Z.; Li, X.; Zhou, C. Spatiotemporal Evolution and Influencing Factors of Coupling and Coordination between the Ecosystem Service Value and Economy in the Pearl River Delta Urban Agglomeration of China. Land 2024, 13, 1670. [Google Scholar] [CrossRef]
- Zhang, D.; Xie, X.; Zhou, C. Spatial influence of exposure to green spaces on the climate comfort of urban habitats in China. Urban Clim. 2023, 51, 101657. [Google Scholar] [CrossRef]
- Hu, P.; Li, F.; Sun, X.; Liu, Y.; Chen, X.; Hu, D. Assessment of Land-Use/Cover Changes and Its Ecological Effect in Rapidly Urbanized Areas—Taking Pearl River Delta Urban Agglomeration as a Case. Sustainability 2021, 13, 5075. [Google Scholar] [CrossRef]
- Liu, W.; Zhan, J.; Zhao, F.; Yan, H.; Zhang, F.; Wei, X. Impacts of urbanization-induced land-use changes on ecosystem services: A case study of the Pearl River Delta Metropolitan Region, China. Ecol. Indic. 2019, 98, 228–238. [Google Scholar] [CrossRef]
- Li, C.; Kam, M.; Tang, Y.; Fung, T. From a “World Factory” to China’s Bay Area: A Review of the Outline of the Development Plan for the Guangdong-Hong Kong-Macao Greater Bay Area. Plan. Theory Pract. 2022, 23, 310–314. [Google Scholar] [CrossRef]
- Jiang, S.; Ren, H.; Zhang, Z. Monitoring and assessing the growth law of urban land using multi-source data: A case study of five East African countries. Land Use Policy 2025, 153, 107530. [Google Scholar] [CrossRef]
- Wei, L.; Zhou, L.; Sun, D.; Tang, X. The evolution of spatio-temporal pattern and scenario simulation of urban agglomeration expansion in the Yellow River Basin: A case study in the Hohhot-Baotou-Ordos-Yulin Urban Agglomeration. Geogr. Res. 2022, 41, 1610–1622. [Google Scholar]
- Taka, M.; Sillanpää, N.; Niemi, T.; Warsta, L.; Kokkonen, T.; Setälä, H. Heavy metals from heavy land use? Spatio-temporal patterns of urban runoff metal loads. Sci. Total Environ. 2022, 817, 152855. [Google Scholar] [CrossRef]
- Zhai, H.; Lv, C.; Liu, W.; Yang, C.; Fan, D.; Wang, Z.; Guan, Q. Understanding Spatio-Temporal Patterns of Land Use/Land Cover Change Under Urbanization in Wuhan, China, 2000–2019. Remote Sens. 2021, 13, 3331. [Google Scholar] [CrossRef]
- Wang, S.; He, S.; Wang, J.; Li, J.; Zhong, X.; Cole, J.; Kurbanov, E.; Sha, J. Analysis of Land Use/Cover Changes and Driving Forces in a Typical Subtropical Region of South Africa. Remote Sens. 2023, 15, 4823. [Google Scholar] [CrossRef]
- Chen, Q.; Wu, M.; Xie, H. Tillage conditions or social economy? An analysis of the dominant driving force of farmland marginalization from the farmers’ perspective. Land Use Policy 2023, 133, 106870. [Google Scholar] [CrossRef]
- Zhao, D.; Xiao, M.; Huang, C.; Liang, Y.; Yang, Z. Land Use Scenario Simulation and Ecosystem Service Management for Different Regional Development Models of the Beibu Gulf Area, China. Remote Sens. 2021, 13, 3161. [Google Scholar] [CrossRef]
- Simwanda, M.; Murayama, Y.; Phiri, D.; Nyirenda, V.R.; Ranagalage, M. Simulating Scenarios of Future Intra-Urban Land-Use Expansion Based on the Neural Network–Markov Model: A Case Study of Lusaka, Zambia. Remote Sens. 2021, 13, 942. [Google Scholar] [CrossRef]
- Li, B.; Shi, X.; Chen, Y.; Jiang, Y. Quantitative assessment of the ecological effects of land use/cover change in the arid region of Northwest China. Environ. Monit. Assess. 2019, 191, 704. [Google Scholar] [CrossRef]
- Krishnan, G.; Shanthi Priya, R.; Senthil, R. Ecological effects of land use and land cover changes on lakes in urban environments. Sustain. Dev. 2024, 32, 6801–6818. [Google Scholar] [CrossRef]
- Hashim, F.; Dibs, H.; Jaber, H.S. Adopting Gram-Schmidt and Brovey Methods for Estimating Land Use and Land Cover Using Remote Sensing and Satellite Images. Nat. Environ. Pollut. Technol. 2022, 21, 867–881. [Google Scholar] [CrossRef]
- Li, K.; Wang, L.; Yin, D. Deriving corn and soybeans fractions with Land Remote-Sensing Satellite (System, Landsat) imagery by accounting for endmember variability on Google Earth Engine. Int. J. Remote Sens. 2021, 42, 4493–4513. [Google Scholar] [CrossRef]
- Hu, P.; Li, F.; Hu, D.; Sun, X.; Liu, Y.; Chen, X. Spatial and temporal characteristics of urban expansion in Pearl River Delta urban agglomeration from 1980 to 2015. Acta Ecol. Sin. 2021, 41, 7063–7072. [Google Scholar]
- Liu, Z.; Huang, H.; Saskia, E.W.; Yan, D. Construction area expansion in relation to economic-demographic development and land resource in the Pearl River Delta of China. J. Geogr. Sci. 2016, 26, 188–202. [Google Scholar] [CrossRef]
- Wang, Y.; Huang, C.; Feng, Y.; Gu, J. Evaluation of the Coordinated Relationship between Land Consumption Rate and Population Growth Rate in the Pearl River Delta based on the 2030 Sustainable Development Goals. Remote Sens. Technol. Appl. 2021, 36, 1168–1177. [Google Scholar]
- Xu, Q.; Huang, Y. Analysis of urban expansion measurement and driving mechanism in typical region of Pearl River Delta. Sci. Surv. Mapp. 2018, 43, 49–52. [Google Scholar]
- Chen, Q.; Wang, X.; Wu, Z.; Wang, Z. Impacts of Urban Expansion on Meteorological Conditions and Ozone Concentration in Spring over the Pearl River Delta, China. J. Trop. Meteorol. 2012, 28, 357. [Google Scholar]
- Zhao, L.; Liu, X.; Liu, P.; Chen, G.; He, J. Urban Expansion Simulation and Early Warning based on Geospatial Partition and FLUS Model. J. Geo-Inf. Sci. 2020, 22, 517–530. [Google Scholar]
- Guo, R.; Liu, X.; Xu, X. Future Urban Expansion Simulation and Flood Mitigation Assessment in the Pearl River Delta under Flood Risk Avoidance. Trop. Geogr. 2023, 43, 1083–1097. [Google Scholar]
- Lu, Y.; Lin, J. Predicting the impact of urban agglomeration development on grain production regions: A case study of Pearl River Delta. J. Nat. Resour. 2023, 38, 1532–1549. [Google Scholar] [CrossRef]
- Zhang, X.; Zeng, H. Dynamic of three dimensional ecological footprint in the Pearl River Delta and its driving factors. Acta Sci. Circumstantiae 2017, 37, 771–778. [Google Scholar]
- Wang, M.; Qiu, S.; Shi, W. Impacts of future land use change on biodiversity in the Pearl River Delta. Acta Ecol. Sin. 2024, 44, 7183–7197. [Google Scholar]
- Wu, M.; Niu, Z.; Wang, C. Assessing the Accuracy of Spatial and Temporal Image Fusion Model of Complex area in South China. J. Geo-Inf. Sci. 2014, 16, 776–783. [Google Scholar]
- Hu, Y.; Connor, D.S.; Stuhlmacher, M.; Peng, J.; Turner, B.L., II. More urbanization, more polarization: Evidence from two decades of urban expansion in China. npj Urban Sustain. 2024, 4, 33. [Google Scholar] [CrossRef]
- Xiao, R.; Yu, X.; Xiang, T.; Zhang, Z.; Wang, X.; Wu, J. Exploring the coordination between physical space expansion and social space growth of China’s urban agglomerations based on hierarchical analysis. Land Use Policy 2021, 109, 105700. [Google Scholar] [CrossRef]
- Li, Z.; Li, M.; Xia, B. Spatio-temporal dynamics of ecological security pattern of the Pearl River Delta urban agglomeration based on LUCC simulation. Ecol. Indic. 2020, 114, 106319. [Google Scholar] [CrossRef]
- GB/T 21010-2017; Current Land Use Classification. General Administration of Quality Supervision, Inspection and Quarantine of the People’s Republic of China (AQSIQ) and Standardization Administration of the People’s Republic of China (SAC): Beijing, China, 2017.
- Wei, Q.; Xue, L.; Zhang, H.; Chen, P.; Yang, J.; Niu, B. Spatiotemporal analysis of carbon emission efficiency across economic development stages and synergistic emission reduction in the Beijing-Tianjin-Hebei region. J. Environ. Manag. 2025, 377, 124609. [Google Scholar] [CrossRef]
- He, Y.; Liang, Y.; Li, L.; Zhang, C.; Huang, J. Loss of green landscapes due to urban expansion in China. Resour. Conserv. Recycl. 2023, 199, 107228. [Google Scholar] [CrossRef]
- You, M.; Zou, Z.; Zhao, W.; Zhang, W.; Fu, C. Study on land use and landscape pattern change in the Huaihe River Ecological and economic zone from 2000 to 2020. Heliyon 2023, 9, e13430. [Google Scholar] [CrossRef]
- Li, Z.; Han, H.; You, H.; Cheng, X.; Wang, T. Effects of local characteristics and landscape patterns on plant richness: A multi-scale investigation of multiple dispersal traits. Ecol. Indic. 2020, 117, 106584. [Google Scholar] [CrossRef]
- Zou, Z.; Zhao, X.; Liu, S.; Yuan, X.; Zhou, C. Quantitative attribution of spatio-temporal pattern of pm2.5 concentration based on geodetector and GWR model: Evidence from China’s three major urban agglomerations. PLoS ONE 2025, 20, e0326241. [Google Scholar]
- He, X.; Zhou, Y.; Yuan, Y. Exploring the relationship between urban polycentricity and consumer amenity development: An empirical study using Dianping Data in China. Cities 2025, 166, 106197. [Google Scholar] [CrossRef]
- Bao, W.; Yang, Y.; Zou, L. How to reconcile land use conflicts in mega urban agglomeration? A scenario-based study in the Beijing-Tianjin-Hebei region, China. J. Environ. Manag. 2021, 296, 113168. [Google Scholar] [CrossRef] [PubMed]
- Wang, R.; Bai, Y.; Alatalo, J.; Guo, G.; Yang, Z.; Yang, Z.; Yang, W. Impacts of urbanization at city cluster scale on ecosystem services along an urban-rural gradient: A case study of Central Yunnan City Cluster, China. Environ. Sci. Pollut. Res. Int. 2022, 29, 88852–88865. [Google Scholar] [CrossRef] [PubMed]
- Guo, S.; Zhang, S.; Lv, X.; Tang, Y.; Zhang, T.; Hua, Z. Occurrence, risk assessment and source apportionment of perfluoroalkyl acids in the river of a hill-plain intersection region: The impacts of land use and river network structure. Sci. Total Environ. 2024, 954, 176260. [Google Scholar] [CrossRef] [PubMed]
- Wang, P.; Zeng, C.; Zhang, W.; Lv, T.; Miao, X.; Xiang, H. Investigation of the spatial effects on PM2.5 in relation to land use and ecological restoration in urban agglomerations. Sci. Total Environ. 2023, 913, 169665. [Google Scholar] [CrossRef]
- Xu, Y.; Liu, X. Path analysis and mediating effects of influencing factors of land use carbon emissions in Chang-Zhu-Tan urban agglomeration. Technol. Forecast. Soc. Change 2023, 188, 122268. [Google Scholar]
- Liu, C.; Hu, S.; Wu, S.; Song, J.; Li, H. County-level land use carbon emissions in China: Spatiotemporal patterns and impact factors. Sustain. Cities Soc. 2024, 105, 105304. [Google Scholar] [CrossRef]
- Li, H.; Chen, K.; Yan, L.; Zhu, Y.; Liao, L.; Chen, Y. Urban Land Use Transitions and the Economic Spatial Spillovers of Central Cities in China’s Urban Agglomerations. Land 2021, 10, 644. [Google Scholar] [CrossRef]
- Qiao, W.; Hu, B.; Guo, Z.; Huang, X. Evaluating the sustainability of land use integrating SDGs and its driving factors: A case study of the Yangtze River Delta urban agglomeration, China. Cities 2023, 143, 104569. [Google Scholar] [CrossRef]
- Wang, X.; Yan, F.; Zeng, Y.; Chen, M.; Su, F.; Cui, Y. Changes in Ecosystems and Ecosystem Services in the Guangdong-Hong Kong-Macao Greater Bay Area since the Reform and Opening Up in China. Remote Sens. 2021, 13, 1611. [Google Scholar] [CrossRef]
- Liu, Y.; Cao, X.; Xu, J.; Li, T. Influence of traffic accessibility on land use based on Landsat imagery and internet map: A case study of the Pearl River Delta urban agglomeration. PLoS ONE 2019, 14, e0224136. [Google Scholar] [CrossRef] [PubMed]
- Wang, J.; Xu, C. Geodetector: Principle and prospective. Acta Geogr. Sin. 2017, 72, 116–134. [Google Scholar]
- Zou, Z.; You, M.; Zhao, W.; Fu, C.; Zhang, W.; He, Z. Changes in the “Production-Living-Ecological Space” Pattern in the Interlocking Mountain and River Zones of the Yellow River Basin—Taking Xinxiang City as an Example. J. Resour. Ecol. 2023, 14, 479–492. [Google Scholar]
- Li, C.; Wu, Y.; Gao, B.; Zheng, K.; Wu, Y.; Li, C. Multi-scenario simulation of ecosystem service value for optimization of land use in the Sichuan-Yunnan ecological barrier, China. Ecol. Indic. 2021, 132, 108328. [Google Scholar] [CrossRef]
- Cai, J.; Chi, H.; Lu, N.; Bian, J.; Chen, H.; Yu, J.; Yang, S. Analysis of Spatiotemporal Predictions and Drivers of Carbon Storage in the Pearl River Delta Urban Agglomeration via the PLUS-InVEST-GeoDetector Model. Energies 2024, 17, 5093. [Google Scholar] [CrossRef]
- Gong, J.; Du, H.; Sun, Y.; Zhan, Y. Simulation and prediction of land use in urban agglomerations based on the PLUS model: A case study of the Pearl River Delta, China. Front. Environ. Sci. 2023, 11, 1306187. [Google Scholar] [CrossRef]
- Cui, F.; Wang, Y.; Liu, G. Exploring the spatial-temporal evolution and driving mechanisms for coupling coordination between green transformation of urban construction land and industrial transformation and upgrading: A case study of the urban agglomeration in the middle reaches of the Yangtze River. Environ. Sci. Pollut. Res. Int. 2023, 30, 119385–119405. [Google Scholar]
- Zhu, Z.; Zhu, X.; Li, S. Evolution process and characteristics of spatial structure of urban agglomeration in the middle reaches of the Yangtze River. Acta Geogr. Sin. 2021, 76, 799–817. [Google Scholar]
- Zhu, Z.; He, Q. Spatio-temporal evaluation of the urban agglomeration expansion in the middle reaches of the Yangtze River and its impact on ecological lands. Sci. Total Environ. 2021, 790, 148150. [Google Scholar]
- Wang, Y.; Zhou, X.; Wang, P.; Li, B.; Han, W.; Hou, J. Spatio-temporal Analysis of Land Use/Land Cover Pattern Changes in Triangle of Central China in the Past 30 Years. Remote Sens. Technol. Appl. 2025, 40, 132. [Google Scholar]
- He, D.; Chen, Z.; Zhou, J.; Yang, T.; Lu, L. The Heterogeneous Impact of High-Speed Railway on Urban Expansion in China. Remote Sens. 2021, 13, 4914. [Google Scholar] [CrossRef]
- Zhang, X.; Zou, Y.; Xia, C.; Lu, Y. Unraveling the mystery of urban expansion in the Guangdong-Hong Kong-Macao Greater Bay Area: Exploring the crucial role of regional cooperation. Environ. Plan. B Urban Anal. City Sci. 2025, 52, 707–724. [Google Scholar] [CrossRef]
- Zhang, X.; Chen, Y.; Xu, Y.; Yue, W.; Tang, C. Does regional cooperation constrain urban sprawl? Evidence from the Guangdong-Hong Kong-Macao Greater Bay Area. Landsc. Urban Plan. 2023, 235, 104742. [Google Scholar] [CrossRef]
- Yang, F.; Pang, B.; Song, L.; Cheng, H.; Zhou, S.; Zheng, Z.; Peng, D.; Zuo, D. Response of extreme precipitation to urban expansion over the Guangdong-Hong Kong-Macao Greater Bay Area. Urban Clim. 2024, 56, 102062. [Google Scholar] [CrossRef]
- Hong, W.; Ren, Z.; Guo, Y.; Wang, C.; Cao, F.; Zhang, P.; Hong, S.; Ma, Z. Spatiotemporal changes in urban forest carbon sequestration capacity and its potential drivers in an urban agglomeration: Implications for urban CO2 emission mitigation under China’s rapid urbanization. Ecol. Indic. 2024, 159, 111601. [Google Scholar] [CrossRef]
- Wang, C.; Ren, Z.; Du, Y.; Guo, Y.; Zhang, P.; Wang, G.; Hong, S.; Ma, Z.; Hong, W.; Li, T. Urban vegetation cooling capacity was enhanced under rapid urbanization in China. J. Clean. Prod. 2023, 425, 138906. [Google Scholar] [CrossRef]
- Guo, Y.; Ren, Z.; Wang, C.; Zhang, P.; Ma, Z.; Hong, S.; Hong, W.; He, X. Spatiotemporal patterns of urban forest carbon sequestration capacity: Implications for urban CO2 emission mitigation during China’s rapid urbanization. Sci. Total Environ. 2023, 912, 168781. [Google Scholar] [CrossRef]


| Data Name n | Data Description | Data Type | Time | Data Source |
|---|---|---|---|---|
| Land Use | Land Use Data | Raster Data | 1990, 1995, 2000, 2005, 2010, 2015, 2020 | Resource and Environmental Science Data Center, Chinese Academy of Sciences (http://www.resdc.cn/, accessed on 26 March 2024) |
| DEM | Elevation, slope, aspect, et al. | Raster Data | 2020 | NASA-SRTM (https://www.earthdata.nasa.gov/, accessed on 2 July 2023) |
| Geospatial Data | Administrative boundaries, road networks, rivers, et al. | Vector Data | 2020 | National Geomatics Center of China (http://www.ngcc.cn/) |
| Socioeconomic Data | Population, economic indicators for driving factor analysis | Statistical Data | 2000, 2010, 2020 | Guangdong Provincial Bureau of Statistics (https://stats.gd.gov.cn/) |
| NPP-VIIRS Nighttime Lights | Economic proxy for driving factor analysis | Raster Data | 2000, 2010, 2020 | National Earth System Science Data Center, National Science & Technology Infrastructure of China (http://www.geodata.cn) |
| Constraint Factors | Nature reserves | Vector Data | 2025 | OSM (https://www.openstreetmap.org/, accessed on 18 March 2025) |
| Index | Ecological Significance | Calculation Formula | Parameter Description |
|---|---|---|---|
| NP | Total number of patches of a specific land type | is the number of patches of type | |
| LPI | Proportion of the largest patch relative to the total landscape area | is the area of the patch in the landscape and is the total landscape area | |
| AI | Patch connectivity; higher values indicate greater aggregation | is the number of similar adjacent patches of corresponding landscape types | |
| COHESION | Physical connectivity between patches within a landscape type | is the perimeter of the th patch in the th landscape, is the area of the patch in the landscape, and is the total area of the landscape |
| Category | ID | Factor | Metric | Unit |
|---|---|---|---|---|
| Natural factors | 1 | Terrain relief | Relief amplitude | m |
| 2 | Slope | Mean slope | % | |
| 3 | River network density | River length ÷ built-up area | km/km2 | |
| 4 | Elevation | Mean elevation | m | |
| Socioeconomic factors | 5 | Population | Permanent population | 10,000 people |
| 6 | Economic vitality | Nighttime light index | - | |
| 7 | Economic scale | GDP | 10,000 CNY | |
| 8 | Investment intensity | Fixed-asset investment | 10,000 CNY | |
| 9 | Industrial output | Gross industrial output | 10,000 CNY | |
| 10 | Secondary industry | Secondary industry GDP share | % | |
| 11 | Tertiary industry | Tertiary industry GDP share | % | |
| 12 | Foreign investment | Foreign direct investment (FDI) | 10,000 CNY | |
| 13 | Transportation | Paved road area | m2 |
| Land Use Type | 1990 | 2010 | 2020 | |||
|---|---|---|---|---|---|---|
| Area (km2) | Proportion of Area (%) | Area (km2) | Proportion of Area (%) | Area (km2) | Proportion of Area (%) | |
| Cropland | 15,803.69 | 29.23 | 12,666.02 | 23.40 | 12,162.02 | 22.47 |
| Forest | 30,666.25 | 56.72 | 29,812.87 | 55.08 | 29,421.18 | 54.37 |
| Grassland | 1112.47 | 2.06 | 944.95 | 1.75 | 1018.89 | 1.88 |
| Water body | 3668.02 | 6.78 | 3881.34 | 7.17 | 3786.53 | 7.00 |
| Construction land | 2789.74 | 5.16 | 6809.67 | 12.58 | 7721.43 | 14.27 |
| Unused land | 21.42 | 0.04 | 8.91 | 0.02 | 6.04 | 0.01 |
| Influencing Factors | Explanatory Variables | Variance Inflation Factor (VIF) | Tolerance (T) |
|---|---|---|---|
| Natural factors | elevation (X1) | 6.853 | 0.146 |
| river network density (X2) | 5.382 | 0.186 | |
| Socioeconomic factors | permanent population (X3) | 2.541 | 0.394 |
| fixed-asset investment (X4) | 2.942 | 0.342 | |
| secondary industry shares (X5) | 7.715 | 0.130 | |
| tertiary industry shares (X6) | 4.328 | 0.231 | |
| foreign direct investment (X7) | 2.728 | 0.367 | |
| paved road area (X8) | 2.311 | 0.433 |
| Models | AICc (Akaike Information Criterion Corrected) | RMSE (Cross-Validation) | |
|---|---|---|---|
| OLS | 16.2960 | 0.9532 | 0.055 ± 0.007 |
| GWR | 30.0616 | 0.9484 | 0.059 ± 0.008 |
| GTWR | 6.0769 | 0.9677 | 0.040 ± 0.005 |
| Types of Land | Natural Development Scenario | Ecological Protection Scenario | Economic Development Scenario | |||
|---|---|---|---|---|---|---|
| Area | Proportion | Area | Proportion | Area | Proportion | |
| Cropland | 11,455.34 | 21.17% | 11,817.12 | 21.84% | 10,730.36 | 19.83% |
| Forest | 28,874.97 | 53.35% | 29,738.99 | 54.94% | 28,851.15 | 53.30% |
| Grassland | 1042.04 | 1.93% | 790.88 | 1.46% | 1011.81 | 1.87% |
| Water body | 3900.98 | 7.21% | 3833.92 | 7.08% | 3968.28 | 7.33% |
| Construction land | 8840.04 | 16.34% | 7930.39 | 14.65% | 9552.30 | 17.65% |
| Unused land | 2.69 | 0.01% | 4.75 | 0.01% | 2.16 | 0.01% |
Disclaimer/Publisher’s Note: The statements, opinions and data contained in all publications are solely those of the individual author(s) and contributor(s) and not of MDPI and/or the editor(s). MDPI and/or the editor(s) disclaim responsibility for any injury to people or property resulting from any ideas, methods, instructions or products referred to in the content. |
© 2025 by the authors. Licensee MDPI, Basel, Switzerland. This article is an open access article distributed under the terms and conditions of the Creative Commons Attribution (CC BY) license (https://creativecommons.org/licenses/by/4.0/).
Share and Cite
Zou, Z.; Zhao, X.; Liu, S.; Zhou, C. Driving Forces and Future Scenario Simulation of Urban Agglomeration Expansion in China: A Case Study of the Pearl River Delta Urban Agglomeration. Remote Sens. 2025, 17, 2455. https://doi.org/10.3390/rs17142455
Zou Z, Zhao X, Liu S, Zhou C. Driving Forces and Future Scenario Simulation of Urban Agglomeration Expansion in China: A Case Study of the Pearl River Delta Urban Agglomeration. Remote Sensing. 2025; 17(14):2455. https://doi.org/10.3390/rs17142455
Chicago/Turabian StyleZou, Zeduo, Xiuyan Zhao, Shuyuan Liu, and Chunshan Zhou. 2025. "Driving Forces and Future Scenario Simulation of Urban Agglomeration Expansion in China: A Case Study of the Pearl River Delta Urban Agglomeration" Remote Sensing 17, no. 14: 2455. https://doi.org/10.3390/rs17142455
APA StyleZou, Z., Zhao, X., Liu, S., & Zhou, C. (2025). Driving Forces and Future Scenario Simulation of Urban Agglomeration Expansion in China: A Case Study of the Pearl River Delta Urban Agglomeration. Remote Sensing, 17(14), 2455. https://doi.org/10.3390/rs17142455


