Article

A Dual-Branch Spatial-Frequency Domain Fusion Method with Cross Attention for SAR Image Target Recognition

1
Information and Navigation College, Air Force Engineering University, Xi’an 710077, China
2
Department of information engineering, Tongling Polytechnic, Tongling 244000, China
*
Author to whom correspondence should be addressed.
Remote Sens. 2025, 17(14), 2378; https://doi.org/10.3390/rs17142378
Submission received: 18 June 2025 / Revised: 4 July 2025 / Accepted: 7 July 2025 / Published: 10 July 2025

Abstract

Synthetic aperture radar (SAR) image target recognition has important application values in security reconnaissance and disaster monitoring. However, due to speckle noise and target orientation sensitivity in SAR images, traditional spatial domain recognition methods face challenges in accuracy and robustness. To effectively address these challenges, we propose a dual-branch spatial-frequency domain fusion recognition method with cross-attention, achieving deep fusion of spatial and frequency domain features. In the spatial domain, we propose an enhanced multi-scale feature extraction module (EMFE), which adopts a multi-branch parallel structure to effectively enhance the network’s multi-scale feature representation capability. Combining frequency domain guided attention, the model focuses on key regional features in the spatial domain. In the frequency domain, we design a hybrid frequency domain transformation module (HFDT) that extracts real and imaginary features through Fourier transform to capture the global structure of the image. Meanwhile, we introduce a spatially guided frequency domain attention to enhance the discriminative capability of frequency domain features. Finally, we propose a cross-domain feature fusion (CDFF) module, which achieves bidirectional interaction and optimal fusion of spatial-frequency domain features through cross attention and adaptive feature fusion. Experimental results demonstrate that our method achieves significantly superior recognition accuracy compared to existing methods on the MSTAR dataset.

1. Introduction

Synthetic aperture radar (SAR), as an active microwave remote sensing imaging system, relies on its unique all-weather and day/night imaging capabilities to maintain stable imaging performance under complex environmental conditions. Therefore, it plays an irreplaceable role in application fields such as security reconnaissance, disaster monitoring, marine monitoring, and resource exploration.
In the development of SAR automatic target recognition (ATR) technology, researchers have successively proposed various recognition methods. Early template matching methods mainly relied on manually designed feature extraction operators to achieve recognition by comparing the similarity between target features and a sample library [1,2,3]. Although such methods have advantages such as intuitive algorithm principles and simple implementation, they have three fundamental defects. Firstly, it is necessary to build a large-scale sample library that covers various imaging conditions and target poses, resulting in high data acquisition costs. Secondly, extracted features struggle to effectively cope with the speckle noise and pose variations unique to SAR images, resulting in poor robustness. Thirdly, traditional methods are unable to accurately model the complex nonlinear relationship between target features and imaging conditions [4]. These limitations seriously restrict the application effect and recognition performance of template matching methods in actual complex scenarios.
In recent years, the rapid development of deep learning technology is reshaping the technological landscape of SAR ATR. Deep learning methods, represented by convolutional neural network (CNN) and Transformer [5,6,7,8], have enabled a paradigm shift from data-driven to knowledge-driven approaches by constructing multi-layer neural network architectures. These networks adopt an end-to-end training approach, enabling them to automatically learn the complete mapping relationship from low-level signal features to high-level semantics. In the feature extraction stage, shallow-layer networks capture low-level features such as target scatter point distributions and edge contours through local receptive fields; middle-layer networks gradually fuse local features to form more discriminative part-level representations; while deep-layer networks establish structured semantic expressions of targets through global feature integration [9]. The features of different scales endow the model with strong nonlinear modeling capabilities, enabling it to adaptively handle complex interference factors existing in SAR images, such as speckle noise, target occlusion, and pose changes. Meanwhile, the exploratory applications of new architectures such as Graph Neural Network (GNN) [10,11,12] and Spiking Neural Network (SNN) [13,14,15], as well as the introduction of cutting-edge technologies like multimodal data fusion and meta-learning, are continuously expanding the technical boundaries of SAR ATR [16,17,18]. With the rapid development of SAR ATR and the continuous expansion of application scenarios, SAR ATR is facing increasingly severe challenges. How to break through the existing technical bottlenecks and achieve fast and accurate recognition of multiple types of targets in SAR images under complex scenarios has become one of the most challenging frontier research topics in the remote sensing field.
In order to improve the accuracy of target recognition, scholars have proposed different methods. Su proposed an SAR target recognition method based on multi-level deep feature adaptive weighted decision fusion [19]. Li has proposed a forward modeling method for the scattering center (SC) model of coated targets on rough ground, which is specifically tailored for remote sensing and target recognition applications [20]. Lin designed a visualization method to analyze and highlight the role of polarization elements and proposed a simple polarization-related feature for target recognition [21]. Ding proposed an SAR ATR method based on the three-dimensional scattering center model, which provides a complete target description [22]. To improve small ship target detection, Guan presents an optimized YOLO network designed to enhance accuracy for small objects [23]. However, the aforementioned data-driven methods usually focus on features in the spatial domain while neglecting relevant characteristics in the frequency domain. Qu proposed a dual-domain network that jointly utilizes spatial and frequency domain features for SAR change detection tasks. However, due to the lack of dynamic interaction mechanisms for cross-domain features, it only achieves fusion through simple feature concatenation or linear weighting, leaving room for improvement in recognition performance [24].
To address above challenges, we propose a dual-branch spatial-frequency domain fusion recognition method with cross-attention. In the spatial domain, we propose an enhanced multi-scale feature extraction (EMFE) module, which adopts a parallel convolution structure of 1 × 1, 3 × 3, and 5 × 5 to achieve multi-level feature extraction and effectively capture spatial information of different scales. Meanwhile, we design a frequency domain guided attention mechanism, which converts spatial features into frequency domain representations through fast Fourier transform (FFT) and generates attention maps, enabling the network to adaptively focus on key spatial regions. Next, by combining CBAM and residual connections, the importance of different channels is dynamically calibrated, and the problems of gradient vanishing and network degradation are reduced. In the frequency domain, we propose the hybrid frequency domain transform (HFDT) module, which extracts real and imaginary features through an orthonormal two-dimensional FFT. Meanwhile, we introduce a spatial domain guided attention mechanism, which uses the original spatial features to generate attention maps to modulate the frequency domain features, effectively maintaining the correspondence between the frequency domain features and the spatial structure. Next, by using frequency domain self-attention mechanism and residual connection, the interference of low and high frequency information mixing is effectively solved, enhancing the expression ability of frequency domain features on the main structure. Finally, we constructed a cross-domain feature fusion module (CDFF), which uses cross attention to establish dynamic associations between dual domain features. Spatial features provide semantic guidance for frequency-domain components, while frequency-domain features supplement structural constraints for spatial features. Efficient fusion is then achieved through bilinear projection and adaptive weighting, enhancing global representations while preserving spatial details.
The contributions of this study can be summarized as follows:
  • We propose a spatial-frequency domain fusion recognition method with cross attention, which solves the limitations of single-domain feature extraction, increases the amount of cross-domain feature information and achieves efficient cross-domain fusion recognition.
  • We propose an EMFE module and an HFDT module. The EMFE module employs a multi-branch parallel convolution structure to extract multi-scale local features in the spatial domain. To enhance key regional features, the HFDT module provides a frequency-domain attention weight, improving the distinguishability of spatial features. Furthermore, the HFDT module extracts global structural features in the frequency domain, compensating for the limited receptive field of spatial-domain feature extraction. To align with the spatial domain features, the EMFE provides a spatial-domain attention weight, reducing the problem of feature inconsistency across domains.
  • We propose a cross-domain feature fusion (CDFF) module that employs a cross-attention mechanism, bilinear projection, and adaptive fusion. Through bidirectional cross-domain attention interaction, the CDFF module achieves complementary fusion of spatial-domain detail features and frequency-domain global features. This further enhances feature distinguishability and spatial-frequency domain alignment, significantly improving the model’s feature representation capability and achieving optimal cross-domain feature fusion.
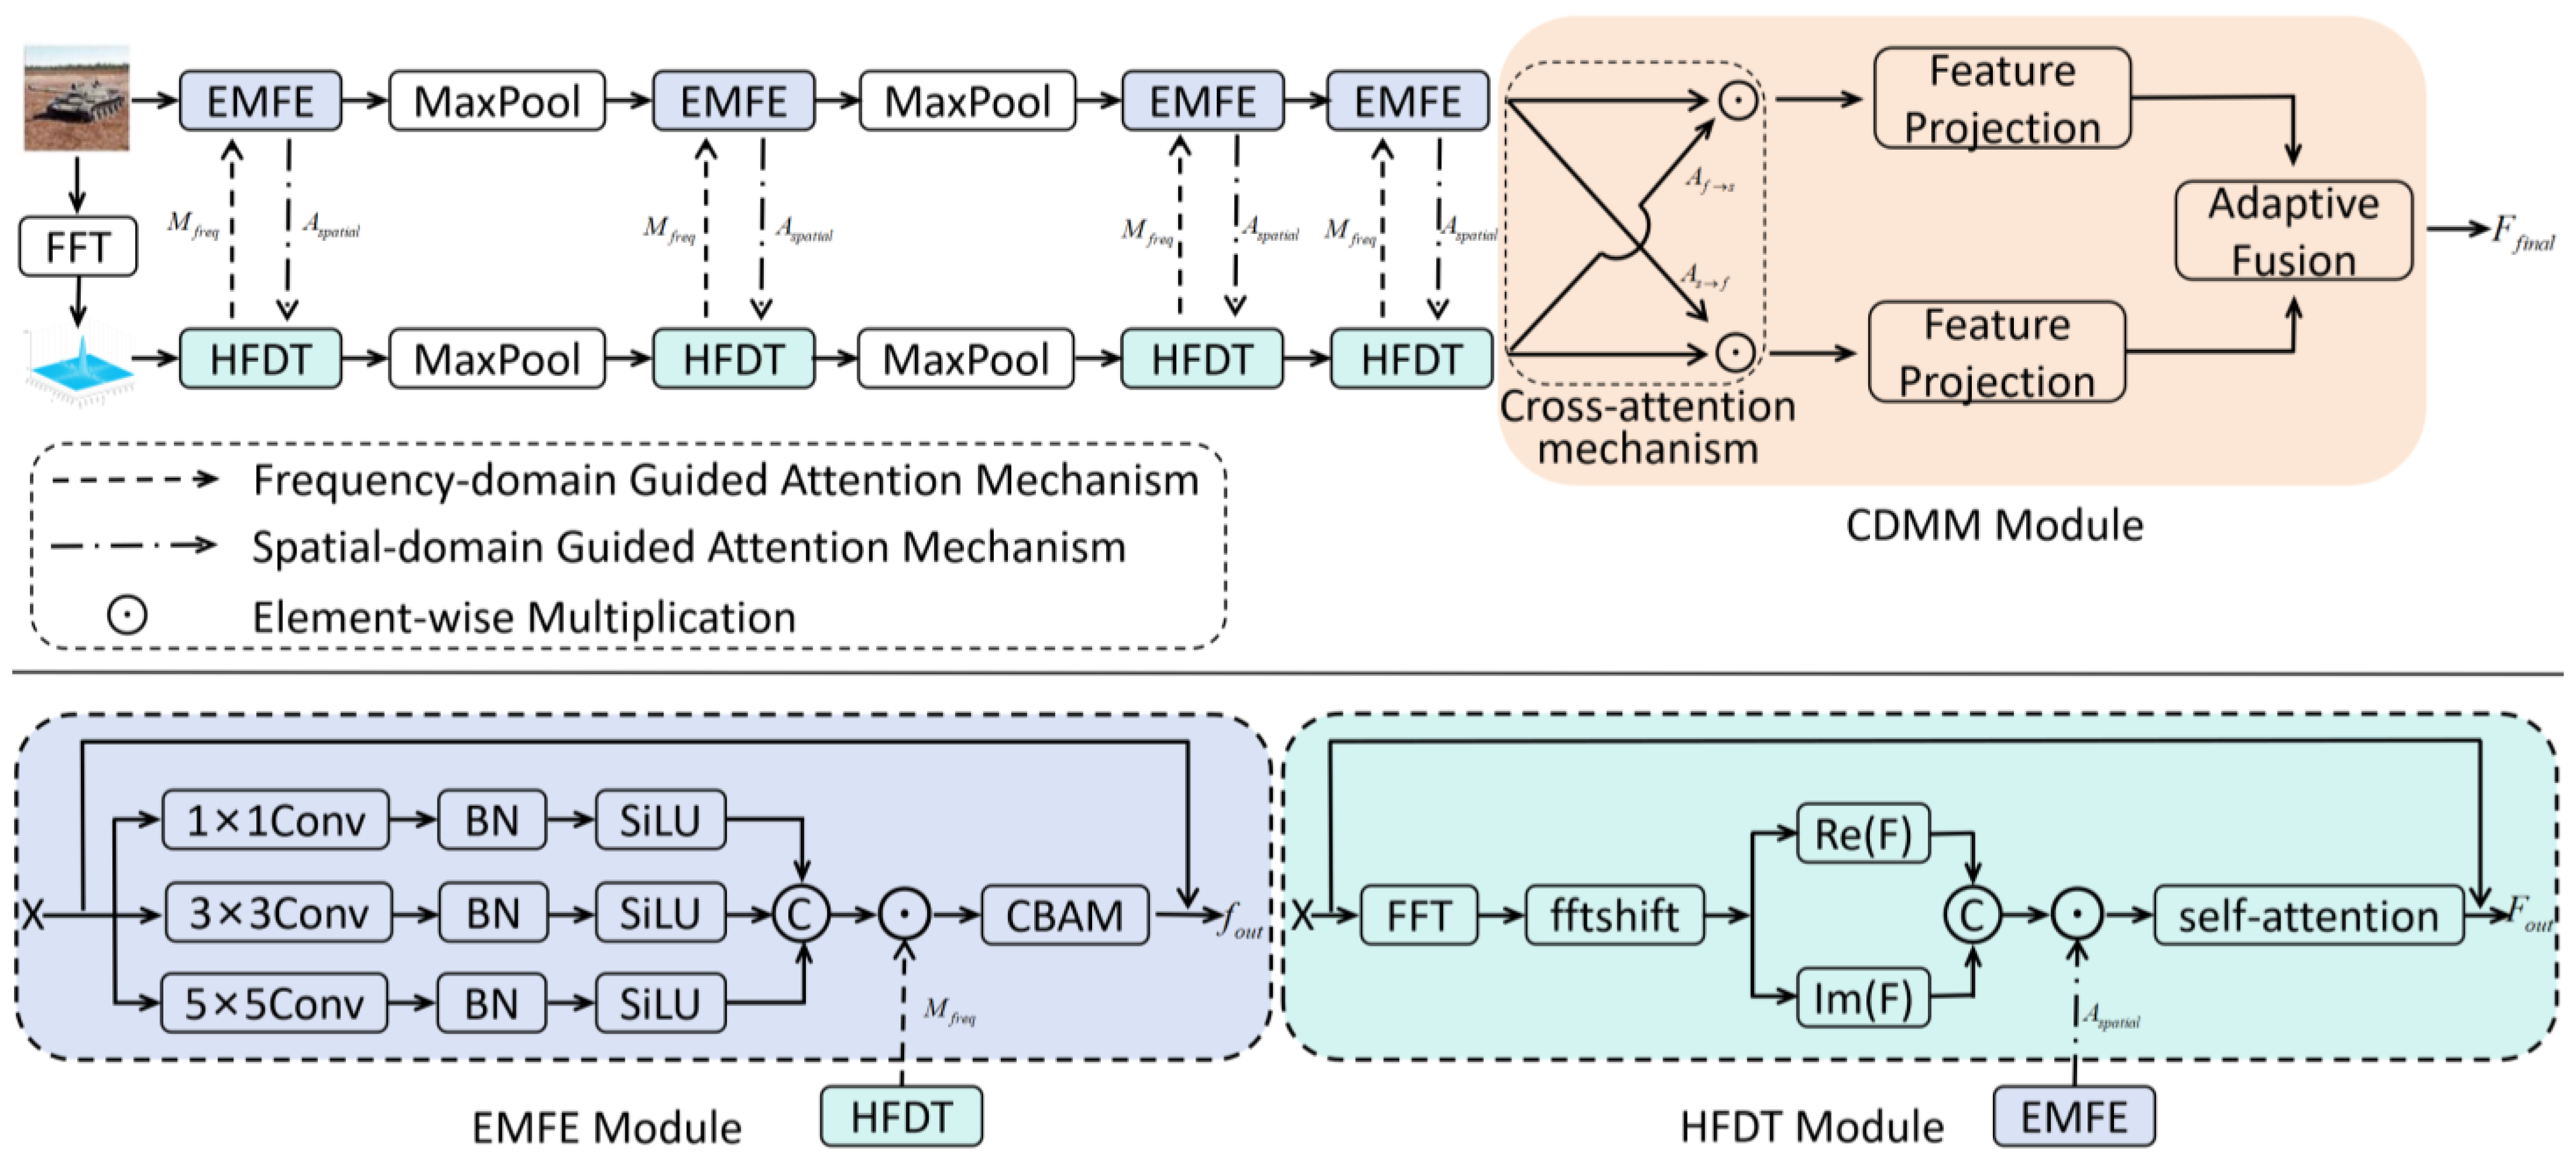
The remaining parts of this paper are organized as follows. Section 2 introduces the proposed method in this paper. Section 3 describes the experiments and results and then compares and analyzes the experimental results obtained by different methods. Section 4 summarizes this paper and discusses future research directions.

2. Proposed Method

In this section, we introduced the framework of the paper, which consists of three components: spatial domain feature extraction, frequency domain feature extraction and cross domain fusion module, as shown in Figure 1. Finally, we design a joint loss function to enhance the model’s ability to perceive inter-class differences, better distinguish samples of different categories, and reduce overfitting.

2.1. Spatial Domain Feature Extraction

To maximize the mining of spatial geometry and topological information from input data, we propose an EMFE module in the spatial domain. Then, we adopt an alternating stack of four-level EMFE modules and max-pooling layers. At each feature extraction stage, the number of channels follows an exponential growth (64 → 128 → 256 → 512), ensuring that the network gradually expands the receptive field and enhances semantic representation capabilities during down sampling process. The EMFE module integrates a multi-scale feature pyramid structure, frequency domain guided attention mechanism, CBAM, and deep residual connections, constructing a hierarchical and robust feature representation system.

2.1.1. Multi-Scale Feature Extraction

In order to obtain features from different receptive fields, we established a multi-scale parallel feature extraction method to achieve a hierarchical representation of spatial features in SAR images. Specifically, the input feature map X R C × H × W contains three parallel convolution structures.
  • Local detail feature extraction. It uses 1 × 1 convolution kernels to capture pixel-level local features, achieving fine-grained feature extraction and preserving local detail information of the target.
f 1 ( x ) = S i L U ( B N ( W 1 X ) )
where W 1 R C o u t / 4 × C × 1 × 1 is a learnable weight, B N ( ) is batch normalization, S i L U ( ) is the activation function
2.
Medium scale feature extraction. It employs 3 × 3 depthwise separable convolution to extract region-level features, constructing feature representations with medium receptive fields [25]. This balances local details with contextual information while reducing computational complexity, effectively capturing the spatial correlations between target components. As shown in Figure 2.
f 3 ( x ) = S i L U ( B N ( P W ( W 3 p w D W ( W 3 d w X ) ) ) )
where D W ( ) is depth convolution and P W ( ) is point convolution. W 3 d w R C × 1 × 3 × 3 depth convolution weight and W 3 p w R C o u t / 2 × C × 3 × 3 is point wise convolution weight.
3.
Global contextual feature extraction. It uses 5 × 5 standard convolutions to construct a feature extraction path with large receptive fields, capturing the overall geometric morphology and spatial layout features of the target. This approach establishes global contextual relationships, suppresses local interference from speckle noise, and reduces the computational complexity of large convolution kernels.
f 5 ( x ) = S i L U ( B N ( W 5 x ) )
where W 5 R C o u t / 4 × C × 5 × 5 .
The features of various scales extracted are concatenated along the channel dimension to form multi-scale fusion features.
f m u l t i ( x ) = C o n c a t ( f 1 ( x ) , f 3 ( x ) , f 5 ( x ) ) R C o u t × H × W

2.1.2. Frequency Domain Guided Attention

To address the limitations of traditional attention mechanisms in modeling long-range dependencies and preserving high frequency detailed information, we propose a frequency guided attention mechanism that enables the model to dynamically focus on spatial regions corresponding to critical frequency components across different scenarios.
We perform Fourier transform on the input feature map X , concatenate the real and imaginary components as frequency domain representations, and construct a frequency domain feature map. This process fully preserves the amplitude and phase characteristics of the frequency domain information, jointly forming a complete complex frequency domain feature representation, thereby addressing the loss of high frequency detailed information in traditional attention mechanisms.
F X = f f t s h i f t ( F F T ( X ) )
F f r e q = C o n c a t ( Re ( F X ) , Im ( F X ) )
where Re ( ) is the real part of the transformed result, and Im ( ) is the imaginary part of the transformed result. f f t s h i f t ( ) can eliminate numerical imbalances caused by energy differences across frequency bands.
To effectively map frequency domain information to spatial attention weights, we design a lightweight feature transformation network. Firstly, we compress and reduce the dimensionality of the high-dimensional frequency domain features to extract the most discriminative frequency components. Then, through nonlinear activation functions and pointwise convolutions, we progressively restore the channel dimensions. Finally, a sigmoid function is applied to generate normalized spatial attention weights.
M f r e q = S i g m o i d ( W f S i L U ( W f F f r e q ) )
where W f R C r e d × 2 C × H × W represents the dimensionality reduction convolution kernel, which compresses the concatenated frequency domain features F f r e q R 2 C × H × W into a low dimensional space R C r e d × H × W . This approach not only reduces computational overhead but also extracts abstract representations of the frequency-domain features, effectively filtering out high-frequency noise. W f R C × C r e d × H × W is the reconstruction convolution kernel, restoring the compressed features to the original number of channels and generating attention weights M f r e q R C × H × W , thereby enhancing the model’s nonlinear expressive capacity.
By performing element-wise multiplication with the multi-scale spatial feature map f m u l t i ( x ) , M f r e q achieves frequency-domain semantic guidance for spatial features. This enables the network to adaptively adjust the weight allocation of spatial features based on frequency-domain distribution characteristics, enhancing the response of spatial regions associated with frequency-domain patterns. As a result, deep fusion and interaction of cross-domain information are achieved during the feature extraction stage.
f e n h a n c e d = f m u l t i M f r e q

2.1.3. Convolutional Block Attention Module (CBAM) and Residual Connection

Although the frequency domain guided attention enhances the perception of spatial features for global structure and frequency patterns, it lacks precise representation of the semantic correlation between feature channels and spatial details. To address these issues, we introduce the convolutional block attention module (CBAM) [26], enabling the network to focus more on information-rich channels. It dynamically calibrates the importance of different channels, suppresses redundant or low-contribution channels, and enhances discriminative feature channels.
M c = S i g m o i d ( M L P ( A v g P o o l ( f e n h a n c e d ) ) + M L P ( M a x P o o l ( f e n h a n c e d ) ) )
M s = S i g m o i d ( W s C o n c a t ( A v g P o o l ( f e n h a n c e d ) , M a x P o o l ( f e n h a n c e d ) ) )
where W s is the output weight, and the final weighted output feature is
f e n h a n c e d = M c M s f e n h a n c e d
where represents element wise multiplication.
To address the common issues of gradient vanishing and network degradation in the training of deep networks, we employ residual connections to establish cross-layer identity mapping paths. This approach enables direct information flow propagation, allowing deep networks to maintain training dynamics with or even superior to those of shallow networks.
f o u t = S i L U ( B N ( W g f e n h a n c e d ) ) + f ( X )
f ( X ) = X C = C o u t B N ( W t X ) o t h e r w i s e
where W g and W t is the weight. f ( X ) is the projection mapping of X , ensuring that the number of input and output channels is consistent.

2.2. Frequency Domain Feature Extraction

To explore the potential information of data in the frequency domain and complement the spatial domain network to improve the overall performance of the model, we propose a hybrid frequency domain transform module (MFDT) in the frequency domain. By designing an alternating stacked structure of four MFDT modules and max-pooling layers, we progressively compress the spatial dimensions while expanding the channel dimensions (64 → 128 → 256 → 512). This achieves a progressive improvement of feature abstraction while preserving the integrity of frequency domain information. The MFDT module includes frequency domain feature transformation, spatial domain guided attention, frequency domain self-attention, and residual connection, constructing a progressive representation from shallow frequency domain features to deep semantic features.

2.2.1. Frequency Domain Feature Transformation

To obtain frequency domain features, we input a feature map X R C × H × W (where C is the number of channels, H is the height, and W is the width). It performs a Fourier transform to obtain the frequency domain feature representation. The transformation formula is as follows:
F ( u , v ) = h = 0 H 1 w = 0 W 1 X ( h , w ) e j 2 π ( u h H + v w W )
where ( u , v ) is the frequency domain coordinate, u [ 0 , H 1 ] , v [ 0 , W 1 ] . Then, we adopt orthogonal normalization processing and perform spectrum centralization:
F s h i f t e d ( u , v ) = f f t s h i f t ( F ( u , v ) )
The output results include both the real part Re ( F s h i f t e d ) and the imaginary part Im ( F s h i f t e d ) as two orthogonal components, which together form a complete representation of frequency domain information. The real part mainly reflects the even-symmetry characteristics of the signal, corresponding to the cosine projection of frequency domain components; while the imaginary part characterizes the odd-symmetry properties of the signal, embodying the sine projection components. Using only a single component will lead to severe loss of frequency-domain information and fail to ensure transform invertibility. Therefore, we adopt a strategy of concatenating real and imaginary components, converting complex-number operations into conventional convolution operations in the real number domain.
F c a t = C o n c a t ( Re ( F s h i f t e d ) , Im ( F s h i f t e d ) ) R 2 C × H × W
To achieve efficient encoding and nonlinear representation of complex spectral features, we perform 1 × 1 convolution transformation on the concatenated features, mapping the 2C-dimensional complex features into C-dimensional space.
F t r a n s = S i L U ( B N ( C o n v 1 × 1 ( F c a t ) ) )

2.2.2. Spatial Domain Guided Attention

To enhance the ability of frequency domain features to perceive spatial structure information and avoid the loss of spatial location information that may be caused by pure frequency domain processing, we adopt a spatial domain guided attention mechanism, which effectively solves the problem of missing spatial domain contextual information in traditional frequency domain processing methods.
We perform multi-layer convolutional transformations to the spatial domain features X . Through 1 × 1 convolution, we compress the channel dimension and introduce nonlinearity via an activation function. Subsequently, we expand the channels back to the same dimension as the frequency domain feature using another 1 × 1 convolution. Finally, we apply the sigmoid function to generate the spatial guided attention weights.
A s p a t i a l = S i g m o i d ( C o n v 1 × 1 ( S i L U ( C o n v 1 × 1 ( X ) ) ) )
These weights are element-wise multiplied with the frequency-domain features, enabling the model to focus on spatially relevant regions when capturing frequency components. This establishes a cross-domain spatial-frequency correspondence, thereby enhancing the frequency features’ ability to represent target structures in the image.
F g u i d e d = F t r a n s A s p a t i a l

2.2.3. Frequency Domain Self-Attention and Residual Connection

To suppress irrelevant noise and redundant information, we introduce frequency domain self-attention mechanism, which effectively solves the interference of high-frequency noise and enhances the expression ability of frequency domain features on the main structure.
We generate self-attention weights through a two-layer convolutional network. The first convolutional layer compresses channel dimensions while introducing SiLU activation to enhance nonlinearity. The second convolutional layer restores the original channel dimensions, followed by a sigmoid function that normalizes the weights to the (0,1) range to produce the final self-attention weights.
A f r e q = S i g m o i d ( C o n v 1 × 1 ( S i L U ( C o n v 1 × 1 ( F g u i d e d ) ) ) )
Next, the weights A f r e q are channel-wise multiplied with the frequency-domain features, then combined with the original features F g u i d e d via residual connection to produce the final output.
F o u t = F g u i d e d A f r e q + f ( x )
f ( x ) = X C = C o u t B N ( W q X ) o t h e r w i s e

2.3. Cross Domain Feature Fusion Module

Spatial domain and frequency domain representations each have unique advantages and limitations. Spatial features focus on local structures and detailed textures, but they are sensitive to noise and difficult to model global dependencies. Frequency domain features capture global frequency distributions and periodic patterns, yet they may lose some spatial local information. To integrate the dual representational advantages of spatial and frequency domains while overcoming the inherent limitations of single domain representations, we propose a cross-domain feature fusion (CDFF) module. The CDFF module includes cross attention mechanisms, dual domain feature projection, and adaptive feature fusion, effectively mitigating the limitations of single domain representations while enhancing the model’s discriminative capability for key regional features. As shown in Figure 3.

2.3.1. Cross Attention Mechanisms

To reduce the feature bias of single-domain guided attention in the past and enhance cross-domain feature alignment, we designed a cross-attention mechanism in CDFF module to achieve interactive guidance between spatial and frequency domain features. We generate cross-domain attention weights for the spatial domain output feature f o u t and frequency domain output feature F o u t through two layers of convolution with dimensionality reduction followed by dimensionality expansion, establishing cross-domain correlations. By integrating the SiLU function with the Sigmoid output constraint, we precisely model the mapping relationship between local textures in the spatial domain and global features in the frequency domain.
A s f = S i g m o i d ( W b ( S i L U ( W a F o u t ) ) )
A f s = S i g m o i d ( W d ( S i L U ( W c f o u t ) ) )
where W a R C o u t / 8 × C o u t and W c R C o u t / 8 × C o u t are the weight of dimensionality reduction convolution. W b R C o u t × C o u t / 8 and W d R C o u t × C o u t / 8 are the weight of the dimensionality expansion convolution.
Then, the weights are element-wise multiplied with the original output features to achieve feature recalibration.
F s = F s A f s
F f = F f A s f

2.3.2. Dual Domain Feature Projection

To reduce the computational load, the original high-dimensional features are mapped into the same low-dimensional space through parallel dimensionality reduction projection. This approach not only preserves the discriminative features of each domain but also achieves compactness in feature expression.
F s ^ = B N ( S i L U ( C o n v 1 × 1 ( F s ) ) )
F f ^ = B N ( S i L U ( C o n v 1 × 1 ( F f ) ) )
where C o n v 1 × 1 represents a channel adjustment convolution that compresses the number of channels to half of the original, thereby reducing the computational complexity.

2.3.3. Adaptive Feature Fusion

We employ a multi-stage feature fusion approach to achieve effective cross-domain feature integration: First, the compressed cross-domain features are concatenated along the channel dimension, then processed through a fusion network consisting of 3 × 3 convolutions, batch normalization (BN), and SiLU activation functions for nonlinear feature transformation and deep fusion.
F f u s e d = D r o p o u t ( B N ( S i L U ( C o n v 3 × 3 ( C o n c a t ( F s ^ , F f ^ ) ) ) ) )
Next, we introduce a collaborative architecture of residual connections and gating mechanisms. This architecture achieves a balance between computational efficiency and feature calibration capability through a carefully designed double-layer 1 × 1 convolution, which first reduces the channel dimension to C o u t / 4 and then restores it to C o u t .
F f i n a l = F f u s e d + F f u s e d S i g m o i d ( C o n v 1 × 1 ( S i L U ( C o n v 1 × 1 ( F f u s e d ) ) ) )
Ultimately, the model transforms the high-dimensional features, which have undergone multi-level feature extraction and deep fusion, through a fully connected layer via linear transformation. Combined with nonlinear activation functions and Dropout regularization, it maps these features into the probability distribution space of the target categories. The output is converted into class probability distributions via the softmax function, enabling end-to-end classification tasks.

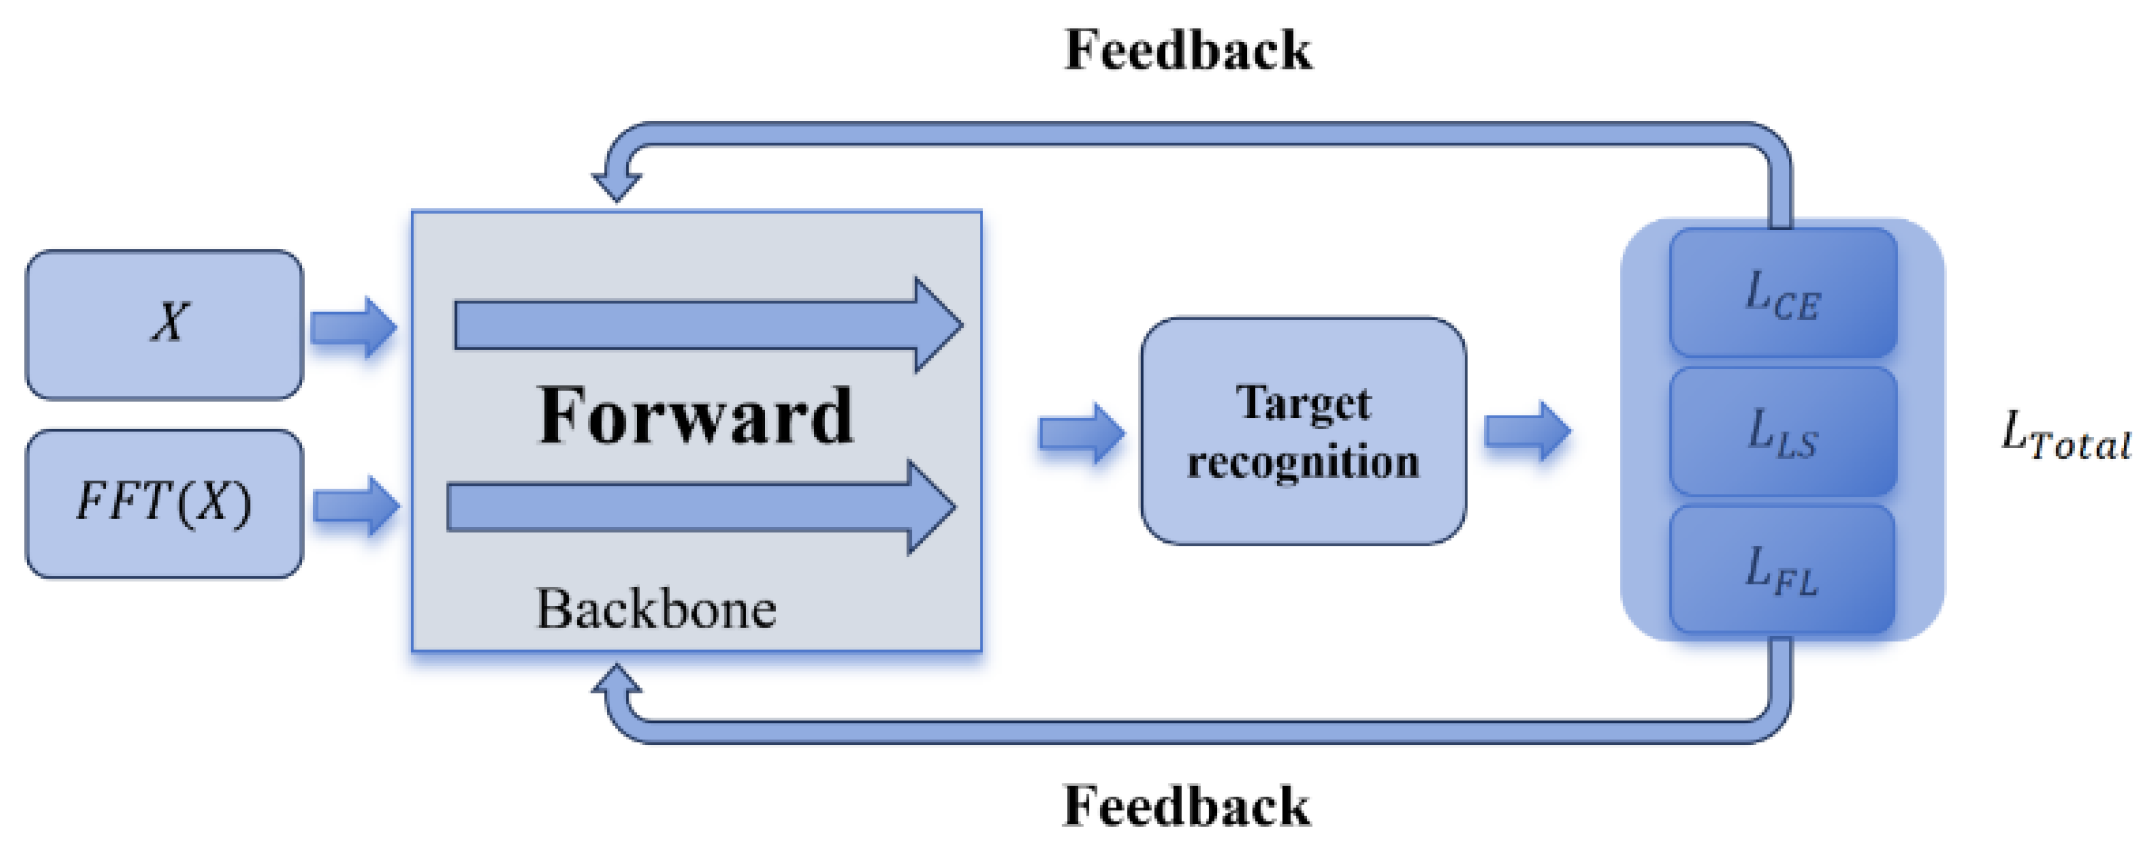
2.4. Joint Loss Function

To enhance the model’s discriminative ability for complex samples, we design a joint loss function that combines cross entropy loss, label smoothing cross entropy loss, and focal loss [27]. The joint loss function enhances the model’s robustness against difficult samples and class imbalance issues while maintaining classification accuracy by weighted combination of three loss functions. As shown in Figure 4.
1.
Cross entropy loss ( L C E ). It is used to measure the difference between the predicted probability distribution and the true label distribution.
L C E = i = 1 C y i log ( p i )
where C is the number of categories, y i is the encoding of the true label, and p i is the probability of the category predicted by the model.
2.
Label smoothing cross entropy loss ( L L S ). Label smoothing is a regularization technique that prevents the model from overfitting by adding some noise to the true labels. Specifically, when calculating the cross-entropy loss, the label smoothing cross entropy loss replaces the true label y i with a smoothed label y i L S
y i L S = 1 ε + ε C i = t ε C o t h e r w i s e
where ε [ 0 , 1 ] , C is the number of categories.
L L S = i = 1 C y i L S log ( p i ) = ( 1 ε ) L C E + ε L U
L U = 1 C i = 1 C log ( p i )
where L U is a uniform distribution penalty term, which encourages the model to maintain moderate prediction probabilities for all categories.
3.
Focal loss ( L F L ). It reduces the loss contribution of easy-to-classify samples by introducing an adjustable focusing parameter, thereby enhancing the model’s attention to difficult-to-classify samples.
L F L = α t ( 1 p t ) δ log ( p t )
where p t is the model’s predicted probability for the true class, δ is the modulation parameter, and α t is the class weight used to balance the losses of different categories.
The joint loss function L T o t a l combines the above three loss functions and obtains the final loss through the method of weighted summation.
L T o t a l = α L C E + β L L S + γ L F L
where we set the initial weights as α = 0.7, β = 0.2, and γ = 0.1, and obtained the final weights through experiments.

3. Experiment and Discussion

To systematically evaluate the effectiveness of the proposed method, we perform comprehensive experimental validation. First, we introduce the MSTAR dataset used in the experiment. Next, we provide complete specifications of the experimental setup and implementation details. Then, the superiority of this method is proved through comparative experiments with existing methods. Finally, the contributions of each module are deeply analyzed through carefully designed ablation experiments, thereby comprehensively validating the effectiveness of the proposed method.

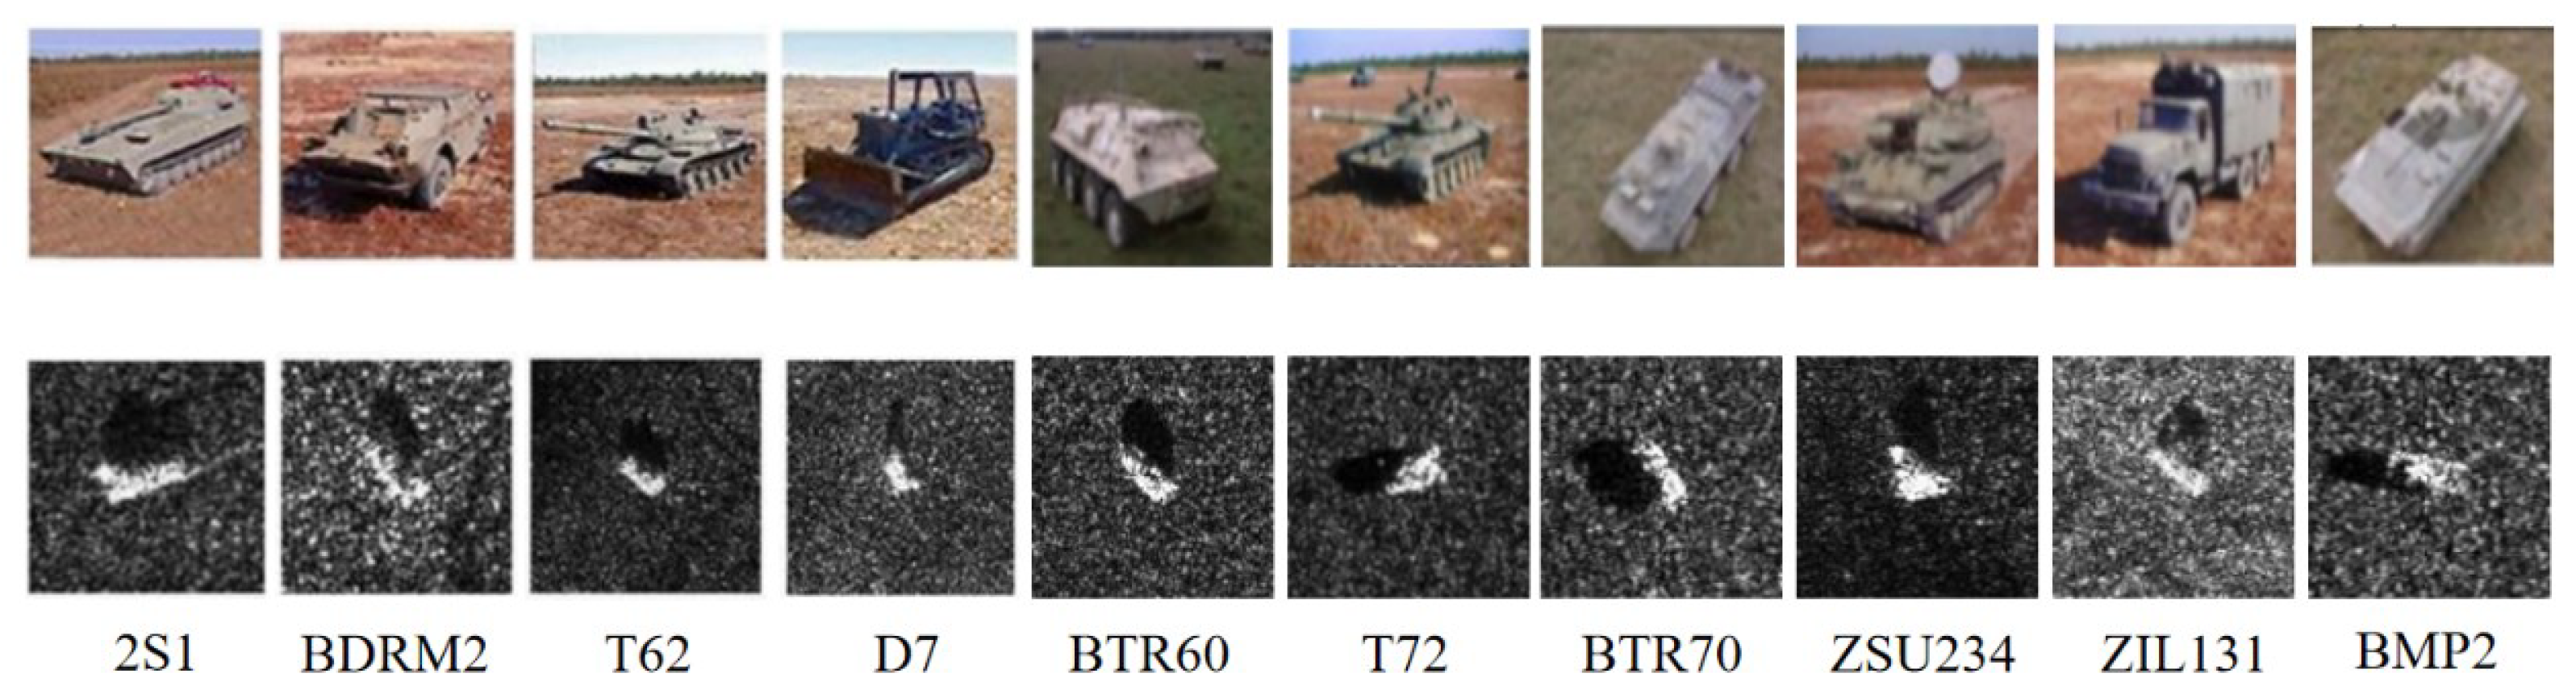
3.1. Dataset Introduction

The MSTAR dataset [28], developed by Sandia National Laboratories in the United States, is a SAR image dataset. It has become one of the most authoritative datasets in the field of SAR ATR. It systematically collects SAR image data of 10 types of typical military vehicles, covering various important military targets such as main battle tanks, self-propelled rocket launchers, and armored bulldozers. All data were acquired under various practical scenarios, exhibiting the following distinctive characteristics: (1) full-angle coverage with an azimuth range of 0° to 360°; (2) multi-condition design, encompassing standard operating conditions (SOC) and three extended operating conditions (EOC-D, EOC-C and EOC-V), which, respectively, address practical factors such as varying elevation angles, target configurations, and version changes; (3) diverse background environments. The optical and SAR images of ten types of targets in the MSTAR dataset are shown in Figure 5. The distribution of data for each class in the MSTAR is shown in Table 1.
To verify the robustness of the proposed method, we conducted experiments using EOC data from the MSTAR dataset, which features more complex imaging conditions. EOC includes three different data configurations: EOC-D, EOC-C, and EOC-V. EOC-D captures SAR images at a 30-degree pitch angle. EOC-C data refers to SAR images collected from changes in vehicle appearance. EOC-V is SAR images acquired for the same target but with different models. Table 2 shows the distribution of EOC data.
We use PyTorch 2.0 and an NVIDIA A100 GPU with CUDA 11.8 acceleration. We also adopt the Adam optimizer with momentum (learning rate = 0.001, momentum = 0.9, weight decay = 5 × 10⁻⁴). The number of epochs is set to 200, the batch size is 16, and the input images are uniformly resized to 64 × 64. In addition, we will implement a learning rate decay strategy (step = 10, gamma = 0.1).
To comprehensively evaluate the recognition performance of the proposed algorithm, we calculated the experimental results based on various metrics, particularly accuracy, precision, recall, and F1-score [29]. Their calculations are as follows:
A c c u r a c y = T P + T N T P + T N + F P + F N
P r e c i s i o n = T P T P + F P
R e c a l l = T P T P + F N
F 1 = 2 × P r e c i s i o n × R e c a l l P r e c i s i o n + R e c a l l
where TP (True Positive) represents the positive samples that the model correctly predicts as positive. TN (True Negative) represents the negative samples that the model correctly predicts as negative. FP (False Positive) represents the negative samples that the model incorrectly predicts as positive. FN (False Negative) represents the positive samples that the model incorrectly predicts as negative. They evaluate the model’s recognition performance from different perspectives. Accuracy represents the proportion of correctly classified samples in the total samples, which measures the overall classification precision of the model. Precision refers to the ratio of samples predicted as positive by the model to those that are actually positive, reflecting the model’s accuracy in predicting positive classes. Recall is the proportion of correctly predicted positive samples, assessing the model’s coverage capability for positive samples. The F1-score, the harmonic mean of precision and recall, provides a comprehensive evaluation of the model’s performance.

3.2. Comparison Experiment

To comprehensively evaluate the performance advantages of the proposed method, we have meticulously designed a multi-dimensional comparison scheme. It includes not only representative classic convolutional neural networks such as VGG16 [30], GoogLeNet [31], and ResNet18 [32] but also the latest proposed SAR target recognition algorithms such as NLCANet [33] and MIDFF [34]. MIDFF employs a multi-perspective feature fusion network that effectively enhances recognition performance under limited data conditions by extracting inter-class discriminative features and intra-class similarity features, followed by their fusion with multi-view features. NLCANet is a semantically augmented multi-view fusion algorithm that employs a joint learning strategy to simultaneously optimize view-specific loss terms, semantic regularization loss terms, and view-semantic coupling loss terms. Through alternating iterations, it obtains optimal sparse coding representations and ultimately accomplishes recognition tasks based on the principle of reconstruction error minimization. DDNet [24] is a dual-domain network, which jointly exploits the spatial and frequency features for SAR change detection task. DBTF [35] is a dual-branch feature extraction and fusion architecture based on transformer, including significant feature extraction (SFE), global feature extraction (GFE), and dual-branch feature fusion (D-BFF). For performance evaluation, we employ four key metrics: Recall, Precision, F1-score, and Accuracy, to conduct a comprehensive assessment of the model’s performance.
Table 3 presents the experimental comparison results. The proposed method achieves significant improvements in all evaluation metrics, with the accuracy reaching 99.90%, which is 0.2 percentage points higher than that of the second-best method. These experimental results not only verify the effectiveness of the proposed method but more demonstrate its technical superiority in feature extraction and classification discrimination across multiple dimensions, providing a novel solution for enhancing SAR target recognition performance.
Table 4 presents the recognition rates of the proposed method for different categories of targets under SOCS. The results show that each category can achieve a high recognition rate, fully demonstrating the excellent recognition performance of the proposed method under SOCS.
Table 5 shows the recognition rates of all subtypes and the average values for each category under EOCs conditions. The average recognition rate of EOC-D is 97.68%, the average recognition rate of EOC-V is 98.11%, and the average recognition rate of EOC-C is 99.11%. Among them, the recognition rate of EOC-D is relatively low because the pitch angle of EOC-D imaging is 30°, while that of the training set is 17°. The difference in image angles between the training set and the test set leads to significant variations in SAR image features, resulting in relatively low recognition performance
Table 6 presents the average recognition rates of our method and other methods under EOCs conditions. The experimental results demonstrate that the recognition rates of different methods vary across scenarios. Our method achieves recognition rates of 97.68%, 98.11%, and 99.11% in EOC-D, EOC-V, and EOC-C, respectively, exhibiting significantly superior overall performance compared to other methods.

3.3. Ablation Experiment

To comprehensively verify the robustness and effectiveness of the method, this section systematically evaluates the performance of the proposed method in ablation experiments under SOCs. In the ablation experiments, V1 denotes the experimental results using only the spatial domain with frequency-domain guided attention mechanism, V2 represents the results with only the frequency domain with spatial-domain guided attention mechanism, V3 indicates the results incorporating both spatial and frequency domains but without the cross-domain fusion module, where features were directly concatenated, and V4 corresponds to the complete spatial-frequency fusion framework. As shown in Table 7, the ablation experiment results in the MSTAR dataset under different configurations are presented.
The experimental results in Table 7 demonstrate that the proposed method achieves superior recognition performance on the MSTAR dataset, which primarily benefits from the dataset’s abundant sample size and comprehensive target feature coverage that effectively enhance the model’s feature representation capability. The single-domain feature experiments achieved recognition rates of 97.36% for the spatial domain (V1) and 95.15% for the frequency domain (V2), respectively. When employing concatenated spatial and frequency domain features (V3), the recognition performance was further improved to 98.68%, validating the effectiveness of multi-domain feature complementarity. Building upon V3 with the incorporation of a cross-domain feature fusion (CDFF) module, the complete spatial-frequency fusion model (V4) achieves an outstanding recognition rate of 99.90%. From Version V1 to V4, the misrecognition rate of BMP2 has persisted, mainly due to two reasons: first, BMP2 and other armored vehicles such as BTR70 and T72 have inherent structural similarities in SAR images, resulting in similar distributions of scattering centers; second, the specific speckle noise in SAR images will interfere with the recognition process and mask the subtle distinguishing features. Nevertheless, the stable performance of our method under different configurations fully demonstrates its excellent robustness.
Figure 6 presents the t-SNE visualization results and confusion matrix using four configurations (V1, V2, V3, and V4) on the MSTAR dataset. The t-SNE plots of spatial domain V1 and frequency domain V2 exhibit significant overlapping distributions among sample points from different classes, indicating relatively poor clustering performance. The joint use of the spatial domain network and the frequency domain network significantly improves the clustering performance of V3. Finally, after adding the CDFF module, the t-SNE visualization of V4 shows that samples of various categories form clear independent clusters, and the misrecognition rate in the confusion matrix is also significantly reduced.

4. Conclusions

A dual-branch spatial-frequency domain fusion recognition method with cross-attention is proposed in the paper. In the spatial domain, we propose an enhanced multi-scale feature extraction module (EMFE), which adopts a multi-branch parallel structure to effectively enhance the network’s multi-scale feature representation capability. Combining frequency domain guided attention, the model focuses on key regional features in the spatial domain. In the frequency domain, we design a hybrid frequency domain transformation module (HFDT) that extracts real and imaginary features through fast Fourier transform (FFT) to capture the global structure of the image. Meanwhile, we introduce a spatially guided frequency domain attention to enhance the discriminative capability of frequency domain features. Finally, we propose a cross-domain feature fusion (CDFF) module, which achieves bidirectional interaction and optimal fusion of spatial-frequency domain features through cross attention and adaptive feature fusion. Experimental results demonstrate that our method achieves significantly superior recognition accuracy compared to existing methods on the MSTAR dataset.
Although this method has achieved good recognition results, there are still some issues to be further studied. We can further optimize frequency domain feature extraction and we explore how to more effectively extract target features when facing some small sample datasets. Therefore, in the subsequent work, we will adopt the same design philosophy to experimentally verify different methods for networks with small sample datasets.

Author Contributions

Conceptualization, C.L. and J.N.; methodology, C.L.; software, D.W.; validation, D.W., Y.L. and Q.Z.; formal analysis, C.L.; investigation, J.N.; resources, J.N.; data curation, C.L.; writing—original draft preparation, C.L.; writing—review and editing, J.N.; visualization, C.L.; supervision, Y.L.; project administration, Q.Z.; funding acquisition, Y.L. All authors have read and agreed to the published version of the manuscript.

Funding

This work was supported by the National Natural Science Foundation of China under Grant 62131020 and 62301599, Natural Science Foundation of Shaanxi Province under Grant 2025JC-YBMS-709, and Key Research Project of Natural Science for Anhui Provincial Universities under Grant 2024AH051858.

Data Availability Statement

The dataset used in this study is available at https://github.com/waterdisappear/Data-Bias-in-MSTAR, (accessed on 10 May 2025): Discovering and Explaining the Non-Causality of Deep Learning in SAR ATR.

Conflicts of Interest

The authors declare no conflicts of interest.

References

  1. He, D.; Guo, W.; Zhang, T.; Zhang, Z.; Yu, W. Occluded target recognition in SAR imagery with scattering excitation learning and channel dropout. IEEE Geosci. Remote Sens. Lett. 2023, 20, 4005005. [Google Scholar] [CrossRef]
  2. Dong, Z.; Liu, M.; Chen, S.; Tao, M.; Wei, J.; Xing, M. Occluded SAR target recognition based on center local constraint shadow residual network. IEEE Geosci. Remote Sens. Lett. 2025, 22, 3532763. [Google Scholar] [CrossRef]
  3. Liu, Y.; Zhang, F.; Ma, L.; Ma, F. Long-tailed SAR target recognition based on expert network and intraclass resampling. IEEE Geosci. Remote Sens. Lett. 2023, 20, 4010405. [Google Scholar] [CrossRef]
  4. Chen, Z.; Zhao, L.; He, Q.; Kuang, G. Pixel-level and feature-level domain adaptation for heterogeneous SAR target recognition. IEEE Geosci. Remote Sens. Lett. 2022, 19, 4515205. [Google Scholar] [CrossRef]
  5. Sun, S.K.; He, Z.; Fan, Z.H.; Ding, D.Z. SAR Image target recognition using diffusion model and scattering information. IEEE Geosci. Remote Sens. Lett. 2024, 21, 4017505. [Google Scholar] [CrossRef]
  6. Li, Y.; Wan, C.; Zhou, X.; Tang, T. Small-sample SAR target recognition using a multimodal views contrastive learning method. IEEE Geosci. Remote Sens. Lett. 2025, 22, 4007905. [Google Scholar] [CrossRef]
  7. Chen, H.; Du, C.; Zhu, J.; Guo, D. Target-aspect domain continual learning for SAR target recognition. IEEE Trans. Geosci. Remote Sens. 2025, 63, 5205514. [Google Scholar] [CrossRef]
  8. Guo, S.; Chen, T.; Wang, P.; Yan, J.; Liu, H. TSMAL: Target-shadow mask assistance learning network for SAR target recognition. IEEE J. Sel. Top. Appl. Earth Obs. Remote Sens. 2024, 17, 18247–18263. [Google Scholar] [CrossRef]
  9. Yu, X.; Dong, F.; Ren, H.; Zhang, C.; Zou, L.; Zhou, Y. Multilevel adaptive knowledge distillation network for incremental sar target recognition. IEEE Geosci. Remote Sens. Lett. 2023, 20, 4004405. [Google Scholar] [CrossRef]
  10. Ren, H.; Dong, F.; Zhou, R.; Yu, X.; Zou, L.; Zhou, Y. Dynamic embedding relation distillation network for incremental SAR automatic target recognition. IEEE Geosci. Remote Sens. Lett. 2024, 21, 4002105. [Google Scholar] [CrossRef]
  11. Hou, J.J.; Bian, Z.D.; Yao, G.J.; Lin, H.; Zhang, Y.H.; He, S.Y. Attribute scattering center-assisted SAR ATR based on GNN-FiLM. IEEE Geosci. Remote Sens. Lett. 2024, 21, 4009205. [Google Scholar] [CrossRef]
  12. Zhang, B.; Kannan, R.; Prasanna, V.; Busart, C. Accelerating GNN-Based SAR automatic target recognition on HBM-enabled FPGA. In Proceedings of the 2023 IEEE High Performance Extreme Computing Conference (HPEC), Boston, MA, USA, 25–29 September 2023; pp. 1–7. [Google Scholar]
  13. Wu, Y.; Wu, L.; Hu, T.; Xiao, Z.; Xiao, M.; Li, L. An efficient radar-based gesture recognition method using enhanced GMM and hybrid SNN. IEEE Sens. J. 2025, 25, 12511–12524. [Google Scholar] [CrossRef]
  14. Zhu, N.; Xi, Z.; Wu, C.; Zhong, F.; Qi, R.; Chen, H. Inductive conformal prediction enhanced LSTM-SNN network: Applications to birds and UAVs recognition. IEEE Geosci. Remote Sens. Lett. 2024, 21, 3502705. [Google Scholar] [CrossRef]
  15. Liu, S.; Yi, Y. Knowledge distillation between DNN and SNN for intelligent sensing systems on loihi chip. In Proceedings of the 2023 24th International Symposium on Quality Electronic Design (ISQED), San Francisco, CA, USA, 5–7 April 2023; pp. 1–8. [Google Scholar]
  16. Sun, Z.; Leng, X.; Lei, Y.; Xiong, B.; Ji, K.; Kuang, G. BiFA-YOLO: A novel YOLO-based method for arbitrary-oriented ship detection in high-resolution SAR images. Remote Sens. 2021, 13, 4209. [Google Scholar] [CrossRef]
  17. Zhang, X.; Zhang, S.; Sun, Z.; Liu, C.; Sun, Y.; Ji, K. Cross-sensor SAR image target detection based on dynamic feature discrimination and center-aware calibration. IEEE Trans. Geosci. Remote Sens. 2025, 63, 5209417. [Google Scholar] [CrossRef]
  18. Jia, L.; Ma, T.; Rong, H.; Al-Nabhan, N. Affective region recognition and fusion network for target-level multimodal sentiment classification. IEEE Trans. Emerg. Top. Comput. 2024, 12, 688–699. [Google Scholar] [CrossRef]
  19. Su, X. SAR Target recognition method based on adaptive weighted decision fusion of deep features. Recent Adv. Electr. Electron. Eng. 2024, 8, 803–810. [Google Scholar] [CrossRef]
  20. He, S.; Hua, M.; Zhang, Y.; Du, X.; Zhang, F. Forward modeling of scattering centers from coated target on rough ground for remote sensing target recognition applications. IEEE Trans. Geosci. Remote Sens. 2024, 62, 2000617. [Google Scholar] [CrossRef]
  21. Lin, H.; Wang, H.; Xu, F.; Jin, Y.Q. Target recognition for SAR images enhanced by polarimetric information. IEEE Trans. Geosci. Remote Sens. 2024, 62, 5204516. [Google Scholar] [CrossRef]
  22. Ding, B.; Zhang, A.; Li, R. A 3-D scattering centre model-based SAR target recognition method using multi-level region matching. Remote Sens. Lett. 2024, 15, 215–223. [Google Scholar] [CrossRef]
  23. Guan, T.; Chang, S.; Wang, C.; Jia, X. SAR small ship detection based on enhanced YOLO network. Remote Sens. 2025, 17, 839. [Google Scholar] [CrossRef]
  24. Qu, X.; Gao, F.; Dong, J.; Du, Q.; Li, H. Change detection in synthetic aperture radar images using a dual-domain network. IEEE Geosci. Remote Sens. Lett. 2022, 19, 4013405. [Google Scholar] [CrossRef]
  25. Xu, C.; Wang, Q.; Wang, X.; Chao, X.; Pan, B. Wake2Wake: Feature-guided self-supervised wave suppression method for SAR ship wake detection. IEEE Trans. Geosci. Remote Sens. 2024, 62, 5108114. [Google Scholar] [CrossRef]
  26. Zhao, S.; Zhang, Y.; Luo, Y.; Kang, Y.; Wang, H. Dynamically self-training open set domain adaptation classification method for heterogeneous SAR image. IEEE Geosci. Remote Sens. Lett. 2024, 21, 4003705. [Google Scholar] [CrossRef]
  27. Xu, C.; Wang, X. OpenSARWake: A large-scale SAR dataset for ship wake recognition with a feature refinement oriented detector. IEEE Geosci. Remote Sens. Lett. 2024, 21, 4010105. [Google Scholar] [CrossRef]
  28. Zhang, T.; Tong, X.; Wang, Y. Semantics-assisted multiview fusion for SAR automatic target recognition. IEEE Geosci. Remote Sens. Lett. 2024, 21, 4007005. [Google Scholar] [CrossRef]
  29. Lin, Q.; Sun, H.; Xu, Y.; Wang, J.; Ji, K.; Kuang, G. Combining local electromagnetic scattering and global structure features for SAR open set recognition. IEEE J. Sel. Top. Appl. Earth Obs. Remote Sens. 2025, 18, 12572–12587. [Google Scholar] [CrossRef]
  30. Sun, Z.; Leng, X.; Zhang, X.; Zhou, Z.; Xiong, B.; Ji, K. Arbitrary-direction SAR ship detection method for multiscale imbalance. IEEE Trans. Geosci. Remote Sens. 2025, 63, 5208921. [Google Scholar]
  31. Zhao, X.; Zhao, S.; Luo, Y.; Lv, B.; Zhang, Z. Generalizing SAR object detection: A unified framework for cross-source scenarios. IEEE Geosci. Remote Sens. Lett. 2025, 22, 4009105. [Google Scholar] [CrossRef]
  32. Saret, A.; Choudhury, T.; Aich, S.; Joshi, P.; Pant, B.; Choudhury, T. Butterfly image classification using modification and fine-tuning of ResNet18. In Proceedings of the 2024 OPJU International Technology Conference (OTCON) on Smart Computing for Innovation and Advancement in Industry 4.0, Raigarh, India, 5 June 2024; pp. 1–6. [Google Scholar]
  33. Wang, Z.; Xin, Z.; Liao, G. Land-sea target detection and recognition in SAR image based on non-local channel attention network. IEEE Trans. Geosci. Remote Sens. 2022, 60, 5237316. [Google Scholar] [CrossRef]
  34. Lv, B.; Ni, J.; Lu, Y.; Zhao, S.; Liang, J.; Yuan, H.; Zhang, Q. A multiview inter-class dissimilarity feature fusion SAR images recognition network within limited sample condition. IEEE J. Sel. Top. Appl. Earth Obs. Remote Sens. 2024, 17, 17820–17836. [Google Scholar] [CrossRef]
  35. Sun, Z.; Leng, X.; Zhang, X.; Xiong, B.; Ji, K.; Kuang, G. Ship recognition for complex SAR images via dual-branch transformer fusion network. IEEE Geosci. Remote Sens. Lett. 2024, 21, 4009905. [Google Scholar] [CrossRef]
  36. Wen, Z.; Yu, Y.; Wu, Q. Multimodal discriminative feature learning for SAR ATR: A fusion framework of phase history, scattering topology, and image. IEEE Trans. Geosci. Remote Sens. 2024, 62, 5200414. [Google Scholar] [CrossRef]
  37. Zhang, L.; Leng, X.; Feng, S.; Ma, X.; Ji, K.; Kuang, G.; Liu, L. Domain knowledge powered two-stream deep network for few-shot SAR vehicle recognition. IEEE Trans. Geosci. Remote Sens. 2021, 60, 5215315. [Google Scholar] [CrossRef]
  38. Wang, C.; Luo, S.; Huang, Y.; Pei, J.; Zhang, Y.; Yang, J. SAR ATR method with limited training data via an embedded feature augmenter and dynamic hierarchical-feature refiner. IEEE Trans. Geosci. Remote Sens. 2023, 61, 5216215. [Google Scholar] [CrossRef]
  39. Wang, C.; Huang, Y.; Liu, X.; Pei, J.; Zhang, Y.; Yang, J. Global in local: A convolutional transformer for SAR ATR FSL. IEEE Geosci. Remote Sens. Lett. 2022, 19, 4509605. [Google Scholar] [CrossRef]
  40. Lv, B.; Luo, Y.; Ni, J.; Zhao, S.; Liang, J.; Zhang, Q. Multiview and multi-level feature fusion method within limited sample conditions for SAR image target recognition. ISPRS J. Photogramm. Remote Sens. 2025, 224, 302–316. [Google Scholar] [CrossRef]
  41. Choi, J.H.; Lee, M.J.; Jeong, N.H.; Lee, G.; Kim, K.T. Fusion of target and shadow regions for improved SAR ATR. IEEE Trans. Geosci. Remote Sens. 2022, 60, 5226217. [Google Scholar] [CrossRef]
  42. Xiao, Z.; Zhang, G.; Dai, Q. Multiview features centers sample expansion for SAR image classification. IEEE Geosci. Remote Sens. Lett. 2024, 21, 4001905. [Google Scholar] [CrossRef]
Figure 1. The framework of dual-branch spatial-frequency domain fusion recognition method with cross attention.
Remotesensing 17 02378 g001
Figure 2. The structure diagram of medium scale feature extraction.
Remotesensing 17 02378 g002
Figure 3. The structure diagram of CDFF module.
Remotesensing 17 02378 g003
Figure 4. The structural diagram of joint loss function.
Remotesensing 17 02378 g004
Figure 5. Optical and SAR images of 10 types of targets in the MSTAR dataset.
Remotesensing 17 02378 g005
Figure 6. T-SNE visualization and confusion matrix results under different configurations for 10 SAR images per category in the MSTAR dataset. V1 denotes the experimental results using only the spatial domain, V2 represents the results with only the frequency domain, V3 indicates the results incorporating both spatial and frequency domains but without the cross-domain fusion module, where features were directly concatenated, and V4 corresponds to the complete spatial-frequency fusion framework.
Remotesensing 17 02378 g006
Table 1. MSTAR Dataset: data distribution at different pitch angles.
Target TypeBMP2BTR70T722S1BRDM2D7BTR60T62ZIL131ZSU234
Training(15°)218220220221220224217224224222
Testing(17°)38424240374137394041
Table 2. Trainning and testing datasets under EOCS.
Operating
Condition
TrainingTesting
EOC-DTypesNumberDepression
Angle
TypesNumberDepression
Angle
2S129917°2S128830°
BRDM2298BRDM2287
T72232T72288
ZSU234299ZSU234288
EOC-VTypesNumberDepression
Angle
TypesNumberDepression
Angle
BMP223317°T72-SN81242617°, 15°
T72-A04573
BRDM2298T72-A05573
T72-A07573
BTR70233T72-A10567
BMP2-9566428
T72232BMP2-C21429
EOC-CTypesNumberDepression
Angle
TypesNumberDepression
Angle
BMP223317°T72-S741917°, 15°
BRDM2298T72-A32572
BTR70233T72-A62573
T72232T72-A63573
T72-A64573
Table 3. COMPARISON EXPERIMENT ON MSTAR DATASET (%).
MethodRecallPrecisionF1Accuracy
VGG1691.1993.4393.4391.66
GoogLeNet99.4099.1299.1299.16
ResNet1899.1598.9299.0199.09
NLCANet99.7599.5799.5899.72
MIDFF99.5499.5399.5499.58
DDNet99.6599.6199.6199.63
DBTF99.1699.1099.1199.14
Ours99.9299.8899.8899.90
Table 4. The recognition rate of each category for our method under SOC (%).
ClassBMP2BTR70T722S1BRDM2Average
Accuracy9910010010010099.90
ClassZIL131BTR60T62D7ZSU234
Accuracy100100100100100
Table 5. The recognition rate of each category for our method under EOCs (%).
EOC-DTypeAccuracyAverage
2S199.1297.68
BRDM294.38
T7299.65
ZSU23497.57
EOC-VTypeAccuracyAverage
T72-SN81298.5998.11
T72-A0498.25
T72-A0599.21
T72-A0797.73
T72-A1099.65
BMP2-956697.79
BMP2-C2195.54
EOC-CTypeAccuracyAverage
T72-S798.3399.11
T72-A3298.60
T72-A62100
T72-A6398.95
T72-A6499.65
Table 6. The recognition rate of different methods under EOCs (%).
MethodEOC-DEOC-VEOC-C
MoFFL [36]73.9966.8086.27
DKTS-N [37]71.0970.1868.41
EFA-DHFR [38]78.5279.1587.01
ConvT [39]74.8083.5589.74
MMFF [40]81.8391.6292.40
IFTS [41]96.8798.2395.52
EFAS [42]95.3096.7596.76
Ours97.6898.1199.11
Table 7. Ablation experiments in the MSTAR dataset: recognition performance (%) of different ablation configurations.
Method123BMP2BTR70T722S1BRDM2D7BTR60T62ZIL131ZSU234Average
V1 95.8310010091.6710010095.4591.3010010097.36
V2 95.8395.4510091.6710010090.9195.6510010095.15
V3 91.6710010095.8310010010010010010098.68
V499.0010010010010010010010010010099.90
Disclaimer/Publisher’s Note: The statements, opinions and data contained in all publications are solely those of the individual author(s) and contributor(s) and not of MDPI and/or the editor(s). MDPI and/or the editor(s) disclaim responsibility for any injury to people or property resulting from any ideas, methods, instructions or products referred to in the content.

