
GNSS-Based Models of Displacement, Stress, and Strain in the SHETPENANT Region: Impact of Geodynamic Activity from the ORCA Submarine Volcano

 , , , , , , and
Abstract
1. Introduction
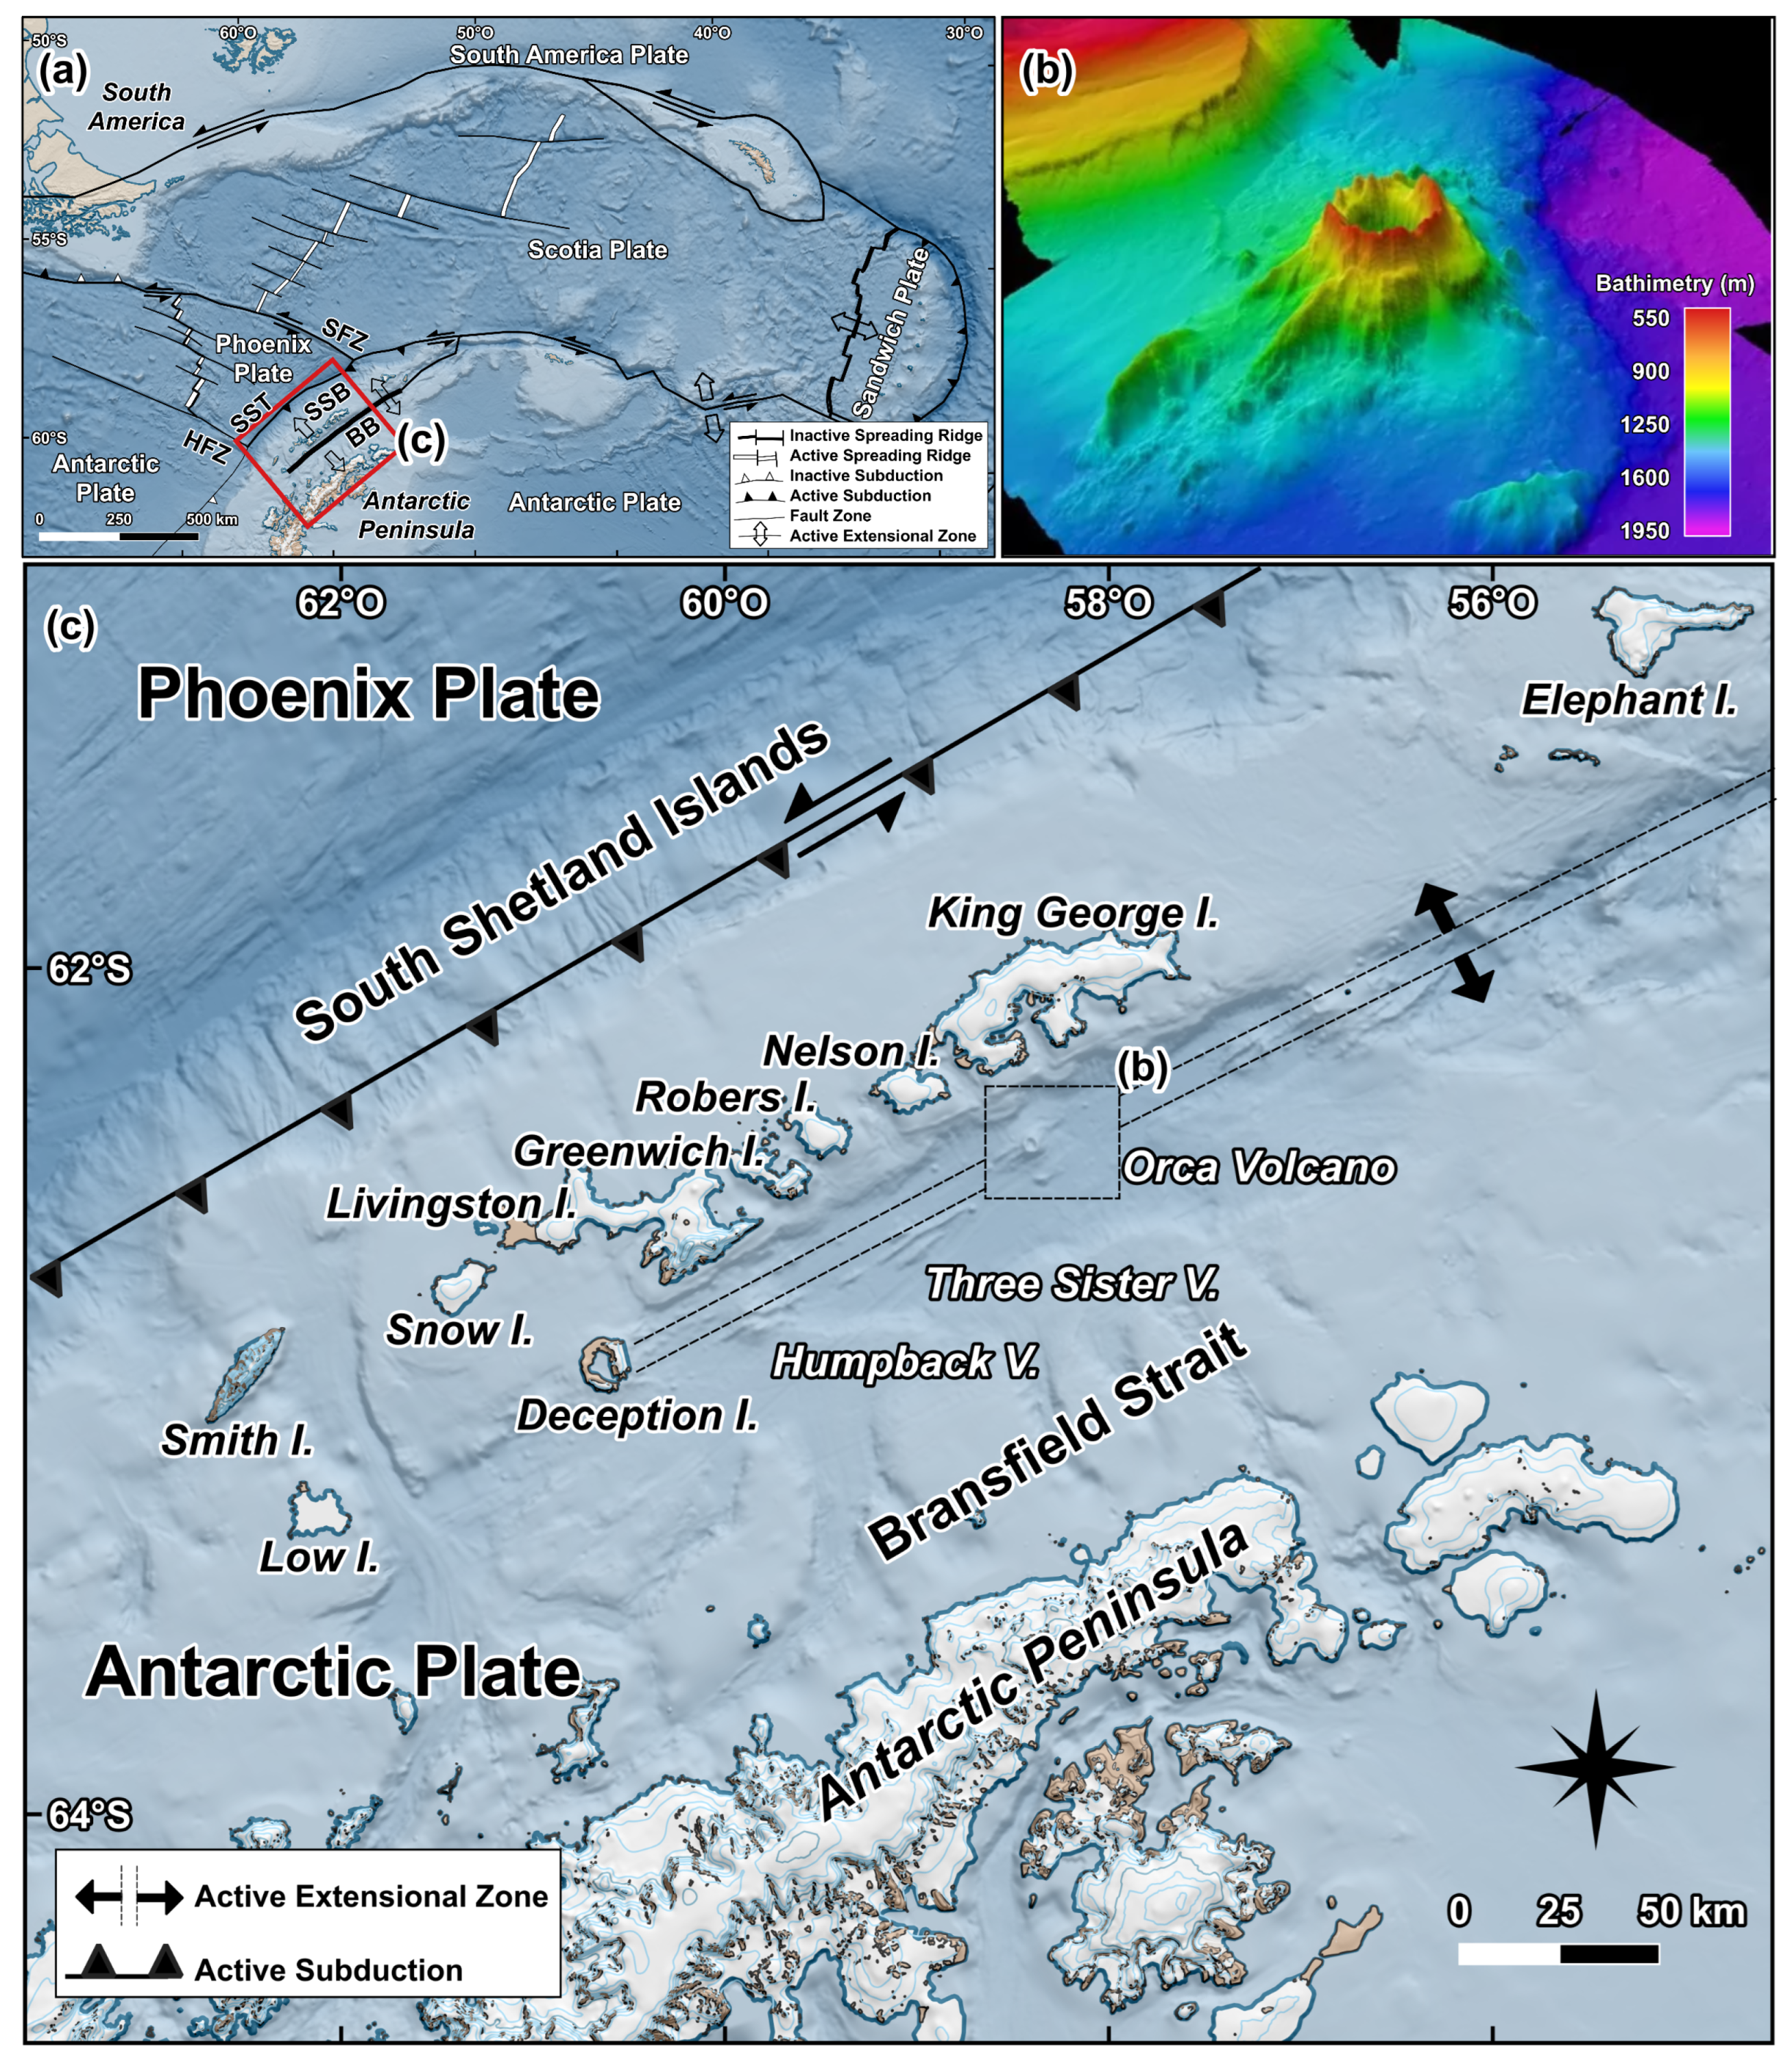
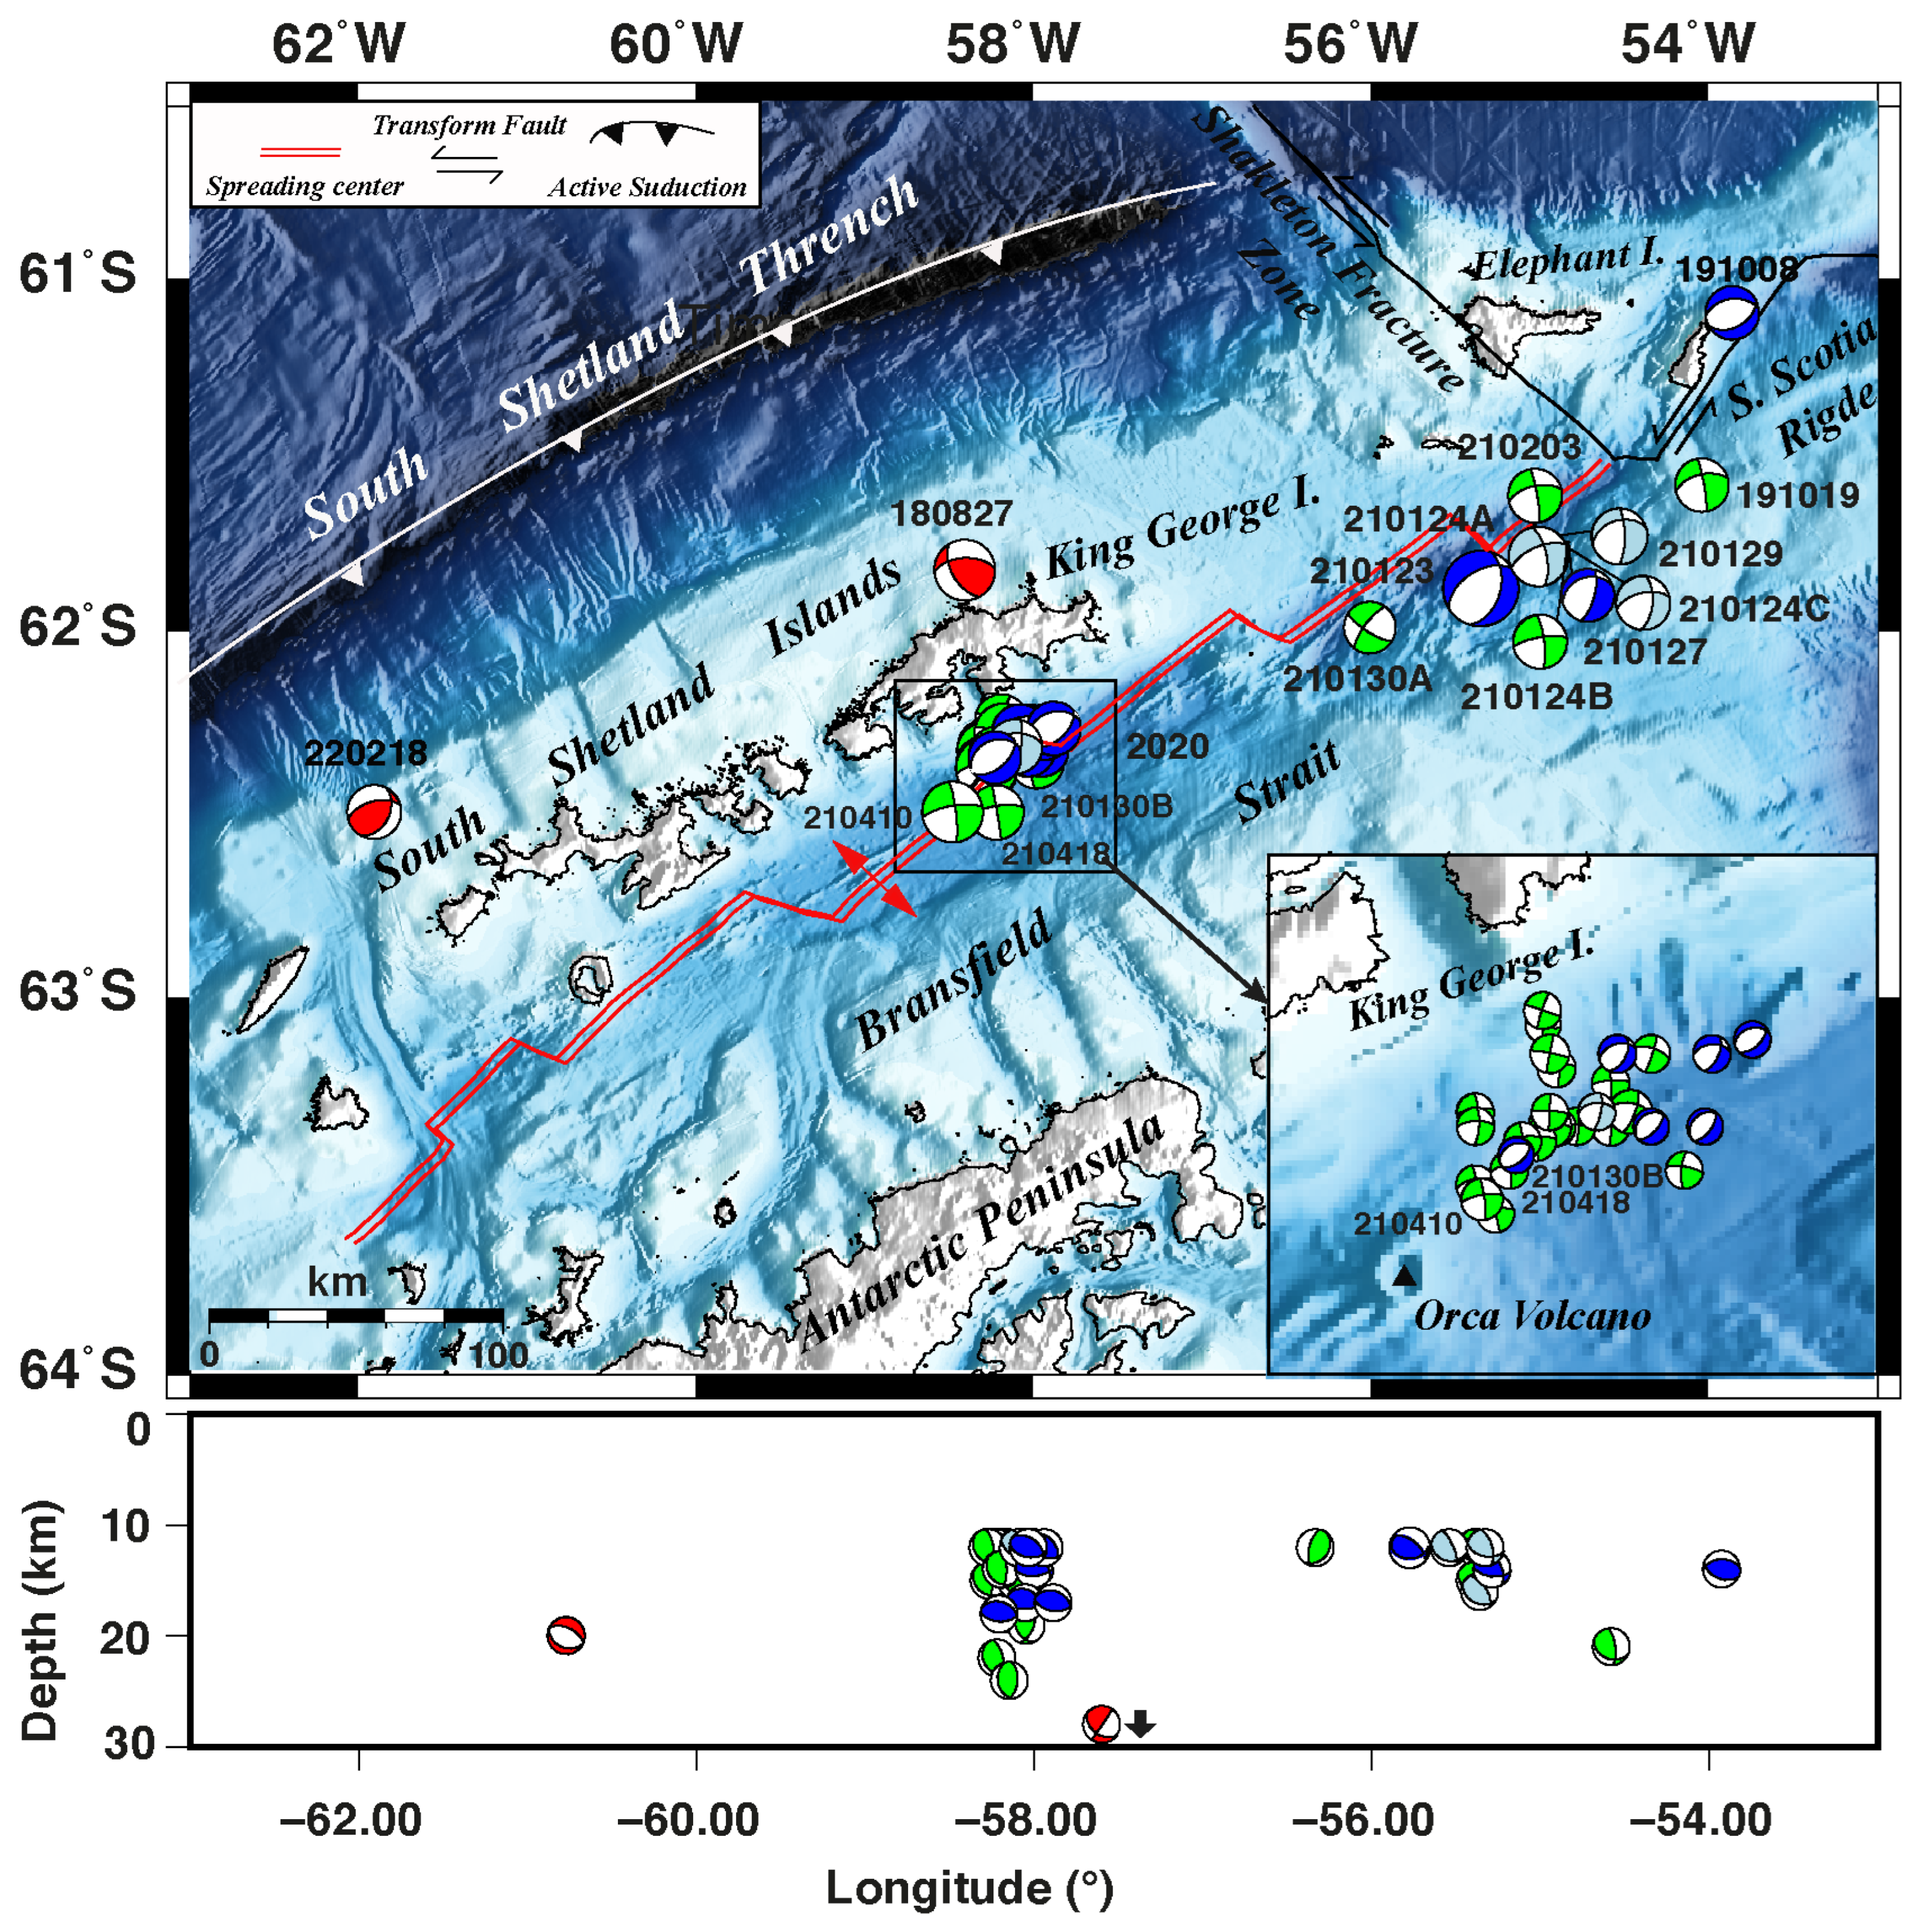
2. Geodynamic Frame and Seismic Activity
3. Methodology
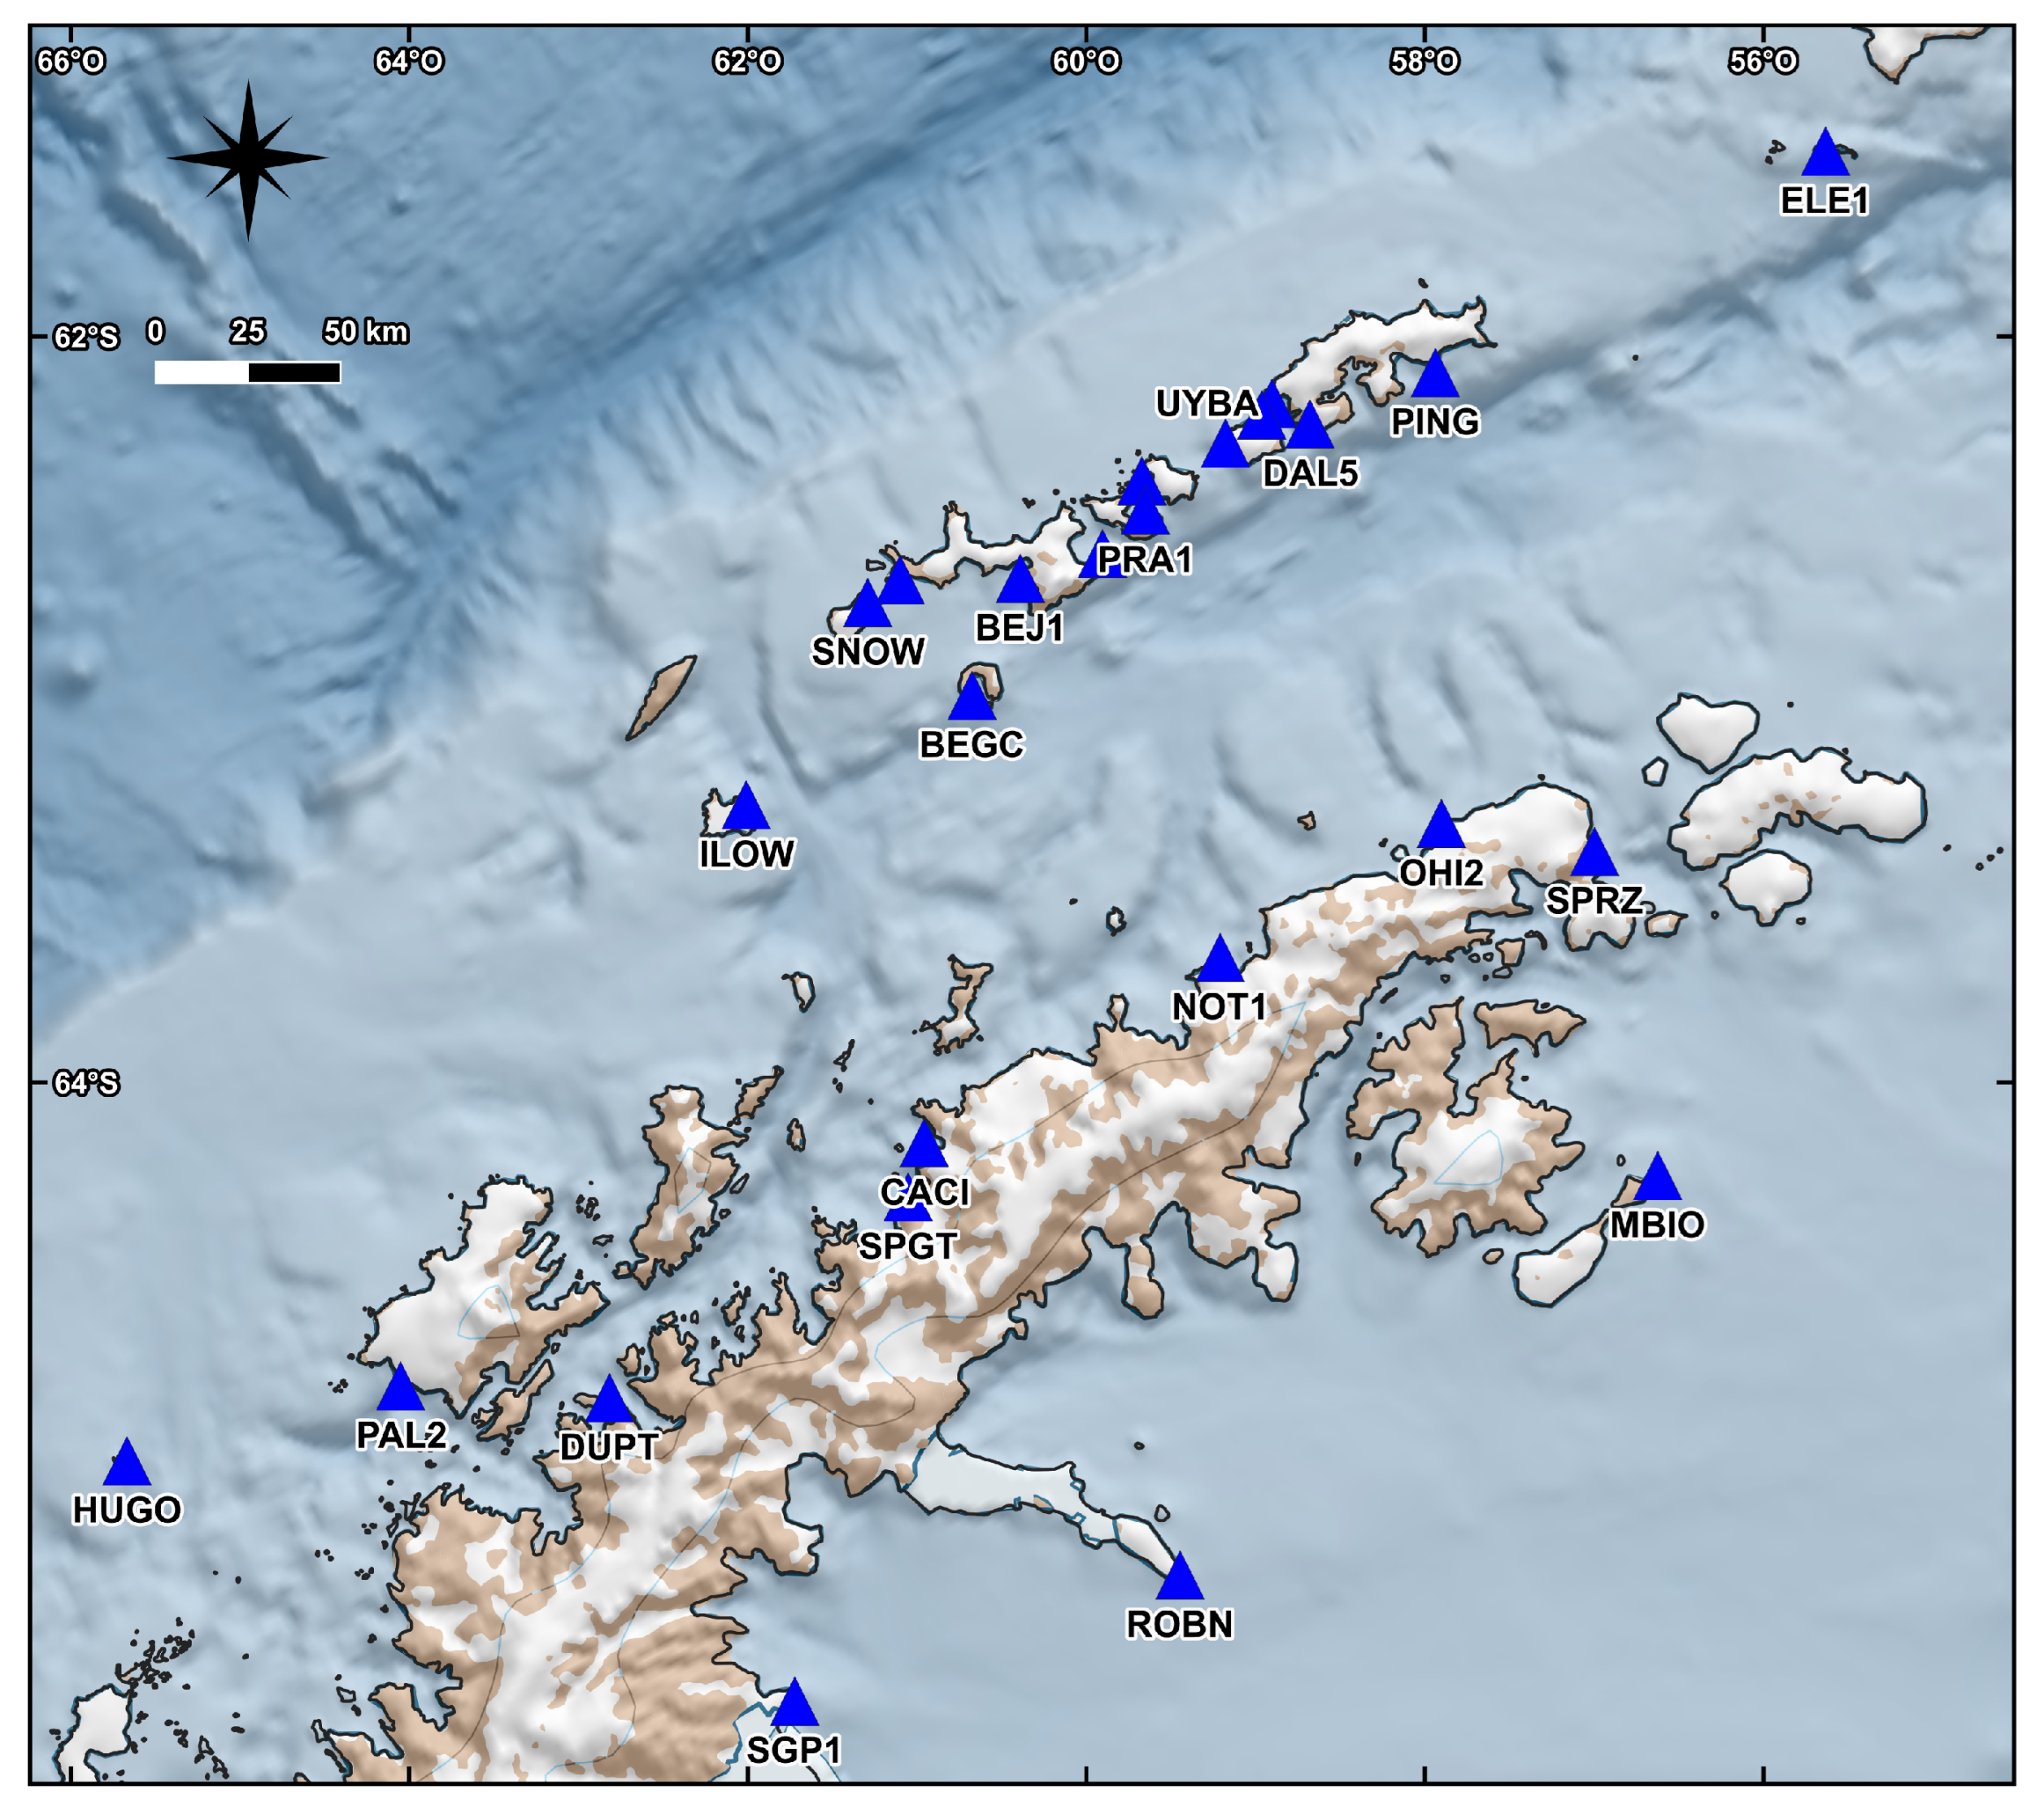
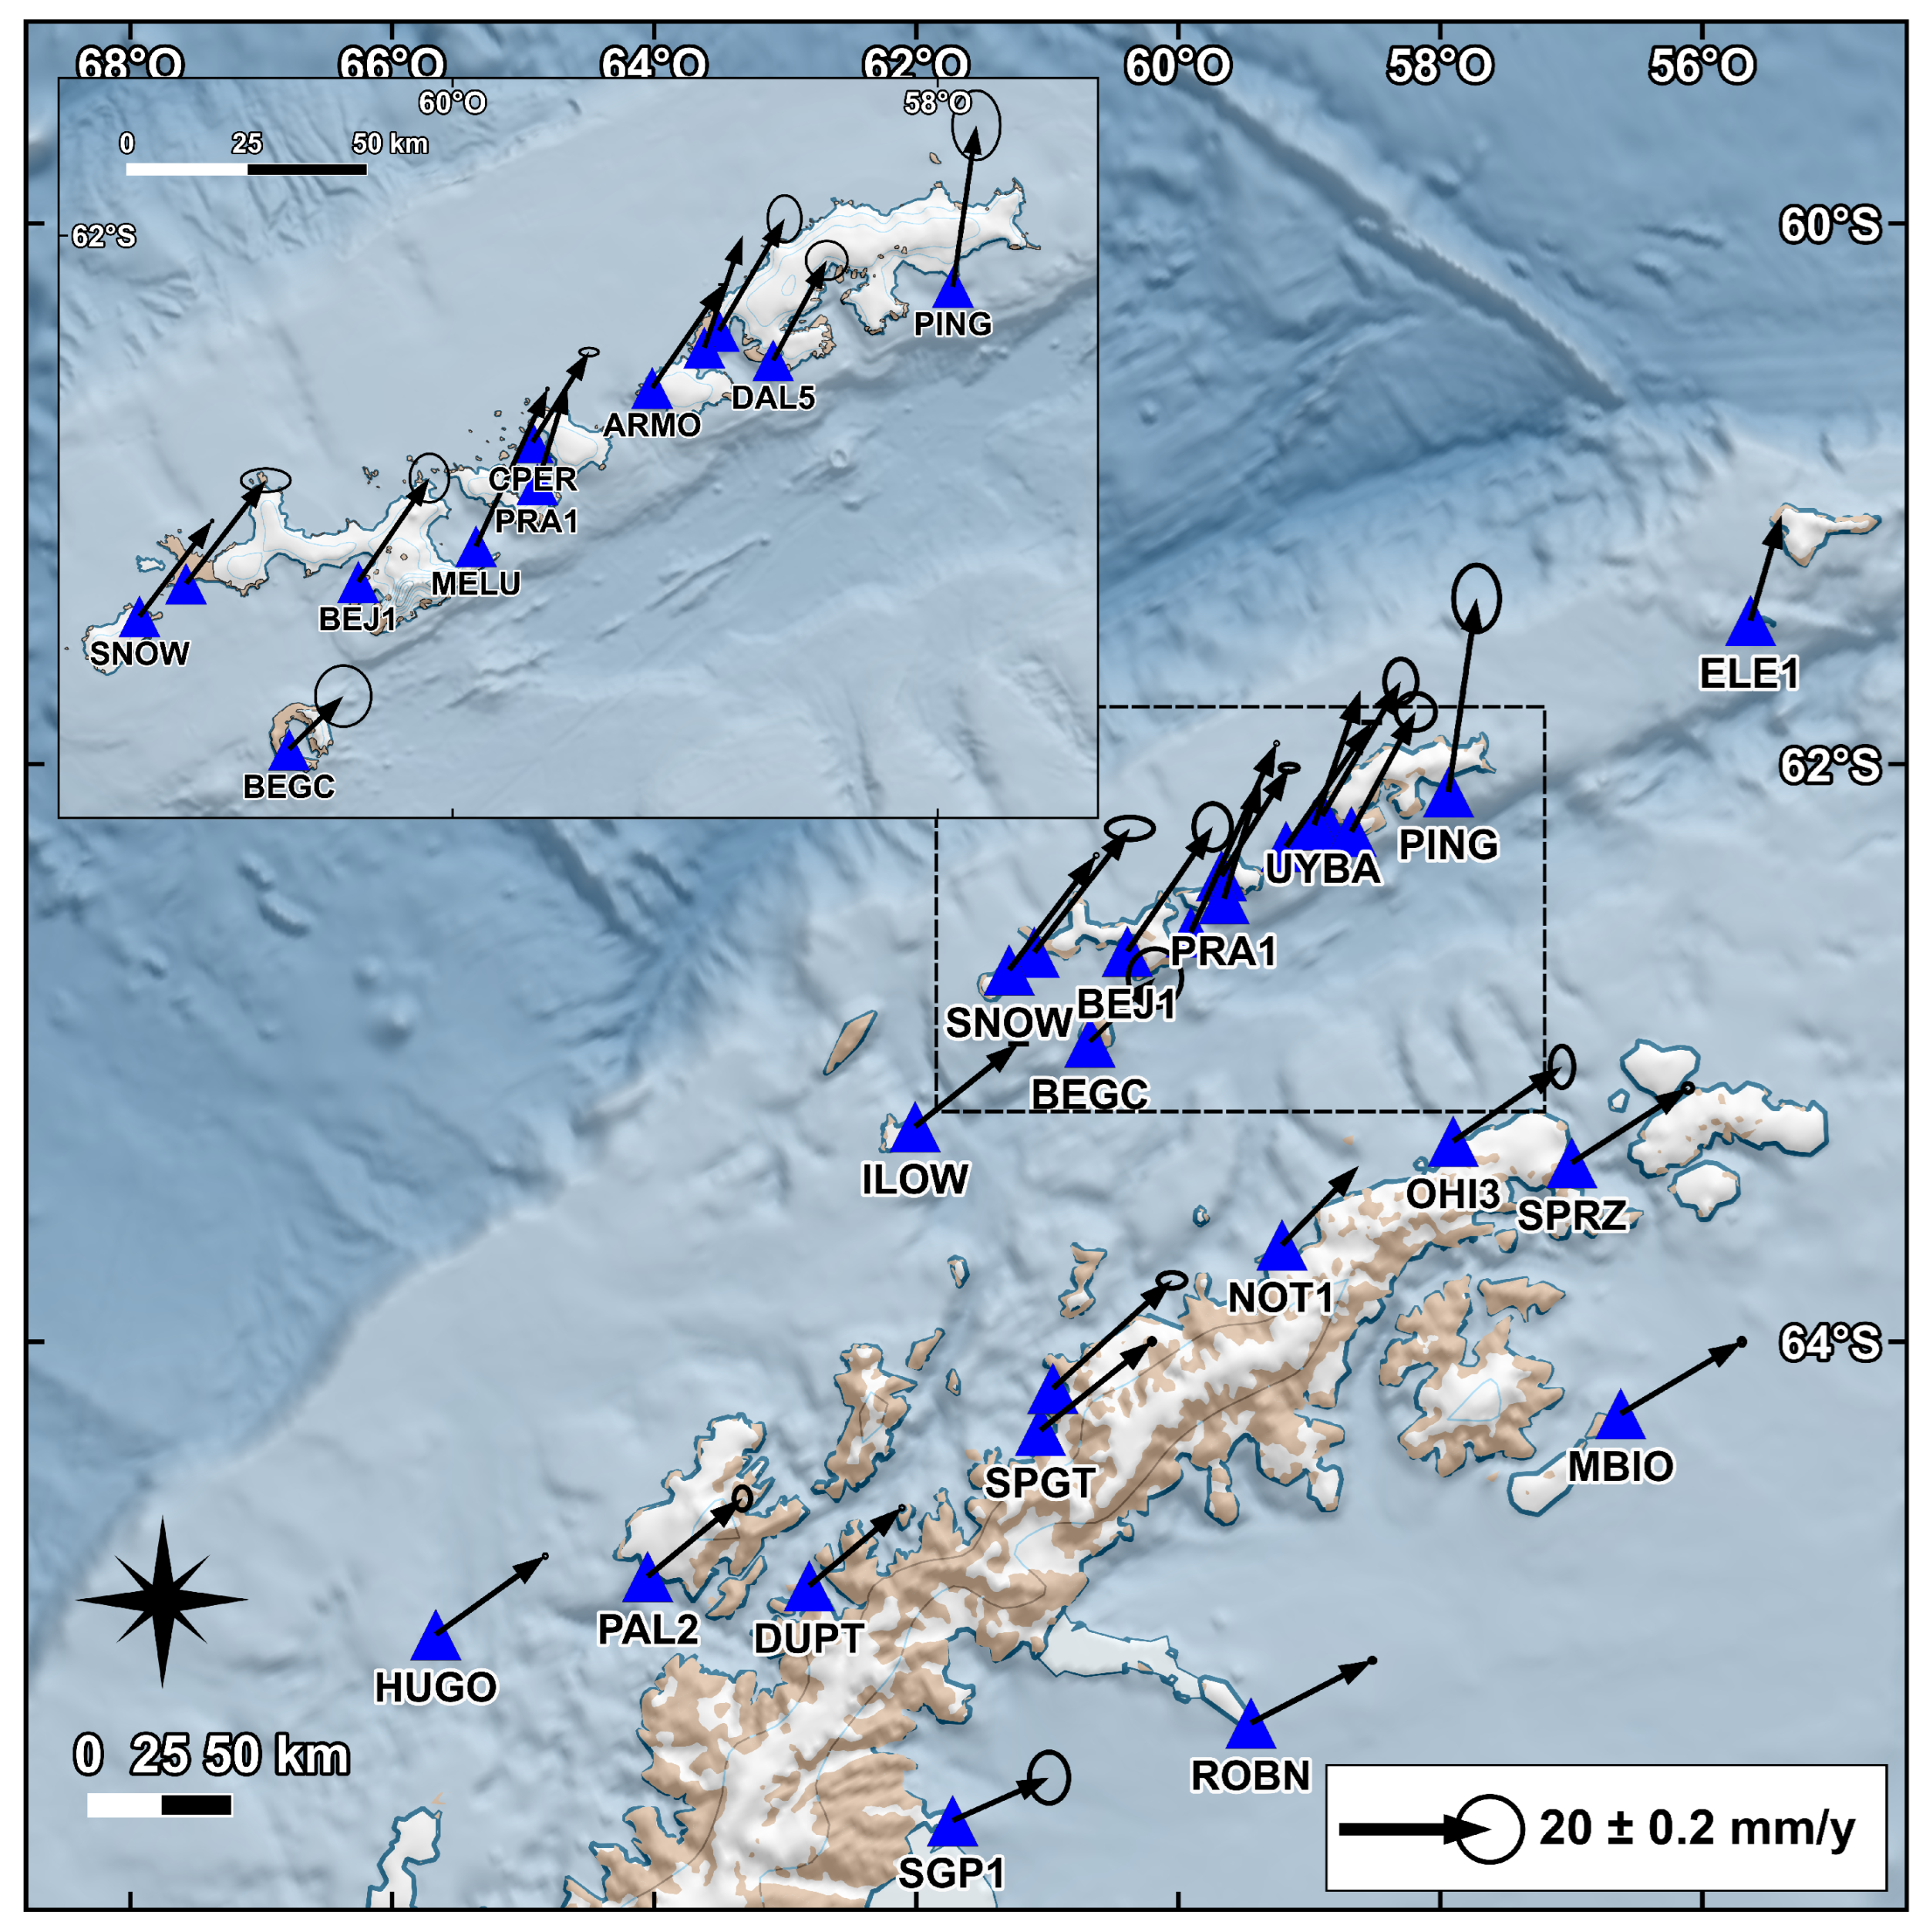
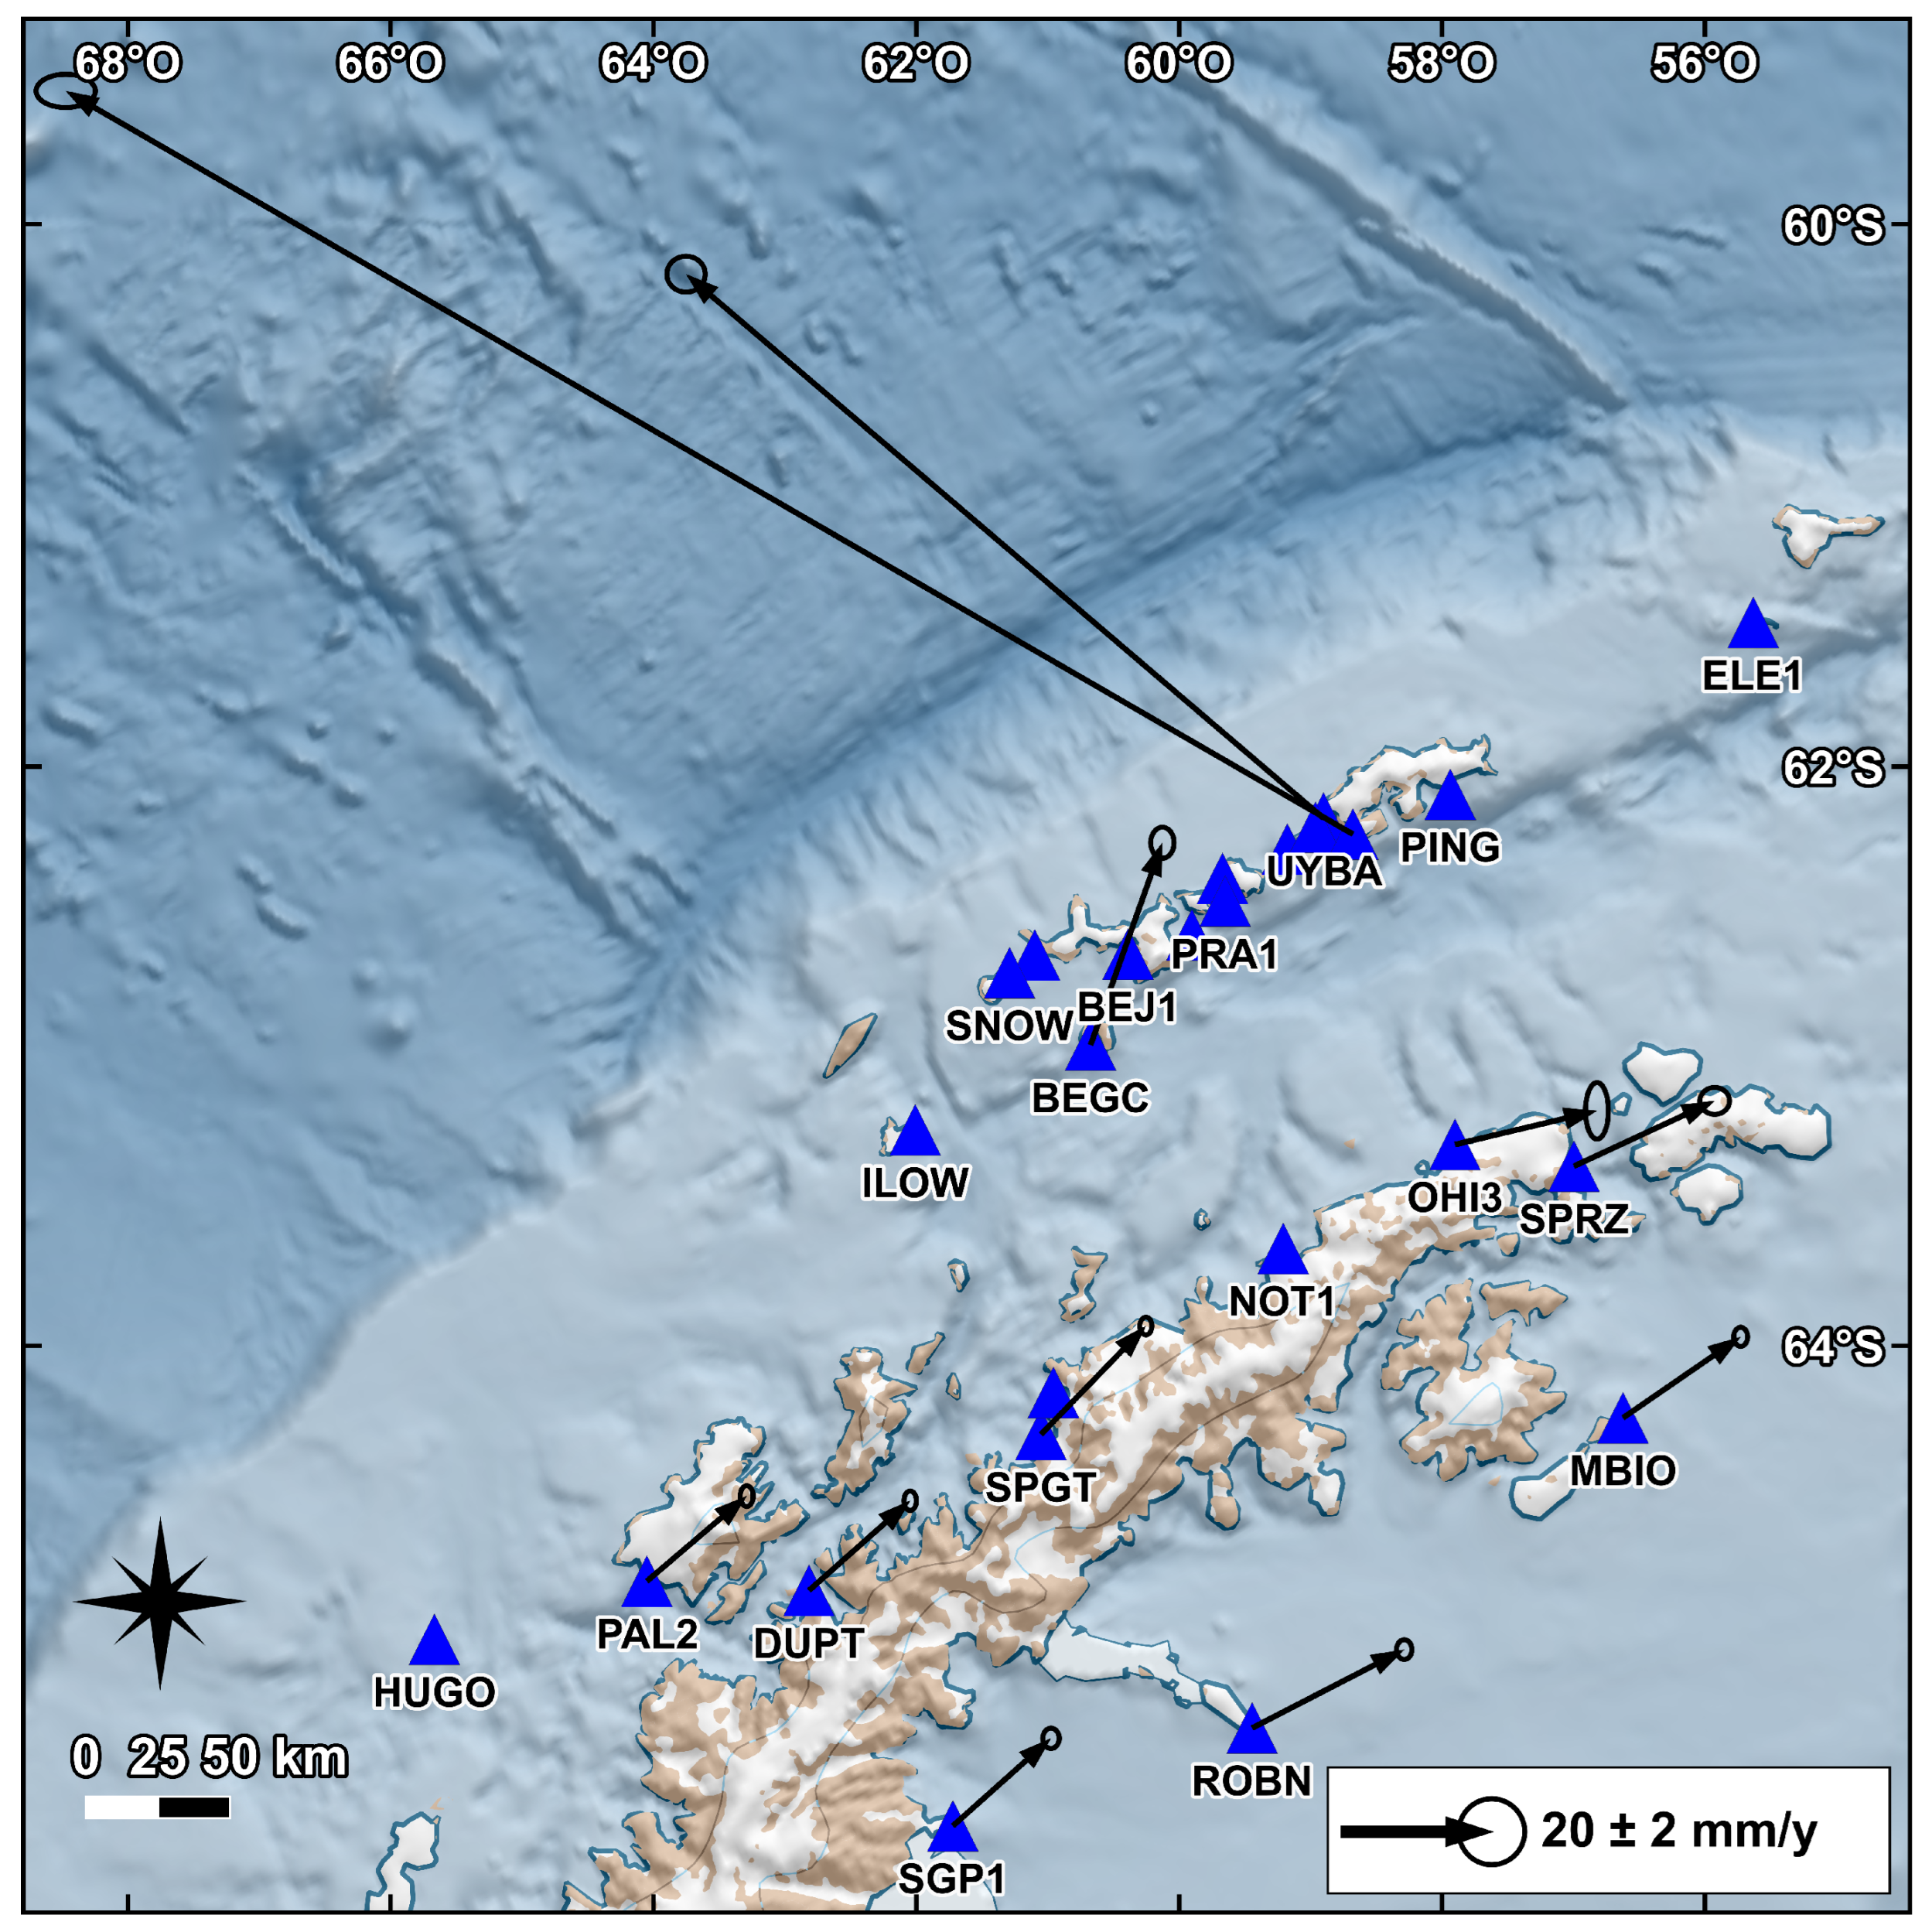
3.1. GNSS Stations
3.2. Data Processing
3.3. Time Series Analysis
3.4. Stress and Strain Parameters
4. Results
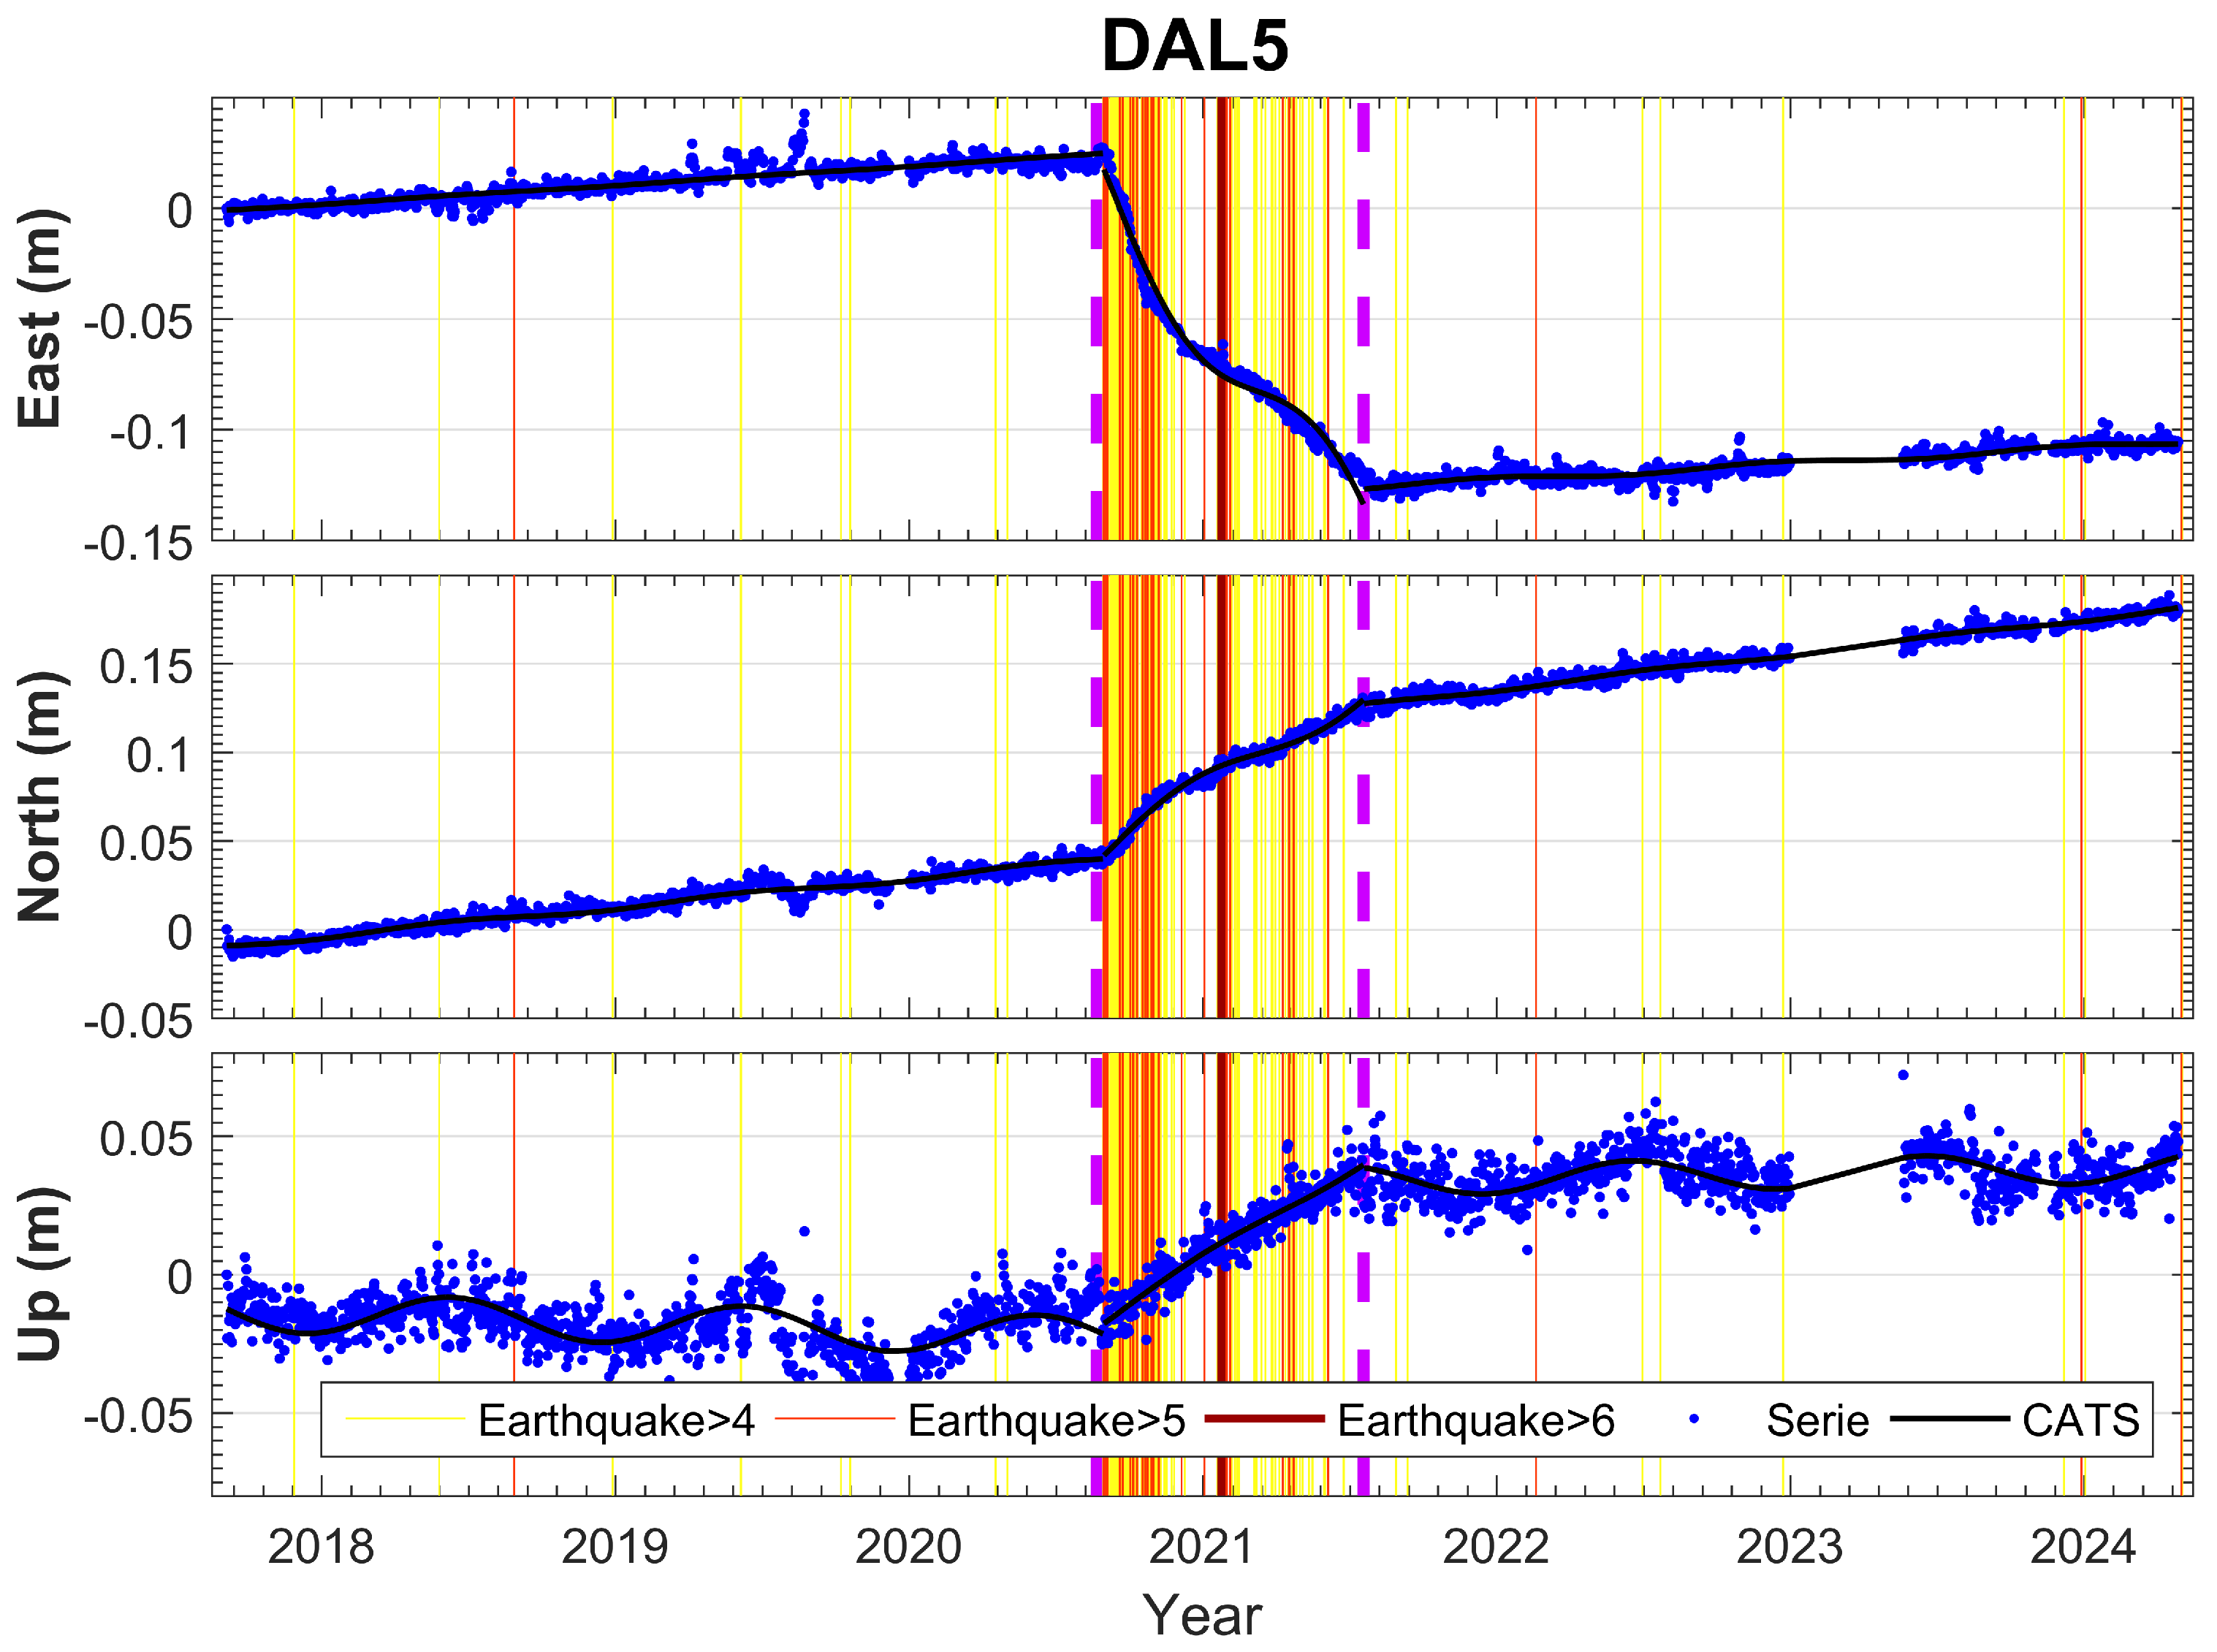
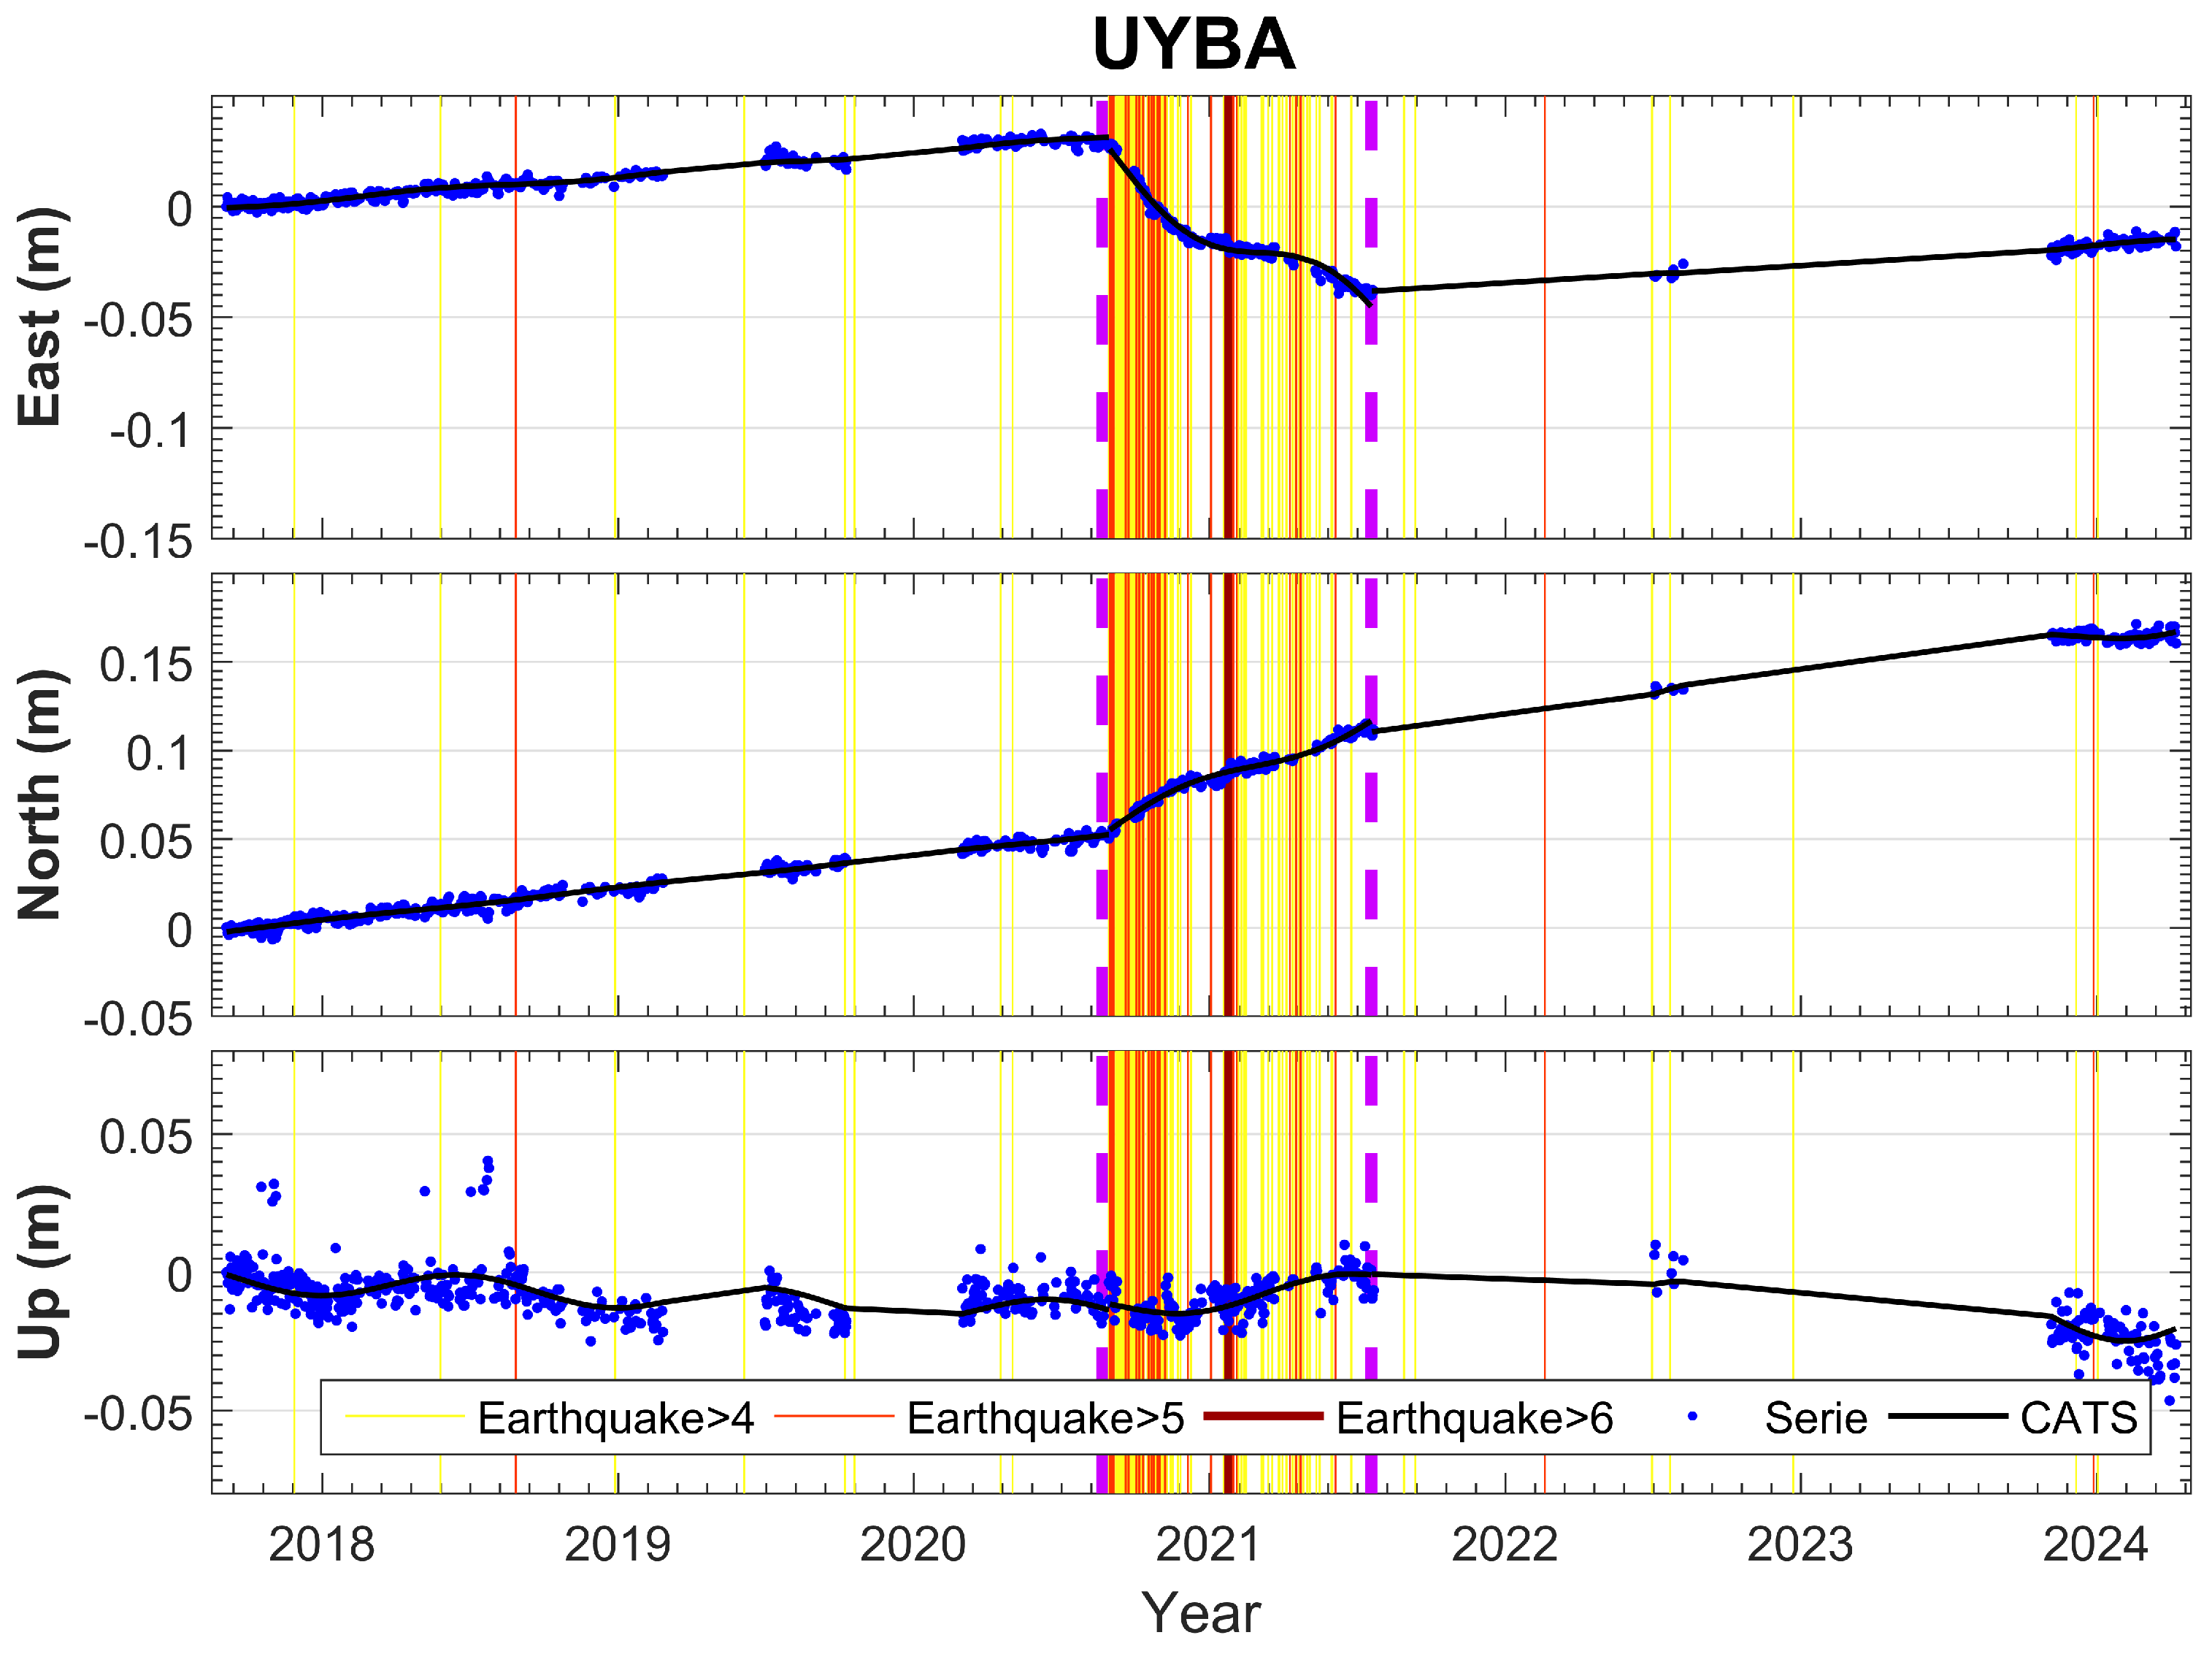
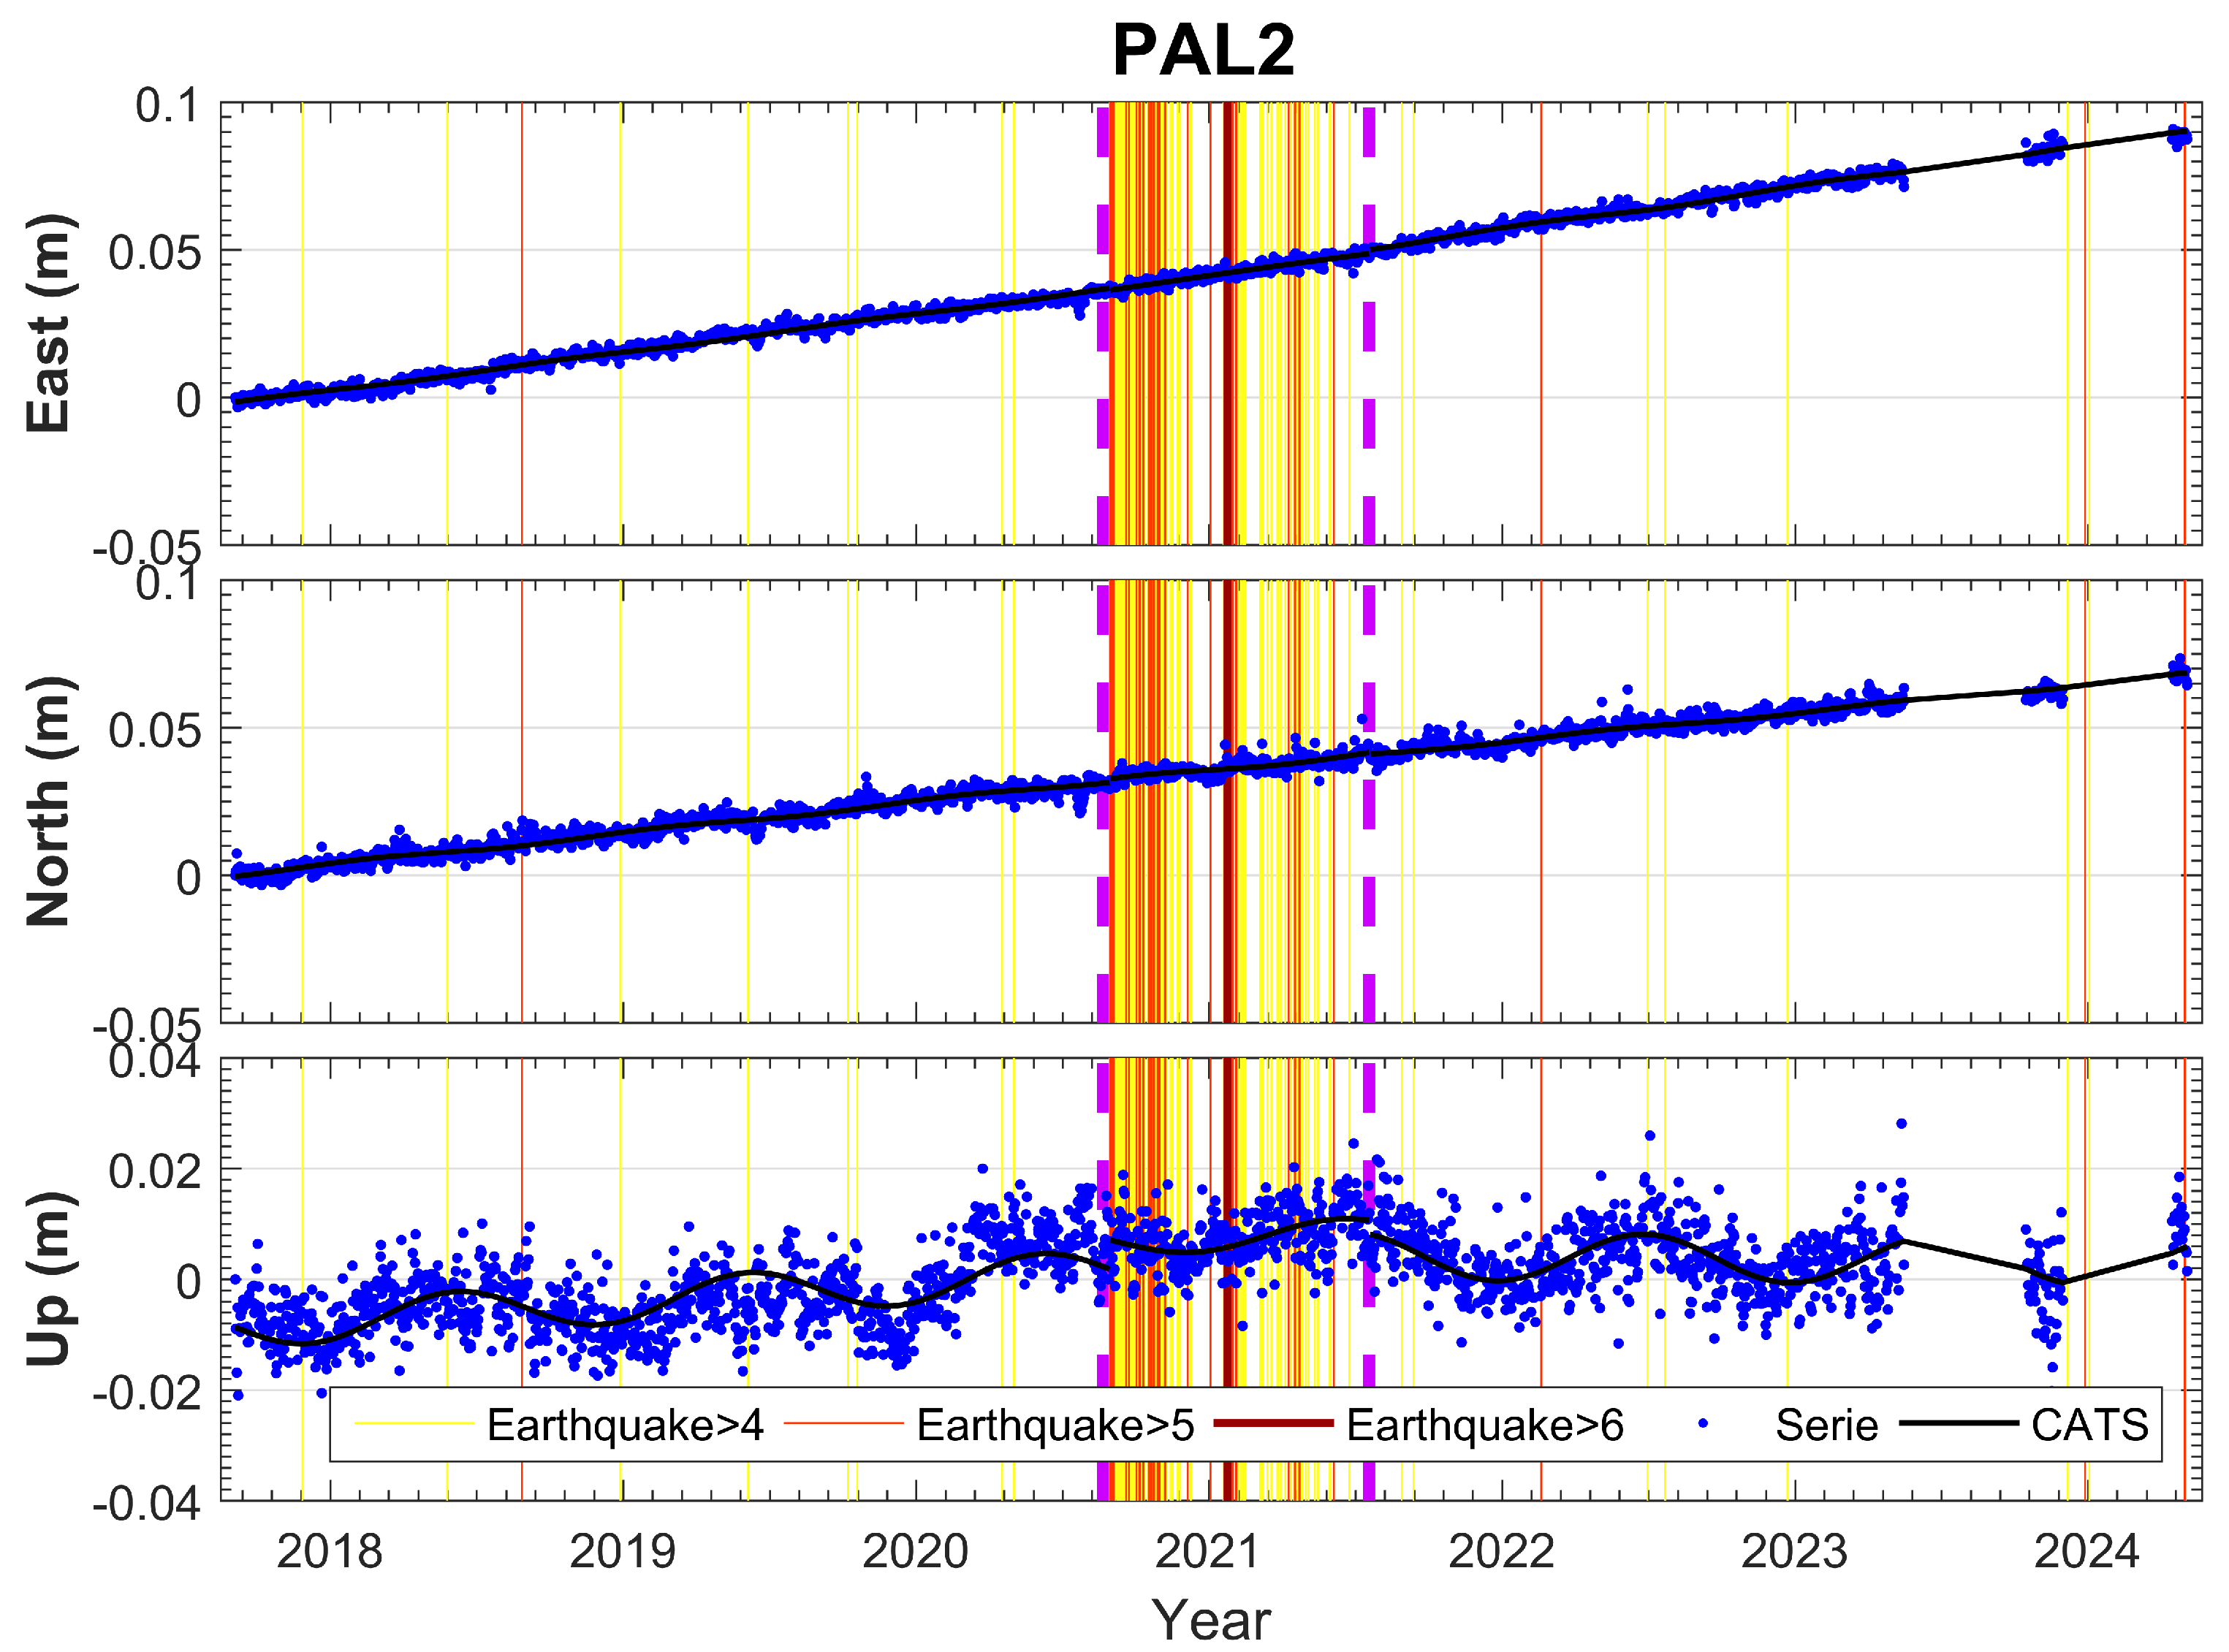
4.1. Time Series
4.2. Preseismic, Coseismic, and Postseismic Displacement Models
4.3. Stress and Strain Models
5. Discussion
6. Conclusions
Author Contributions
Funding
Data Availability Statement
Acknowledgments
Conflicts of Interest
Abbreviations
| ANET | Antarctic Network |
| CATS | Create and Analyze Time Series |
| DNA | Dirección Nacional del Antártico |
| GCMT | Global Centroid Moment Tensor |
| GPS | Global Positioning System |
| GNSS | Global Navigation Satellite System |
| IAA | Instituto Antártico Argentino |
| IAG | Instituto Andaluz de Geofísica |
| IDW | Inverse Distance Weighting |
| IGM-UY | Instituto Geográfico Militar de Uruguay |
| IGS | International GNSS Service |
| ITRF | Internacional Terrestrial Reference Frame |
| JPL | Jet Propulsion Laboratory |
| LAGC | Laboratorio de Astronomía Geodesia y Cartografía |
| MIDAS | Median Interannual Difference Adjusted for Skewness |
| NGL | Nevada Geodetic Laboratory |
| PPP | Precise Point Positioning |
| RAMSAC | Red Argentina de Monitoreo Satelital Continuo |
| REGNA-ROU | Red Geodésica Nacional Activa de la República Oriental del Uruguay |
| RGAE | Red Geodésica Antártica Española |
| SEPA | Seismic Experiment in Patagonia and Antarctica |
| SIRGAS | Sistema de Referencia Geocéntrico para las Américas |
| SHETPENANT | South Shetland Islands and Antarctic Peninsula region |
| USGS | United States Geological Survey |
References
- Dzurisin, D. Volcano Deformation: New Geodetic Monitoring Techniques; Springer Science & Business Media: Berlin/Heidelberg, Germany, 2006. [Google Scholar]
- Fournier, T.J.; Pritchard, M.E.; Riddick, S.N. Duration, magnitude, and frequency of subaerial volcano deformation events: New results from Latin America using InSAR and a global synthesis. Geochem. Geophys. Geosystems 2010, 11, Q01003. [Google Scholar] [CrossRef]
- Berrocoso, M.; Fernández-Ros, A.; Prates, G.; García, A.; Kraus, S. Geodetic implications on block formation and geodynamic domains in the South Shetland Islands, Antarctic Peninsula. Tectonophysics 2016, 666, 211–219. [Google Scholar] [CrossRef]
- Qin, S.; Wang, W.; Song, S. Comparative study on vertical deformation based on GPS and leveling data. Geod. Geodyn. 2018, 9, 115–120. [Google Scholar] [CrossRef]
- Battaglia, M.; Alpala, J.; Alpala, R.; Angarita, M.; Arcos, D.; Euillades, L.; Euillades, P.; Muller, C.; Narváez, L. Monitoring volcanic deformation. In Reference Module in Earth Systems and Environmental Sciences; Elsevier: Amsterdam, The Netherlands, 2019. [Google Scholar]
- Corsa, B.; Barba-Sevilla, M.; Tiampo, K.; Meertens, C. Integration of DInSAR time series and GNSS data for continuous volcanic deformation monitoring and eruption early warning applications. Remote Sens. 2022, 14, 784. [Google Scholar] [CrossRef]
- Aoki, Y. Measuring volcano deformation with GNSS. In GNSS Monitoring of the Terrestrial Environment; Elsevier: Amsterdam, The Netherlands, 2024; pp. 129–159. [Google Scholar]
- Martí, J. Volcano Geology: A Fundamental Tool to Quantify Volcanic Hazards. In A Comprehensive Study of Volcanic Phenomena; Németh, K., Ed.; IntechOpen: Rijeka, Croatia, 2024; Chapter 1. [Google Scholar] [CrossRef]
- Poland, M.P. Remote Sensing of Volcano Deformation and Surface Change. In Remote Sensing for Characterization of Geohazards and Natural Resources; Chaussard, E., Jones, C., Chen, J.A., Donnellan, A., Eds.; Springer International Publishing: Cham, Switzerland, 2024; pp. 173–203. [Google Scholar] [CrossRef]
- Krietemeyer, A.; van Dalfsen, E. Cost-effective GNSS as a tool for monitoring volcanic deformation: A case study on Saba in the Lesser Antilles. J. Volcanol. Geotherm. Res. 2025, 459, 108263. [Google Scholar] [CrossRef]
- Fernández, J.; Pepe, A.; Poland, M.P.; Sigmundsson, F. Volcano Geodesy: Recent developments and future challenges. J. Volcanol. Geotherm. Res. 2017, 344, 1–12. [Google Scholar] [CrossRef]
- Riccardi, U.; Arnoso, J.; Benavent, M.; Vélez, E.; Tammaro, U.; Montesinos, F. Exploring deformation scenarios in Timanfaya volcanic area (Lanzarote, Canary Islands) from GNSS and ground based geodetic observations. J. Volcanol. Geotherm. Res. 2018, 357, 14–24. [Google Scholar] [CrossRef]
- Segall, P.; Anderson, K.R.; Johanson, I.; Miklius, A. Mechanics of inflationary deformation during caldera collapse: Evidence from the 2018 Kīlauea eruption. Geophys. Res. Lett. 2019, 46, 11782–11789. [Google Scholar] [CrossRef]
- Munekane, H. Modeling long-term volcanic deformation at Kusatsu-Shirane and Asama volcanoes, Japan, using the GNSS coordinate time series. Earth Planets Space 2021, 73, 192. [Google Scholar] [CrossRef]
- Anderson, K.; Johanson, I. Incremental caldera collapse at Kīlauea Volcano recorded in ground tilt and high-rate GNSS data, with implications for collapse dynamics and the magma system. Bull. Volcanol. 2022, 84, 89. [Google Scholar] [CrossRef]
- Kelman, M.C.; Wilson, A.M. Assessing the relative threats from Canadian volcanoes. Can. J. Earth Sci. 2024, 61, 408–430. [Google Scholar] [CrossRef]
- Ellis, A.P.; Johanson, I.A.; Poland, M.P. Deformation of Mauna Loa before, during, and after its 2022 eruption. Bull. Volcanol. 2025, 87, 8. [Google Scholar] [CrossRef]
- Parks, M.; Sigmundsson, F.; Drouin, V.; Hjartardóttir, Á.R.; Geirsson, H.; Hooper, A.; Vogfjörd, K.S.; Ófeigsson, B.G.; Hreinsdóttir, S.; Jensen, E.H.; et al. Deformation, seismicity, and monitoring response preceding and during the 2022 Fagradalsfjall eruption, Iceland. Bull. Volcanol. 2023, 85, 60. [Google Scholar] [CrossRef]
- Suarez, E.; García-Cañada, L.; Meletlidis, S.; Domínguez-Cerdeña, I.; del Fresno, C.; Perdiguer-Lopez, R.; Poczatek-Stanczyk, M. São Jorge’s Volcano-Tectonic Unrest in 2022: A Joint Interpretation Through GNSS and Fully Automated Seismic Analysis. Pure Appl. Geophys. 2025, 182, 1089–1111. [Google Scholar] [CrossRef]
- Poland, M.P.; Peltier, A.; Bonforte, A.; Puglisi, G. The spectrum of persistent volcanic flank instability: A review and proposed framework based on Kīlauea, Piton de la Fournaise, and Etna. J. Volcanol. Geotherm. Res. 2017, 339, 63–80. [Google Scholar] [CrossRef]
- Dumont, Q.; Cayol, V.; Froger, J.L.; Peltier, A. 22 years of satellite imagery reveal a major destabilization structure at Piton de la Fournaise. Nat. Commun. 2022, 13, 2649. [Google Scholar] [CrossRef]
- Kobayashi, T.; Morishita, Y.; Munekane, H. First detection of precursory ground inflation of a small phreatic eruption by InSAR. Earth Planet. Sci. Lett. 2018, 491, 244–254. [Google Scholar] [CrossRef]
- Inguaggiato, S.; Vita, F.; Diliberto, I.S.; Inguaggiato, C.; Mazot, A.; Cangemi, M.; Corrao, M. The volcanic activity changes occurred in the 2021–2022 at Vulcano island (Italy), inferred by the abrupt variations of soil CO2 output. Sci. Rep. 2022, 12, 21166. [Google Scholar] [CrossRef]
- Bonforte, A.; Aiesi, G.; Calvagna, F.; Consoli, S.; Pruiti, L.; Rubonello, A.; Saraceno, B. Real-time mobile GNSS network data acquired during the 2021–2022 unrest at Vulcano island. Bull. Volcanol. 2024, 86, 36. [Google Scholar] [CrossRef]
- Grapenthin, R.; Freymueller, J.T.; Kaufman, A.M. Geodetic observations during the 2009 eruption of Redoubt Volcano, Alaska. J. Volcanol. Geotherm. Res. 2013, 259, 115–132. [Google Scholar] [CrossRef]
- Pinel, V.; Poland, M.; Hooper, A. Volcanology: Lessons learned from Synthetic Aperture Radar imagery. J. Volcanol. Geotherm. Res. 2014, 289, 81–113. [Google Scholar] [CrossRef]
- Biggs, J.; Pritchard, M.E. Global Volcano Monitoring: What Does It Mean When Volcanoes Deform? Elements 2017, 13, 17–22. [Google Scholar] [CrossRef]
- Zhan, Y.; Gregg, P.M. Data assimilation strategies for volcano geodesy. J. Volcanol. Geotherm. Res. 2017, 344, 13–25. [Google Scholar] [CrossRef]
- Sigmundsson, F.; Einarsson, P.; Geirsson, H. Chapter 11—Magma Movements in Volcanic Plumbing Systems and their Associated Ground Deformation and Seismic Patterns. In Volcanic and Igneous Plumbing Systems; Burchardt, S., Ed.; Elsevier: Amsterdam, The Netherlands, 2018; pp. 285–322. [Google Scholar] [CrossRef]
- Smittarello, D.; Cayol, V.; Pinel, V.; Froger, J.L.; Peltier, A.; Dumont, Q. Combining InSAR and GNSS to track magma transport at basaltic volcanoes. Remote Sens. 2019, 11, 2236. [Google Scholar] [CrossRef]
- Cegla, A.; Rohm, W.; Lasota, E.; Biondi, R. Detecting volcanic plume signatures on GNSS signal, Based on the 2014 Sakurajima Eruption. Adv. Space Res. 2022, 69, 292–307. [Google Scholar] [CrossRef]
- Rosado, B.; Fernández-Ros, A.; Berrocoso, M.; Prates, G.; Gárate, J.; de Gil, A.; Geyer, A. Volcano-tectonic dynamics of Deception Island (Antarctica): 27 years of GPS observations (1991–2018). J. Volcanol. Geotherm. Res. 2019, 381, 57–82. [Google Scholar] [CrossRef]
- Jiménez-Morales, V.; Almendros, J.; Carmona, E. Long-Term Evolution of the Seismic Activity Preceding the 2015 Seismic Crisis at Deception Island Volcano, Antarctica (2008–2015). Surv. Geophys. 2022, 43, 959–994. [Google Scholar] [CrossRef]
- Almendros, J.; Wilcock, W.; Soule, D.; Teixidó, T.; Vizcaíno, L.; Ardanaz, O.; Granja-Bruña, J.; Martín-Jiménez, D.; Yuan, X.; Heit, B.; et al. BRAVOSEIS: Geophysical investigation of rifting and volcanism in the Bransfield strait, Antarctica. J. S. Am. Earth Sci. 2020, 104, 102834. [Google Scholar] [CrossRef]
- Poli, P.; Cabrera, L.; Flores, M.C.; Báez, J.C.; Ammirati, J.B.; Vásquez, J.; Ruiz, S. Volcanic Origin of a Long-Lived Swarm in the Central Bransfield Basin, Antarctica. Geophys. Res. Lett. 2022, 49, e2021GL095447. [Google Scholar] [CrossRef]
- Loureiro Olivet, J.; Sánchez Bettucci, L.; Castro-Artola, O.A.; Castro, H.; Rodríguez, M.; Latorres, E. A seismic swarm at the Bransfield Rift, Antarctica. J. S. Am. Earth Sci. 2021, 111, 103412. [Google Scholar] [CrossRef]
- Cesca, S.; Sugan, M.; Rudzinski, Ł.; Vajedian, S.; Niemz, P.; Plank, S.; Petersen, G.; Deng, Z.; Rivalta, E.; Vuan, A.; et al. Massive earthquake swarm driven by magmatic intrusion at the Bransfield Strait, Antarctica. Commun. Earth Environ. 2022, 3, 89. [Google Scholar] [CrossRef]
- Jung, J.; Park, Y.; Lee, W.S.; Park, S. Seismicity in the Bransfield Strait, Antarctica, using temporal Ocean Bottom Seismographs data. In EGU General Assembly Conference Abstracts; The SAO Astrophysics Data System: Cambridge, MA, USA, 2024; p. 1332. [Google Scholar]
- Norwegian Polar Institute. QAntarctica—A GIS Package for Antarctica. 2023. Available online: https://npolar.no/quantarctica/ (accessed on 20 May 2024).
- Robertson Maurice, S.D.; Wiens, D.A.; Shore, P.J.; Vera, E.; Dorman, L.M. Seismicity and tectonics of the South Shetland Islands and Bransfield Strait from a regional broadband seismograph deployment. J. Geophys. Res. Solid Earth 2003, 108, 2461. [Google Scholar] [CrossRef]
- Dziak, R.P.; Park, M.; Lee, W.S.; Matsumoto, H.; Bohnenstiehl, D.R.; Haxel, J.H. Tectonomagmatic activity and ice dynamics in the Bransfield Strait back-arc basin, Antarctica. J. Geophys. Res. Solid Earth 2010, 115, B01102. [Google Scholar] [CrossRef]
- Ibáñez, J.; Carmona, E.; Almendros, J.; Saccorotti, G.; Del Pezzo, E.; Abril, M.; Ortiz, R. The 1998–1999 seismic series at Deception Island volcano, Antarctica. J. Volcanol. Geotherm. Res. 2003, 128, 65–88. [Google Scholar] [CrossRef]
- Almendros, J.; Carmona, E.; Jiménez, V.; Díaz-Moreno, A.; Lorenzo, F. Volcano-tectonic activity at deception island volcano following a seismic swarm in the Bransfield Rift (2014–2015). Geophys. Res. Lett. 2018, 45, 4788–4798. [Google Scholar] [CrossRef]
- Rodrigo, C.; Blamey, J.M.; Huhn, O.; Provost, C. ¿ Existe un flujo hidrotermal activo desde el monte submarino Orca en el estrecho Bransfield, Antártica? Andean Geol. 2018, 45, 344–356. [Google Scholar] [CrossRef]
- Moreno Vacas, A.; Almendros González, F.J. On the origin of recent seismic unrest episodes at Deception Island volcano, Antarctica. J. Volcanol. Geotherm. Res. 2021, 419, 107376. [Google Scholar] [CrossRef]
- Zoback, M.L. First- and second-order patterns of stress in the lithosphere: The World Stress Map Project. J. Geophys. Res. 1992, 97, 11703–11728. [Google Scholar] [CrossRef]
- Altamimi, Z.; Collilieux, X.; Métivier, L. ITRF2008: An improved solution of the International Terrestrial Reference Frame. J. Geod. 2011, 85, 457–473. [Google Scholar] [CrossRef]
- Altamimi, Z.; Rebischung, P.; Métivier, L.; Collilieux, X. ITRF2014: A new release of the International Terrestrial Reference Frame modeling nonlinear station motions. J. Geophys. Res. Solid Earth 2016, 121, 6109–6131. [Google Scholar] [CrossRef]
- Dietrich, R.; Rulke, A.; Ihde, J.; Lindner, K.; Miller, H.; Niemeier, W.; Schenke, H.; Seeber, G. Plate kinematics and deformation status of the Antarctic Peninsula based on GPS. Glob. Planet. Change 2004, 42, 313–321. [Google Scholar] [CrossRef]
- Yuan, P.; Blewitt, G.; Kreemer, C.; Hammond, W.C.; Argus, D.; Yin, X.; Van Malderen, R.; Mayer, M.; Jiang, W.; Awange, J.; et al. An enhanced integrated water vapour dataset from more than 10000 global ground-based GPS stations in 2020. Earth Syst. Sci. Data 2023, 15, 723–743. [Google Scholar] [CrossRef]
- Blewitt, G.; Hammond, W.C.; Kreemer, C. Harnessing the GPS data explosion for interdisciplinary science. Eos 2018, 99, 485. [Google Scholar] [CrossRef]
- Bertiger, W.; Bar-Sever, Y.; Dorsey, A.; Haines, B.; Harvey, N.; Hemberger, D.; Heflin, M.; Lu, W.; Miller, M.; Moore, A.W.; et al. GipsyX/RTGx, a new tool set for space geodetic operations and research. Adv. Space Res. 2020, 66, 469–489. [Google Scholar] [CrossRef]
- Zumberge, J.; Heflin, M.; Jefferson, D.; Watkins, M.; Webb, F. Precise point positioning for the efficient and robust analysis of GPS data from large networks. J. Geophys. Res. Solid. 1997, 102, 5005–5017. [Google Scholar] [CrossRef]
- Blewitt, G.; Kreemer, C.; Hammond, W.C.; Gazeaux, J. MIDAS robust trend estimator for accurate GPS station velocities without step detection. J. Geophys. Res. Solid Earth 2016, 121, 2054–2068. [Google Scholar] [CrossRef] [PubMed]
- Dach, R.; Hugentobler, U.; Fridez, P.; Meindl, M. Bernese GPS Software Ver. 5.0 User Manual; Astronomical Institute, University of Bern: Bern, Switzerland, 2007. [Google Scholar]
- Berrocoso, M.; Ramírez, M.; Pérez-Peña, A.; Enríquez-Salamanca, J.; Fernández, A.; Torrecillas, C. El Sistema de Posicionamiento Global; Servicio de Publicaciones de la Universidad de Cádiz: Cádiz, Spain, 2004. [Google Scholar]
- Rosado, B.; Ramírez-Zelaya, J.; Barba, P.; De Gil, A.; Berrocoso, M. Comparative Analysis of Non-Linear GNSS Geodetic Time Series Filtering Techniques: El Hierro Volcanic Process (2010–2014). Eng. Proc. 2021, 5, 23. [Google Scholar] [CrossRef]
- Kanamori, H.; Brodsky, E.E. The Physics of Earthquakes. Rep. Prog. Phys. 2004, 67, 1429–1496. [Google Scholar] [CrossRef]
- Williams, S.D.P. CATS: GPS coordinate time series analysis software. GPS Solut. 2008, 12, 147–153. [Google Scholar] [CrossRef]
- Barba, P.; Rosado, B.; Ramírez-Zelaya, J.; Berrocoso, M. Comparative Analysis of Statistical and Analytical Techniques for the Study of GNSS Geodetic Time Series. Eng. Proc. 2021, 5, 21. [Google Scholar] [CrossRef]
- Ramírez-Zelaya, J.; Peci, L.M.; Fernandez-Ros, A.; Berrocoso, M. Q–Str2–Models: A software in PyQGIS to obtain Stress–Strain models from GNSS geodynamic velocities. Comput. Geosci. 2023, 179, 105045. [Google Scholar] [CrossRef]
- Buchta, E.; Scheinert, M.; King, M.; Wilson, T.; Clarke, P.J.; Gómez, D.; Kendrick, E.; Knöfel, C.; Koulali, A. Daily Coordinate Time Series for GPS Stations on Bedrock for Antarctica and the Sub Antarctic Sector, 1995–2021, Reprocessed by the GIANT–REGAIN Project; 2025. Dataset Bundled Publication. Available online: https://doi.org/10.1594/PANGAEA.967515 (accessed on 7 July 2024).
- Allmendinger, R.W.; Reilinger, R.; Loveless, J. Strain and rotation rate from GPS in Tibet, Anatolia, and the Altiplano. Tectonics 2007, 26, TC3002. [Google Scholar] [CrossRef]
- Goudarzi, M.A.; Cocard, M.; Santerre, R. GeoStrain: An open source software for calculating crustal strain rates. Comput. Geosci. 2015, 82, 1–12. [Google Scholar] [CrossRef]
- Pagani, C.; Bodin, T.; Métois, M.; Lasserre, C. Bayesian Estimation of Surface Strain Rates From Global Navigation Satellite System Measurements: Application to the Southwestern United States. J. Geophys. Res. Solid Earth 2021, 126, e2021JB021905. [Google Scholar] [CrossRef]
- Nico, G.; Rutigliano, P.; Benedetto, C.; Vespe, F. Terrain modelling by kinematical GPS survey. Nat. Hazards Earth Syst. Sci. 2005, 5, 293–299. [Google Scholar] [CrossRef]


| Stations | Latitude | Longitude | Network | Analysis Center | Location |
|---|---|---|---|---|---|
| ARMO | −62,294 | −59,177 | RGAE | LAGC | Harmony Point, Nelson Island |
| BEGC | −62,979 | −60,674 | RGAE | LAGC | Gabriel de Castilla Base, Deception Island |
| BEJ1 | −62,663 | −60,389 | RGAE | LAGC | Juan Carlos I Base, Livingston Island |
| BYER | −62,666 | −61,099 | RGAE | LAGC | Byers Peninsula, Livingston Island |
| CACI | −64,156 | −60,957 | RGAE | LAGC | Caleta Cierva, AP |
| CPER | −62,397 | −59,671 | RGAE | LAGC | Coppermine Peninsula, Robert Island |
| DAL5 | −62,241 | −58,678 | DNA-IAA | NGL | Carlini Base, King George Island |
| DUPT | −64,805 | −62,817 | ANET | NGL | Duthiers Point, AP |
| GRW1 | −62,216 | −58,962 | RGAE | LAGC | Greenwich Island |
| HUGO | −64,963 | −65,668 | ANET | NGL | Hugo Island |
| ILOW | −63,271 | −62,009 | RGAE | LAGC | Low Island |
| MBIO | −64,240 | −56,623 | RAMSAC | NGL | Base Marambio, AP |
| MELU | −62,596 | −59,903 | RGAE | LAGC | Half Moon Island |
| OHI2 | −63,321 | −57,901 | IGS | NGL | O’Higgins Antarctic Base, AP |
| OHI3 | −63,321 | −57,901 | IGS | NGL | O’Higgins Antarctic Base, AP |
| PAL2 | −64,775 | −64,051 | IGS | NGL | Palmer Antarctic Base, Anvers Island |
| PING | −62,099 | −57,937 | RGAE | LAGC | Penguin Island |
| PRPT | −66,007 | −65,339 | ANET | NGL | Prospect Point |
| ROBN | −65,247 | −59,445 | ANET | NGL | Robertson Island |
| SGP1 | −65,557 | −61,722 | ANET | NGL | Cape Disappointment |
| SNOW | −62,728 | −61,291 | RGAE | LAGC | Snow Island |
| SPGT | −64,295 | −61,052 | ANET | NGL | Spring Point |
| SPRZ | −63,395 | −56,996 | RAMSAC | NGL | Esperanza Base, Esperanza Bay |
| UYBA | −62,184 | −58,902 | REGNA-ROU | NGL | Artigas Base, King George Island |
| Preseismic | Coseismic | Postseismic | ||||||||||||||||
|---|---|---|---|---|---|---|---|---|---|---|---|---|---|---|---|---|---|---|
| Stations | East | North | Up | East | North | Up | East | North | Up | |||||||||
| BEGC | 8.9 | 8.7 | −5.2 | 0.18 | 0.20 | 0.14 | 9.8 | 27.6 | −25.2 | 0.80 | 1.06 | 1.97 | - | - | - | - | - | - |
| DAL5 | 8.8 | 16.4 | −3.9 | 0.14 | 0.13 | 0.31 | −175.7 | 101.4 | 53.7 | 2.02 | 1.14 | 2.09 | 7.3 | 19.7 | 1.8 | 0.11 | 0.11 | 0.28 |
| DUPT | 12.7 | 10.7 | 9.9 | 0.01 | 0.01 | 0.03 | 13.8 | 12.2 | 6.4 | 0.43 | 0.67 | 1.59 | 12.7 | 10.2 | 0.7 | 0.11 | 0.16 | 0.40 |
| MBIO | 16.6 | 9.8 | 3.3 | 0.02 | 0.02 | 0.05 | 16.1 | 11.1 | 14.2 | 0.47 | 0.65 | 1.80 | 16.9 | 7.8 | 5.8 | 0.17 | 0.20 | 0.45 |
| OHI2 | 14.5 | 9.4 | −1.7 | 0.25 | 0.60 | 1.10 | 19.4 | 4.6 | 17.5 | 0.78 | 1.93 | 4.04 | 17.1 | 11.1 | −1.6 | 0.17 | 0.32 | 0.76 |
| OHI3 | 14.9 | 10.2 | 0.2 | 0.08 | 0.14 | 0.39 | 20.2 | 9.8 | 16.4 | 0.70 | 1.61 | 4.23 | 15.0 | 12.6 | 0.4 | 0.26 | 0.42 | 0.88 |
| PAL2 | 13.0 | 10.7 | 3.3 | 0.06 | 0.08 | 0.20 | 13.6 | 11.6 | 5.2 | 0.44 | 0.71 | 1.56 | 14.2 | 9.8 | −0.4 | 0.09 | 0.12 | 0.31 |
| PRPT | 14.8 | 10.1 | 0.6 | 0.02 | 0.03 | 0.06 | 15.7 | 10.5 | −6.8 | 0.47 | 0.67 | 1.60 | 17.4 | 9.6 | −8.4 | 0.43 | 0.49 | 1.28 |
| ROBN | 16.6 | 8.6 | 5.8 | 0.02 | 0.01 | 0.03 | 20.8 | 10.7 | 10.2 | 0.52 | 0.67 | 1.35 | 15.8 | 9.7 | 8.1 | 0.14 | 0.15 | 0.35 |
| SGP1 | 13.2 | 5.9 | 8.1 | 0.13 | 0.17 | 0.46 | 13.4 | 11.9 | 12.8 | 0.56 | 0.70 | 2.07 | 12.6 | 9.8 | 5.7 | 0.20 | 0.19 | 0.53 |
| SPGT | 15.3 | 12.2 | 8.8 | 0.02 | 0.02 | 0.05 | 14.3 | 14.8 | 8.5 | 0.41 | 0.60 | 1.49 | 14.2 | 11.8 | 5.6 | 0.14 | 0.17 | 0.43 |
| SPRZ | 15.9 | 10.2 | 7.3 | 0.03 | 0.03 | 0.34 | 19.2 | 8.9 | 8.0 | 1.02 | 0.92 | 2.58 | 15.9 | 10.6 | 6.2 | 0.25 | 0.22 | 0.54 |
| UYBA | 10.8 | 18.4 | −4.5 | 0.11 | 0.15 | 0.47 | −87.0 | 74.2 | 9.3 | 1.31 | 1.23 | 2.46 | 8.0 | 24.0 | −2.7 | 0.60 | 0.80 | 2.50 |
| HUGO | 15.0 | 10.7 | −1.3 | 0.01 | 0.01 | 0.04 | - | - | - | - | - | - | 16.0 | 10.0 | 2.6 | 0.09 | 0.09 | 2.45 |
| ARMO | 11.7 | 17.0 | −6.4 | 0.00 | 0.00 | 0.00 | - | - | - | - | - | - | - | - | - | - | - | - |
| BEJ1 | 11.7 | 17.0 | −4.9 | 0.13 | 0.16 | 0.25 | - | - | - | - | - | - | - | - | - | - | - | - |
| BYER | 13.1 | 17.0 | −3.2 | 0.16 | 0.08 | 0.30 | - | - | - | - | - | - | - | - | - | - | - | - |
| CACI | 16.3 | 14.8 | 25.6 | 0.10 | 0.05 | 0.56 | - | - | - | - | - | - | - | - | - | - | - | - |
| CPER | 9.3 | 14.8 | −16.9 | 0.00 | 0.00 | 0.00 | - | - | - | - | - | - | - | - | - | - | - | - |
| ELE1 | 4.2 | 14.4 | 2.8 | 0.00 | 0.00 | 0.00 | - | - | - | - | - | - | - | - | - | - | - | - |
| GRW1 | 6.3 | 18.4 | −4.4 | 0.00 | 0.00 | 0.00 | - | - | - | - | - | - | - | - | - | - | - | - |
| ILOW | 14.1 | 11.3 | 8.3 | 0.00 | 0.00 | 0.00 | - | - | - | - | - | - | - | - | - | - | - | - |
| MELU | 11.7 | 25.8 | −6.1 | 0.01 | 0.01 | 0.01 | - | - | - | - | - | - | - | - | - | - | - | - |
| NOT1 | 10.5 | 10.8 | 8.0 | 0.00 | 0.00 | 0.00 | - | - | - | - | - | - | - | - | - | - | - | - |
| PING | 3.8 | 26.5 | −5.2 | 0.02 | 0.02 | 0.14 | - | - | - | - | - | - | - | - | - | - | - | - |
| PRA1 | 4.9 | 16.2 | 0.0 | 0.00 | 0.00 | 0.00 | - | - | - | - | - | - | - | - | - | - | - | - |
| SNOW | 11.9 | 15.7 | −1.6 | 0.01 | 0.01 | 0.01 | - | - | - | - | - | - | - | - | - | - | - | - |
Disclaimer/Publisher’s Note: The statements, opinions and data contained in all publications are solely those of the individual author(s) and contributor(s) and not of MDPI and/or the editor(s). MDPI and/or the editor(s) disclaim responsibility for any injury to people or property resulting from any ideas, methods, instructions or products referred to in the content. |
© 2025 by the authors. Licensee MDPI, Basel, Switzerland. This article is an open access article distributed under the terms and conditions of the Creative Commons Attribution (CC BY) license (https://creativecommons.org/licenses/by/4.0/).
Share and Cite
Rosado, B.; Jiménez, V.; Pérez-Peña, A.; Martín, R.; de Gil, A.; Carmona, E.; Gárate, J.; Berrocoso, M. GNSS-Based Models of Displacement, Stress, and Strain in the SHETPENANT Region: Impact of Geodynamic Activity from the ORCA Submarine Volcano. Remote Sens. 2025, 17, 2370. https://doi.org/10.3390/rs17142370
Rosado B, Jiménez V, Pérez-Peña A, Martín R, de Gil A, Carmona E, Gárate J, Berrocoso M. GNSS-Based Models of Displacement, Stress, and Strain in the SHETPENANT Region: Impact of Geodynamic Activity from the ORCA Submarine Volcano. Remote Sensing. 2025; 17(14):2370. https://doi.org/10.3390/rs17142370
Chicago/Turabian StyleRosado, Belén, Vanessa Jiménez, Alejandro Pérez-Peña, Rosa Martín, Amós de Gil, Enrique Carmona, Jorge Gárate, and Manuel Berrocoso. 2025. "GNSS-Based Models of Displacement, Stress, and Strain in the SHETPENANT Region: Impact of Geodynamic Activity from the ORCA Submarine Volcano" Remote Sensing 17, no. 14: 2370. https://doi.org/10.3390/rs17142370
APA StyleRosado, B., Jiménez, V., Pérez-Peña, A., Martín, R., de Gil, A., Carmona, E., Gárate, J., & Berrocoso, M. (2025). GNSS-Based Models of Displacement, Stress, and Strain in the SHETPENANT Region: Impact of Geodynamic Activity from the ORCA Submarine Volcano. Remote Sensing, 17(14), 2370. https://doi.org/10.3390/rs17142370